Embed Size (px)
Citation preview

The Misguided Beliefs of Financial Advisors∗
Juhani T. Linnainmaa
Brian T. MelzerAlessandro Previtero
November 2016
Abstract
A common view of retail finance is that conflicts of interest contribute to the high cost of advice.
Using detailed data on financial advisors and their clients, however, we show that most advisors
invest their personal portfolios just like they advise their clients. They trade frequently, prefer
expensive, actively managed funds, chase returns, and under-diversify. Differences in advisors’
beliefs affect not only their own investment choices, but also cause substantial variation in the
quality and cost of their advice. Advisors do not hold expensive portfolios only to convince
clients to do the same—their own performance would actually improve if they held exact copies
of their clients’ portfolios, and they trade similarly even after they leave the industry. These
results suggest that many advisors offer well-meaning, but misguided, recommendations rather
than self-serving ones. Policies aimed at resolving conflicts of interest between advisors and
clients do not address this problem.
∗Juhani Linnainmaa is with the University of Southern California and NBER, Brian Melzer is with the Northwest-ern University, and Alessandro Previtero is with the Indiana University and NBER. We thank Jason Allen, AlexanderDyck, Diego Garcia, Chuck Grace, John Griffin, Jonathan Reuter, Andrei Shleifer, and Sheridan Titman for valuablecomments. We are grateful for feedback given by conference and seminar participants at Boston College, DartmouthCollege, Georgetown University, HEC Montreal, Indiana University, Northwestern University, University of Arizona,University of Chicago, University of Colorado Boulder, University of Maryland, University of Texas at Austin, NBERBehavioral Economics 2016 spring meetings, FMA Napa Conference on Financial Markets Research, University ofRochester, IDC 13th Annual Conference in Financial Economics Research, SFS Cavalcade 2016, CEIBS ShanghaiFinance Conference, and Western Finance Association 2016 meetings. We are especially grateful to Univeris, Fun-data, and two anonymous financial firms for donating data and giving generously of their time. Alessandro Previteroreceived financial support from Canadian financial firms for conducting this research. Juhani Linnainmaa receivedfinancial support from the PCL Faculty Research Fund at the University of Chicago Booth School of Business. Ad-dress correspondence to Alessandro Previtero, Indiana University, 1275 E. 10th St., Bloomington, IN 47405, USA(email: [email protected]).

1 Introduction
Individual investors throughout the world rely on financial advisors to guide their investment deci-
sions. According to the 2013 Survey of Consumer Finances, nearly 40 million American households
received advice from a financial planner or securities broker. A common criticism of the financial
advisory industry is that conflicts of interest compromise the quality, and raise the cost, of ad-
vice. Many advisors require no direct payment from clients but instead draw commissions on the
mutual funds they sell. Within this structure, advisors may be tempted to recommend products
that maximize commissions instead of serving the interests of their clients. Academic studies have
shown suggestive evidence that sales commissions distort portfolios.1 Policymakers in Australia,
the United Kingdom, and the United States, in turn, have either banned commissions or mandated
that advisors act as fiduciaries, placing clients’ interests ahead of their own.2
In this paper we find support for an alternative explanation of costly and low-quality advice that
has starkly different policy implications. Advisors give poor advice because they have misguided
beliefs. They recommend frequent trading and expensive, actively managed products because they
believe active management, even after commissions, dominates passive management. Indeed, they
hold the same investments that they recommend. Eliminating conflicts of interest may therefore
reduce the cost of advice by less than policymakers hope.
Our analysis uses data provided by two large Canadian financial institutions. Advisors within
these firms provide advice on asset allocation and serve as mutual fund dealers, recommending the
1See, for example, Bergstresser, Chalmers, and Tufano (2009), Mullainathan, Noth, and Schoar (2012), Christof-fersen, Evans, and Musto (2013), Anagol, Cole, and Sarkar (2016), and Egan (2016).
2In 2012, the Australian government implemented the Future of Financial Advice Reform, which banned conflictedcompensation arrangements, including commissions. In 2013, the Financial Conduct Authority in the United Kingdombanned commissions. In 2016, the United States Department of Labor finalized a rule to impose fiduciary duty inretirement accounts.
1

purchase or sale of unaffiliated mutual funds. These advisors are not subject to fiduciary duty
under Canadian law (Canadian Securities Administrators 2012). The data include comprehensive
trading and portfolio information on more than 4,000 advisors and almost 500,000 clients between
1999 and 2013. Our data also include the personal trading and account information of the vast
majority of advisors themselves. This unique feature proves fruitful for our analysis. The advisor’s
own trades reveal his beliefs and preferences, which allow us to test whether client trades that are
criticized as self-serving emanate from misguided beliefs rather than misaligned incentives.
We begin by characterizing the trading patterns of advisors and clients. We focus on trading
behaviors that may hurt risk-adjusted performance: high turnover, preference for funds with active
management or high expense ratios, return chasing, and underdiversification.3 Both clients and
advisors exhibit trading patterns previously documented for self-directed investors. For example,
they purchase funds with better-than-average historical returns and they overwhelmingly favor
expensive, actively managed funds. This similarity suggests that advisors do not dramatically alter
their recommendations when acting as agents rather than principals.
An analysis of fees and investment returns likewise shows little evidence that advisors recom-
mend worse performing funds than they hold themselves. The average expense ratios of mutual
funds in advisors’ and clients’ portfolios are nearly the same, at 2.43% and 2.36%. Advisors earn
commissions on their personal purchases, but even after adjusting for these rebates, the performance
difference between advisors and clients is close to zero. Depending on the model, this difference
3Barber and Odean (2000) find that active trading—which can result from return chasing, for example—significantly hurts individual investors’ performance. French (2008) computes that the average investor would haveimproved his performance by 67 basis points per year between 1980 and 2006 by switching to a passive market port-folio. Carhart (1997) shows that expenses reduce performance at least one-for-one and that returns decrease withfund turnover. Calvet, Campbell, and Sodini (2007) and Goetzmann and Kumar (2008) find that underdiversificationleads to large welfare losses for some households.
2

ranges from −5 to +21 basis points per year. Clients and advisors both earn annual net alphas of
−3%.
We show that the similarity in trading emerges from advisors’ influence over client trades. The
identity of the advisor is the single most important piece of information for predicting nearly all of
the client trading behaviors. The common variation among co-clients, measured through advisor
fixed effects, dominates variation explained by observable client traits such as age, income, risk
tolerance, and financial knowledge. We also estimate a model with client fixed effects to address
the possibility that the advisor effects capture shared, but unobservable, preferences among co-
clients. This two-way fixed effects analysis is feasible because we observe clients who are forced
to switch advisors due to their old advisor’s death, retirement, or resignation. These switches
exhibit little client-level selection, as they are not initiated by clients and are typically transfers of
an advisor’s entire “book of business.” The client fixed effects also prove important in explaining
portfolio choices, but they do not meaningfully crowd out the advisor effects.
We trace differences in advisors’ recommendations to their own beliefs and preferences, as re-
flected in their personal trading. An advisor’s own trading behavior strongly predicts the behavior
common among his clients. For example, an advisor who encourages his clients to chase returns
typically also chases returns himself. These correlations, which range from 0.14 to 0.29, are sta-
tistically significant for each trading pattern, irrespective of whether we measure advisor influence
with or without client fixed effects.
We use detailed transaction data—the timing of trades and the specific funds purchased—to
illustrate advisors’ impact on client trading. While common strategies, such as return chasing,
may coincidentally emerge among clients, it is unlikely that clients would buy specifically the same
3

funds at the same time without common input from the advisor. We show that clients’ purchases
coincide frequently with the purchases of their own advisor but rarely with those of other advisors.
More than 80% of an advisor’s purchases are funds currently held or purchased by his clients in the
same month. When an advisor deviates from his clients, he favors funds with even stronger prior
performance, higher expense ratios, and more idiosyncratic risk.
Collectively, our results suggest that advisors’ own beliefs and preferences drive their recommen-
dations. We examine and rule out two alternative explanations. First, advisors do not appear to
invest in expensive funds only to convince their clients to do the same. If anything, they invest even
more similarly to clients when the cost is highest, that is, when their personal portfolios are large.
Advisors’ trading behavior also remains mostly unchanged after they leave the industry. They con-
tinue to chase returns and invest in expensive, actively managed funds. Moreover, if advisors were
“window dressing,” their personal portfolios should perform no worse than those of their clients.
However, the average advisor would earn higher returns if he copied his clients’ portfolios. Second,
advisors do not seem to push certain mutual funds on behalf of their dealer firms. If advisors only
serve as salespeople, they might be convinced to purchase, both for their clients and for themselves,
the funds that their dealer promotes. Differences between dealers, however, explain little of the
variation in client behavior. For example, client attributes alone explain 1.0% of the variation in
clients’ return-chasing behavior. The R2 increases only to 1.1% when we account for differences
between dealers, but to 16.5% when include advisor fixed effects. The same pattern holds for the
other trading behaviors. The advisor, rather than the dealer, provides the common input.
We conclude by showing that differences in advisors’ beliefs predict substantial differences in
clients’ investment performance. We sort advisors into deciles based on the gross performance of
4

their personal portfolios and compare their clients’ performance. Clients advised by bottom-decile
advisors earn 1.2% lower returns than clients advised by top-decile advisors. The fees display
the same pattern. Advisors who hold portfolios in the top fee decile recommend portfolios that
are 36 basis points more expensive than those recommended by advisors at the other end of the
distribution. Idiosyncratic portfolio risk likewise falls by half when the advisor is in the bottom
decile of idiosyncratic risk rather than the top decile. Together, these patterns in gross returns,
fees, and risk indicate that differences in advisors’ beliefs cause substantial variation in risk-adjusted
portfolio returns.
We contribute to the literature on financial advice by highlighting the importance of advisors’
beliefs. Mullainathan, Noth, and Schoar (2012) show that advisors fail to override client biases
toward return chasing and active management. We confirm their findings and document a specific
reason—mistaken beliefs—as to why advisors fail to de-bias their clients. Our analysis complements
Foerster, Linnainmaa, Melzer, and Previtero (2015), who use the same data to document advisors’
influence on equity allocations. While advisors do not adjust their personal portfolios to manipulate
clients, their choice to hold similar portfolios may engender trust and facilitate client risk-taking
(Gennaioli, Shleifer, and Vishny 2015). Our analysis also relates to studies of advisor misconduct
(Egan, Matvos, and Seru 2015), conflicts of interest (Bergstresser, Chalmers, and Tufano 2009;
Christoffersen, Evans, and Musto 2013; Anagol, Cole, and Sarkar 2016; and Egan 2016), and the
investment performance of advised accounts (Chalmers and Reuter 2015; Hackethal, Inderst, and
Meyer 2012; and Hoechle, Ruenzi, Schaub, and Schmid 2015).
Other studies have used product purchases by sales agents or “experts” to examine the roles
of incentives and beliefs in principal-agent problems. Cheng, Raina, and Xiong (2014) find that
5

mid-level managers in securitized finance personally invested in real estate during the mid-2000s
housing boom. Dvorak (2015) shows that consultants typically design similar 401(k) plans for
clients as they offer to their own employees. Levitt and Syverson (2008), on the other hand, find
that real estate agents leave their own homes on the market for longer and sell them at higher prices
than their clients’ homes. Finally, Bronnenberg, Dube, Gentzkow, and Shapiro (2015) show that
pharmacists and chefs are less likely to buy nationally branded items than lower-priced, private-label
alternatives. By contrast, the experts in our setting do not tilt their purchases toward lower-cost
alternatives.
The rest of the paper is organized as follows. Section 2 describes the data. Section 3 shows that
advisors and clients pursue similar strategies and earn comparable alphas. Sections 4 and 5 measure
advisors’ influence on client trading and explore the similarity between their own investments and
their recommendations. Section 6 quantifies the influence of advisors’ beliefs on client performance.
Section 7 tests whether advisors strategically trade contrary to their beliefs. Section 8 concludes
and discusses the policy implications.
2 Data
We use administrative data on client investments and advisory relationships provided by two Cana-
dian Mutual Fund Dealers (MFDs). Non-bank financial advisors of this type are the main source of
financial advice in Canada—they account for $390 billion (55%) of household assets under advice as
of December 2011 (Canadian Securities Administrators 2012). The two firms in our sample advise
just under $20 billion of assets, so they represent roughly 5% of the MFD sector.4
4These firms are among those studied by Foerster et al. (2015). Two of the firms in that study did not provide theidentifiers necessary for matching advisors to their personal portfolios and for comparing client and advisor behavior.We exclude these two dealers throughout this study.
6

Advisors within these firms are licensed to sell mutual funds and precluded from selling individ-
ual securities and derivatives. They make recommendations and execute trades on clients’ behalf
but cannot engage in discretionary trading.5 They do not provide captive distribution for particular
mutual fund families. Rather, they are free to recommend all mutual funds. As discussed below,
the breadth in their clients’ holdings reflects this freedom.
Both dealers provided the detailed history of transactions and demographic information on
clients and advisors. They also provided unique identifiers that link advisors to their personal
investment portfolios, if held at their own firm. While these portfolios are visible to us, they would
only be visible to clients if voluntarily disclosed by the advisor.
Out of 4,407 advisors, 3,276 maintain a personal portfolio at their firm. The advisors who do
not are usually just starting out. For example, among the 680 advisors who never attract more
than five clients—and often disappear quickly—only 44% have a personal portfolio at the firm. But
among the 2,123 advisors who go on to advise more than 50 clients, 91% have a personal portfolio
at the firm.6
We supplement these administrative data with returns, fees, and net asset values from Fundata,
Morningstar, and Univeris.
5Under Canadian securities legislation, advisors do not have fiduciary duty. Instead, they face a weaker legalmandate to “deal fairly, honestly and in good faith with their clients” and to make recommendations suitable toclients’ investment goals and risk tolerance (Canadian Securities Administrators 2012).
6Table A1 in the Appendix presents an analysis of advisor survival as a function of the number of clients. Theestimates show that advisors with more than 100 clients have an annual survival rate of 98.9%. This survival ratedecreases almost monotonically as the number of clients falls, and reaches 81.2% among advisors with at most fiveclients.
7

2.1 Advisors and their clients
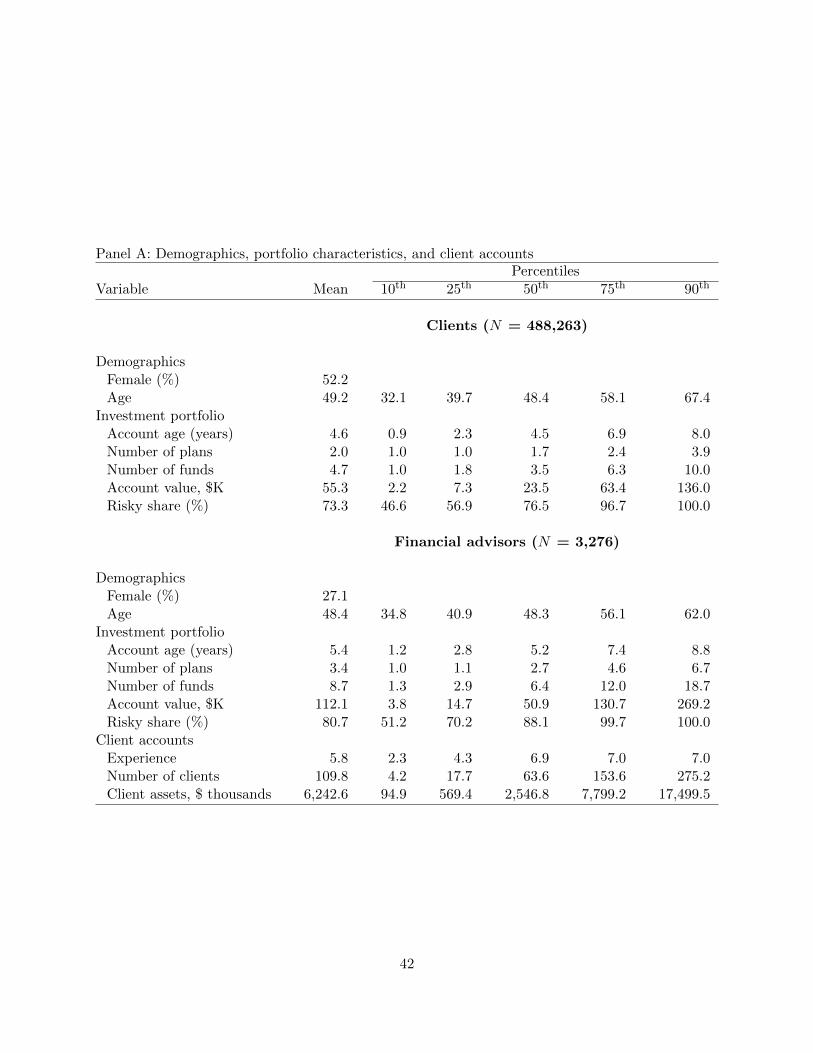
Table 1 provides key summary statistics for clients and financial advisors. The sample includes all
individual accounts held at one of the two dealers between January 1999 and December 2013. We
study the 3,276 advisors with personal portfolio information and the 488,263 clients who are active
at some point during the 14-year sample period. The total amount of assets under advice as of
June 2012 is $18.9 billion.
Men and women are equally represented among clients. Their ages range from 32 years old
at the bottom decile to 67 years old at the top decile. The average client has 1.7 plans, or sub-
accounts, invested in 3.5 mutual funds. The distribution of client assets is right-skewed: while the
median client has CND 23,500 in assets, the average account size is CND 55,300. Advisors differ
from their clients. Nearly three-quarters of the advisors are men, and the average advisor’s account
value is CND 112,100, which is twice the value of the average client’s account.
The second panel shows the distribution of account types. The majority of investors—85% of
clients and 86% of advisors—have retirement plans, which receive favorable tax treatment compa-
rable to IRA and 401(k) plans in the U.S. The next most common account type is the unrestricted
general-purpose plan, which is held by 28% of clients and 44% of advisors. In some of our analyses,
we separate retirement and general accounts because of differences in tax treatment.
Financial advisors collect information on clients’ risk tolerance, financial knowledge, salary,
and net worth through “Know Your Client” forms at the start of the advisor-client relationship.
They also report this information for themselves. Advisors report higher risk tolerance, net worth,
and salary than their clients. Most advisors report “high” financial knowledge although, perhaps
surprisingly, a handful of advisors report “low” financial knowledge, which corresponds to a person
8

who has “some investing experience but does not follow financial markets and does not understand
the basic characteristics of various types of investments.”
The third panel summarizes the overlap in fund purchases between clients and advisors. We
exclude purchases made under automatic savings plans and focus on the remaining, “discretionary”
purchases. We divide the client purchases into three mutually exclusive groups: funds purchased
by the client and advisor in the same month; funds purchased by the client and held by the advisor;
and funds purchased only by the client. Of the 8.1 million client purchases, more than one-quarter
are held or purchased by the advisor in the same month. For the advisors, the overlap is even more
striking. Only 20% of purchases are unique to the advisor; the remaining 80% of funds are either
purchased contemporaneously or held by clients.
2.2 Investment options, fund types, and fees
The clients in the data invest in 3,023 mutual funds. In the Morningstar data, a total of 3,764
mutual funds were available to Canadian investors at some point during the 1999–2013 sample
period. Most mutual funds are offered with different load structures. The most common structures
are front-end load, back-end load, low load, and no load. All options are available to clients, but
it is the advisor who decides the fund type in consultation with the client. These vehicles differ in
how costly they are to the investor, how (and when) they compensate the advisor, and how they
restrict the investor’s behavior. We provide an overview of fund fees and commissions below, along
with more detailed discussion in Appendix A.
In measuring investment performance we calculate returns net of all fees and rebates. The
fees include recurring management expense charges assessed in proportion to the investment value
and deducted daily by the mutual fund company. The fees also include front-end and back-end
9

load payments assessed upon purchase or sale. The rebates are transaction charges reimbursed
by the mutual fund or financial advisor. In their own trading, advisors face the same restrictions
and fees as non-advisors do. For example, if the advisor sells a back-end load fund too early, he
incurs the same charge as clients. Advisors do, however, benefit from serving as their own agents.
They receive sales commissions on their purchases and recurring “trailing” commissions on their
holdings. When measuring advisors’ net investment performance, we account for all fees net of
such commissions earned on their personal investments.7
3 Trading behaviors and investment performance of clients and
advisors
3.1 Trading behaviors
We compare investors and advisors using four trading behaviors—return chasing, preference for
actively managed funds, turnover, and underdiversification—and two measures of portfolio cost.
Table 2 reports summary statistics calculated from all trades and holdings in general-purpose and
retirement accounts. We use portfolio holdings to measure turnover and underdiversification, and
portfolio purchases to measure the remaining behaviors.
Both clients and advisors purchase funds with better recent performance.8 We measure return
chasing by ranking all mutual funds by their prior year net return and computing the average
7Advisors share commissions with their dealer firms. In a 2010 industry study of the top ten Canadian dealers,advisors received, on average, 78% of commission payments (Fusion Consulting 2011). We therefore assume thatadvisors keep 78% of commissions in calculating their net cost of investment.
8Return chasing has been studied extensively. See, for example, Nofsinger and Sias (1999), Grinblatt and Keloharju(2001), Barber and Odean (2008), and Kaniel, Saar, and Titman (2008) for analyses of how investors trade in responseto past price movements. Frazzini and Lamont (2008) show that retail investors reduce their wealth in the long runby chasing returns.
10

percentile rank of the funds purchased. Clients purchase funds in the 60th percentile of prior year
performance, on average. Advisors display slightly more return chasing, with an average purchase
in the 63rd percentile.
Clients and advisors display a similar, overwhelming preference for actively managed mutual
funds. We define active management as the fraction of (non-money market) assets invested in
actively managed mutual funds. We classify as passive those funds that are identified as index or
target-date funds in Morningstar or in their names. The average client invests almost exclusively
in actively managed mutual funds, with only 1.5% allocated to passive funds. Likewise, advisors
allocate only 1.2% to passive funds. These allocations are close to the 1.5% market share of index
mutual funds in the Canadian market (Canadian Securities Administrators 2012).9 For comparison,
the market share of index mutual funds in the United States is 9% (Investment Company Institute
2012).
Advisors trade more actively than clients, particularly in non-retirement accounts. We define
turnover as the market value of funds bought and sold divided by the beginning-of-the-month
market value of the portfolio.10 We split the sample between tax-deferred retirement accounts and
general-purpose accounts within which income and capital gains are taxed annually. Advisors trade
substantially more in general-purpose accounts, with average turnover of 52% compared to 34% for
clients. Both display lower turnover in retirement accounts—39% for advisors and 31% for clients.
We measure underdiversification as the amount of idiosyncratic portfolio risk. Following
Calvet, Campbell, and Sodini (2007), we regress investors’ portfolio returns against the MSCI
World index, measured in Canadian dollars and net of the Canadian T-bill rate. Idiosyncratic
9Index funds, though rarely chosen, are available. More than half of the top 100 Canadian fund families offer apassive option.
10Odean (1999) and Barber and Odean (2000), among others, find that high turnover reduces performance.
11

portfolio risk is the annualized volatility of the residuals from this regression. We compute this
measure for investors’ risky assets alone to avoid confounding underdiversification with differences
in asset allocation. High idiosyncratic risk indicates that an investor holds an underdiversified
portfolio.11 The annualized idiosyncratic volatility is 7.3% for the average client and 8.1% for the
average advisor.
Finally, we measure the cost of funds purchased in two ways. The first measure is the average
annualized management expense ratio (MER). The second measure is the average within-asset class
percentile rank of MER.12 A high percentile rank implies that clients hold mutual funds that are
expensive compared to other funds in the same class. Advisors invest in slightly more expensive
mutual funds. The average MER is 2.36% for clients and 2.43% for advisors. This difference also
holds within asset classes: the average funds bought by clients and advisors lie in the 43rd and
46th percentiles, respectively.
3.2 Investment performance
Table 3 summarizes the investment performance of advisors and clients. We compute aggregate
value-weighted returns for all clients or all advisors. We consider three measures of returns: gross
of fees, net of management expense charges alone, and net of all fees and rebates. Rebates on the
advisor portfolio also include the sales and trailing commissions that mutual funds pay on their
11See Barber and Odean (2000), Calvet, Campbell, and Sodini (2007), Goetzmann and Kumar (2008), Kumar(2009), and Grinblatt, Keloharju, and Linnainmaa (2011) for studies of underdiversification. Both home bias anda preference for lottery-type payoffs can cause households to underdiversify (Barber and Odean 2013). Using thesame data as this study, Foerster, Linnainmaa, Melzer, and Previtero (2015) document home bias among Canadianinvestors and their advisors.
12Each fund is categorized into one of five asset classes: equities, balanced, fixed income, money market, andalternatives. The category “alternatives” includes funds classified as commodity, real estate, and retail venturecapital.
12

personal purchases and holdings. Due to these payments, advisors’ returns net of all fees and
rebates are almost always higher than their returns net of mutual fund expense ratios.
We measure performance with three asset pricing models. The first model is the Sharpe (1964)-
Lintner (1965) capital asset pricing model with the excess return on the Canadian equity market as
the market factor. The second model adds a factor measuring the term spread in bonds, which is the
return difference between long-term and short-term Canadian government bonds. The third model
adds the North American size, value, and momentum factors, and the return difference between
high-yield Canadian corporate debt and investment grade debt. We include the bond factors to
account for investors’ bond holdings, and the size, value, and momentum factors to adjust for any
style tilts. We use three models to assess whether the alpha estimates are sensitive to the choice of
factors.
Table 3 shows that both clients and advisors earn gross alphas that are statistically indistin-
guishable from zero.13 In the first model, gross alpha is 14 basis points (t-value = 0.15) per year
for clients and −68 basis points (t-value = −0.66) for advisors. The alpha estimates decline with
the addition of the other factors but remain statistically indistinguishable from zero. The six-
factor model explains 87% to 88% of the time-series variation in the returns on client and advisor
portfolios.
The difference between clients’ and advisors’ gross returns has a positive and statistically sig-
nificant alpha in all three models. This alpha is measured more precisely than the separate client
13Table A2 in the Appendix reports the factor loadings and model fits.
13

and advisor alphas because the difference removes time-series variation in returns. In the six-factor
model, the alpha for the difference is 55 basis points (t-value of 2.55) per year in the clients’ favor.14
Clients and advisors net alphas—computed after management expense charges but before other
fees and rebates—are substantially negative. The annualized six-factor alphas are −3.07% (t-value
= −3.42) for clients and −3.66% (t-value = −3.79) for advisors. The additional fees net of rebates
reduce clients’ alphas by an additional 15 basis points per year. The sales and trailing commissions
paid to advisors, net of other fees, raise their net alpha by 66 basis points per year. Therefore, net
of all fees and rebates, the total performance of advisors and clients is similar. In the six-factor
model, clients lag advisors by a statistically insignificant 21 basis points per year.
4 Measuring advisors’ influence on client trading
In this section we measure advisors’ influence on client portfolios. We use the return chasing
behavior to introduce the methodology and then present the results for the other trading behaviors
and fee measures.
4.1 Return chasing behavior
The distribution of return chasing, plotted in Figure 1, shows considerable variation across clients
and advisors. Although the mean of the distribution is positive, some clients and advisors are
contrarian. In the following analysis, we test whether an advisor’s common input explains where
his clients fall in this distribution.
14In Appendix Table A3, we decompose the net alpha difference between advisors and clients into four components:style gross alpha, within-style gross alpha, style fee, and within-style fee. We define the styles using 53 Morningstarcategories, such as “U.S. Small- and Mid-Cap Equity” and “Global Fixed Income.” Most of the 60 basis point returngap between advisors and clients stems from the two gross alpha components. The point estimates are 27 and 28basis points for the style and within-style alphas; the two fee components together account for four basis points.
14

Table 4 Panel A displays estimates from the following regression model:
yia = µa + θXi + εia, (1)
in which the dependent variable, yia, is the average percentile rank of the funds bought by client i
when advised by advisor a. The vector Xi includes the investor attributes summarized in Table 1—
such as risk tolerance, investment horizon, and age—as well as province and dealer firm fixed effects.
The advisor fixed effects µa capture common variation in return chasing among clients of the same
advisor. We estimate the model using OLS, clustering standard errors by advisor to account for
correlation in behavior between clients of the same advisor.
The first model reported in Table 4 excludes the advisor fixed effects to gauge the explanatory
power of the investor attributes, the dealer fixed effect, and the province fixed effects alone. This
model’s explanatory power is modest. The adjusted R2s are 1.1% and 1.0% with and without
the dealer effect. Some covariates stand out. Return chasing is more common among wealthier,
more risk tolerant, and financially knowledgeable clients who report short investment horizons.
The second regression includes advisor fixed effects. These fixed effects substantially increase the
model’s explanatory power, to 16.5%. This estimate indicates that clients who share the same
advisor chase returns to a similar extent.
The significance of the advisor fixed effects in Table 4 could emanate from endogenous matching
between advisors and clients. An investor who is predisposed to chase returns may seek an advisor
who recommends such trades to all his clients. In that case, the advisor fixed effects may overstate
the common input of the advisor—some of the common trading may reflect client-initiated trades.
15

The regressions control for many demographics that plausibly relate to the advisor-client matching.
However, advisors and clients may also match in other dimensions that correlate with return chasing.
We use two-way fixed effects to address this issue. In this analysis, we limit the sample to clients
who switch advisors (within the same dealer firm) after their initial advisor dies, retires, or leaves
the industry. By observing clients who switch advisors, we can simultaneously identify advisor and
client fixed effects, the latter controlling for unobserved characteristics shared by clients of the same
advisor. The client fixed effects will absorb these characteristics—to the extent that they remain
fixed over time—purging the advisor fixed effects of potential matching-induced bias. We exclude
switches initiated by clients since they may coincide with a change in preferences. We identify a
client as having been displaced if the advisor goes from having at least ten clients to quitting within
six months.
While clients can still select their post-switch advisor, selection at this stage is somewhat rare.
The vast majority of switches in our sample represent transfers of entire client groups, or “books
of business,” from one advisor to another at the same dealer. Upon being displaced, 85% of clients
maintain an account at the same dealer and, conditional on staying, 87% of the clients end up with
the same new advisor. The variation that we examine in the two-way fixed effects model, therefore,
is mostly unaffected by client-level selection.
The estimates in Panel B of Table 4 show that advisors significantly influence client behavior.
The adjusted R2 rises from 5.1% in the model with client fixed effects alone to 29.1% in the model
with both client and advisor fixed effects. The F -tests at the bottom of the table indicate that
both sets of fixed effects are statistically highly significant.
16

4.2 Other trading patterns
In Table 5, we repeat the analysis of Section 4.1 for each trading behavior and fee measure. Because
the differences in turnover between clients’ general and retirement accounts in Table 2 are relatively
modest, we henceforth pool these accounts. Panel A shows that, in most cases, the inclusion of
advisor fixed effects significantly boosts the model’s explanatory power. In the active-management
regressions, for example, the client attributes explain just 0.9% of the variation. Advisor fixed
effects increase the model’s explanatory power to 18.0%. The explanatory power of these advisor
fixed effects does not arise from differences between dealers. Models with and without the dealer
effect have the same explanatory power of 0.9%.
Panel B uses displaced clients to estimate models with client fixed effects, advisor fixed effects,
and both. Similar to the return-chasing regressions presented in Table 4 Panel B, advisor fixed
effects often increase the explanatory power significantly. In each two-way fixed effects regression,
the F -test (not reported) rejects the null that the advisor fixed effects are jointly zero. These
estimates suggest that advisors direct many clients to trade in similar ways.
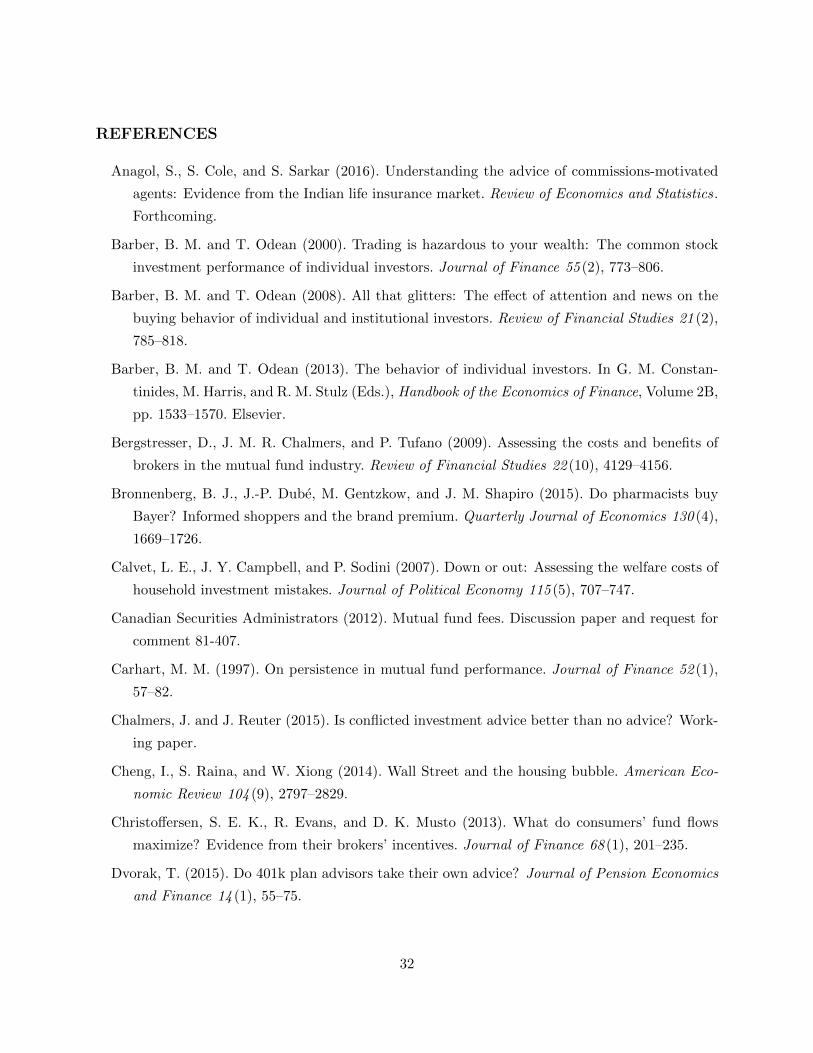
4.3 Event-study analysis of purchases by clients of the same advisor
As further illustration that advisors provide common recommendations, we show that clients of the
same advisor (“co-clients”) often purchase the same funds at the same time. We use an event-study
approach. We identify all events in which a client purchases a new mutual fund and then, for a
two-year window around this month, we estimate the probability that at least one co-client buys
the same fund for the first time.
17

The black line in Figure 2 indicates these estimates. The probability that at least one co-client
purchases the same fund in the same month is 0.45. In addition to this contemporaneous spike,
there is an elevated probability of a co-client purchase in the two months before or after the original
client’s purchase. By contrast, when we randomly match each client with another advisor’s clients,
we find little overlap in their purchases. For this analysis we resample the data 100 times with
replacement, each time matching the client to another advisor at the same dealer (blue line) or
the other dealer (red line). We then measure the fraction of fund purchases that are also made by
at least one counterfactual co-client during the two-year window. We find few common purchases
among counterfactual co-clients, whether drawn from the same dealer or the other dealer.
The coordination in trading that we observe among co-clients is strong evidence that advisors
direct clients to trade in similar ways. Even if clients selected advisors who prefer a given trading
strategy such as active management, it would be unlikely that co-clients would purchase precisely
the same funds at the same time without common input from the advisor. While other events,
such as news stories or fund ratings changes, might also cause coordination in trading, their effects
would not be restricted to co-clients.
5 Do advisors encourage clients to trade like themselves?
We now explore whether advisors adopt for themselves the same trading strategies or individual
trades that we have identified as common among their clients. In these tests, we compare each
advisor’s estimated fixed effects to his own trading behaviors, and we also examine the overlap in
individual trades between advisors and their clients.
18

5.1 Explaining advisor fixed effects with advisors’ own investment behavior
Table 6 reports estimates from regressions of advisor fixed effects on advisor behavior and attributes:
µia = α+ β Own behavioria + γXa + εia. (2)
The dependent variable, µia, is advisor a’s estimated fixed effect for trading behavior i from the
analysis reported in Table 5. We analyze fixed-effect estimates from regressions that include either
client attributes or client fixed effects. While the latter analysis covers a smaller set of advisors—
those that work with displaced clients—its measure of advisor influence more cleanly identifies the
causal input of those advisors. The key independent variable, Own behavioria, is the measure of
behavior i in advisor a’s own portfolio. The control variables in Xa are the advisor’s age, gender,
native language, number of clients, and risk tolerance.
The estimates in Table 6 indicate that an advisor’s personal investment behavior correlates
closely with that of his clients. In the return chasing regression, for example, the slope estimate for
the advisor-behavior variable is 0.24 (t-value = 13.67). If an advisor chases returns, his clients are
more likely to chase returns. For the other trading behaviors, the coefficients range from a low of
0.13 (for total MER) to a high of 0.29 (for active management), indicating some variation in which
dimensions an advisor’s behavior tracks that of his clients. Advisor attributes do not meaningfully
correlate with the advisor fixed effects: the adjusted R2 decreases only modestly when we exclude
them from the regressions. The bottom half of Table 6 shows that the advisor-behavior coefficients
are broadly similar when we use advisor fixed effects from the displacement regressions as the
dependent variable.
19

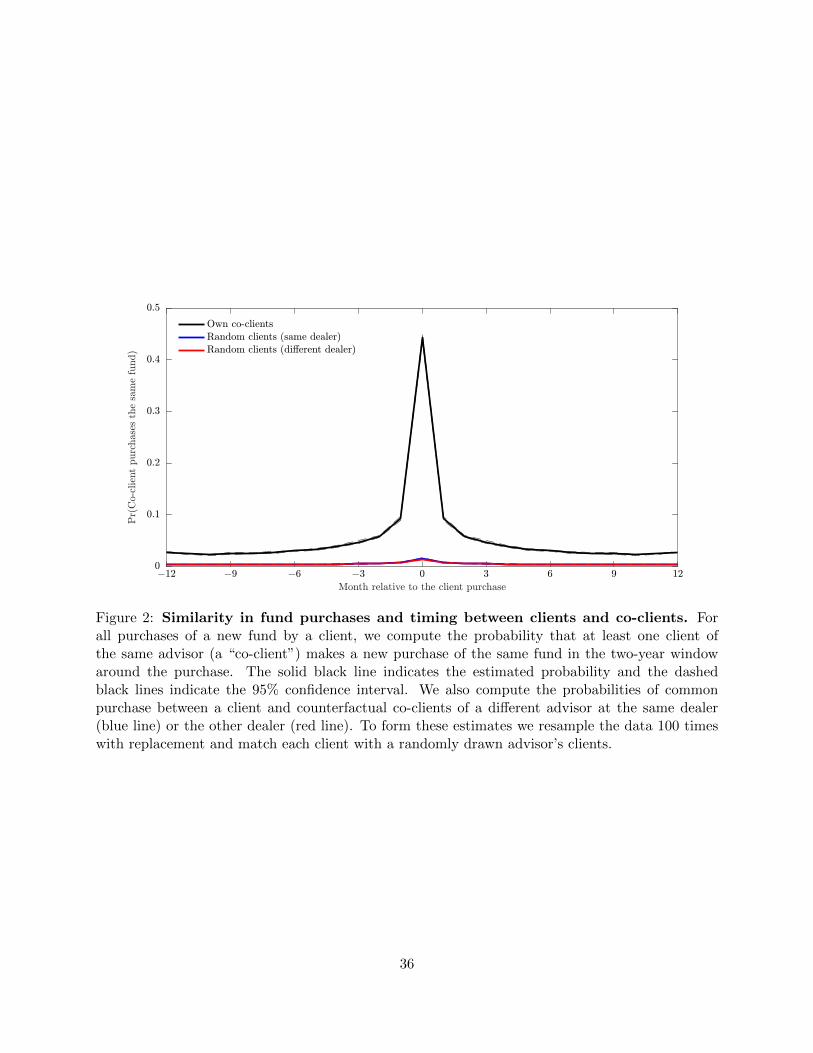
5.2 Similarity in fund purchases and timing between advisors and clients
The connection between advisor and client trading goes beyond similarity in strategy: clients often
invest in the same funds at the same time as the advisor. We compare advisor and client purchases
in an event study, just as we did for clients and co-clients. We identify all events in which an
advisor purchases a new mutual fund and estimate the probability that at least one of the advisor’s
clients buys the same fund in the months surrounding the advisor’s purchase. We also compare
each advisor’s purchases to the purchases of clients who use another advisor. For this comparison,
we resample other advisors’ clients 100 times with replacement, and compute how often one of
these counterfactual clients purchases the same fund as the advisor.
The black line in Figure 3 shows that an advisor’s clients often buy the same new fund as
the advisor within a few months of the advisor’s own purchase. The estimated probability of
contemporaneous purchase by at least one client is 0.45.15 There is little overlap in purchases with
respect to the clients of other advisors. The probability of common purchase with at least one client
of the randomly matched advisor never exceeds 0.04. This estimate is similar for counterfactual
clients drawn from the same dealer (blue line) or the other dealer (red line).
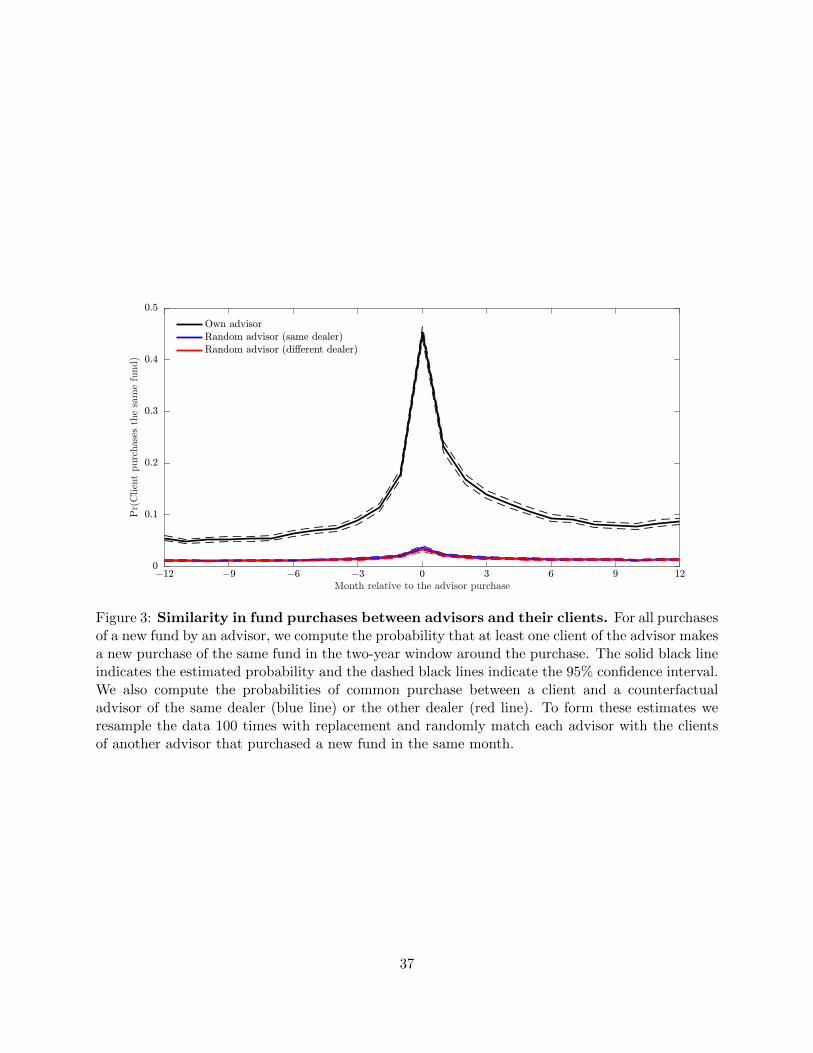
As in the estimation of advisor fixed effects, the sample of displaced clients is useful for es-
tablishing a causal link between an advisor’s own trades and his clients’ trades. Before a client is
displaced, we can measure the overlap between his purchases and those of his current and future
advisors. We classify a client’s purchase as overlapping if the advisor buys the same fund within
one month of the client’s purchase. Figure 4 shows that, before displacement, more than 5% of
a client’s purchases coincide with a purchase by his current advisor, while just 1% coincide with
15Figure A1 estimates the same probabilities using data on advisors who have no more than ten clients at thetime of the purchase. The estimated probabilities for this sample are similar to those reported in Figure 3 Panel A.Advisors with a large number of clients therefore do not drive the results.
20

a purchase by his future advisor. Following the switch, the overlap in purchases with the new
advisor increases more than four-fold, to nearly the same level as exhibited with the old advisor.
This pattern is consistent with a causal connection—advisors’ preferred investments appear in their
clients’ portfolios specifically while they work together.
5.3 A comparison of advisors’ and clients’ overlapping and non-overlapping
trades
Advisors often, but not always, purchase the same mutual funds for themselves as for their clients.
Table 1 Panel C shows that one-fifth of advisor purchases are “advisor-only,” mutual funds neither
bought nor held by clients at the same time. Among client transactions, three-quarters of fund
purchases are “client-only,” neither bought nor held by advisors at the same time.
We measure the differences in characteristics—return chasing, active management, idiosyncratic
risk, and fees—of the funds bought just by the advisor, just for the clients, or jointly. We compute,
for each advisor, the average characteristics by purchase type. The regressions reported in Ta-
ble 7 summarize the differences in characteristics. The omitted category consists of the client-only
purchases.
Funds purchased only by advisors have higher prior returns, more idiosyncratic risk, and higher
fees. The differences between client-only and joint purchases, by contrast, are small. The average
percentile rank of funds purchased solely by the advisor is 5 points higher than funds bought by
clients. The advisor-only purchases also have 1.7 percentage points more idiosyncratic volatility
and lie 3 percentage points higher in the fee distribution than client-only purchases.16 Finally,
16In Table 7’s trade-level analysis, we measure differences in idiosyncratic volatilities of mutual funds bought byadvisors, clients, or both. We measure a fund’s risk by regressing its excess returns against the MSCI World indexand computing the volatility of its residual returns.
21

advisor-only purchases are tilted slightly toward passive funds, but with little economic difference:
index funds comprise less than 2% of purchases within each purchase type pair.
6 How much do the risk and return of client portfolios vary with
advisors’ beliefs?
Advisors’ tendency to recommend the same investments as they hold personally causes correlation
between their performance and the performance of their clients. Advisors who pay high fees under-
perform those who pay low fees and so do their clients. Likewise, advisors whose investments earn
poor returns gross of fees will also deliver poor returns for their clients. The same pattern will also
hold for portfolio risk—advisors who fail to diversify will experience more volatile returns them-
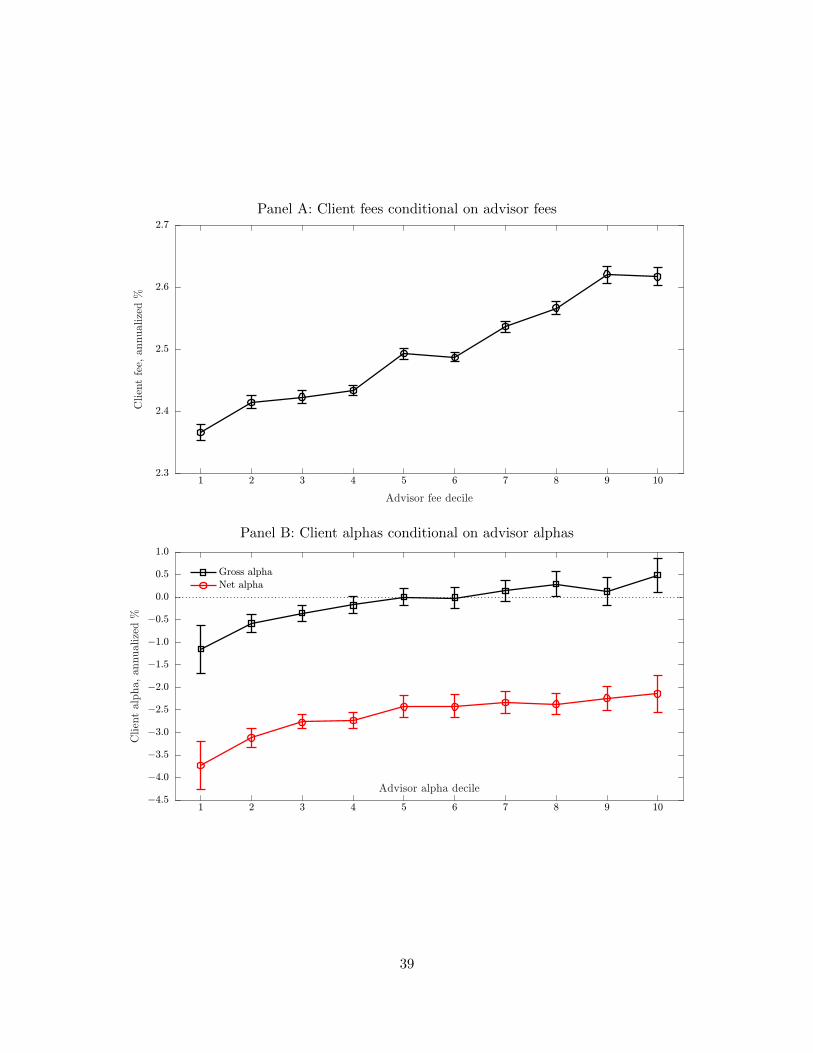
selves and deliver a riskier portfolio to their clients. We quantify these effects by sorting advisors
into deciles by their personal fees, performance or portfolio risk and comparing client portfolios
across deciles.
Panel A of Figure 5 plots the results for fees. We compute the average fee paid each advisor’s
clients and then average across advisors in each decile. Clients’ average annual fees increase by 36
basis points between the bottom and top deciles. This difference is almost have of the standard
deviation of fees in the cross-section of clients (76 basis points). This comparison indicates that an
indirect sort on advisor fees generates considerable dispersion in client fees.
Panel B of Figure 5 examines the association between client and advisor alphas. We estimate
the alpha for each client and advisor using a two-factor model that includes the market and term
factors. Similar to the fee computation, we calculate the average client alpha for each advisor and
average across advisors in each decile of net alpha. Client alphas, both gross and net, increase
22

significantly in advisor alpha. Moving from the bottom decile to the top decile, clients’ annual
gross and net alphas increase by 1.17% and 1.21%. The differences between the top and bottom
deciles are significant with t-values in excess of 5.0.17
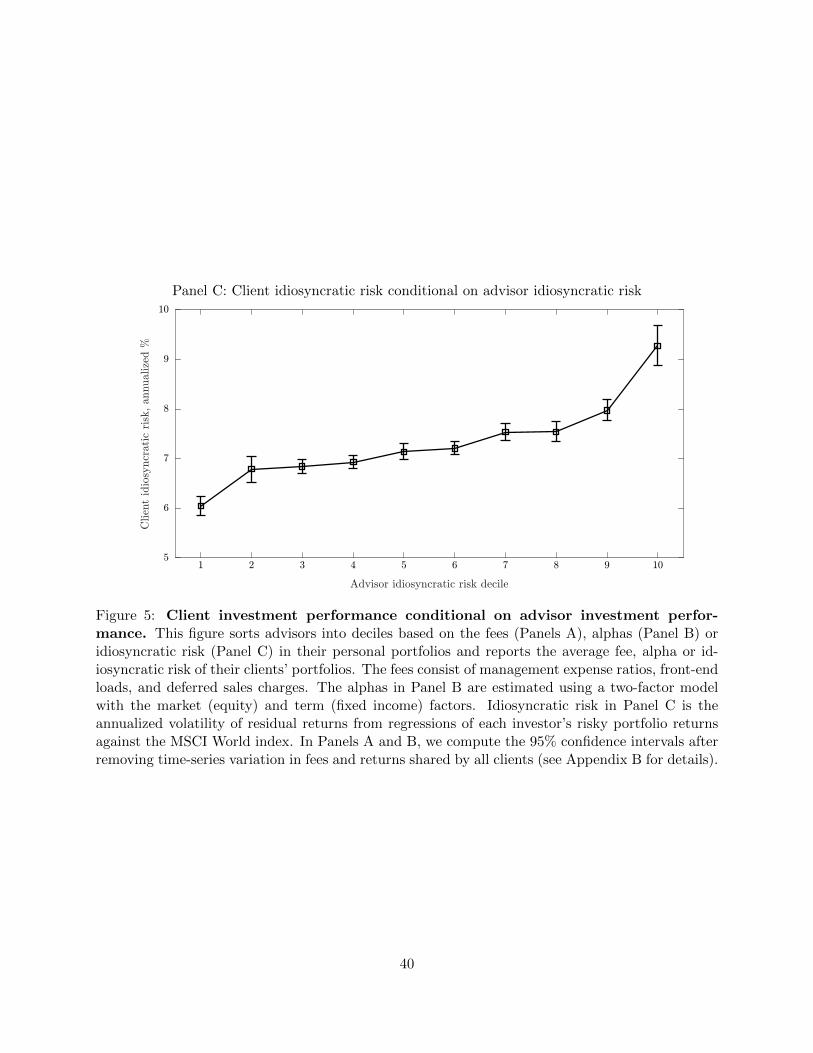
Panel C of Figure 5 examines idiosyncratic portfolio risk. The idiosyncratic risk in advisors’
own portfolios ranges from an average of 5% per year in the bottom decile to 12% per year in
the top decile. Client idiosyncratic risk increases by more than half, from 6.0% to 9.3% per year,
between the bottom and top deciles of the advisor distribution.
7 Do advisors trade contrary to their beliefs?
We have interpreted advisors’ trades as reflecting their own beliefs. But advisors may trade contrary
to their beliefs for two reasons. First, advisors could voluntarily disclose their trades to gain their
clients’ trust. For example, they may buy expensive, high-commission funds in order to convince
clients to do the same. Second, an advisor might suffer from cognitive dissonance if he advises his
clients to invest differently than he invests himself.
In this section, we present three tests that examine whether advisors trade contrary to their
beliefs. We show that advisors continue to trade similarly after they quit the industry; that the
correlation between their behavior and that of their clients is higher for advisors with large personal
portfolios; and that advisors would have been better off had they held exact copies of their clients’
portfolios.
17Appendix B describes the methodology for this test.
23

7.1 Post-career advisors
Table 8 summarizes advisors’ behavior before and after they leave the industry. We observe more
than 400 advisors who stop advising clients. Nearly 90% of them continue to hold a personal
portfolio at their old firm. The last column’s pairwise t-tests evaluate whether advisors invest
differently while advising clients.
Advisors do not substantially alter their investment behavior after they quit the industry. Al-
though advisors trade more often during the post-career period—with annual turnover of 53%
compared to 35% during their career—this change is inconsistent with the view that they trade
actively only to convince clients to do the same. Advisors slightly moderate their return chasing
behavior in the post-career period, though they still purchase funds that are, on average, in the 58th
percentile of past-year returns. Post-career advisors continue to favor actively managed funds and
underdiversified portfolios, with allocations similar to when they were advising clients. Advisors’
annualized management expense ratios decrease by 14 basis points (t-value = −2.84) after they
leave the industry, but this change reflects an increased allocation to fixed income—the within-asset
class fee remains nearly unchanged (t-value = 0.26) at the 46th percentile. Thus, advisors’ maintain
their preference for expensive mutual funds even when there is no strategic benefit from doing so.
7.2 Client-advisor trading similarity and advisor wealth
Advisors who buy costly funds only to convince clients to do the same accept lower returns on
their own portfolios in exchange for increased commissions. The cost of this strategic trading
increases in the size of the advisor’s portfolio, while the benefit increases in client assets under
advice. Therefore, we expect such strategic behavior to be less common for advisors with larger
24

personal portfolios relative to assets under advice. Building on our analysis in Section 5, we test
this hypothesis by measuring the correlation between advisor fixed effects and advisor behavior,
alone and interacted with relative portfolio size:
µia = α+ β Own behavioria +Advisor assets
Client assetsa × (δ + θ Own behavioria) + γXa + εia. (3)
We measure an advisor’s relative portfolio size (“Advisor assets / Client assets”) as a percentile
rank. For each month, we compute the ratio of each advisor’s personal account value to the value
of his client assets under management and then rank advisors from those with the smallest ratio
(value of 0) to the largest (value of 1). An advisor’s relative portfolio size is his average percentile
rank across all months.
We summarize the estimates from Equation (3) here and report them in detail in Appendix
Table A4. In contrast to the strategic trading conjecture, the coefficients on the interactions are
positive; these estimates are statistically significant at the 5% level for return chasing and percentile
fees, and at the 10% level for idiosyncratic risk. The economic magnitudes are large. Consider,
for example, the return chasing behavior. The estimates reported in Panel A of Table 6 show that
the unconditional correlation between advisors and clients is 0.24. The estimates in Table A4 show
that this correlation is as low as 0.11 among the advisors with the smallest personal portfolios and
as high as 0.36 among advisors with the largest portfolios. Excluding total MER, for which the
interaction coefficient is very small, the correlation in advisor-client trading is two or three times
larger for advisors with the largest relative portfolios compared to the smallest. These estimates
indicate that, if anything, advisors who have a greater vested interest in the performance of their
own portfolios invest more similarly to their clients.
25

7.3 Hypothetical performance if advisors held perfect copies of their clients’
portfolios
If an advisor selects poor investments only to convince clients to do the same, his optimal portfolio
should perform no worse than that of his clients. While the advisor can benefit from buying
expensive and poor performing funds if his clients do the same, he has no reason to buy such funds
solely for his own account. We would thus expect an advisor’s unique investments to outperform
the investments that overlap with his clients.
In Table 9, we test this hypothesis by comparing advisors’ actual returns to the hypothetical
returns they would earn by duplicating their clients’ portfolios. The six-factor alpha for advisors’
actual returns is −3.01% per year (t-value of −3.07), as reported in Table 3. We also compute the
value-weighted returns on each advisor’s aggregate client portfolio. We assume the advisor would
pay the same deferred sales charges as those paid by his clients, and we credit the advisor with
the commissions he would earn by serving as his own agent. The six-factor model alpha for this
hypothetical “perfect-copy” portfolio is −2.26% per year (t-value of −2.50). This estimate is higher
than clients’ net alpha with fees (−3.22%, reported in Table 3) because of the sales commissions
and trailing commissions. The bottom part of Table 9 measures how much advisors’ alphas would
change if they copied their clients’ portfolios. In the six-factor model, the increase is 0.75% (t-value
of 3.47) per year. This estimate ranges from 0.75% to 1.03% across the three pricing models.
These estimates suggest that advisors could significantly improve their performance by holding
the same portfolios as their clients. Poor-performing funds do not appear just among investments
held jointly with clients but are actually more prevalent among investments made by the advisors
alone.
26

8 Conclusions
Many households turn to financial advisors for guidance and receive advice that has been criticized
as costly or of low-quality. A central concern, highlighted in academic studies and policy debates
alike, is that advisors lack a fiduciary obligation to clients and receive commissions that may create
agency conflicts.
We show, however, that many advisors invest personally just as they direct their clients. They
underdiversify, trade frequently, and favor expensive, actively managed mutual funds with high
past returns, despite evidence that these strategies often underperform. Advisors pursue similar
strategies in their own portfolios even after they stop advising clients, which rules out the possibility
that advisors hold expensive portfolios merely to convince clients to do the same. Rather than
passively implementing their firm’s strategy as an uninformed salesperson might, advisors of the
same dealer display considerable autonomy. Our results suggest that advisors have the wrong
beliefs rather than the wrong incentives.
Differences in advisors’ beliefs predict substantial differences in clients’ performance. Advisors
in the top decile of personal portfolio returns deliver 1.4% per year higher gross returns to clients
compared to bottom-decile advisors. Advisors in the top decile of portfolio fees likewise deliver
portfolios that cost 36 basis points per year more than bottom-decile advisors. Finally, advisors
that hold the least-diversified risky portfolios also deliver client portfolios with nearly twice the
idiosyncratic volatility as advisors in the bottom decile.
Policies aimed at resolving conflicts of interest—by imposing fiduciary duty or banning commis-
sions—do not address misguided beliefs. When advisors recommend strategies that underperform,
they often act as an agent exactly as they would as a principal, so aligning their interests would not
27

change their behavior. Solving the problem of misguided beliefs would instead require improved
education or screening of advisors, perhaps enforced with professional licensing requirements. The
market may not reward such actions if clients cannot differentiate good and bad advice. Changing
advisors’ views about active investment strategies may also be difficult. Advisors are not random
draws from the population, and they may pursue their vocation in part because of their misguided
belief that active management adds value.
28

A Appendix: Mutual Fund Fee Structures
Mutual funds come in five types, which differ in their costs and how they restrict client behavior.
In every option, the client pays the mutual fund company a management expense ratio (MER),
deducted daily from the fund’s net asset value.18 The fund types are:
1. Front-end load fund. The client pays a fee directly to the advisor upon purchase of the
fund. This up-front fee can be negotiated between the advisor and the client, subject to a
maximum value set by the mutual fund. The maximum load is typically 5% of the purchase
value. The client is free to sell the mutual fund at any time without any additional cost. In
addition to the up-front payment from the client, the advisor receives a trailing commission—
typically 1% of the client assets per year—from the mutual fund company for as long as the
client holds the fund.
2. Back-end load fund. The client pays no fee upon purchase but instead pays a deferred
sales charge if he sells the fund within a specified period of time. The deferred sales charge
is highest for redemptions in the first year and typically declines to zero after five to seven
years. Back-end load funds often release 10% of the shares each year so that the client can
sell these shares without incurring a sales charge. The mutual fund pays the advisor a sales
commission at the time of the purchase and a trailing commission for as long as the client
holds the fund. The typical sales commission is 5% of the purchase value and the typical
trailing commission is 0.5% of client assets per year. The trailing commission associated with
this option is typically low because of the up-front sales commission.
18Some funds also charge clients an administrative fee for retirement-account investments.
29

3. Low-load fund. These investments are similar to back-end load funds, except that the sales
commission and deferred sales charges are smaller and amortize more quickly.
4. No-load fund. The client pays no fee to the advisor at the time of the purchase, and the
mutual fund company pays no sales commission to the advisor. The advisor may receive a
trailing commission from the mutual fund.
5. F-class fund. These funds have no loads and pay no commissions. They are meant for
fee-only advisors, who are compensated directly by clients, but can be sold by anyone. When
these funds are sold by a commissions-based advisor, the mutual fund company can arrange
a recurring fee to be drawn from the client’s assets and paid to the advisor.
B Appendix: Analyzing client performance across deciles of ad-
visors
We normalize monthly decile returns by subtracting the average return across the deciles, and run
the two-factor asset pricing regression using these normalized returns. We estimate a model:
rd,t − rt = αd + βd,mktMKTRFt + βd,termTERMt + ed,t, (A-1)
where rd,t is decile d’s month t return and rt = (1/10)∑10
d=1 rd,t. This normalization provides more
precision when comparing performance across deciles; it removes the time-series variation in returns
that is common to all clients. These standard errors are appropriate for comparisons across deciles;
the estimates in Table 3 are appropriate for tests concerning the level of alphas.
30

We next estimate the two-factor regression for the average return in excess of the riskless rate,
rt − rf,t = α+ βmktMKTRFt + βtermTERMt + et. (A-2)
In Panel B of Figure 5, we plot αd + α for each decile to restore the level of alphas. We take
the standard errors from the normalized regressions of Equation (A-1), thereby showing only the
cross-advisor estimation uncertainty.
31
REFERENCES
Anagol, S., S. Cole, and S. Sarkar (2016). Understanding the advice of commissions-motivated
agents: Evidence from the Indian life insurance market. Review of Economics and Statistics.
Forthcoming.
Barber, B. M. and T. Odean (2000). Trading is hazardous to your wealth: The common stock
investment performance of individual investors. Journal of Finance 55 (2), 773–806.
Barber, B. M. and T. Odean (2008). All that glitters: The effect of attention and news on the
buying behavior of individual and institutional investors. Review of Financial Studies 21 (2),
785–818.
Barber, B. M. and T. Odean (2013). The behavior of individual investors. In G. M. Constan-
tinides, M. Harris, and R. M. Stulz (Eds.), Handbook of the Economics of Finance, Volume 2B,
pp. 1533–1570. Elsevier.
Bergstresser, D., J. M. R. Chalmers, and P. Tufano (2009). Assessing the costs and benefits of
brokers in the mutual fund industry. Review of Financial Studies 22 (10), 4129–4156.
Bronnenberg, B. J., J.-P. Dube, M. Gentzkow, and J. M. Shapiro (2015). Do pharmacists buy
Bayer? Informed shoppers and the brand premium. Quarterly Journal of Economics 130 (4),
1669–1726.
Calvet, L. E., J. Y. Campbell, and P. Sodini (2007). Down or out: Assessing the welfare costs of
household investment mistakes. Journal of Political Economy 115 (5), 707–747.
Canadian Securities Administrators (2012). Mutual fund fees. Discussion paper and request for
comment 81-407.
Carhart, M. M. (1997). On persistence in mutual fund performance. Journal of Finance 52 (1),
57–82.
Chalmers, J. and J. Reuter (2015). Is conflicted investment advice better than no advice? Work-
ing paper.
Cheng, I., S. Raina, and W. Xiong (2014). Wall Street and the housing bubble. American Eco-
nomic Review 104 (9), 2797–2829.
Christoffersen, S. E. K., R. Evans, and D. K. Musto (2013). What do consumers’ fund flows
maximize? Evidence from their brokers’ incentives. Journal of Finance 68 (1), 201–235.
Dvorak, T. (2015). Do 401k plan advisors take their own advice? Journal of Pension Economics
and Finance 14 (1), 55–75.
32

Egan, M. (2016). Brokers vs. retail investors: Conflicting interests and dominated products.
Working paper.
Egan, M., G. Matvos, and A. Seru (2015). The market for financial adviser misconduct. University
of Chicago working paper.
Foerster, S., J. T. Linnainmaa, B. T. Melzer, and A. Previtero (2015). Retail financial advice:
Does one size fit all? Journal of Finance. Forthcoming.
Frazzini, A. and O. A. Lamont (2008). Dumb money: Mutual fund flows and the cross-section
of stock returns. Journal of Financial Economics 88 (2), 299–322.
French, K. R. (2008). Presidential address: The cost of active investing. Journal of Finance 63 (4),
1537–1573.
Fusion Consulting (2011). State of the industry.
Gennaioli, N., A. Shleifer, and R. Vishny (2015). Money doctors. Journal of Finance 70 (1),
91–114.
Goetzmann, W. N. and A. Kumar (2008). Equity portfolio diversification. Review of Fi-
nance 12 (3), 433–463.
Grinblatt, M. and M. Keloharju (2001). What makes investors trade? Journal of Finance 56 (2),
589–616.
Grinblatt, M., M. Keloharju, and J. Linnainmaa (2011). IQ and stock market participation.
Journal of Finance 66 (6), 2121–2164.
Hackethal, A., R. Inderst, and S. Meyer (2012). Trading on advice. CEPR Discussion Paper
8091.
Hoechle, D., S. Ruenzi, N. Schaub, and M. Schmid (2015). Financial advice and bank profits.
Swiss Institute of Banking and Finance Working paper.
Investment Company Institute (2012). 2012 Investment Company Fact Book, 52nd edition.
Kaniel, R., G. Saar, and S. Titman (2008). Individual investor trading and stock returns. Journal
of Finance 63 (1), 273–310.
Kumar, A. (2009). Who gambles in the stock market? Journal of Finance 64 (4), 1889–1933.
Levitt, S. D. and C. Syverson (2008). Market distortions when agents are better informed: The
value of information in real estate transactions. Review of Economics and Statistics 90 (4),
599–611.
Lintner, J. (1965). The valuation of risk assets and the selection of risky investments in stock
portfolios and capital budgets. Review of Economics and Statistics 47 (1), 13–37.
33

Mullainathan, S., M. Noth, and A. Schoar (2012). The market for financial advice: An audit
study. NBER Working Paper No. 17929.
Nofsinger, J. R. and R. W. Sias (1999). Herding and feedback trading by institutional and
individual investors. Journal of Finance 54 (6), 2263–2295.
Odean, T. (1999). Do investors trade too much? American Economic Review 89 (5), 1279–1298.
Sharpe, W. F. (1964). Capital asset prices: A theory of market equilibrium under conditions of
risk. Journal of Finance 19 (3), 425–442.
34

Return chasing estimate
Densityofclients
Densityofadvisors
0 10 20 30 40 50 60 70 80 90 1000
1
2
3
4
5
0
1
2
3
4
5
ClientsAdvisors
Figure 1: Return chasing by clients and advisors. We compute the average percentile rank ofprior-year returns for mutual funds purchased by each advisor and client with at least 10 purchases.This figure plots the distribution of this return chasing estimate across clients and advisors. Theadvisor measures on the secondary y-axis are scaled down for ease of comparison.
35
Month relative to the client purchase
Pr(Co-clientpurchasesthesamefund)
!12 !9 !6 !3 0 3 6 9 120
0:1
0:2
0:3
0:4
0:5
Own co-clientsRandom clients (same dealer)Random clients (di,erent dealer)
Figure 2: Similarity in fund purchases and timing between clients and co-clients. Forall purchases of a new fund by a client, we compute the probability that at least one client ofthe same advisor (a “co-client”) makes a new purchase of the same fund in the two-year windowaround the purchase. The solid black line indicates the estimated probability and the dashedblack lines indicate the 95% confidence interval. We also compute the probabilities of commonpurchase between a client and counterfactual co-clients of a different advisor at the same dealer(blue line) or the other dealer (red line). To form these estimates we resample the data 100 timeswith replacement and match each client with a randomly drawn advisor’s clients.
36
Month relative to the advisor purchase
Pr(Clientpurchasesthesamefund)
!12 !9 !6 !3 0 3 6 9 120
0:1
0:2
0:3
0:4
0:5
Own advisorRandom advisor (same dealer)Random advisor (di,erent dealer)
Figure 3: Similarity in fund purchases between advisors and their clients. For all purchasesof a new fund by an advisor, we compute the probability that at least one client of the advisor makesa new purchase of the same fund in the two-year window around the purchase. The solid black lineindicates the estimated probability and the dashed black lines indicate the 95% confidence interval.We also compute the probabilities of common purchase between a client and a counterfactualadvisor of the same dealer (blue line) or the other dealer (red line). To form these estimates weresample the data 100 times with replacement and randomly match each advisor with the clientsof another advisor that purchased a new fund in the same month.
37
Advisor
Co-purchase
probability(%
)
Old New New0
1
2
3
4
5
6
7
8Before displacement After displacement
Figure 4: Estimated co-purchase probabilities for displaced clients. We compute theprobabilities of “co-purchase” between clients and their current and future advisors using the sampleof displaced clients. A client’s purchase is a co-purchase if the advisor buys the same fund withina three-month window of the client purchase. The before-displacement bars denote the probabilitythat a client’s current advisor (“old”) or future advisor (“new”) purchase the same fund before theclient is displaced. The after-displacement bar denotes the probability that the client’s new advisor(after displacement) purchases the same fund as the client. The before-displacement sample isrestricted to clients of future advisors that advise clients before the displacement. The error barsindicate 95% confidence intervals.
38
Panel A: Client fees conditional on advisor fees
Advisor fee decile
Clien
tfe
e,annualize
d%
1 2 3 4 5 6 7 8 9 102:3
2:4
2:5
2:6
2:7
Panel B: Client alphas conditional on advisor alphas
Advisor alpha decile
Clientalpha,annualized%
1 2 3 4 5 6 7 8 9 10!4:5
!4:0
!3:5
!3:0
!2:5
!2:0
!1:5
!1:0
!0:5
0:0
0:5
1:0
Gross alphaNet alpha
39
Panel C: Client idiosyncratic risk conditional on advisor idiosyncratic risk
Advisor idiosyncratic risk decile
Clien
tid
iosy
ncr
atic
risk
,annualize
d%
1 2 3 4 5 6 7 8 9 105
6
7
8
9
10
Figure 5: Client investment performance conditional on advisor investment perfor-mance. This figure sorts advisors into deciles based on the fees (Panels A), alphas (Panel B) oridiosyncratic risk (Panel C) in their personal portfolios and reports the average fee, alpha or id-iosyncratic risk of their clients’ portfolios. The fees consist of management expense ratios, front-endloads, and deferred sales charges. The alphas in Panel B are estimated using a two-factor modelwith the market (equity) and term (fixed income) factors. Idiosyncratic risk in Panel C is theannualized volatility of residual returns from regressions of each investor’s risky portfolio returnsagainst the MSCI World index. In Panels A and B, we compute the 95% confidence intervals afterremoving time-series variation in fees and returns shared by all clients (see Appendix B for details).
40
Table 1: Descriptive statistics from dealer data
This table reports demographics and portfolio information for clients and financial advisors, andclient information for financial advisors. “Account age (years)” is the number of years an investor’saccount has been open. “Experience” is the number of years since the advisor obtained a licenseor, if the license date is unknown, the number of years after first appearing as an advisor in oursample. We calculate “Risky share” as the fraction of assets invested in equities, assuming balancedfunds invest 50% in equities. For Panel A, we compute the distribution of each variable by calendarmonth and report the average over time for the mean and each point in the distribution. Timehorizon, risk tolerance, financial knowledge, income, and net worth, which we report in Panel B,are collected by advisors through “Know-Your-Client” surveys. Panel C categorizes clients’ andadvisors’ discretionary mutual fund purchases and reports the frequency of each type. We label as“discretionary” all purchases that are not made under an automatic savings plan. A purchase is:“client-only” if the client’s advisor neither purchases nor holds the same fund at the same time;“client and advisor purchase” if both the client and advisor buy the same fund in the same month;or “client purchases, advisor holds” if the advisor holds the fund at the same time. The advisorpurchase categories are defined analogously.
41
Panel A: Demographics, portfolio characteristics, and client accountsPercentiles
Variable Mean 10th 25th 50th 75th 90th
Clients (N = 488,263)
DemographicsFemale (%) 52.2Age 49.2 32.1 39.7 48.4 58.1 67.4
Investment portfolioAccount age (years) 4.6 0.9 2.3 4.5 6.9 8.0Number of plans 2.0 1.0 1.0 1.7 2.4 3.9Number of funds 4.7 1.0 1.8 3.5 6.3 10.0Account value, $K 55.3 2.2 7.3 23.5 63.4 136.0Risky share (%) 73.3 46.6 56.9 76.5 96.7 100.0
Financial advisors (N = 3,276)
DemographicsFemale (%) 27.1Age 48.4 34.8 40.9 48.3 56.1 62.0
Investment portfolioAccount age (years) 5.4 1.2 2.8 5.2 7.4 8.8Number of plans 3.4 1.0 1.1 2.7 4.6 6.7Number of funds 8.7 1.3 2.9 6.4 12.0 18.7Account value, $K 112.1 3.8 14.7 50.9 130.7 269.2Risky share (%) 80.7 51.2 70.2 88.1 99.7 100.0
Client accountsExperience 5.8 2.3 4.3 6.9 7.0 7.0Number of clients 109.8 4.2 17.7 63.6 153.6 275.2Client assets, $ thousands 6,242.6 94.9 569.4 2,546.8 7,799.2 17,499.5
42

Panel B: Account and client characteristicsAccount types Clients Advisors Time horizon Clients Advisors
General 27.6% 44.3% 1–3 years 2.5% 2.2%Retirement 84.9% 85.6% 4–5 years 8.1% 5.3%Education savings 9.4% 23.0% 6–9 years 69.7% 67.2%Tax-free 4.3% 7.4% 10+ years 19.7% 25.3%Other 0.6% 0.1%
Risk tolerance Clients Advisors Salary Clients Advisors
Very low 4.2% 1.0% $30–50k 34.6% 15.1%Low 4.3% 2.7% $50–70k 35.4% 26.1%Low to Moderate 8.5% 3.1% $70–100k 17.3% 21.6%Moderate 51.5% 30.1% $100–200k 12.1% 34.1%Moderate to High 19.7% 20.7% $200–300k 0.2% 2.2%High 11.9% 42.3% Over $300k 0.2% 0.8%
Financial knowledge Clients Advisors Net worth Clients Advisors
Low 40.3% 1.5% Under $35k 3.6% 1.3%Moderate 54.5% 15.7% $35–60k 6.2% 2.5%High 5.2% 82.8% $60–100k 9.3% 5.9%
$100–200k 18.3% 13.1%Over $200k 62.7% 77.2%
Panel C: Clients’ and advisors’ discretionary mutual fund purchases
Client only 72.5% Advisor only 19.7%Client and advisor purchase 4.3% Advisor and client purchase 43.7%Client purchases, advisor holds 23.3% Advisor purchases, client holds 36.6%
No. of discretionary purchases 8,119,446 No. of discretionary purchases 127,251
43

Table 2: The trading behaviors of clients and advisors
This table summarizes the trading behaviors of clients and advisors. The measures are definedas follows: (i) Return chasing is the average percentile rank of prior one-year returns for fundsbought; (ii) Active management is the proportion of index funds and target-date funds bought;(iii) Turnover is the market value of monthly purchases and sales divided by the beginning ofmonth market value of holdings (annualized by multiplying by 12); and (iv) Underdiversificationis the annualized volatility of the residuals from regressions of risky portfolio returns against theMSCI World index. The bottom two rows report two measures of fees. Total MER is the averagemanagement expense ratio of the funds bought by clients and advisors. Percentile within assetclass is the average percentile fee rank of funds bought. We compute percentile ranks withinfive asset classes: equity, balanced, fixed income, money market, and alternatives. We include allaccounts and, in the case of turnover, also report the measures separately for general-purpose andretirement accounts. We compute the client measures by first taking the average client behaviorfor each advisor and then averaging across advisors.
Clients Advisors Difference,Behavior Mean SE Mean SE t-value N
Return chasing 60.3 0.2 63.1 0.3 −9.67 2,313Active management 98.5 0.1 98.8 0.2 −1.52 2,380Turnover
Retirement accounts 30.9 0.7 38.9 1.3 −6.15 2,352General-purpose accounts 33.7 0.9 52.2 1.9 −9.83 1,498All 31.5 0.7 40.0 1.2 −7.20 2,589
Underdiversification 7.3 0.0 8.1 0.1 −11.10 2,402
FeesPercentile within asset class 43.2 0.2 45.9 0.3 −10.10 2,361Total MER 2.36 0.01 2.43 0.01 −6.70 2,364
44
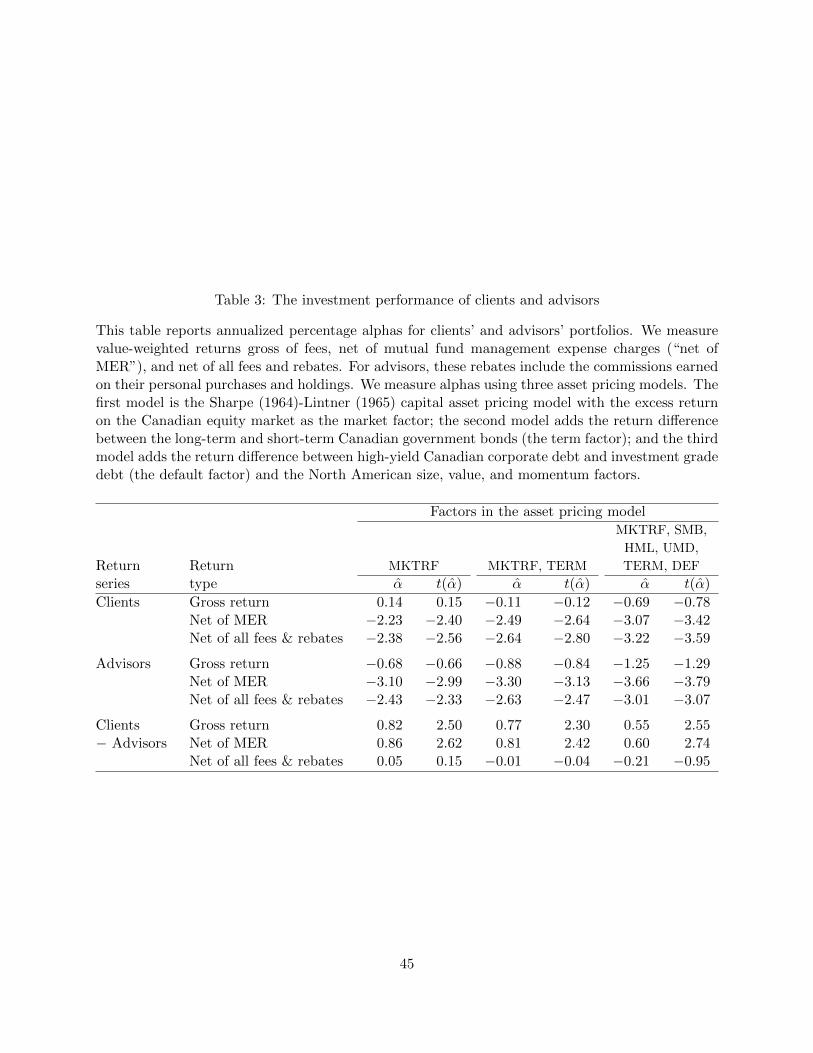
Table 3: The investment performance of clients and advisors
This table reports annualized percentage alphas for clients’ and advisors’ portfolios. We measurevalue-weighted returns gross of fees, net of mutual fund management expense charges (“net ofMER”), and net of all fees and rebates. For advisors, these rebates include the commissions earnedon their personal purchases and holdings. We measure alphas using three asset pricing models. Thefirst model is the Sharpe (1964)-Lintner (1965) capital asset pricing model with the excess returnon the Canadian equity market as the market factor; the second model adds the return differencebetween the long-term and short-term Canadian government bonds (the term factor); and the thirdmodel adds the return difference between high-yield Canadian corporate debt and investment gradedebt (the default factor) and the North American size, value, and momentum factors.
Factors in the asset pricing modelMKTRF, SMB,
HML, UMD,
Return Return MKTRF MKTRF, TERM TERM, DEF
series type α t(α) α t(α) α t(α)
Clients Gross return 0.14 0.15 −0.11 −0.12 −0.69 −0.78Net of MER −2.23 −2.40 −2.49 −2.64 −3.07 −3.42Net of all fees & rebates −2.38 −2.56 −2.64 −2.80 −3.22 −3.59
Advisors Gross return −0.68 −0.66 −0.88 −0.84 −1.25 −1.29Net of MER −3.10 −2.99 −3.30 −3.13 −3.66 −3.79Net of all fees & rebates −2.43 −2.33 −2.63 −2.47 −3.01 −3.07
Clients Gross return 0.82 2.50 0.77 2.30 0.55 2.55− Advisors Net of MER 0.86 2.62 0.81 2.42 0.60 2.74
Net of all fees & rebates 0.05 0.15 −0.01 −0.04 −0.21 −0.95
45

Table 4: Explaining cross-sectional variation in return chasing with advisor fixed effects and clientattributes
Panel A evaluates the importance of advisor, dealer, and province fixed effects and client attributesin explaining cross-sectional variation in clients’ return chasing behavior. Return chasing is theaverage percentile rank of prior one-year returns of funds purchased. The unit of observation is aclient-advisor pair. The first regression in Panel A includes client attributes and a dealer effect.The second regression adds advisor fixed effects. The age fixed effects are based on the client’saverage age during the time the client is active, measured in five-year increments. Panel B uses asample that consists of clients who are forced to switch advisors when their old advisor dies, retires,or leaves the industry. The specifications in Panel B include advisor fixed effects, client fixed effectsor both. We calculate t-values with clustering by advisor.
46
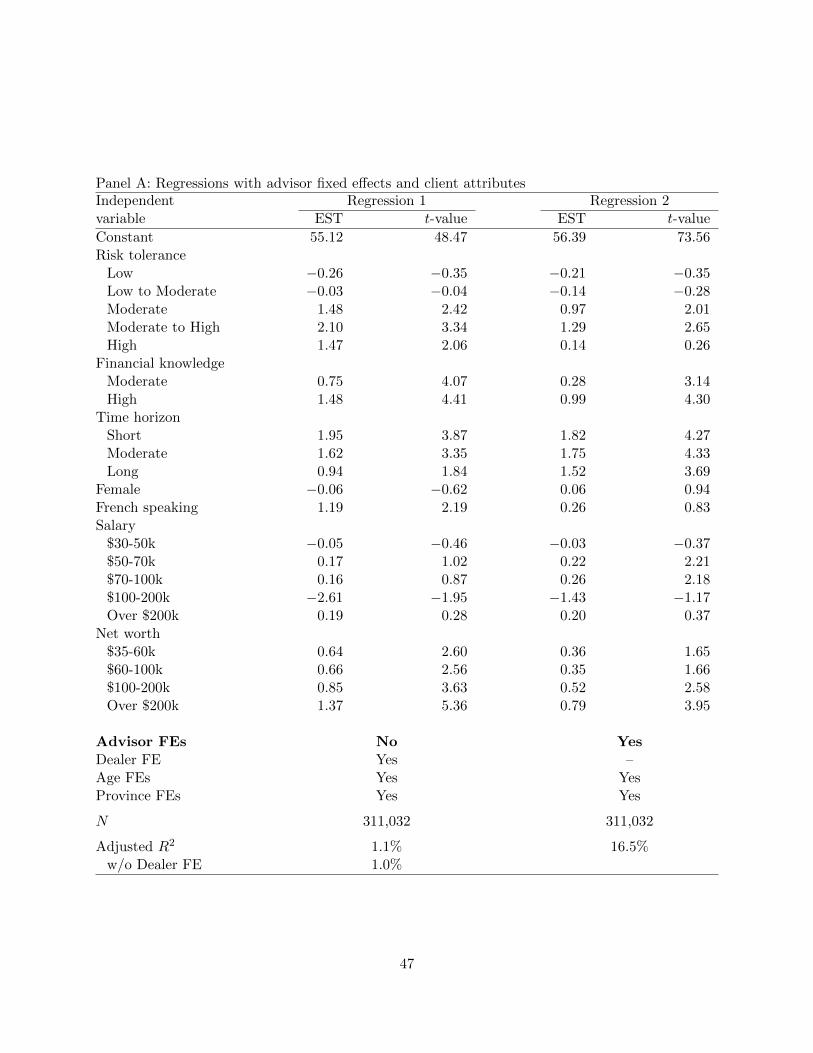
Panel A: Regressions with advisor fixed effects and client attributesIndependent Regression 1 Regression 2variable EST t-value EST t-value
Constant 55.12 48.47 56.39 73.56Risk tolerance
Low −0.26 −0.35 −0.21 −0.35Low to Moderate −0.03 −0.04 −0.14 −0.28Moderate 1.48 2.42 0.97 2.01Moderate to High 2.10 3.34 1.29 2.65High 1.47 2.06 0.14 0.26
Financial knowledgeModerate 0.75 4.07 0.28 3.14High 1.48 4.41 0.99 4.30
Time horizonShort 1.95 3.87 1.82 4.27Moderate 1.62 3.35 1.75 4.33Long 0.94 1.84 1.52 3.69
Female −0.06 −0.62 0.06 0.94French speaking 1.19 2.19 0.26 0.83Salary
$30-50k −0.05 −0.46 −0.03 −0.37$50-70k 0.17 1.02 0.22 2.21$70-100k 0.16 0.87 0.26 2.18$100-200k −2.61 −1.95 −1.43 −1.17Over $200k 0.19 0.28 0.20 0.37
Net worth$35-60k 0.64 2.60 0.36 1.65$60-100k 0.66 2.56 0.35 1.66$100-200k 0.85 3.63 0.52 2.58Over $200k 1.37 5.36 0.79 3.95
Advisor FEs No YesDealer FE Yes –Age FEs Yes YesProvince FEs Yes Yes
N 311,032 311,032
Adjusted R2 1.1% 16.5%w/o Dealer FE 1.0%
47

Panel B: Regressions with advisor and client fixed effectsAdvisor FEs Client FEs Adjusted R2
Yes No 19.7%No Yes 5.1%Yes Yes 29.1%
Test: Client FEs jointly zero F (9537, 2495) = 1.30Test: Advisor FEs jointly zero F (154, 1402) = 4.19
Number of observations 12,476
48

Table 5: Explaining cross-sectional variation in client behavior with advisor fixed effects, clientattributes, and client fixed effects
Panel A reports adjusted R2s for models explaining cross-sectional variation in client behaviorusing advisor fixed effects, dealer fixed effects, and client attributes. Panel B reports adjusted R2sfor models with advisor and client fixed effects in the sample of displaced clients. The displacedclients are those who switch advisors when their old advisor dies, retires, or leaves the industry.We calculate the measures of behavior using all trades and holdings in clients’ general-purpose andretirement accounts. The unit of observation is a client-advisor pair.
Panel A: Regressions with advisor fixed effects and client attributesClient attributes Client attributes
Behavior Client attributes + dealer effect + advisor FEs N
Return chasing 1.0% 1.1% 16.5% 311,032Active management 0.9% 0.9% 18.0% 325,472Turnover 0.7% 0.7% 7.1% 387,640Underdiversification 3.0% 3.1% 20.2% 287,229
FeesTotal MER 8.1% 8.3% 26.1% 322,968Percentile within asset class 3.0% 3.1% 22.4% 321,064
Panel B: Two-way fixed effects models for client behaviorClient Advisor Both
Behavior FEs FEs FEs N
Return chasing 5.1% 19.7% 29.1% 12,476Active management 8.8% 34.1% 49.0% 13,259Turnover 7.2% 13.9% 21.9% 22,764Underdiversification 44.6% 26.1% 63.8% 16,195
FeesTotal MER 57.0% 34.3% 67.3% 13,161Percentile within asset class 30.7% 29.3% 47.9% 13,076
49
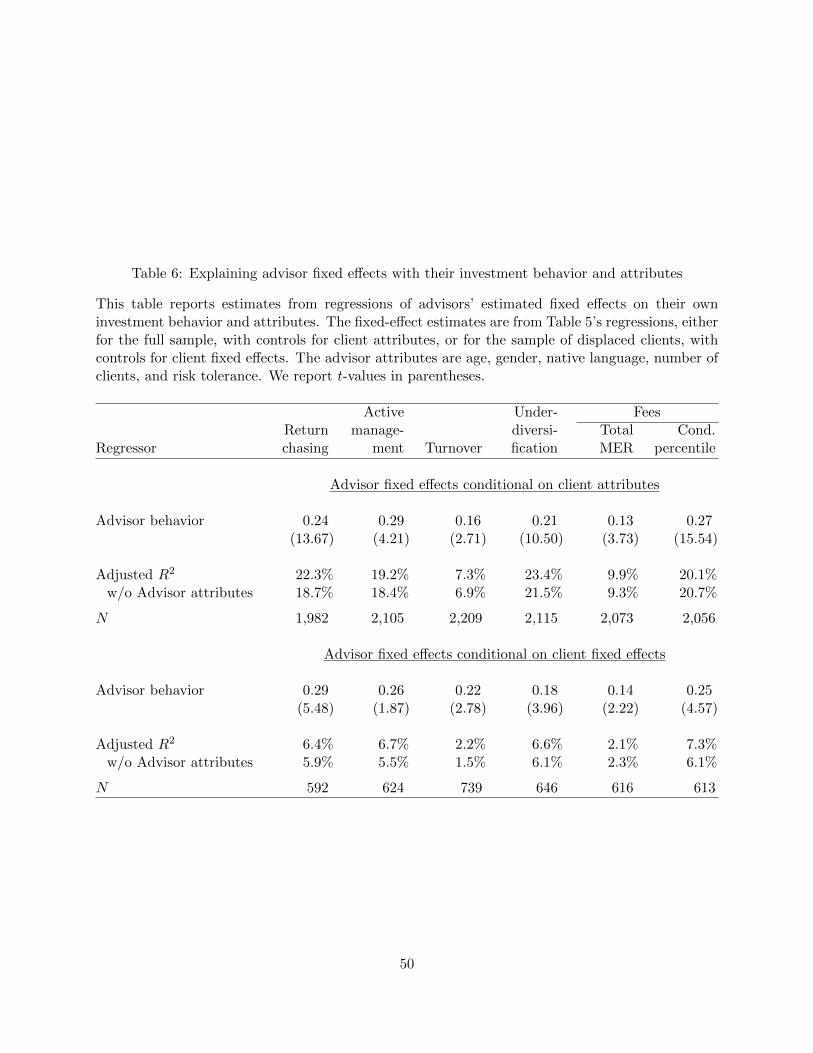
Table 6: Explaining advisor fixed effects with their investment behavior and attributes
This table reports estimates from regressions of advisors’ estimated fixed effects on their owninvestment behavior and attributes. The fixed-effect estimates are from Table 5’s regressions, eitherfor the full sample, with controls for client attributes, or for the sample of displaced clients, withcontrols for client fixed effects. The advisor attributes are age, gender, native language, number ofclients, and risk tolerance. We report t-values in parentheses.
Active Under- FeesReturn manage- diversi- Total Cond.
Regressor chasing ment Turnover fication MER percentile
Advisor fixed effects conditional on client attributes
Advisor behavior 0.24 0.29 0.16 0.21 0.13 0.27(13.67) (4.21) (2.71) (10.50) (3.73) (15.54)
Adjusted R2 22.3% 19.2% 7.3% 23.4% 9.9% 20.1%w/o Advisor attributes 18.7% 18.4% 6.9% 21.5% 9.3% 20.7%
N 1,982 2,105 2,209 2,115 2,073 2,056
Advisor fixed effects conditional on client fixed effects
Advisor behavior 0.29 0.26 0.22 0.18 0.14 0.25(5.48) (1.87) (2.78) (3.96) (2.22) (4.57)
Adjusted R2 6.4% 6.7% 2.2% 6.6% 2.1% 7.3%w/o Advisor attributes 5.9% 5.5% 1.5% 6.1% 2.3% 6.1%
N 592 624 739 646 616 613
50
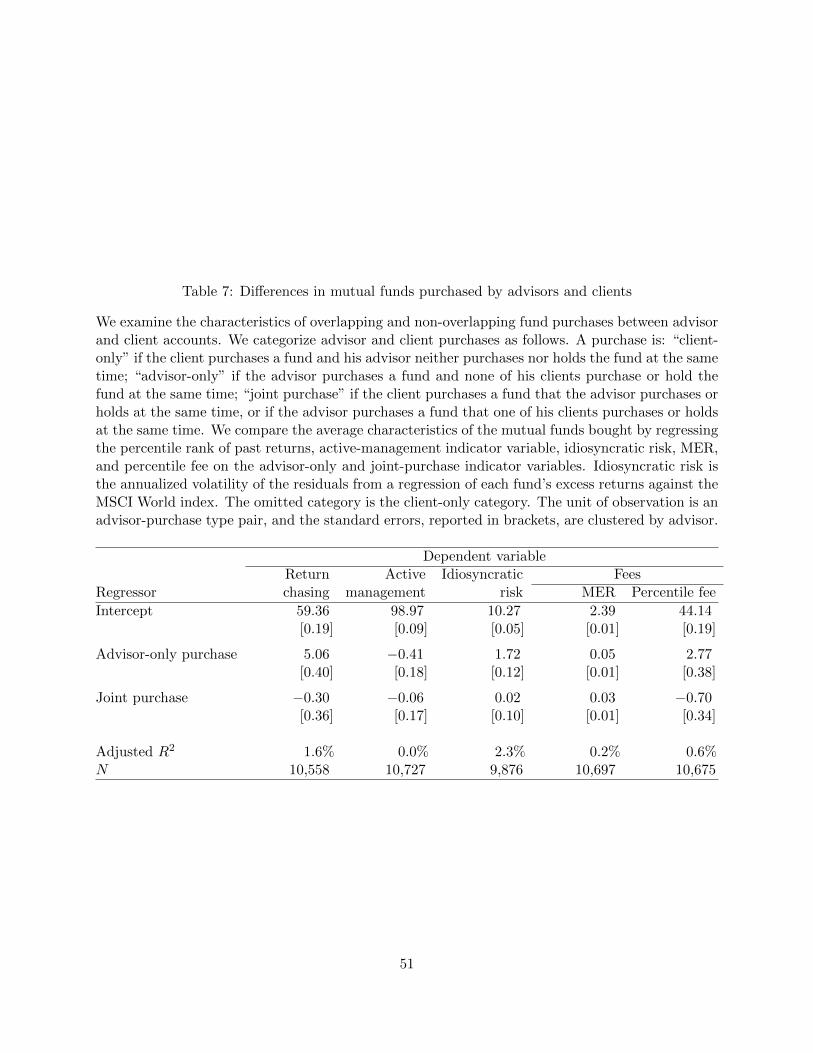
Table 7: Differences in mutual funds purchased by advisors and clients
We examine the characteristics of overlapping and non-overlapping fund purchases between advisorand client accounts. We categorize advisor and client purchases as follows. A purchase is: “client-only” if the client purchases a fund and his advisor neither purchases nor holds the fund at the sametime; “advisor-only” if the advisor purchases a fund and none of his clients purchase or hold thefund at the same time; “joint purchase” if the client purchases a fund that the advisor purchases orholds at the same time, or if the advisor purchases a fund that one of his clients purchases or holdsat the same time. We compare the average characteristics of the mutual funds bought by regressingthe percentile rank of past returns, active-management indicator variable, idiosyncratic risk, MER,and percentile fee on the advisor-only and joint-purchase indicator variables. Idiosyncratic risk isthe annualized volatility of the residuals from a regression of each fund’s excess returns against theMSCI World index. The omitted category is the client-only category. The unit of observation is anadvisor-purchase type pair, and the standard errors, reported in brackets, are clustered by advisor.
Dependent variableReturn Active Idiosyncratic Fees
Regressor chasing management risk MER Percentile fee
Intercept 59.36 98.97 10.27 2.39 44.14[0.19] [0.09] [0.05] [0.01] [0.19]
Advisor-only purchase 5.06 −0.41 1.72 0.05 2.77[0.40] [0.18] [0.12] [0.01] [0.38]
Joint purchase −0.30 −0.06 0.02 0.03 −0.70[0.36] [0.17] [0.10] [0.01] [0.34]
Adjusted R2 1.6% 0.0% 2.3% 0.2% 0.6%N 10,558 10,727 9,876 10,697 10,675
51
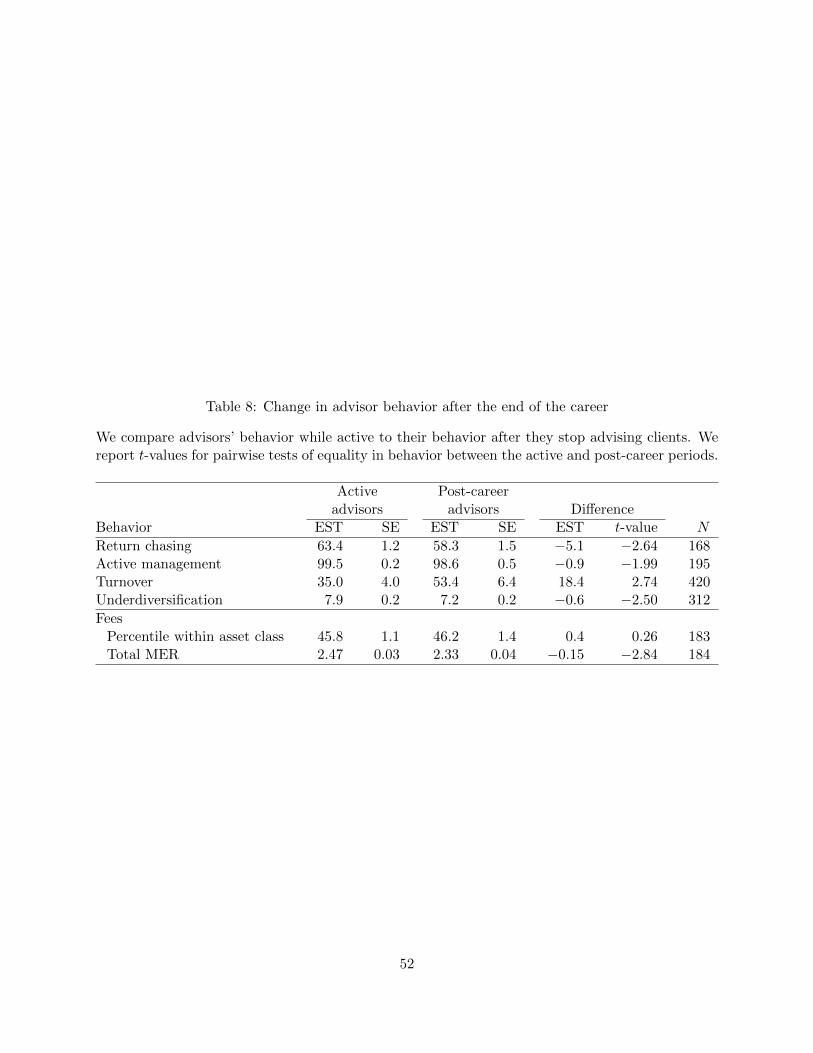
Table 8: Change in advisor behavior after the end of the career
We compare advisors’ behavior while active to their behavior after they stop advising clients. Wereport t-values for pairwise tests of equality in behavior between the active and post-career periods.
Active Post-careeradvisors advisors Difference
Behavior EST SE EST SE EST t-value N
Return chasing 63.4 1.2 58.3 1.5 −5.1 −2.64 168Active management 99.5 0.2 98.6 0.5 −0.9 −1.99 195Turnover 35.0 4.0 53.4 6.4 18.4 2.74 420Underdiversification 7.9 0.2 7.2 0.2 −0.6 −2.50 312
FeesPercentile within asset class 45.8 1.1 46.2 1.4 0.4 0.26 183Total MER 2.47 0.03 2.33 0.04 −0.15 −2.84 184
52
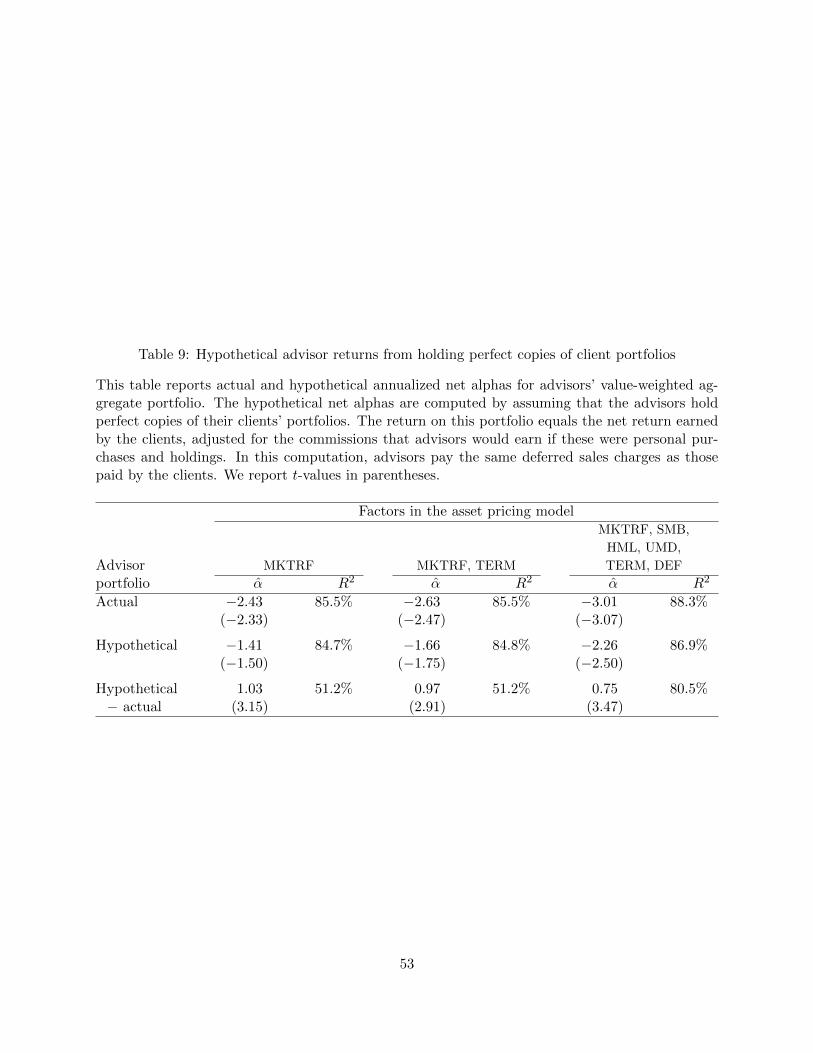
Table 9: Hypothetical advisor returns from holding perfect copies of client portfolios
This table reports actual and hypothetical annualized net alphas for advisors’ value-weighted ag-gregate portfolio. The hypothetical net alphas are computed by assuming that the advisors holdperfect copies of their clients’ portfolios. The return on this portfolio equals the net return earnedby the clients, adjusted for the commissions that advisors would earn if these were personal pur-chases and holdings. In this computation, advisors pay the same deferred sales charges as thosepaid by the clients. We report t-values in parentheses.
Factors in the asset pricing modelMKTRF, SMB,
HML, UMD,
Advisor MKTRF MKTRF, TERM TERM, DEF
portfolio α R2 α R2 α R2
Actual −2.43 85.5% −2.63 85.5% −3.01 88.3%(−2.33) (−2.47) (−3.07)
Hypothetical −1.41 84.7% −1.66 84.8% −2.26 86.9%(−1.50) (−1.75) (−2.50)
Hypothetical 1.03 51.2% 0.97 51.2% 0.75 80.5%− actual (3.15) (2.91) (3.47)
53
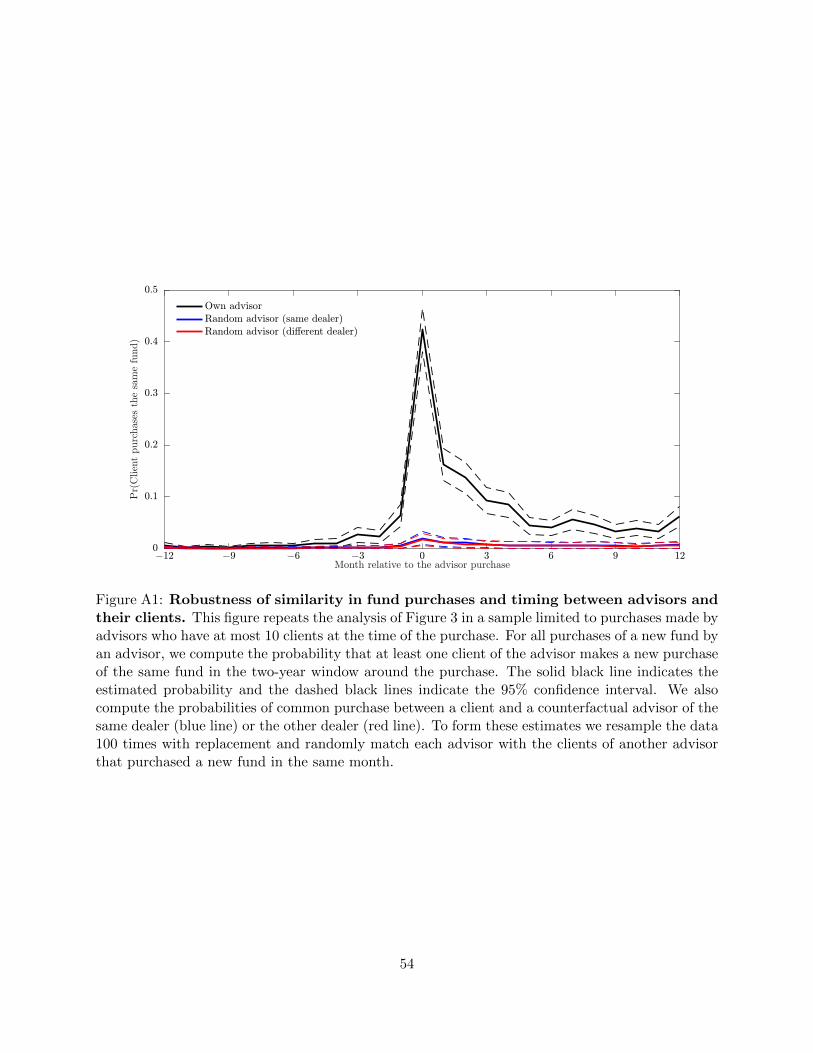
Month relative to the advisor purchase
Pr(Clientpurchasesthesamefund)
!12 !9 !6 !3 0 3 6 9 120
0:1
0:2
0:3
0:4
0:5
Own advisorRandom advisor (same dealer)Random advisor (di,erent dealer)
Figure A1: Robustness of similarity in fund purchases and timing between advisors andtheir clients. This figure repeats the analysis of Figure 3 in a sample limited to purchases made byadvisors who have at most 10 clients at the time of the purchase. For all purchases of a new fund byan advisor, we compute the probability that at least one client of the advisor makes a new purchaseof the same fund in the two-year window around the purchase. The solid black line indicates theestimated probability and the dashed black lines indicate the 95% confidence interval. We alsocompute the probabilities of common purchase between a client and a counterfactual advisor of thesame dealer (blue line) or the other dealer (red line). To form these estimates we resample the data100 times with replacement and randomly match each advisor with the clients of another advisorthat purchased a new fund in the same month.
54
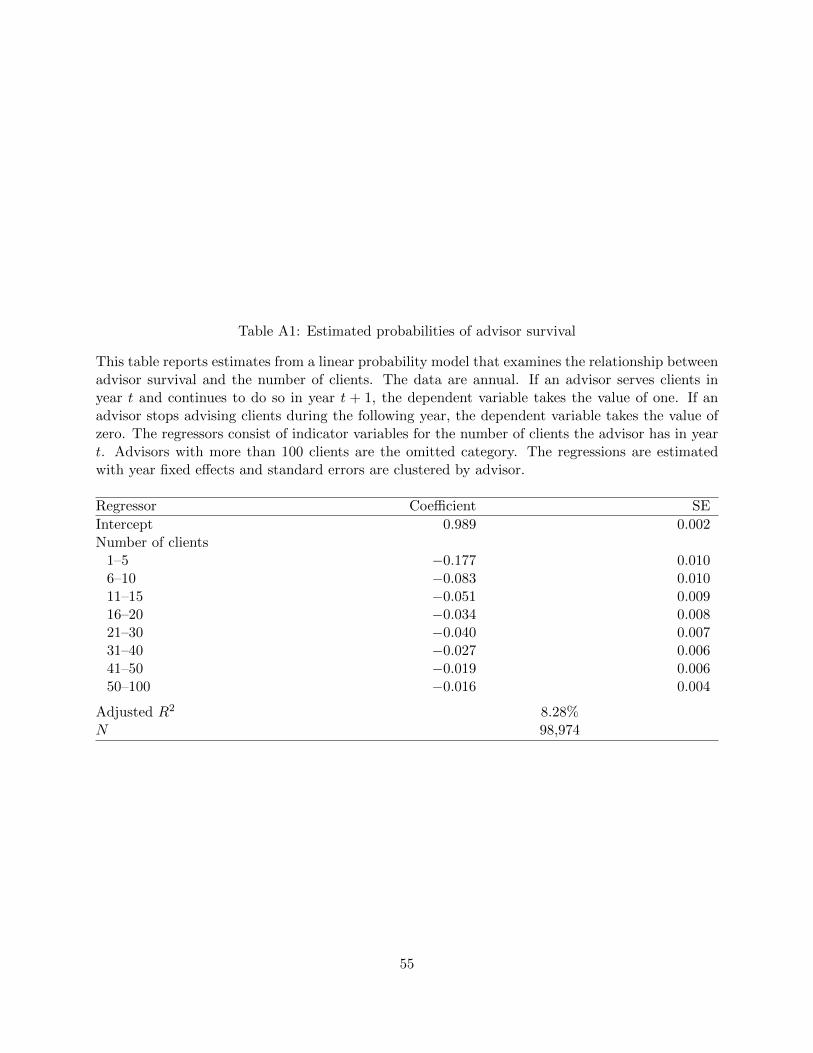
Table A1: Estimated probabilities of advisor survival
This table reports estimates from a linear probability model that examines the relationship betweenadvisor survival and the number of clients. The data are annual. If an advisor serves clients inyear t and continues to do so in year t + 1, the dependent variable takes the value of one. If anadvisor stops advising clients during the following year, the dependent variable takes the value ofzero. The regressors consist of indicator variables for the number of clients the advisor has in yeart. Advisors with more than 100 clients are the omitted category. The regressions are estimatedwith year fixed effects and standard errors are clustered by advisor.
Regressor Coefficient SE
Intercept 0.989 0.002Number of clients
1–5 −0.177 0.0106–10 −0.083 0.01011–15 −0.051 0.00916–20 −0.034 0.00821–30 −0.040 0.00731–40 −0.027 0.00641–50 −0.019 0.00650–100 −0.016 0.004
Adjusted R2 8.28%N 98,974
55
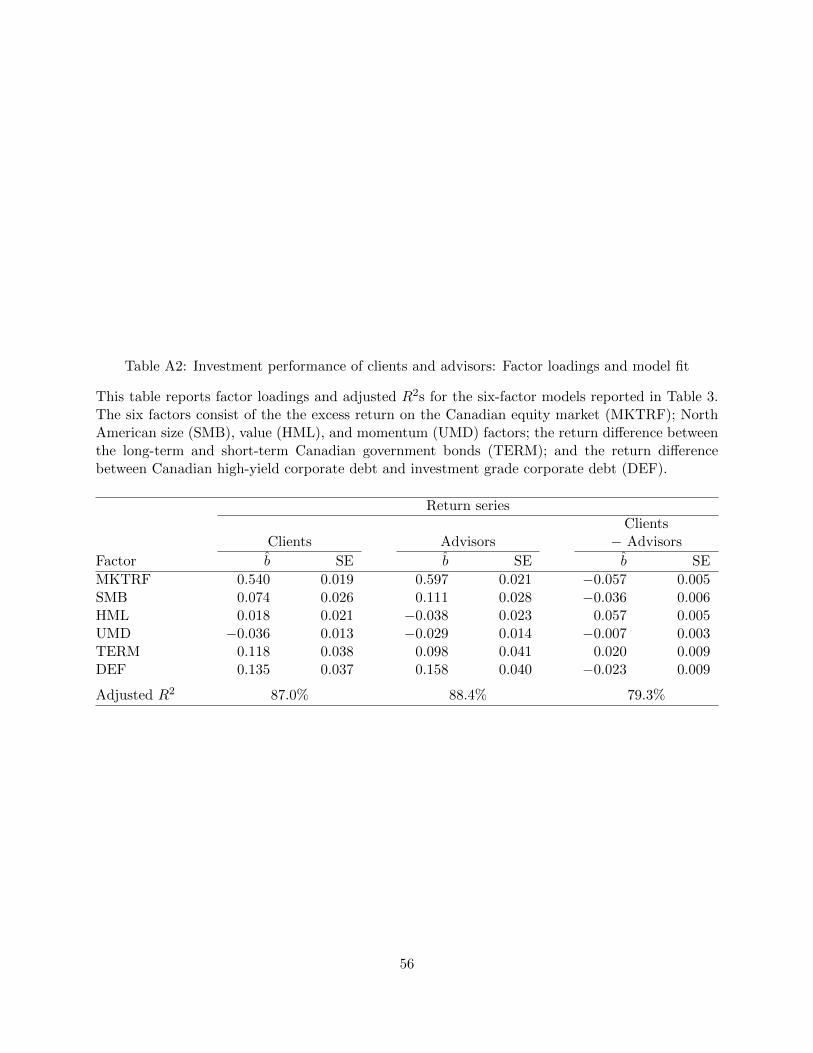
Table A2: Investment performance of clients and advisors: Factor loadings and model fit
This table reports factor loadings and adjusted R2s for the six-factor models reported in Table 3.The six factors consist of the the excess return on the Canadian equity market (MKTRF); NorthAmerican size (SMB), value (HML), and momentum (UMD) factors; the return difference betweenthe long-term and short-term Canadian government bonds (TERM); and the return differencebetween Canadian high-yield corporate debt and investment grade corporate debt (DEF).
Return seriesClients
Clients Advisors − Advisors
Factor b SE b SE b SE
MKTRF 0.540 0.019 0.597 0.021 −0.057 0.005SMB 0.074 0.026 0.111 0.028 −0.036 0.006HML 0.018 0.021 −0.038 0.023 0.057 0.005UMD −0.036 0.013 −0.029 0.014 −0.007 0.003TERM 0.118 0.038 0.098 0.041 0.020 0.009DEF 0.135 0.037 0.158 0.040 −0.023 0.009
Adjusted R2 87.0% 88.4% 79.3%
56
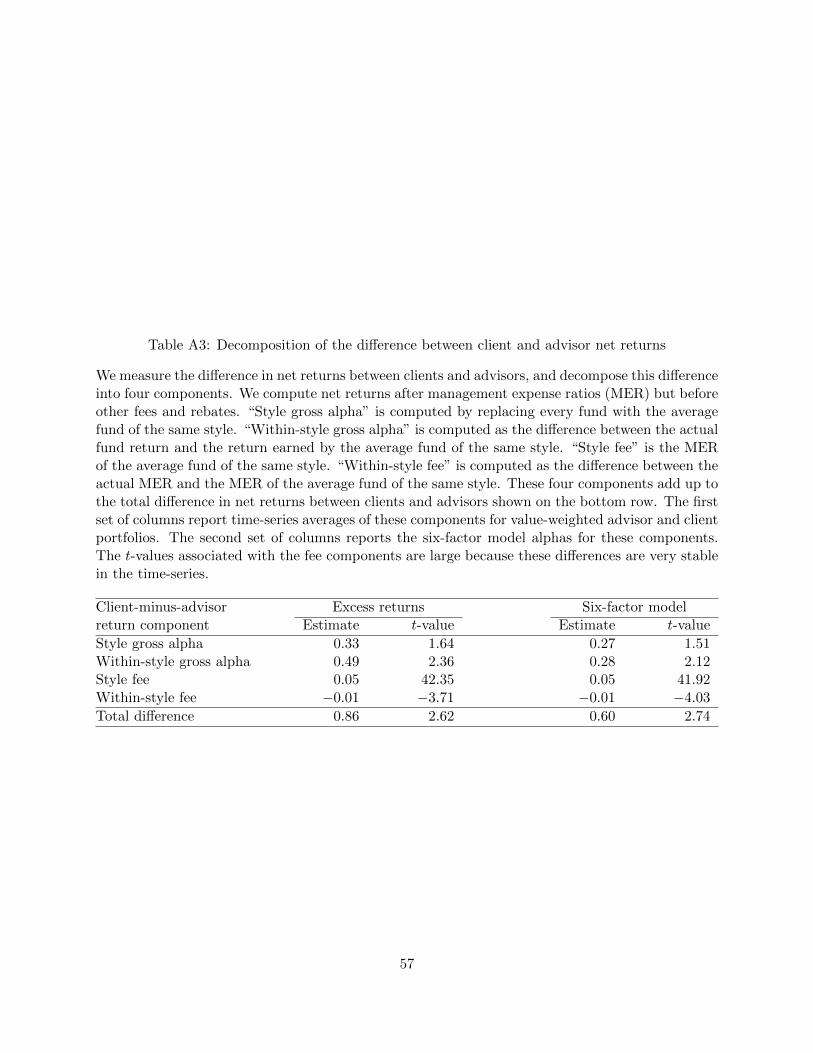
Table A3: Decomposition of the difference between client and advisor net returns
We measure the difference in net returns between clients and advisors, and decompose this differenceinto four components. We compute net returns after management expense ratios (MER) but beforeother fees and rebates. “Style gross alpha” is computed by replacing every fund with the averagefund of the same style. “Within-style gross alpha” is computed as the difference between the actualfund return and the return earned by the average fund of the same style. “Style fee” is the MERof the average fund of the same style. “Within-style fee” is computed as the difference between theactual MER and the MER of the average fund of the same style. These four components add up tothe total difference in net returns between clients and advisors shown on the bottom row. The firstset of columns report time-series averages of these components for value-weighted advisor and clientportfolios. The second set of columns reports the six-factor model alphas for these components.The t-values associated with the fee components are large because these differences are very stablein the time-series.
Client-minus-advisor Excess returns Six-factor modelreturn component Estimate t-value Estimate t-value
Style gross alpha 0.33 1.64 0.27 1.51Within-style gross alpha 0.49 2.36 0.28 2.12Style fee 0.05 42.35 0.05 41.92Within-style fee −0.01 −3.71 −0.01 −4.03
Total difference 0.86 2.62 0.60 2.74
57
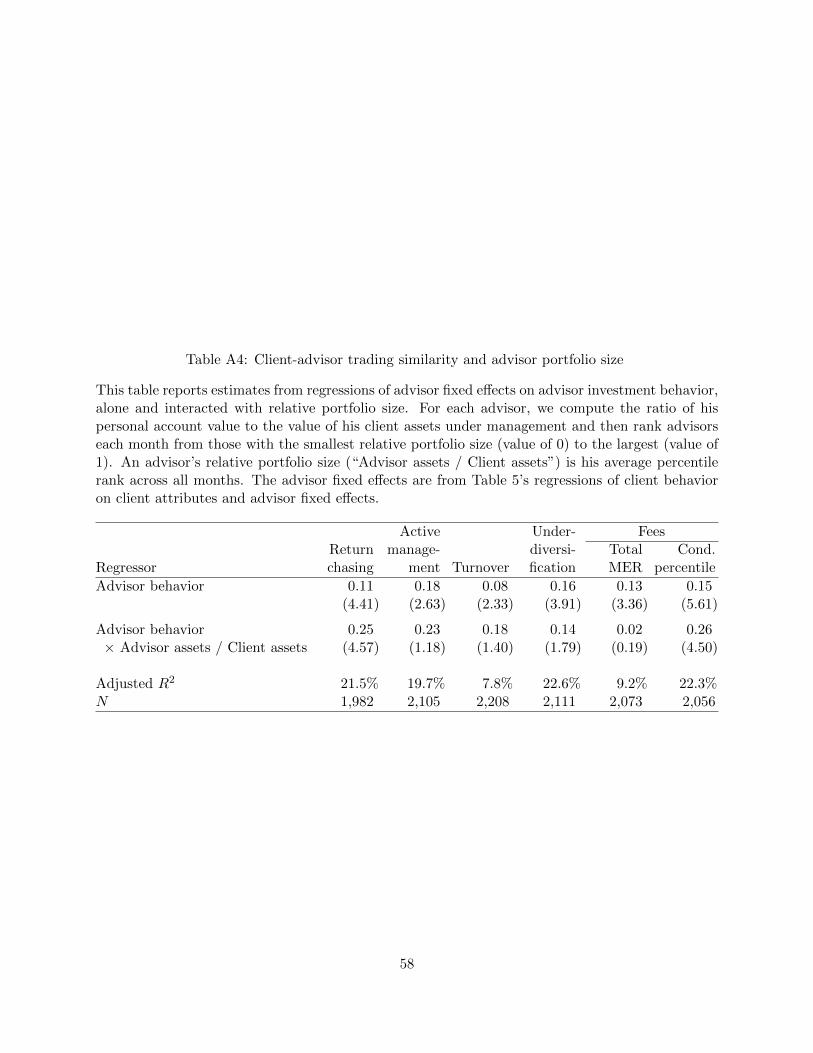
Table A4: Client-advisor trading similarity and advisor portfolio size
This table reports estimates from regressions of advisor fixed effects on advisor investment behavior,alone and interacted with relative portfolio size. For each advisor, we compute the ratio of hispersonal account value to the value of his client assets under management and then rank advisorseach month from those with the smallest relative portfolio size (value of 0) to the largest (value of1). An advisor’s relative portfolio size (“Advisor assets / Client assets”) is his average percentilerank across all months. The advisor fixed effects are from Table 5’s regressions of client behavioron client attributes and advisor fixed effects.
Active Under- FeesReturn manage- diversi- Total Cond.
Regressor chasing ment Turnover fication MER percentile
Advisor behavior 0.11 0.18 0.08 0.16 0.13 0.15(4.41) (2.63) (2.33) (3.91) (3.36) (5.61)
Advisor behavior 0.25 0.23 0.18 0.14 0.02 0.26× Advisor assets / Client assets (4.57) (1.18) (1.40) (1.79) (0.19) (4.50)
Adjusted R2 21.5% 19.7% 7.8% 22.6% 9.2% 22.3%N 1,982 2,105 2,208 2,111 2,073 2,056
58