Embed Size (px)
Citation preview

THE MINERAL INDUSTRY OF JAPAN—2002 13.1
1References that include a section mark (§) are found in the Internet References Cited section.
THE MINERAL INDUSTRY OF
JAPANBy John C. Wu
Japan is a high-income developed country in eastern Asia. In 2002, its per capita gross domestic product (GDP) was $31,471, and its economy was the world’s second largest with a GDP of $4.0 trillion (World Bank, 2003§1). It also was one of the most industrialized and technologically advanced countries in the world despite its limited resources of raw materials. Japan relied heavily on imports of mineral fuels and a wide variety of nonfuel minerals to meet the raw material requirements for its large manufacturing and utility (electricity and gas) sectors. Japan, however, has substantial resources of such industrial minerals as dolomite, iodine, limestone, pyrophyllite, and silica (table 3).
Japan’s production capacities of the chemical, construction material, electricity, and ferrous and nonferrous metals industries in the manufacturing and utility sectors were among the world’s largest. These industries processed imported raw materials and produced a broad category of mineral products, which included inorganic chemicals and compounds, construction materials, ferrous metals, industrial minerals, nonferrous metals, petrochemicals, and refined petroleum products, for domestic consumption by the downstream industries in the manufacturing and construction sectors and for export to the world markets. The electricity and gas industries used imported coal, natural gas, petroleum, and uranium and other nuclear fuel materials to produce electricity and processed natural gas to meet the energy requirements for the construction, mining, manufacturing, and other sectors of the economy.
In 2002, Japan was one of the world’s top importers and consumers of primary aluminum, cadmium metal, chromite, coal, cobalt metal, copper ore and metal, diamond, ferrochromium, ferronickel, fluorspar, gallium metal, gold metal, iron ore, ilmenite and rutile, indium metal, industrial salt, lead ore and metal, liquefied natural gas (LNG), lithium metal, manganese ore, magnesium, nickel ore and metal, crude petroleum, platinum-group-metals (PGM), potash, phosphate rock, rare earths, silicon metal, silver metal, tin metal, zinc ore and metal, and zircon. Japan was one of the world’s major exporters of cement, refined copper, inorganic chemicals, compound fertilizers, iodine, electrolytic manganese dioxide, high-purity rare (minor) metals, iron and steel, and titanium sponge metal and mill products.
The mining sector was the smallest sector of Japan’s industry-based economy. According to the Government statistics on national accounts, the percentage contribution of the mining sector to Japan’s GDP was only 0.18% in 2001 (the latest year for which data were available). The percentage contribution to Japan’s GDP by the mineral industry, which included the mining sector (0.18%) and the mineral-processing sectors of the ferrous
and nonferrous metals (3.31%), chemicals (3.00%), fabricated metal products (1.44%), petroleum and coal products (0.95%), and industrial mineral products (0.85%) in the manufacturing industry, however, was 9.73% in 2001 (Economic and Social Research Institute, 2003b§).
The mineral industry was important to the Japanese economy because of its sizable contribution to the GDP and the vital role it played in supplying primary materials not only to its own construction and manufacturing sectors, but also to those sectors of China, the Republic of Korea, and Taiwan in northeastern Asia and to such members of the Association of Southeast Asian Nations (ASEAN) as Brunei, Indonesia, Malaysia, the Philippines, Singapore, and Thailand in southeastern Asia.
The Japanese economy, as measured by real GDP (in 1995 constant prices), recovered to a positive growth of 1.6% in fiscal year 2002 following an economic recession with a 1.2% negative growth in fiscal year 2001. Japan’s real GDP (in 1995 constant prices), however, registered only a 0.1% positive growth in calendar year 2002 compared with a 0.4% positive growth in calendar year 2001; this was largely the result of an 0.8% decline in private demand despite a 0.3% increase in public demand in calendar year 2002. Japan’s GDP, in 1995 constant prices, was estimated to be $4.4 trillion in 2002 (Economic and Social Research Institute, 2003a§, Japan Institute for Social and Economic Affairs, 2003§).
In 2002, Japan’s industrial production, as measured by the indices of mining and manufacturing, decreased by 1.3%. The number of Japan’s unemployed workers increased to 3.49 million from 3.40 million in 2001, and its total labor force decreased to 66.89 million from 67.52 million in 2001. As a result, Japan’s unemployment rate rose to 5.4%, which was a record high, from 5.0% in 2001. Japan’s merchandise trade surplus rose to $78.8 billion from $54.0 billion in 2001, and the Japanese yen (¥) depreciated by 3.08% to ¥125.39 against US$1.00 in 2002. As measured by the Consumer Price Index, Japan’s rate of deflation was 0.9% compared with 0.7% in 2000 and 2001 (Japan Institute of Labor, 2003§).
Government Policies and Programs
The Metal Mining Agency of Japan (MMAJ) in cooperation with the Japan International Cooperation Agency (JICA) continued to undertake overseas mineral exploration projects as part of the Official Development Assistance Program (ODA) of the Japanese Government in 2002. In response to requests from the Governments of developing countries, the MMAJ provided technical assistance, which included the transfer of advanced exploration technology to these Governments, and carried out a broad range of basic exploration for further exploration and development of their mineral resources. The MMAJ also provided loans and exploration assistance to support private
13.2 U.S. GEOLOGICAL SURVEY MINERALS YEARBOOK—2002
Japanese companies and their foreign partners that were involved in joint-exploration works overseas.
The MMAJ’s ongoing ODA projects in 2002 included two 2-year reconnaissance survey projects, nine 3-year mineral exploration projects, a deep-sea mineral exploration project, and a 2-year environmental survey project. The purpose of the ongoing two 2-year reconnaissance surveys was to explore for copper, gold, lead, and zinc in massive sulfide, porphyry copper, and vein-type deposits in a 100,000-square-kilometer (km2) area in northwestern Argentina and copper, nickel, and PGM in magmatic deposits in a 1,400,000-km2 area in the Parana Basin of Brazil. The purpose of the ongoing nine 3-year mineral exploration projects was to explore for copper, gold, lead, nickel, and zinc in massive sulfide and porphyry copper in a 53,000-km2 area in the Altai area of China; copper, gold, lead, silver, and zinc in porphyry copper, skarn, and vein-type deposits in a 26,000-km2 area in the southwestern and central areas of Honduras; copper and gold in porphyry copper and vein-type deposits in a 12,000-km2 area in the East Java area of Indonesia; titanium in placer deposits in a 2,700-km2 area in the Kokpetinskaya area of Kazakhstan; gold in greenstone-type deposits in a 5,800-km2 area in the Baoule-Banifing area of Mali; gold, lead, silver, and zinc in massive sulfide deposits in a 1,100-km2 area in the Zacualpan area of Mexico; copper, gold, and molybdenum in porphyry copper and vein-type deposits in a 5,500-km2 area in the Western Erdenet area of Mongolia; copper and zinc in massive sulfide deposits in a 2,100-km2 area in the Marrakech-Tekna area of Morocco; and gold in greenstone-type deposits in a 12,000-km2 area in the Arroyo Grande and San Jose areas of Uruguay. The purpose of the ongoing deep-sea mineral exploration project was to explore for cobalt, manganese, nickel, and platinum in cobalt-rich manganese crusts offshore Marshall Island. The purpose of the one ongoing 2-year environmental survey project was to conduct a geochemical baseline study involving analyses of river water quality, stream sediments, and other analyses in a 4,000-km2 area in the Viti Levu South region of Fiji. In 2002, the MMAJ signed two new mineral exploration agreements with Bolivia and Turkey to explore for copper, lead and zinc in the Yani-Pelecucho area of the La Paz region in Bolivia and in the Hopa area in northeastern Turkey and a new regional development survey project with Vietnam in 2002 (Metal Mining Agency of Japan, 2002a).
The MMAJ continued to provide financial and technical support, which included geologic and geophysical surveys and drilling, to five private Japanese companies in 2002. These overseas exploration projects were for copper and gold by Mitsubishi Materials Corp. in the Los Dos Buhos Cateo area of Argentina; lead and zinc by Mitsui Metal Mining Co. Ltd. in the Ciquian East area of Peru; nickel by Sumitomo Metal Mining Co. Ltd. in the Zambales area of the Philippines; copper, gold, and PGM by Sumitomo Metal Mining in the Tropico area of Mexico; and copper by Nittetsu Mining Co. Ltd. in the Namosi area of Fiji (Metal Mining Agency of Japan, 2002b).
By January 31, 2002, Japan’s last major coal mine operated by Taiheiyo Coal Mining Co. Ltd in Kushiro, Hokkaido Prefecture, was closed after Japan’s 8th National Coal Policy (1992-2001) ended. Because of Japan’s increased reliance on imported coal, the Ministry of Economy, Trade and Industry
began implementing the Overseas Transfer Project on Coal Mining Technology in 2002 under the 5-year (2002-06) Technical Transfer Plan for Coal Mining Technology. As part of Japan’s long-term energy policy to secure a stable supply of overseas coal, transfer of coal mining technology under the 5-year plan focused mainly on training for large coal-producing countries in Asia by using Japan’s coal mine (Agency for Natural Resources and Energy, 2003§). Taiheiyo coal mine became a center for implementing transfer of coal mining technology and changed its name to Kushiro Coal Mining Co. Ltd. (Masakazu Ikenaga, Manager, Planning Department, Japan Coal Energy Center, written commun., October 28, 2002).
Environmental Issues
To recover and recycle materials from disposed cars, chlorofluorcarbons (CFCs) used in air conditioners, and safety air bags, the Diet (the Japanese Parliament) enacted the Law for Effective Re-utilization of Used Auto Parts (Automobile Recycling Law), which became effective July 5, 2002; it would be fully enforced by the end of 2004. Under the law, automakers and importers would be required to recover and recycle materials, which will include CFCs from automobiles. The car owners must pay the automakers a designated recycling fee of about 20,000 yen, or about $160, per vehicle to an appointed body at the time of a new car purchase. The car owner also would be required to purchase a 3,000-yen (about $25) coupon to recover and destroy CFCs and CFC substitutes used in automobile air conditioners (Japan for Sustainability, 2002a§).
To regulate soil contamination caused by hazardous substances and to prevent human health from being damaged by the contamination, the Diet also enacted the Contaminated Soil Countermeasure Law on May 29, 2002; it would be fully enforced by February 15, 2003. It was Japan’s first law to regulate soil contamination in urban areas. Companies that handle chemicals would be required to comply with the new law. Under the law, if a site is so polluted that it can damage the public health, then the Prefecture governor can order its landowner to investigate the land for soil contamination. If the soil is found to be contaminated, then the governor can designate it to be a polluted site and order the polluter or its landowner, if the polluter is not identified or nonexistent, to clean up the site (Japan for Sustainability, 2002b§).
Following the Government enactments of the latest environmental laws on recycling, Dowa Mining Co. Ltd., which had been expanding its recycling business for the past 2 to 3 years, would continue to focus on its environmental businesses, most recently on soil purification, and would expand into metal recycling for smelting. The company was building up its business to recover and recycle the rare metals from catalytic converters in junked cars. In April, Dowa Mining started pilot operation of a car shredder dust treatment plant at Kosaka in Akita Prefecture at a cost of $21.5 million, about 33% of which was funded by the Government. Dowa Mining, which has extensive experience in recycling catalytic converters, also would invest from $3 million to $4 million in Nippon PGM Co. (its subsidiary) to increase its monthly processing capacity to 800 metric tons (t) from 450 t. The expanded capacity
THE MINERAL INDUSTRY OF JAPAN—2002 13.3
would allow Dowa Mining to increase recovery of platinum and palladium from the exhaust systems (Nikkei Weekly, 2002b; Japan Metal Bulletin, 2002a§). In April, Dowa Mining also started construction of a new recycling treatment plant in Okayama in Western Japan (Japan Metal Review, 2002a).
Production
Mine production of most nonferrous metals (except gold, lead, and silver) and most industrial minerals (except dolomite) declined in 2002 because of depleting ore reserves, lower domestic prices, and weaker domestic demand for mineral products. Mine production of zinc declined in 2002 because the ore production from the Toyoha Mine in Hokkaido Prefecture had a lower content of zinc and a higher content of lead and silver. Japan’s coal output declined to less than 1.5 million metric tons (Mt) in 2002 because of the permanent closures of the Ikeshima Mine in Nagasaki Prefecture in December 2001 and the Kusbiro Mine in Hokkaido Prefecture in January 2002. According to Japan Coal Energy Center, about 11 small-scale open pit coal mines and 1 underground coal mine still operated in the Prefectures of Hokkaido and Yamaguchi in 2002 (Masakazu Ikenaga, Manager Planning Department, Japan Coal Energy Center, written commun., October 28, 2002). The output of crude petroleum and natural gas remained very small.
In the mineral processing industry, production of nonferrous metals was mixed. Metal production of refined copper, gold, lead, silver, and zinc decreased because of weak domestic demand. Production of chromium metal increased in 2002 because of increased production from the new plant in Toyama Prefecture that was operated by NKK Materials Co. Ltd. Production of iron and steel increased to the highest level in 13 years owing to a significant increase in exports to Asian countries. Production of electrolytic manganese oxide and titanium sponge metal decreased because of weak domestic demand or reduced exports of titanium sponge, and production of cement and other construction-related materials was lower because of the continued weakness in the construction sector in 2002. Production of refined petroleum products was mostly lower in 2002 because of weak domestic demand for petroleum products (table 1).
Trade
Japan was a net importer of minerals because of its large import bill for mineral fuels. Japan’s mineral trade deficit, however, decreased to $63.8 billion in 2002 from $71.7 billion in 2001 as a result of lower import bills for mineral fuels and other nonfuel minerals and higher export earnings from iron and steel in 2002 (table 4).
Total imports of minerals decreased by 5.7% to $97 billion and accounted for 28.7% of the total imports, which were valued at $337.6 billion in 2002 (Ministry of Finance, 2002b, p. 9-13, 15-16, 33-41). Of the total minerals imports, $65.7 billion was for such mineral fuels as coal, LNG, crude and partially refined petroleum, refined petroleum products, and other mineral fuels; $6.5 billion, for ores and concentrates of ferrous and nonferrous minerals, slag, scrap, and ash of iron and steel, other metals, and metal compounds; and $1.2 billion, for such industrial minerals
as salt, sulfur, earths and stone, lime, plastering materials, and cement. Imports of processed minerals, mineral-related chemicals, and metals totaled $24.7 billion, of which $3.5 billion was for mineral-related chemicals and fertilizers; $11.6 billion, for products of iron and steel and nonferrous, rare, and other base metals; $5.7 billion, for precious and semiprecious stones and precious metals; and $2.9 billion, for articles and products of asbestos, cement, ceramics, glass, mica, and stone.
Total exports of minerals, mineral-related chemicals, and processed minerals products increased by 6.6% to $33.2 billion and accounted for 8.0% of Japan’s total exports, which were valued at $416.5 billion in 2002 (Ministry of Finance, 2001a, p. 9-13, 15-16, 34-41). Exports of iron and steel products and nonferrous, rare, and other base metals totaled $23.7 billion. Exports of processed mineral articles and products of asbestos, cement, ceramics, glass, mica, and stone amounted to $4.1 billion. Exports of salt, sulfur, earths and stone, lime, plastering materials, cement, mineral fuels, and nonferrous minerals were $1.7 billion. Exports of mineral-related chemicals and fertilizer were $2.0 billion. Exports of precious and semiprecious stones and precious metals were $1.6 billion (table 4). Physical measures of the exports and imports of mineral commodities in 2000 and 2001 are listed in tables 10 and 11.
Structure of the Mineral Industry
Japan’s mineral industry consisted of a small mining sector of coal and nonferrous metals, a large mining sector of industrial minerals, and a large mineral-processing sector of ferrous and nonferrous metals and industrial minerals (table 2). Mining and mineral-processing businesses were owned and operated by private companies incorporated in Japan.
In the mining sector, the number of major nonferrous metal mines remained at two in 2002. The major industrial mineral mines totaled 42 in 2002, the same number as that of 2001. The coal mining sector consisted of 11 small-scale open pit mines mostly in Hokkaido Prefecture and one underground mine at Kushiro in Hokkaido Prefecture, which was owned and operated by Taiheiyo Coal Mining Co. Ltd. prior to February 2002 and by newly established Kushiro Coal Mining Co. Ltd. beginning in February 2002. Japan’s mining capacity of nonferrous metals (mainly lead, gold, silver and zinc) and coal shrunk substantially between 2001 and 2002. The number of persons employed by the mining sector totaled about 50,000 in 2002 (Statistical Handbook of Japan, 2003§).
In the mineral-processing sector, the iron and steel industry continued to cut the number of employees to 165,932 from 178,716 in 2001. The industry’s production capacity of pig iron decreased to 93.2 million metric tons per year (Mt/yr) from 94.13 Mt/yr in 2001, and the production capacity of crude steel decreased to 144.8 Mt/yr from 145.3 Mt/yr in 2000. In the nonferrous metal industry, which included smelting and refining of copper, gold, lead, silver, zinc, and other minor metals, the number of its regular employees was reduced by 393 to 5,664 in 2002. Japan’s production capacity of refined copper remained at 1.496 Mt/yr; that of refined gold and lead remained steady at 166 metric tons per year (t/yr) and 274,800 t/yr, respectively; that of refined silver remained at 2,916 t/yr; and that of zinc remained at 750,000 t/yr. Japan’s electrolytic maganese dioxide
13.4 U.S. GEOLOGICAL SURVEY MINERALS YEARBOOK—2002
production capacity was reduced by 18,000 t/yr to 59,000 t/yr owing to the closure of the 18,000-t/yr Takaoka plant in Toyama Prefecture by Japan Metal & Chemical Co. Ltd. Japan’s cement industry cut the number of its regular employees by 177 to 3,836, and reduced its cement clinker capacity by 3.75 Mt/yr to 82.93 Mt/yr (Ministry of Economy, Trade and Industry, 2002a, p. 127, 130; 2002c, p. 94-95, 155, 157; Arumu Publishing Co. Ltd., 2003, p. 34).
Commodity Review
Metals
Aluminum.—Japan’s production of primary aluminum (unwrought aluminum) by NLM at the Kambara refinery in Shizuoka Prefecture amounted to about 0.32% of Japan’s requirements for primary aluminum in 2002. Virtually all Japan’s requirements for primary aluminum was met by imports. In 2002, imports of primary aluminum totaled 2.58 Mt, of which 1.73 Mt was primary aluminum ingots and 848,330 t was primary aluminum alloys. The import bill for primary aluminum, which included ingots and alloys, was $3.59 billion (Ministry of Finance, 2002b, p. 662-663).
According to the estimate by Marubeni Corp., which was the largest aluminum trader among the Japanese trading companies, about 45.6 % of imported primary aluminum was to be supplied from Japan’s 11 overseas aluminum smelter projects in fiscal year 2002. Japanese aluminum and major trading companies held substantial equity shares in those smelters in Australia, Brazil, Canada, Indonesia, Mozambique, New Zealand, the United States, and Venezuela (table 5). About 52.7% of the imported aluminum was to be supplied under long-term contracts from the world’s major producers of primary aluminum; and about 2% was to be supplied from the spot market (Marubeni Corp., 2001).
The major primary aluminum and aluminum alloy suppliers in 2002 included Russia (26.4%), Australia (22.4%), New Zealand (7.7%), Brazil (7.4%), South Africa (6.7%), China (5.8%), Indonesia (4.8%), Canada (3.8%), the United Arab Emirates (3.1%), and Ukraine (2.8%). The United States supplied only 5,418 t and accounted for 0.2% of imported primary aluminum and aluminum alloys in 2002 (Ministry of Finance, 2002b, p. 662-663).
Prior to 2002, Venezuela supplied between 110,000 and 123,000 t/yr of primary aluminum, which included 90,000 t/yr of primary aluminum under equity-share investment in Venezuela’s aluminum smelter and 30,000 t/yr of primary aluminum under long-term contract. The contract renewal negotiations between the six Japanese shareholders, which were led by Showa Denko K.K. (20%), and Venezuela state-owned Corp. Venezolana de Guayana (80%) concluded a new 4-year contract in mid-November 2002 after 10 months of talks. Under the new contract, Industria Venezolana de Alumino C.A. of Venezuela (VENALUM) was to supply 360,000 t of primary aluminum to Japan at a rate of 90,000 t/yr of primary aluminum in the next 4 years ending March 2006. The new contract, however, would replace the preferential price terms that the Japanese shareholders enjoyed in the past with an undisclosed new price terms (Metal Bulletin, 2002b, i).
Kobe Steel Ltd., which owned 13.33% of Aluminerie Alouette Inc. (ALOUETTE) of Canada, sold its 13.33% interest in ALOUETTE to the Provincial Government of Quebec through Société Genérale de Financement for $100 million and sold its 9.5% interest in reduction lines 1 and 2 at the Boyne Island Smelter in Australia to Comalco Ltd. of Australia for $78.5 million in mid-2002. Kobe Steel was trying to sell, but could not find buyers for its 1.8% interest in Nippon Amazon Aluminum, which owned 49% interest in Alumino Brasilero S.A. of Brazil, and its 4% interest in VENALUM (Metal Bulletin, 2002c; Mining Journal, 2002d).
In September 2002, Marubeni, which owned a 6.67% interest in ALOUETTE, announced that it would participate in the capacity expansion of ALOUETTE by increasing its investment by 7.5 billion yen, or $59.8 million, in the project that would start in 2003 to boost ALOUETTE’s smelting capacity to 550,000 t/yr from 243,000 t/yr by fall 2005. Marubeni had about 160,000 t/yr of equity primary aluminum through its investments in aluminum smelters in Australia, Brazil, Canada, Indonesia, and Venezuela. After capacity expansion of ALOUETTE is completed, Marubeni would increase its right of off-take of equity primary aluminum to more than 180,000 t/yr (Marubeni Corp., 2002§).
Because of a weak economic recovery, domestic demand for primary aluminum decreased slightly by 0.2% to about 2 Mt, about 85% of which was for rolling and die-casting in 2002. Exports of primary aluminum, which included aluminum alloys (10,280 t) and aluminum ingots (2,167 t), totaled 12,447 t and were valued at $26.1 million in 2002. The major buyers of aluminum ingots in 2002 were China (37.4%), Thailand (27.7%), the Republic of Korea (13.0%), Malaysia (7.7%), and the Philippines (5.6%). The major buyers of aluminum alloys in 2002 were Indonesia (30.1%), the Republic of Korea (28.3%), the Philippines (14.2%), Thailand (7.9%), China (6.9%), and the United States (5.2%) (Ministry of Finance, 2002a, p. 576).
Bauxite and Alumina.—Japan relied 100% on imports of bauxite for the manufacture of alumina and aluminum hydroxide. In 2002, Japan imported 1.87 Mt of bauxite, which was valued at $45 million. The two principal suppliers of bauxite were Australia (54.9%) and Indonesia (39.1%). Production of alumina and aluminum hydroxide was by Nippon Light Metal Co. Ltd. (NLM) at its Shimizu plant in Shizuoka Prefecture, Showa Denko K.K. at its Yokohama plant in Kanagawa Prefecture, and Sumitomo Chemical Co. Ltd. at its Ehime plant in Ehime Prefecture.
In 2002, alumina production totaled 332,541 t, and domestic shipments totaled 204,028 t, of which 110,318 t was for the manufacture of refractories; 41,309 t, for ceramics; 4,771 t, for abrasives; 1,307 t, for welding rods; and 46,323 t, for other uses. In 2002, Japan exported 90,744 t of alumina principally to China, the Republic of Korea, and Taiwan. In 2002, aluminum hydroxide production totaled 723,860 t, and domestic shipment totaled 261,155 t, of which 165,996 t was for the manufacture of flocculate materials; 37,273 t, for rubber and plastics; 14,223 t, for synthetic zeolite; 1,650 t, for fluoride; and 42,013 t, for other uses. In 2002, Japan exported 85,120 t of aluminum hydroxide principally to Indonesia, the Republic of Korea, Taiwan, and Thailand (Japan Aluminum Association, 2003, p. 11, 20).
THE MINERAL INDUSTRY OF JAPAN—2002 13.5
Cadmium.—In 2002, Japan was one of the top two producers and consumers of cadmium in the world. Cadmium was produced mainly as a byproduct of zinc refining operations that used mostly imported ore. According to the Japan Mining Industry Association, cadmium was produced by Toho Zinc Co. Ltd. and accounted for 31.4% of the total production; Dowa Mining Co. Ltd., 27.1%; Sumitomo Metal Mining Co. Ltd. and Nippon Mining and Metals Co. Ltd. (NMM), 13.5% each; Mitsui Mining and Smelting Co. Ltd., 12.5%; and Mitsubishi Materials Corp., 2.0% (Arumu Publishing Co. Ltd., 2003, p. 113).
Because of lower domestic production of cadmium and increased consumption of electrodes for nickel-cadmium (Ni-Cd) batteries, imports of cadmium ingot and powder rose by 28% to 2,819 t and were valued at $2.2 million in 2002. The major suppliers were the Republic of Korea (42.0%), Canada (17.8%), Peru (7.8%), Germany (7.1%), Russia (6.1%), and the United Kingdom (5.9%) (Ministry of Finance, 2002b, p. 670).
In 2002, Japan’s demand for domestically produced cadmium was 2,586 t, of which 2,437 t was consumed by the producers of Ni-Cd battery electrodes. In 2002, the consumption of cadmium for the production of Ni-Cd batteries accounted for 94.2% of shipment of domestically produced cadmium. Other domestic demand for domestically produced cadmium for alloys was 31 t; plating, 1 t; pigments, 3 t; and other end users, 114 t in 2002. Japan also imported 2,813 t of cadmium, of which 2,783 t was mainly for the production of Ni-Cd batteries (Arumu Publishing Co. Ltd., 2003, p. 112).
Chromium.—Japan relied on imports to meet all chromium requirements for its iron and steel industry. Because of increased imports of ferrochromium, Japan’s imports of chromium ore and concentrate decreased by 13.7% to 354,928 t and were valued at $20.8 million in 2002. The major suppliers were South Africa (53%), India (41%), and Iran (3%) (Ministry of Finance, 2002b, p. 169-170).
Consumption of chromium ore and concentrate by the iron and steel industry decreased by 9.7% to 296,851 t, of which 169,003 t was consumed by the ferroalloy industry and 127,848 t, by others. The iron and steel industry’s yearend inventory of chromium ore decreased by 5.9% to 145,064 t, which was equivalent to about 6 months of consumption in 2002 (Ministry of Economy, Trade and Industry, 2002c, p. 90).
Production of ferrochromium decreased by 17.3% to 91,937 t in 2002 owing to high production costs and low import prices. Imports of ferrochromium, which included high- and low-carbon ferrochromium, increased by 5.9% to 783,371 t. The major overseas suppliers were South Africa (56.4%), Kazakhstan (17.8%), Zimbabwe (16.0%), China (3.8%), Russia (2.4%), and India (2.3%). Imports of ferrochromium were valued at $301.4 million (Ministry of Finance, 2002b, p. 624).
To secure a greater overseas supply of ferrochromium, Mitsubishi Corp. reached an agreement in August to acquire a 36.6% interest in Hernic Ferrochrome of South Africa from Hernic (Pty) Ltd. and a 7.5% interest from Hernic’s management. In March 2000, Mitsubishi Corp. had acquired from Nippon Steel Trading Co. Ltd. an 11% interest in Hernic Ferrochrome, which decreased to 9.375% later. After completion of the Hernic acquisition, Mitsubishi would own
53.475% interest in Hernic Ferrochrome, which operated a 260,000-t/yr plant at Brits, South Africa. In addition to 70,000 t/yr of shipments to Japan based on a prior contract agreement, Mitsubishi would take an additional 40% of the plant’s output to supply its Japanese customers, which included Nippon Steel Corp., Sumitomo Metal Industries Ltd., Daido Steel Co. Ltd., Nippon Yakin Kogyo Co. Ltd., and Nippon Metal Industry Co. Ltd. (Metal Bulletin, 2002d).
Consumption of ferrochromium, which included high-carbon ferrochromium (802,872 t) and low-carbon ferrochromium (38,781 t), increased by 0.4% to 841,653 t, of which 836,992 t was consumed by steel producers and 4,661 t, by ferroalloy producers (Ministry of Economy, Trade and Industry, 2002c, p. 210). Exports of ferrochromium totaled 1,362 t, of which 1,255 t was low-carbon ferrochromium and 107 t, high-carbon ferrochromium. The major buyers of ferrochromium were the United States (77.2%) and Thailand (15.6%). Exports of ferrochromium totaled $2.7 million (Ministry of Finance, 2002a, p. 497).
Production of chromium metal was by NKK Materials Co. Ltd., which operated a 1,000-t/yr plant that used the silicothermic method at Shinminato in Toyama Prefecture, and by Nippon Denko Co. Ltd., which operated an 800-t/yr plant that used the aluminothermic reduction method at Oshima, which is located a few kilometers south of Shinminato in Toyama Prefecture. Chromium metal produced by Nippon Denko decreased to 700 t in 2002 from 750 t in 2001, and NKK Materials increased to 900 t in 2002 from 600 t in 2001. In the domestic market, chromium metal was consumed mainly for the manufacture of super alloys, heat resisting steel, and electronic materials (Arumu Publishing Co. Ltd., 2003, p. 100).
Cobalt.—Japan relied 100% on imported cobalt matte and other intermediate products of cobalt for metal production. Sumitomo Metal Mining, which was Japan’s sole producer of cobalt metal and cobalt salts (cobalt sulfate and cobalt oxide), operated a cobalt refinery in Niihama, Ehime Prefecture, with a rated capacity of 600 t/yr (Arumu Publishing Co. Ltd., 2003, p. 74). Japan also imported cobalt metal, cobalt oxide, and cobalt hydroxide to meet its cobalt requirements.
In 2002, imports of cobalt matte, other intermediate products of cobalt, cobalt ingots, and other articles of cobalt totaled 9,827 t and were valued at $154.5 million. The major suppliers were Canada, 20.7%; Finland, 20.1%; Australia, 18.1%; Zambia, 14.8%; Norway, 9.0%; Belgium, 4.2%; Congo (Brazzaville) and Congo (Kinshasa), 5.5% combined; and Morocco, 3.3%. Japan also imported 2,173 t of cobalt oxide and 332 t of cobalt hydroxide. Belgium and Finland were the two principal suppliers of cobalt oxides and accounted for 76% and 21%, respectively. Belgium, Finland, and the United States were the three major suppliers of cobalt hydroxide and accounted for 35%, 32%, and 28%, respectively. Imports of cobalt oxide and hydroxide amounted to $41.2 million (Ministry of Finance, 2002b, p. 182, 670).
Domestic demand for cobalt metal decreased by 16.8% to 2,058 t, of which 764 t was for specialty steel; 460 t, for pipe, plate, rod, and wire; 276 t, for ultra-hard tool steel (cemented carbides); 193 t, for manufacturing of magnetic materials; 134 t, for catalysts; and 231 t, for other end uses (Ministry of
13.6 U.S. GEOLOGICAL SURVEY MINERALS YEARBOOK—2002
Economy, Trade and Industry, 2002c, p. 280). In addition to the Government statistics on reported domestic demand for cobalt, demand for cobalt by the manufacturers of batteries was estimated to be 7,000 t. According to an estimate by Mitsui & Co., the overall demand for cobalt in Japan was about 9,000 t compared with 8,200 t in 2001 (Arumu Publishing Co. Ltd., 2003, p. 74).
Copper, Lead, and Zinc.—In 2002, Toyoha Mining Co. Ltd., which operated the Toyoha Mine in Hokkaido Prefecture, was Japan’s only lead and zinc mining company. Mine production of lead increased by 14.5%, and that of zinc decreased by 3.7%. The mine also produced a considerable amount of byproduct silver and a very small amount of byproduct copper. For raw material requirements that included domestic ore, imported ore, scrap, and other raw materials for its nonferrous metal smelting and refining industries, Japan relied on imported copper ores and concentrates (86%), on imported zinc ore and concentrate (79%) and on imported lead ore and concentrate (48%) for the production of refined copper, refined zinc, and refined lead, respectively.
In 2002, Japan was the world’s largest importer of copper concentrate and one of the world’s major importers of lead and zinc concentrates. Imports of copper concentrate decreased by 3.6% to 4.2 Mt and were valued at $2.07 billion. The major suppliers of copper concentrate were Chile (35.9%), Indonesia (23.9%), Papua New Guinea (8.8%), Australia (8.6%), Canada (7.1%), Peru (6.5%), and Argentina (4.7%). Imports of zinc and lead concentrates decreased by 13.1% to 1 Mt and 16.6% to 155,109 t, respectively. The import bills for zinc and lead were $198 million and $57 million, respectively. The major suppliers of lead concentrate were the United States (42.5%), Australia (34.4%), and Peru (8.7%). The major suppliers of zinc concentrate were Australia (35.6%), Peru (19.1%), the United States (14.2%), Canada (8.5%), Chile (6.1%), Mexico (5.9%), and Bolivia (4.6%) (Ministry of Finance, 2002b, p. 169).
To secure additional captive copper concentrate from overseas nonferrous metals mines in which Japanese nonferrous metal mining companies held substantial equity and provided long-term loans, Sumitomo Metal Mining decided to increase its investment in an exploration and development project of copper, gold, and PGM in Mexico (table 9).
Sumitomo Metal Mining in joint venture with Santoy Resources Ltd. of Canada completed the first phase of their 60%-owned Tropico Project in Sinaloa State, Mexico. The remaining 40% interest of the project was owned by Almanden Minerals Ltd. of Canada. Under the terms of a newly amended joint-venture agreement in 2002, Sumitomo Metal Mining was required to fund $3.5 million to earn a 51% interest in the Tropico Project by March 31, 2006, and Sumitomo Metal Mining agreed to expend a minimum of $400,000 per year from April 1, 2002, through March 31, 2006, and to complete a prefeasibility study (Santoy Resources Ltd., 2002; Almaden Mineral Ltd., 2002§).
In 2002, metal production of copper, lead, and zinc declined mainly because of decreases in exports of refined copper and sluggish domestic demand for lead and zinc. Exports of lead and zinc, however, increased because of the effects of Japanese overseas’ plants (transplants) in China and Southeast Asian
countries. Japan’s capacity utilization rate of the nonferrous metals smelting and refining industry was 95.9% for copper, 85.3% for zinc, and 77.6% for lead (Ministry of Economy, Trade and Industry, 2002c, p. 97-99, 155).
In February, Sumitomo Metal Mining announced that it was to spend about $88 million in the next 3 years for the expansion of its Toyo copper smelter and refining complex in Besshi, Ehime Prefecture, to meet the growing exports of refined copper to China and other Asian countries. The expansion project involved adjustments and modifications to the flash furnace, flotation plant, converter, tank house (refinery), and other facilities to raise refining capacity to 300,000 t/yr from 270,000 t/yr by March 2004 (Metal Bulletin, 2002h; Japan Metal Bulletin, 2002c§).
In June, Mitsubishi Materials, which was the parent company of Hosokura Smelting and Refining Co. Ltd., suspended operations of its 21,600-t/yr secondary lead smelter at Hosokura in Miyagi Prefecture because of the environmental problems caused by high lead contamination in its drainage (Japan Metal Review, 2002b).
Following the establishment in 2001 of the joint-venture United Copper Resources Co. Ltd. (UCR) for purchasing copper ore and concentrate and the joint-venture Pan Pacific Copper Co. Ltd. (PPC) for selling refined copper, NMM and Mitsui Mining and Smelting Co. Ltd. (MMS) announced in May 2002 that they would fully integrate their copper businesses by strengthening their collaboration in copper smelting operations to promote timely responses to the changing business environment and to strengthen international competitiveness. In their announcement in May, NMM and MMS were to reorganize PPC to take over UCR’s raw materials procurement gradually. In addition, PPC’s responsibilities would include copper production, sales, and handling investments and financing for mines, and planning and developing new technologies to enhance sales activities. UCR was to be dissolved after the transfer of its raw materials procurement business to PPC is completed. Beginning in April 2003, the newly organized PPC would be owned by NMM (66%) and by MMS (34%), and the full integration of copper businesses would start (Metal Bulletin, 2002e; Japan Metal Bulletin, 2002b§).
In July, NMM entered into a joint-venture agreement with Chile’s state-owned copper producer, Corporación de Nacional del Cobre de Chile (CODELCO), to construct a pilot plant in Hitachi, Ibaraki Prefecture, and to establish the joint-venture firm Biosigma with $3 million in paid-up capital to develop and patent biotechnologies to recover copper from lower grade sulfate copper ore by using bioleaching (bacterial leaching). NMM was to provide $1 million to own 34% of Biosigma, and CODELCO was to provide $2 million to own 67%. This was the first time that a Japanese copper producer entered into a joint venture with CODELCO on bioleaching (Japan Metal Review, 2002c; Mining Journal, 2002a).
Imports of refined copper decreased by 26.7% to 114,371 t and were valued at $182.2 million. The major suppliers of refined copper were Chile (46.5%), Zambia (20.0%), Australia (8.0%), Peru (6.7%), Indonesia (5.2%), the Philippines (3.3%), China (3.2%), India (2.5%), and Burma (2.2%). Imports of refined lead decreased sharply by 71.2% to 10,687 t and were valued at about $9.2 million. The principal suppliers of refined
THE MINERAL INDUSTRY OF JAPAN—2002 13.7
lead were China (91.8%) and Peru (7.5%). Imports of zinc slab (refined zinc, not alloyed) also decreased sharply by 66.3% to 21,432 t and were valued at about $18.0 million. The major suppliers of zinc slab were Peru (50.1%), China (38.9%), and Canada (10.3%) (Ministry of Finance, 2002b, p. 656, 677).
Domestic demand for refined copper increased by 5.7% to more than 1.16 Mt (revised from more than 1.03 Mt). Domestic demand for refined copper, by sector, was 742,141 t (revised from 613,083 t) for wire and cable, 388,277 t for brass mill products, and 32,528 t for others (Ministry of Economy, Trade and Industry, 2002c, p. 266). Exports of refined copper decreased by 9.2% to 377,855 t and were valued at $603.6 million in 2002. The major buyers of refined copper were Taiwan (42.9%), China (33.1%), the Republic of Korea (7.3%), Indonesia (7.0%), Thailand and the United States (2.4% each), Malaysia (2.2%), and Vietnam (1.7%). Most of the 50,449 t of unrefined copper and copper anodes was exported mainly to the Republic of Korea (94.0%) and Taiwan (4.1%). Exports of unrefined copper and copper anodes were valued at $108.5 million (Ministry of Finance, 2002a, p. 568).
In 2002, domestic demand for refined lead decreased by 15% to 207,154 t, of which 168,715 t was for storage batteries; 20,134 t, for inorganic chemicals; 6,833 t, for solder; and 11,472 t, for other uses (Ministry of Economy, Trade and Industry, 2002c, p. 268). Exports of refined lead increased sharply by to 10,325 t from 747 t in 2001 and were valued at $4.8 million in 2002. The major buyers of refined lead in 2002 were Indonesia (31.1%), Singapore (29.1%), and Malaysia (15.6%) (Ministry of Finance, 2002a, p. 581).
Domestic demand for zinc slab decreased by 11.0% to 485,005 t, of which 231,191 t was for sheet galvanizing (47.7%); 97,364 t, for other plating (20.1%); 63,057 t, for brass mill products (13.0%); 39,426 t, for zinc die-cast products (8.1%); 30,900 t, for inorganic chemicals (6.4%); and 23,067 t, for other uses (4.7%) (Ministry of Economy, Trade and Industry, 2002c, p. 272). Exports of zinc slab increased by 30.5% to 94,973 t and were valued at $75.3 million. The major buyers were Taiwan (38.59%), Vietnam (15.4%), the Philippines (12.1%), Indonesia (11.0%), the United States (9.0%), Bangladesh (6.6%), and Malaysia and Thailand (1.5% each) (Ministry of Finance, 2002a, p. 582).
Gallium.—Japan was one of the world’s top importers and consumers of gallium metal. Japan’s primary production of high-purity gallium metal was by Dowa Mining, which produced about 8 t in 2002. Secondary producers of high-purity gallium metal, which included Dowa Mining, Nichia Chemical Industries, Rosa Industries Co. Ltd., Sumitomo Chemical Co. Ltd., and Sumitomo Metal Mining, recycled gallium metal from scrap materials and upgraded imported intermediate-grade gallium metal (4 nines, or 99.99%) to high-purity gallium metal (6 nines, or 99.9999%, to 7 nines, or 99.99999%).
Gallium metal production from recycling scrap materials, which included new scraps of gallium metal, wafer scraps of gallium arsenic (GaAs) and gallium phosphate (GaP), and residue from the liquid-phase epitaxial process, totaled 63,259 kilograms (kg). Imports of gallium metal, which included gallium metal with purity between 4 nines and 7 nines, totaled 55,080 kg (Arumu Publishing Co. Ltd., 2003, p. 26).
Overall supply of gallium metal totaled about 126 t, but Japan’s total demand for gallium metal was estimated to be 130 t, of which 45.6% was for the manufacture of GaAs and GaP crystals; 53.2%, for GaAs-based light-emitting diodes (LEDs), GaP-based LEDs, and GaAs-based laser diodes (LDs); and 1.2% for other endusers (Arumu Publishing Co. Ltd., 2003, p. 25-26).
To secure captive high-purity gallium metal from gallium-metal-processing plants overseas to meet the growing demand by the compound semiconductor market, especially for such mobile communications uses as cellular phones, Sumitomo Chemical established a manufacturing facility in Shanghai, China, in a joint venture with Technical Sources International Group (TSI) of the United States and Inabata & Co. Ltd. of Japan in mid-2001. The joint-venture Shanghai Sumika High Purity Metal, Ltd. was owned by Sumitomo Chemical (70%) and TSI and Inabata (15% each). The 40-t/yr-capacity plant in Shanghai used Sumitomo Chemical’s proprietary technology. Gallium metal produced by the plant in 2002 was shipped to Sumitomo Chemical, which also operated a 40-t/yr processing plant in Ehime Prefecture. The Ehime plant’s capacity was expanded to 60 t/yr in 2002 (Sumitomo Chemical Co. Ltd., 2001§, 2002§).
Gold and Silver.—Mine production of gold and silver increased because of higher precious metals prices in 2002. Gold mine production was mainly by Sumitomo Metal Mining from the Hishikari Mine in Kagoshima Prefecture on Kyushu Island. The company, which was working on its Honko (main mine) and Yamada deposits in the Hishikari mining area, produced about 8.6 t of gold in 2002. Other small-scale productive gold and silver mines were the Arkesi and Kasuga in Kagoshima Prefecture. The Toyoha Mines produced most of Japan’s mined silver as a byproduct of their lead and zinc mining operations in Hokkaido Prefecture.
In overseas mineral exploration, Sumitomo Metal Mining (51%) and its partners Teck Cominco Ltd. (40%) of Canada and Sumitomo Corp. (9%) completed the final feasibility study for the Pogo (Stone Boy) gold project at yearend 2001. The Pogo gold project, which was located about 61 kilometers (km) northeast of Delta Junction near Goodpaster River in eastern interior Alaska, was still waiting for a wastewater discharge (National Pollution Discharge Elimination System) permit from the U.S. Environmental Protection Agency (EPA). According to Teck Cominco, the joint venture’s (Teck-Pogo, Inc.) revised documents, which eliminated shaft hoisting and updated the water management plan to address changes in support of project permitting, were submitted in 2002 so that an environmental impact statement (EIS) could be drafted. Road access for construction, construction of mill and site facilities, and mine development were expected to begin in 2003 following the completion of an EIS; and the EPA was the lead agency for the development of the EIS (Teck Cominco Ltd., 2002§; U.S. Environmental Protection Agency, 2002§).
According to the proposed development plan, the project would develop an underground mine in land owned by the State of Alaska with a surface mill designed to process 2,500 metric tons per day (t/d) of ore to produce about 375,000 ounces per year, or about 11,664 kilograms per year (kg/yr), of gold with

13.8 U.S. GEOLOGICAL SURVEY MINERALS YEARBOOK—2002
the possibility of increasing production capacity to 3,500 t/d and to produce 500,000 ounces per year, or 15,552 kg/yr of gold. The project would require 25 to 33 months to construct and would have a mine life of about 11 to 12 years. The capital cost of the project was estimated to be between $200 million and $250 million (Resources Development Council for Alaska, Inc., 2003§).
In 2002, production of refined gold and refined silver decreased by 7.1% and 1.5%, respectively, owing mainly to reduced input from imported ore. Imports of gold ingots and powder increased by 101.7% to 80,386 kg because of decreased domestic production of refined gold and a substantial increase in the domestic gold demand for private investment and industrial use. Imports of silver ingots and powder increased by 1.4% to 884 t, but domestic demand for silver decreased in all end users except in silver nitrate for other uses, which increased by 46%. The major suppliers of gold ingots and powder in 2002 were Australia (47.2%), Switzerland (14.6%), Republic of Uzbekistan (8.3%), Hong Kong (6.8%), Canada (5.8%), the United States (4.4%), Russia (4.2%), and South Africa (2.5%). The major suppliers of silver ingots and powder in 2002 were Mexico (35.6%), the Republic of Korea (15,5%), Peru (14.6%), Australia (14.3%), the United States (9.2%), and China (5.9%). Import bills for gold ingots and powder were $791.7 million and that for silver ingot and powder were $133.8 million (Ministry of Finance, 2002b, p. 618-619).
Overall demand for gold, which included such uses as dental, medical, industrial, industrial arts and crafts, and private investment, increased to 303,098 kg in 2002 from 262,495 kg in 2001. Of this overall domestic demand for gold, dental and medical uses increased to 24,112 kg in 2002 from 20,813 kg (revised) in 2001; industrial uses increased to 125,591 kg in 2002 from 119,629 kg in 2001; industrial arts and crafts decreased to 4,597 kg in 2002 from 4,893 kg in 2001; and private investment and other uses increased to 148,698 kg in 2002 from 117,160 kg (revised) in 2001. Despite the continued decline in demand for jewelry to 18,154 kg in 2002 from 21,739 kg in 2001, gold demand for electronics and telecommunications rebounded in 2002 and increased to 80,415 kg in 2002 from 70,916 kg in 2001 (Arumu Publishing Co. Ltd., 2003, p. 117).
The continuing decline in the domestic demand for silver decreased by 10.1% to 2,658 t from 2,958 t in 2001 owing to the continued decline in the demand for photographic materials, which decreased to 1,532 t in 2002 from 1,663 t in 2001, electric contacts (silver solder), which decreased to 98 t in 2002 from 111 t in 2001, and other uses, which decreased to 440 t in 2002 from 637 t in 2001. Despite the general decline, silver nitrate for other than photographic uses increased to 220 t in 2002 from 150 t in 2001, and rolled products, to 216 t in 2002 from 194 t in 2001 (Ministry of Economy, Trade and Industry 2002c, p. 286).
Exports of refined gold ingots and powder decreased by 62.6 % to 5,350 kg and were valued at $47.1 million in 2002. The major buyers of refined gold ingots and powder were Switzerland (61.2%), the Republic of Korea (10.7%), Hong Kong (3.5%), Taiwan (2.6%), and Vietnam (2.5%). Exports of silver ingots and powder increased by 44.2% to 359.7 t and were valued at $22.5 million. The major buyers of refined silver and powder were the Republic of Korea (19.9%), Singapore (17.4%), Taiwan (16.2%), China (12.5%), Hong Kong (11.8%),
the United Kingdom (9.0%), Malaysia (8.1%), and the United States (2.2%) (Ministry of Finance, 2002a, p. 492-493).
Iron and Steel.—Japan relied on imports to meet virtually all the iron ore requirements for its iron and steel industry. In 2002, imports of iron ore totaled 129.1 Mt and were valued at $3.0 billion. The average c.i.f. (cost, insurance, and freight) import price per metric ton of iron ore was $23.54 compared with $24.31 in 2001. In 2002, the major suppliers of iron ore were Australia (57.5%), Brazil (19.4%), India (12.0%), South Africa (3.7%), the Philippines (2.8%), and Chile (2.0%). Imports of pig iron increased slightly by 1.9% to 184,698 t and were valued at $22 million. The average c.i.f. import price per metric ton of pig iron was $136.72 compared with $121.69 in 2001. The major suppliers of pig iron in 2002 were China (40.5%), Brazil (29.9%), North Korea (19.8%), and South Africa (9.8%) (Ministry of Finance, 2002b, p. 169, 624).
Consumption of iron ore by the iron and steel industry increased by 3.3% to 113.9 Mt, of which 86.4 Mt was for sintering; 26.5 Mt, for ironmaking; 807,000 t, for steelmaking; and 135,000 t, for other uses. Consumption of other iron ore raw materials by the iron and steel industry included 3.6 Mt of imported pellets, 716,000 t of imported iron sand, 228,000 t of imported ferruginous manganese ore, and 11.6 Mt of other iron ore materials. The industry also consumed 43.4 Mt of iron and steel scrap. Consumption of other major raw materials was 65.3 Mt of coking coal, 36.5 Mt of coal coke, 12.9 Mt of limestone, 4.5 Mt of quicklime, 1.7 Mt of dolomite, 1.5 Mt of serpeninite, 448,976 t of silica stone, and 156,481 t of fluorite (Ministry of Economy, Trade and Industry, 2002c, p. 84-86, 90-93).
In 2002, pig iron production increased by 2.7% to 81 Mt, of which 80.5 Mt was for steelmaking and 465,900 t, was for foundry. The total ironmaking capacity decreased to 93.2 Mt/yr from 94.1 Mt/yr in 2001, and the number of blast furnaces (35) and other furnaces (4) for ironmaking decreased to 39 from 42 in 2001 (Ministry of Economy, Trade and Industry, 2002c, p. 28, 94).
Crude steel production increased by 4.7% to 107.7 Mt owing mainly to increased exports of iron and steel especially to the Asian markets. Of the total crude steel produced in 2002, 72.9% was processed by basic oxygen furnaces (L.D. converter), and 27.1%, by electric furnaces. In the steelmaking sector, the number of basic oxygen furnaces decreased to 63 from 64 in 2002, and the number of electric arc furnaces decreased to 366 from 407 in 2001. The overall crude steel production capacity decreased to 144.8 Mt/yr from 145.3 Mt/yr in 2001 (Ministry of Economy, Trade and Industry, 2002c, p. 39, 94).
In 2002, Japan was the world’s second largest producer of crude steel and accounted for 11.9% of the world total (International Iron and Steel Institute, 2003b§). Among Japan’s top five steelmakers in 2002, Nippon Steel Corp., which produced 29.8 Mt of crude steel, was the third largest steel-producing company in the world after Arcelor S.A. and the LNM Group; NKK Corp., which produced 15.2 Mt, ranked 8th; Kawasaki Steel Corp., which produced 13.7 Mt, ranked 11th; Sumitomo Metal Industries, Ltd., which produced 11.8 Mt, ranked 13th; and Kobe Steel Ltd., which produced 6.6 Mt, ranked 27th (International Iron and Steel Institute, 2003a§). In
THE MINERAL INDUSTRY OF JAPAN—2002 13.9
2002, all five integrated steelmakers either achieved or exceeded their targeted sales and reported better-than-expected financial results, all owing to increased exports and better export prices (Metal Bulletin, 2003).
In September 2002, Kawasaki Steel and NKK formally merged and created a new company called JFE Holdings Inc. to reduce costs and to improve efficiencies to meet the worldwide customer’s requirements. Under JFE Holdings, five wholly owned subsidiaries would be established by April 2003 to continue the business. Among the five subsidiaries, the two most important were JFE Steel Corp. and JFE Engineering Corp. The impact of the merger would not be known until after April 2003. According to Japan’s Fair Trade Commission, however, JFE Steel would have an average market share of 30% in the domestic market in electric sheet, tinplate, high-tensile sheet and plate, and line-pipe for domestic gas and water projects. According to Kawasaki Steel, about 6,000 jobs and 2 Mt/yr of steel production capacity would be cut at JFE Steel (Metal Bulletin, 2002a; Metal Bulletin Monthly 2002).
Following the merger of Kawasaki Steel and NKK in September 2002, Nippon Steel, Kobe Steel, and Sumitomo Metal reached an agreement in November 2002 to form a three-way partnership to cut costs and to take on JFE Holdings in the domestic and world markets. The three companies announced that as part of their planned comprehensive alliance, they would invest several billion yen in each other; integrate production, distribution, and material procurement; and consolidate facilities. As a result, Japan’s steel industry would be consolidated into two major groups. In terms of crude steel output, number of mills, and number of employees, the three-way partnership would have 42.4 Mt, 14 Mt, and 107,363 t compared with JFE Holdings’ 25.2 Mt, 4 Mt, and 57,004 t, respectively, in 2002 (Nikkei Weekly, 2002c).
In October, Sumitomo Metal also engaged in talks with China Steel Corp. of Taiwan to set up a joint venture for the early stages of the steelmaking process at its Wakayama works in a cross-border alliance to make use of excess capacity. The joint venture, which would to be established in 2003, would operate blast furnaces and converters at the steel works in Wakayama Prefecture and produce steel billets for Sumitomo Metal and steel slab for China Steel (Nikkei Weekly, 2002d).
In 2002, domestic demand for steel increased by only 1.2% to about 63.4 Mt, of which 53.4 Mt was ordinary steel products and 10.0 Mt, specialty steel products. The increase in overall domestic demand for steel was mainly to the result of stronger demand by the manufacturers of automobile, electric machinery and equipment, and industrial machinery and equipment. Domestic demand, as measured by orders for ordinary and specialty steels, remained weak in most of the end user’s categories in 2002 (table 6).
Exports of iron and steel, however, continued to move higher, especially to the East Asian market where exports rose by 31.7% in 2002. Overall exports of iron and steel products increased by 19.2% to 36.3 Mt; this was the second highest level after the record 37.0 Mt of 1976. Of total exports, 70.9% was ordinary steel products; 14.1%, specialty steel products; 10.9%, steel ingots and semifinished products; 1.9%, pig iron; and 1.4%, secondary products (Japan Iron and Steel Federation, 2003§).
Exports of iron and steel products to the Asia markets increased by 31.7%. Exports to the European and Middle Eastern markets decreased by 40.1% and 22.5% respectively; the Oceania markets increased by 20.4%; the North America and South America markets decreased by 18.7%; and the African markets increased by 18.4% in 2002. Exports of iron and steel products to the United States dropped sharply by 32.7% to 1.5 Mt (table 7; Japan Iron and Steel Federation, 2003§).
Imports of iron and steel products decreased by 13.6% to 5.3 Mt in 2002 for the second consecutive year of decline; this was the lowest level in 16 years. Of the total imports, 2.8 Mt was ordinary steel products; 1.9 Mt, pig iron, ferroalloys, steel ingots, and semimanufactured steel; 362,000 t, other steel products; and 106,000 t, specialty steel products (Japan Iron and Steel Federation, 2003, p. 18-19). Among the major suppliers of all steel products, the Republic of Korea and Taiwan accounted for more than 90% of total steel products imported by Japan (Japan Iron and Steel Federation, 2003§).
Manganese.—Japan relied 100% on imports to meet its manganese raw material requirements for the iron and steel and electrolytic manganese dioxide industries. In 2002, Japan imported 897,990 t of high-grade manganese ore, 125,896 t of ferruginous manganiferous ore, 1,463 t of high-grade manganese dioxide ore, and 89,389 t of low-grade manganese ore. The major suppliers of high-grade manganese dioxide ore were Colombia (31.6%), Mexico (27.3%), Gabon (21.9%), and China (12.3%). The major suppliers of ferruginous manganiferous ore were India (80.3%) and South Africa (18.2%). The major suppliers of high-grade manganese ore were South Africa (71.7%) and Australia (26.3%). The major suppliers of low-grade manganese ore were South Africa (44.8%), Ghana (28.1%), and India (25.9%). The import bills for manganese totaled $106.9 million in 2002 (Ministry of Finance, 2002b, p. 169).
Consumption of manganese ore for the production of ferroalloys increased by 2.4% to 646,096 t, that for steelmaking increased by 6.8% to 167,203 t, and that for other uses increased by 30.0% to 78 t in 2002. Production of ferromanganese decreased by 3.1%, owing to increased consumption for steelmaking (Ministry of Economy, Trade and Industry, 2002c, p. 29, 91). Imports of ferromanganese increased by 6.4% to 58,052 t because of decreased domestic production. The major suppliers were China (55.9%), South Africa (29.3%), the Republic of Korea (7.5%), and Australia (6.9%) (Ministry of Finance, 2002b, p. 624).
Consumption of domestically produced high- and low-carbon ferromanganese for steelmaking increased by 1.5% to 408,696 t, of which 332,961 t was high-carbon ferromanganese and 75,735 t, low-carbon ferromanganese (Ministry of Economy, Trade and Industry, 2002c, p. 210). Exports of ferromanganese decreased by 47.0% to 14,855 t. The major buyers were Taiwan (31.4%), the United States (29.6%), Thailand (8.4%), Saudi Arabia (8.1%), Australia (7.8%), the Republic of Korea (4.9%), and India (3.6%). Export earnings from ferromanganese totaled valued at $10.2 million in 2002 (Ministry of Finance, 2002a, p. 496).

13.10 U.S. GEOLOGICAL SURVEY MINERALS YEARBOOK—2002
In 2002, Japan was the world’s largest producer of electrolytic manganese dioxide (EMD). Japan’s EMD producers were Mitsui Mining and Smelting at its Takehara plant (24,600 t/yr) in Hiroshima Prefecture and its County Cork plant (19,000 t/yr) in Ireland and Tosoh Corp. at its Hyuga plant (34,000 t/yr), Miyazaki Prefecture, and its Salonika plant (18,000 t/yr) in Greece. Japan Metal & Chemicals Co. Ltd. suspended operations of its Takaoka plant (18,000 t/yr) in Toyama Prefecture and its Hunan plant (10,000 t/yr) in China. Japan’s EMD production capacity, which included three overseas plants, totaled 95,600 t/yr and accounted for 32.4% of the world’s production capacity of 295,200 t/yr. Of the 45,867 t produced, 27,057 t was consumed domestically for the production of batteries and 23,855 t was exported. The major buyers were Indonesia (26.5%), China (18.5%), Singapore (18.3%), the Republic of Korea (13.1%), the United States (8.3%), and Greece (4.2%). Export earnings from manganese dioxides were valued at $31.7 million in 2002 (Ministry of Finance, 2002a, p. 112; Arumu Publishing Co. Ltd., 2003, p. 34).
Nickel.—Japan relied 100% on imported raw materials to meet its nickel requirements in 2002. Japan was the world’s largest importer and consumer of nickel and the second largest producer of nickel metal after Russia (International Nickel Study Group, 2003, p. 8, 10). All nickel ores and nickel mattes were imported for the production of ferronickel, nickel chemicals (salts), nickel oxide sinter, and refined nickel. Additionally, ferronickel, nickel powder and flake, nickel oxide sinter, nickel waste and scrap, and refined nickel also were imported to meet the nickel requirements of the battery, magnetic materials, nonferrous alloys, and specialty steel industries, as well as other end users.
Imports of nickel ore increased by 2.3% to 4.5 Mt and were valued at $141.1 million. The suppliers of nickel ore were Indonesia (53.8%), the Philippines (26.4%), and New Caledonia (19.7%). Imports of nickel matte, in gross weight, decreased by 13.5% to 101,450 t and were valued at $414.7 million. The suppliers of nickel matte were Indonesia (74.2%) and Australia (25.8%). Imports of ferronickel, in gross weight, increased by 10.1% to 50,058 t and were valued at $98.2 million. The suppliers of ferronickel were New Caledonia (63.8%), Indonesia (13.3%), the Dominican Republic (11.5%), and Colombia (11.4%). Imports of refined nickel increased by 44.0% to 40, 415 t and were valued at $266 million. The top suppliers of refined nickel were Australia (27.1%), Russia (20.2%), Zimbabwe (10.9%), Norway (9.6%), South Africa (8.2%), Canada (7.3%), Brazil (6.1%), the United Kingdom (4.9%), and China (4.2%). Imports of nickel oxide sinter increased by 26.5% to 1,147 t and were valued at $6.2 million; Australia, which was the dominant supplier of nickel oxide sinter, accounted for 99.4%. Imports of nickel powders and flakes increased by 18.64% to 9,780 t and were valued at $84.7 million. The major suppliers were the United Kingdom (44.4%) and Canada (48.8%). Imports of nickel waste and scrap decreased by 12.5% to 14,033 t and were valued at $77.1 million. The major suppliers were Russia (23.3%), the United States (18.2%), Zimbabwe (17.6%), the Republic of Korea (7.1%), Taiwan (6.6%), and South Africa (6.0%) (Ministry of Finance, 2002b, p. 169, 624, 661).
Consumption of nickel ore by the ferroalloy industry increased by 6.2% to 3.4 Mt in 2002. Production of ferronickel was by Hyuga Smelting Co. Ltd. (a wholly owned subsidiary of Sumitomo Metal Mining) in Hyuga, Miyazaki Prefecture; Nippon Yakin Kogyo at Oheyama, Miyazu, Kyoto Prefecture; and Pacific Metals Co. Ltd. in Hachinohe, Aomori Prefecture. Production of ferronickel, in gross weight, increased by 0.9% to 370,973 t, which contained about 74,400 t of nickel. Consumption of ferronickel for steelmaking, in gross weight, increased by 4.6% to 308,560 t owing to stronger demand by the manufacturers of nickel-based stainless steel (Ministry of Economy, Trade and Industry, 2002c, p. 91, 210). Exports of ferronickel decreased by 1.8% to 119,507 t, of which 54.9% went to Taiwan and 45.1%, to the Republic of Korea. Export earnings from ferronickel were valued at $139 million (Ministry of Finance, 2002a, p. 497).
Refined nickel was produced solely by Sumitomo Metal Mining at its nickel refinery that used its Matte Chlorine Leaching Electrowinning process in Niihama, Ehime Prefecture. The 36,000-t/yr nickel refinery used imported nickel matte from Australia and Indonesia to produce refined nickel and nickel salts for domestic consumption and exports. Tokyo Nickel Co. Ltd. operated a 60,000-t/yr smelter in Matsuzaka, Mie Prefecture, which also used imported nickel matte to produce briquettes, granules, and nickel oxide sinters for domestic consumption and export. Sumitomo Metal Mining announced in mid-2002 that it planned to expand refined nickel production capacity to 46,000 t/yr from 36,000 t/yr and refined cobalt capacity to 1,100 t/yr from 300 to 400 t/yr at its Niihama Facilities in Ehime Prefecture by mid-2004. The expansion project would be in line with the start up of nickel-cobalt sulfide production that will use high-pressure acid-leach technology at the Rio Tuba Mine on Palawan Island in the Philippines; Sumitomo Metal Mining owned 54%. Sumitomo Metal Mining reportedly also expressed an interest in acquiring up to 25% interest in the Goro laterite nickel project in New Caledonia (Mining Journal, 2002c, e, f; Nikkei Weekly, 2002a).
Domestic demand for refined nickel increased by 4.4% to 65,010 t owing to a substantial increase in demand by the manufacturers of specialty steel in 2002. Among the end users, production of specialty steel increased by 18.0% to 53,233 t; batteries, by 11.5% to 3,983 t; magnetic materials, by 38.3% to 1,991 t; and catalysts, by 15.5% to 440 t. Among the end users, the manufacturing of galvanized sheet decreased by 42.0% to 2,500 t, and other users, by 61.6% to 2864 t in 2002 (Ministry of Economy, Trade and Industry, 2002c, p. 278). Exports of refined nickel decreased by 65.1% to 167 t and were valued at $1.5 million in 2002. The major buyers were Indonesia (33.8%), the Republic of Korea (17.7%), Thailand (15.6%), Singapore (7.7%), the Philippines (7.6%), and Hong Kong (5.4%). Exports of nickel oxide sinter and other intermediate products of nickel metallurgy decreased by 9.3% to 23,112 t and were valued at $129.3 million. The principal buyers were the Republic of Korea (53.8%) and Taiwan (44.8%). Exports of nickel powders and flakes increased by 77.5% to 1,449 t in 2002 and were valued at $26.2 million. The major buyers were China (51.5%), Hong Kong (29.6%), France (6.5%), and the United States (3.8%). Exports of nickel waste and scrap decreased by 56.7% to 308 t and were valued at $0.9 million. The major
THE MINERAL INDUSTRY OF JAPAN—2002 13.11
buyers were the United Kingdom (39.2%), the United States (29.1%), Hong Kong (19.1%), the Republic of Korea (4.6%), Australia (3.9%), and Taiwan (3.8%) (Ministry of Finance, 2002a, p. 575).
Titanium.—In 2002, Japan was the world’s largest producer of titanium sponge metal and accounted for 40.2% of the world total (Arumu Publishing Co. Ltd., 2003, p. 52). Japan also was one of the world’s major producers of titanium dioxide pigment. All the raw material requirements for production of titanium sponge metal and dioxide pigment, however, were supplied by imports. Titanium ore (rutile) was consumed by the producers of titanium sponge metal. Ilmenite and titanium slag were consumed mainly by the manufacturers of synthetic rutile and titanium dioxide pigment. Small amounts of rutile and ilmenite were consumed as blast furnace additives in the steel industry.
Imports of titanium ore (rutile) decreased by 16.2% to 94,468 t because of lower titanium sponge production in 2002. The major suppliers were Australia (54.7%), India (24.9%), Canada (10.5%), and South Africa (9.6%). Imports of ilemenite decreased by 22.1% to 290,755 t. The major suppliers were Vietnam (40.1%), Australia (34.6%), Malaysia (9.4.%), Egypt (9.1%), and India (3.7%). Import bills for rutile and ilmenite totaled $43.0 million and $30.2 million, respectively, in 2002. No imports of titanium slag were reported (Ministry of Finance, 2002b, p. 170).
In 2002, production of titanium sponge decreased by 9.3% because of a sharp decline in exports to the European Union and the United States. Sumitomo Titanium Corp. (formerly Sumitomo Sitix Corp.; the name was changed in 2002) launched a $29 million expansion project to add three reduction furnaces and auxiliary equipment at its Amagasaki plant near Osaka in Hyogo Prefecture. By the end of 2001, the expansion project was completed, and the capacity was boosted to 18,000 t/yr from 15,000 t/yr (Metal Bulletin, 2002f, g).
Total titanium sponge shipments decreased by 9.8% to 22,652 t in 2002. According to the Japan Titanium Society, domestic shipments of titanium sponge increased to 16,801 t in 2002 from 14,328 t in 2001. Exports of titanium sponge decreased to 5,851 t in 2002 from 10,779 t in 2001. Imports of titanium sponge increased slightly to 9,210 t in 2002 from 9,100 t in 2001. Total shipments of titanium mill products increased to 14,481 t in 2002 from 14,434 t in 2001; domestic shipments of titanium mill products decreased to 7,256 t from 7,307 t in 2001. Exports of titanium mill products increased to 7,225 t in 2002 from 7,127 t in 2001. Imports of titanium mill products increased to 1,389 t in 2002 from 1,223 t in 2001 (Arumu Publishing Co. Ltd., 2003, p. 52-53).
In the domestic market, according to the Japan Titanium Society, shipments of titanium mill products to chemical-plant and heat-exchange equipment manufacturers increased to 2,199 t in 2002 from 2,043 t in 2001. Shipments to power-generation and water-desalination plant manufacturers increased to 886 t in 2002 from 805 t in 2001. Shipments to the distributors decreased to 1,135 t in 2002 from 1,325 t in 2001. Shipments to consumer and sports leisure goods manufacturers decreased to 1,335 t in 2002 from 1,352 t in 2001. Shipments to aircraft manufacturers decreased to 447 t in 2002 from 554 t in 2001. Shipments to automobiles manufacturers increased to
571 t in 2002 from 499 t in 2001. Shipments to architectural and civil engineering materials manufacturers decreased to 43 t from 72 t in 2001. Shipments to the manufacturers of ship, marine, and energy materials increased to 194 t from 153 t in 2001 (Arumu Publishing Co. Ltd., 2003, p. 56).
According to Government trade statistics, exports of titanium sponge decreased by 46.1% to 5,996 t and totaled $43.1 million in 2002. The major buyers were the United States (66.3%), the United Kingdom (22.0%), and the Republic of Korea (5.6%) (Ministry of Finance, 2002a, p. 586). Exports of titanium waste and scrap and titanium powder increased by 72.5% to 4,177 t and totaled $17.8 million in 2002. The major buyers were the United States (73.9%), Taiwan (15.5%), the United Kingdom (3.4%), and Germany (2.7%). To meet the domestic requirements, Japan imported 9,680 t of lower grade titanium sponge, powder, waste and scrap, which were valued at $74.6 million in 2002. The principal suppliers were Kazakhstan (35.3%), Russia (35.1%), and the United States (22.7%) (Ministry of Finance, 2002b, p. 670).
Imports of titanium mill products increased to 1,389 t in 2002 from 1,223 t in 2001 and were valued at $51.2 million. The principal suppliers were the United States (46.7%), Russia (36.7%), China (8.5%), and Italy (3.1%) (Ministry of Finance, 2002b, p. 671). Exports of titanium mill products increased to 8,704 t in 2002 from 8,836 t in 2001 and were valued at $202.6 million in 2002. The major buyers were Sweden (16.1%), Taiwan (12.4%), the Republic of Korea (11.2%), France (10.8%), Italy (8.1%), the United States (6.9%), Germany (6.2%), Hong Kong (5.0%), the Netherlands (4.3%), and Denmark (2.7%) (Ministry of Finance, 2002a, p. 586).
Production of titanium dioxide decreased by 6.4% because of the weaker demand in the domestic market despite a 10.6% increase in exports in 2002. According to Government statistics, the industry’s capacity decreased by 2.6% to 317,400 t/yr in 2002 from 325,800 t/yr in 2001. The capacity utilization was 75.8% (Ministry of Economy, Trade and Industry, 2002b, p. 70, 238-239). According to the Japan Titanium Dioxide Industry Association, only six companies were operating in 2002, and the industry’s total capacity was estimated to be 322,200 t/yr in 2002 (Arumu Publishing Co. Ltd., 2003, p. 57).
According to the Japan Titanium Dioxide Industry Association, total shipments of titanium dioxide to the domestic market decreased by 2.6% to 169,451 t. Of that total 73,705 t was for the manufacture of paints and coating materials; 34,279 t, printing inks and pigments; 18,476 t, papers; 18,307 t, synthetic resin (plastics); 2,833 t, chemical fibers; 2,668 t, rubber; 1,818 t, condenser; and 17,599 t, other end uses (Arumu Publishing Co. Ltd., 2003, p. 57).
Imports of titanium oxide decreased by 36.3% to 9,105 t in 2002 from 14,298 t in 2001 and were valued at $11.9 million. The major suppliers were China (61.3%), the Republic of Korea (22.5%), France (6.6%), and Canada (2.6%) (Ministry of Finance, 2002b, p. 182). Exports of titanium oxides increased by 8.4% to 25,500 t in 2002 and were valued at $67.3 million. The major buyers were China (35.2%), Taiwan (24.0%), the Republic of Korea (10.6%), the United States (6.1%), Indonesia (4.3%), the Netherlands (2.3%), and Germany (2.1%) (Ministry of Finance, 2002a, p. 112-113).

13.12 U.S. GEOLOGICAL SURVEY MINERALS YEARBOOK—2002
Industrial Minerals
Cement.—In 2002, Japan was the world’s fourth largest cement producer after China, India, and the United States (van Oss, 2003). Japan’s cement production decreased by 6.2% to 71.8 Mt because of reduced public works budgets that generated about 60% of domestic cement demand. Japan’s apparent consumption of cement decreased by 5.8% to 64.6 Mt from 68.6 Mt in 2000; and per capita apparent consumption decreased to 507 kg in 2002 from 539 kg in 2001. In 2002, Japan’s cement industry comprised 20 producers (companies), which operated 35 plants with 62 kilns and had a total capacity of 78 Mt/yr. Japan’s cement plants were concentrated mainly in the Chugoku (Kansai and Kanto) and the Kyushu areas where most of Japan’s limestone reserves are located (Japan Cement Association, 2003a§, b§).
As a result of the continued consolidation in the cement industry, Japan’s cement clinker capacity decreased to 82.9 Mt/yr in 2002 from 86.7 Mt/yr in 2001, and the number of regular employees in the cement industry decreased to 3,836 in 2002 from 4,013 in 2001. Production of portland cement clinker decreased to 68.9 Mt in 2002 from 71.7 Mt in 2001, and that of cement decreased to 71.8 Mt in 2002 from 76.5 Mt in 2001. As a result, the cement capacity utilization rate dropped to 91.2% in 2002 from 95.9% in 2001. In 2002, 50.1 Mt of ordinary portland cement was produced; 3.9 Mt, high early strength and moderate heat portland cement; 17.1 Mt, blast-furnace slag cement; 329,000 t, other cement; 211,000 t, flyash cement; and 76,000 t, white cement. The major raw materials consumed by the cement industry included 78.6 Mt of limestone, 10.6 Mt of clay, 6.3 Mt of silica stone, 5.9 Mt of blast furnace ore slag, and 2.6 Mt of gypsum (Ministry of Economy, Trade and Industry, 2002a, p. 63-67, 122-123, 127, 130).
Taiheiyo Cement Corp. reported a net profit in its 2002 financial result for the first time after two consecutive years of net loss. The company, however, failed to gain the price-control power as widely anticipated following the merger of Chichibu Onoda Cement Corp. and Nihon Cement Co. Ltd. in October 1998. To improve its financial results through an increase in the rate of return on assets and to reduce fixed costs of interest-bearing debt, Taiheiyo Cement began implementing a management plan called Taiheiyo 04 Mid-Term Management Plan. Under this plan, Taiheiyo would further downsize its cement business activities because of reduced domestic cement demand, reduce costs by increasing use of recycled natural resources, and strengthen the existing overseas investment and export business activities (Taiheiyo Cement Corp., 2002§).
According to the Japan Cement Association (2003b§), domestic demand for cement decreased by 5.5% to 63.8 Mt, and exports of cement, which included clinker, increased by 9.2 % to 8.3 Mt in 2002. According to Government trade statistics, exports of cement clinker increased by 16.9% to 4.16 Mt. Exports of portland cement, however, decreased by 1.0% to 3.97 Mt. In the past 3 years, exports of cement clinker had been increasing, and those of portland cement, decreasing. The major buyers of cement clinker were China (37.4%), Hong Kong (27.7%), Australia (11.2%), Côte d’lvoire (7.0%), Kenya (4.2%), Singapore (5.3%), Chile (3.5%), and Malaysia (3.2%).
The major buyers of portland cement were Singapore (40.1%), Hong Kong (17.2%), Taiwan (9.9%), China (9.4%), the Republic of Korea (8.9%), and Nigeria (5.2%). Export earnings from portland cement and cement clinker were $77.9 million and $67.2 million, respectively. The average export f.o.b. (free-on-board) price of portland cement decreased to $19.63 per metric ton in 2002 from $22.69 per ton in 2001 (Ministry of Finance, 2002a, p. 100). Imports of cement, which included aluminous, portland, and white cement, decreased by 30.2% to 823,469 t. The principal suppliers were the Republic of Korea (97.0%), France (1.4%), and China (1.3%). The average import c.i.f. price of portland cement increased to $42.82 per metric ton in 2002 from $32.94 per ton in 2001 (Ministry of Finance, 2002b, p. 168).
Limestone.—Japan was self-sufficient in limestone in 2002. The country remained one of the world’s top limestone producers, although production decreased by 5.7% owing to decreased consumption as raw materials for cement production and as construction aggregates for public works projects by the construction industry. In Japan, most of the major limestone quarries were owned and operated by cement, construction, or steel companies (table 8).
Total sales (demand) of domestically produced limestone decreased to 179.1 Mt in 2002 from 187.2 Mt in 2001 mainly because of decreased consumption of limestone by the cement and construction industries in 2002 (Ministry of Economy, Trade and Industry, 2002d, p. 108).
In 2002, the country imported 308,395 t of limestone flux, limestone, and other calcareous stone mainly from Malaysia (35.6%), the Philippines (31.7%), Vietnam (28.6%), and China (3.7%). Japan exported 2.0 Mt of limestone flux, limestone, and other calcareous stone mainly to Taiwan (58.6%), Australia (28.1%), and the Republic of Korea (12.3%). Export earnings and import bills of limestone flux, limestone, and other calcareous stone were valued at $13.9 million and $9.3 million, respectively (Ministry of Finance, 2002a, p. 99; 2002b, p. 167).
Mineral Fuels
Coal.—Japan was the largest coal importer and one of the largest coal consumers in the world because of its large and growing demand for coal by the cement, paper, and power generation industries (U.S. Energy Information Administration, 2003§). Japan’s coal production dropped to less than 1.5 Mt in 2002. Japan’s coal import reliance was estimated to be 100% for coking coal and anthracite, and about 98.5% for steam (thermal) coal.
Coal was produced mainly by an underground mine operated by Kushiro Coal Mine Co. Ltd., which was established in February 2002 following the closure of Taiheiyo (Pacific) Coal Mining Co. Ltd. at the end of January 2002, in Kushiro, Hokkaido Prefecture, and 11 small-scale open pit mines (10 in Hokkaido Prefecture and 1 in Yamaguchi Prefecture).
According to the Japan Coal Energy Center, Taiheiyo Coal Mining Co. Ltd., which changed its name to Kushiro Coal Mine Co. Ltd. in February 2002, became a center for the implementation of transferring Japanese coal technology
THE MINERAL INDUSTRY OF JAPAN—2002 13.13
to large-scale coal-producing countries in Asia. In 2002, Japan produced about 1.37 Mt of coal, of which 762,751 t was produced from the Kushiro Mine and 604,709 t, from 11 small-scale open pit mines (Shinji,Tomita, Director, Planning Department, Japan Coal Energy Center, written commun., October 16, 2003).
To encourage the use of cleaner fuels like natural gas and to limit greenhouse emissions, the Ministry of Economy, Trade and Industry reportedly was considering a new tax on coal imports in September 2002. The Government intended to impose a tax on coal imports beginning April 1, 2003; details of the tax, however, were still undecided. The proposed new coal tax would affect the Australian coal producers most because Australia was Japan’s largest coal supplier and accounted for more than 40% of Japan’s total imports of coking coal and more than 65% of steam (thermal) coal in 2002 (Mining Journal, 2002b; Ministry of Finance, 2002b, p. 171; Environmental Finance News, 2002§).
In 2002, Japan’s overall coal imports, which were based on trade statistics of the Ministry of Finance, increased by 1.8% to158.6 Mt, of which 104.2 Mt was bituminous (steam; other than coking coal); 49.5 Mt, coking coal, and 4.9 Mt, anthracite. The total value of imported coal was estimated to be $6.26 billion. The major suppliers of coking coal were Australia (44.2%), Indonesia (23.5%), Canada (15.1%), China (9.7%), and Russia (5.1%). The major suppliers of bituminous were Australia (67.7%), China (20.3%), Indonesia (16.7%), Russia (3.7%), and Canada (1.7%). The major suppliers of anthracite were China (57.2%), Vietnam (29.0%), North Korea (7.2%), and Australia (5.1%). China gradually was gaining market share of Japan coal market by offering lower prices in 2002. The average c.i.f. import price of coking coal was $45.00 per ton from China compared with $47.98 per ton from Australia. The average c.i.f. import price of bituminous was $36.03 per ton from China compared with $37.32 per ton from Australia (Ministry of Finance, 2002b, p. 171).
Natural Gas and Petroleum.—In 2002, Japan was one of the world’s top importers of natural gas and crude petroleum. Domestic production of natural gas and crude petroleum was insignificant because of its limited indigenous resources. Japan’s natural gas and crude petroleum reserves were estimated to be 39.6 billion cubic meters and 58.5 million barrels (Mbbl), respectively (Oil & Gas Journal, 2002a). In 2002, domestic production of natural gas and crude petroleum totaled about 2.6 billion cubic meters and 4.5 Mbbl, respectively, compared with 79 billion cubic meters and 1,457 Mbbl of domestic consumption of natural gas and crude petroleum (Ministry of Economy, Trade and Industry, 2002d, p. 24-25, 64-65, 94).
In 2002, Japan relied on imports to meet 96.7% of its domestic natural gas requirements and 99.7% of its crude petroleum requirements. Japan imported 76.1 billion cubic meters of natural gas in the form of LNG and 1,482 Mbbl of crude petroleum (Ministry of Economy, Trade and Industry, 2002d, p. 32-34, 94).
According to the Government trade statistics, imports of LNG totaled 53,877,618 t, or 80.7 billion cubic meters, and were valued at $11.9 billion in 2002. The suppliers of LNG were
Indonesia (32.3%), Malaysia (19.8%), Australia (13.4%), Qatar (11.6%), Brunei (10.9%), the United Arab Emirates (8.2%), the United States (2.3%), and Oman (1.5%) (Ministry of Finance, 2002b, p.177). Crude petroleum imports were mainly from the Middle East (86.0%) and Asia (7.8), which included China and Southeast Asia. The major suppliers of crude petroleum were the United Arab Emirates (23.8%), Saudi Arabia (22.6%), Iran (12.7%), Qatar (9.6%), Kuwait (7.4%), Oman (5.3%), Neutral Zone (the area shared equally by Kuwait and Saudi Arabia) (4.3%), Indonesia (3.9%), and China (1.7%) (Ministry of Economy, Trade and Industry, 2002d, p. 32-34). Imports of crude petroleum were valued at $36.3 billion (Ministry of Finance, 2002b, p. 172-173). The average monthly import c.i.f. price per barrel of crude petroleum was $24.63 in 2002 compared with $25.34 in 2001, and the average monthly import c.i.f. price per ton of LNG was $220.58 (27,659 yen) in 2002 compared with $237.85 (28,899 yen) in 2001 (Ministry of Economy, Trade, and Industry, 2002d, p. 122-123).
In 2002, refined petroleum products were produced by 18 oil companies that operated 32 refineries with a total capacity of 4.77 million barrels per day mostly along the eastern coast of Honshu (Oil & Gas Journal, 2002b).
In 2002, domestic demand for refined petroleum, by product, was as follows: heavy fuel oil, 413 Mbbl; gasoline, 375 Mbbl; naphtha, 300 Mbbl; diesel (distillate fuel oil), 250 Mbbl; kerosene, 184 Mbbl; asphalt, 32 Mbbl; jet fuel, 30 Mbbl; lubricants, 17 Mbbl; and paraffin, 905,600 barrels (bbl). To meet its domestic demand, Japan imported a total of 233 Mbbl of refined petroleum products in 2002. The imported refined petroleum products included 188 Mbbl of naphtha, 16 Mbbl of kerosene, 11 Mbbl of gasoline, 10 Mbbl of heavy fuel oil, 7 Mbbl of diesel, 642,000 bbl of jet fuel, 195,000 bbl of lubricants, 82,000 bbl of asphalt, and 38,900 bbl of paraffin (Ministry of Economy, Trade and Industry, 2002d, p. 68-69).
In 2002, consumption of domestically produced natural gas was by the gas industry (50.3%), the electric power industry (17.8%), the oil and gas industry (13.7%), the chemical industry (12.4%), and other manufacturing and service industries (5.8%). Additionally, Japan consumed 50.9 Mt, or 76.2 billion cubic meters, of imported natural gas in the form of LNG, of which about 69% was consumed by the electric power industry for power generation; 30%, for city gas industry; and 1%, for industrial use mainly by the iron and steel industry (Ministry of Economy, Trade and Industry, 2002d, p. 28-29, 95).
At the end of 2002, Japan’s stockpile of crude petroleum, partially refined, and refined petroleum products totaled 171 days supply, of which the national stockpile was 92 days and the private stockpile, 78 days (Ministry of Economy, Trade and Industry, 2002d, p. 122-123).
Reserves
Japan’s reserves of limestone and other industrial minerals, such as dolomite, iodine, pyrophyllite, and silica stone, are large. Coal reserves were substantial and very costly to produce in Japan. With the exception of gold and zinc, the country’s ore reserves for metallic minerals and other minerals, especially oil and gas, are negligible (table 3).
13.14 U.S. GEOLOGICAL SURVEY MINERALS YEARBOOK—2002
Infrastructure
Japan had one of the most modern and complete infrastructures for its mining and mineral-processing industries in the world. Despite its small land area, Japan had a highway system of 1.15 million kilometers, of which 863,003 km was paved. The railroad network had 23,654 km, of which 20,491 km was 1.067-meter (m) narrow gauge (12,732 km electrified), 3,059 km was 1.435-m standard gauge (all electrified), 77 km is 1.372-m narrow gauge (all electrified), and 27 km is 0.762-m narrow gauge (all electrified). Highway and railroad networks link all major seaports and coastal cities on the four major islands. The networks also connect Honshu to the islands of Kyushu and Shikoku in the south and Hokkaido in the north by means of bridges and tunnels.
Japan’s domestic and international telecommunication services were among the best in the world with satellite earth stations—five Intelsat (four Pacific Ocean and one Indian Ocean), one Intersputnik (Indian Ocean region), and one Inmarsat (Indian and Pacific Ocean regions); submarine cables to China, the Philippines, Russia, and the United States (via Guam); and 73 Internet service providers (2000). For electric power transmission, Japan had a route length of 94,000 km and a circuit length of 166,000 km (2001). For power distribution, Japan’s total length of line distances, which included high- and low-voltage, was 1.23 Mkm (2001); this was concentrated in the major industrial areas of Fukuoka, Hiroshima, Nagoya, Osaka, Takamatsu, Tokyo, and Toyama. Japan also had an extensive pipeline system—natural gas, 1,800 km; refined petroleum products, 322 km; and crude petroleum, 84 km.
Japan had 25 major ports and more than 2,000 minor ports to receive raw materials from overseas and to export manufactured products. The major port facilities, which included the terminals and warehouses, were among the most indispensable parts of the infrastructure for the mineral industry because of their role in receiving imported raw materials, such as coal, crude petroleum, iron ore, LNG, nonferrous ore, and phosphate rock for mineral-processing plants and powerplants, as well as exporting value-added mineral and metal products. The important seaports of the major mineral processing centers were Akita, Amagasaki, Chiba, Hachinohe, Higashi-Harima, Himeji, Hiroshima, Kawasaki, Kinuura, Kobe, Kushiro, Mizushima, Moji, Nagoya, Osaka, Sakai, Sakaide, Shimizu, Tokyo, and Yokohama on Honshu; Fukuoka, Kita Kyushu, and Oita on Kyushu; and Hakodate, Muroran, and Tomakomai on Hokkaido.
Japan had 173 airports (2001); of those, 142 had paved runways and 31, unpaved runways. Japan also had 16 heliports (2001). The major international airports were Fukuoka, Haneda (Tokyo), Kansai, Nagoya, Narita (New Tokyo), and Osaka. Japan’s round-the-clock airport, Kansai International, which opened in September 1994 sits on reclaimed offshore land in Osaka Bay.
Outlook
The Japanese economic recovery is expected to continue at a slow pace in 2003. The domestic mining activities are expected to hold steady in 2003 at about the same level as that in 2002.
Metal production of copper and zinc is expected to increase slightly when the Japanese economy recovers. Demand for nonferrrous metals in the domestic markets in 2003 is expected to be stronger than that of 2002. Production of crude steel is also expected to increase to more than the 110-Mt level because of the continued recovery in the Japanese economy and the economies of the Southeast Asian nations in 2003. Production of titanium sponge metal is expected to continue the 2002 downward trend or to remain at the same level as that of 2002 because of slow recovery of commercial airlines business, particularly in the United States. Production of cement and limestone is expected to continue the 2002 downward trend because of the continuing weak domestic demand owing to decreasing Government spending for public works projects.
To sustain its economic health and to prevent another economic recession, Japan is expected to continue exporting more ferrous and nonferrous metals and cement clinker and cement to China, the Republic of Korea, Taiwan, and ASEAN countries where the economies are expected to continue to improve in the coming years. Imports of coal, nonferrous metals, and other minerals are expected to increase slightly in 2003 when the activities of the manufacturing move to higher gear in 2003.
In line with its mineral policy to secure and diversify its long-term supply of raw materials, thus ensuring a steady economic growth, Japan is expected to continue its active search for direct investment in joint exploration and development of minerals in developed and developing countries, especially in Australia, Canada, Chile, China, Indonesia, Mexico, Peru, the Philippines, and the United States. The targeted minerals were antimony, chromium, coal, columbium (niobium), copper, gold, iron ore, lead, lithium, manganese, molybdenum, natural gas, nickel, crude petroleum, rare earths, silver, strontium, tantalum, titanium, tungsten, vanadium, and zinc.
References Cited
Arumu Publishing Co. Ltd., 2003, [Industrial rare metals]: Annual Review, no. 119, July, 138 p.
International Nickel Study Group, 2003, World nickel statistics: The Hague, Netherlands, International Nickel Study Group Monthly Bulletin, v. 8, no. 5, May, 76 p.
Japan Aluminum Association, 2003, Aluminum statistical yearbook 2002: Tokyo, Japan, Japan Aluminum Association, October 1, 68 p.
Japan Iron and Steel Federation, 2003, Monthly report of the iron and steel statistics: Tokyo, Japan, Japan Iron and Steel Federation, v. 46, no. 6, August, 27 p.
Japan Metal Review, 2002a, Dowa Mining expands its recycling treatment points in Kansai area: Japan Metal Review, no. 1,415, April 18, p. 4-5.
Japan Metal Review, 2002b, Mitsubishi Materials suspended lead production at Hosokura: Japan Metal Review, no. 1,421, June 6, p. 4.
Japan Metal Review, 2002c, Nippon M&M tied up with Codelco on bio-leaching method for SX-EW process: Japan Metal Review, no. 1,421, June 6, p. 2.
Marubeni Corp., 2001, Sources of imported primary aluminum (fiscal year base): Tokyo, Japan, Marubeni Corp., October 31, 1 p.
Metal Bulletin, 2002a, Control not competition—NKK and Kawasaki mark merger launch: Metal Bulletin, no. 8711, September 30, p. 17.
Metal Bulletin, 2002b, Japanese set to renew Al supply from VENALUM: Metal Bulletin, no. 8723, November 11, p. 4.
Metal Bulletin, 2002c, Kobe Steel sells Sept-Iles smelter stake: Metal Bulletin, no. 8690, July 11, p. 4.
Metal Bulletin, 2002d, Mitsubishi secures South Africa charge chrome producer: Metal Bulletin, no. 8696, August 5, p. 7.

THE MINERAL INDUSTRY OF JAPAN—2002 13.15
Metal Bulletin, 2002e, Nippon and Mitsui proceed with copper merger: Metal Bulletin, no. 8679, June 3, p. 6.
Metal Bulletin, 2002f, Sumitomo Sitex completes expansion, sets up IPO: Metal Bulletin, no. 8648, February 11, p. 9.
Metal Bulletin, 2002g, Sumitomo Titanium completes upgrade at Amagasaki: Metal Bulletin, no. 8657, March 14, p. 6.
Metal Bulletin, 2002h, Sumitomo to add 30,000 tpy copper capacity: Metal Bulletin, no. 8685, June 24, p. 5.
Metal Bulletin, 2002i, VENALUM strike deal with Japanese partners: Metal Bulletin, no. 8724, November 14, p. 5.
Metal Bulletin 2003, Japan’s big six may exceed their expectations: Metal Bulletin, no. 8755, March 10, p. 23.
Metal Bulletin Monthly, 2002, Japanese merger creates Asian waves: Metal Bulletin Monthly, issue 376, April, p. 41-45.
Metal Mining Agency of Japan, 2002a, Mineral exploration projects of ODA in 2002 by MMAJ: Tokyo, Japan, Metal Mining Agency of Japan, July 15, 2 p.
Metal Mining Agency of Japan, 2002b, Japanese companies overseas mineral exploration projects which MMAJ supported: Tokyo, Japan, Metal Mining Agency of Japan, September 19, p. 1.
Mining Journal, 2002a, Codelco and Nippon in biotech jv—Technology today: Mining Journal, v. 339, no. 8694, July 19, p. 44.
Mining Journal 2002b, Japanese coal-tax threat—Mineral markets: Mining Journal, v. 339, no. 8701, September 6, p. 172.
Mining Journal, 2002c, Japanese interest in Goro: Mining Journal, v. 339, no. 8707, October 18, p. 265.
Mining Journal, 2002d, Kobe sells Alouette stake, offer other, industry in action—Development: Mining Journal, v. 339, no. 8693, July 12, p. 30.
Mining Journal, 2002e, Sumitomo interested in Goro deal: Mining Journal, v. 338, no. 8686, May 24, p. 378.
Mining Journal, 2002f, Sumitomo plans nickel boost: Mining Journal, v. 339, no. 8700, August 30, p. 153.
Ministry of Economy, Trade and Industry, 2002a, Yearbook of ceramics and building materials statistics: Tokyo, Japan, Ministry of Economy, Trade and Industry, June 30, 132 p.
Ministry of Economy, Trade and Industry, 2002b, Yearbook of chemical industries statistics: Tokyo, Japan, Ministry of Economy, Trade and Industry, June 30, 257 p.
Ministry of Economy, Trade and Industry, 2002c, Yearbook of iron and steel, non-ferrous metal and fabricated metals statistics: Tokyo, Japan, Ministry of Economy, Trade and Industry, June 30, 304 p.
Ministry of Economy, Trade and Industry, 2002d, Yearbook of mineral resources and petroleum products statistics: Tokyo, Japan, Ministry of Economy, Trade and Industry, July 15, 134 p.
Ministry of Finance, 2002a, Japan imports and exports—Commodity by country: Tokyo, Japan, Ministry of Finance, December, export portion, 1,209 p.
Ministry of Finance, 2002b, Japan imports and exports—Commodity by country: Tokyo, Japan, Ministry of Finance, December, import portion, 955 p.
Nikkei Weekly, 2002a, Nickel prospecting, Japanese companies in Philippines: Nikkei Weekly, v. 40, no. 2,020, March 25, p. 18.
Nikkei Weekly, 2002b, Rare metal recycling, Japanese companies at home: Nikkei Weekly, v. 40, no. 2,019, March 18, p. 8.
Nikkei Weekly, 2002c, Steelmakers form iron triangle: Nikkei Weekly, v. 40, no. 2,056, November 18, p. 2.
Nikkei Weekly, 2002d, Steelmakers form productive links: Nikkei Weekly, v. 40, no. 2,053, October 25, p. 8.
Oil & Gas Journal, 2002a, Worldwide look at reserves and production: Oil & Gas Journal, v. 100, no. 52, December 263 p. 113-115.
Oil & Gas Journal, 2002b, Worldwide refineries—Capacities as of January 1, 2003: Oil & Gas Journal, v. 100, no. 52, December 23, p. 86-88.
Santoy Resources Ltd., 2002, First phase results for Tropico project: Vancouver, British Columbia, Canada, Santory Resources Ltd., press release, March 2, 1 p.
van Oss, H.G., 2003, Cement: U.S. Geological Survey Mineral Commodity Summaries 2003, p. 42-43.
Internet References Cited
Agency for Natural Resources and Energy, 2003, Development of coal policy responding to new task, Measure and Policies/Coal Policy, accessed October 7, 2003, at URL http://www.enecho.meti.go.jp/english/policy/coal/development.html.
Almaden Minerals Ltd., 2002 (April 5), Sumitomo to proceed with Tropico project joint venture, News Release, accessed September 26, 2002, at URL http://www.almdenminerals.com/News%20releases/2002/apri05-02.html.
Economic and Social Research Institute, 2003a, Development of real GDP, accessed September 24, 2003, at URL http://www.esri.cao.go.jp/jp/sna/qe032-2/rnen.html
Economic and Social Research Institute, 2003b, Gross domestic product and factor income classified by economic activities at constant prices, accessed September 24, 2003, via URL http://www.esri.cao.go.jp/en/h15-nenpou/4support/02real.htm.
Environmental Finance News, 2002 (October), Japan coal tax looms over mining sector, accessed October 31, 2003, at URL http://www.environmental-finance.com/2002/02oct/news.htm.
International Iron and Steel Institute, 2003a, The largest steel-producing companies, 2001 and 2002, accessed October 27, 2002, via URL http://www.worldsteel.org/media/wsif/wsif2003.pdf.
International Iron and Steel Institute, 2003b, The major steel-producing countries, 2001 and 2002, accessed October 27, 2003, via URL http://www.worldsteel.org/media/wsif/wsif2003.pdf.
Japan Cement Association, 2003a, Outline, accessed October 30, 2003, at URL http://www.jcassoc.or.jp/jac/english/ue_01.html.
Japan Cement Association, 2003b, Production, sales, consumption, accessed October 30, 2003, at URL http://www.jcassoc.or.jp/jac/english/ ue_04_010.html.
Japan for Sustainability, 2002a (July 5), Japan enacted automobile recycling law, Information Center, accessed December 2, 2002, via URL http://www.japanfs.org/db/database.cgi.
Japan for Sustainability, 2002b (May 28), Law enacted to prevent soil contamination, Information Center, accessed December 2, 2002, via URL http://japanfs.org.jp/db/database.cgi.
Japan Institute for Social and Economic Affairs (Keizai Koho Center), 2003, Real GDP in constant US dollars, accessed October 3, 2003, at URL http://www.kkc-usa.org/index.cfm/1745.
Japan Institute of Labor, 2003, Main labor economic indicators, accessed October 3, 2003, via URL http://www.jil.go.jp/english/estatis/eshuyo/200310/index.
Japan Iron and Steel Federation, 2003, Steel trade, The Steel Industry of Japan 2003, accessed September 29, 2003, at URL http://www.jisf.or.jp/sij/steeltrade.html.
Japan Metal Bulletin, 2002a (April 23), Dowa Mining stats pilot operations of car shredder dust treatment plant, accessed April 24, 2002, at URL http://www,japanmetalbulletin.com/news-nm/n20020423.html.
Japan Metal Bulletin, 2002b (May 31), Nippon Mining, Mitsui Mining enhancing ties via PPC, accessed October 29, 2002, at URL http://www.japanmetalbulletin.com/news-nm/n200205031.ntml.
Japan Metal Bulletin, 2002c (February 20), Sumitomo Metal Mining set to slash costs by 14 billion yen, accessed April 1, 2002, at URL http://www.japanmetalbulletin.com/news-mn/n20020220.html.
Marubeni Corp., 2002 (September 30), Marubeni joins the expansion of Aluminerie Alouette’s expansion project, News, accessed October 28, 2002, at URL http://www.marubeni.co.jp/english/news/nl1020930.htm.
Resources Development Council for Alaska, Inc., 2003, Action alert—Pogo gold mining project, accessed October 22, 2003, at URL http://akrde.org/alerts/pogo.html.
Statistical Handbook of Japan, 2003, Table 12.2—Employed persons by industry, accessed October 8, 2003, at URL http://www.stat.go.jp/english/data/handbook/c12cont.htm.
Sumitomo Chemical Co. Ltd. (July 17), 2001, Sumitomo Chemical to expand high-purity gallium production, News Release, accessed October 20, 2003, at URL http://www.sumitomo-chem.co.jp/english/e1newsrelease/pdf/20020717e.pdf.
Sumitomo Chemical Co. Ltd., 2002, IT-related chemical sector, annual report 2002, accessed October 21, 2003, at URL http://www.sumitomo-chem.co.jp/english/03invest/e3_2002/ar2002.pdf.
Taiheiyo Cement Corp., 2002 (April 11), Mid-term management plan, News Release, accessed November 3, 2003, at URL http://www.taiheiyo-cement.co.jp/english/news/020411.html.
Teck Cominco Ltd., 2002 (March 23), Pogo project technicals (Teck Cominco), accessed October 23, 2003, via URL http://www.teck.com/operations/pogo/technicals.htm.
U.S. Energy Information Administration, 2003, Japan, Country Analysis Briefs, accessed July 18, 2003, at URL http://www.eia.doe.gov/emeu/cabs/japan.html.

13.16 U.S. GEOLOGICAL SURVEY MINERALS YEARBOOK—2002
U.S. Environmental Protection Agency, 2002, Pogo Mine EIS, accessed October 22, 2003, via URL http://www.pogomineeis.com.
World Bank, 2003, Japan data profile, Data Profile Tables, accessed September 24, 2003, via URL http://www/worldbank.org/data/countrydata/countrydata.html.
Major Sources of Information
Ministry of Economy, Trade and IndustryEconomic and Industrial Policy BureauResearch and Statistics Department1-3-1 Kasumigaseki, Chiyoda-ku, Tokyo 100-8902, JapanTelephone: 81-3-3501-1511, extension 2868
Metal Mining Agency of JapanTokiwa Building, 1-24-14Toranomon, Minato-ku, Tokyo 105-0001, JapanTelephone: 81-3-5512-1300,Fax: 81-3-3503-0570
National Institute of Advanced Industrial Science and TechnologyGeological Survey of JapanAIST Tsukuba Central 7, Tsukuba, Ibaraki 305-8567, JapanTelephone: 81-2-9854-3513,Fax: 81-2-9854-3533
Major Publications
Arumu Publishing Co. Ltd., Tokyo:Industrial Rare Metals, Annual Review, annual.
Japan Aluminum Association, Tokyo:Light Metal Statistics in Japan, annual.
Japan Iron and Steel Federation, Tokyo:The Steel Industry of Japan, annual.
Japan Metal Review, Ltd., Tokyo:Japan Metal Review, weekly.
Japan Mining Industry Association, Tokyo:Bulletin of Japan Mining Industry Association, monthly.
Metal Mining Agency of Japan, Tokyo:Annual report, annual.
Ministry of Economy, Trade and Industry, Tokyo:Yearbook of Minerals and Nonferrous Metals Statistics.Yearbook of Iron and Steel Statistics.Yearbook of Iron and Steel, Nonferrous Metal and Fabricated
Metals Statistics (2002 onward).Yearbook of Production, Supply and Demand of Petroleum,
Coal and Coke Statistics.Yearbook of Minerals Resources and Petroleum Products
Statistics (2002 onward).Yearbook of Ceramics and Building Materials Statistics.Yearbook of Chemical Industries Statistics.
Ministry of Finance, Tokyo:Japan Exports & Imports, Commodity by Country, monthly.
Nihon Keizai Shimbun, Inc., Tokyo:Japan Economic Almanac, annual.The Nikkei Weekly.
Petroleum Association of Japan, Tokyo:PAJ Annual Review, annual.
Research Institute of Economy, Trade and Industry, Tokyo:Mining Handbook (Kogyo Benran), annual.
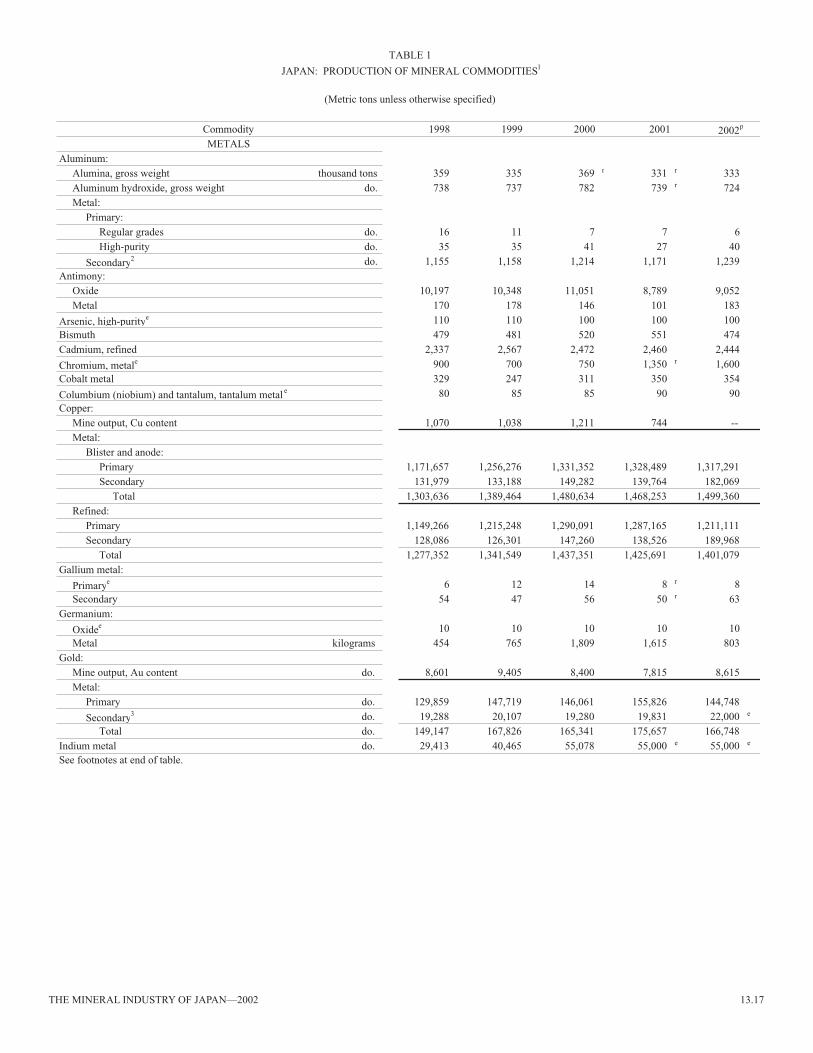
THE MINERAL INDUSTRY OF JAPAN—2002 13.17
Commodity 1998 1999 2000 2001 2002p
METALSAluminum:
Alumina, gross weight thousand tons 359 335 369 r 331 r 333Aluminum hydroxide, gross weight do. 738 737 782 739 r 724Metal:
Primary:Regular grades do. 16 11 7 7 6High-purity do. 35 35 41 27 40
Secondary2 do. 1,155 1,158 1,214 1,171 1,239Antimony:
Oxide 10,197 10,348 11,051 8,789 9,052Metal 170 178 146 101 183
Arsenic, high-puritye 110 110 100 100 100Bismuth 479 481 520 551 474Cadmium, refined 2,337 2,567 2,472 2,460 2,444
Chromium, metale 900 700 750 1,350 r 1,600Cobalt metal 329 247 311 350 354
Columbium (niobium) and tantalum, tantalum metal e 80 85 85 90 90Copper:
Mine output, Cu content 1,070 1,038 1,211 744 -- Metal:
Blister and anode:Primary 1,171,657 1,256,276 1,331,352 1,328,489 1,317,291Secondary 131,979 133,188 149,282 139,764 182,069
Total 1,303,636 1,389,464 1,480,634 1,468,253 1,499,360Refined:
Primary 1,149,266 1,215,248 1,290,091 1,287,165 1,211,111Secondary 128,086 126,301 147,260 138,526 189,968
Total 1,277,352 1,341,549 1,437,351 1,425,691 1,401,079Gallium metal:
Primarye 6 12 14 8 r 8Secondary 54 47 56 50 r 63
Germanium:
Oxidee 10 10 10 10 10Metal kilograms 454 765 1,809 1,615 803
Gold:Mine output, Au content do. 8,601 9,405 8,400 7,815 8,615Metal:
Primary do. 129,859 147,719 146,061 155,826 144,748
Secondary3 do. 19,288 20,107 19,280 19,831 22,000 e
Total do. 149,147 167,826 165,341 175,657 166,748Indium metal do. 29,413 40,465 55,078 55,000 e 55,000 e
TABLE 1
JAPAN: PRODUCTION OF MINERAL COMMODITIES 1
(Metric tons unless otherwise specified)
See footnotes at end of table.

13.18 U.S. GEOLOGICAL SURVEY MINERALS YEARBOOK—2002
Commodity 1998 1999 2000 2001 2002p
METALS--ContinuedIron and steel:
Iron ore and iron sand concentrate:Gross weight 1,720 1,450 1,454 750 700 e
Fe content 699 589 523 258 240 e
Metal:Pig iron and blast furnace ferroalloys thousand tons 74,981 74,520 81,071 78,836 80,979Electric-furnace ferroalloys:
Ferrochrome 142,931 119,777 130,074 111,167 91,937Ferromanganese 334,081 315,152 337,694 368,293 356,717Ferronickel 345,772 332,293 367,181 367,739 370,973Ferrosilicon 951 1,452 -- -- -- Silicomanganese 70,886 65,744 67,926 62,238 70,965Other:
Ferromolybdenum 3,443 3,391 3,699 3,485 2,375Ferrotungsten 61 43 42 109 9Ferrovanadium 4,073 3,349 4,108 3,613 3,592Unspecified 1,101 6,077 7,171 5,733 6,376
Total 903,299 847,278 917,895 922,377 902,944Steel, crude thousand tons 93,548 94,192 106,444 102,866 107,745Semimanufactures, hot-rolled:
Ordinary steels do. 73,379 73,221 83,048 78,927 80,864Special steels do. 14,774 14,224 15,747 15,835 17,443
Lead:Mine output, Pb content 6,198 6,074 8,835 4,997 5,723Metal, refined:
Primary 144,542 125,514 129,469 127,358 107,744Secondary 157,555 167,915 182,209 175,088 178,016
Total 302,097 293,429 311,678 302,446 285,760Magnesium metal, secondary 7,807 7,732 10,000 e 10,000 e 9,000 e
Manganese, oxide 52,341 57,993 63,379 51,095 45,867Molybdenum metal 632 586 626 610 465Nickel metal:
Refined 29,397 30,481 36,230 32,526 32,303Ni content of nickel oxide sinter 25,435 34,482 47,020 49,600 48,950Ni content of ferronickel 69,202 67,166 74,753 68,113 r 74,418Ni content of chemical 2,511 2,570 2,721 r 2,394 r 1,820
Total 126,545 134,699 160,724 r 152,633 r 157,491Platinum-group metals:
Palladium metal kilograms 4,151 5,354 4,712 4,805 5,618Platinum metal do. 533 737 782 791 762
Rare-earth oxide4 4,728 5,092 5,619 5,109 5,423Selenium, elemental 550 546 612 735 752Silicon, high-purity 5,340 3,844 4,688 4,334 4,457Silver:
Mine output, Ag content kilograms 94,472 94,004 103,781 80,397 81,416Metal:
Primary do. 2,203,697 2,257,888 2,384,739 2,293,028 2,259,551
Secondary3 do. 415,757 503,938 345,358 303,804 320,000 e
Total do. 2,619,454 2,761,826 2,730,097 2,596,832 2,579,551Tellurium, elemental 39 35 36 39 29Tin, metal, smelter 500 568 593 668 659
(Metric tons unless otherwise specified)
JAPAN: PRODUCTION OF MINERAL COMMODITIES 1
See footnotes at end of table.
TABLE 1--Continued

THE MINERAL INDUSTRY OF JAPAN—2002 13.19
Commodity 1998 1999 2000 2001 2002p
METALS--ContinuedTitanium:
Dioxide 251,275 269,193 270,272 256,961 240,469Metal 24,182 18,898 19,458 24,815 22,500
Tungsten metal 4,082 4,357 4,993 3,607 3,302
Vanadium metale, 5 250 250 250 250 250Zinc:
Mine output, Zn content 67,670 64,263 63,601 44,519 42,851Oxide 77,183 78,928 82,816 75,414 74,515Metal:
Primary 513,916 524,979 541,704 541,277 547,183Secondary 138,771 158,637 157,047 142,777 126,723
Total 652,687 683,616 698,751 684,054 673,906 Zirconium oxide 7,270 7,660 8,540 7,930 8,500 e
INDUSTRIAL MINERALS
Asbestose 18,000 18,000 18,000 18,000 18,000
Bromine, elementale 15,000 15,000 15,000 15,000 20,000Cement, hydraulic thousand tons 81,328 80,120 81,097 76,550 71,828Clays:
Bentonite 443,566 428,247 415,115 405,738 400,000 e
Fire clay, crude 577,666 558,110 506,314 475,665 480,000 e
Kaolin 83,257 53,092 25,739 19,976 19,000 e
Diatomitee 190,000 190,000 190,000 180,000 180,000
Feldspar and related materials:e
Feldspar 50,000 52,000 52,000 50,000 50,000Aplite 310,000 330,000 330,000 310,000 300,000
Gypsum thousand tons 5,305 5,549 5,917 5,874 5,644Iodine, elemental 6,142 6,152 6,157 6,643 6,548Lime, quicklime thousand tons 7,646 7,594 8,106 7,586 r 7,420Nitrogen, N content of ammonia do. 1,389 1,385 1,410 1,318 1,192
Perlitee 251,000 260,000 250,000 255,000 250,000Salt, all types thousand tons 1,293 1,327 1,374 1,358 r 1,350 e
Silica sand do. 6,650 r 6,088 r 6,121 r 5,768 r 4,884Silica stone, quartzite do. 16,235 15,548 15,578 14,213 13,571Sodium compounds, n.e.s.:
Soda ash 721,747 721,752 669,203 461,204 460,000 e
Sulfate 177,407 174,139 163,057 146,780 137,713Stone, crushed and broken:
Dolomite thousand tons 3,873 3,648 3,539 3,389 3,450Limestone do. 183,955 180,193 185,569 182,255 171,948
Sulfur:S content of pyrite do. 23 41 30 30 20Byproduct of metallurgy do. 1,322 1,363 1,384 1,319 1,326Byproduct of petroleum do. 2,081 2,054 2,071 2,024 r 1,865
Talc and related materials:
Talce 50,000 50,000 50,000 45,000 40,000Pyrophyllite 764,099 694,317 692,998 623,097 600,000 e
Vermiculitee 15,000 15,000 15,000 15,000 15,000See footnotes at end of table.
JAPAN: PRODUCTION OF MINERAL COMMODITIES 1
(Metric tons unless otherwise specified)
TABLE 1--Continued
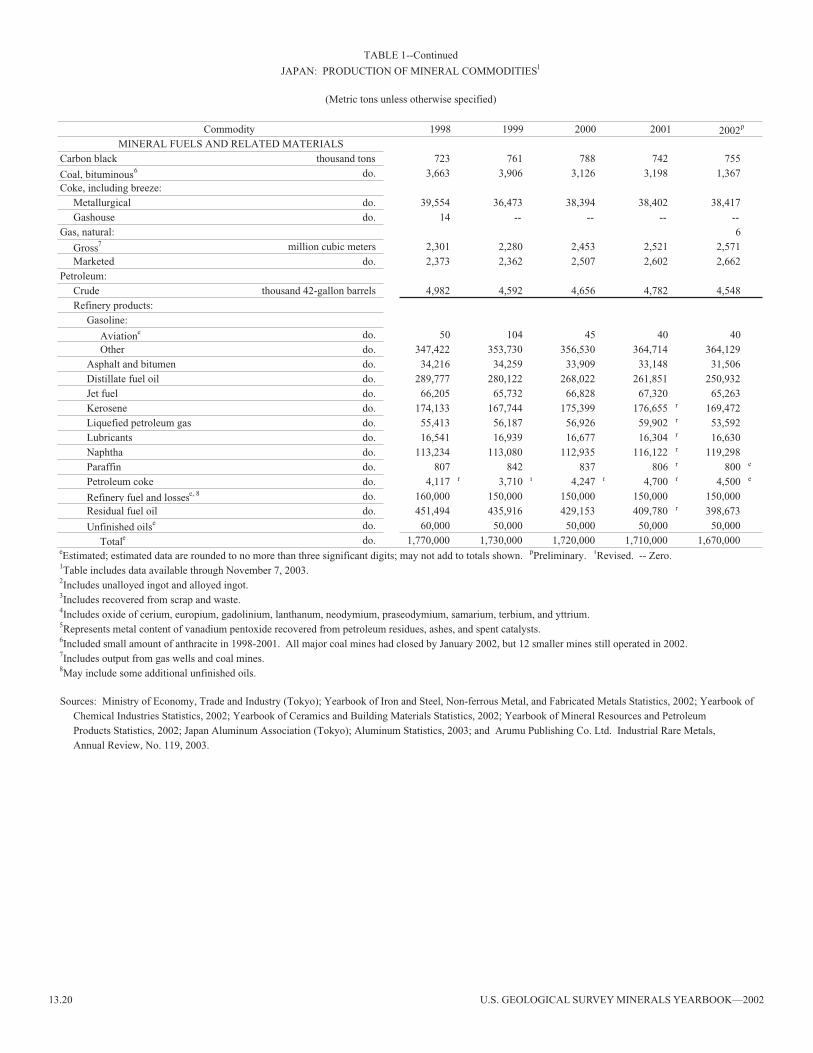
13.20 U.S. GEOLOGICAL SURVEY MINERALS YEARBOOK—2002
Commodity 1998 1999 2000 2001 2002p
MINERAL FUELS AND RELATED MATERIALSCarbon black thousand tons 723 761 788 742 755
Coal, bituminous6 do. 3,663 3,906 3,126 3,198 1,367Coke, including breeze:
Metallurgical do. 39,554 36,473 38,394 38,402 38,417Gashouse do. 14 -- -- -- --
Gas, natural: 6
Gross7 million cubic meters 2,301 2,280 2,453 2,521 2,571Marketed do. 2,373 2,362 2,507 2,602 2,662
Petroleum:Crude thousand 42-gallon barrels 4,982 4,592 4,656 4,782 4,548Refinery products:
Gasoline:
Aviatione do. 50 104 45 40 40Other do. 347,422 353,730 356,530 364,714 364,129
Asphalt and bitumen do. 34,216 34,259 33,909 33,148 31,506Distillate fuel oil do. 289,777 280,122 268,022 261,851 250,932Jet fuel do. 66,205 65,732 66,828 67,320 65,263Kerosene do. 174,133 167,744 175,399 176,655 r 169,472Liquefied petroleum gas do. 55,413 56,187 56,926 59,902 r 53,592Lubricants do. 16,541 16,939 16,677 16,304 r 16,630Naphtha do. 113,234 113,080 112,935 116,122 r 119,298Paraffin do. 807 842 837 806 r 800 e
Petroleum coke do. 4,117 r 3,710 r 4,247 r 4,700 r 4,500 e
Refinery fuel and lossese, 8 do. 160,000 150,000 150,000 150,000 150,000Residual fuel oil do. 451,494 435,916 429,153 409,780 r 398,673
Unfinished oilse do. 60,000 50,000 50,000 50,000 50,000
Totale do. 1,770,000 1,730,000 1,720,000 1,710,000 1,670,000
JAPAN: PRODUCTION OF MINERAL COMMODITIES 1
(Metric tons unless otherwise specified)
TABLE 1--Continued
Annual Review, No. 119, 2003.
eEstimated; estimated data are rounded to no more than three significant digits; may not add to totals shown. pPreliminary. rRevised. -- Zero.1Table includes data available through November 7, 2003.2Includes unalloyed ingot and alloyed ingot.3Includes recovered from scrap and waste.4Includes oxide of cerium, europium, gadolinium, lanthanum, neodymium, praseodymium, samarium, terbium, and yttrium.5Represents metal content of vanadium pentoxide recovered from petroleum residues, ashes, and spent catalysts.6Included small amount of anthracite in 1998-2001. All major coal mines had closed by January 2002, but 12 smaller mines still operated in 2002.
Products Statistics, 2002; Japan Aluminum Association (Tokyo); Aluminum Statistics, 2003; and Arumu Publishing Co. Ltd. Industrial Rare Metals,
7Includes output from gas wells and coal mines.8May include some additional unfinished oils.
Sources: Ministry of Economy, Trade and Industry (Tokyo); Yearbook of Iron and Steel, Non-ferrous Metal, and Fabricated Metals Statistics, 2002; Yearbook of Chemical Industries Statistics, 2002; Yearbook of Ceramics and Building Materials Statistics, 2002; Yearbook of Mineral Resources and Petroleum

THE MINERAL INDUSTRY OF JAPAN—2002 13.21
TABLE 2JAPAN: STRUCTURE OF THE MINERAL INDUSTRY IN 2002
(Thousand metric tons unless otherwise specified)
Major operating companies AnnualCommodity and major equity owners Location of main facilities capacity
Cement Aso Cement Co. Ltd. Tagawa and Kanda, Fukuoka Prefecture 3,000Do. Daiichi Cement Co. Ltd. Kawasaki, Kanagawa Prefecture 1,169Do. Denki Kagaku K.K. Omi, Niigata Prefecture 2,762Do. Hachinohe Cement Co. Ltd. Hachinohe, Aomori Prefecture 1,533Do. Hitachi Cement Co. Ltd. Hitachi, Ibaraki Prefecture 941Do. Mitsubishi Materials Corp. Higashidori, Shimokita-gun, Apmori Prefecture; 13,467
Higashiyama, Higashiiwai-gun, Iwate Prefecture; Yokoze, Saitama Prefecture; Kurosaki, Kyushu, and Higashitani, Fukuoka Prefecture
Do. Mitsui Mining Co. Ltd. Togawa, Fukuoka Prefecture 2,075Do. Myojo Cement Co. Ltd. Itoigawa, Niigata Prefecture 2,482Do. Nippon Steel Chemical Co. Ltd. Tobata, Kitakyushu, Fukuoka Prefecture 855Do. Nittetsu Cement Co. Ltd. Muroran, Hokkaido Prefecture 1,589Do. Ryukyu Cement Co. Ltd. Yabu, Nago, Okinawa Prefecture 722Do. Sumitomo Osaka Cement Co. Ltd. Tamura, Fukushima Prefecture; Aso, 14,402
Tochigi Prefecture; Motosu, Gifu Prefecture; Sakata, Shiga Prefecture; Ako, Hyogo Prefecture;and Susaki, Kochi Prefecture
Do. Taiheiyo Cement Corp. Ofunato, Iwate Prefecture; Chichibu, Kumagaya, 29,904and Saitama, Saitama Prefecture; Fujiwara, Mie Prefecture; Saiki and Tsukumi, Oita Prefecture; Kamiiso, Hokkaido Prefecture; Tosa, Kochi Precture; and Kawara, Fukuoka Prefecture
Do. Tokuyama Cement Co. Ltd. Nanyo, Yamaguchi Prefecture 5,936Do. Tosoh Corp. Shin Nanyo, Yamaguchi Prefecture 2,869Do. Tsuruga Cement Co. Ltd. Tsuruga, Fukui Prefecture 1,710Do. Ube Industries Ltd. Ube, Isa, Yamaguchi Prefecture; and Kanda, 10,736
Fukuoka PrefectureCoal Kushiro Coal Mine Co. Ltd.1 Kushiro, Hokkaido Prefecture 800Cobalt, refined metric tons Sumitomo Metal Mining Co. Ltd. Niihama, Ehime Prefecture 600Copper, refined do. Hibi Kyodo Smelting Co. Ltd. (Mitsui Mining and Tamano, Okayama Prefecture 218,400
Smelting Co. Ltd., 64%; Nittetsu Mining Co. Ltd., 20%; Furukawa Co. Ltd., 16%)
Do. do. Mitsubishi Materials Corp. Naoshima, Kagawa Prefecture 225,600Do. do. Nippon Mining and Metals Co. Ltd. (wholly owned Hitachi, Ibaraki Prefecture; Saganoseki, Oita 452,400
subsidiary of Nikko Kyodo Co. Ltd.) Prefecture Do. do. Onahama Smelting and Refining Co. Ltd. (Dowa Onahama, Fukushima Prefecture 258,000
Mining Co. Ltd., 31.15%; Furukawa Co. Ltd., 8.31%; Furukawa Electric Co. Ltd., 4.17%; Mitsubushi Materials Corp., 49.29%; Mitsubishi Cable Indutries, Ltd., 4.17%; others, 2.91%
Do. do. Sumitomo Metal Mining Co. Ltd. Besshi, Ehime Prefecture 270,000Do. do. Kosaka Smelting and Refining Co. Ltd. (wholly Kosaka, Akita Prefecture 72,000
owned subsidiary of Dowa Mining Co. Ltd.)Gold:
In concentrate kilograms Sumitomo Metal Mining Co. Ltd. Hishikari, Kagoshima Prefecture 9,000Refined do. Kosaka Smelting and Refining Co. Ltd. (wholly Kosaka, Akita Prefecture 18,000
owned subsidiary of Dowa Mining Co. Ltd.)Do. do. Mitsui Mining and Smelting Co. Ltd. Takehara, Hiroshima Prefecture 22,000Do. do. Mitsubishi Materials Corp. Naoshima, Kagawa Prefecture 60,000Do. do. Nippon Mining and Metals Co. Ltd. Hitachi, Ibaraki Prefecture 30,000Do. do. Sumitomo Metal Mining Co. Ltd. Niihama, Ehime Prefecture 36,000
See footnotes at end of table.
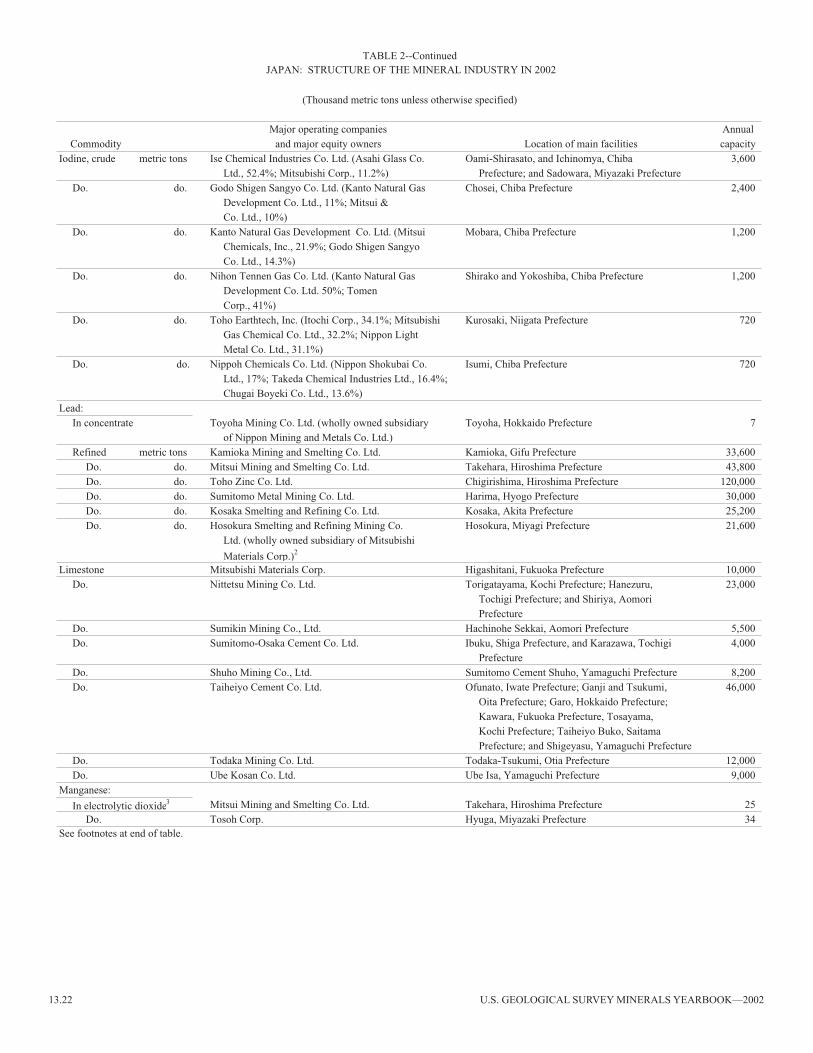
13.22 U.S. GEOLOGICAL SURVEY MINERALS YEARBOOK—2002
TABLE 2--Continued
(Thousand metric tons unless otherwise specified)
Major operating companies AnnualCommodity and major equity owners Location of main facilities capacity
Iodine, crude metric tons Ise Chemical Industries Co. Ltd. (Asahi Glass Co. Oami-Shirasato, and Ichinomya, Chiba 3,600Ltd., 52.4%; Mitsubishi Corp., 11.2%) Prefecture; and Sadowara, Miyazaki Prefecture
Do. do. Godo Shigen Sangyo Co. Ltd. (Kanto Natural Gas Chosei, Chiba Prefecture 2,400Development Co. Ltd., 11%; Mitsui & Co. Ltd., 10%)
Do. do. Kanto Natural Gas Development Co. Ltd. (Mitsui Mobara, Chiba Prefecture 1,200Chemicals, Inc., 21.9%; Godo Shigen Sangyo Co. Ltd., 14.3%)
Do. do. Nihon Tennen Gas Co. Ltd. (Kanto Natural Gas Shirako and Yokoshiba, Chiba Prefecture 1,200Development Co. Ltd. 50%; Tomen Corp., 41%)
Do. do. Toho Earthtech, Inc. (Itochi Corp., 34.1%; Mitsubishi Kurosaki, Niigata Prefecture 720Gas Chemical Co. Ltd., 32.2%; Nippon Light Metal Co. Ltd., 31.1%)
Do. do. Nippoh Chemicals Co. Ltd. (Nippon Shokubai Co. Isumi, Chiba Prefecture 720Ltd., 17%; Takeda Chemical Industries Ltd., 16.4%; Chugai Boyeki Co. Ltd., 13.6%)
Lead:In concentrate Toyoha Mining Co. Ltd. (wholly owned subsidiary Toyoha, Hokkaido Prefecture 7
of Nippon Mining and Metals Co. Ltd.)Refined metric tons Kamioka Mining and Smelting Co. Ltd. Kamioka, Gifu Prefecture 33,600
Do. do. Mitsui Mining and Smelting Co. Ltd. Takehara, Hiroshima Prefecture 43,800Do. do. Toho Zinc Co. Ltd. Chigirishima, Hiroshima Prefecture 120,000Do. do. Sumitomo Metal Mining Co. Ltd. Harima, Hyogo Prefecture 30,000Do. do. Kosaka Smelting and Refining Co. Ltd. Kosaka, Akita Prefecture 25,200Do. do. Hosokura Smelting and Refining Mining Co. Hosokura, Miyagi Prefecture 21,600
Ltd. (wholly owned subsidiary of Mitsubishi
Materials Corp.)2
Limestone Mitsubishi Materials Corp. Higashitani, Fukuoka Prefecture 10,000Do. Nittetsu Mining Co. Ltd. Torigatayama, Kochi Prefecture; Hanezuru, 23,000
Tochigi Prefecture; and Shiriya, Aomori Prefecture
Do. Sumikin Mining Co., Ltd. Hachinohe Sekkai, Aomori Prefecture 5,500Do. Sumitomo-Osaka Cement Co. Ltd. Ibuku, Shiga Prefecture, and Karazawa, Tochigi 4,000
PrefectureDo. Shuho Mining Co., Ltd. Sumitomo Cement Shuho, Yamaguchi Prefecture 8,200Do. Taiheiyo Cement Co. Ltd. Ofunato, Iwate Prefecture; Ganji and Tsukumi, 46,000
Oita Prefecture; Garo, Hokkaido Prefecture;Kawara, Fukuoka Prefecture, Tosayama, Kochi Prefecture; Taiheiyo Buko, Saitama Prefecture; and Shigeyasu, Yamaguchi Prefecture
Do. Todaka Mining Co. Ltd. Todaka-Tsukumi, Otia Prefecture 12,000Do. Ube Kosan Co. Ltd. Ube Isa, Yamaguchi Prefecture 9,000
Manganese:
In electrolytic dioxide3 Mitsui Mining and Smelting Co. Ltd. Takehara, Hiroshima Prefecture 25Do. Tosoh Corp. Hyuga, Miyazaki Prefecture 34
See footnotes at end of table.
JAPAN: STRUCTURE OF THE MINERAL INDUSTRY IN 2002

THE MINERAL INDUSTRY OF JAPAN—2002 13.23
TABLE 2--ContinuedJAPAN: STRUCTURE OF THE MINERAL INDUSTRY IN 2002
(Thousand metric tons unless otherwise specified)
Major operating companies AnnualCommodity and major equity owners Location of main facilities capacity
Nickel:In ferronickel metric tons Hyuga Smelting Co. Ltd. (wholly owned Hyuga, Miyazaki Prefecture 19,000
subsidiary of Sumitomo Metal Mining Co. Ltd.)Do. do. Nippon Yakin Kogyo Co. Ltd. Oheyama, Kyoto Prefecture 12,720Do. do. Pacific Metals Co. Ltd. Hachinohe, Aomori Prefecture 40,800
In oxide do. Tokyo Nickel Co. Ltd. Matsuzaka, Mie Prefecture 60,000Refined do. Sumitomo Metal Mining Co. Ltd. Niihama, Ehime Prefecture 36,000
Pyrophyllite Goto Kozan Co. Ltd. Goto, Nagasaki Prefecture 204Do. Ohira Kozan Co. Ltd. Ohira, Okayama Prefecture 132Do. Sankin Kogyo Co. Ltd. Otsue, Hiroshima Prefecture 72Do. Shinagawa Shirenga Co. Ltd. Mitsuishi, Okayama Prefecture 180Do. Shokozan Kogyosho Co. Ltd. Yano-Shokozan, Hiroshima Prefecture 180Do. Showa Kogyo Co. Ltd. Showa-Shokozan, Hiroshima Prefecture 60
Steel, crude Kawasaki Steel Corp. Mizushima, Okayama Prefecture, and Chiba, 17,405Chiba Prefecture
Do. Kobe Steel Ltd. Kakogawa and Kobe, Hyogo Prefecture 8,943Do. NKK Corp. Fukuyama, Hiroshima Prefecture, and Keihin, 16,430
Kanagaw PrefectureDo. Nippon Steel Corp. Oita, Oita Prefecture; Kawata, Fukuoka 33,199
Prefecture; Kimitsu, Chiba Prefecture; and Nagoya, Aichi Prefecture
Do. Sumitomo Metal Industries, Ltd. Kashima, Ibaraki Prefecture; Kokura, 12,820Fukuoka Prefecture; and Wakayama, Wakayama Prefecture
Titanium:In sponge metal Sumitomo Sitex Corp. (Sumitomo Metal Industries, Amagasaki, Hyogo Prefecture 18
Ltd., 92.4%; Kobe Steel Ltd., 7.6%)Do. Toho Titanium Co. Ltd. (Nippon Mining and Chigasaki, Kanagawa Prefecture 12
Metals Co. Ltd., 47%; Mitsui & Co. Ltd., 20%; others, 33%)
In dioxide metric tons Fuji Titanium Industry Co. Ltd. (Ishihara Sangyo Kobe, Hyogo Prefecture 17,400Kaishia Ltd., 24.8%; others, 75.2%)
Do. do. Furukawa Co. Ltd. Osaka, Osaka Prefecture 13,200Do. do. Ishihara Sangyo Kaisha Ltd. (Mitsui & Co. Ltd., 11%) Yokkaichi, Mie Prefecture 154,800Do. do. Sakai Chemical Industries Co. Ltd. Onahama, Fukushima Prefecture 60,000Do. do. Tayca Corp. Saidaiji, Okayama Prefecture 60,000Do. do. Titan Kogyo Kabushiki Kaisha Ube, Yamaguchi Prefecture 16,800Do. do. Tohkem Products Corp. Akita, Akita Prefecture 30,000
Zinc:In concentrate Toyoha Mining Co. Ltd. Toyoha, Hokkaido Prefecture 45Refined metric tons Akita Smelting Co. Ltd. (Dowa Mining Co. Ltd., 57%; Iijima, Akita Prefecture 200,400
Nippon Mining and Metals Co. Ltd., 24%; Sumitomo Metal Mining Co. Ltd., 14%; Mitsubushi Materials Corp., 5%)
Do. do. Hachinohe Smelting Co. Ltd. (Mitsui Mining Hachinohe, Aomori Prefecture 117,600and Smelting Co. Ltd., 57.7%; Nippon Mining and Metals Co. Ltd., 27.8%; Toho Zinc Co. Ltd.and Nisso Smelting Co. Ltd., 14.5%)
Do. do. Hikoshima Smelting Co. Ltd. Hikoshima, Yamaguchi Prefecture 84,000Do. do. Kamioka Mining and Smelting Co. Ltd. Kamioka, Gifu Prefecture 72,000Do. do. Toho Zinc Co. Ltd. Annaka, Gunma Prefecture 139,200Do. do. Sumitomo Metal Mining Co. Ltd. Harima, Hyogo Prefecture 90,000
3Japan Metal & Chemical Co. Ltd. ceased operations of its Takaoka plant at the end of 2001.
1Coal mining operation continued, following establishment of Kushiro Coal Mining Co. Ltd. in 2002.2Mitsubishi Materials Corp. suspended operations of its secondary lead smelter at Hosokura in June 2002.
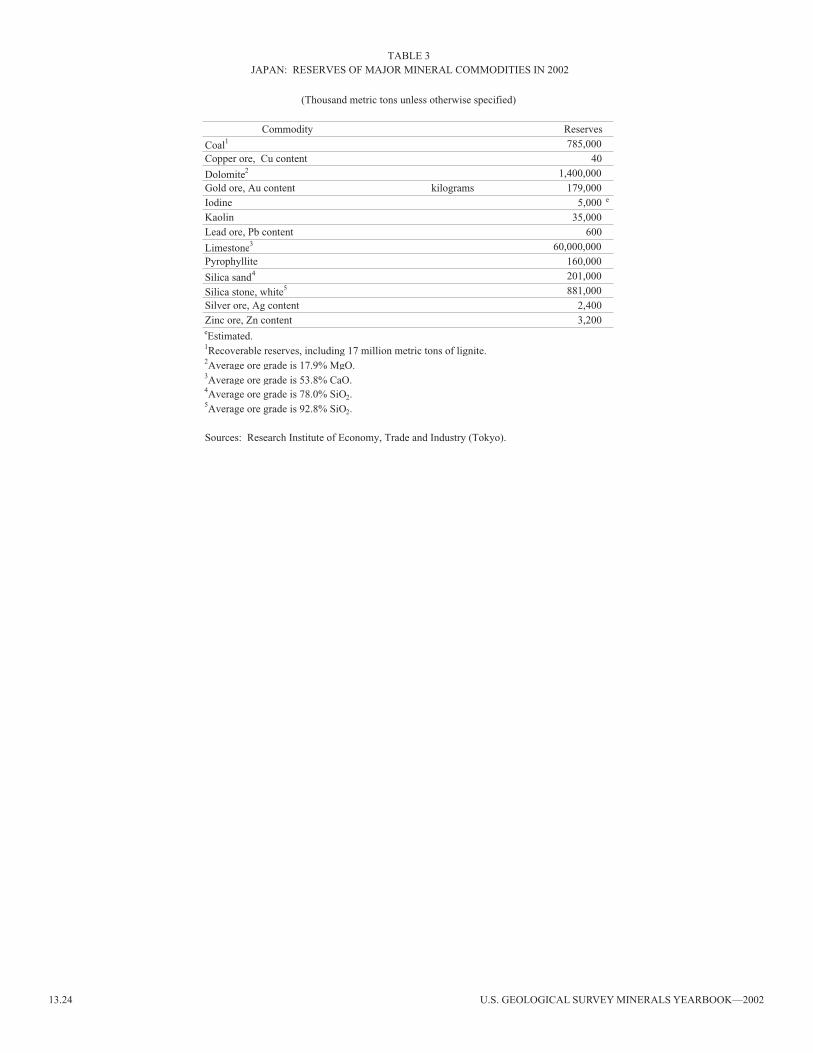
13.24 U.S. GEOLOGICAL SURVEY MINERALS YEARBOOK—2002
TABLE 3
(Thousand metric tons unless otherwise specified)
Commodity Reserves
Coal1 785,000Copper ore, Cu content 40
Dolomite2 1,400,000Gold ore, Au content kilograms 179,000Iodine 5,000 e
Kaolin 35,000Lead ore, Pb content 600
Limestone3 60,000,000Pyrophyllite 160,000
Silica sand4 201,000
Silica stone, white5 881,000Silver ore, Ag content 2,400Zinc ore, Zn content 3,200eEstimated.1Recoverable reserves, including 17 million metric tons of lignite.2Average ore grade is 17.9% MgO.3Average ore grade is 53.8% CaO.4Average ore grade is 78.0% SiO2.5Average ore grade is 92.8% SiO2.
Sources: Research Institute of Economy, Trade and Industry (Tokyo).
JAPAN: RESERVES OF MAJOR MINERAL COMMODITIES IN 2002
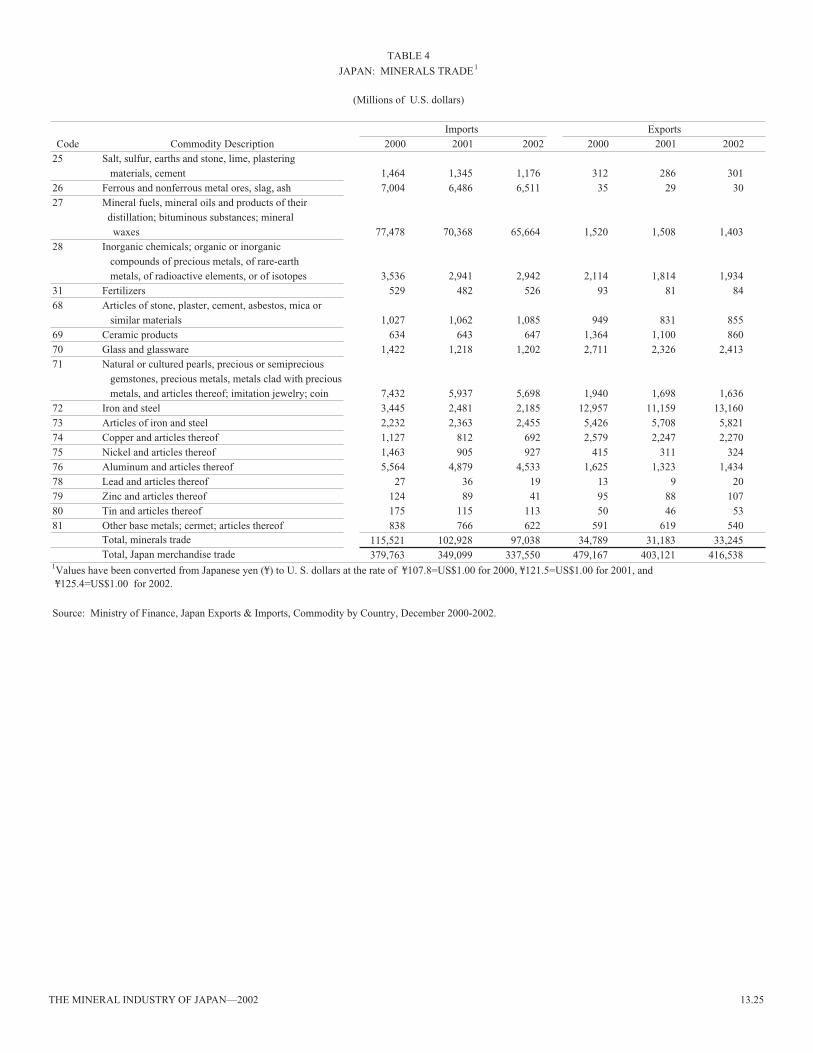
THE MINERAL INDUSTRY OF JAPAN—2002 13.25
TABLE 4
(Millions of U.S. dollars)
Imports ExportsCode Commodity Description 2000 2001 2002 2000 2001 2002
25 Salt, sulfur, earths and stone, lime, plastering materials, cement 1,464 1,345 1,176 312 286 301
26 Ferrous and nonferrous metal ores, slag, ash 7,004 6,486 6,511 35 29 3027 Mineral fuels, mineral oils and products of their
distillation; bituminous substances; mineral waxes 77,478 70,368 65,664 1,520 1,508 1,403
28 Inorganic chemicals; organic or inorganic compounds of precious metals, of rare-earth metals, of radioactive elements, or of isotopes 3,536 2,941 2,942 2,114 1,814 1,934
31 Fertilizers 529 482 526 93 81 8468 Articles of stone, plaster, cement, asbestos, mica or
similar materials 1,027 1,062 1,085 949 831 85569 Ceramic products 634 643 647 1,364 1,100 86070 Glass and glassware 1,422 1,218 1,202 2,711 2,326 2,41371 Natural or cultured pearls, precious or semiprecious
gemstones, precious metals, metals clad with precious metals, and articles thereof; imitation jewelry; coin 7,432 5,937 5,698 1,940 1,698 1,636
72 Iron and steel 3,445 2,481 2,185 12,957 11,159 13,16073 Articles of iron and steel 2,232 2,363 2,455 5,426 5,708 5,82174 Copper and articles thereof 1,127 812 692 2,579 2,247 2,27075 Nickel and articles thereof 1,463 905 927 415 311 32476 Aluminum and articles thereof 5,564 4,879 4,533 1,625 1,323 1,43478 Lead and articles thereof 27 36 19 13 9 2079 Zinc and articles thereof 124 89 41 95 88 10780 Tin and articles thereof 175 115 113 50 46 5381 Other base metals; cermet; articles thereof 838 766 622 591 619 540
115,521 102,928 97,038 34,789 31,183 33,245379,763 349,099 337,550 479,167 403,121 416,538
Source: Ministry of Finance, Japan Exports & Imports, Commodity by Country, December 2000-2002.
1Values have been converted from Japanese yen (¥) to U. S. dollars at the rate of ¥107.8=US$1.00 for 2000, ¥121.5=US$1.00 for 2001, and
Total, Japan merchandise tradeTotal, minerals trade
JAPAN: MINERALS TRADE 1
¥125.4=US$1.00 for 2002.

13.26 U.S. GEOLOGICAL SURVEY MINERALS YEARBOOK—2002
TA
BL
E 5
Ann
ual c
apac
itySh
ipm
ent t
oC
ompa
ny n
ame
(pro
ject
(m
etri
c to
ns)
Typ
e of
Prod
uctio
nSh
ipm
ent t
oJa
pan
2002
eM
ajor
equ
ity h
olde
rPa
rtic
ipat
ing
Japa
nese
nam
e) a
nd c
ount
ryT
otal
Japa
nese
sha
repo
wer
star
ted
Japa
n st
arte
d(m
etri
c to
ns)
and/
or o
ther
hol
ders
com
pani
es a
nd th
eir
equi
ty s
hare
New
Zea
land
Alu
min
ium
313,
000
67,6
00H
ydro
Apr
il 19
71Ju
ly 1
971
66,0
00C
omal
co N
ew Z
eala
nd L
td.,
79.3
6%Su
mito
mo
Che
mic
al C
o. L
td.,
20.
64%
.Sm
elte
rs L
td. (
NZ
AS)
,N
ew Z
eala
ndA
lcan
Sm
elte
rs a
nd C
hem
ical
90,0
0045
,000
do
.U
nkno
wn
Janu
ary
1977
35,0
00A
lcan
Alu
min
um L
td. o
f C
anad
a,N
ippo
n L
ight
Met
al C
o. L
td.,
50%
.L
td. (
AL
PAC
), C
anad
a50
%In
talc
o A
lum
inum
Cor
p.27
2,00
010
6,00
0
do.
1966
Unk
now
n84
,000
Alc
oa I
nc.,
61%
Mits
ui &
Co.
, Ltd
., 32
%; Y
KK
Cor
p., 7
%.
Eas
talc
o A
lum
inum
Co.
174,
000
68,0
00T
herm
al19
70
(AL
UM
AX
),1 Uni
ted
Stat
esIn
dust
ria
Ven
ezol
ana
de45
0,00
090
,000
Hyd
roFe
brua
ry 1
978
Dec
embe
r 19
7813
0,00
0C
orp.
Ven
ezol
ana
de G
uaya
naSh
owa
Den
ko K
.K.,
7%; S
umito
mo
Che
mic
al
Alu
min
io C
.A. (
VE
NA
LU
M),
(CV
G)
of V
enez
uela
, 80%
Co.
Ltd
., 4%
; Kob
e St
eel L
td.,
4%; M
itsub
ishi
Ven
ezue
laM
ater
ials
Cor
p., 3
%; M
itsub
ishi
Alu
min
umC
o. L
td.,
1%; M
arub
eni C
orp.
, 1%
.P.
T. I
ndon
esia
Asa
han
225,
000
133,
000
do
.Fe
brua
ry 1
982
Oct
ober
198
211
5,00
0In
done
sian
Gov
ernm
ent,
41%
Nip
pon
Asa
han
Alu
min
ium
Co.
Ltd
. (a
13-
Alu
min
um (
ASA
HA
N),
mem
ber
Japa
nese
con
sort
ium
), 5
9%.
Indo
nesi
aB
oyne
Isl
and
Smel
ter
Ltd
.:26
0,00
013
0,00
0T
herm
al
do.
July
198
223
8,00
02
Com
alco
Ltd
. of
Aus
tral
ia, 5
9.5%
Sum
itom
o L
ight
Met
al C
o. L
td.,
17%
; Ryo
wa
BO
YN
E r
educ
tion
lines
1, 2
,D
evel
opm
ent P
ty. L
td.,
9.5%
; YK
K A
lum
inum
Aus
tral
iaPt
y. L
td.,
9.5%
; Sum
itom
o C
hem
ical
Co.
Ltd
., 4.
5%.
BO
YN
E r
educ
tion
line
3,23
0,00
094
,000
do
.Ju
ly 1
997
Oct
ober
199
7C
omal
co L
td. o
f A
ustr
alia
, 59.
25%
Sum
itom
o L
ight
Met
al N
o. 2
Co.
Pty
. Ltd
., 17
%;
Aus
tral
iaR
yow
a D
evel
opm
ent I
I Pt
y. L
td.,
14.2
5%;
YK
K A
lum
iniu
m P
ty. L
td.,
9.5%
.A
lcoa
of
Aus
tral
ia L
td.
350,
000
80,5
00
do.
Nov
embe
r 19
86U
nkno
wn
78,0
00A
lcoa
of
Aus
tral
ia, 4
5%; E
aste
rnM
arub
eni C
orp.
, 23%
.(P
OR
TL
AN
D),
Aus
tral
iaA
lum
inum
Co.
, 10%
; Chi
naIn
tern
atio
nal T
rust
& I
nves
tmen
tC
orp.
, 22%
Alu
min
io B
rasi
leir
o S.
A.
345,
000
169,
000
Hyd
roJu
ly 1
985
Nov
embe
r 19
8617
5,00
0C
ompa
nhia
Val
e do
Rio
Doc
e,N
ippo
n A
maz
on A
lum
inum
Co.
(a
32-m
embe
r(A
LB
RA
S), B
razi
l51
%Ja
pane
se c
onso
rtiu
m),
49%
.M
ozam
biqu
e A
lum
inum
Co.
250,
000
63,0
00
do.
June
200
0U
nkno
wn
63,0
00B
illito
n pl
c, 4
7.11
%; I
ndus
tria
lM
itsub
ishi
Cor
p., 2
5%.
(MO
ZA
L 1
),3 Moz
ambi
que
Dev
elop
men
t Cor
p. o
f So
uth
Afr
ica,
24.
04%
; th
e G
over
nmen
t of
Moz
ambi
que,
3.8
5%A
lum
iner
ie A
loue
tte I
nc.
230,
000
46,0
00
do.
June
199
2Se
ptem
ber
1992
48,0
00A
lcan
, 40%
; Aus
tria
Met
al A
G, 2
0%;
Mar
uben
i Cor
p., 6
.67%
.
(AL
OU
ET
TE
),4 C
anad
aN
orsk
Hyd
ro, 2
0%; S
ocie
te G
ener
ale
de F
inan
cem
ent d
u D
uebe
c, 1
3.33
%
Sour
ce:
Japa
n A
lum
inum
Ass
ocia
tion,
Jap
an O
vers
eas
Alu
min
un S
mel
ting
Proj
ects
; U.S
. Geo
logi
cal S
urve
y, P
rim
ary
Alu
min
um P
lant
Wor
ldw
ide—
1998
, Par
t I—
Det
ail,
p. 4
, 22,
and
155
; Mar
uben
i Cor
p.
4 Cap
acity
wou
ld b
e ex
pand
ed to
500
,000
met
ric
tons
per
yea
r in
fal
l 200
5.
e Est
imat
e ba
sed
on J
apan
ese
fisc
al y
ear
endi
ng M
arch
of
the
follo
win
g ye
ar.
JAPA
N:
OV
ER
SEA
S A
LU
MIN
UM
SM
EL
TIN
G P
RO
JEC
TS,
200
2
1 The
two
smel
ters
und
er th
e co
mpa
ny A
LU
MA
X w
ere
acqu
ired
by
Alc
oa I
nc. i
n Ju
ly 1
998.
2 Ship
men
t to
Japa
n in
clud
ed f
rom
Boy
ne r
educ
tion
lines
1, 2
, and
3.
3 Phas
e 2
(MO
ZA
L 2
) w
ill a
dd a
n ad
ditio
nal 2
53,0
00 m
etri
c to
ns p
er y
ear
of a
lum
inum
cap
acity
by
2003
.
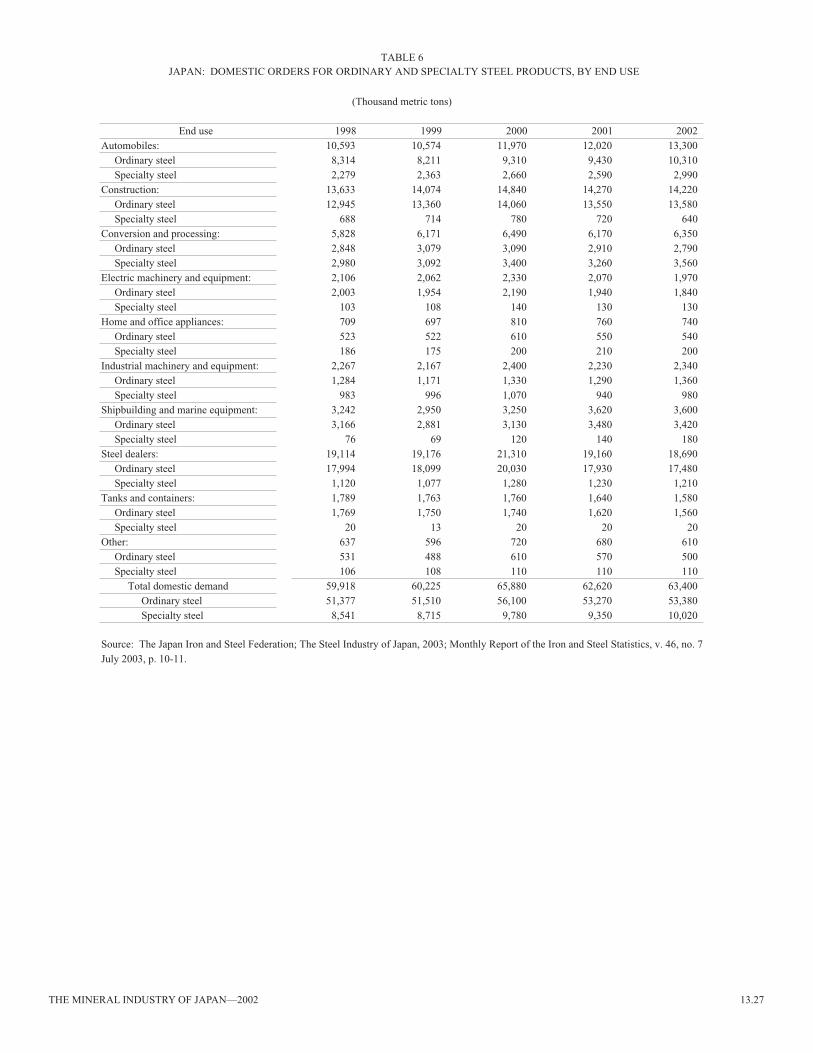
THE MINERAL INDUSTRY OF JAPAN—2002 13.27
TABLE 6
(Thousand metric tons)
End use 1998 1999 2000 2001 2002Automobiles: 10,593 10,574 11,970 12,020 13,300
Ordinary steel 8,314 8,211 9,310 9,430 10,310Specialty steel 2,279 2,363 2,660 2,590 2,990
Construction: 13,633 14,074 14,840 14,270 14,220Ordinary steel 12,945 13,360 14,060 13,550 13,580Specialty steel 688 714 780 720 640
Conversion and processing: 5,828 6,171 6,490 6,170 6,350Ordinary steel 2,848 3,079 3,090 2,910 2,790Specialty steel 2,980 3,092 3,400 3,260 3,560
Electric machinery and equipment: 2,106 2,062 2,330 2,070 1,970Ordinary steel 2,003 1,954 2,190 1,940 1,840Specialty steel 103 108 140 130 130
Home and office appliances: 709 697 810 760 740Ordinary steel 523 522 610 550 540Specialty steel 186 175 200 210 200
Industrial machinery and equipment: 2,267 2,167 2,400 2,230 2,340Ordinary steel 1,284 1,171 1,330 1,290 1,360Specialty steel 983 996 1,070 940 980
Shipbuilding and marine equipment: 3,242 2,950 3,250 3,620 3,600Ordinary steel 3,166 2,881 3,130 3,480 3,420Specialty steel 76 69 120 140 180
Steel dealers: 19,114 19,176 21,310 19,160 18,690Ordinary steel 17,994 18,099 20,030 17,930 17,480Specialty steel 1,120 1,077 1,280 1,230 1,210
Tanks and containers: 1,789 1,763 1,760 1,640 1,580Ordinary steel 1,769 1,750 1,740 1,620 1,560Specialty steel 20 13 20 20 20
Other: 637 596 720 680 610Ordinary steel 531 488 610 570 500Specialty steel 106 108 110 110 110
Total domestic demand 59,918 60,225 65,880 62,620 63,400Ordinary steel 51,377 51,510 56,100 53,270 53,380Specialty steel 8,541 8,715 9,780 9,350 10,020
Source: The Japan Iron and Steel Federation; The Steel Industry of Japan, 2003; Monthly Report of the Iron and Steel Statistics, v. 46, no. 7,July 2003, p. 10-11.
JAPAN: DOMESTIC ORDERS FOR ORDINARY AND SPECIALTY STEEL PRODUCTS, BY END USE
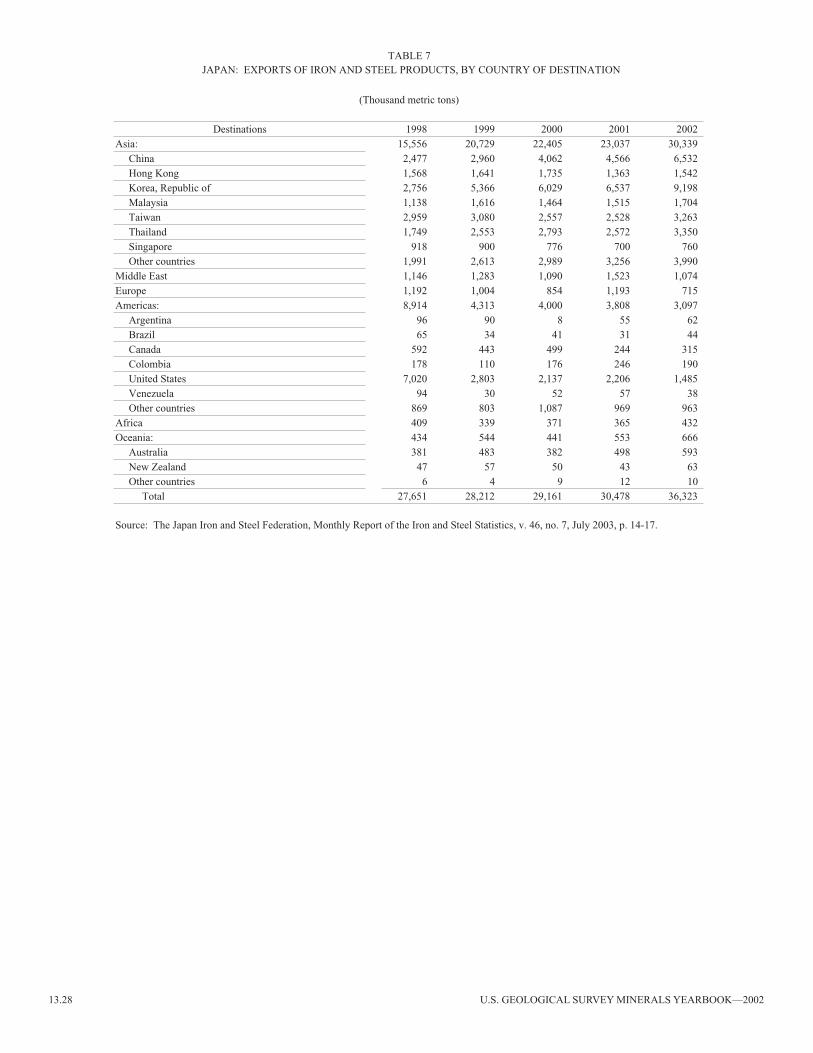
13.28 U.S. GEOLOGICAL SURVEY MINERALS YEARBOOK—2002
TABLE 7
(Thousand metric tons)
Destinations 1998 1999 2000 2001 2002Asia: 15,556 20,729 22,405 23,037 30,339
China 2,477 2,960 4,062 4,566 6,532Hong Kong 1,568 1,641 1,735 1,363 1,542Korea, Republic of 2,756 5,366 6,029 6,537 9,198Malaysia 1,138 1,616 1,464 1,515 1,704Taiwan 2,959 3,080 2,557 2,528 3,263Thailand 1,749 2,553 2,793 2,572 3,350Singapore 918 900 776 700 760Other countries 1,991 2,613 2,989 3,256 3,990
Middle East 1,146 1,283 1,090 1,523 1,074Europe 1,192 1,004 854 1,193 715Americas: 8,914 4,313 4,000 3,808 3,097
Argentina 96 90 8 55 62Brazil 65 34 41 31 44Canada 592 443 499 244 315Colombia 178 110 176 246 190United States 7,020 2,803 2,137 2,206 1,485Venezuela 94 30 52 57 38Other countries 869 803 1,087 969 963
Africa 409 339 371 365 432Oceania: 434 544 441 553 666
Australia 381 483 382 498 593New Zealand 47 57 50 43 63Other countries 6 4 9 12 10
Total 27,651 28,212 29,161 30,478 36,323
Source: The Japan Iron and Steel Federation, Monthly Report of the Iron and Steel Statistics, v. 46, no. 7, July 2003, p. 14-17.
JAPAN: EXPORTS OF IRON AND STEEL PRODUCTS, BY COUNTRY OF DESTINATION

THE MINERAL INDUSTRY OF JAPAN—2002 13.29
TABLE 8
(Thousand metric tons)
Location ProductionCompany Prefecture Mine 2000 2001
Taiheiyo Cement Co. Ltd. (formerly Chichibu Onoda Cement Co. Ltd.) Oita Ganji 9,983 8,814Do. do. Tsukumi 9,224 4,502Do. Hokkaido Garo 8,325 8,929Do. Iwate Oofunato 4,423 3,922Do. Saitama Minowa, Taiheiyo Buko 3,876 2,839Do. Guma Kanoyama 2,962 2,851Do. Kochi Tosayama 2,891 3,029Do. Yamagichi Shigeyasu 2,200 2,030Do. Fukuoka Kawara 2,098 --
Total 43,884 36,916Nittetsu Mining Co. Ltd. Kochi Torigatayama 12,627 13,707
Do. Aomori Shiriya 4,690 5,425Do. Tochigi Hanezuru 3,190 3,335
Total 20,507 22,467Todaka Mining Co. Ltd. Oita Todaka Tsukumi 11,520 12,041Ube Kosan Co. Ltd. Yamaguchi Ube Isa 8,841 9,258Mitsubishi Materials Corp. Fukuoka Higashitani 8,363 8,995Shuho Mining Co. Ltd. do. Sumitomo Cement Shuho 8,007 8,460Sumikin Mining Co. Ltd. Aomori Hachinohe Sekkai 5,315 6,036Ishizaki Co. Ltd. Mie Fujiwara 3,797 4,944Mitsui Mining Co. Ltd. Fukuoka Sekinoyama 3,553 3,674Sumitomo Osaka Cement Co. Ltd. Shiga Ibuki 1,743 --
Do. Tochigi Karasawa 1,641 1,731Total 3,384 1,731
Boku Mining Co. Ltd. Saitama Buko -- 2,839Ryoko Lime Industries Co. Ltd. do. Une 4,056 3,812Denki Kagaku Industries Co. Ltd. Niigata Omi 3,389 3,488Ryukiu Cement Co. Ltd. Okinawa Awa 2,968 2,632Oita Mining Co. Ltd. (formerly Furukawa Co. Ltd.) Oita Oita 2,626 2,432Yabashi Ryutaro Gifu Kinsyozan Sekkaiseki 2,289 2,439Funao Mine Co. Ltd. Fukuoka Funao 2,268 2,299Gikenkomusho Co. Ltd. Fukuoka Ube Kanda 2,149 2,352Myojo Cement Co. Ltd. Niigata Tomi 2,048 2,473Yoshizawa Lime Industries Co., Ltd. Tochigi Okano 1,321 1,417Okutama Industries Co. Ltd. Tokyo Hikawa 1,108 1,141
Total of 21 companies 141,393 141,846Grand total for Japan 185,569 182,255
-- Zero.
Source: Research Institute of International Trade and Industry (Chosakai), Mining Handbook (Kogyo Benran), 2000-2001.
JAPAN: MAJOR LIMESTONE PRODUCERS
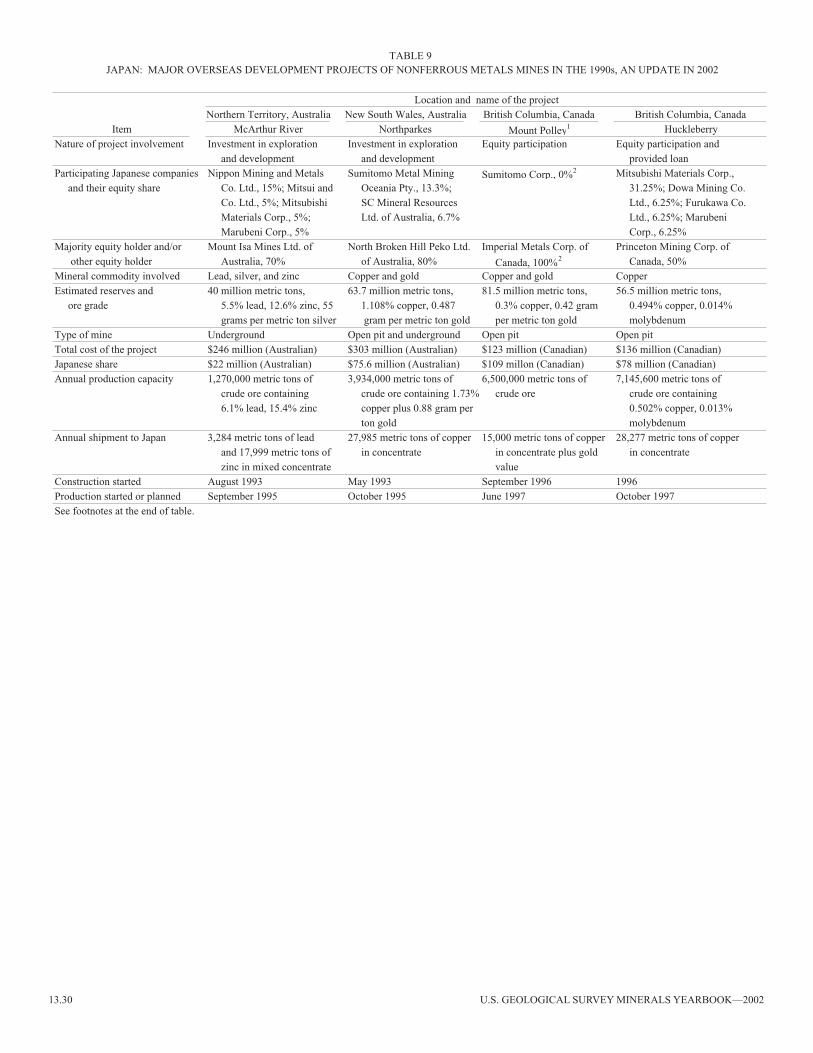
13.30 U.S. GEOLOGICAL SURVEY MINERALS YEARBOOK—2002
TABLE 9
Location and name of the projectNorthern Territory, Australia New South Wales, Australia British Columbia, Canada British Columbia, Canada
Item McArthur River Northparkes Mount Polley1 HuckleberryNature of project involvement Investment in exploration Investment in exploration Equity participation Equity participation and
and development and development provided loanParticipating Japanese companies Nippon Mining and Metals Sumitomo Metal Mining Sumitomo Corp., 0%2 Mitsubishi Materials Corp.,
and their equity share Co. Ltd., 15%; Mitsui and Oceania Pty., 13.3%; 31.25%; Dowa Mining Co.Co. Ltd., 5%; Mitsubishi SC Mineral Resources Ltd., 6.25%; Furukawa Co.Materials Corp., 5%; Ltd. of Australia, 6.7% Ltd., 6.25%; MarubeniMarubeni Corp., 5% Corp., 6.25%
Majority equity holder and/or Mount Isa Mines Ltd. of North Broken Hill Peko Ltd. Imperial Metals Corp. of Princeton Mining Corp. of other equity holder Australia, 70% of Australia, 80% Canada, 100%2 Canada, 50%
Mineral commodity involved Lead, silver, and zinc Copper and gold Copper and gold CopperEstimated reserves and 40 million metric tons, 63.7 million metric tons, 81.5 million metric tons, 56.5 million metric tons,
ore grade 5.5% lead, 12.6% zinc, 55 1.108% copper, 0.487 0.3% copper, 0.42 gram 0.494% copper, 0.014%grams per metric ton silver gram per metric ton gold per metric ton gold molybdenum
Type of mine Underground Open pit and underground Open pit Open pitTotal cost of the project $246 million (Australian) $303 million (Australian) $123 million (Canadian) $136 million (Canadian)Japanese share $22 million (Australian) $75.6 million (Australian) $109 millon (Canadian) $78 million (Canadian)Annual production capacity 1,270,000 metric tons of 3,934,000 metric tons of 6,500,000 metric tons of 7,145,600 metric tons of
crude ore containing crude ore containing 1.73% crude ore crude ore containing6.1% lead, 15.4% zinc copper plus 0.88 gram per 0.502% copper, 0.013%
ton gold molybdenumAnnual shipment to Japan 3,284 metric tons of lead 27,985 metric tons of copper 15,000 metric tons of copper 28,277 metric tons of copper
and 17,999 metric tons of in concentrate in concentrate plus gold in concentratezinc in mixed concentrate value
Construction started August 1993 May 1993 September 1996 1996Production started or planned September 1995 October 1995 June 1997 October 1997See footnotes at the end of table.
JAPAN: MAJOR OVERSEAS DEVELOPMENT PROJECTS OF NONFERROUS METALS MINES IN THE 1990s, AN UPDATE IN 2002

THE MINERAL INDUSTRY OF JAPAN—2002 13.31
TABLE 9--ContinuedJAPAN: MAJOR OVERSEAS DEVELOPMENT PROJECTS OF NONFERROUS METALS MINES IN THE 1990s, AN UPDATE IN 2002
Location and name of the projectRegion III, Chile Region I, Chile Region IV, Chile Region III, Chile
Item La Candelaria Collahuasi Los Pelambres El BronceNature of project involvement Investment in exploration Equity participation and Equity participation Investment in exploration
and development provided loan and developmentParticipating Japanese companies Sumitomo Metal Mining Mitsui and Co. Ltd., 6.9%; Nippon Mining and Metals Nittetsu Mining Co. Ltd.,
and their equity share Arizona Inc., 15%; Mitsui Mining and Co. Ltd., 15%; Mitsubishi 60%Sumitomo Corp., 5% Smelting Co. Ltd., 1.5%; Materials Corp., 10%;
Nippon Mining and Marubeni Corp., 8.75%;Metals Co., Ltd., 3.6% Mitsubishi Corp., 5%;
Mitsui and Co. Ltd., 1.25%Major equity holder and/or Phelps Dodge Corp. of the Falconbridge Ltd. of Canada, Antofagasta plc of the United El Bronce SA of Chile, 40%
other equity holder United States, 80% 44%; Anglo Kingdom, 55.55%;American plc of the Ananconda Chile S.A. of United Kingdom, 44% Chile, 9.45%
Mineral commodity involved Copper and gold Copper Copper CopperEstimated reserves and 366 million metric tons, 1,867.7 million metric tons, 1,139.7 million metric tons, 50 million metric tons, 1.6%
ore grade 0.84% copper, 0.205 0.93% copper 0.74% copper coppergram per metric ton gold
Type of mine Open pit Open pit Open pit UndergroundTotal cost of the project $592 million $1,760 million $1,355 million $132 millionJapanese share $296 million $174 million $835 million $116 millionAnnual production capacity 10,000,000 metric tons of 25,600,000 metric tons of 34,000,000 metric tons of 1,820,000 metric tons of
crude ore crude ore crude ore crude ore
Annual shipment to Japan 90,801 metric tons of 94,591 metric tons of 167,282 metric tons of 10,000 metric tons of coppercopper in concentrate copper in concentrate copper in concentrate in concentrate
Construction started April 1993 1996 November 1997 May 1999Production started or planned March 1995 January 1999 April 2000 2002See footnotes at the end of table.
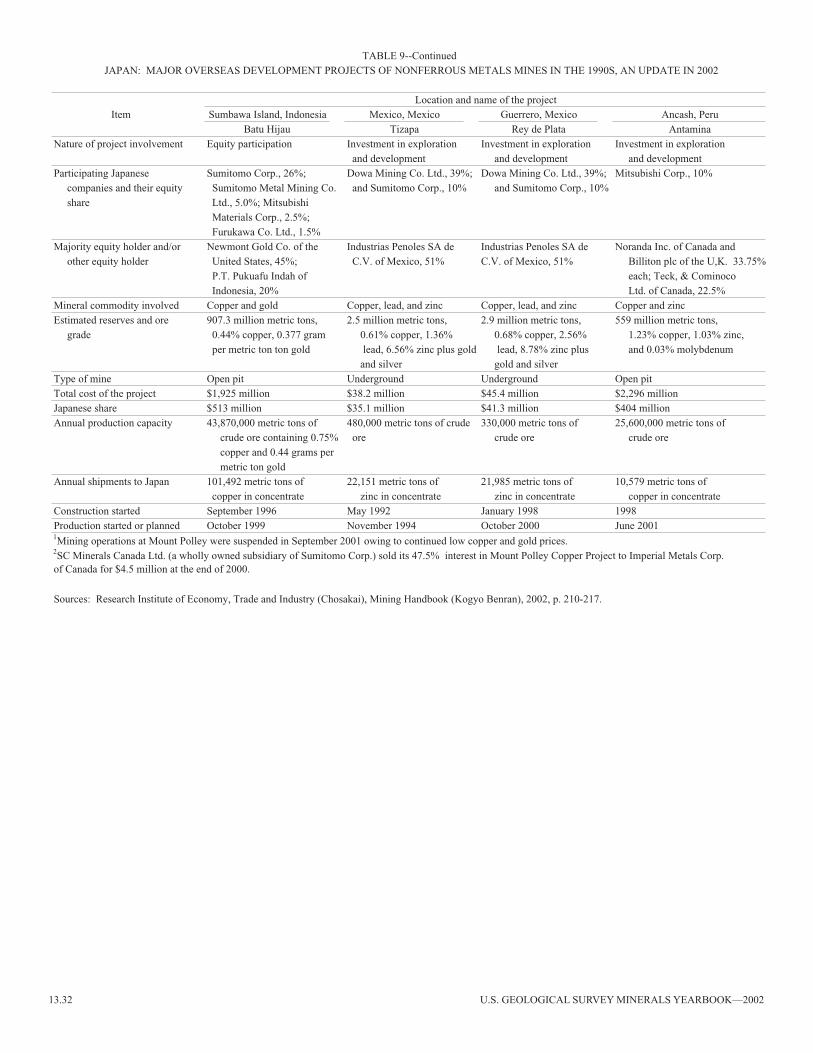
13.32 U.S. GEOLOGICAL SURVEY MINERALS YEARBOOK—2002
TABLE 9--ContinuedJAPAN: MAJOR OVERSEAS DEVELOPMENT PROJECTS OF NONFERROUS METALS MINES IN THE 1990S, AN UPDATE IN 2002
Location and name of the projectItem Sumbawa Island, Indonesia Mexico, Mexico Guerrero, Mexico Ancash, Peru
Batu Hijau Tizapa Rey de Plata AntaminaNature of project involvement Equity participation Investment in exploration Investment in exploration Investment in exploration
and development and development and developmentParticipating Japanese Sumitomo Corp., 26%; Dowa Mining Co. Ltd., 39%; Dowa Mining Co. Ltd., 39%; Mitsubishi Corp., 10%
companies and their equity Sumitomo Metal Mining Co. and Sumitomo Corp., 10% and Sumitomo Corp., 10%share Ltd., 5.0%; Mitsubishi
Materials Corp., 2.5%; Furukawa Co. Ltd., 1.5%
Majority equity holder and/or Newmont Gold Co. of the Industrias Penoles SA de Industrias Penoles SA de Noranda Inc. of Canada andother equity holder United States, 45%; C.V. of Mexico, 51% C.V. of Mexico, 51% Billiton plc of the U,K. 33.75%
P.T. Pukuafu Indah of each; Teck, & Cominoco Indonesia, 20% Ltd. of Canada, 22.5%
Mineral commodity involved Copper and gold Copper, lead, and zinc Copper, lead, and zinc Copper and zincEstimated reserves and ore 907.3 million metric tons, 2.5 million metric tons, 2.9 million metric tons, 559 million metric tons,
grade 0.44% copper, 0.377 gram 0.61% copper, 1.36% 0.68% copper, 2.56% 1.23% copper, 1.03% zinc, per metric ton ton gold lead, 6.56% zinc plus gold lead, 8.78% zinc plus and 0.03% molybdenum
and silver gold and silverType of mine Open pit Underground Underground Open pitTotal cost of the project $1,925 million $38.2 million $45.4 million $2,296 millionJapanese share $513 million $35.1 million $41.3 million $404 millionAnnual production capacity 43,870,000 metric tons of 480,000 metric tons of crude 330,000 metric tons of 25,600,000 metric tons of
crude ore containing 0.75% ore crude ore crude orecopper and 0.44 grams per metric ton gold
Annual shipments to Japan 101,492 metric tons of 22,151 metric tons of 21,985 metric tons of 10,579 metric tons of copper in concentrate zinc in concentrate zinc in concentrate copper in concentrate
Construction started September 1996 May 1992 January 1998 1998Production started or planned October 1999 November 1994 October 2000 June 2001
Sources: Research Institute of Economy, Trade and Industry (Chosakai), Mining Handbook (Kogyo Benran), 2002, p. 210-217.
1Mining operations at Mount Polley were suspended in September 2001 owing to continued low copper and gold prices.2SC Minerals Canada Ltd. (a wholly owned subsidiary of Sumitomo Corp.) sold its 47.5% interest in Mount Polley Copper Project to Imperial Metals Corp. of Canada for $4.5 million at the end of 2000.

THE MINERAL INDUSTRY OF JAPAN—2002 13.33
Destinations, 2001United
Commodity 2000 2001 States Other, principalMETALS
Alkali and alkaline-earth metals 1,873 404 17 China 174; India 124; Republic of Korea 66.Aluminum: Ore and concentrate 300 660 -- Taiwan 600; Republic of Korea 60. Oxides and hydroxides 337,317 101,333 2,979 Republic of Korea 55,634; Taiwan 13,274; China 11,539. Ash and residue containing aluminum 10,150 9,159 -- China 5,500; North Korea 2,161; Taiwan 893. Metal including alloys: Scrap 34,673 52,674 42 China 45,961; Hong Kong 3,390; Republic of Korea 849. Unwrought 10,002 12,567 418 Republic of Korea 3,133; Indonesia 2,598; Philippines
1,295. Semimanufactures 311,679 273,008 14,571 China 68,553; Taiwan 43,435; Thailand 27,633.Antimony: Oxides 2,321 1,924 36 Republic of Korea 328; Taiwan 269; Thailand 237.
Metal including alloys, all forms2 180 162 1 Thailand 97; Spain 54.Arsenic, metal including alloys, all forms 42 29 24 United Kingdom 2; Germany 1.Beryllium, metal including alloys, all forms 8 6 1 China 1; Hong Kong 1; Taiwan 1.
Bismuth, metal including alloys, all forms2 3 31 3 Belgium 25; Republic of Korea 1.Cadmium, metal including alloys, all forms (3) 57 (3) Netherlands 40; Hong Kong 15.Chromium: Ore and concentrate 8,322 65 -- Republic of Korea 25; Philippines 20; Taiwan 20. Oxides and hydroxides 4,932 1,606 880 Taiwan 248; Republic of Korea 224; France 85. Metal including alloys, all forms 218 226 46 Republic of Korea 107; Taiwan 56; Netherlands 5.Cobalt: Oxides and hydroxides 234 380 1 Republic of Korea 182; China 110; Taiwan 29. Metal including alloys, all forms 1,106 1,342 140 Canada 550; Hong Kong 212; China 123.Columbium and tantalum, tantalum metal including alloys, all forms 385 348 93 China 75; Germany 63; United Kingdom 58.Copper: Oxides and hydroxides 1,961 1,736 4 Singapore 775; China 447; Republic of Korea 372. Sulfate 3,330 2,922 40 Taiwan 2,040; Hong Kong 306; Republic of Korea 173. Metal including alloys: Scrap 110,853 156,490 77 China 146,936; Hong Kong 4,324; Taiwan 2,462. Unwrought 82,714 45,137 (3) Republic of Korea 42,326; Taiwan 2,124; Hong Kong 469. Semimanufactures 329,287 268,343 27,009 China 45,509; Malaysia 37,230; Republic of Korea
29,173.Germanium, metal including alloys, all forms 1 (3) (3)
Gold: Waste and scrap kilograms 528 48 -- Singapore 22; Germany 16; Hong Kong 10. Metal including alloys, unwrought and partly wrought do. 69 70 7 Singapore 17; Malaysia 14; Taiwan 13.Iron and steel: Iron ore and concentrate 78,831 60,442 10 China 60,400; Republic of Korea 23. Metal: Scrap thousand tons 2,895 6,151 33 China 2,865; Republic of Korea 1,921; Taiwan 792. Pig iron, cast iron, related materials do. 224 532 (3) Republic of Korea 3; Taiwan 1. Ferroalloys: Ferrochromium 2,541 2,686 2,308 Thailand 155; Republic of Korea 119; Indonesia 41. Ferromanganese 44,248 28,018 -- Taiwan 9,779; Republic of Korea 4,989; Australia 3,507. Ferromolybdenum 22 21 -- Thailand 16; Republic of Korea 3; Philippines 2. Ferronickel 114,828 121,708 -- Taiwan 66,955; Republic of Korea 54,693. Ferrosilicomanganese 4,928 431 -- Taiwan 325; Republic of Korea 85; China 21. Ferrosilicon 4,883 4,287 (3) Republic of Korea 1,755; Indonesia 1,070; Thailand 735. Silicon metal 489 464 5 China 157; Republic of Korea 147; United Kingdom 49. Unspecified 3,592 3,449 2,000 China 677; Taiwan 182; Thailand 98.See footnotes at end of table.
TABLE 10
JAPAN: EXPORTS OF MINERAL COMMODITIES 1
(Metric tons unless otherwise specified)

13.34 U.S. GEOLOGICAL SURVEY MINERALS YEARBOOK—2002
UnitedCommodity 2000 2001 States Other, principal
METALS--Continued Lead: Oxides 112 246 4 Germany 108; Taiwan 64; Republic of Korea 26. Ash and residue containing lead 61 -- -- Metal including alloys: Scrap 5,164 3,857 -- Republic of Korea 3,739; India 82; Thailand 20. Unwrought 6,475 6,729 -- China 3,127; Malaysia 2,134; Taiwan 873. Semimanufactures 644 488 16 China 195; Malaysia 98; Taiwan 78.Lithium, oxide and hydroxide 24 22 2 Taiwan 6; Hong Kong 5; China 4.Magnesium, metal including alloys: Scrap 43 210 4 China 104; United Kingdom 72; Russia 29. Unwrought 143 121 13 Taiwan 81; Norway 22; China 3. Semimanufactures 1,241 829 (3) Taiwan 790; Singapore 20; Malaysia 4.Manganese: Ore and concentrate, battery-grade -- 2,922 -- All to China. Oxides 2,370 2,358 72 China 1,554; Republic of Korea 448; Taiwan 190. Metal including alloys, all forms 44 48 (3) China 25; India 9; Taiwan 7.Mercury 39 17 -- Netherlands 11; Iran 4.Molybdenum: Ore and concentrate, roasted 3 -- -- Oxides and hydroxides 108 35 10 Australia 10; Italy 8; Republic of Korea 3. Metal including alloys, all forms 156 172 35 Republic of Korea 63; Taiwan 26; Germany 19.Nickel: Matte and speiss thousand tons 23,072 25,480 3 Republic of Korea 17,515; Taiwan 7,800; Belgium 152. Oxides and hydroxides 3,873 3,077 458 Hong Kong 820; Taiwan 625; China 423. Metal including alloys: Scrap 681 712 205 United Kingdom 167; Belgium 72; Taiwan 66. Unwrought 1,222 954 213 Republic of Korea 213; United Kingdom 189; China 175. Semimanufactures 10,619 8,085 1,363 Hong Kong 1,284; Iran 1,129; Republic of Korea 902.Platinum-group metals: Waste and sweepings 77 3 1 Germany 1; United Kingdom 1. Metal including alloys, unwrought and partly wrought: Palladium thousands $172 $171 $91 Hong Kong $33; Austria $31; Switzerland $10. Platinum do. $115 $139 $15 Hong Kong $63; Switzerland $20; Singapore $5. Rhodium do. $8 $3 $1 Thailand $1; Taiwan $1. Iridium, osmium, ruthenium do. $8 $3 (3) Mainly to the Republic of Korea $1. Unspecified do. $9 $1 (3) Germany $4; Hong Kong $3; Republic of Korea $1.Rare-earth metals including alloys, all forms 199 197 (3) China 186; Hong Kong 8; Thailand 1.Selenium 528 605 1 Hong Kong 249; China 180; India 93.Silicon 3,269 3,022 616 Republic of Korea 492; United Kingdom 462; Malaysia 414.Silver metal including alloys, unwrought and
partly wrought thousands $85 $88 $5 Taiwan $21; Malaysia $7; Singapore $3.Tin: Metal including alloys: Scrap 975 567 53 United Arab Emirates 249; Belgium 147; Taiwan 69. Unwrought 341 954 213 Republic of Korea 213; United Kingdom 189; China 175. Semimanufactures 2,434 1,705 72 Hong Kong 547; China 268; Singapore 175.See footnotes at end of table.
TABLE 10--Continued
JAPAN: EXPORTS OF MINERAL COMMODITIES 1
(Metric tons unless otherwise specified)
Destinations, 2001
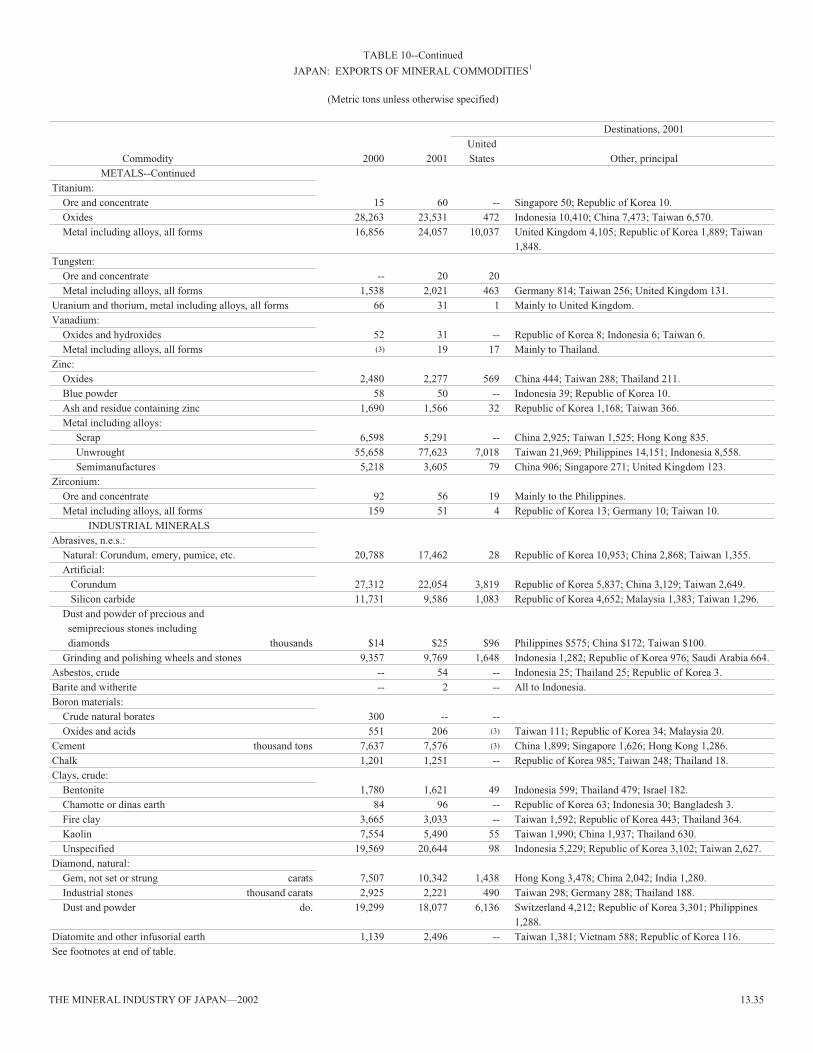
THE MINERAL INDUSTRY OF JAPAN—2002 13.35
Destinations, 2001United
Commodity 2000 2001 States Other, principalMETALS--Continued
Titanium: Ore and concentrate 15 60 -- Singapore 50; Republic of Korea 10. Oxides 28,263 23,531 472 Indonesia 10,410; China 7,473; Taiwan 6,570. Metal including alloys, all forms 16,856 24,057 10,037 United Kingdom 4,105; Republic of Korea 1,889; Taiwan
1,848.Tungsten: Ore and concentrate -- 20 20 Metal including alloys, all forms 1,538 2,021 463 Germany 814; Taiwan 256; United Kingdom 131.Uranium and thorium, metal including alloys, all forms 66 31 1 Mainly to United Kingdom.Vanadium: Oxides and hydroxides 52 31 -- Republic of Korea 8; Indonesia 6; Taiwan 6. Metal including alloys, all forms (3) 19 17 Mainly to Thailand.Zinc: Oxides 2,480 2,277 569 China 444; Taiwan 288; Thailand 211. Blue powder 58 50 -- Indonesia 39; Republic of Korea 10. Ash and residue containing zinc 1,690 1,566 32 Republic of Korea 1,168; Taiwan 366. Metal including alloys: Scrap 6,598 5,291 -- China 2,925; Taiwan 1,525; Hong Kong 835. Unwrought 55,658 77,623 7,018 Taiwan 21,969; Philippines 14,151; Indonesia 8,558. Semimanufactures 5,218 3,605 79 China 906; Singapore 271; United Kingdom 123. Zirconium: Ore and concentrate 92 56 19 Mainly to the Philippines. Metal including alloys, all forms 159 51 4 Republic of Korea 13; Germany 10; Taiwan 10.
INDUSTRIAL MINERALS Abrasives, n.e.s.: Natural: Corundum, emery, pumice, etc. 20,788 17,462 28 Republic of Korea 10,953; China 2,868; Taiwan 1,355. Artificial: Corundum 27,312 22,054 3,819 Republic of Korea 5,837; China 3,129; Taiwan 2,649. Silicon carbide 11,731 9,586 1,083 Republic of Korea 4,652; Malaysia 1,383; Taiwan 1,296. Dust and powder of precious and semiprecious stones including diamonds thousands $14 $25 $96 Philippines $575; China $172; Taiwan $100. Grinding and polishing wheels and stones 9,357 9,769 1,648 Indonesia 1,282; Republic of Korea 976; Saudi Arabia 664.Asbestos, crude -- 54 -- Indonesia 25; Thailand 25; Republic of Korea 3.Barite and witherite -- 2 -- All to Indonesia.Boron materials: Crude natural borates 300 -- -- Oxides and acids 551 206 (3) Taiwan 111; Republic of Korea 34; Malaysia 20. Cement thousand tons 7,637 7,576 (3) China 1,899; Singapore 1,626; Hong Kong 1,286.Chalk 1,201 1,251 -- Republic of Korea 985; Taiwan 248; Thailand 18.Clays, crude: Bentonite 1,780 1,621 49 Indonesia 599; Thailand 479; Israel 182. Chamotte or dinas earth 84 96 -- Republic of Korea 63; Indonesia 30; Bangladesh 3. Fire clay 3,665 3,033 -- Taiwan 1,592; Republic of Korea 443; Thailand 364. Kaolin 7,554 5,490 55 Taiwan 1,990; China 1,937; Thailand 630. Unspecified 19,569 20,644 98 Indonesia 5,229; Republic of Korea 3,102; Taiwan 2,627.Diamond, natural: Gem, not set or strung carats 7,507 10,342 1,438 Hong Kong 3,478; China 2,042; India 1,280. Industrial stones thousand carats 2,925 2,221 490 Taiwan 298; Germany 288; Thailand 188. Dust and powder do. 19,299 18,077 6,136 Switzerland 4,212; Republic of Korea 3,301; Philippines
1,288.Diatomite and other infusorial earth 1,139 2,496 -- Taiwan 1,381; Vietnam 588; Republic of Korea 116.See footnotes at end of table.
TABLE 10--Continued
JAPAN: EXPORTS OF MINERAL COMMODITIES 1
(Metric tons unless otherwise specified)
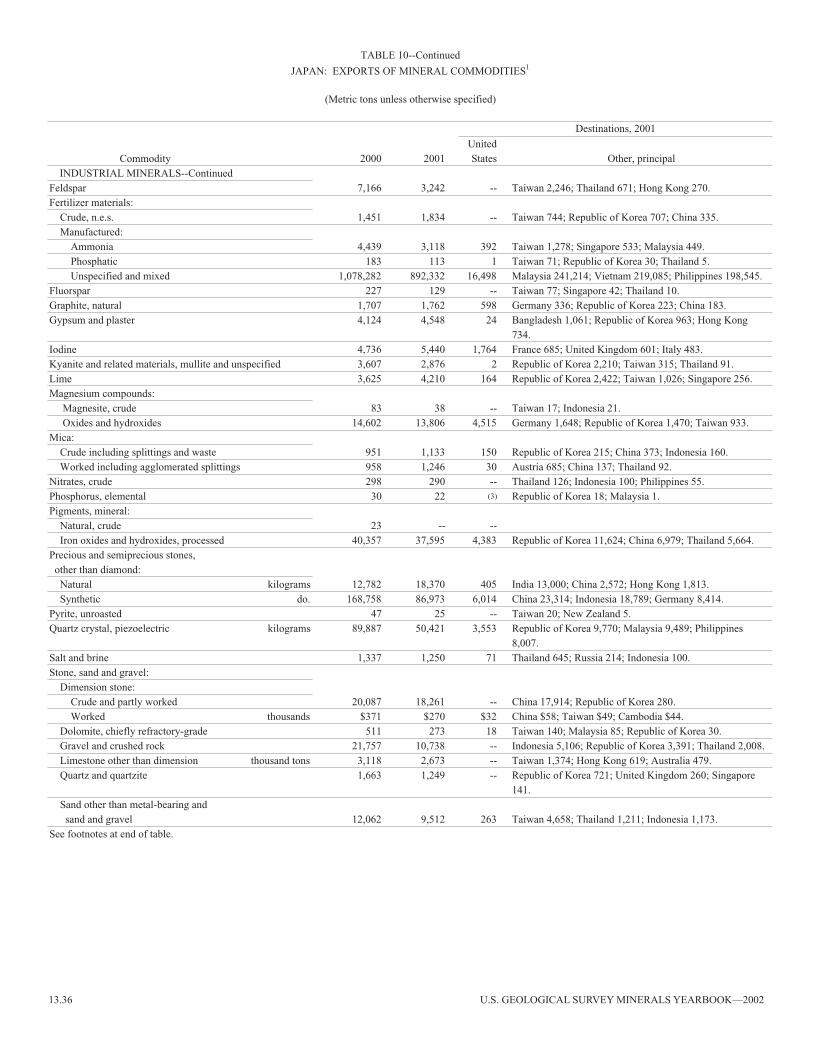
13.36 U.S. GEOLOGICAL SURVEY MINERALS YEARBOOK—2002
UnitedCommodity 2000 2001 States Other, principal
INDUSTRIAL MINERALS--ContinuedFeldspar 7,166 3,242 -- Taiwan 2,246; Thailand 671; Hong Kong 270.Fertilizer materials: Crude, n.e.s. 1,451 1,834 -- Taiwan 744; Republic of Korea 707; China 335. Manufactured: Ammonia 4,439 3,118 392 Taiwan 1,278; Singapore 533; Malaysia 449. Phosphatic 183 113 1 Taiwan 71; Republic of Korea 30; Thailand 5. Unspecified and mixed 1,078,282 892,332 16,498 Malaysia 241,214; Vietnam 219,085; Philippines 198,545.Fluorspar 227 129 -- Taiwan 77; Singapore 42; Thailand 10.Graphite, natural 1,707 1,762 598 Germany 336; Republic of Korea 223; China 183. Gypsum and plaster 4,124 4,548 24 Bangladesh 1,061; Republic of Korea 963; Hong Kong
734.Iodine 4,736 5,440 1,764 France 685; United Kingdom 601; Italy 483.Kyanite and related materials, mullite and unspecified 3,607 2,876 2 Republic of Korea 2,210; Taiwan 315; Thailand 91.Lime 3,625 4,210 164 Republic of Korea 2,422; Taiwan 1,026; Singapore 256.Magnesium compounds: Magnesite, crude 83 38 -- Taiwan 17; Indonesia 21. Oxides and hydroxides 14,602 13,806 4,515 Germany 1,648; Republic of Korea 1,470; Taiwan 933.Mica: Crude including splittings and waste 951 1,133 150 Republic of Korea 215; China 373; Indonesia 160. Worked including agglomerated splittings 958 1,246 30 Austria 685; China 137; Thailand 92.Nitrates, crude 298 290 -- Thailand 126; Indonesia 100; Philippines 55.Phosphorus, elemental 30 22 (3) Republic of Korea 18; Malaysia 1. Pigments, mineral: Natural, crude 23 -- -- Iron oxides and hydroxides, processed 40,357 37,595 4,383 Republic of Korea 11,624; China 6,979; Thailand 5,664.Precious and semiprecious stones, other than diamond: Natural kilograms 12,782 18,370 405 India 13,000; China 2,572; Hong Kong 1,813. Synthetic do. 168,758 86,973 6,014 China 23,314; Indonesia 18,789; Germany 8,414.Pyrite, unroasted 47 25 -- Taiwan 20; New Zealand 5.Quartz crystal, piezoelectric kilograms 89,887 50,421 3,553 Republic of Korea 9,770; Malaysia 9,489; Philippines
8,007.Salt and brine 1,337 1,250 71 Thailand 645; Russia 214; Indonesia 100.Stone, sand and gravel: Dimension stone: Crude and partly worked 20,087 18,261 -- China 17,914; Republic of Korea 280. Worked thousands $371 $270 $32 China $58; Taiwan $49; Cambodia $44. Dolomite, chiefly refractory-grade 511 273 18 Taiwan 140; Malaysia 85; Republic of Korea 30. Gravel and crushed rock 21,757 10,738 -- Indonesia 5,106; Republic of Korea 3,391; Thailand 2,008. Limestone other than dimension thousand tons 3,118 2,673 -- Taiwan 1,374; Hong Kong 619; Australia 479. Quartz and quartzite 1,663 1,249 -- Republic of Korea 721; United Kingdom 260; Singapore
141. Sand other than metal-bearing and sand and gravel 12,062 9,512 263 Taiwan 4,658; Thailand 1,211; Indonesia 1,173.See footnotes at end of table.
TABLE 10--Continued
JAPAN: EXPORTS OF MINERAL COMMODITIES 1
(Metric tons unless otherwise specified)
Destinations, 2001
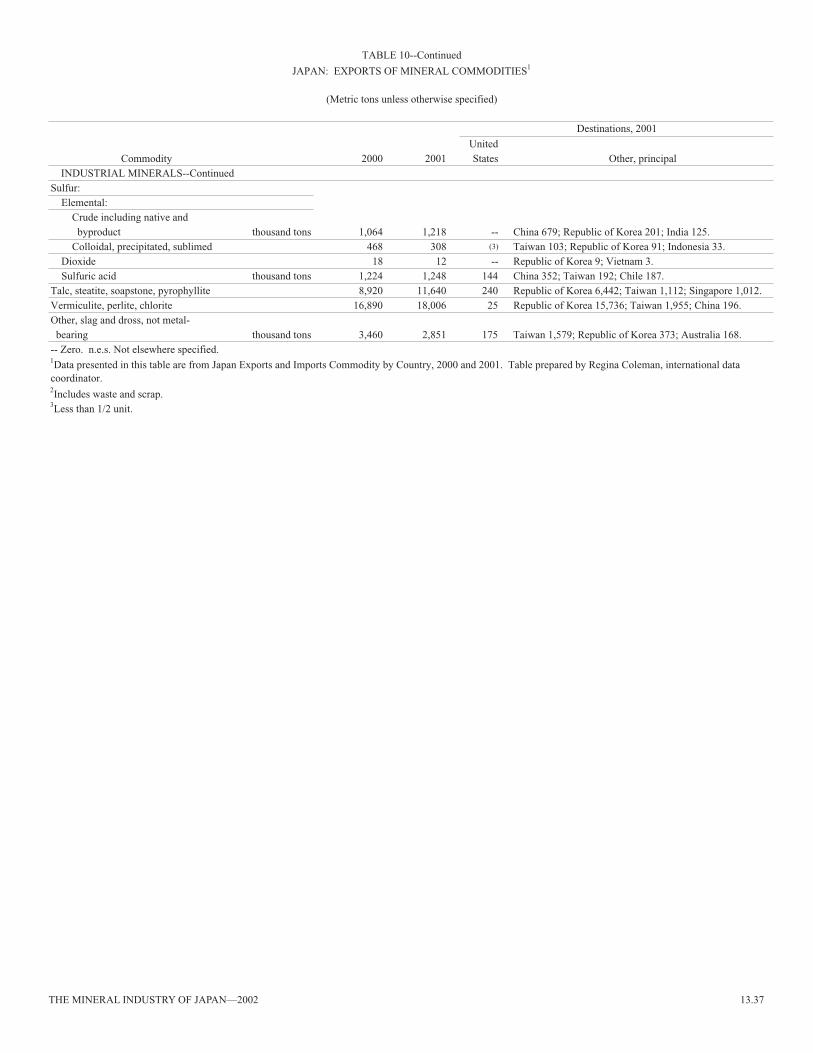
THE MINERAL INDUSTRY OF JAPAN—2002 13.37
UnitedCommodity 2000 2001 States Other, principal
INDUSTRIAL MINERALS--Continued Sulfur: Elemental: Crude including native and byproduct thousand tons 1,064 1,218 -- China 679; Republic of Korea 201; India 125. Colloidal, precipitated, sublimed 468 308 (3) Taiwan 103; Republic of Korea 91; Indonesia 33. Dioxide 18 12 -- Republic of Korea 9; Vietnam 3. Sulfuric acid thousand tons 1,224 1,248 144 China 352; Taiwan 192; Chile 187. Talc, steatite, soapstone, pyrophyllite 8,920 11,640 240 Republic of Korea 6,442; Taiwan 1,112; Singapore 1,012.Vermiculite, perlite, chlorite 16,890 18,006 25 Republic of Korea 15,736; Taiwan 1,955; China 196.Other, slag and dross, not metal- bearing thousand tons 3,460 2,851 175 Taiwan 1,579; Republic of Korea 373; Australia 168.-- Zero. n.e.s. Not elsewhere specified.
(Metric tons unless otherwise specified)
Destinations, 2001
TABLE 10--Continued
JAPAN: EXPORTS OF MINERAL COMMODITIES 1
1Data presented in this table are from Japan Exports and Imports Commodity by Country, 2000 and 2001. Table prepared by Regina Coleman, international data coordinator.2Includes waste and scrap.3Less than 1/2 unit.

13.38 U.S. GEOLOGICAL SURVEY MINERALS YEARBOOK—2002
Sources, 2001United
Commodity 2000 2001 States Other, principalMETALS
Alkali and alkaline-earth metals 384 288 133 France 73; China 51; Russia 27.Aluminum: Ore and concentrate thousand tons 2 2 -- Mainly from Australia. Oxides and hydroxides 91,894 88,519 5,490 Australia 73,856; Germany 3,283; China 2,938. Ash and residue 1,820 1,331 -- Russia 1,121; China 105; Malaysia 77. Metal including alloys: Scrap 130,423 120,829 31,707 China 9,086; Singapore 8,634; Thailand 8,347. Unwrought thousand tons 2,605 2,611 22 Australia 653; Russia 639; Brazil 186.Antimony: Ore and concentrate 40 20 -- All from China. Oxides 8,497 7,382 40 China 6,371; Mexico 282; Taiwan 516. Metal including alloys, all forms 10,965 7,372 (2) China 7,366; Thailand 5.Arsenic, metal including alloys, all forms 45 (2) --Beryllium, metal including alloys, all forms 3 13 13Bismuth, metal including alloys, all forms 361 241 (2) Belgium 78; Peru 72; China 36.Cadmium, metal including alloys, all forms 4,056 2,723 -- Germany 485; Belgium 360; Canada 319.Chromium: Ore and concentrate 501,727 411,120 -- South Africa 271; India 109; Iran 11. Oxides and hydroxides 3,472 4,970 567 Kazakhstan 1,584; China 1,196; United Kingdom 997. Metal including alloys, all forms 3,202 3,480 674 China 1,372; France 737; United Kingdom 395.Cobalt: Oxides and hydroxides 3,354 1,482 12 Belgium 1,106; Finland 211; Philippines 34. Metal including alloys, all forms 10,337 7,973 46 Canada 1,777; Australia 995.Columbium and tantalum, tantalum metal including alloys, all forms 409 251 83 Thailand 46; China 37; United Kingdom 19.Copper: Ore and concentrate thousand tons 4,469 4,112 -- Chile 1,781; Indonesia 808; Canada 506. Matte including cement copper -- 1,956 -- Taiwan 861; France 684; Malaysia 239. Oxides and hydroxides 3,297 3,732 2,148 Malaysia 516; Norway 406; Vietnam 233. Sulfate 429 741 6 Taiwan 380; Thailand 187; Republic of Korea 122. Ash and residue containing copper 1,946 4,020 1,701 Malaysia 1,619; Philippines 332; Indonesia 108. Metal including alloys: Scrap 190,221 142,702 39,772 Malaysia 19,029; Philippines 17, 973; Thailand 7,507. Unwrought 227,564 167,242 796 Chile 72,374; Philippines 12,284; Republic of Korea
1,677. Semimanufactures 1,053 58,738 2,117 Republic of Korea 11,649; Malaysia 10,526; Germany 5,527.Germanium, metal including alloys, all forms 7 7 (2) China 4; Belgium 1; Russia 1.See footnotes at end of table.
TABLE 11
JAPAN: IMPORTS OF MINERAL COMMODITIES 1
(Metric tons unless otherwise specified)

THE MINERAL INDUSTRY OF JAPAN—2002 13.39
Sources, 2001United
Commodity 2000 2001 States Other, principalMETALS--Continued
Gold: Waste and sweepings 198 238 (2) Singapore 124; Republic of Korea 35; Taiwan 17. Metal including alloys, unwrought and partly wrought kilograms 72,796 43,231 694 Australia 17,132; Brazil 4,999; Uzbekistan 4,778.Iron and steel: Iron ore and concentrate excluding roasted pyrite million tons 122 126 -- Australia 70; Brazil 25; Philippines 4. Metal: Scrap thousand tons 321 144 42 Republic of Korea 34; Taiwan 29; Thailand 12. Pig iron, cast iron, related materials do. 919 340 3 Australia 79; Brazil 46; Sweden 32. Ferroalloys: Ferrochromium 776,327 739,687 -- South Africa 392,161; Kazahkstan 146,356; Zimbabwe
84,106. Ferromanganese 69,683 54,549 -- China 23,754; South Africa 20,514; Republic of Korea
4,204. Ferromolybdenum 3,346 3,873 -- China 3,633; Chile 240. Ferronickel 37,630 45,470 -- New Caledonia 32,970; Indonesia 6,109; Dominica
4,712. Ferrosilicochromium 5,818 3,493 34 China 3,040, Zimbabwe 419. Ferrosilicomanganese 223,747 218,405 -- China 155,940; Australia 17,979; Ukraine 11,199. Ferrotungsten 1,101 826 -- All from China. Silicon metal 194,362 184,771 11 China 135,180; Australia 19,036; Norway 16,998. Unspecified 39,428 33,787 20 China 11,389; Brazil 10,390; United Kingdom 2,406.Lead: Ore and concentrate 185,584 186,136 65,816 Australia 67,619; Peru 19,030; Bolivia 11,488. Oxides 49,514 37,301 25 China 20,965; Taiwan 8,710. Metal including alloys: Scrap (2) -- Unwrought 31,383 45,208 2 China 40,116; Taiwan 674. Semimanufactures 2,201 2,397 4 China 981; France 765; United Kingdom 413.Lithium, oxides and hydroxides 1,558 1,312 930 China 228; Russia 110; Taiwan 43.Magnesium, metal including alloys: Scrap 948 790 -- All from Taiwan. Unwrought 38,221 33,665 166 China 26,095; Norway 5,910; Canada 1,022. Semimanufactures 4,092 3,350 296 China 2,900; Russia 209; Republic of Korea 47.Manganese: Oxides and dioxides 2,946 2,155 (2) China 1,093; Belgium 630; Mexico 160. Metal including alloys, all forms 43,270 52,748 885 China 45,143; South Africa 6,558; Netherlands 77.Mercury 7 11 (2) Mainly from Algeria.Molybdenum: Ore and concentrate: Roasted 32,389 31,687 2,618 Chile 11,872; China 6,508; Canada 3,285. Unroasted 13 60 -- China 40; Australia 20. Oxides and hydroxides 1,167 1,492 176 Chile 554; China 370; Iran 310. Metal including alloys: Semimanufactures 291 378 130 Austria 127; China 100; Germany 11. All forms 541 504 145 Germany 165; China 140; Uzbekistan 34.See footnotes at end of table.
TABLE 11--Continued
JAPAN: IMPORTS OF MINERAL COMMODITIES 1
(Metric tons unless otherwise specified)

13.40 U.S. GEOLOGICAL SURVEY MINERALS YEARBOOK—2002
Sources, 2001United
Commodity 2000 2001 States Other, principalMETALS--Continued
Nickel: Ore and concentrate thousand tons 4,579 4,420 -- Indonesia 1,920; Philippines 1,312; New Caledonia
1,187. Matte 111,690 117,349 -- Indonesia 80,742; Australia 36,607. Oxides and hydroxides 125 60 8 Canada 25; Finland 23. Metal including alloys: Scrap 15,665 16,040 2,077 Russia 2,259; Zimbabwe 3,903; South Africa 619. Unwrought 58,325 28,762 27 Australia 8,353; Russia 3,029; Norway 2,770. Semimanufactures 14,226 11,289 1,760 United Kingdom 3,898; Canada 3,652; Republic of
Korea 362.Platinum-group metals: Waste and scrap 480 339 8 Republic of Korea 138; Malaysia 63; Taiwan 35. Metal including alloys, unwrought and partly wrought: Palladium 84 49 4 Russia 25; South Africa 12. Platinum kilograms 51,844 49,299 3,025 South Africa 37,979; Russia 2,816; Norway 669. Rhodium do. 1,106 503 -- Italy 300; Russia 105; South Africa 52. Iridium, osmium, ruthenium do. 8,147 6,963 509 South Africa 5,145; Germany 683; Russia 494. Unspecified do. 12,145 13,130 1,950 South Africa 3,708; Germany 2,428; Switzerland 1,392.Rare-earth metals including alloys, all forms 7,077 3,346 30 China 3,213; Estonia 97. Selenium 46 18 (2) Philippines 11; Belgium 5.Silicon, high-purity 200,375 6,271 4,382 Germany 965; United Kingdom 379; China 242.Silver: Ore and concentrate 14,157 14,813 -- Peru 13,965; Chile 848. Metal including alloys, unwrought and partly wrought: kilograms 2,051,348 1,387,568 127,997 Peru 336,813; Mexico 335,580; Republic of Korea
228,045.Tin, metal including alloys: Ore and concentrate 14 14 -- All from the Netherlands. Metal including alloys: Scrap 196 36 (2) Republic of Korea 31; Malaysia 5. Unwrought 32,483 24,144 77 China 9,325; Indonesia 9,227; Thailand 3,288. Semimanufactures 409 369 12 Singapore 252; Republic of Korea 23; Thailand 52. See footnotes at end of table.
TABLE 11--Continued
JAPAN: IMPORTS OF MINERAL COMMODITIES 1
(Metric tons unless otherwise specified)

THE MINERAL INDUSTRY OF JAPAN—2002 13.41
Sources, 2001United
Commodity 2000 2001 States Other, principalMETALS--Continued
Titanium: Ore and concentrate 80,392 112,802 -- Australia 55,726; Canada 23,020; India 22,960. Oxides 15,303 14,298 601 China 5,369; France 5,043; Republic of Korea 1,942. Metal including alloys, all forms 7,527 10,333 3,188 Russia 3,959; Kazakhstan 2,429; Republic of Korea 78. Tungsten: Ore and concentrate 1,514 951 -- Russia 777; Portugal 151; China 20. Metal including alloys, all forms 700 1,418 58 China 854; Republic of Korea 237; Germany 125. Uranium and thorium, metal including alloys, all forms 2,595 767 73 France 99; Canada 44; United Kingdom 19.
Oxides and hydroxides 4,539 3,638 (2) Australia 1,420; China 1,292; South Africa 886. Ash and residue containing zinc 242 127 -- Mainly from United Kingdom. Metal including alloys, all forms 238 230 132 Germany 97; South Africa 1.Zinc: Ore and concentrate thousand tons 1,063 1,164 136 Australia 478; Peru 162; Canada 125. Oxides 19,378 13,874 205 China 6,747; Republic of Korea 4,406; Taiwan 1,484. Blue powder 1,995 1,532 -- Singapore 850; Republic of Korea 435; Malaysia 151. Ash and residue containing zinc 26,884 31,165 3,069 Taiwan 12,826; Republic of Korea 8,172; Spain 4,511. Metal including alloys: Scrap 69 31 -- All from Republic of Korea. Unwrought 85,627 63,580 -- China 50,011; Peru 6,479; Canada 2,285. Semimanufactures 6,686 4,130 67 China 1,920; Belgium 1,421; France 408.Zirconium: Ore and concentrate 86,952 84,124 4,702 Australia 45,014; South Africa 29,583; Russia 4,412. Metal including alloys, all forms 704 557 300 France 218; United Kingdom 18.
INDUSTRIAL MINERALSAbrasives, n.e.s.: Natural: Corundum, emery, pumice, etc. 16,234 17,056 3,472 China 6,213; India 5,896; Republic of Korea 654. Artificial: Corundum 172,991 162,405 303 China 125,151; Australia 10,864; Hungary 7,353. Silicon carbide 76,934 68,519 81 China 61,761; Taiwan 8,351; Brazil 3,240. Dust and powder of precious and semiprecious stones including diamonds thousands $34 $1,953 $1,548 China $220; India $128; Brazil $51. Grinding and polishing wheels and stones 5,245 5,200 319 China 3,325; Thailand 797; Austria 133.Asbestos, crude 98,595 79,463 5,127 Canada 44,203; Zimbabwe 14,684; South Africa 6,960.Barite and witherite 108,156 94,272 411 China 87,223; North Korea 6,478; Thailand 160.Boron: Crude natural borates 46,150 44,679 10 Turkey 40,300; Russia 4,341; China 28. Oxides and acids 900 555 401 Russia 154.Cement thousand tons 1,378 1,184 (2) Republic of Korea 1,117; China 48.See footnotes at end of table.
TABLE 11--Continued
JAPAN: IMPORTS OF MINERAL COMMODITIES 1
(Metric tons unless otherwise specified)
Vanadium, metal including alloys, all forms:

13.42 U.S. GEOLOGICAL SURVEY MINERALS YEARBOOK—2002
Sources, 2001United
Commodity 2000 2001 States Other, principalINDUSTRIAL MINERALS--Continued
Clays, crude: Bentonite 224,126 200,022 168,688 China 29,543; New Zealand 820; India 680. Chamotte or dinas earth 12,564 15,388 -- China 6,757; South Africa 5,208; Republic of Korea
3,052. Fire clay 5,809 9,989 3,073 China 6,899; Germany 17. Fuller's earth 8,224 9,140 5,346 China 3,230; Australia 564. Kaolin thousand tons 1,401 1,397 971 Brazil 236; Indonesia 66; China 61. Unspecified 176,333 152,695 3,333 China 148,506; Vietnam 300; Germany 261.Cryolite and chiolite 20 53 -- China 50; Denmark 3.Diamond, natural: Gem, not set or strung thousand carats 2,735 2,574 71 India 1,834; Israel 223; Hong Kong 191. Industrial stones do. 524 1,534 174 Ireland 1,311; United Kingdom 14; Belgium 13. Dust and powder do. 113,250 92,436 19,641 Ireland 33,343; China 23,420; Republic of Korea 3,328.Diatomite and other infusorial earth 9,048 7,427 6,952 China 201; Thailand 180; Canada 38.Feldspar 1,781 1,366 -- India 535; China 407; Malaysia 236.Fertilizer materials: Crude, n.e.s. 64,850 57,635 113 Republic of Korea 21,007; China 18,967; Indonesia
11,948. Manufactured: Ammonia 25,740 20,505 (2) Canada 12,505; Indonesia 7,999. Phosphatic 314,522 139,713 53,386 China 78,345; Republic of Korea 4,672; Israel 3,300. Potassic thousand tons 954 930 217 Canada 437; Russia 85; Israel 40. Unspecified and mixed do. 2,130 496 136 Jordan 92; China 52; Republic of Korea 45.Fluorspar 562,147 519,221 -- China 400,771; Mexico 110,462; Thailand 4,000.Graphite, natural 143,906 143,540 357 China 135,520; North Korea 3,440; Sri Lanka 3,227.Gypsum and plaster thousand tons 2,495 1,982 (2) Australia 920; Thailand 731; Mexico 324.Iodine 363 273 -- Chile 257; Peru 16.Lime 15,728 17,675 -- Thailand 17,303; Republic of Korea 100; France 57.Magnesium compounds: Magnesite, crude 2,244 1,870 -- China 1,690; Australia 180. Oxides and hydroxides 27,598 26,689 1,261 China 16,521; Israel 4,776; Republic of Korea 1,580. Other 238 476 -- All from China.Mica: Crude including splittings and waste 45,369 47,902 426 China 30,248; India 6,824; Canada 3,014. Worked including agglomerated splittings 421 236 1 China 116; Belgium 43; Switzerland 30. Nitrates, crude 22,048 22,024 40 Chile 4,595; Germany 85; China 60.Phosphates, crude thousand tons 899 771 -- China 371; South Africa 201; Jordan 106.Phosphorus do. 26,163 26,541 153 China 25,592; Germany 700; Netherlands 678.Pigments, mineral: Natural crude 249 252 -- Australia 188; Austria 51; United Kingdom 13. Iron oxides and hydroxides, processed 31,123 54,460 3,241 China 11,779; Germany 7,193; Republic of Korea
1,871.Potassium salts 216 72 36 Mainly from Canada.Precious and semiprecious stones, other than diamond: Natural 609 672 11 Brazil 390; China 99; South Africa 76. Synthetic kilograms 119,246 50,706 15,958 Republic of Korea 11,977; China 8,086; Austria 4,948.Pyrite, unroasted 6,243 9,773 -- All from China.Quartz crystal, piezoelectric kilograms 115,272 150,588 11,910 Russia 65,747; China 48,280; Malaysia 8,070.Salt and brine thousand tons 7,974 7,866 1 Mexico 3,868; Australia 3,508; China 293.See footnotes at end of table.
TABLE 11--Continued
JAPAN: IMPORTS OF MINERAL COMMODITIES 1
(Metric tons unless otherwise specified)
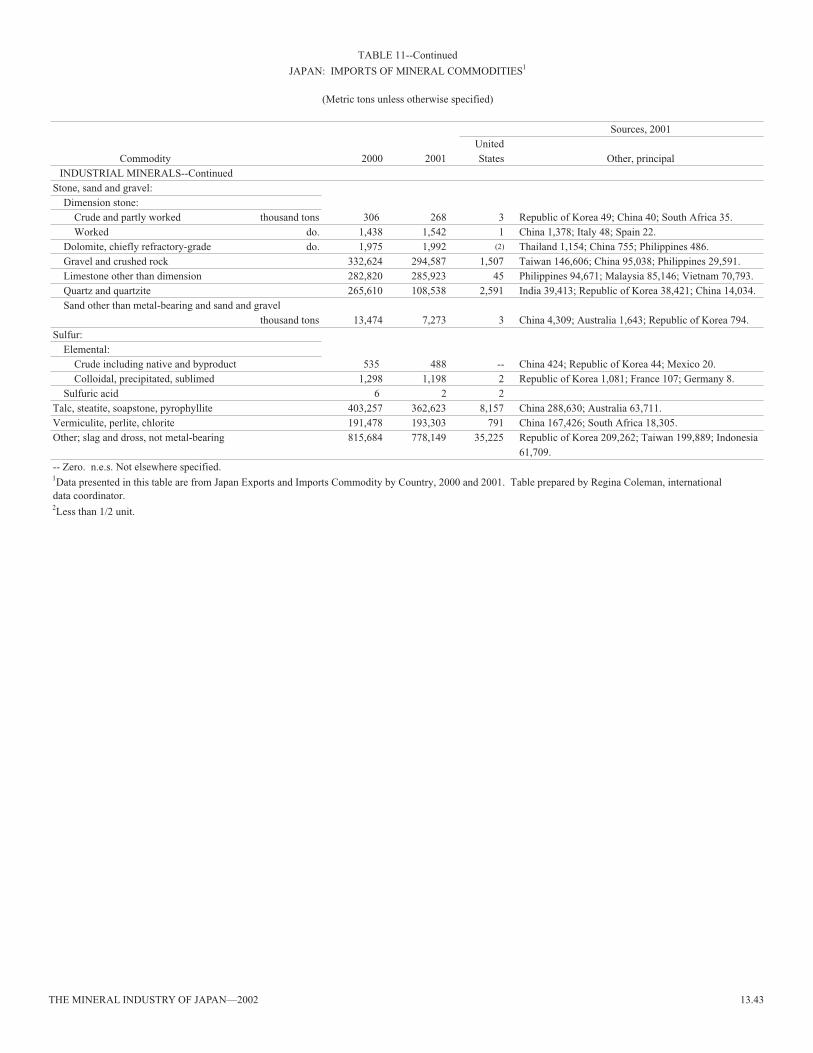
THE MINERAL INDUSTRY OF JAPAN—2002 13.43
Sources, 2001United
Commodity 2000 2001 States Other, principalINDUSTRIAL MINERALS--Continued
Stone, sand and gravel: Dimension stone: Crude and partly worked thousand tons 306 268 3 Republic of Korea 49; China 40; South Africa 35. Worked do. 1,438 1,542 1 China 1,378; Italy 48; Spain 22. Dolomite, chiefly refractory-grade do. 1,975 1,992 (2) Thailand 1,154; China 755; Philippines 486. Gravel and crushed rock 332,624 294,587 1,507 Taiwan 146,606; China 95,038; Philippines 29,591. Limestone other than dimension 282,820 285,923 45 Philippines 94,671; Malaysia 85,146; Vietnam 70,793. Quartz and quartzite 265,610 108,538 2,591 India 39,413; Republic of Korea 38,421; China 14,034. Sand other than metal-bearing and sand and gravel thousand tons 13,474 7,273 3 China 4,309; Australia 1,643; Republic of Korea 794.Sulfur: Elemental: Crude including native and byproduct 535 488 -- China 424; Republic of Korea 44; Mexico 20. Colloidal, precipitated, sublimed 1,298 1,198 2 Republic of Korea 1,081; France 107; Germany 8. Sulfuric acid 6 2 2Talc, steatite, soapstone, pyrophyllite 403,257 362,623 8,157 China 288,630; Australia 63,711.Vermiculite, perlite, chlorite 191,478 193,303 791 China 167,426; South Africa 18,305. Other; slag and dross, not metal-bearing 815,684 778,149 35,225 Republic of Korea 209,262; Taiwan 199,889; Indonesia
61,709.-- Zero. n.e.s. Not elsewhere specified.
(Metric tons unless otherwise specified)
1Data presented in this table are from Japan Exports and Imports Commodity by Country, 2000 and 2001. Table prepared by Regina Coleman, internationaldata coordinator.2Less than 1/2 unit.
TABLE 11--Continued
JAPAN: IMPORTS OF MINERAL COMMODITIES 1