Embed Size (px)
Citation preview

Brigham Young University Brigham Young University
BYU ScholarsArchive BYU ScholarsArchive
Faculty Publications
2011-11-02
The Migratory Response of Labor to Special Economic Zones in The Migratory Response of Labor to Special Economic Zones in
the Philippines, 1995–2005 the Philippines, 1995–2005
Scott R. Sanders Brigham Young University - Provo, [email protected]
David L. Brown Cornell University
Follow this and additional works at: https://scholarsarchive.byu.edu/facpub
Part of the Migration Studies Commons, Other Sociology Commons, Regional Sociology Commons,
and the Rural Sociology Commons
BYU ScholarsArchive Citation BYU ScholarsArchive Citation Sanders, Scott R. and Brown, David L., "The Migratory Response of Labor to Special Economic Zones in the Philippines, 1995–2005" (2011). Faculty Publications. 4803. https://scholarsarchive.byu.edu/facpub/4803
This Peer-Reviewed Article is brought to you for free and open access by BYU ScholarsArchive. It has been accepted for inclusion in Faculty Publications by an authorized administrator of BYU ScholarsArchive. For more information, please contact [email protected], [email protected].

The Migratory Response of Labor to Special EconomicZones in the Philippines, 1995–2005
Scott R. Sanders • David L. Brown
Received: 13 July 2009 / Accepted: 18 October 2011 / Published online: 2 November 2011
� Springer Science+Business Media B.V. 2011
Abstract In the mid 1990s the Filipino government adopted a new export-led
development policy in an attempt to attract new investments and lower the unem-
ployment rates throughout the country. The central idea was to provide foreign
investors more access to Filipino markets and labor by giving them investor tax
breaks and lowering trade tariffs. In return, the government hoped that investors
would bring large amounts of capital into designated areas thereby creating new
jobs and stimulating the domestic economy. The Filipino created the Philippine
Economic Zone Authority (PEZA) and Base Conversion Development Authority
(BCDA) to manage the operation of the Special Economic Zones (SEZ) throughout
the country. Between 1995 and 2005 PEZA and BCDA approved over 200 new SEZ
that have created over four million jobs throughout the country. However, these jobs
are concentrated in a small number of regions. This research uses a modified Harris-
Todaro model and GIS techniques to examine the inter-regional migration response
to the PEZA and BCDA programs’ geographically targeted investments. We show
that areas with the highest job growth have high rates of in-migration while regions
with low SEZ related investments have become migration-sending areas. In addi-
tion, our analysis shows that in-migration to SEZ affected areas has tended to
surpass available jobs resulting in high unemployment. We show how the Harris-
Todaro model in combination with GIS might be used to identify locations for
future PEZA and BCDA investments that are less likely to result in regional pop-
ulation loss or growth in unemployment.
S. R. Sanders (&)
Department of Development Sociology, Cornell University, 115 Warren Hall, Ithaca,
New York 14853, USA
e-mail: [email protected]
D. L. Brown
Department of Development Sociology, Cornell University,
338 Warren Hall, Ithaca, New York 14853, USA
123
Popul Res Policy Rev (2012) 31:141–164
DOI 10.1007/s11113-011-9220-7

Keywords Philippines � Labor migration � Special economic zones �Rural–urban migration � GIS
Introduction and Background
In the mid 1990s the Philippines adopted an export-led growth economic
development policy. Historically the Philippines engaged in protectionist policies
under the Marcos administration. These policies were designed to restrict foreign
ownership and control over business in the Philippines. However, with the fall of the
Marcos regime and the success of the Asian tigers, the Aquino and Ramos
administrations believed that Marcos’ longstanding protectionist policies had
prevented the Philippines from benefiting from the foreign direct investment led
economic boom in South East Asia during the late 1980s and early 1990s. The
Philippines inability to attract FDI was largely due to the remnant policy and
corruption from the Marcos era (Ringuet and Estrada 2003). As a result, in the mid
1990s the Filipino government adopted a new development policy in an attempt to
attract FDI.
The theory driving this new policy approach was centered on trade liberalization
and had the backing and encouragement of the World Bank and the United States.
These policies would also transform the Philippines economy from the inward
oriented policies of the Marcos regime to the outward export production-led model
that was succeeding in other South East Asian countries. The central idea was to
provide investors more access to Filipino markets and labor by easing restrictions on
property ownership, providing investors with tax breaks and lowering trade tariffs
(Guillermo 1996). In return, the government hoped that investors would focus their
investment of industrial capital in designated areas. These investments would create
new jobs that would then stimulate regional economies and eventually expand to
economic growth for the Philippines as a whole. In addition, the capital investments
needed to create new industrial jobs would provide funding for training,
infrastructure upgrades and utility improvements for the Philippines (Tolentino
1994). The allure of potential capital, together with pressure from the international
community, prompted the Filipino government to pursue large capital investments
and adopt an export-led growth strategy.
To implement this new strategy the Filipino government passed two major pieces
of legislation, Republic Act No. 7227, otherwise known as the Bases Conversion
and Development Act of 1992 and Republic Act No. 7916 (R.A. No. 7916 or the
‘‘Act’’) otherwise known as the Special Economic Zone Act of 1995. These bills
created the Base Conversion and Development Authority (BCDA) and the
Philippines Economic Zone Authority (PEZA) to help attract foreign investors,
and to target special areas within the Philippines thought to be particularly suitable
for special economic zones (SEZ). Foreign investments located within SEZ received
tax breaks and other financial incentives from the Filipino government. Today, over
200 SEZ have been created throughout the Philippines. These zones are directly
responsible for creating millions of new jobs and billions of dollars in foreign
investment (Philippines Congressional Planning and Budget Department 2003). At
142 S. R. Sanders, D. L. Brown
123

the national level, the Philippines’ strategy of export-led growth has succeeded in
attracting foreign investment and creating new jobs. However, it is unclear how the
influx of foreign capital has affected the regional distribution of the population and
migration flows within the Philippines. This paper examines how the establishment
of SEZ affected and facilitated the creation of new rural to urban migration flows in
the Philippines. These new rural to urban migration flows may have outpaced job
creation in regions with high concentrations of SEZ, and even lead to an increase in
unemployment. Because reliable migration data are not available at the provincial or
regional level for the Philippines, the examination of migration in the Philippines
can be difficult. However, this paper is able to map predicted changes in migration
flows using a modified Harris-Todaro model. Comparing regional wage discrep-
ancies, the Harris-Todaro model can estimate if there is a high propensity of
migration from one area to another. The scores estimated by the model are then
mapped to show changes in rural to urban migration flows for three different
periods, 1990–1995, 1995–2000, 2000–2005.
Creation of Infrastructure to Stimulate Export-Led Development
In the mid 1990s, BCDA and PEZA actively pursued foreign investment and created
SEZ as locations for new development. In 1992, the BCDA began to convert former
United States (US) military bases into economic centers for future SEZ (Bases
Conversion Development Authority 2006b). The conversion mainly targeted the
former US naval base in Subic Bay, Angeles Airbase northwest of Manila and Fort
John Hay in the northern Cordillera Administrative Region (CAR).1 The conversion
of these military bases into SEZ began in 1992, but the first SEZ were not
established until after 1995.
In 1995, PEZA was created to establish and manage all SEZ that were not located
on former US military bases. While SEZ are the geographic locations of targeted
economic development, they vary from extensive economic districts to concentrated
development within a single building. PEZA or BCDA used a variety of fiscal
incentives to attract business and investors to SEZ in the Philippines. Once an
investment is approved by PEZA or BCDA a company can begin operations within
the designated SEZ and immediately receive the financial benefits granted to it by
PEZA and BCDA. These incentives are diverse and significant. For example,
foreign investors can obtain tax and duty-free importation of capital equipment, raw
materials, spare parts and supplies; income tax holidays of 4–6 years; a special tax
rate of 5% of gross income earned in lieu of all national and local taxes; tax credits
for import substitution; and discounted prices on ‘‘underutilized’’ land (Bases
Conversion Development Authority 2006a; Philippines Economic Zone Authority
2006a).
1 Based on the 2000 census, the Philippines is divided up into 14 regions, including the Metro Manila
area. These regions are administrative divisions that serve primarily to organize the 81 provinces for
administrative and statistical convenience. Although the number of regions has changed over time, this
paper holds the 14 regions defined in the 2000 census constant throughout the paper.
The Migratory Response of Labor 143
123

The SEZ program was also designed to redistribute investment away from the
Metro Manila area by developing ‘‘underutilized land’’ into industrial centers. By
introducing SEZ into largely rural regions outside of Metro Manila, the Filipino
government planned to transform the nation’s economy from one based on
agriculture to a much greater dependence on industry. This transformation would
occur by creating industrial jobs within the SEZ, and by establishing peripheral
industries to support the needs of the SEZ, their businesses and employees. For
example, the steel industry generated jobs in the mills as well as in other industries
providing essential inputs for the mills as well as in other establishments that
produce a variety of manufactured exports using the steel. In addition, the
government believed that PEZA would generate a positive multiplier stimulating
Filipino employers because the day-to-day needs of factory workers and their
families were expected to be supplied by Filipino owned establishments (Guillermo
1996). The Filipino government hoped it could transform agricultural regions with
relatively few employers per hectare into industrial centers employing thousands of
workers and attracting international trade and business.
SEZ created by both BCDA and PEZA vary in size and type of operation from
the East Cyber Gate Building in Metro-Manila that houses software engineering
firms to the Bataan Export Processing Zone which is over 1,700 hectares and houses
factories that produce a broad array of products ranging from garments to agro-
chemicals (Philippines Economic Zone Authority 2006b). The main investments in
SEZ between 1995 and 2001 included electronic parts and products (64.3%),
electrical machinery (13.8%), and transport/car parts (7.4%) (Philippines Economic
Zone Authority 2006b).
When PEZA and BCDA were created, they were responsible for the operation of
a handful of SEZ, however by 2005 the number had grown to over 200 (Fig. 1).2
While SEZ have been established throughout the Philippines, they tend to
concentrate in particular parts of the country. As can be seen in Fig. 1, PEZA
and BCDA especially targeted Regions 3 and 4 for the development of SEZ. One
explanation for this concentration is that two former US military bases, Subic Bay
and Angeles Airbase, are located in Region 3. These two former bases fall under the
BCDA and account for 17 of 45 SEZ in the Region. Another reason for the
concentration of SEZ in Regions 3 and 4 is their well-developed infrastructure. In a
2002 study, Makabenta determined that sound infrastructure was the strongest
determining factor for investors and PEZA when selecting SEZ sites. Accordingly,
strong infrastructure in Regions 3 and 4 made them attractive locations for foreign
investors, for PEZA and for BCDA (Makabenta 2002). In addition, PEZA selected
Regions 3 and 4 in a conscious effort to spread economic growth from the Metro
2 The map below shows the location of all SEZ in the Philippines and divides the Philippines by region.
The remainder of the paper will examine how SEZ have impacted the Philippines on a regional level, and
are based on the 14 regions defined in the 2000 census. These regions are strictly for statistical geography
and have no political offices associated with them. Senators, governors and other political officials are
elected at the provincial level. However, regions are used by the census office and other national
government agencies as a useful level for reporting sub-national statistics. As a result, the regional level
was selected for analysis because consistent and accurate data are available from the Philippines
government, while data at the provincial level are more difficult to obtain and are less reliable.
144 S. R. Sanders, D. L. Brown
123

Manila area into its surrounding regions. For example, Region 4 was targeted as the
location of new manufacturing plants that required large amounts of land because
such sites were not available in the Metro Manila area. BCDA and PEZA hoped that
this targeted approach for the development of Regions 3 and 4 would increase
economic prosperity and lower the region’s unemployment rates. The development
of these regions would then give investors alternatives to the Metro Manila area
(Philippines Economic Zone Authority 2006b).
Have BCDA and PEZA Succeeded in Generating Economic Development?
Between 1995 and 2005 the BCDA and PEZA reported that over 3.1 million jobs
were created within the nation’s 200 SEZ (Bases Conversion Development
Authority 2001; Bases Conversion Development Authority 2006b; Philippines
Economic Zone Authority 2006c). As shown in Table 1, 46.6% of the new jobs
were created in Region 4 and 34.7% in Region 3. One reason so many more jobs
were created there than in any other region, approximately two million between
1995 and 2005, is that the majority of investments in Region 4’s SEZ have been
manufacturing plants that require a large amount of labor. In contrast, those created
in regions such as Metro Manila (NRC) tend to be software engineering and service
oriented businesses with smaller staff requirements (Philippines Economic Zone
Authority 2006b).3
Fig. 1 Location of SEZ, 2005. (Bases Conversion Development Authority 2006a; Philippines EconomicZone Authority 2006a)
3 Note: Table 1 shows the number of jobs directly created within SEZ. It does not include peripheral
jobs. In addition, there is a discrepancy between Fig. 1, the number of regions reporting SEZ, and
The Migratory Response of Labor 145
123

Since 1995, SEZ-created jobs in Regions 3 and 4 have grown faster and increased
more in total jobs than in any of the Philippine’s other regions. Since these figures
do not include the peripheral/support jobs that economists and government officials
anticipated would be generated with the establishment of SEZ, the total number of
new jobs in these regions could be well over two million. Ironically, however, the
creation of new jobs in SEZ has not resulted in lower unemployment levels in the
affected regions. Not only has the unemployment rate increased in Regions 3 and 4
since the establishment of SEZ, but the rate of increase has been higher than
elsewhere in the Philippines (See Table 2).
Paradoxically, at the same time that unemployment rates have increased in
Regions 3 and 4, these regions experienced the highest population growth rates in
the Philippines (2005 Philippines Statistical Yearbook, 2005). Moreover, our
analysis of the components of population change showed that population growth in
Regions 3 and 4 is largely the result of net in-migration.4 (See Table 3) Region 3
had a net migration of 8,51,757 between 2000 and 2005, 3,54,994 from 1995 to
2000 and 9,469 between 1990 and 1995. The same process showed that a net of
1,603,356 moved to Region 4 between 2000 and 2005, with an increase of
1,201,769 between 1995 and 2000 which is an increase of almost a million net in-
migrants compared with 2,16,099 between 1990 and 1995. In contrast, Regions such
Table 2 Unemployment rates
for Philippines, Regions 3 and 4,
1995–2005
National Statistical Coordination
Board 2006
Philippines (%) Region 3 (%) Region 4 (%)
1995 7.5 8.7 9
2000 8.4 10.1 11.3
2005 10.3 12.5 14.1
Table 1 Job growth attributed
to SEZ by selected Regions,
1995–2005
Bases Conversion Development
Authority (2006b); Philippines
Economic Zone Authority
(2006b)
Region Total SEZ Jobs Percentage of SEZ Jobs
CAR 44,686 1.1
NCR 1,21,747 2.9
Region 3 1,456,718 34.7
Region 4 1,958,764 46.6
Region 7 5,73,578 13.7
Region 8 30,906 0.7
Region 10 2,095 0.0
Region 12 13,263 0.3
Footnote 3 continued
Table 1, the number of regions reporting jobs. For example, Fig. 1 indicates that Region 11 had nine SEZ
but zero jobs. Any discrepancy between Fig. 1 and Table 1 can be attributed to one of two reasons. (1)
The SEZ in a region did not report the number of jobs created to BCDA or PEZA, or (2) the SEZ was
approved by BCDA or PEZA, but investors later pulled out. The later is the case of a number of SEZ in
Region 7 where plans to open shipyards to repair supertankers were relocated to Singapore (Philippines
Business Week, Nov. 11, 2004).4 We used the vital statistics method to estimate migration at the regional level between 1990 and 2005.
146 S. R. Sanders, D. L. Brown
123

Ta
ble
3N
etm
igra
tio
n,
nat
ura
lin
crea
sean
dg
row
thra
tes
for
all
Reg
ions,
19
90–
20
05
Net
mig
rati
on
Nat
ura
lin
crea
seG
row
thra
te
90
–9
59
5–
00
00
–05
90
–95
95
–00
00
–05
90
–95
95
–0
00
0–
05
Met
roM
anil
aa4
84
,01
02
60
,58
34
37
,64
71
,021
,63
87
17
,93
77
83
,22
03
.31
.56
2.1
1
CA
R-
20
,72
8-
14
,35
9-
45
,94
91
29
,37
51
24
,93
32
01
,28
01
.71
1.8
21
.5
Reg
.1
-1
18
,41
43
00
,31
13
2,6
28
37
1,6
62
96
,27
73
12
,80
01
.32
.15
1.1
Reg
.2
-6
7,3
92
47
,47
5-
12
4,9
26
26
2,8
82
22
9,6
49
36
3,2
54
1.5
12
.25
1.1
3
Reg
.3
9,4
69
35
4,9
94
85
1,7
57
72
4,0
84
74
3,3
81
83
8,2
80
2.1
23
.17
2.3
6
Reg
.4
21
6,0
99
1,2
01
,769
1,6
03
,356
96
3,8
98
1,0
48
,790
90
5,8
90
3.5
34
.03
3.2
4
Reg
.5
-4
5,9
16
-6
3,5
19
49
,07
84
61
,22
24
24
,88
13
74
,05
11
.91
1.6
81
.23
Reg
.6
-4
5,8
19
46
,92
72
01
,08
84
29
,42
43
87
,17
34
31
,51
71
.31
.56
1.3
5
Reg
.7
13
8,6
12
40
2,1
16
17
9,7
67
55
9,0
76
29
0,2
49
51
1,9
08
1.6
52
.81
1.5
9
Reg
.8
98
,64
13
6,0
08
5,4
25
21
3,7
86
20
7,4
30
29
7,1
56
1.8
41
.51
1.1
2
Reg
.9
77
,29
47
6,7
60
-7
8,2
10
25
7,6
75
21
9,7
89
21
7,0
96
2.4
22
.12
1.8
3
Reg
.1
0-
35
,24
01
0,0
80
18
7,7
14
32
0,9
58
25
4,2
33
25
9,1
38
2.3
21
.99
1.6
7
Reg
.1
11
06
,07
11
97
,85
8-
13
4,9
93
49
1,3
56
38
7,3
19
31
6,6
11
2.6
42
.41
1.7
1
Reg
.1
21
32
,29
91
96
,52
91
91
,64
01
94
,55
11
73
,88
02
25
,28
22
.83
2.6
92
.41
Nat
ion
alS
tati
stic
alC
oo
rdin
atio
nB
oar
d2
00
6;
Ph
ilip
pin
esN
atio
nal
Cen
sus
(19
98a,
b);
Ph
ilip
pin
esN
atio
nal
Cen
sus
(20
05)
aT
he
calc
ula
tio
ns
for
the
Met
roM
anil
aar
eaex
clu
de
the
mun
icip
alit
ies
of:
Pas
ig,
Pas
ayan
dM
anil
aci
ty.
Th
ese
thre
ear
eas
wer
en
etin
-mig
ran
tar
eas
wit
hp
osi
tiv
e
po
pu
lati
on
gro
wth
rate
sab
ov
e2
in1
99
5an
d2
00
5.
Ho
wev
er,
the
Ph
ilip
pin
es2
00
0C
ensu
sin
dic
ates
that
thes
ear
eas
exp
erie
nce
dn
egat
ive
gro
wth
rate
sas
hig
has
-3.
Itis
un
clea
rif
this
dat
ais
accu
rate
or
the
resu
lto
fm
easu
rem
ent
erro
r.A
sa
resu
lt,
Pas
ig,
Pas
ayan
dM
anil
aci
tyh
ave
bee
nre
mo
ved
fro
mth
eca
lcu
lati
on
s
The Migratory Response of Labor 147
123
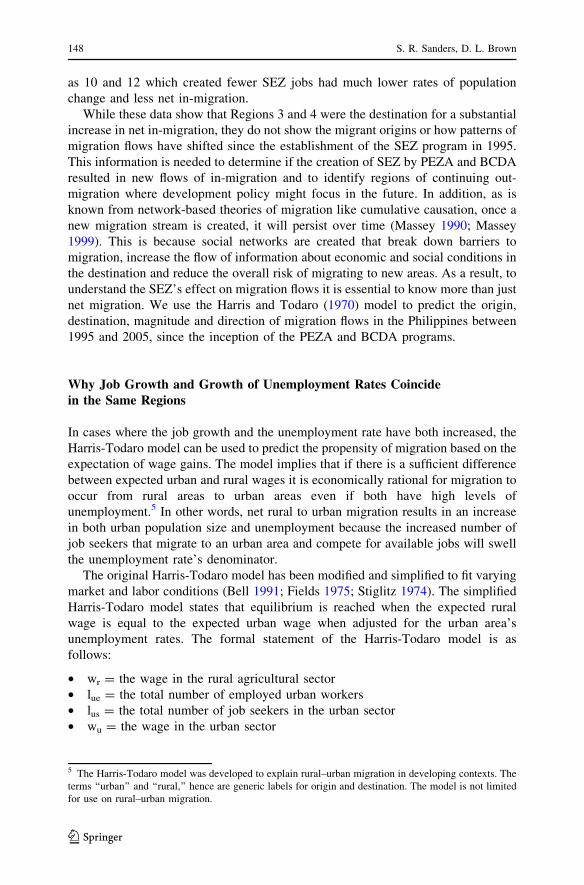
as 10 and 12 which created fewer SEZ jobs had much lower rates of population
change and less net in-migration.
While these data show that Regions 3 and 4 were the destination for a substantial
increase in net in-migration, they do not show the migrant origins or how patterns of
migration flows have shifted since the establishment of the SEZ program in 1995.
This information is needed to determine if the creation of SEZ by PEZA and BCDA
resulted in new flows of in-migration and to identify regions of continuing out-
migration where development policy might focus in the future. In addition, as is
known from network-based theories of migration like cumulative causation, once a
new migration stream is created, it will persist over time (Massey 1990; Massey
1999). This is because social networks are created that break down barriers to
migration, increase the flow of information about economic and social conditions in
the destination and reduce the overall risk of migrating to new areas. As a result, to
understand the SEZ’s effect on migration flows it is essential to know more than just
net migration. We use the Harris and Todaro (1970) model to predict the origin,
destination, magnitude and direction of migration flows in the Philippines between
1995 and 2005, since the inception of the PEZA and BCDA programs.
Why Job Growth and Growth of Unemployment Rates Coincidein the Same Regions
In cases where the job growth and the unemployment rate have both increased, the
Harris-Todaro model can be used to predict the propensity of migration based on the
expectation of wage gains. The model implies that if there is a sufficient difference
between expected urban and rural wages it is economically rational for migration to
occur from rural areas to urban areas even if both have high levels of
unemployment.5 In other words, net rural to urban migration results in an increase
in both urban population size and unemployment because the increased number of
job seekers that migrate to an urban area and compete for available jobs will swell
the unemployment rate’s denominator.
The original Harris-Todaro model has been modified and simplified to fit varying
market and labor conditions (Bell 1991; Fields 1975; Stiglitz 1974). The simplified
Harris-Todaro model states that equilibrium is reached when the expected rural
wage is equal to the expected urban wage when adjusted for the urban area’s
unemployment rates. The formal statement of the Harris-Todaro model is as
follows:
• wr = the wage in the rural agricultural sector
• lue = the total number of employed urban workers
• lus = the total number of job seekers in the urban sector
• wu = the wage in the urban sector
5 The Harris-Todaro model was developed to explain rural–urban migration in developing contexts. The
terms ‘‘urban’’ and ‘‘rural,’’ hence are generic labels for origin and destination. The model is not limited
for use on rural–urban migration.
148 S. R. Sanders, D. L. Brown
123

At equilibrium,
wr ¼lue
lus
wu
In other words, equilibrium is reached when the expected rural wage (wr) equals
the expected urban wage (wu), when the urban wage is multiplied by the number of
available urban jobs (lue) over the total number of both unemployed and employed
laborers in the urban sector (lus) or lue
lus
� �. If the urban wage (wu) after it has been
adjusted for urban unemployment lue
lus
� �is higher than the rural wage (wr), then rural
to urban migration is expected to occur:
wr\lue
lus
wu
Conversely, urban to rural migration will occur if:
wr [lue
lus
wu
Therefore, migration from rural areas to urban areas will increase if:
• Urban wages (wu) increase, increasing the expected urban income
• Urban unemployment (lus) decreases, increasing the expected urban income
• Urban job creation increases the number of available jobs in the urban sector
(lue), increasing the expected urban income
• Agricultural productivity decreases, lowering wages in the agricultural sector
(wr), decreasing the expected rural income
Also, rural to urban migration is possible if the urban wage after it is discounted
for the urban unemployment rate lue
lus
wu
� �is lower than the rural wage rate (wr).
Therefore, equilibrium is achieved when the discounted urban wage is equal to the
rural wage.
The model is based on three assumptions: (1) that the labor pool has the skills
needed to fill any job opening in either rural or urban labor markets, (2) agrarian
employment, subsistence farming, day laborer etc., is always an option for people in
rural areas and (3) migration is risk neutral. The first assumption is realistic with
respect to SEZ. The overwhelming majority of the jobs created are low skill
manufacturing and service jobs, and the skill set needed to obtain these jobs is
common to most of the Filipino labor force. Therefore, it is unlikely that a
significant number of urban jobs are being created that cannot be filled by rural
migrants. The second assumption holds for many parts of the Philippines because
employment rates in primarily rural regions rage from 96 to 99% (Philippines
National Statistics Office 1998a). However, regions like Metro Manila and Regions
3 and 4, which are largely urban, have employment rates lower than 90%.
Therefore, to ensure that the model produces reliable migration estimates a modified
Harris-Todaro model will be used where both rural and urban wage rates will be
discounted by unemployment.
The Migratory Response of Labor 149
123

In the modified Harris-Todaro model lre equals the total number of employed
rural workers and lrs equals the total number of job seekers in the rural sector. Rural
unemployment, lrs and lrs, will then discount the rural wage, wr, and be compared to
the urban sector lue
lus
wu
� �. Therefore, at equilibrium the modified model is:
lre
lrswr¼
lue
lus
wu
Finally, the third assumption assumes there is no risk or loss associated with
migration. This assumption is not practical in the real world. There are many
obvious risks associated in migration. Migrants could be promised a job, but none
are available when they arrive in the new area, theft or accidents can occur during
the actual migration, migrants could be socially rejected in their new communities
or adequate housing may not be available in the new area. This assumption that
migration is risk neutral causes the model to overstate the likelihood of migration. In
order to adjust for this, we will only map significant migration flows, e.g., those with
an HT-score that is B1.10.
Applying the Harris-Todaro Model to Inter-Regional Migrationin the Philippines
The Harris-Todaro model is a two-sector analysis between pairs of urban and rural
regions. In order to apply the model and map the resulting migration flows
throughout the Philippines, the model is calculated between pairs of regions, for
example the Metro Manila area and Region 1. In every calculation the regional
weighted average minimum wage is calculated from government data and used for
either wr or wu depending on whether the region is considered to be urban or rural.
The regional weighted average minimum wage is calculated by first determining the
provincial average minimum wage by taking the provincial minimum wage for both
rural and urban sectors and weighting them according to their respective
populations. Once the provincial average minimum wage has been created for all
the provinces in a region, the regional weighted average minimum wage is
calculated by averaging the provincial weighted average minimum wages and
weighting them by their respective total populations.
The selection of the urban labor sector or,lue
lus
wu is based on the percentage of
urban population for each region. For each calculation between two regions, the
region with the higher percentage of urban population in each pair is designated as
the urban sector and its regional weighted average wage is used to calculate wu.6
6 Urban and rural populations are based on 2005 PopCen definitions and held constant through each time
period. The Philippine National Statistics Coordination Board defines barangay (similar to a village or
neighborhood) as urban if a barangay: (1) has a population size of 5,000 or more, or (2) has at least one
establishment with a minimum of 100 employees, or (3) has 5 or more establishments with a minimum of
10 employees, and 5 or more facilities within the 2 km radius from the barangay hall. Using this
definition, the total urban and rural populations were aggregated to the regional level for 1995, 2000 and
2005.
150 S. R. Sanders, D. L. Brown
123

Therefore the region with the lower percentage of urban population in each pair is
selected as rural sector and its regional weighted average wage used as wr. For
example Metro Manila area, which has the highest percentage of urban population,
is always selected as the urban region and its regional weighted average wage is
used as wu. For selection of the rural region, Cordillera Administrative Region
(CAR) is always selected as the rural sector and wr because it has the lowest
percentage of urban population. This process was used to determine the urban and
rural sectors in each pair of the 91 possible pairings of regions in the Philippines.
Each paired comparison was calculated for three time points: 1995, 2000 and 2005.
In order to map migration flows and determine the significance of their changes
over time, the results of each Harris-Todaro model are expressed as the proportionlue
lus
wu over lrelrs
wr (see below). The resulting number is termed the HT score. To
produce this score the equilibrium model was modified to:
lue
luswu
lrelrs
wr
¼ 1 ; where 1 = HT score
Rural to urban migration occurs when the HT score is greater than one, with the
tendency for migration increasing with higher HT scores:
lue
luswu
lrelrs
wr
[ 1
Conversely, urban to rural migration will occur if the HT score is lower than one:
lue
luswu
lrelrs
wr
\1
1990–1995 Net Migration Flows According to the Harris-Todaro Model
The resulting HT scores were used to map the migration predictions throughout the
Philippines. By using ArcGIS and Tobler’s Flow Mapper the variation and change
of migration flows was mapped for the periods 1990–1995, 1995–2000 and
2000–2005.
The mapped flows (see Fig. 2) represent calculated differences between the
expected wages in Regions 2, 8, 9, 10 and 12 and the expected wage in Metro
Manila area between 1990 and 1995, and range from five to eight pesos per day.
Figure three shows all migration flows with significant HT scores. All other regions
reported either zero migration or insignificant HT scores. The data in Fig. 2 show
migration flows to Manila predicted by the Harris-Todaro model between 1990 and
1995, when PEZA had just been established. As can be seen, only minor flows from
smaller rural regions to Metro Manila area are predicted at that time. The map
shows predicted migration flows with a HT score of 0.91–0.95 which equals a 5–9%
difference in expected average daily regional wage. For example, the average
regional wage after being discounted for unemployment in Region 8 is 88 pesos a
The Migratory Response of Labor 151
123

day while in Metro Manila Area the average wage after unemployment is accounted
for is 101 pesos. That means the average worker in Region 8 can expect to earn 40
extra pesos a week if they choose to migrate to the Metro Manila Area.
These predictions are consistent with census migration data from 1990 to 1995
which show that most large migration flows within the Philippines originated in
southern regions. In addition, the Harris-Todaro model indicates that Regions 8 and 9
had the highest propensity for migration. This finding is consistent with 1995 census
data that indicated that Regions 8 and 9 had the highest number of migrants to the
Metro Manila Area. The 1995 census indicated that Metro Manila gained 52,541
migrants from Region 9 and 46,452 migrants from Region 8 (Philippines National
Statistical Coordination Board, 1997). These predictions are also consistent with
Fig. 2 Significant inter-regional HT migration flows Between 1990 and 1995
152 S. R. Sanders, D. L. Brown
123

population growth patterns for this time period. The Metro Manila Area reported
higher annual growth rates than any other region between 1990 and 1995, 3.3%
compared with a national average of 2.3%. Therefore, the migration tendencies
predicted by the model are supported by census data and appear to accurately depict
overall migration trends between 1990 and 1995.
1995–2000 Migration Flows Centered on the Metro Manila Area
The Harris-Todaro model predicts an increase in the amount of interregional
migration between 1995 and 2000 (see Fig. 3). The Metro Manila Area continued to
be the largest destination for net in-migration with increased volumes of predicted
Fig. 3 Significant inter-regional HT migration flows Between 1995 and 2000
The Migratory Response of Labor 153
123

in-migration from the existing 1990–1995 migration origin areas as well as from
new regions. Region 5, located southeast of Manila, is predicted to have the highest
propensity for out migration to Manila. Its HT Score of 1.32 equals a 43%
difference in expected wages compared with the Metro Manila Area after
unemployment in Metro Manila is accounted for. Even after unemployment is
controlled, the expected average daily wage in Metro Manila compared with Region
5 is greater than 38 pesos a day, or a net gain of 192 pesos per week. Considering
the average daily income for Region 5 was 89 pesos, this difference in income helps
to illustrate why migration to the Metro Manila Area makes economic sense
(Philippines National Statistical Coordination Board 2001).
1995–2000 Migration Flows Centered on Region 3
The data in Fig. 3 show that Region 3 had the largest flows of in-migration from
Regions 5, and 8 during 1995–2000 as well as other minor flows from CAR,
Regions 1, 9 and 12. This is strikingly different than between 1990 and 1995 when
Region 3 received very little migration from other regions. During this time Region
3 went from 9,469 net in-migrants between 1990 and 1995 to 354,994 net in-
migrants between 1995 and 2000. It seems likely that increased migration to Region
3 is a result of job generation associated with SEZ established by both BCDA and
PEZA. The largest flow to Region 3 originated from Region 8. The HT Score for
migration from Region 8 to Region 3 is 1.32 or a 21.5% difference in the expected
daily wage. This is equal to 19 pesos a day or 95 pesos a week.
This predicted migration flow between Regions 3 and 8 based on the HT model is
supported by census data on ethnicity. Region 8 is the home of one of the
Philippine’s major ethnic groups, the Eastern Visayan and Waray. Between 1995
and 2000 Region 3 reported a 47% increase in the number of Visayans, and a 10%
in the number of Waray (Philippines National Statistical Coordination Board 1998b;
Philippines National Statistical Coordination Board 2006). Hence, the census
ethnicity data provide corroborating support to the HT migration predictions for
Region 3.7
1995–2000 Migration Flows Centered on Region 4
Region 4 also experienced a dramatic increase in the amount of net in-migration
between 1995 and 2000 (see Fig. 3). Migration flows to Region 4 are consistent
with the region’s increased population growth rate between 1995 and 2000. During
7 We acknowledge that there are limitations using ethnicity as means to support the models predicted
findings. Due to the limitation of data, we do not know the specific origin of these new ethnic households.
Many residents in Northern Mindanao, including Region 10, speak the Visayan language. We were not
able to obtain more detailed migration and ethnicity census ‘‘public use data’’ from the NSO. However,
while the data used to support the models findings are limited, results do show an increased south to north
migration pattern consistent with the models findings and the theory of cumulative causation.
154 S. R. Sanders, D. L. Brown
123

this time, the annual population growth rate of Region 4 surpassed the growth rate
of the Metro Manila Area and became the country’s fastest growing region. It is
likely that the rapid increase of jobs created within SEZ located in Region 4
contributed significantly to the increased number of migrants to Region 4.
The strongest predicted migration in-flows to Region 4 are from Regions 5 and 8.
The difference in expected average daily wage when unemployment is account for
in Region 4 is 19% or 17 pesos a day in Region 5, and 18% or 16 pesos a day in
Region 8. Similar to Region 3, census data on ethnicity provide corroborating
evidence consistent with the HT model’s migration prediction for Region 4. In
2000, the National Statistics Office reported that Region 4 experienced a 45%
increase in the number of people who classify themselves as Visayan and a 14%
increase in Waray, the major ethnic groups in Region 8, and a 37% increase in the
number of people classifying themselves as Bikol, the major ethnic group in Region
5 (Philippines National Census 1998b; Philippines National Census 2006). The
increase in Visayan and Bikol populations helps to account for the two largest
migration in-flows to Region 4. The likelihood of migration to Region 4 from
Region 5 and 8 is also supported by the fact that the national highway runs from
Region 8 through Region 5 and directly into Region 4. Issah et al. (2005) report that
the presence of infrastructure facilitates migration by removing potential logistical
barriers for migrants and by increasing the flow of employment information
between urban and rural areas (Issah et al. 2005). Accordingly, the 1995–2000
Harris-Todaro migration predictions for Region 4 are consistent with census data
and other research findings.
1995–2000 Migration Flows and Estimates by the Residual Method
Migration estimates using the residual method confirm the results derived from the
Harris-Todaro method. While residual estimates yield a net migration figure for
each region, they do not produce flows data between various origin and destination
regions as is possible with the Harris-Todaro method. Accordingly, the residual
migration analysis is presented as a way of evaluating the reliability of the Harris-
Todaro estimates shown above. The residual population was calculated for all
regions between 1995 and 2000. This was done for each region by subtracting the
total number of registered deaths from the total number of registered births. The
resulting natural increase was then subtracted from the difference in population
between 1995 and 2000. Compared with 1995, Region 4 had a residual population
of 1,201,769 in 2000 while Region 3 had a residual population of 3,54,944. These
two regions had the highest net in-migration in the Philippines between 1995 and
2000. In contrast, Region 5 had a substantial net migration loss with a residual of -
63,519. Regions 8, 9 and CAR also recorded negative residual populations or a
decrease in net in-migration, which are consistent with the 2000 HT-scores. While
these data do not show origins and destinations of the migration flows, they confirm
that net in-migration is occurring to Regions 3 and 4 at the same time that net out-
migration is occurring in Regions 5, 8, 9 and CAR.
The Migratory Response of Labor 155
123

Migration Flows Between 2000 and 2005
The data in Fig. 4 show that the migration flows to the Metro Manila Area predicted
by the HT model for 2000–2005 are similar to those predicted during the previous
5 years. Although there are some slight variations in the magnitude of the flows, the
overall trends are similar to those predicted between 1995 and 2000. The 2005
model predicts that Metro Manila has remained the Philippines major destination for
internal migration.
The data in Fig. 4 also show migration flows to Regions 3 and 4 during 2000 and
2005. These data indicate that Region 3 continued to attract migrants from southern
regions between 2000 and 2005. However, the largest source of in-migration shifted
from Regions 5 and 8 in 2000 to Region 9 during the 2000–2005 period. All other
Fig. 4 Significant inter-regional HT migration flows Between 2000 and 2005
156 S. R. Sanders, D. L. Brown
123

2005 migration predictions for Region 3 were similar to those shown for 2000. The
2000–2005 HT model predictions for Region 4 show that migration flows to the
region originated in an increased number of locations. Overall, the model shows that
migration to Region 4 continued to increase in 2005 and are consistent with residual
estimations of migration that show negative net migration in Region 9 with
decreased net migration in Regions 1, 8 and 12.
Mapping predicted migration flows with the modified Harris-Todaro model
illustrated that migration flows have shifted to Regions 3 and 4 after PEZA and
BCDA began locating SEZ in these regions. This indicates that the jobs created in
the SEZ in Regions 3 and 4 have increased the number of migrants to the area,
which helps to explain why both population and the rate of unemployment have
steadily increased in Regions 3 and 4 since 1995.
In addition, it is likely that increased migration to Regions 3 and 4 will continue.
Consistent with Massey’s theory of cumulative causation, each additional migrant
helps to create the social structure needed to sustain further migration flows (Massey
1990; Massey 1999). Social networks and capital flows between origins and
destinations increase the flow of information about the job market, housing and
other living conditions, thereby reducing the costs and risks associated with
migration. As a result, once a new migration flow is created it will increase in
strength over time. The analysis shows that Regions 3 and 4 became new
destinations for internal migrants during 1995 and 2000, subsequent to the
establishment of the PEZA and BCDA development programs and their resulting
SEZ. Moreover, these new migration flows to Regions 3 and 4 between 1995 and
2000 increased in strength during the next 5 years, indicating that the social
structures promoting migration to these areas has strengthened. Hence, the Harris-
Todaro predictions of Filipino migration flows between 1995 and 2005 are
consistent with migration theory and reflect PEZAs and BCDAs roles in
redistributing the nation’s population.
Conclusions and Policy Implications
The implementation of PEZA and BCDA in 1995 has resulted in substantial
population redistribution within the Philippines. Consistent with the Harris-Todaro
model, rural workers moved from low wage rural areas to more highly urbanized
regions where the PEZA and BCDA programs had established SEZ as the location
of highly subsidized economic development schemes. This research shows that this
population redistribution increases the pressure on urban labor markets to integrate a
growing number of potential workers. Accordingly, the urban unemployment rate
has tended to increase because the number of in-migrating workers has exceeded the
number of new jobs created. Our analysis shows that high levels of rural to urban
migration result between 1995 and 2005 in regions where the PEZA and BCDA
programs have produced the most jobs. Moreover, the research showed that these
same regions experienced increased higher than average increases in unemployment
despite the large number of jobs created by PEZA and BCDA. If reduced
unemployment is one of PEZA’s and BCDA’s goals, we believe that program
The Migratory Response of Labor 157
123

managers should take the geo-spatial location of SEZ into consideration, and direct
FDI into areas with a lower propensity for in-migration. Because migration data
from the Philippines national census is limited, this research suggests that PEZA
and BCDA consider using the modified Harris-Todaro model to identify
geographical areas with a low current migration potential. As a result, they would
be able to map internal migration between origins and destinations thereby
identifying locations where economic development would absorb excess rural labor
rather than stimulating rural out-migration to Manila or Regions 3 and 4 where SEZ
are currently concentrated. In addition, since the model is based on quarterlyprovincial minimum wages, inter-provincial migration estimates could be updated
frequently thereby providing an accurate representation of current migration trends
and potentials.
Using the HT Scores to Identify Potential SEZ Sites
Figure 5 demonstrates how PEZA and BCDA officials could use the modified
Harris-Todaro model to identify future SEZ locations. By using an advanced
interpolation technique in ArcGIS called kriging, a map can be produced that shows
the variation of migration likelihoods throughout the Philippines (ESRI 2007).
Kriging uses the average HT score for each region, and then calculates the value of
unknown cells across a statistical surface. The resulting map then shows the average
HT score for 2005 across the entire Philippines. From this map it is easy to
recognize areas that have an average HT score below 1 indicating a low propensity
for in-migration. PEZA, BCDA and potential investors can then overlay the location
of national highways, major ports, airports and other variables that investors require
to find a location that meets both the business and logistical needs of future investors
and is located in an area currently experiencing low in-migration (Philippines
Economic Zone Authority 2006b).
Figure 5 was calculated using the 2005 HT scores. Areas with the highest
propensity for in-migration are shown in black; areas with the lowest potential are
colored white. As expected, the map shows that the Metro-Manila area and parts of
Region 3 and 4 have the highest tendency for in-migration. According to the Harris-
Todaro model, any additional development or job creation in these areas is likely to
increase the migration flow, causing additional pressure on urban labor markets and
a probable increase in unemployment rates. In contrast, the analysis identifies four
areas with low migration potential that might be good locations for future SEZ sites.
Starting in the north, the analysis identifies the Laoag metropolitan area as a
potential location for future SEZ. The city is connected with the Metro Manila area
by national highways and has convenient access to a number of ports in the region.
It also has the third largest international airport in the Philippines with regularly
scheduled flights to Taiwan. San Fernando metropolitan area is another possible
sight for SEZ in the northern Philippines. The city has the largest port in the
northern Philippines and is connected to Manila by multiple highways. Locating
SEZ in either of these locations would help to establish an economic center for the
northern Philippines. In addition, because of the region’s current low propensity of
158 S. R. Sanders, D. L. Brown
123

in-migration, new jobs created in either of these locations are not likely to result in
increased unemployment rates and regional out-migration.
The Iloilo metropolitan area and Metropolitan Cebu are also possible locations
for future SEZ given that have the second and third largest ports in the Philippines
respectfully. Cebu also has the second largest airport in the Philippines. The one
drawback of locating in this area is a lack of national highway connections with the
rest of the nation’s spatial economy. Because these two cities are located on islands,
ground transportation is limited. However, because companies in SEZ must be
engaged in exportation, the large ports and airports located there would seem to be
Fig. 5 Map of 2005 HT scores showing migration tendencies
The Migratory Response of Labor 159
123

strong inducement for many investors. Also, based on the Harris-Todaro model,
these areas have some of the highest current out-migration flows in the country. The
formation of an economic center in the southern tier of the Philippines similar to the
one established by PEZA in Region 4 would help to alleviate migration to Metro-
Manila as well as to Regions 3 and 4. As a result, economic development would be
spread more widely throughout the nation, and the pressure on urban labor markets
might be lessened thereby diminishing the urban unemployment rate.
This paper demonstrates the benefits of considering policy impacts at a
disaggregated regional level. The regional level migration model used in this
research illuminates how the Philippines’ regional development policies (PEZA and
BCDA) have affected regions differently by placing SEZ in some regions rather
than in others. As a consequence, PEZA and BCDA contribute to regional
inequality, stimulating job and population growth in some areas and out-migration
from others. The Harris-Todaro model and GIS techniques used in this research
demonstrate how spatial models can be used by policymakers for gaining insights
into the relative merits of alternative locations as sites of future SEZ.
Appendix
See Appendix Table 4, 5 and 6.
160 S. R. Sanders, D. L. Brown
123

Ta
ble
4H
Tsc
ore
s,1
99
0–
19
95
NC
RC
AR
Reg
ion
1R
egio
n2
Reg
ion
3R
egio
n4
Reg
ion
5R
egio
n6
Reg
ion
7R
egio
n8
Reg
ion
9R
egio
n1
0R
egio
n1
1R
egio
n1
2
NC
R–
0.9
60
.99
0.9
20
.99
0.9
80
.99
0.9
30
.90
0.9
30
.94
0.9
50
.95
0.9
4
CA
R1
.03
–1
.04
1.0
21
.03
1.0
01
.00
1.0
41
.07
1.0
31
.04
1.0
61
.06
1.0
5
Reg
ion
11
.08
1.0
2–
0.9
71
.03
1.0
21
.05
0.9
91
.06
0.9
80
.99
1.0
11
.01
1.0
0
Reg
ion
21
.11
1.0
71
.04
–1
.09
1.0
91
.01
1.0
41
.01
1.0
31
.05
1.0
61
.07
1.0
5
Reg
ion
30
.95
1.0
50
.96
1.0
5–
0.9
80
.95
1.0
51
.01
1.0
51
.05
1.0
51
.05
1.0
5
Reg
ion
41
.06
0.9
91
.06
0.9
51
.01
–1
.03
0.9
71
.03
0.9
60
.97
0.9
80
.99
0.9
7
Reg
ion
51
.08
1.0
21
.08
0.9
81
.00
1.0
3–
0.9
91
.01
0.9
91
.00
1.0
11
.02
1.0
0
Reg
ion
61
.03
1.0
31
.02
1.0
81
.02
1.0
51
.07
–1
.07
1.0
91
.01
1.0
21
.02
1.0
1
Reg
ion
71
.09
1.0
21
.09
0.9
81
.03
1.0
31
.06
0.9
9–
0.9
81
.00
1.0
11
.02
1.0
0
Reg
ion
81
.12
1.0
11
.07
1.0
51
.02
1.0
21
.04
1.0
71
.04
–1
.07
1.0
91
.09
1.0
8
Reg
ion
91
.13
1.0
11
.07
1.0
51
.02
1.0
11
.04
1.0
71
.04
1.0
6–
1.0
91
.09
1.0
8
Reg
ion
10
1.1
11
.07
1.0
41
.02
1.0
81
.09
1.1
11
.04
1.0
91
.03
1.0
4–
1.0
61
.05
Reg
ion
11
1.0
81
.08
1.0
51
.04
1.0
21
.03
1.0
01
.05
1.0
11
.04
1.0
61
.07
–1
.06
Reg
ion
12
1.1
21
.08
1.0
01
.03
1.0
11
.08
1.0
91
.05
1.0
21
.04
1.0
51
.07
1.0
7–
So
urc
e:P
hil
ippin
esN
atio
nal
Sta
tist
icO
ffice
(19
97)
The Migratory Response of Labor 161
123

Ta
ble
5H
Tsc
ore
s,1
99
5–
200
0
NC
RC
AR
Reg
ion
1R
egio
n2
Reg
ion
3R
egio
n4
Reg
ion
5R
egio
n6
Reg
ion
7R
egio
n8
Reg
ion
9R
egio
n1
0R
egio
n1
1R
egio
n1
2
NC
R–
1.2
81
.24
1.2
31
.02
1.0
61
.34
1.1
41
.17
1.3
91
.18
1.1
71
.19
1.2
8
CA
R0
.79
–1
.06
1.0
10
.92
1.1
71
.09
1.0
81
.01
1.0
21
.01
1.0
11
.02
1.0
4
Reg
ion
10
.75
1.0
2–
0.9
50
.87
0.9
01
.09
1.0
10
.96
1.0
51
.07
0.9
50
.96
1.0
8
Reg
ion
20
.83
1.0
31
.02
–0
.97
1.0
01
.09
1.0
31
.06
1.0
81
.19
1.0
51
.06
1.0
0
Reg
ion
30
.95
1.1
91
.14
1.0
8–
1.0
41
.27
1.0
91
.03
1.3
51
.26
1.0
21
.02
1.1
8
Reg
ion
40
.94
1.1
81
.25
1.0
21
.08
–1
.37
1.0
81
.02
1.3
71
.14
1.0
91
.03
1.1
5
Reg
ion
50
.70
0.9
51
.03
0.8
90
.81
0.8
4–
0.9
50
.89
1.0
71
.00
0.8
90
.90
1.0
1
Reg
ion
60
.81
1.0
91
.09
1.0
30
.94
0.9
71
.09
–1
.04
1.0
41
.06
1.0
31
.04
1.0
7
Reg
ion
70
.87
1.0
91
.08
1.1
11
.02
1.0
51
.09
1.0
8–
1.0
51
.05
1.0
11
.03
1.0
6
Reg
ion
80
.71
0.9
61
.03
0.9
00
.82
0.8
51
.09
0.9
60
.90
–1
.01
0.9
00
.90
1.0
2
Reg
ion
90
.75
1.0
21
.01
0.9
60
.88
0.9
01
.09
1.0
20
.96
1.0
6–
0.9
60
.96
1.0
8
Reg
ion
10
0.8
41
.04
1.0
31
.07
0.9
81
.01
1.0
91
.04
1.0
71
.09
1.0
8–
1.0
81
.03
Reg
ion
11
0.8
61
.06
1.0
61
.09
1.0
01
.03
1.0
91
.06
1.0
91
.04
1.0
31
.09
–1
.05
Reg
ion
12
0.7
61
.03
1.0
90
.97
0.8
90
.91
1.0
91
.03
0.9
71
.07
1.0
90
.97
0.9
7–
So
urc
e:P
hil
ipp
ines
Nat
ion
alS
tati
stic
sO
ffice
(20
02)
162 S. R. Sanders, D. L. Brown
123

Ta
ble
6H
Tsc
ore
s,2
00
0–
20
05
NC
RC
AR
Reg
ion
1R
egio
n2
Reg
ion
3R
egio
n4
Reg
ion
5R
egio
n6
Reg
ion
7R
egio
n8
Reg
ion
9R
egio
n1
0R
egio
n1
1R
egio
n1
2
NC
R–
1.2
91
.27
1.2
31
.07
1.0
41
.39
1.1
51
.16
1.3
71
.14
1.1
41
.15
1.2
3
CA
R0
.81
–1
.02
1.0
80
.93
0.9
01
.04
1.0
71
.09
1.0
41
.08
1.0
51
.08
1.0
3
Reg
ion
10
.74
0.9
8–
0.9
90
.85
0.8
21
.04
1.0
90
.99
1.0
41
.08
0.9
60
.99
1.0
3
Reg
ion
20
.79
1.0
41
.08
–0
.90
0.8
71
.01
1.0
51
.05
1.0
01
.14
1.0
11
.05
1.0
8
Reg
ion
30
.99
1.1
81
.19
1.0
9–
1.0
21
.27
1.0
91
.08
1.3
81
.34
1.0
71
.05
1.1
8
Reg
ion
41
.03
1.1
31
.13
1.0
51
.07
–1
.39
1.2
61
.17
1.3
81
.32
1.0
81
.07
1.1
5
Reg
ion
50
.77
1.0
11
.06
1.0
20
.87
0.8
5–
1.1
21
.02
1.0
71
.09
0.9
81
.02
1.0
6
Reg
ion
60
.74
0.9
31
.05
0.9
30
.80
0.7
80
.98
–0
.94
0.9
81
.02
0.9
00
.93
0.9
7
Reg
ion
70
.85
1.0
21
.07
1.0
30
.97
0.9
41
.09
1.0
4–
1.0
91
.03
1.0
91
.03
1.0
8
Reg
ion
80
.77
1.0
21
.06
1.0
30
.88
0.8
61
.08
1.0
81
.03
–1
.02
1.0
01
.03
1.0
8
Reg
ion
90
.73
0.9
71
.09
0.9
70
.83
0.8
11
.02
1.0
70
.98
1.0
2–
0.9
40
.97
1.0
2
Reg
ion
10
0.8
31
.09
1.0
41
.01
0.9
50
.92
1.0
61
.02
1.0
11
.06
1.0
2–
1.0
11
.06
Reg
ion
11
0.8
21
.09
1.0
31
.09
0.9
40
.91
1.0
51
.02
1.0
11
.05
1.0
91
.06
–1
.04
Reg
ion
12
0.7
91
.04
1.0
81
.05
0.9
00
.87
1.0
91
.05
1.0
51
.05
1.0
41
.01
1.0
5–
So
urc
e:P
hil
ippin
esN
atio
nal
Sta
tist
icO
ffice
(20
07)
The Migratory Response of Labor 163
123
References
Bases Conversion Development Authority. (2001). Annual report 2000.Bases Conversion Development Authority. (2006a). About the BCDA. Retrieved March, 19, 2006, from
http://www.bcda.gov.ph.
Bases Conversion Development Authority. (2006b). Annual report 2005.Bell, C. (1991). Regional heterogeneity, migration, and shadow prices. Journal of Public Economics,
46(1), 1–27.
ESRI. (2007). Understanding different kriging models. Retrieved September 6, 2007, from http://web
help.esri.com/arcgisdesktop/9.2/index.cfm?TopicName=Understanding_different_kriging_models.
Fields, G. S. (1975). Rural-urban migration, urban unemployment and underemployment, and job-search
activity in LDCs. Journal of Development Economics, 2(2), 165–187.
Guillermo, V. (1996). Checking out employment strategies. Manila: Press Foundation of Asia.
Harris, J. R., & Todaro, M. P. (1970). Migration, unemployment and development: A two-sector analysis.
The American Economic Review, 60(1), 126–142.
Issah, I., Khan, T. Y., & Sasaki, K. (2005). Do migrants react to infrastructure difference between urban
and rural areas? Development of an extended Harris-Todaro model. Review of Urban and RegionalDevelopment Studies, 17(1), 68–88.
Makabenta, M. P. (2002). FDI location and special economic zones in the Philippines. Review of Urbanand Regional Development Studies, 14(1), 59.
Massey, D. S. (1990). Social structure, household strategies, and the cumulative causation of migration.
Population Index, 56(1), 3–26.
Massey, D. S. (1999). Why does immigration occur? In C. Hirschman, P. Kasinitz, & J. DeWind (Eds.),
The handbook of international migration: The American experience (pp. 34–52). New York: New
Russell Sage Foundation.
National Statistical Coordination Board. (2001). 2000 Philippines statistical yearbook. Manila: National
Statistical Coordination Board.
Philippines Congressional Planning and Budget Department. (2003). Economic and employment statusreport.
Philippines Economic Zone Authority. (2006a). About PEZA. Retrieved April, 23, 2006, from
http://www.peza.ph.gov.
Philippines Economic Zone Authority. (2006b). Philippines special economic zones. Retrieved April 23,
2006, from http://www.peza.gov.ph.
Philippines Economic Zone Authority.(2006c). SEZ employment totals. Unpublished report.
Philippines National Census. (1997). Provincial profile: National capital region. Manila: National
Statistical Board.
Philippines National Census. (1998a). PopCens 95. Manila: National Statistical Board.
Philippines National Census. (1998b). Socio-economic and demographic characteristics, 1995. Manila:
National Statistical Board.
Philippines National Statistics Office. (2002). Philippines statistical yearbook, 2001. Manila: Bureau of
the Census and Statistics.
Philippines National Census. (2005). Socio-economic and demographic characteristics, 2000. Manila:
Bureau of the Census and Statistics.
Philippines National Census. (2006). Socio-economic and demographic characteristics, 2000. Manila:
National Statistical Board.
Ringuet, D. J., & Estrada, E. (2003). Understanding the Philippines’ economy and politics since the return
of democracy in 1986. Contemporary Southeast Asia, 25(2), 233.
Stiglitz, J. E. (1974). Alternative theories of wage determination and unemployment in LDC’s: The labor
turnover model. The Quarterly Journal of Economics, 88(2), 194–227.
Tolentino, M. P. (1994). Developing agriculture toward sustainable industrialization. Economics andbusiness in the Philippines (pp. 57–68). San Francisco: The Asia Foundation.
164 S. R. Sanders, D. L. Brown
123