Embed Size (px)
Citation preview
1
The Middle Income Trap:The Other Side of the Philippine
Centavo
Max Maquito, Ph.D.Sekiguchi Global Research Association
Temple University Japan
17th SGRA Sustainable Shared Growth Seminar
Feb. 11, 2014University of the Philippines
2
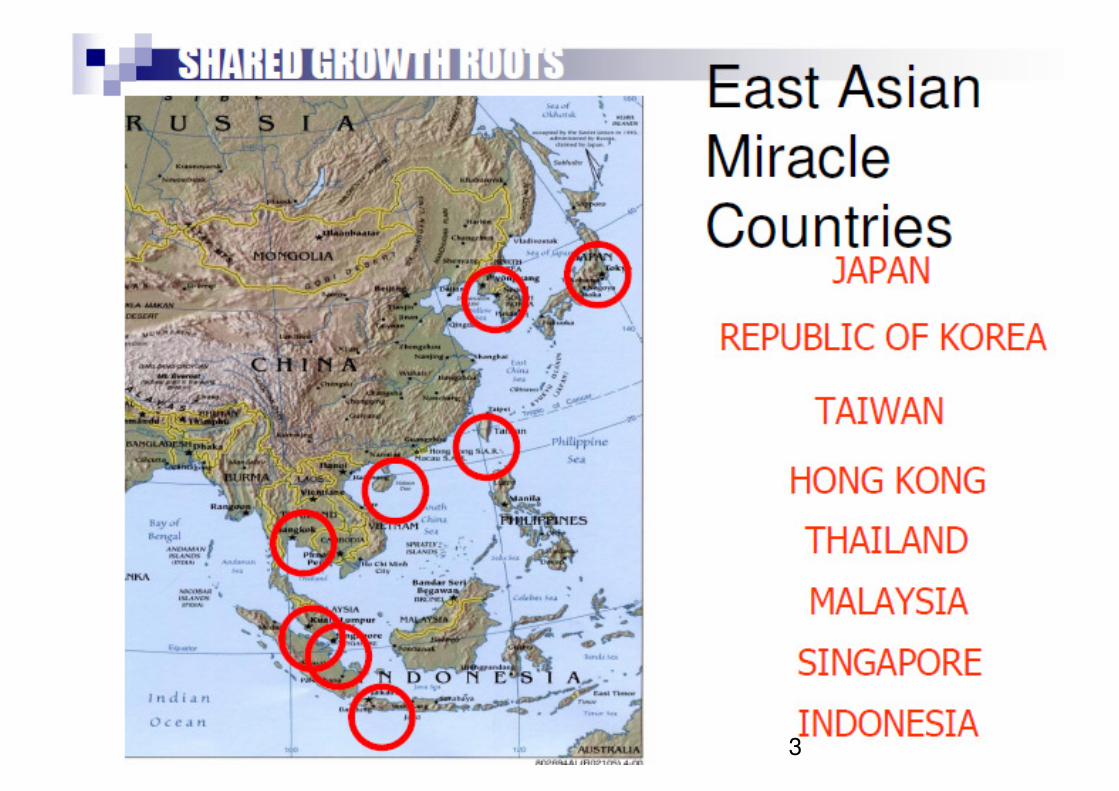
3
4
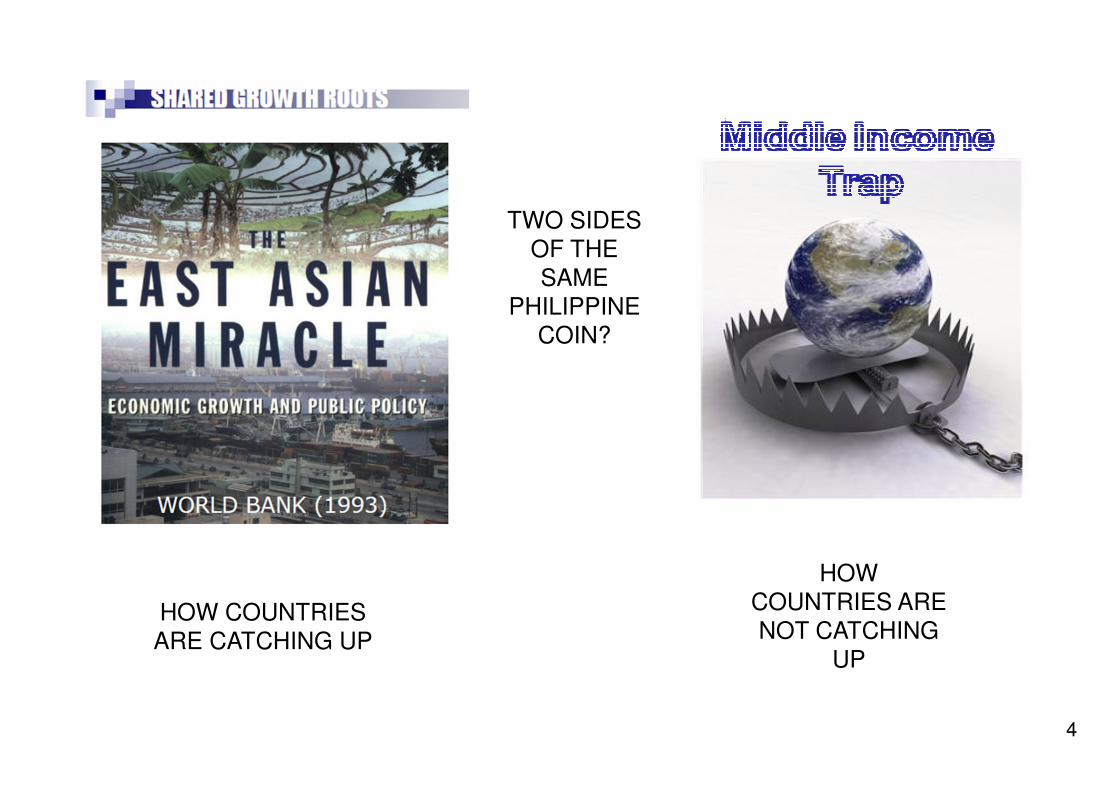
HOW COUNTRIES ARE CATCHING UP
HOW COUNTRIES ARE NOT CATCHING
UP
TWO SIDES OF THE SAME
PHILIPPINE COIN?
5
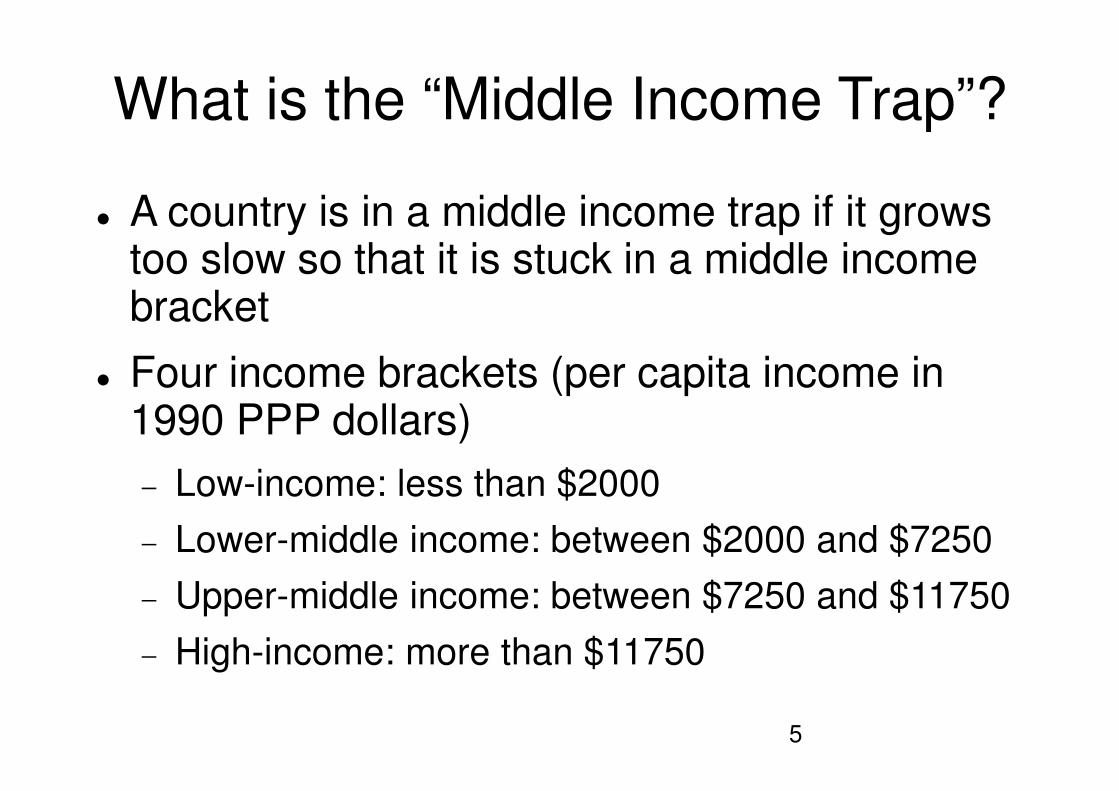
What is the “Middle Income Trap”?
� A country is in a middle income trap if it grows too slow so that it is stuck in a middle income bracket
� Four income brackets (per capita income in 1990 PPP dollars)
− Low-income: less than $2000
− Lower-middle income: between $2000 and $7250
− Upper-middle income: between $7250 and $11750
− High-income: more than $11750
6
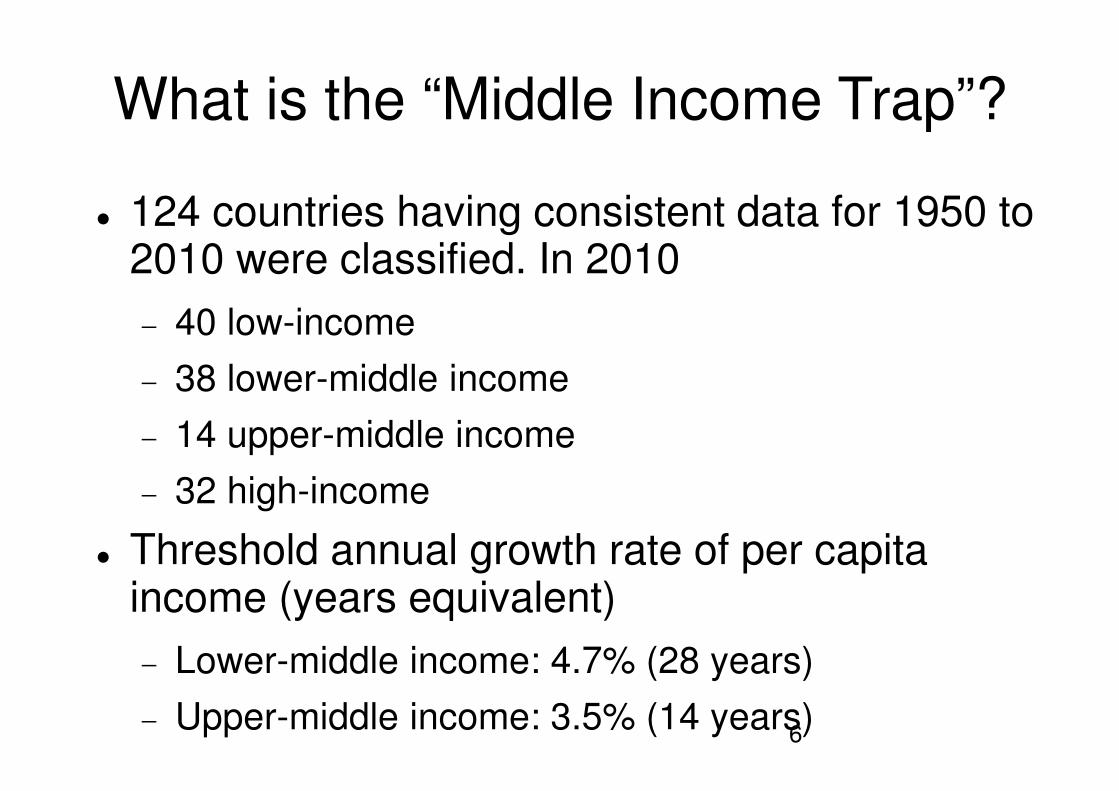
What is the “Middle Income Trap”?
� 124 countries having consistent data for 1950 to 2010 were classified. In 2010
− 40 low-income
− 38 lower-middle income
− 14 upper-middle income
− 32 high-income
� Threshold annual growth rate of per capita income (years equivalent)
− Lower-middle income: 4.7% (28 years)
− Upper-middle income: 3.5% (14 years)
7
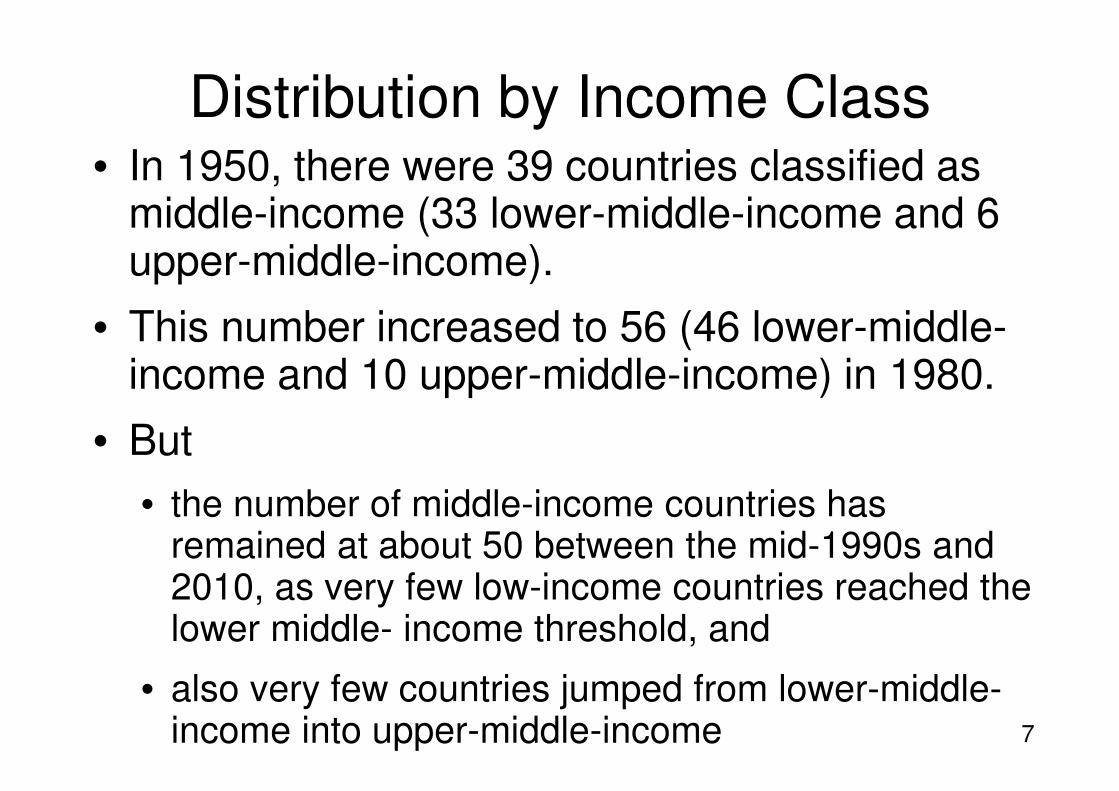
Distribution by Income Class• In 1950, there were 39 countries classified as
middle-income (33 lower-middle-income and 6 upper-middle-income).
• This number increased to 56 (46 lower-middle-income and 10 upper-middle-income) in 1980.
• But
• the number of middle-income countries has remained at about 50 between the mid-1990s and 2010, as very few low-income countries reached the lower middle- income threshold, and
• also very few countries jumped from lower-middle-income into upper-middle-income
8
9
10
11
Difference between LIT and MIT• the low-income countries stuck in a low-level
equilibrium trap face a daunting task need a big push (investment) to start industrialization.
• But the countries that have attained lower- and, especially, upper-middle-income status have, for the most part, achieved some degree of industrialization (some of them, like Brazil or Malaysia, relatively high).
• Their problem is different. Although many of them still display traces of dualism, their problem is not how to increase investment.
12
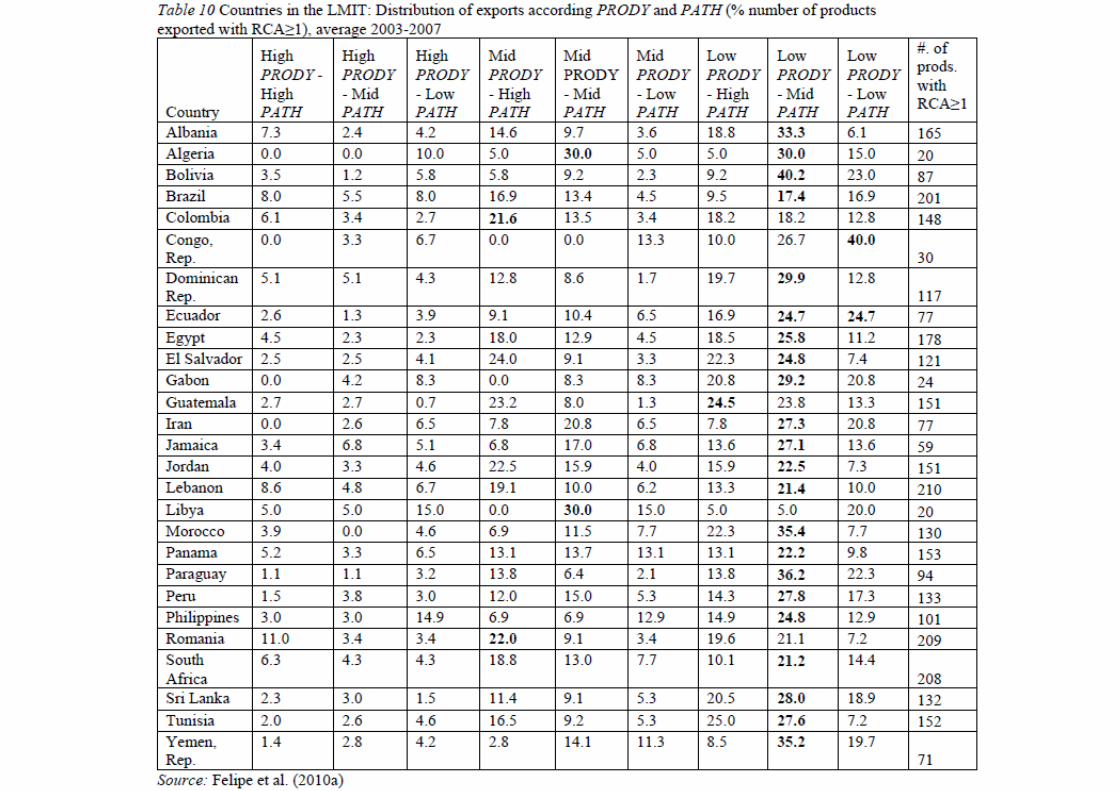
MIT may be a Product Trap• A product trap � MIT
• Countries in the lower-middle-income trap, in particular, export a significant share of products that are both unsophisticated and not especially well-connected to other products (Mid or Low PATH).
• Countries in the upper-middle-income trap are better positioned, but nevertheless, the share of well-connected products in their overall export basket is small.
13
MIT is a Product Trap• distribution of exports according to their level of
sophistication (PRODY) and connectedness (PATH).
• PRODY reflects the income associated with a particular product.
• A product with a higher PRODY is a product exported by relatively richer countries and a product with a lower PRODY is a product exported by relatively poorer countries.
• PATH, on the other hand, reflects the transferability of capabilities associated with the product.
• A product with higher PATH is more connected to other products—i.e., its capabilities are similar to the capabilities required for producing other products—than a product with a lower PATH
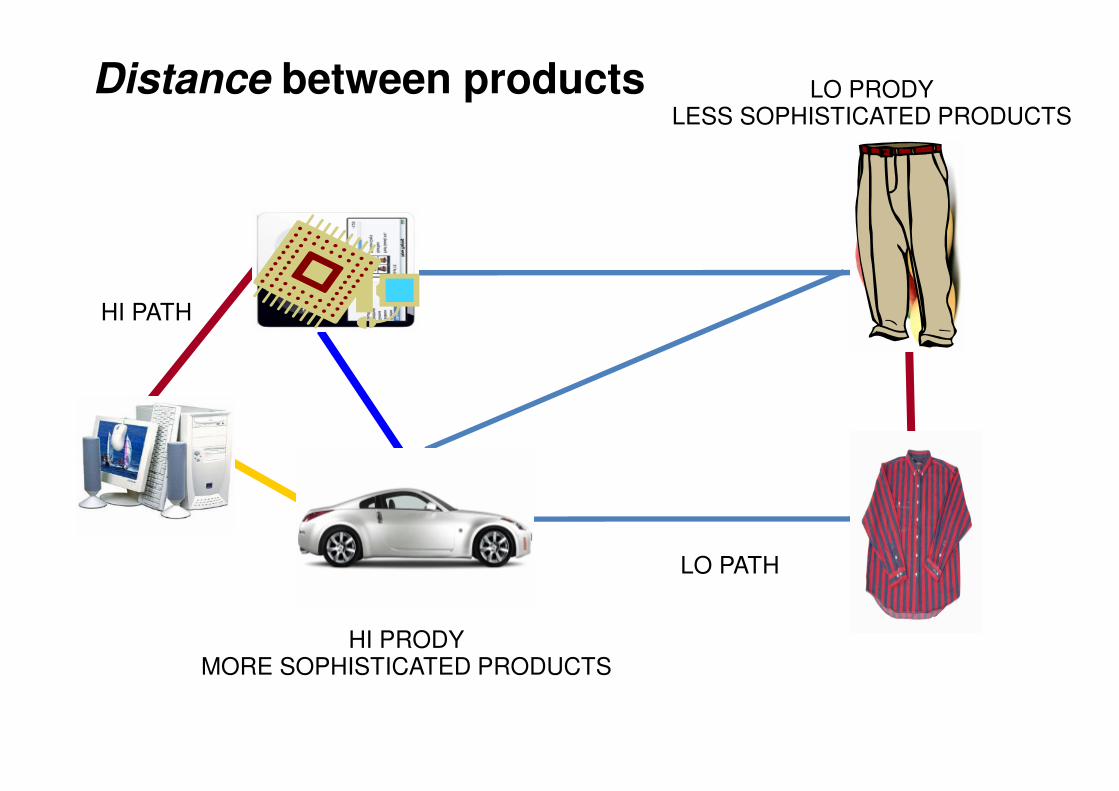
Distance between products
Nearby
How products are linked each other?
HI PRODYMORE SOPHISTICATED PRODUCTS
LO PRODYLESS SOPHISTICATED PRODUCTS
LO PATH
HI PATH
15
16
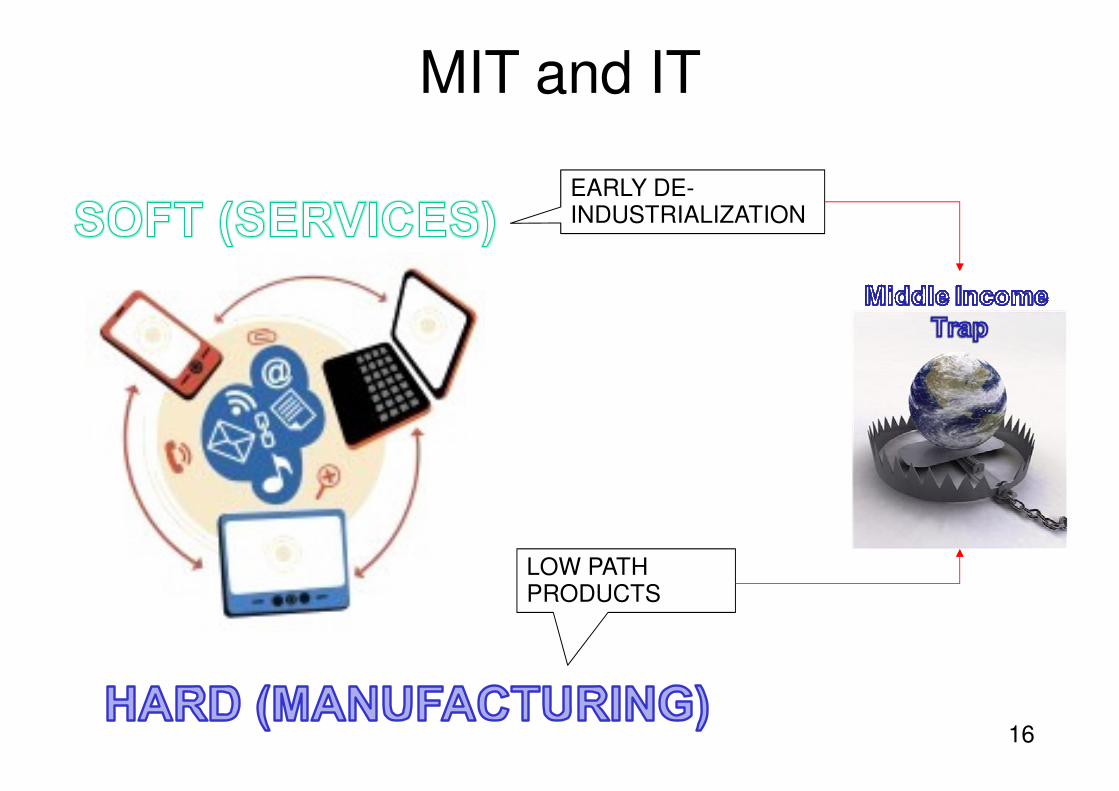
MIT and IT
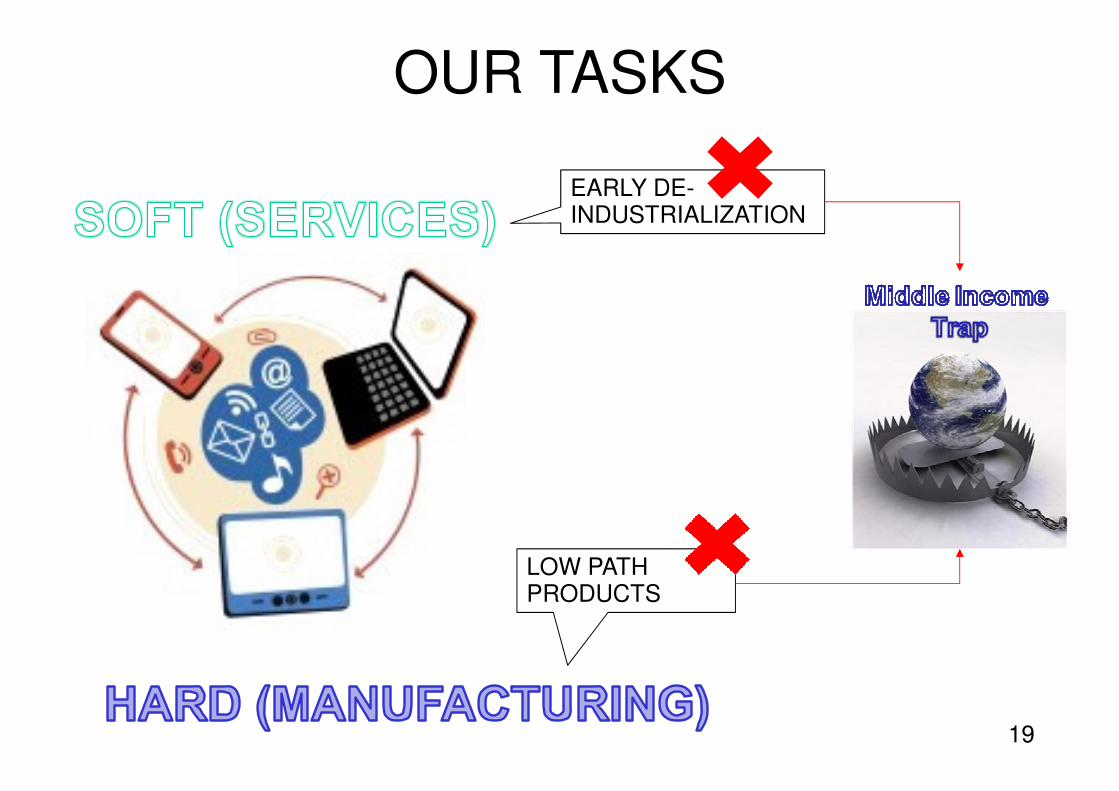
LOW PATH PRODUCTS
EARLY DE-INDUSTRIALIZATION
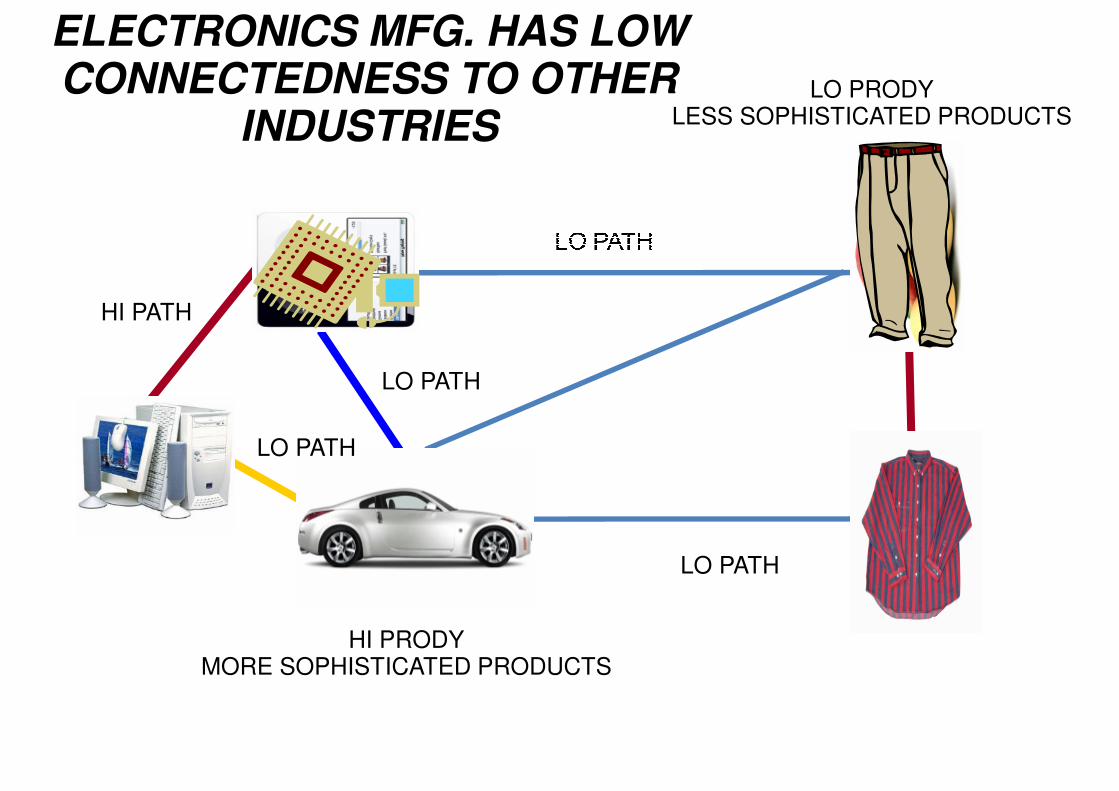
ELECTRONICS MFG. HAS LOW
CONNECTEDNESS TO OTHER
INDUSTRIES
Nearby
How products are linked each other?
HI PRODYMORE SOPHISTICATED PRODUCTS
LO PRODYLESS SOPHISTICATED PRODUCTS
LO PATH
HI PATH
LO PATH
LO PATH
18
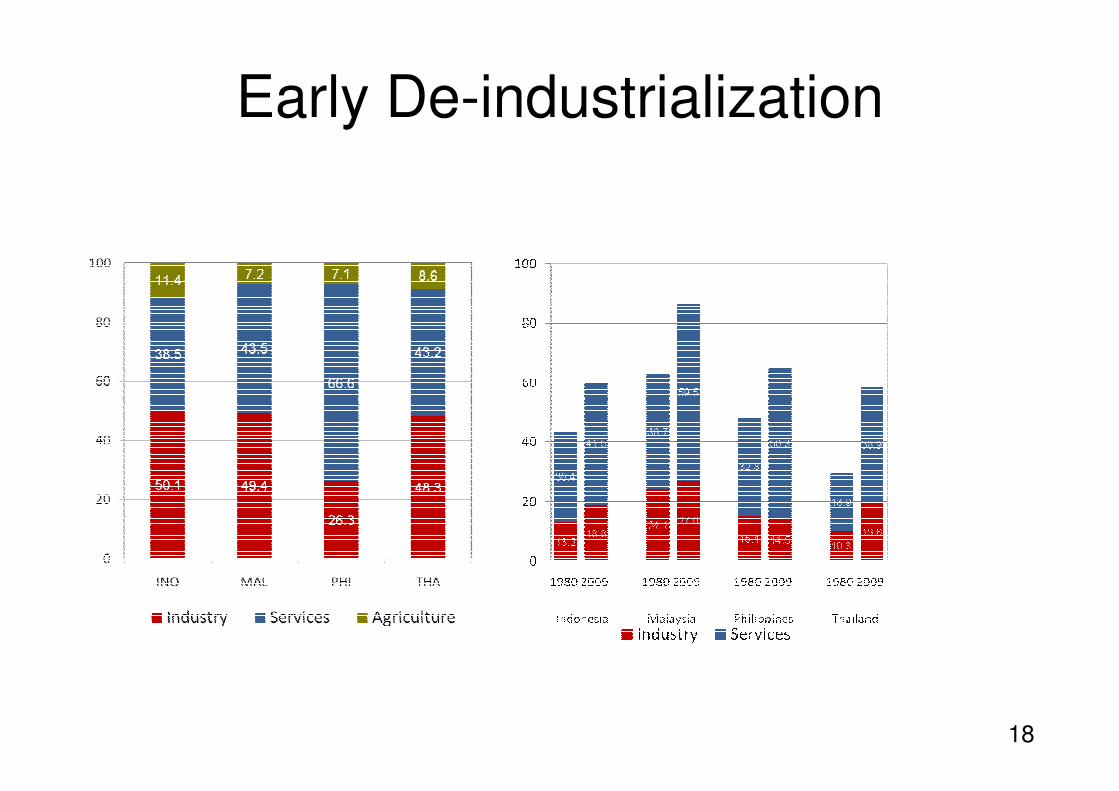
Early De-industrialization
19
OUR TASKS
LOW PATH PRODUCTS
EARLY DE-INDUSTRIALIZATION
20
Sources• Tracking the Middle Income Trap: What is it,
Who is in it, and Why? by Jesus Felipe, Arnelyn Abdon, Ubtsav Kumar, ADB 2012
• Taking the Right Road to Inclusive Growth by Norio Usui, ADB 2012
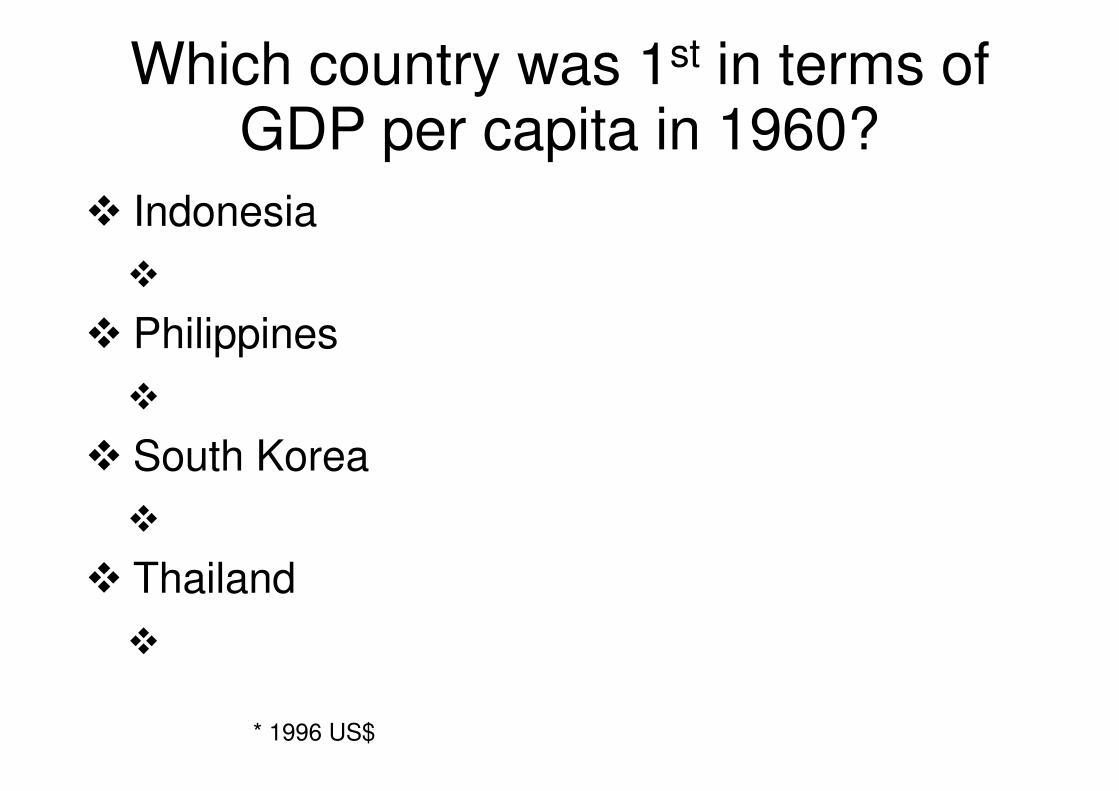
Which country was 1st in terms of GDP per capita in 1960?
� Indonesia
� 936
� Philippines
� 2015
� South Korea
� 1495
� Thailand
� 1091
* 1996 US$
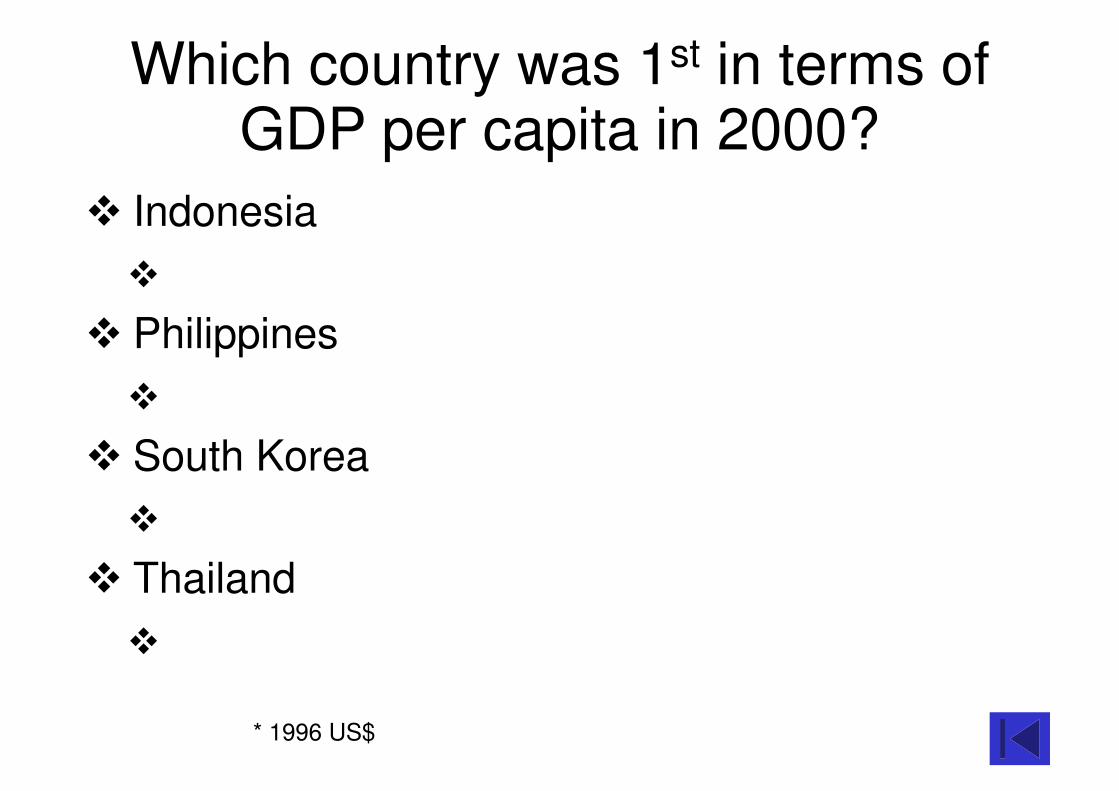
Which country was 1st in terms of GDP per capita in 2000?
� Indonesia
� 3642
� Philippines
� 3425
� South Korea
� 15876
� Thailand
� 6857
* 1996 US$