Embed Size (px)
Citation preview
The Middle East North Africa Region (MENA) A Risk Analysis Review
By
Dr. Abdullah Toukan, CEO
Strategic Analysis and Global Risk Assessment Center Abu Dhabi
UAE
August 25 - 26, 2013
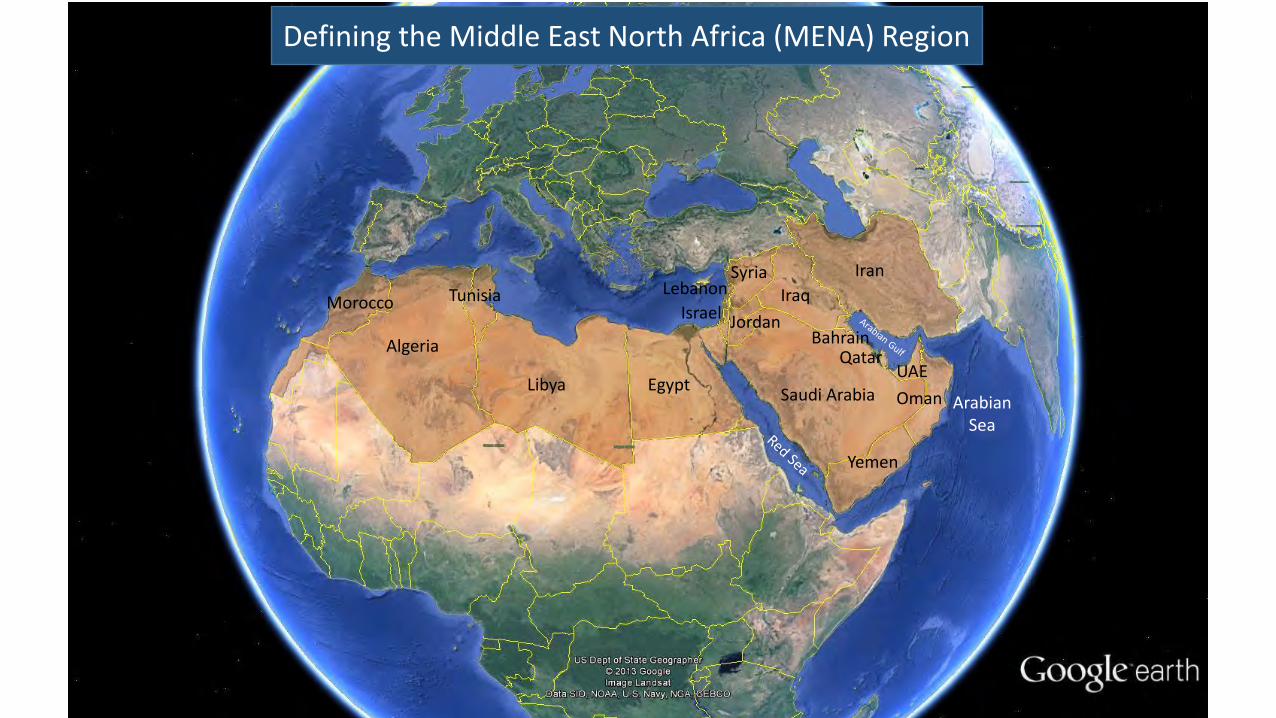
Algeria
Tunisia Morocco
Libya Egypt Saudi Arabia
Yemen
Oman
UAE Qatar
Bahrain
Iraq
Iran Syria
Jordan
Lebanon
Israel
Arabian Sea
Defining the Middle East North Africa (MENA) Region
Introduction to the SAGRA Decision Support System
• This Presentation shows what an integrated approach to Country Risk Assessment entails, and why a country should have a comprehensive overview of the Risks it will encounter not only on a national level but on regional and international levels.
• The SAGRA Risk Analytic Tools Platform will provide a framework for Government
Decision Makers and CEOs to develop a more in-depth understanding into systemic Risks in the mid-to-long term planning horizons.
• The SAGRA Risk Analytic Tools Platform provides for the acquisition of data from multiple sources providing a comprehensive risk landscape. Currently generates around 65 External and Internal Risks for 140 countries.
• The platform provides for the generation of: Development of a Comprehensive Data Base Risk Analytic Tools for Analysis & Forecasting Region and Country Risk Assessment with the choice of Risk Components
developed and compiled by SAGRA.
• Strategic decisions concerning political and economic plus other risks that a country is
exposed to can and should be based on solid quantitative analysis
• For example, a country can be defined through its exposure to multiple economic,
financial, social, and other risks, through the structure and magnitude of its commercial
or political strengths
• A specific problem of this sort might be the need to assess a country’s economic and
financial health considering all of the internal and external risks that contribute to it,
and relative to the same measure as it applies to its trading partners
• A typical goal here might be to find the optimal alignment of the country in relation to its
trading partners in a global Economic and Financial landscape. In this case, one might
also want to find the least expensive, or fastest way to reach an optimal, more
comfortable, risk landscape.
• Problems of this sort are very complex, in part because they potentially
involve many entities, each of which is defined through multiple risks of a
varied nature, but also because the individual risks defining the entities
are almost never independent of each other, and a change in one risk
may affect the value of several others, often in a way that is extremely
difficult to understand and assess,
• One of the unique strengths of the SAGRA Decision Support System
(SDSS) is that through it, without resorting to any such approximation,
one can make perfect sense of questions such as:
– Is country A at higher risk that country B? Or, What can country A do
to improve its global risk landscape? Or, What is the optimal order of
priority to address the problems associated with a high-risk position?
• SDSS is a thus a unique application that allows a user to
– Understand the risks that his country is exposed to and how the risks of other countries might influence those of his country,
– Understand how all the risks involved interact with and influence each other,
– Manipulate the existing risks to understand how variations in other or more risks of one or more countries can influence the risks of his own country,
– Identify the priority of individual risks in assessing the country’s needs in an optimal way,
– Understand and anticipate highly dangerous situations by understanding the sensitivity of the country’s economic, defense, social, and other risks, to changes in any internal or external risk.
The Cause and Effect Risk Matrix
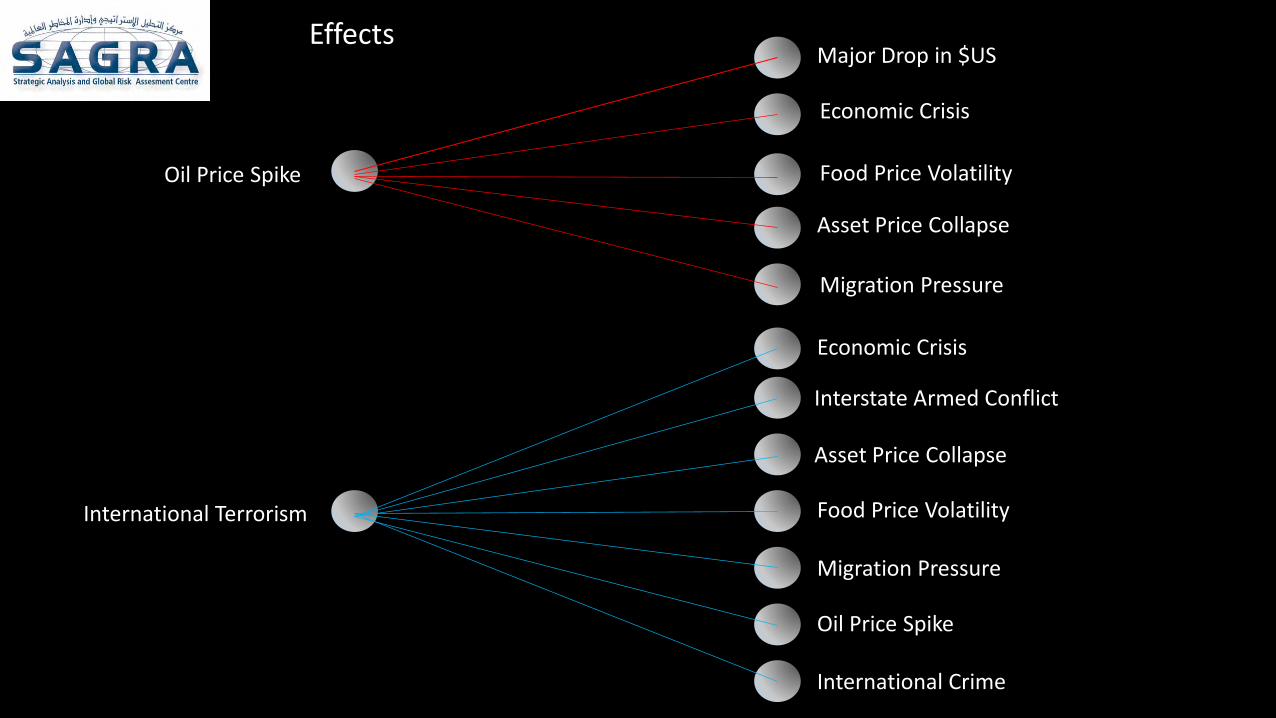
Oil Price Spike
Asset Price Collapse
Economic Crisis
Food Price Volatility
Migration Pressure
Major Drop in $US
Economic Crisis
Interstate Armed Conflict
Food Price Volatility
Migration Pressure
Oil Price Spike
International Crime
International Terrorism
Asset Price Collapse
Effects
The SAGRA Risk Metric Components
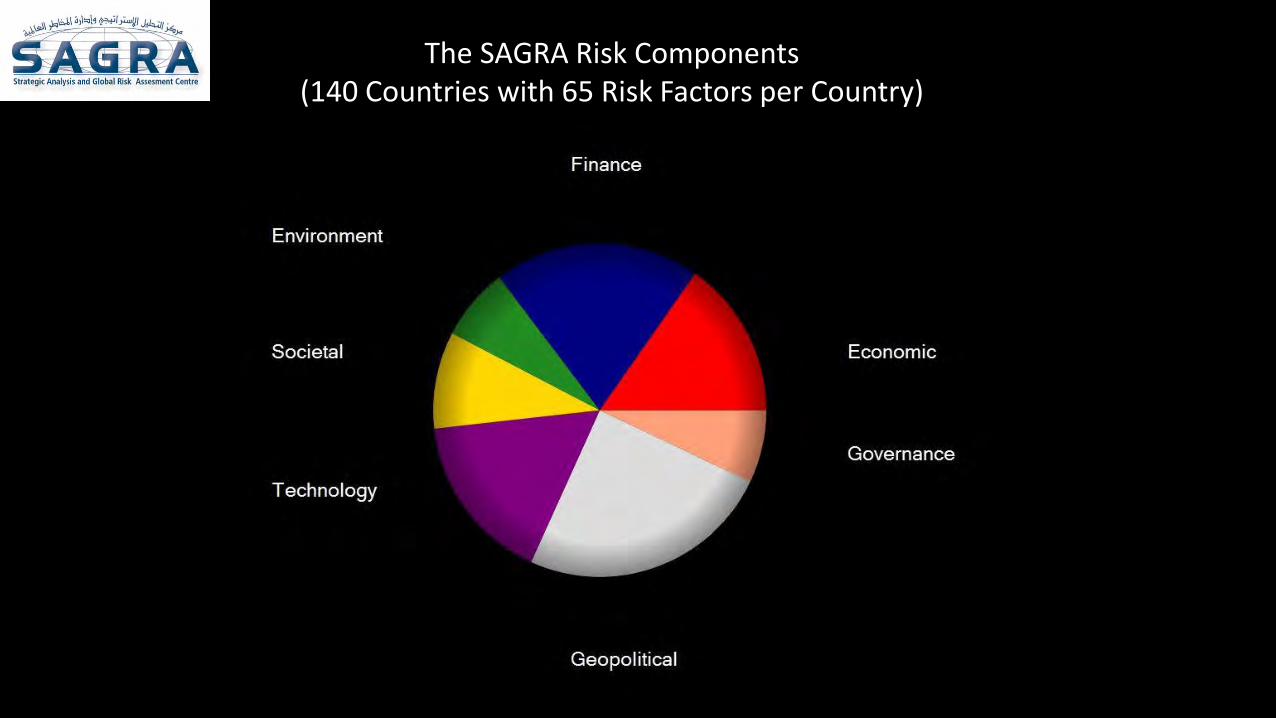
The SAGRA Risk Components (140 Countries with 65 Risk Factors per Country)
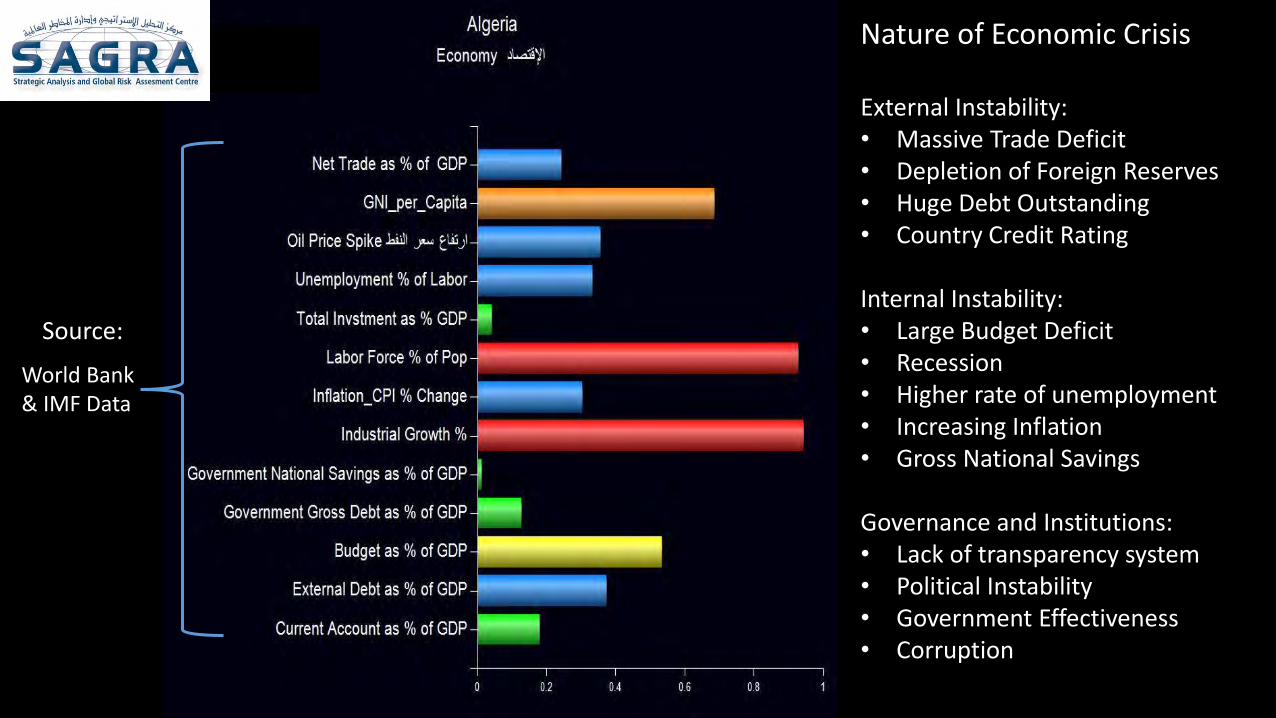
Nature of Economic Crisis External Instability: • Massive Trade Deficit • Depletion of Foreign Reserves • Huge Debt Outstanding • Country Credit Rating Internal Instability: • Large Budget Deficit • Recession • Higher rate of unemployment • Increasing Inflation • Gross National Savings Governance and Institutions: • Lack of transparency system • Political Instability • Government Effectiveness • Corruption
World Bank & IMF Data
Source:
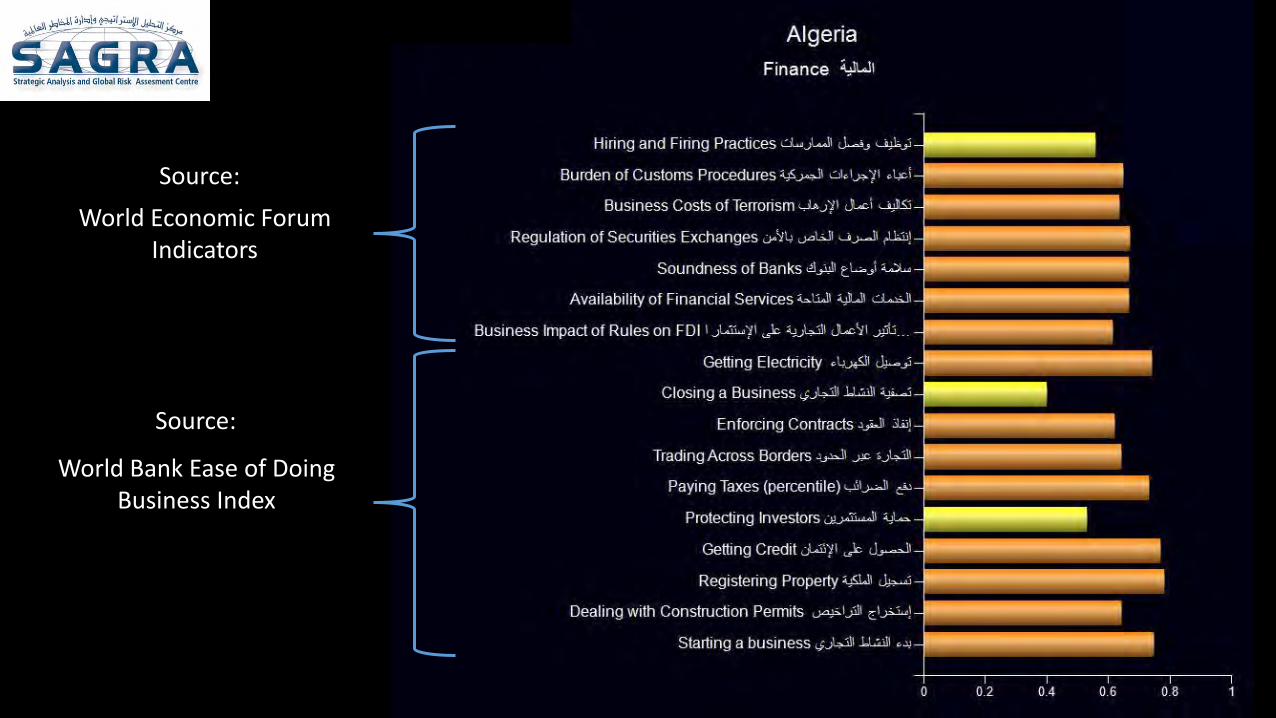
World Economic Forum Indicators
World Bank Ease of Doing Business Index
Source:
Source:
Morocco 97 Algeria 152
Tunisia 50
Libya NA Egypt 109
Israel 38
Lebanon 115
Turkey 71
Syria 144
Jordan 106 Iraq 165 Iran 145
Kuwait 82
Bahrain 42
Qatar 40
Saudi Arabia 22 UAE 26
Oman 47
Yemen 118
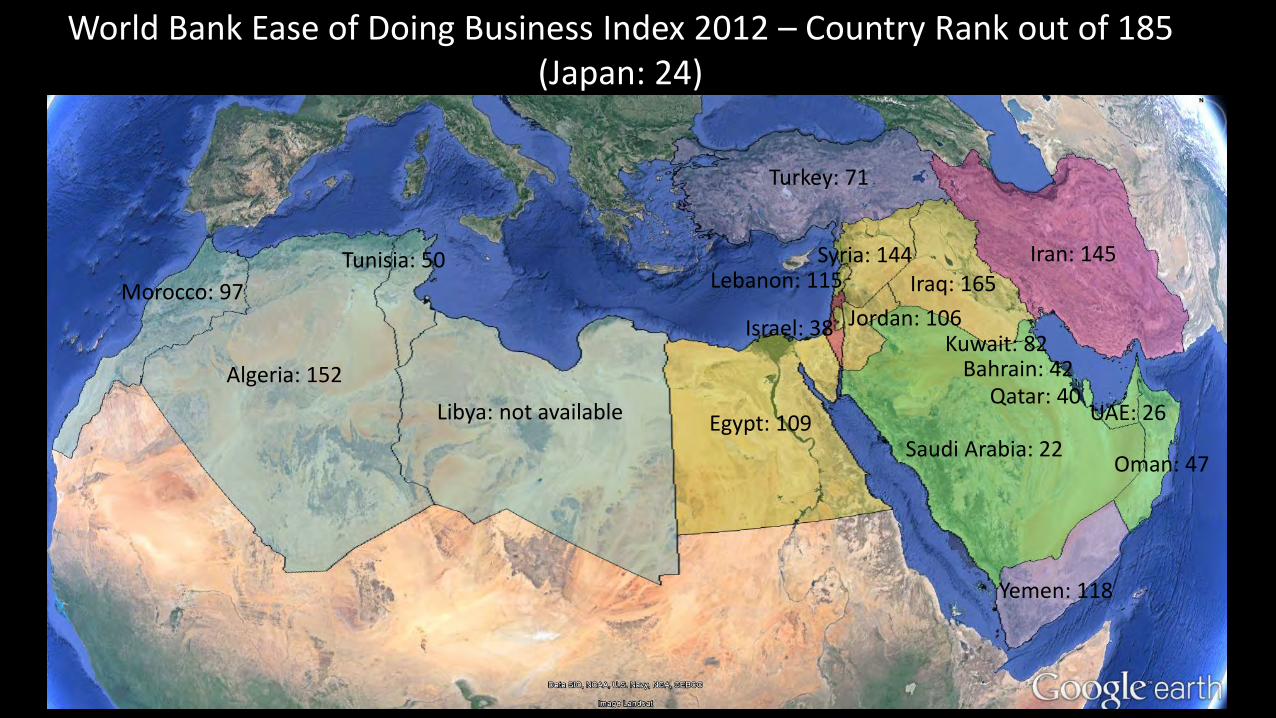
World Bank Ease of Doing Business Index 2012 – Country Rank out of 185 (Japan: 24)
Morocco: 97
Algeria: 152
Tunisia: 50
Libya: not available Egypt: 109
Israel: 38
Lebanon: 115
Turkey: 71
Syria: 144 Iraq: 165
Iran: 145
Saudi Arabia: 22
Bahrain: 42 Qatar: 40
UAE: 26
Oman: 47
Yemen: 118
Jordan: 106 Kuwait: 82
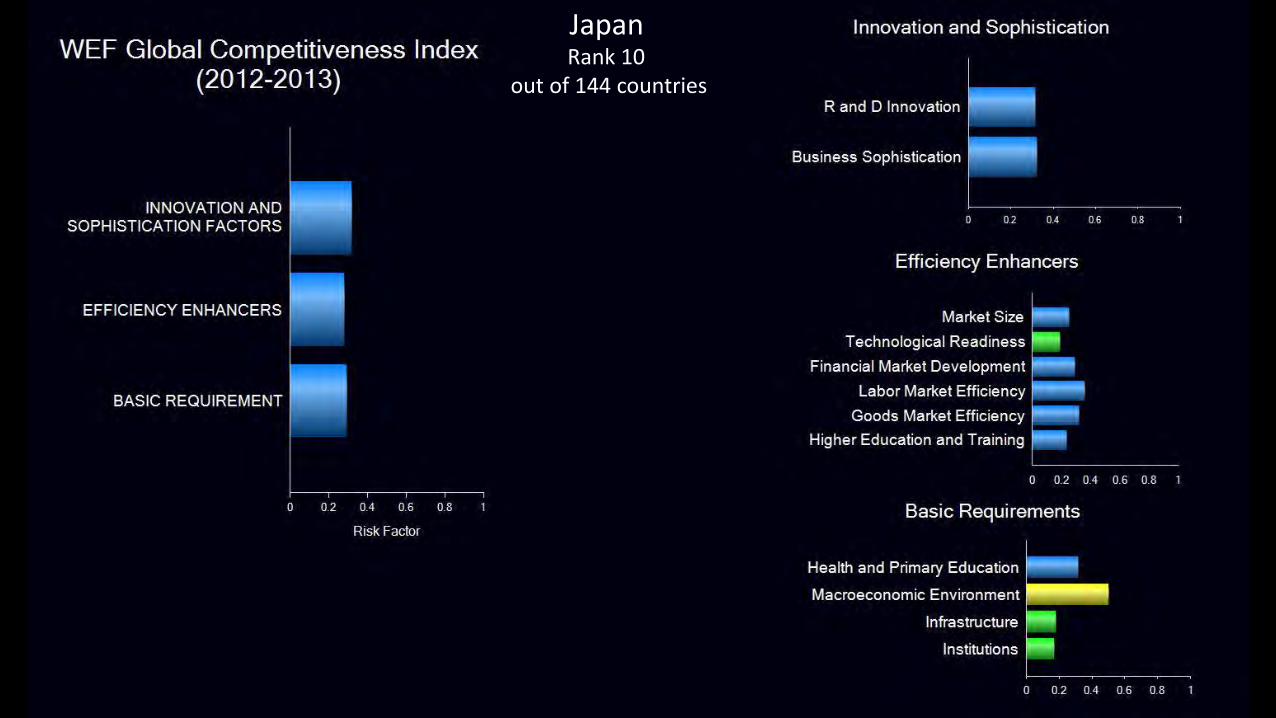
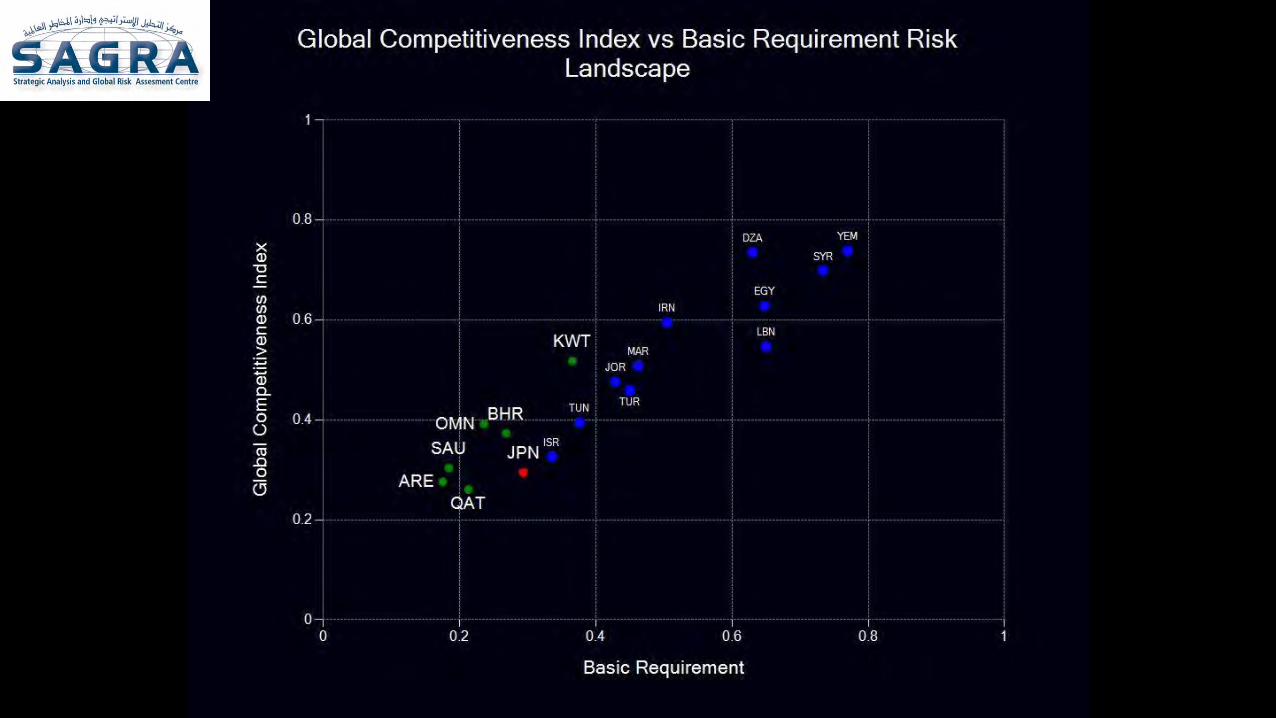
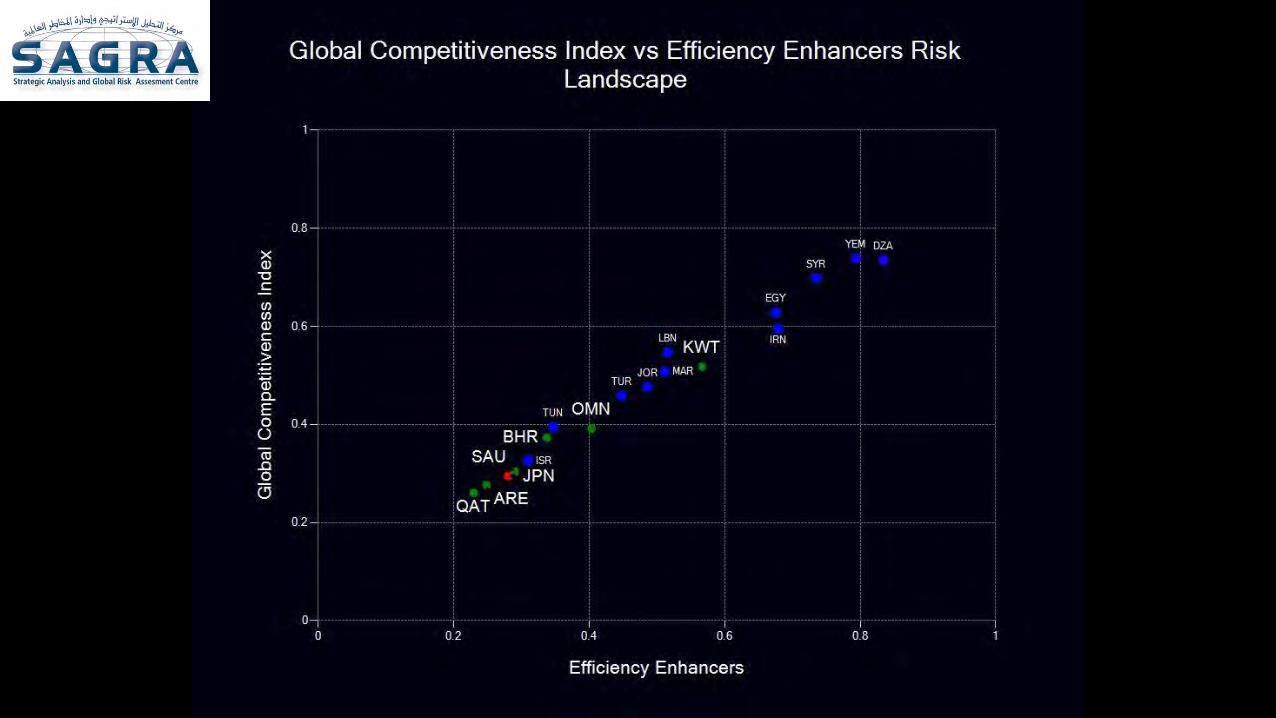
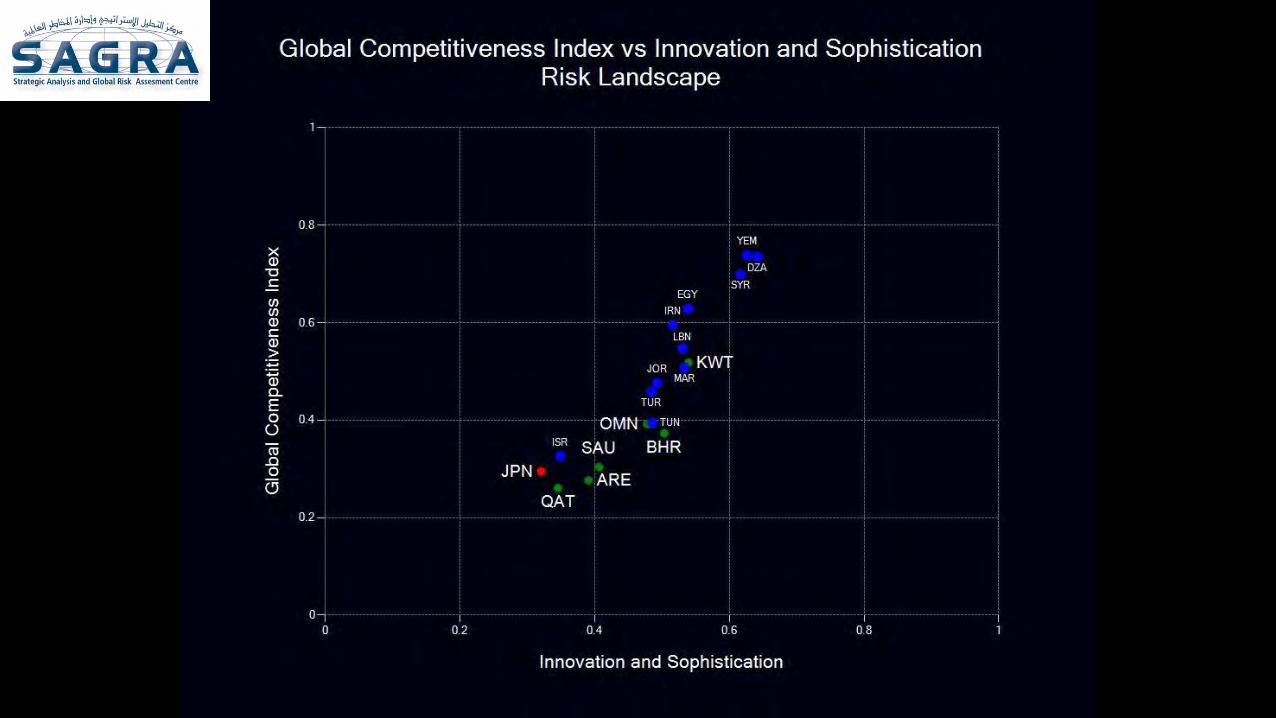
Japan Rank 10
out of 144 countries

Morocco 97 Algeria 152
Tunisia 50
Libya NA Egypt 109
Israel 38
Lebanon 115
Turkey 71
Syria 144
Jordan 106 Iraq 165 Iran 145
Kuwait 82
Bahrain 42
Qatar 40
Saudi Arabia 22 UAE 26
Oman 47
Yemen 118
WEF Global Competitiveness Index 2012-2013 – Country Rank out of 144 (Japan: 10)
Morocco: 70
Algeria: 110
Tunisia: NA
Libya: 113 Egypt: 107
Israel: 26
Lebanon: 91
Turkey: 43
Syria: NA Iraq: NA
Iran: 66
Saudi Arabia: 18
Bahrain: 35 Qatar: 11
UAE: 24
Oman: 32
Yemen: 140
Jordan: 64 Kuwait: 37

For the UAE: Path leading to a more stable region/low risk resulting from the mitigation of Economic and Financial Risks
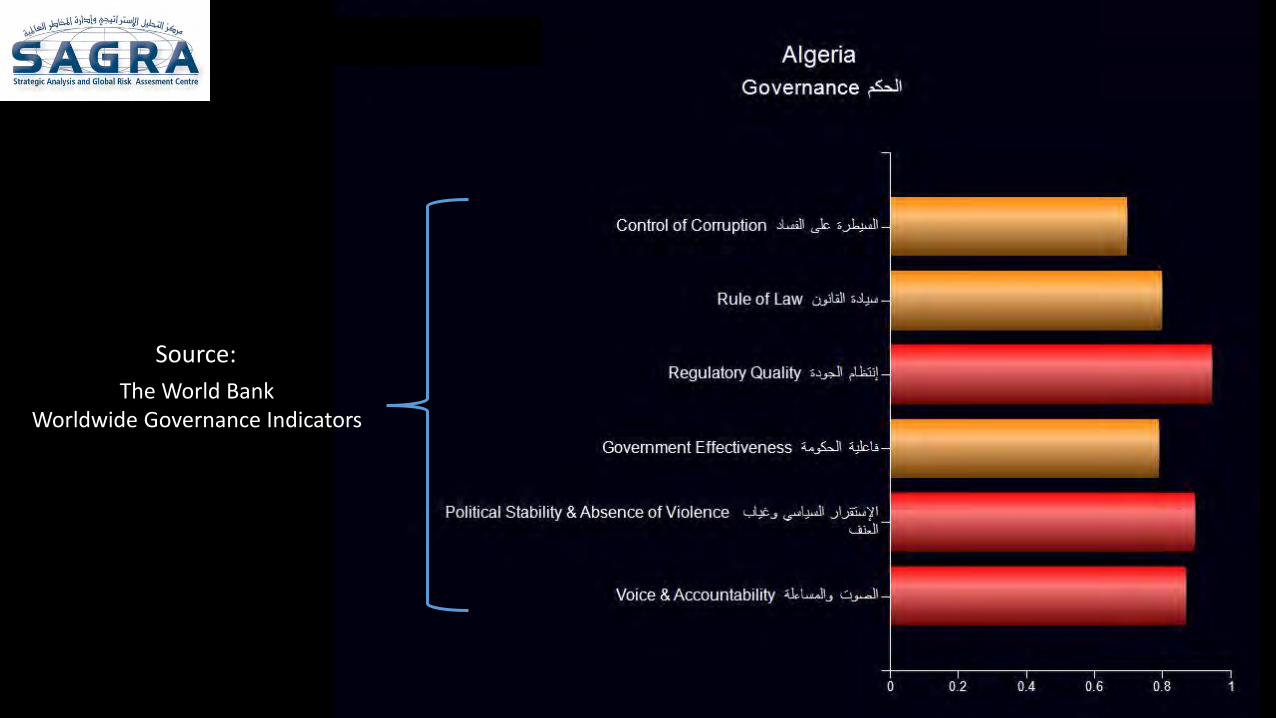
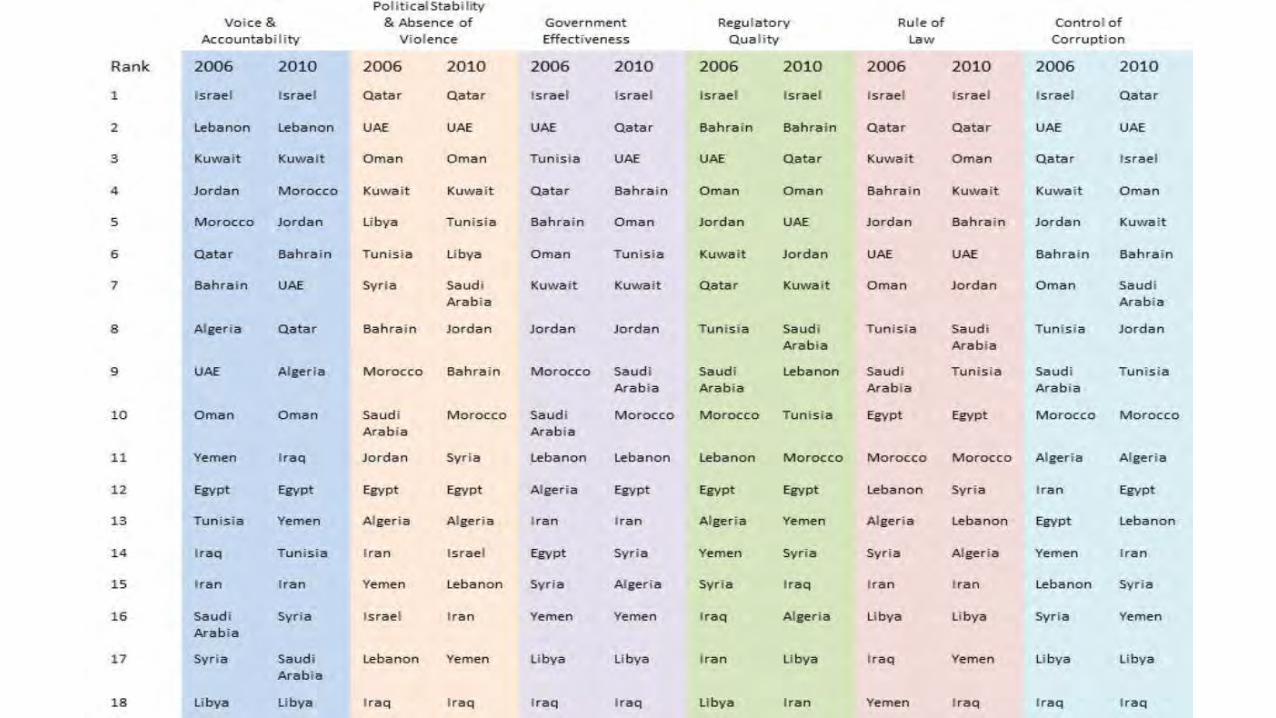
The World Bank Worldwide Governance Indicators
Source:

Morocco 97 Algeria 152
Tunisia 50
Libya NA Egypt 109
Israel 38
Lebanon 115
Turkey 71
Syria 144
Jordan 106 Iraq 165 Iran 145
Kuwait 82
Bahrain 42
Qatar 40
Saudi Arabia 22 UAE 26
Oman 47
Yemen 118
WB Control of Corruption Index 2011 – Country Rank out of 212 (Japan: 22)
Morocco: 105
Algeria: 139
Tunisia: 100
Libya: 202 Egypt: 155
Israel: 58
Lebanon: 172
Turkey: 83
Syria: 175 Iraq: 197
Iran: 173
Saudi Arabia: 110
Bahrain: 75 Qatar: 42
UAE: 38
Oman: 84
Yemen: 195
Jordan: 86 Kuwait: 85

Morocco 97 Algeria 152
Tunisia 50
Libya NA Egypt 109
Israel 38
Lebanon 115
Turkey 71
Syria 144
Jordan 106 Iraq 165 Iran 145
Kuwait 82
Bahrain 42
Qatar 40
Saudi Arabia 22 UAE 26
Oman 47
Yemen 118
WB Political Stability & Absence of Violence Index 2011 – Country Rank out of 212 (Japan: 45)
Morocco: 147
Algeria: 193
Tunisia: 130
Libya: 177 Egypt: 188
Israel: 190
Lebanon: 199
Turkey: 175
Syria: 203 Iraq: 205
Iran: 197
Saudi Arabia: 135
Bahrain: 157 Qatar: 21
UAE: 49
Oman: 69
Yemen: 209
Jordan: 141 Kuwait: 88
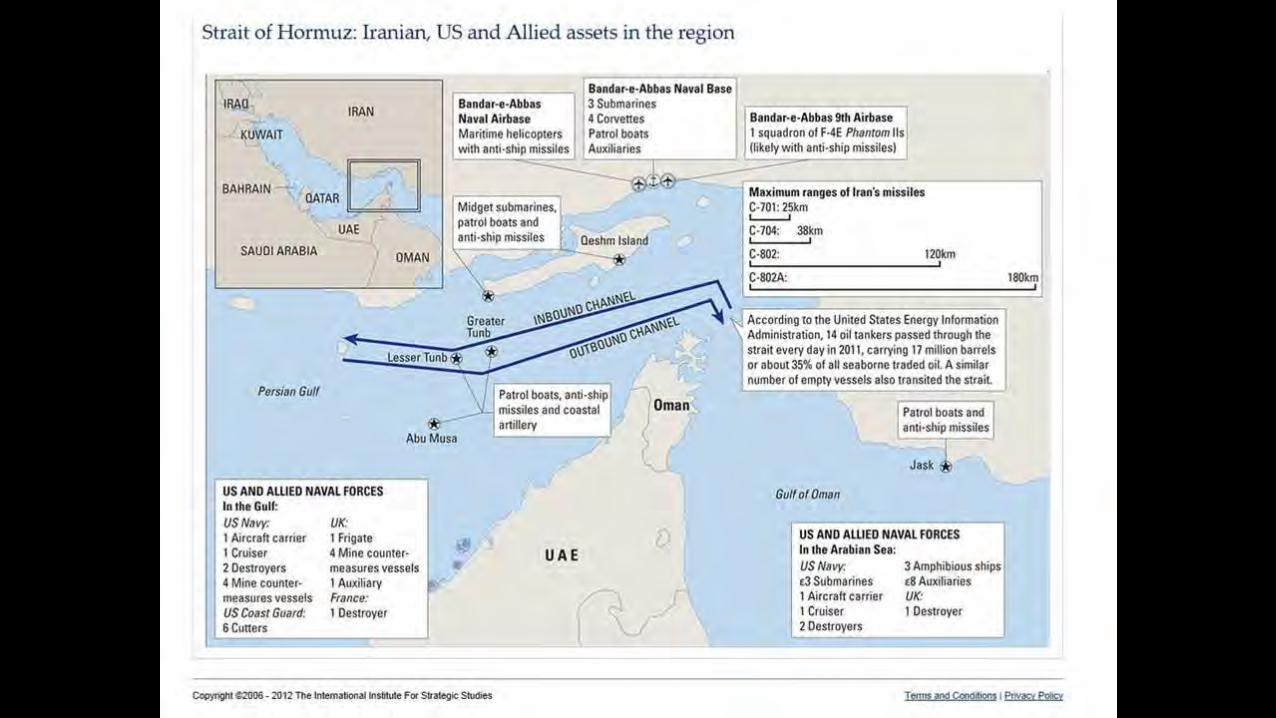
Geo-Political Factors
Iran Iraq
Saudi Arabia
Oman
UAE
Qatar Bahrain
Kuwait
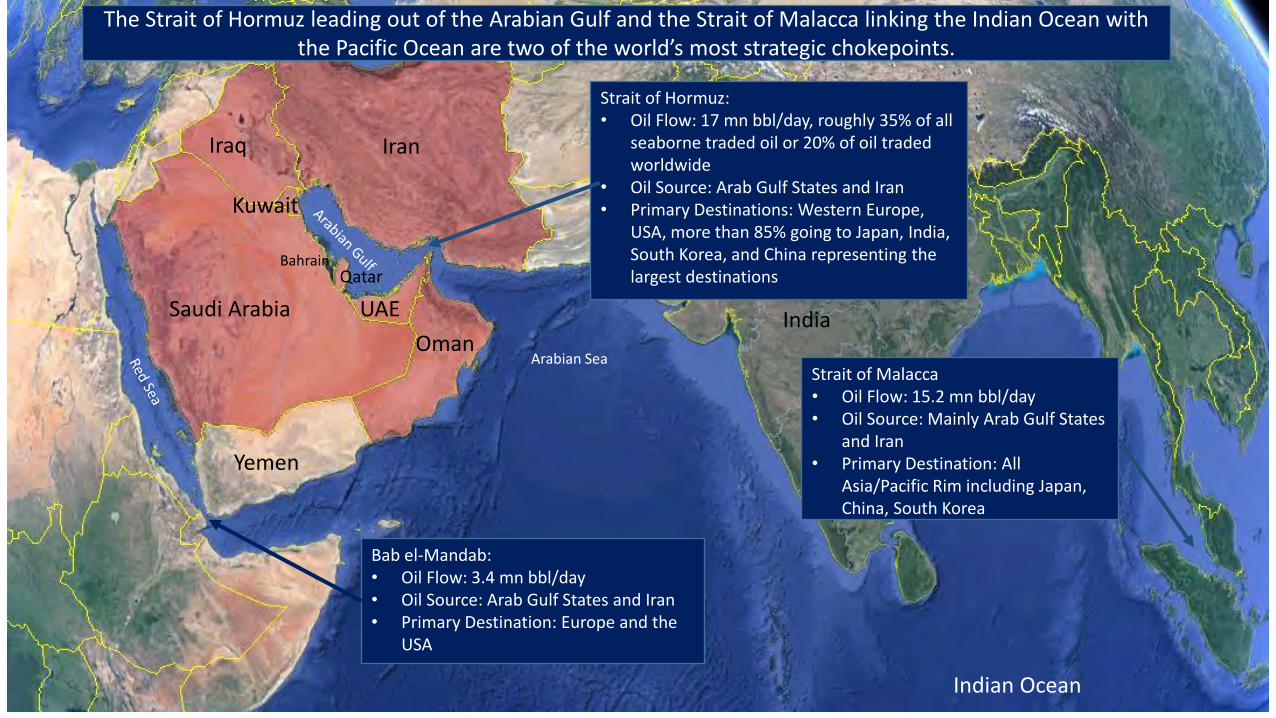
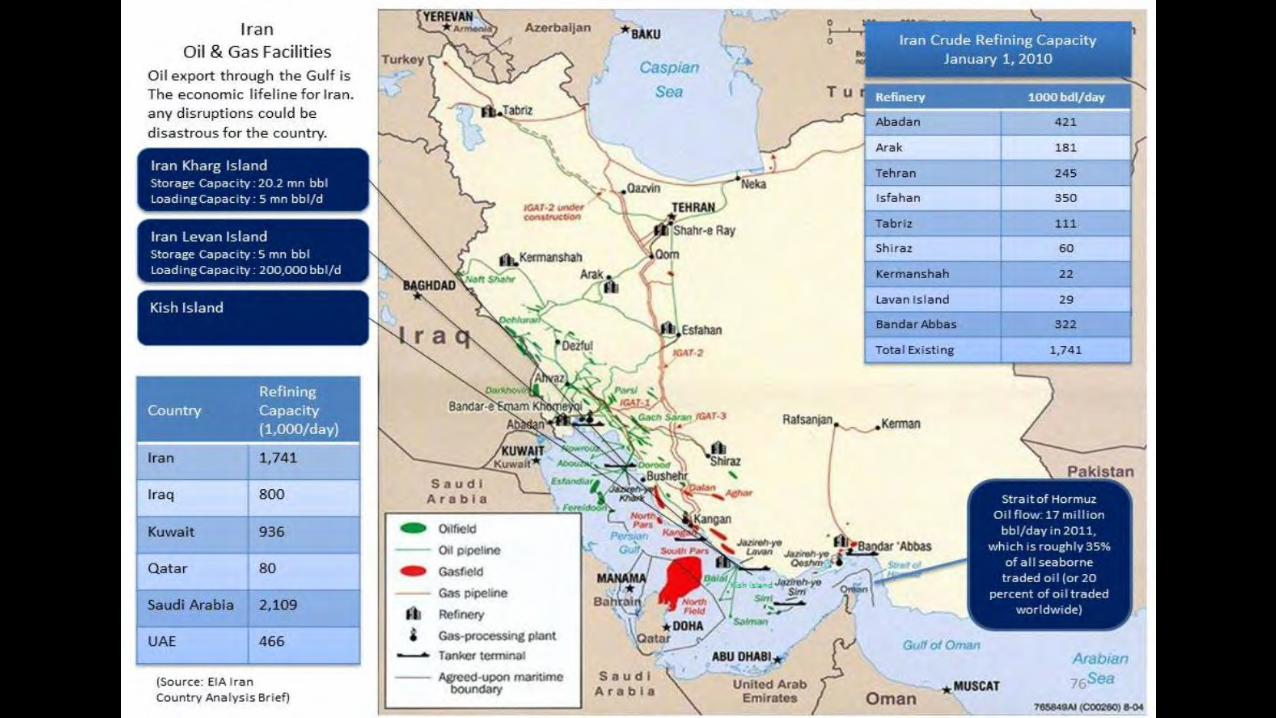
Strait of Hormuz: • Oil Flow: 17 mn bbl/day, roughly 35% of all
seaborne traded oil or 20% of oil traded worldwide
• Oil Source: Arab Gulf States and Iran • Primary Destinations: Western Europe,
USA, more than 85% going to Japan, India, South Korea, and China representing the largest destinations
Strait of Malacca • Oil Flow: 15.2 mn bbl/day • Oil Source: Mainly Arab Gulf States
and Iran • Primary Destination: All
Asia/Pacific Rim including Japan, China, South Korea
India
Bab el-Mandab: • Oil Flow: 3.4 mn bbl/day • Oil Source: Arab Gulf States and Iran • Primary Destination: Europe and the
USA
Arabian Sea
The Strait of Hormuz leading out of the Arabian Gulf and the Strait of Malacca linking the Indian Ocean with the Pacific Ocean are two of the world’s most strategic chokepoints.
Indian Ocean
Yemen
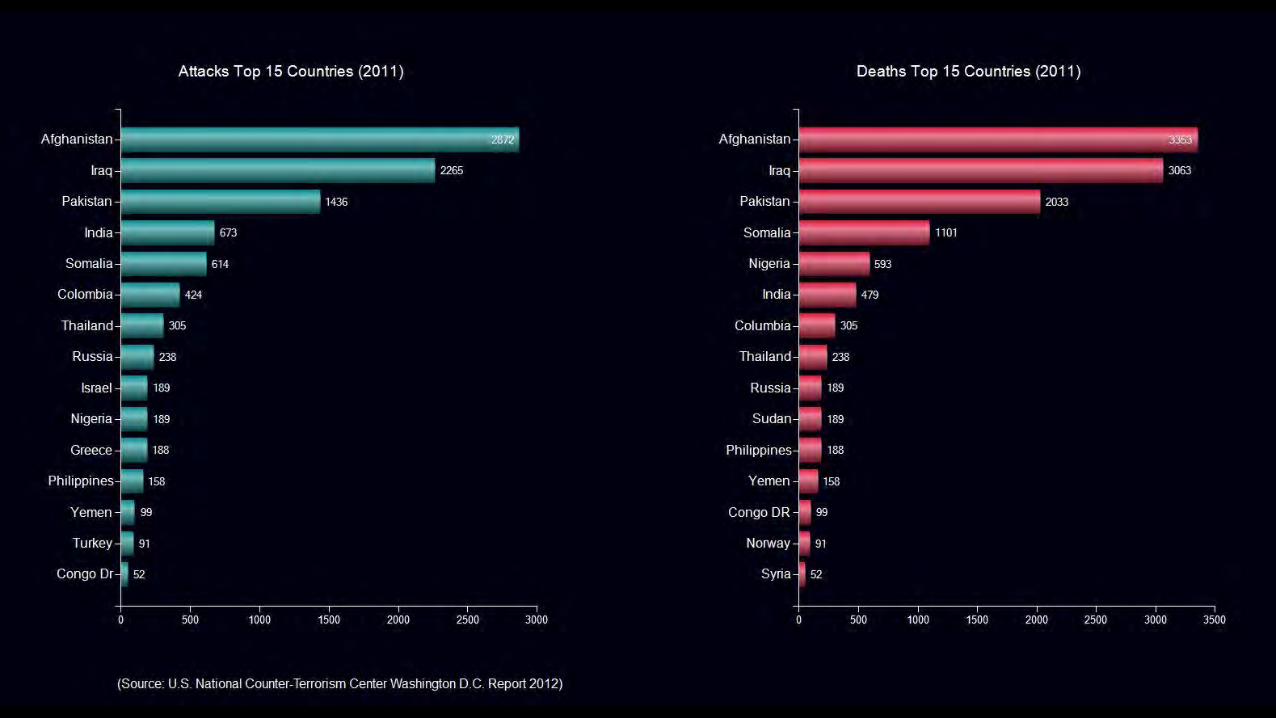
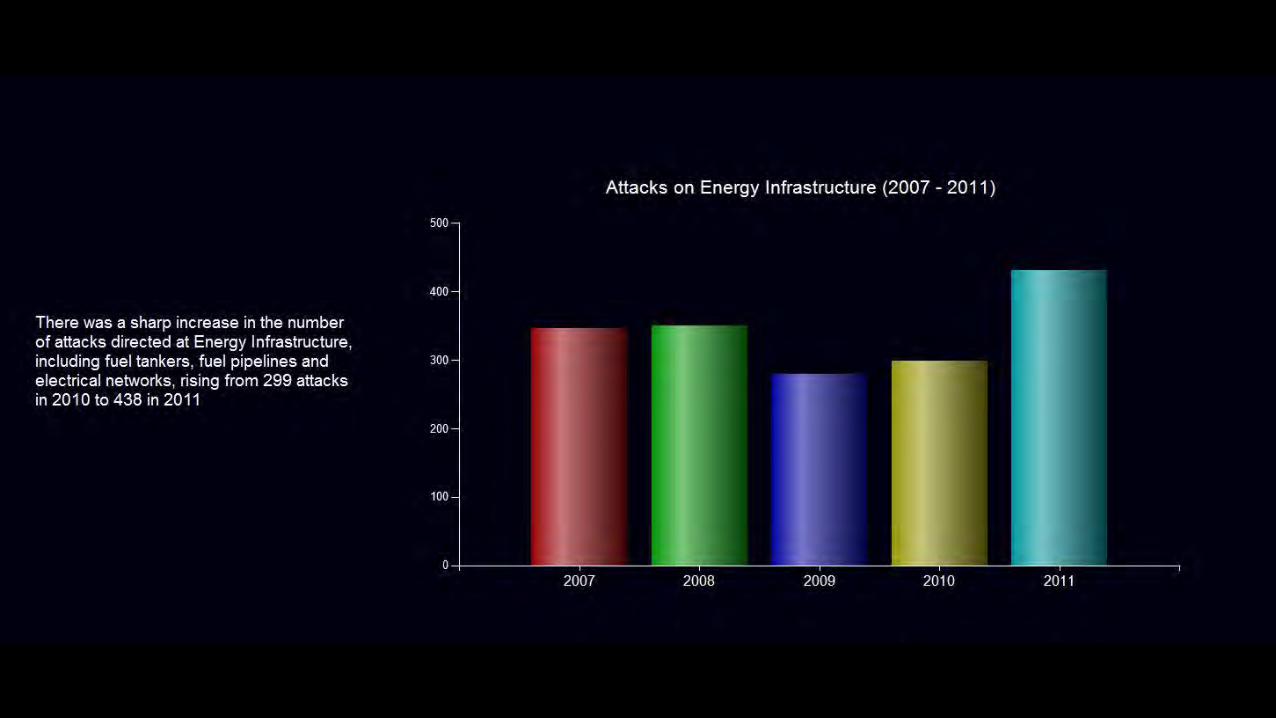
The Economic Costs of Terrorism
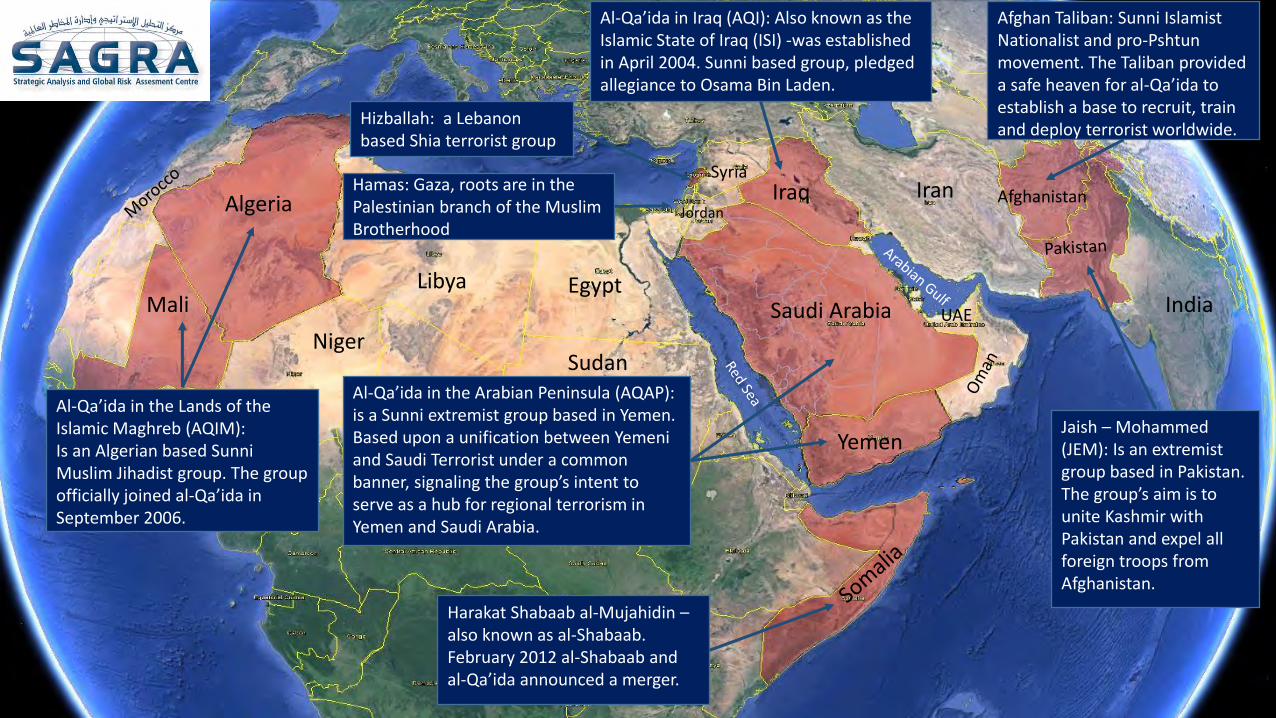
Al-Qa’ida in the Lands of the Islamic Maghreb (AQIM): Is an Algerian based Sunni Muslim Jihadist group. The group officially joined al-Qa’ida in September 2006.
Algeria
Mali
Hamas: Gaza, roots are in the Palestinian branch of the Muslim Brotherhood
Hizballah: a Lebanon based Shia terrorist group
Al-Qa’ida in Iraq (AQI): Also known as the Islamic State of Iraq (ISI) -was established in April 2004. Sunni based group, pledged allegiance to Osama Bin Laden.
Iraq
Al-Qa’ida in the Arabian Peninsula (AQAP): is a Sunni extremist group based in Yemen. Based upon a unification between Yemeni and Saudi Terrorist under a common banner, signaling the group’s intent to serve as a hub for regional terrorism in Yemen and Saudi Arabia.
Harakat Shabaab al-Mujahidin – also known as al-Shabaab. February 2012 al-Shabaab and al-Qa’ida announced a merger.
Jaish – Mohammed (JEM): Is an extremist group based in Pakistan. The group’s aim is to unite Kashmir with Pakistan and expel all foreign troops from Afghanistan.
Afghan Taliban: Sunni Islamist Nationalist and pro-Pshtun movement. The Taliban provided a safe heaven for al-Qa’ida to establish a base to recruit, train and deploy terrorist worldwide.
Saudi Arabia
Yemen
UAE
Afghanistan Iran
Egypt Libya India
Niger Sudan
Syria
Jordan
The Risk Landscape &
Country Stability Index
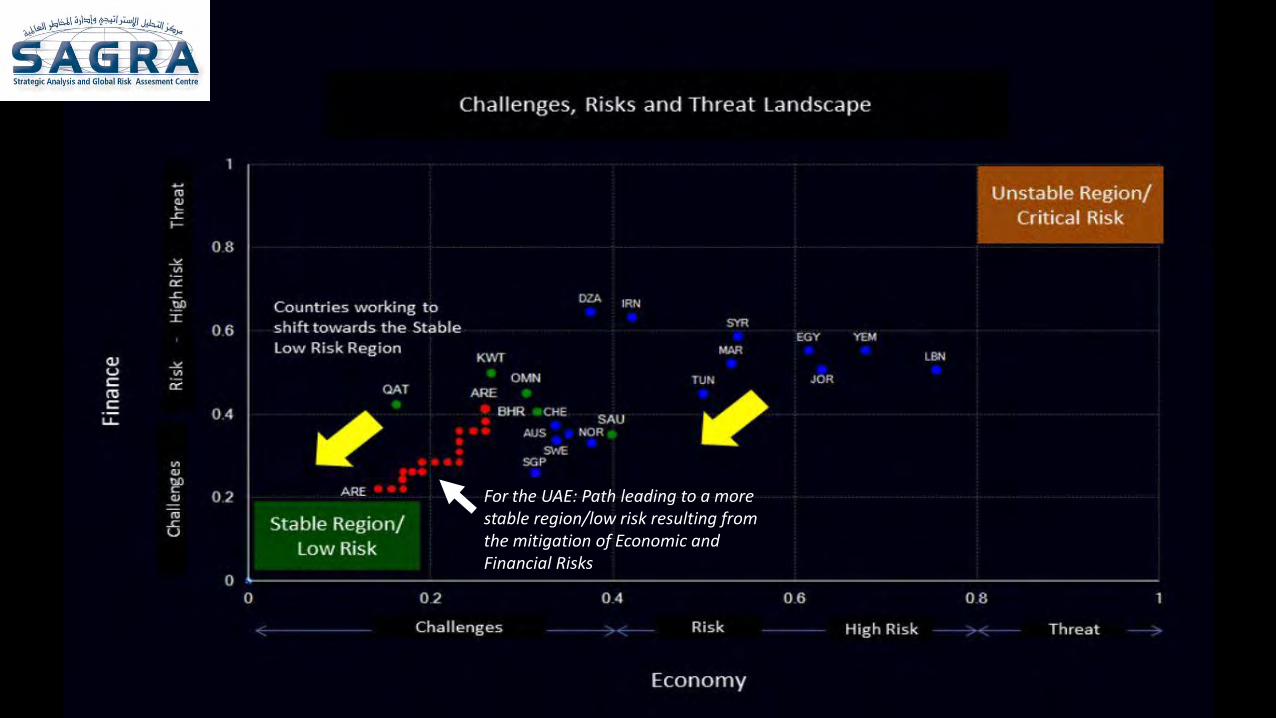
For the UAE: Path leading to a more stable region/low risk resulting from the mitigation of Economic and Financial Risks
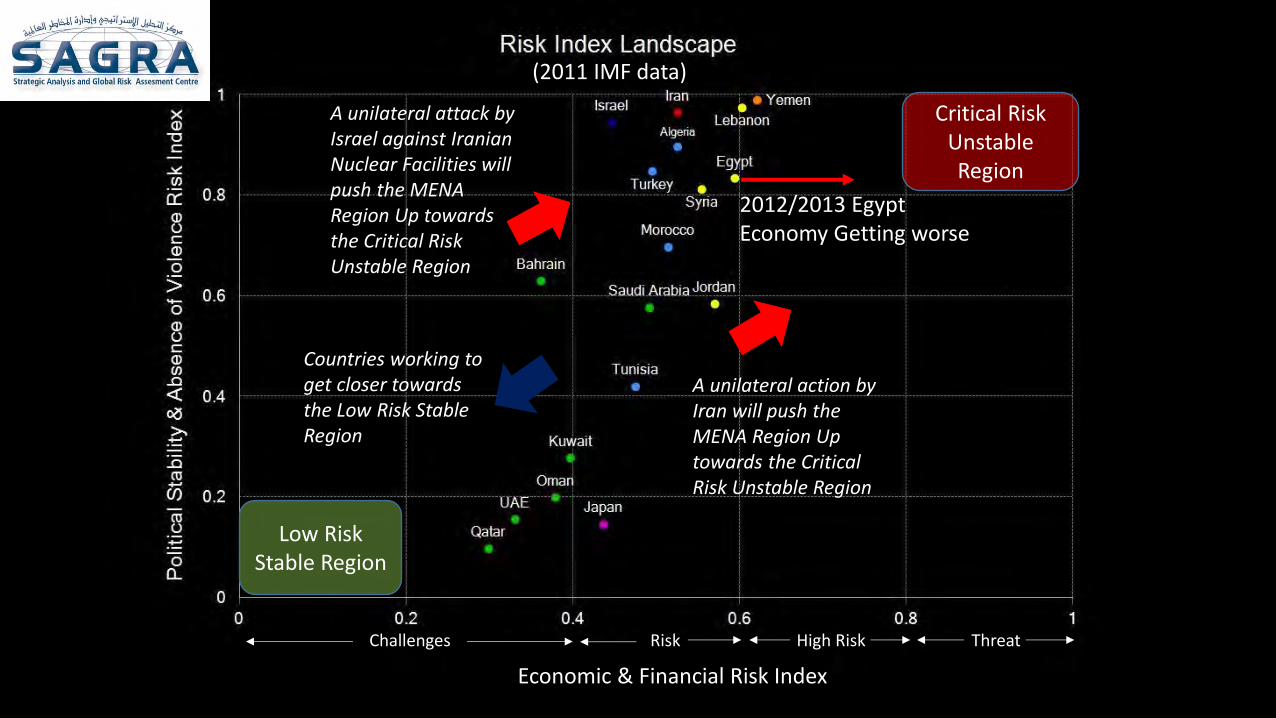
A unilateral action by Iran will push the MENA Region Up towards the Critical Risk Unstable Region
A unilateral attack by Israel against Iranian Nuclear Facilities will push the MENA Region Up towards the Critical Risk Unstable Region
Critical Risk Unstable Region
Low Risk Stable Region
Countries working to get closer towards the Low Risk Stable Region
Challenges Risk High Risk Threat
Economic & Financial Risk Index
(2011 IMF data)
2012/2013 Egypt Economy Getting worse
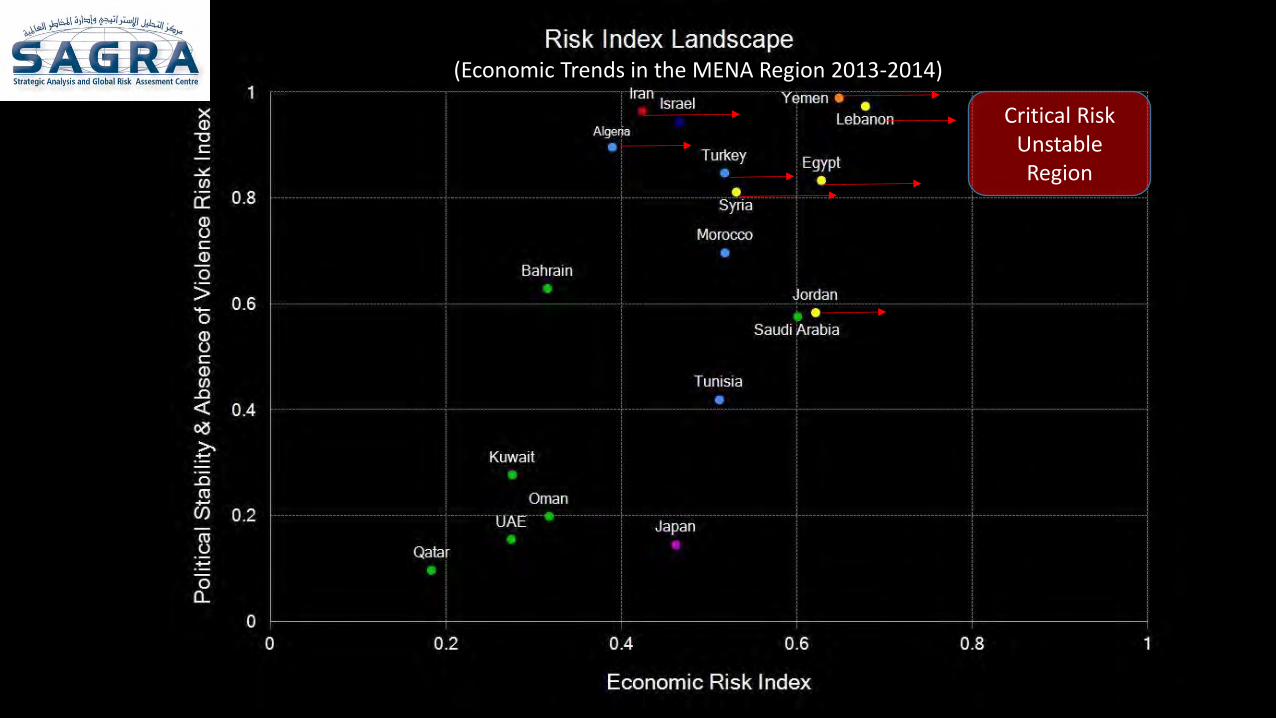
(Economic Trends in the MENA Region 2013-2014)
Critical Risk Unstable Region
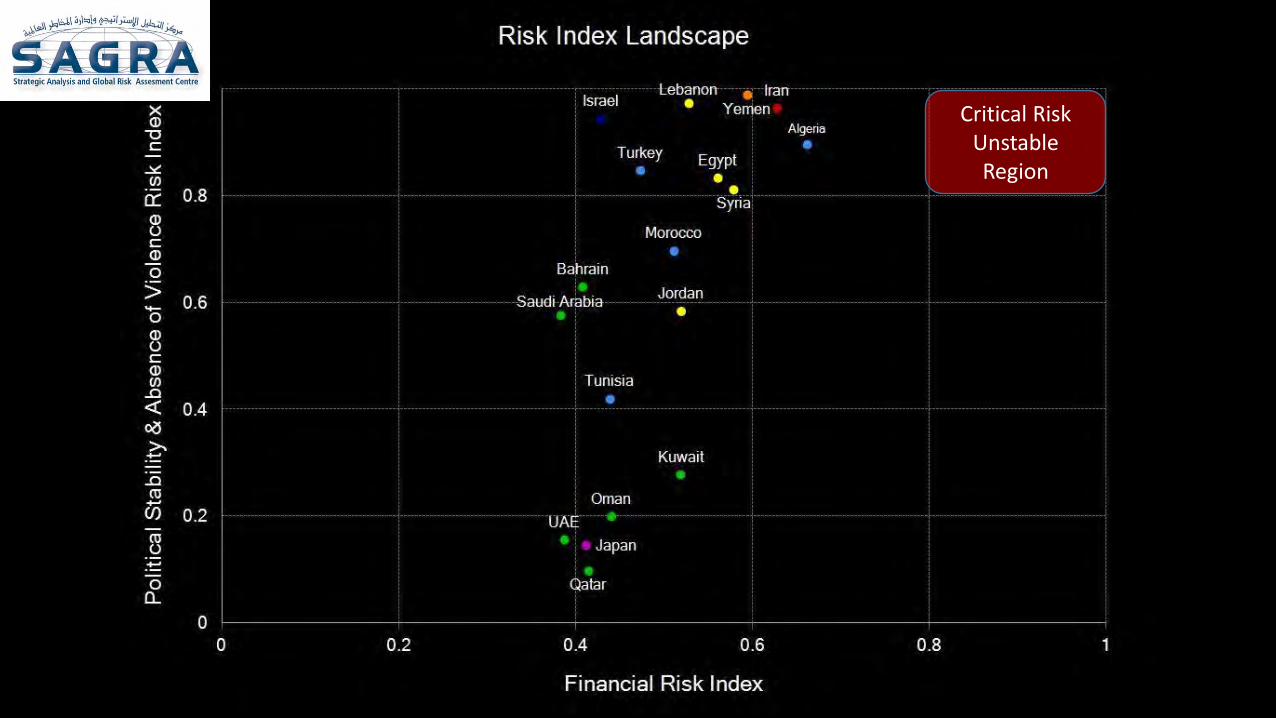
Critical Risk Unstable Region
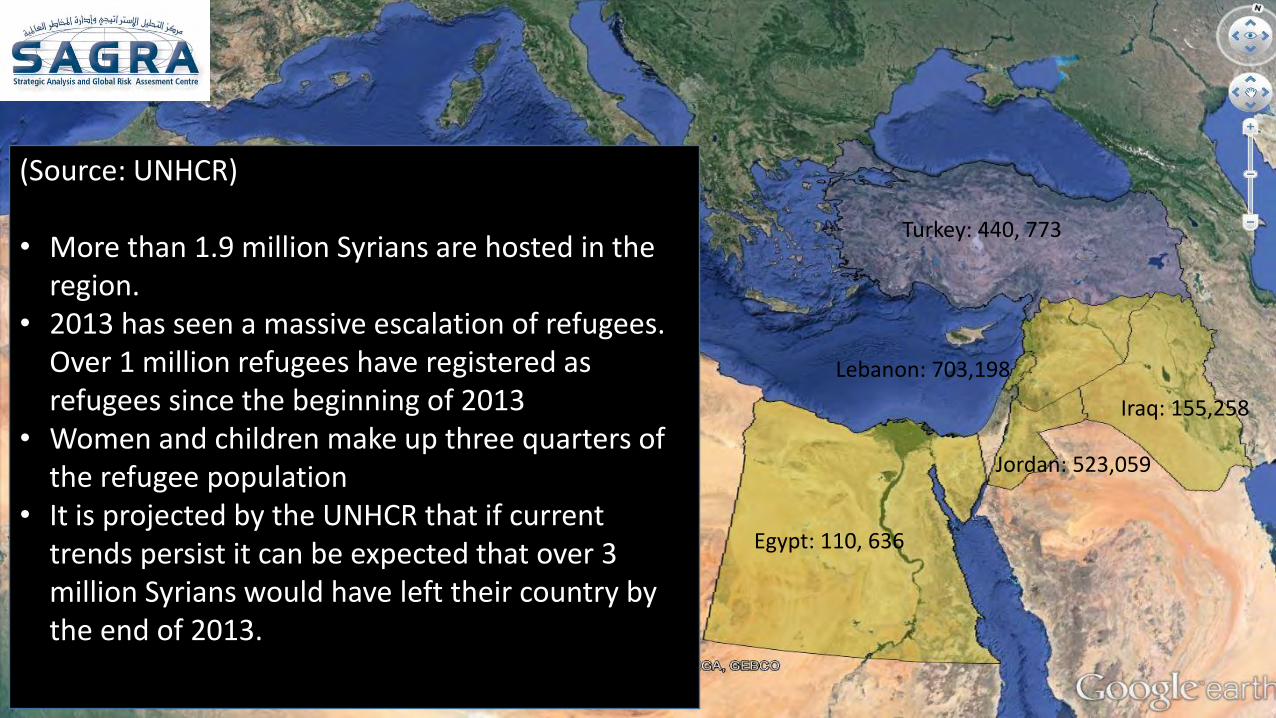
(Source: UNHCR) • More than 1.9 million Syrians are hosted in the
region. • 2013 has seen a massive escalation of refugees.
Over 1 million refugees have registered as refugees since the beginning of 2013
• Women and children make up three quarters of the refugee population
• It is projected by the UNHCR that if current trends persist it can be expected that over 3 million Syrians would have left their country by the end of 2013.
Turkey: 440, 773
Iraq: 155,258
Lebanon: 703,198
Jordan: 523,059
Egypt: 110, 636
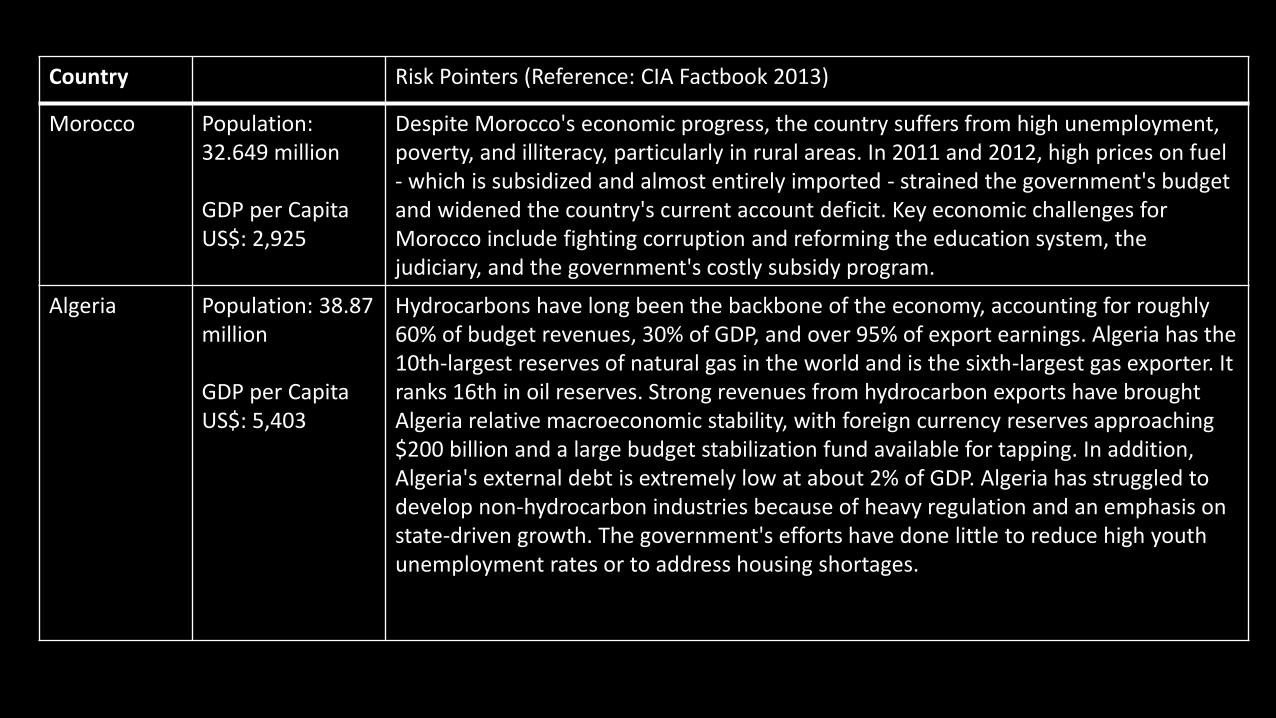
Country Risk Pointers (Reference: CIA Factbook 2013)
Morocco Population: 32.649 million GDP per Capita US$: 2,925
Despite Morocco's economic progress, the country suffers from high unemployment, poverty, and illiteracy, particularly in rural areas. In 2011 and 2012, high prices on fuel - which is subsidized and almost entirely imported - strained the government's budget and widened the country's current account deficit. Key economic challenges for Morocco include fighting corruption and reforming the education system, the judiciary, and the government's costly subsidy program.
Algeria Population: 38.87 million GDP per Capita US$: 5,403
Hydrocarbons have long been the backbone of the economy, accounting for roughly 60% of budget revenues, 30% of GDP, and over 95% of export earnings. Algeria has the 10th-largest reserves of natural gas in the world and is the sixth-largest gas exporter. It ranks 16th in oil reserves. Strong revenues from hydrocarbon exports have brought Algeria relative macroeconomic stability, with foreign currency reserves approaching $200 billion and a large budget stabilization fund available for tapping. In addition, Algeria's external debt is extremely low at about 2% of GDP. Algeria has struggled to develop non-hydrocarbon industries because of heavy regulation and an emphasis on state-driven growth. The government's efforts have done little to reduce high youth unemployment rates or to address housing shortages.
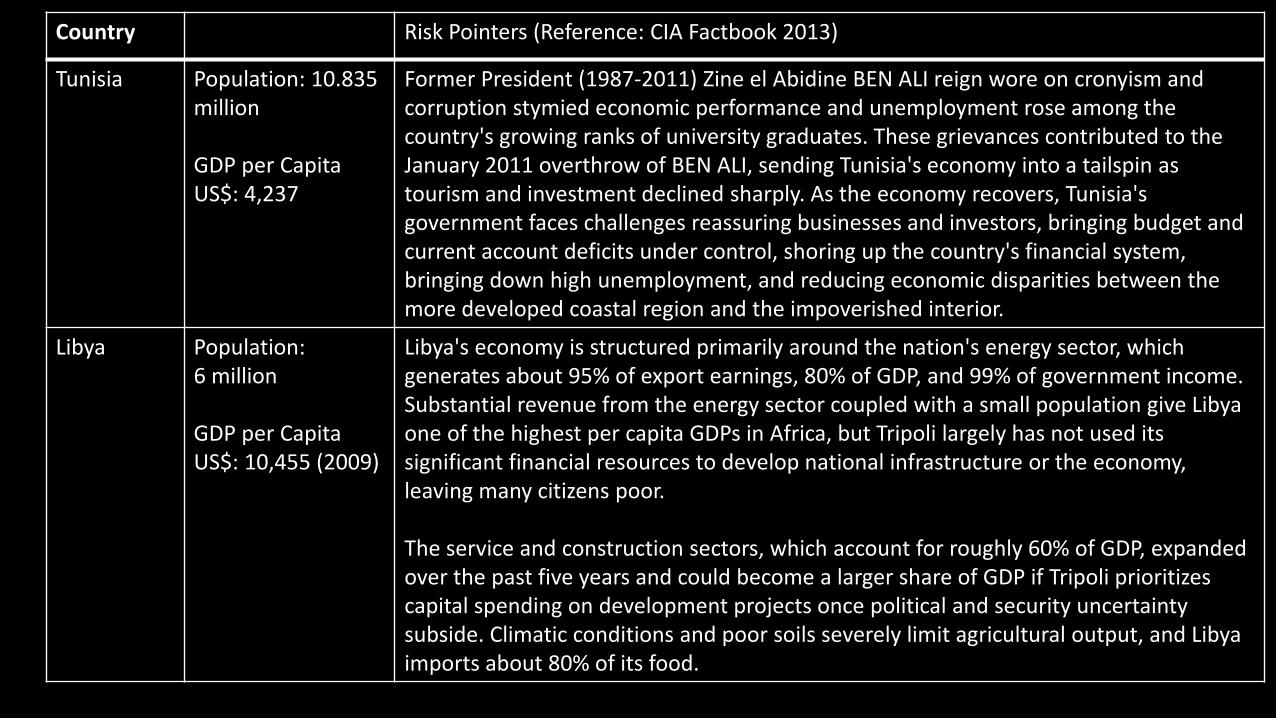
Country Risk Pointers (Reference: CIA Factbook 2013)
Tunisia Population: 10.835 million GDP per Capita US$: 4,237
Former President (1987-2011) Zine el Abidine BEN ALI reign wore on cronyism and corruption stymied economic performance and unemployment rose among the country's growing ranks of university graduates. These grievances contributed to the January 2011 overthrow of BEN ALI, sending Tunisia's economy into a tailspin as tourism and investment declined sharply. As the economy recovers, Tunisia's government faces challenges reassuring businesses and investors, bringing budget and current account deficits under control, shoring up the country's financial system, bringing down high unemployment, and reducing economic disparities between the more developed coastal region and the impoverished interior.
Libya Population: 6 million GDP per Capita US$: 10,455 (2009)
Libya's economy is structured primarily around the nation's energy sector, which generates about 95% of export earnings, 80% of GDP, and 99% of government income. Substantial revenue from the energy sector coupled with a small population give Libya one of the highest per capita GDPs in Africa, but Tripoli largely has not used its significant financial resources to develop national infrastructure or the economy, leaving many citizens poor. The service and construction sectors, which account for roughly 60% of GDP, expanded over the past five years and could become a larger share of GDP if Tripoli prioritizes capital spending on development projects once political and security uncertainty subside. Climatic conditions and poor soils severely limit agricultural output, and Libya imports about 80% of its food.
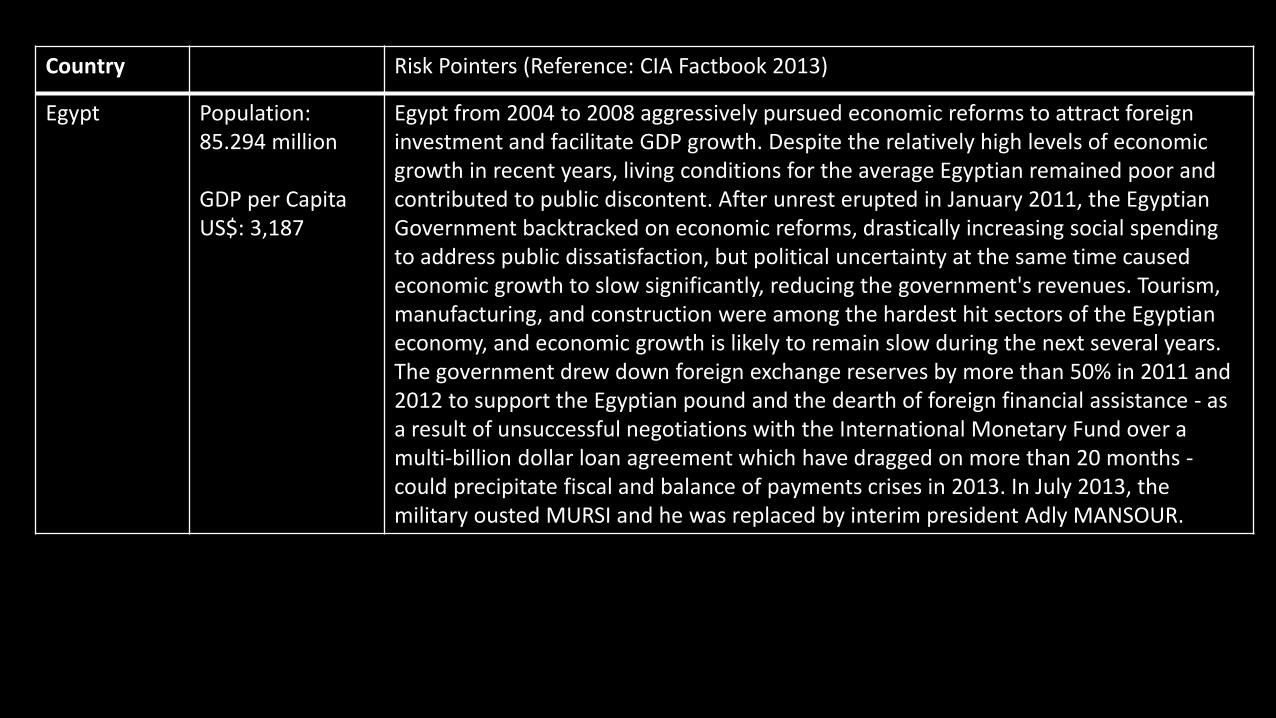
Country Risk Pointers (Reference: CIA Factbook 2013)
Egypt Population: 85.294 million GDP per Capita US$: 3,187
Egypt from 2004 to 2008 aggressively pursued economic reforms to attract foreign investment and facilitate GDP growth. Despite the relatively high levels of economic growth in recent years, living conditions for the average Egyptian remained poor and contributed to public discontent. After unrest erupted in January 2011, the Egyptian Government backtracked on economic reforms, drastically increasing social spending to address public dissatisfaction, but political uncertainty at the same time caused economic growth to slow significantly, reducing the government's revenues. Tourism, manufacturing, and construction were among the hardest hit sectors of the Egyptian economy, and economic growth is likely to remain slow during the next several years. The government drew down foreign exchange reserves by more than 50% in 2011 and 2012 to support the Egyptian pound and the dearth of foreign financial assistance - as a result of unsuccessful negotiations with the International Monetary Fund over a multi-billion dollar loan agreement which have dragged on more than 20 months - could precipitate fiscal and balance of payments crises in 2013. In July 2013, the military ousted MURSI and he was replaced by interim president Adly MANSOUR.
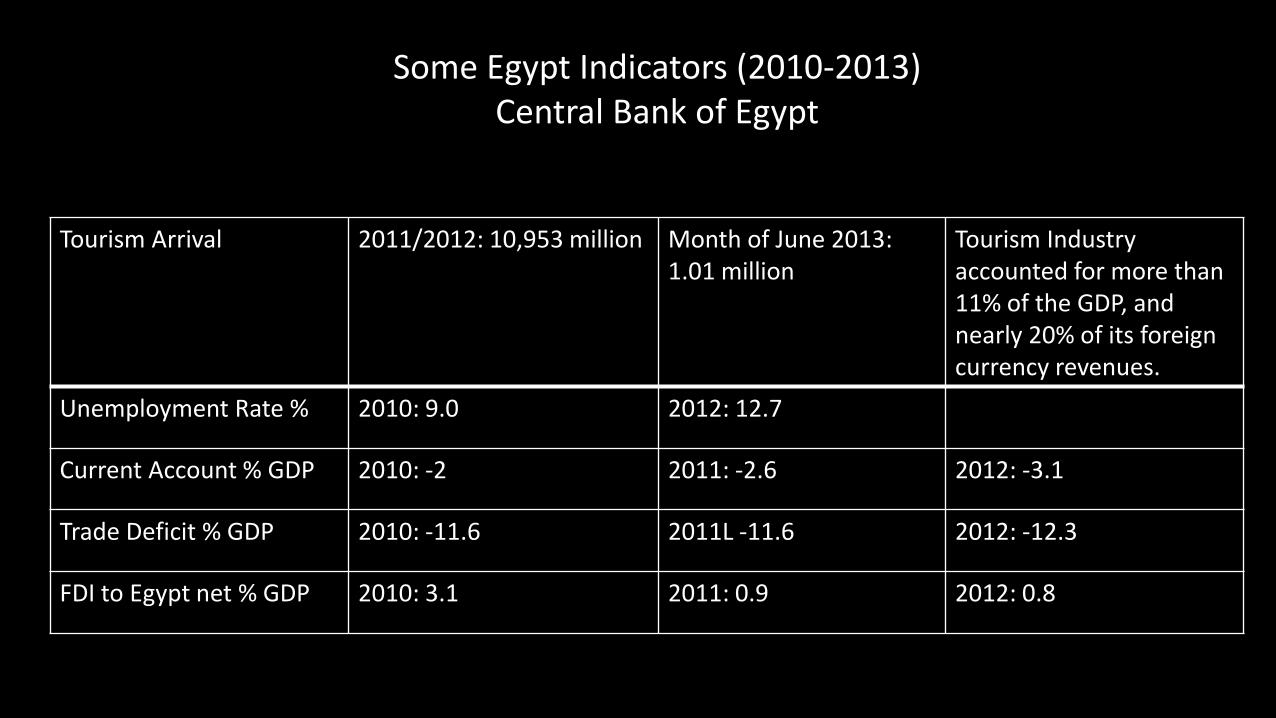
Tourism Arrival 2011/2012: 10,953 million Month of June 2013: 1.01 million
Tourism Industry accounted for more than 11% of the GDP, and nearly 20% of its foreign currency revenues.
Unemployment Rate % 2010: 9.0 2012: 12.7
Current Account % GDP 2010: -2 2011: -2.6 2012: -3.1
Trade Deficit % GDP 2010: -11.6 2011L -11.6 2012: -12.3
FDI to Egypt net % GDP 2010: 3.1 2011: 0.9 2012: 0.8
Some Egypt Indicators (2010-2013) Central Bank of Egypt
Country Risk Pointers (Reference: CIA Factbook 2013)
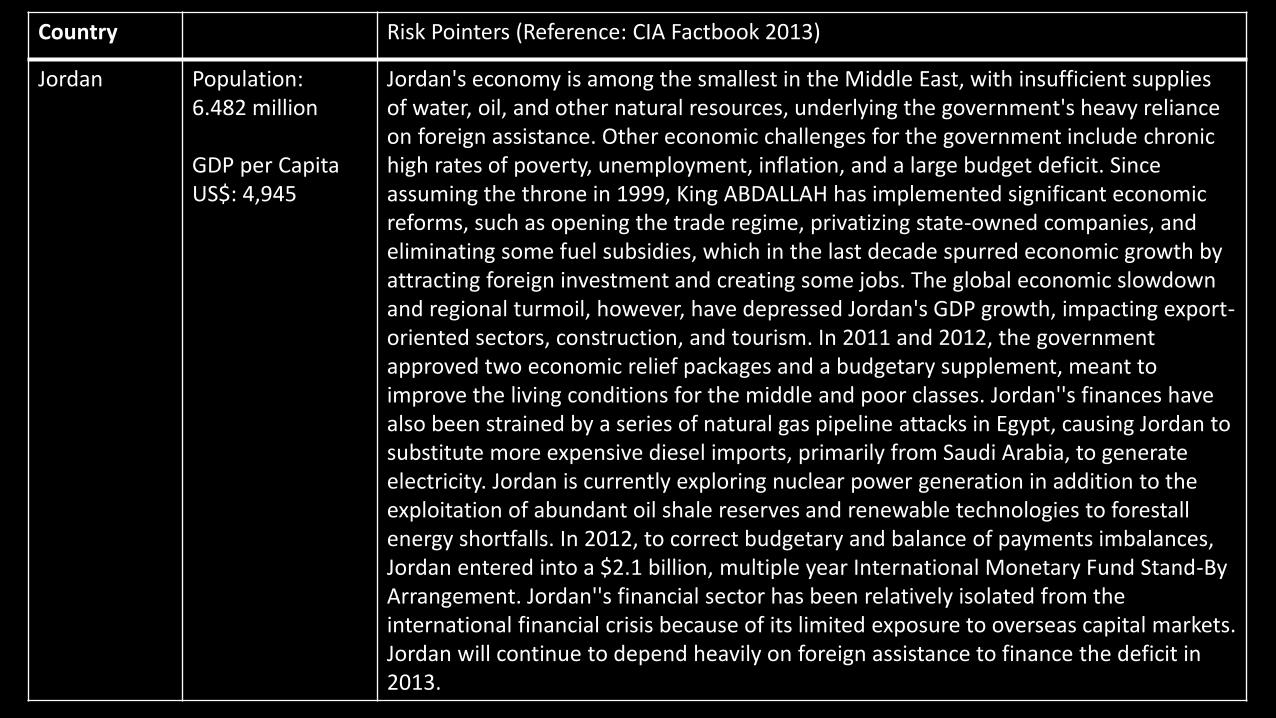
Jordan Population: 6.482 million GDP per Capita US$: 4,945
Jordan's economy is among the smallest in the Middle East, with insufficient supplies of water, oil, and other natural resources, underlying the government's heavy reliance on foreign assistance. Other economic challenges for the government include chronic high rates of poverty, unemployment, inflation, and a large budget deficit. Since assuming the throne in 1999, King ABDALLAH has implemented significant economic reforms, such as opening the trade regime, privatizing state-owned companies, and eliminating some fuel subsidies, which in the last decade spurred economic growth by attracting foreign investment and creating some jobs. The global economic slowdown and regional turmoil, however, have depressed Jordan's GDP growth, impacting export-oriented sectors, construction, and tourism. In 2011 and 2012, the government approved two economic relief packages and a budgetary supplement, meant to improve the living conditions for the middle and poor classes. Jordan''s finances have also been strained by a series of natural gas pipeline attacks in Egypt, causing Jordan to substitute more expensive diesel imports, primarily from Saudi Arabia, to generate electricity. Jordan is currently exploring nuclear power generation in addition to the exploitation of abundant oil shale reserves and renewable technologies to forestall energy shortfalls. In 2012, to correct budgetary and balance of payments imbalances, Jordan entered into a $2.1 billion, multiple year International Monetary Fund Stand-By Arrangement. Jordan''s financial sector has been relatively isolated from the international financial crisis because of its limited exposure to overseas capital markets. Jordan will continue to depend heavily on foreign assistance to finance the deficit in 2013.
Country Risk Pointers (Reference: CIA Factbook 2013)
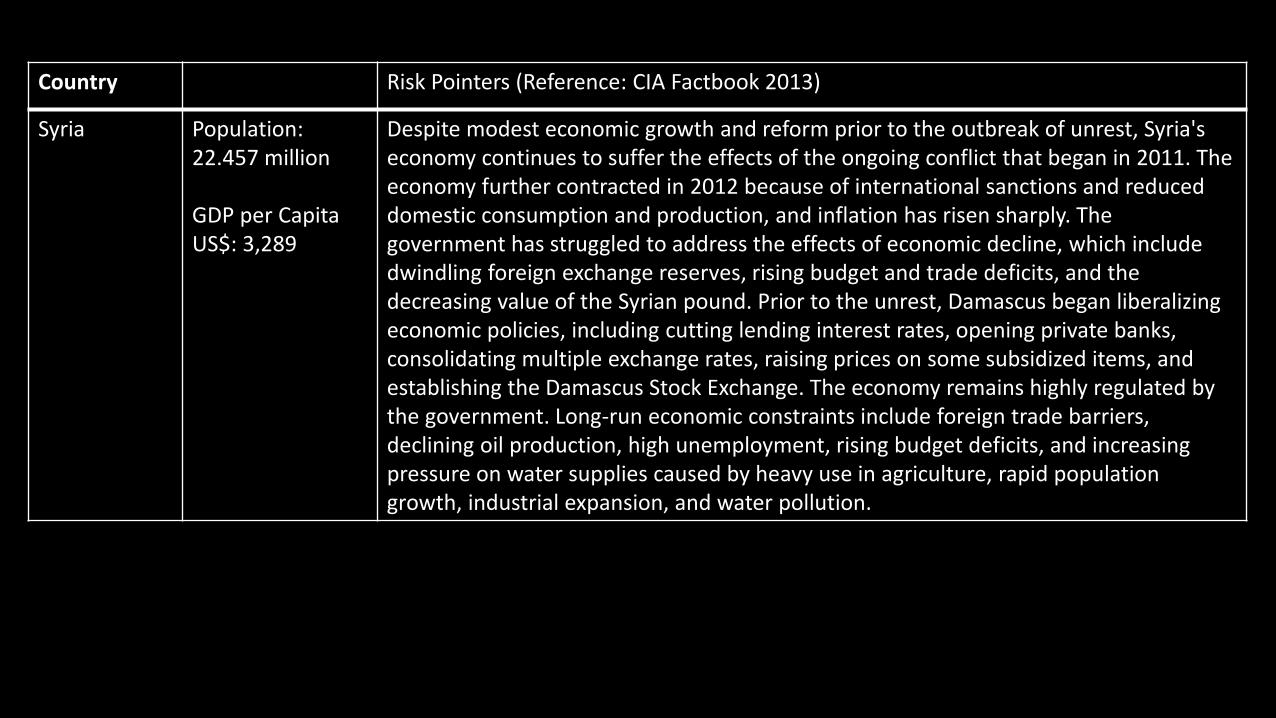
Syria Population: 22.457 million GDP per Capita US$: 3,289
Despite modest economic growth and reform prior to the outbreak of unrest, Syria's economy continues to suffer the effects of the ongoing conflict that began in 2011. The economy further contracted in 2012 because of international sanctions and reduced domestic consumption and production, and inflation has risen sharply. The government has struggled to address the effects of economic decline, which include dwindling foreign exchange reserves, rising budget and trade deficits, and the decreasing value of the Syrian pound. Prior to the unrest, Damascus began liberalizing economic policies, including cutting lending interest rates, opening private banks, consolidating multiple exchange rates, raising prices on some subsidized items, and establishing the Damascus Stock Exchange. The economy remains highly regulated by the government. Long-run economic constraints include foreign trade barriers, declining oil production, high unemployment, rising budget deficits, and increasing pressure on water supplies caused by heavy use in agriculture, rapid population growth, industrial expansion, and water pollution.
Country Risk Pointers (Reference: CIA Factbook 2013)
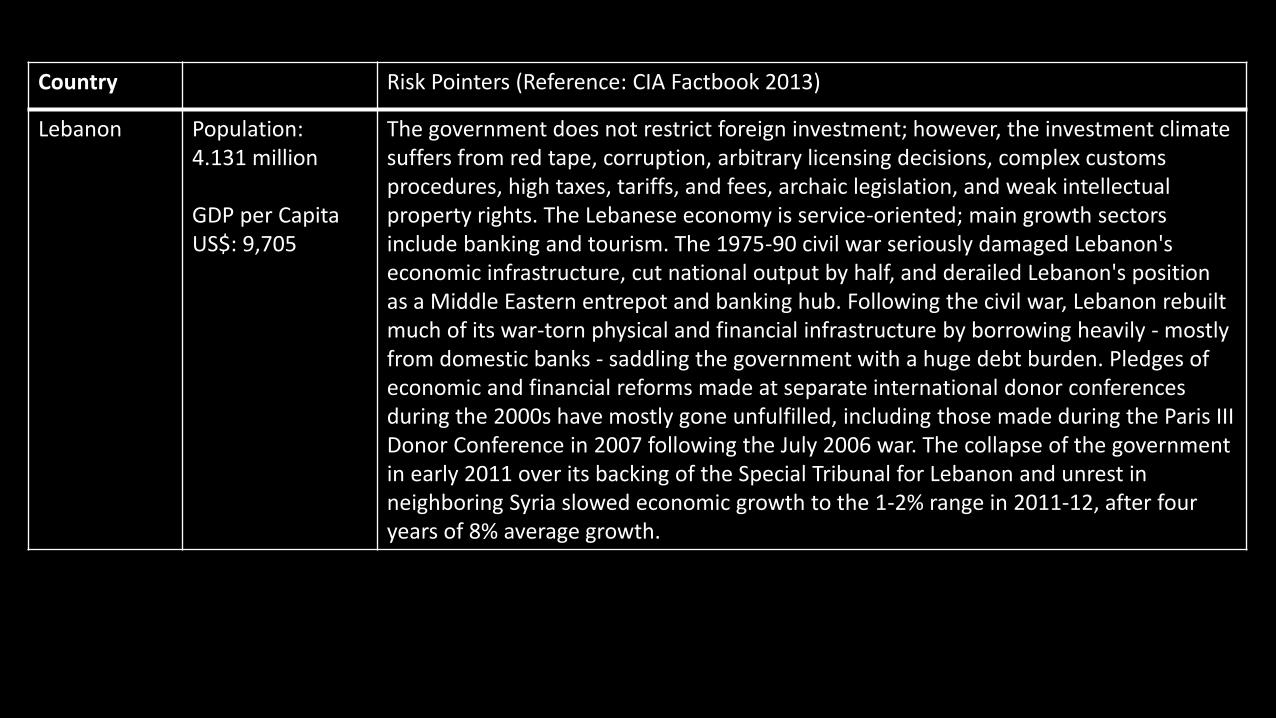
Lebanon Population: 4.131 million GDP per Capita US$: 9,705
The government does not restrict foreign investment; however, the investment climate suffers from red tape, corruption, arbitrary licensing decisions, complex customs procedures, high taxes, tariffs, and fees, archaic legislation, and weak intellectual property rights. The Lebanese economy is service-oriented; main growth sectors include banking and tourism. The 1975-90 civil war seriously damaged Lebanon's economic infrastructure, cut national output by half, and derailed Lebanon's position as a Middle Eastern entrepot and banking hub. Following the civil war, Lebanon rebuilt much of its war-torn physical and financial infrastructure by borrowing heavily - mostly from domestic banks - saddling the government with a huge debt burden. Pledges of economic and financial reforms made at separate international donor conferences during the 2000s have mostly gone unfulfilled, including those made during the Paris III Donor Conference in 2007 following the July 2006 war. The collapse of the government in early 2011 over its backing of the Special Tribunal for Lebanon and unrest in neighboring Syria slowed economic growth to the 1-2% range in 2011-12, after four years of 8% average growth.
Country Risk Pointers (Reference: CIA Factbook 2013)
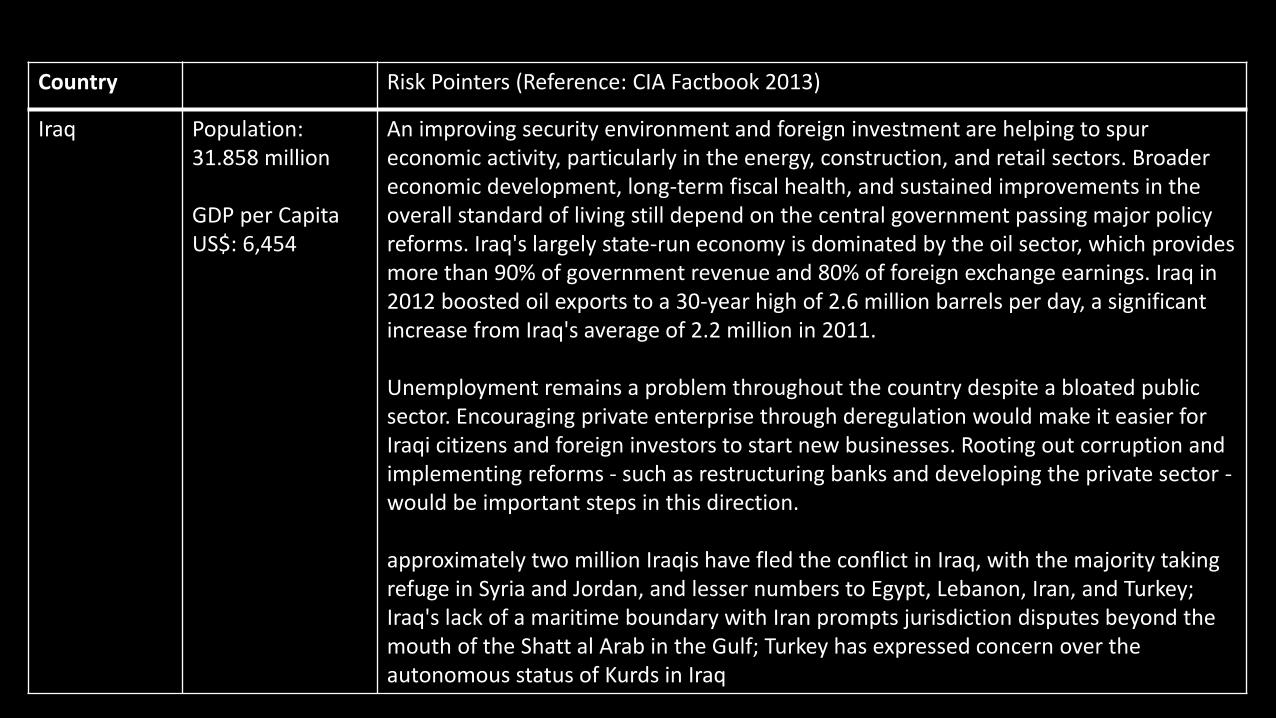
Iraq Population: 31.858 million GDP per Capita US$: 6,454
An improving security environment and foreign investment are helping to spur economic activity, particularly in the energy, construction, and retail sectors. Broader economic development, long-term fiscal health, and sustained improvements in the overall standard of living still depend on the central government passing major policy reforms. Iraq's largely state-run economy is dominated by the oil sector, which provides more than 90% of government revenue and 80% of foreign exchange earnings. Iraq in 2012 boosted oil exports to a 30-year high of 2.6 million barrels per day, a significant increase from Iraq's average of 2.2 million in 2011. Unemployment remains a problem throughout the country despite a bloated public sector. Encouraging private enterprise through deregulation would make it easier for Iraqi citizens and foreign investors to start new businesses. Rooting out corruption and implementing reforms - such as restructuring banks and developing the private sector - would be important steps in this direction. approximately two million Iraqis have fled the conflict in Iraq, with the majority taking refuge in Syria and Jordan, and lesser numbers to Egypt, Lebanon, Iran, and Turkey; Iraq's lack of a maritime boundary with Iran prompts jurisdiction disputes beyond the mouth of the Shatt al Arab in the Gulf; Turkey has expressed concern over the autonomous status of Kurds in Iraq
Country Risk Pointers (Reference: CIA Factbook 2013)
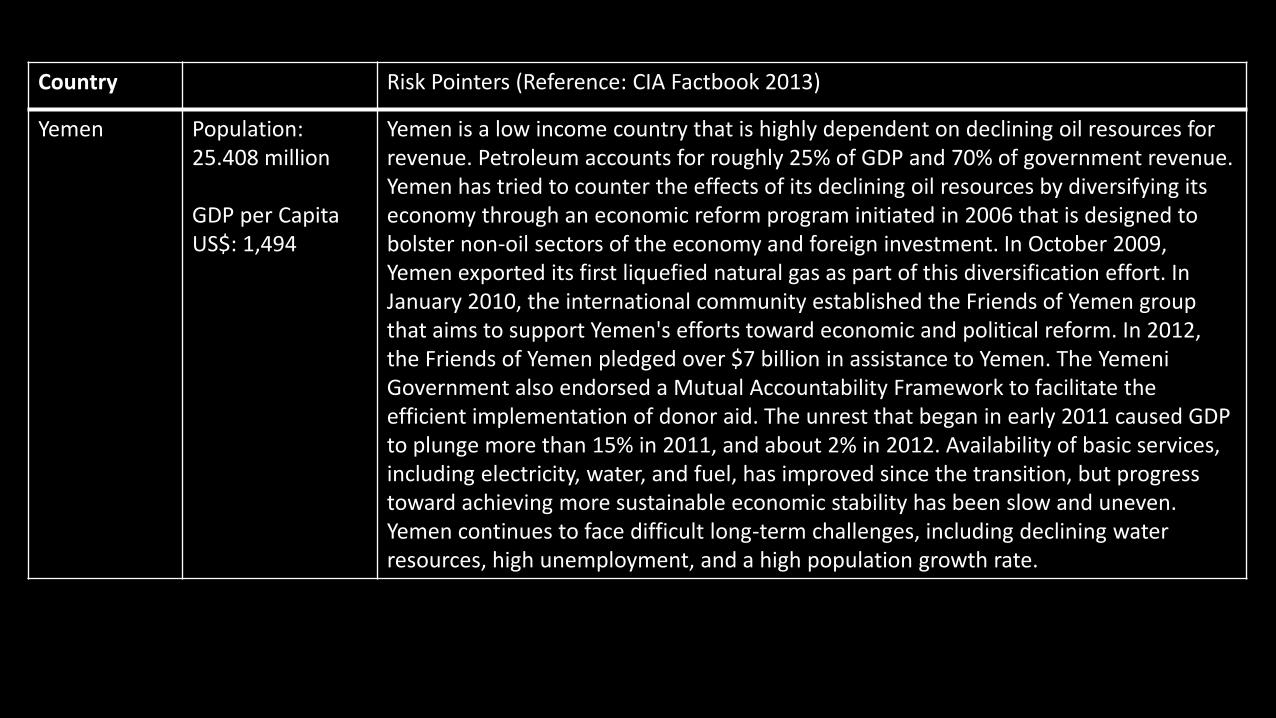
Yemen Population: 25.408 million GDP per Capita US$: 1,494
Yemen is a low income country that is highly dependent on declining oil resources for revenue. Petroleum accounts for roughly 25% of GDP and 70% of government revenue. Yemen has tried to counter the effects of its declining oil resources by diversifying its economy through an economic reform program initiated in 2006 that is designed to bolster non-oil sectors of the economy and foreign investment. In October 2009, Yemen exported its first liquefied natural gas as part of this diversification effort. In January 2010, the international community established the Friends of Yemen group that aims to support Yemen's efforts toward economic and political reform. In 2012, the Friends of Yemen pledged over $7 billion in assistance to Yemen. The Yemeni Government also endorsed a Mutual Accountability Framework to facilitate the efficient implementation of donor aid. The unrest that began in early 2011 caused GDP to plunge more than 15% in 2011, and about 2% in 2012. Availability of basic services, including electricity, water, and fuel, has improved since the transition, but progress toward achieving more sustainable economic stability has been slow and uneven. Yemen continues to face difficult long-term challenges, including declining water resources, high unemployment, and a high population growth rate.
Country Risk Pointers (Reference: CIA Factbook 2013)
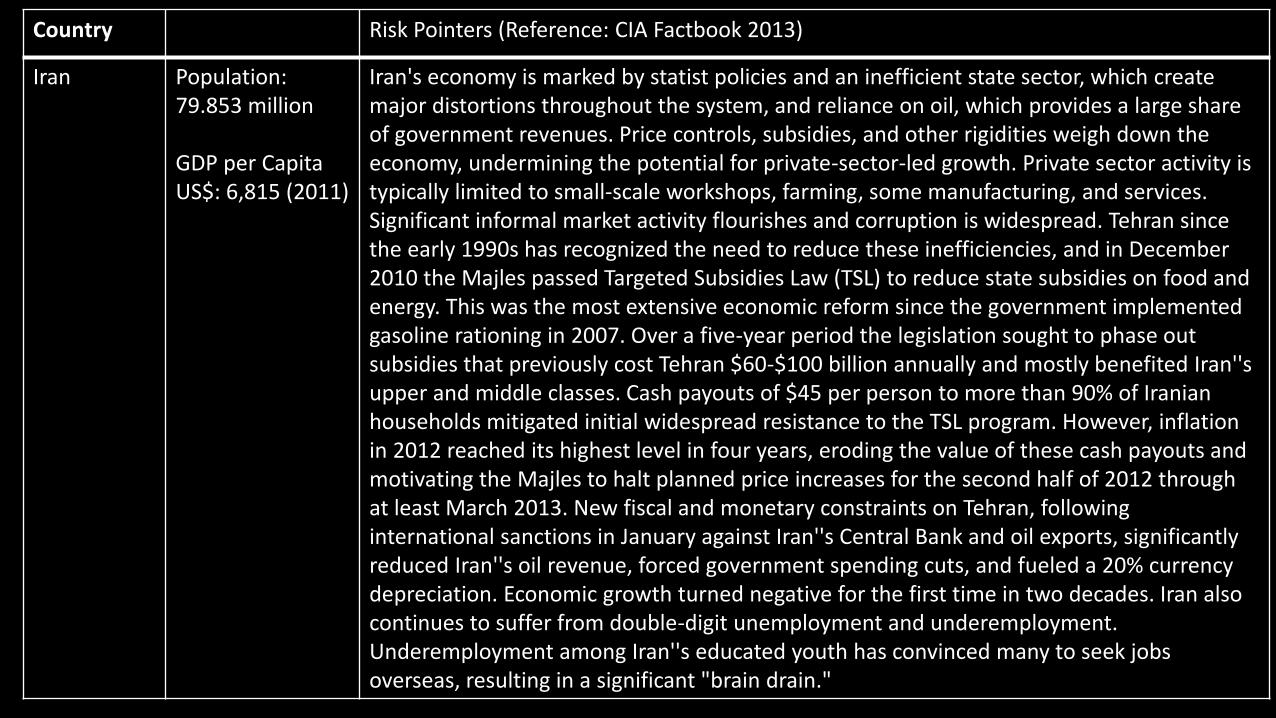
Iran Population: 79.853 million GDP per Capita US$: 6,815 (2011)
Iran's economy is marked by statist policies and an inefficient state sector, which create major distortions throughout the system, and reliance on oil, which provides a large share of government revenues. Price controls, subsidies, and other rigidities weigh down the economy, undermining the potential for private-sector-led growth. Private sector activity is typically limited to small-scale workshops, farming, some manufacturing, and services. Significant informal market activity flourishes and corruption is widespread. Tehran since the early 1990s has recognized the need to reduce these inefficiencies, and in December 2010 the Majles passed Targeted Subsidies Law (TSL) to reduce state subsidies on food and energy. This was the most extensive economic reform since the government implemented gasoline rationing in 2007. Over a five-year period the legislation sought to phase out subsidies that previously cost Tehran $60-$100 billion annually and mostly benefited Iran''s upper and middle classes. Cash payouts of $45 per person to more than 90% of Iranian households mitigated initial widespread resistance to the TSL program. However, inflation in 2012 reached its highest level in four years, eroding the value of these cash payouts and motivating the Majles to halt planned price increases for the second half of 2012 through at least March 2013. New fiscal and monetary constraints on Tehran, following international sanctions in January against Iran''s Central Bank and oil exports, significantly reduced Iran''s oil revenue, forced government spending cuts, and fueled a 20% currency depreciation. Economic growth turned negative for the first time in two decades. Iran also continues to suffer from double-digit unemployment and underemployment. Underemployment among Iran''s educated youth has convinced many to seek jobs overseas, resulting in a significant "brain drain."
Country Risk Pointers (Reference: CIA Factbook 2013)
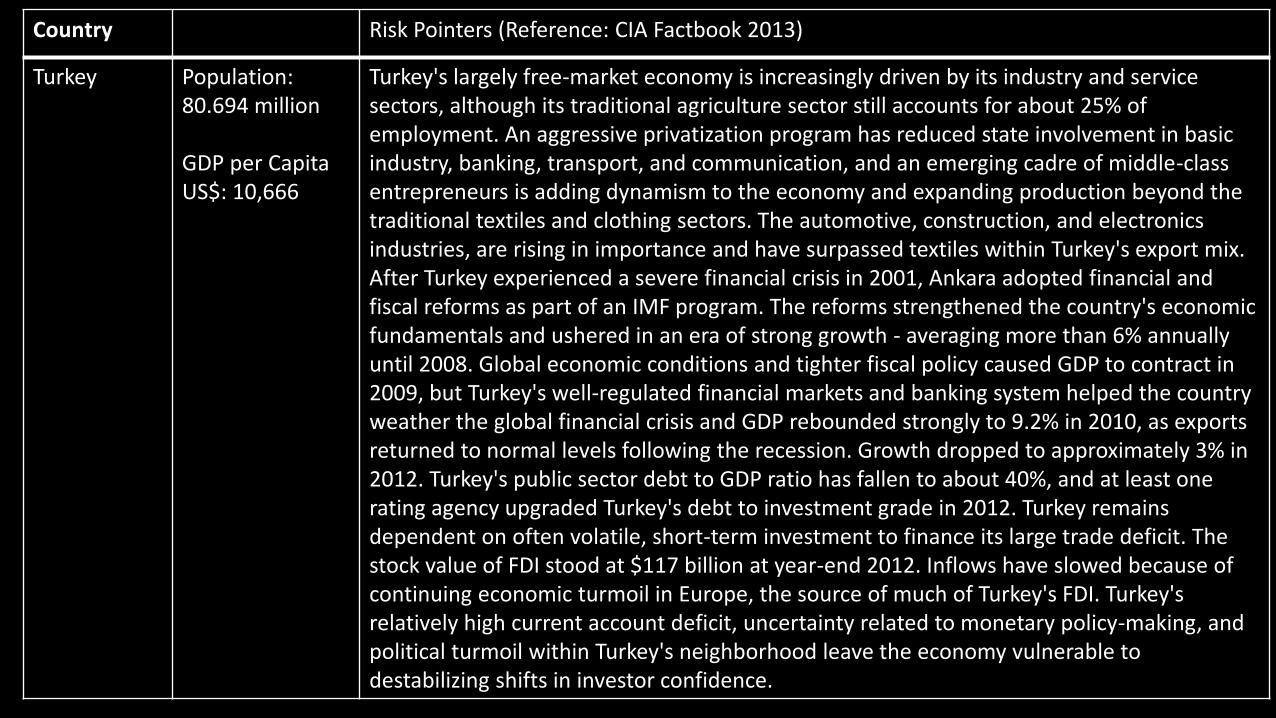
Turkey Population: 80.694 million GDP per Capita US$: 10,666
Turkey's largely free-market economy is increasingly driven by its industry and service sectors, although its traditional agriculture sector still accounts for about 25% of employment. An aggressive privatization program has reduced state involvement in basic industry, banking, transport, and communication, and an emerging cadre of middle-class entrepreneurs is adding dynamism to the economy and expanding production beyond the traditional textiles and clothing sectors. The automotive, construction, and electronics industries, are rising in importance and have surpassed textiles within Turkey's export mix. After Turkey experienced a severe financial crisis in 2001, Ankara adopted financial and fiscal reforms as part of an IMF program. The reforms strengthened the country's economic fundamentals and ushered in an era of strong growth - averaging more than 6% annually until 2008. Global economic conditions and tighter fiscal policy caused GDP to contract in 2009, but Turkey's well-regulated financial markets and banking system helped the country weather the global financial crisis and GDP rebounded strongly to 9.2% in 2010, as exports returned to normal levels following the recession. Growth dropped to approximately 3% in 2012. Turkey's public sector debt to GDP ratio has fallen to about 40%, and at least one rating agency upgraded Turkey's debt to investment grade in 2012. Turkey remains dependent on often volatile, short-term investment to finance its large trade deficit. The stock value of FDI stood at $117 billion at year-end 2012. Inflows have slowed because of continuing economic turmoil in Europe, the source of much of Turkey's FDI. Turkey's relatively high current account deficit, uncertainty related to monetary policy-making, and political turmoil within Turkey's neighborhood leave the economy vulnerable to destabilizing shifts in investor confidence.
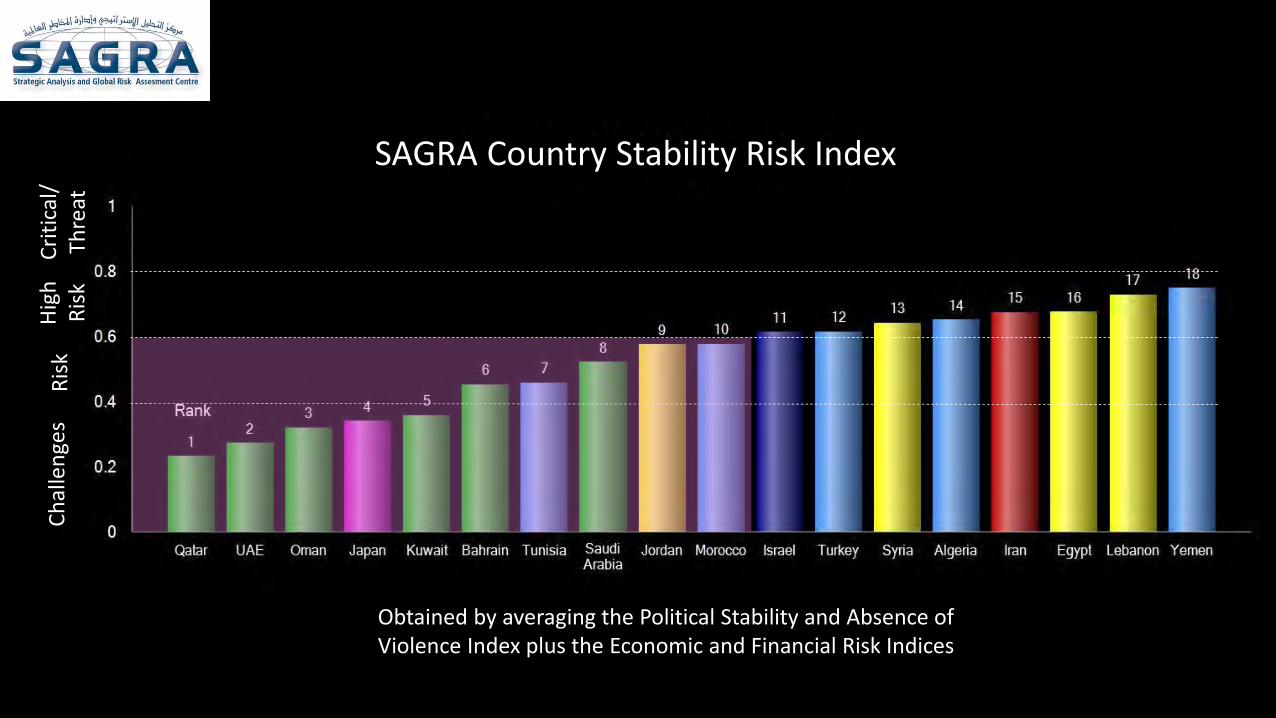
Obtained by averaging the Political Stability and Absence of Violence Index plus the Economic and Financial Risk Indices
Ch
alle
nge
s R
isk
Hig
hR
isk
Cri
tica
l/Th
reat
SAGRA Country Stability Risk Index
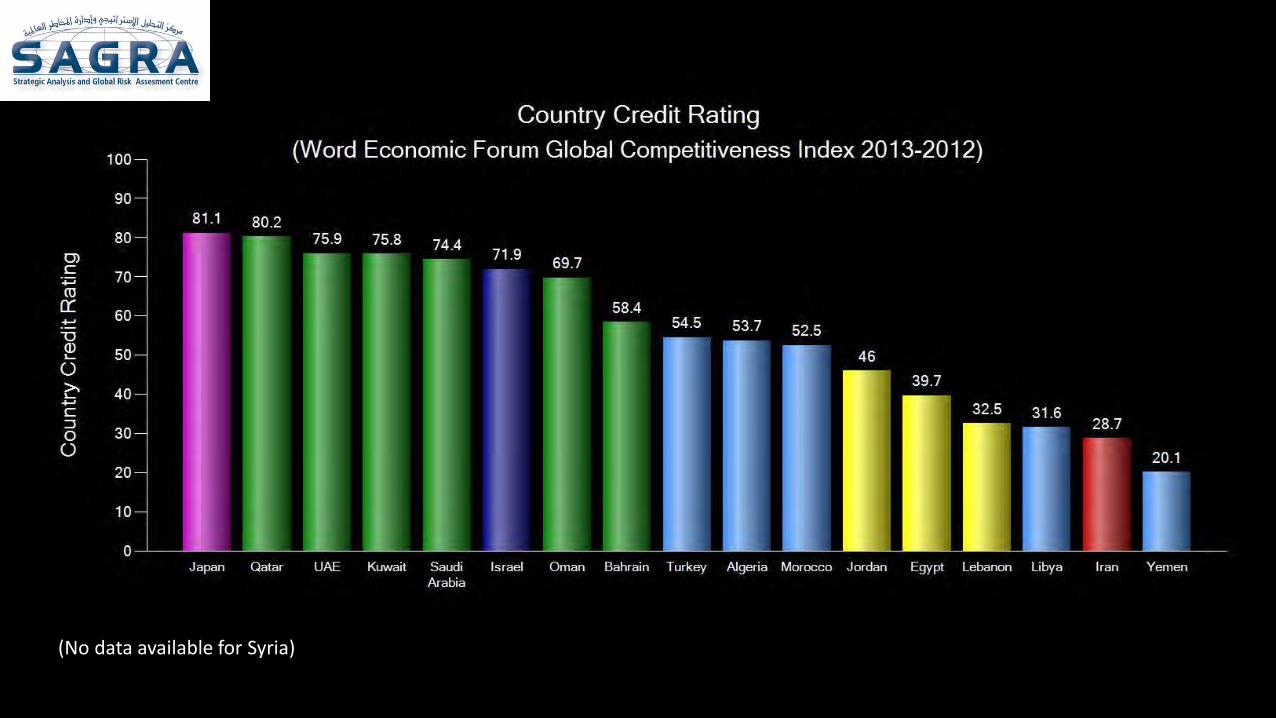
(No data available for Syria)
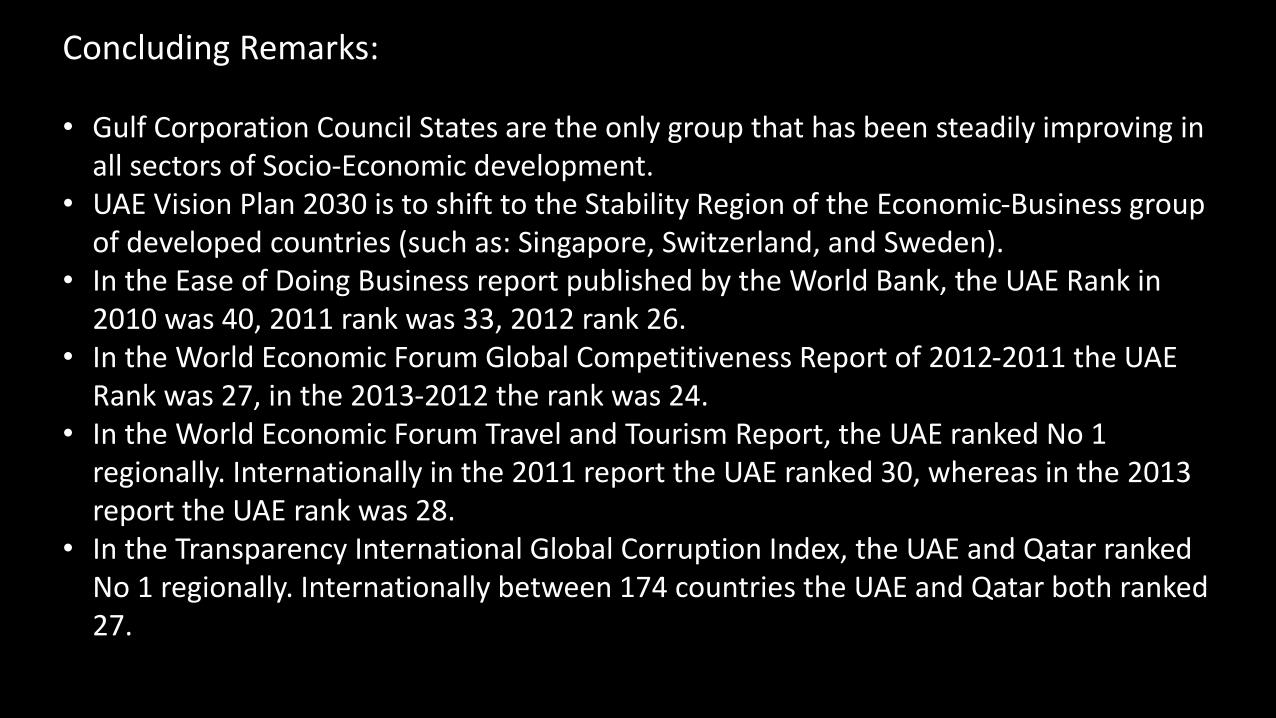
Concluding Remarks: • Gulf Corporation Council States are the only group that has been steadily improving in
all sectors of Socio-Economic development. • UAE Vision Plan 2030 is to shift to the Stability Region of the Economic-Business group
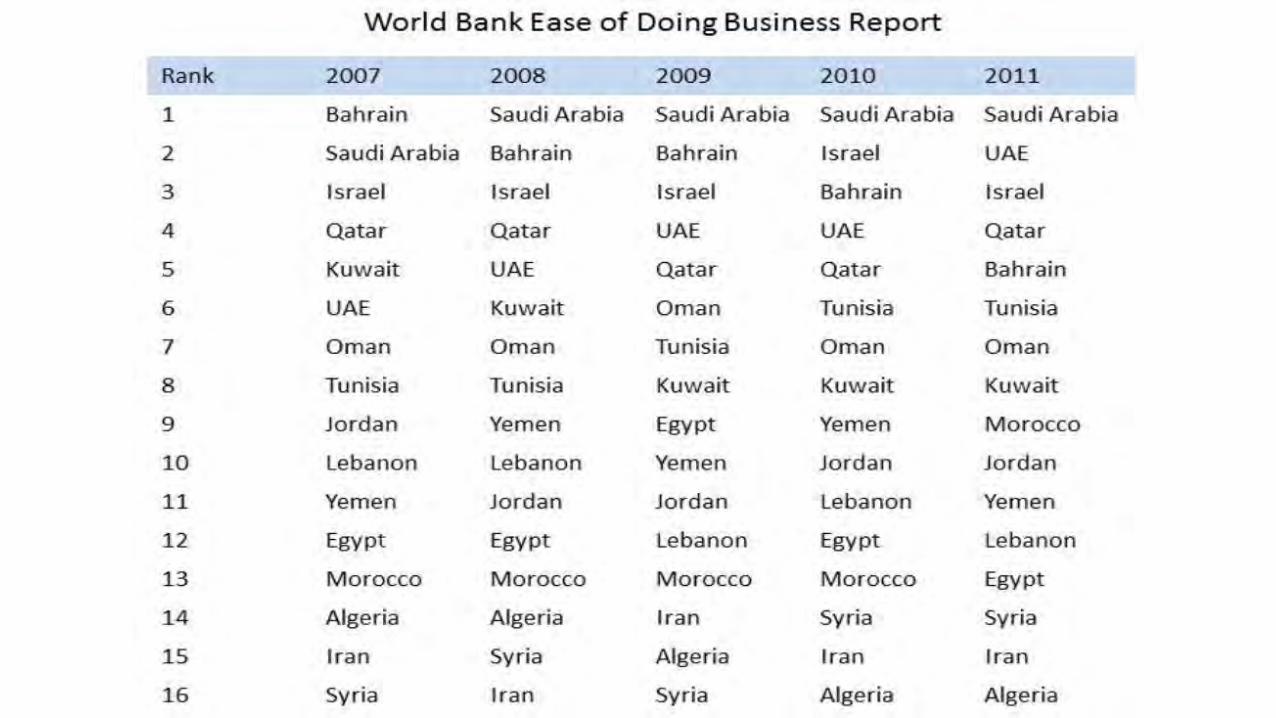
of developed countries (such as: Singapore, Switzerland, and Sweden). • In the Ease of Doing Business report published by the World Bank, the UAE Rank in
2010 was 40, 2011 rank was 33, 2012 rank 26. • In the World Economic Forum Global Competitiveness Report of 2012-2011 the UAE
Rank was 27, in the 2013-2012 the rank was 24. • In the World Economic Forum Travel and Tourism Report, the UAE ranked No 1
regionally. Internationally in the 2011 report the UAE ranked 30, whereas in the 2013 report the UAE rank was 28.
• In the Transparency International Global Corruption Index, the UAE and Qatar ranked No 1 regionally. Internationally between 174 countries the UAE and Qatar both ranked 27.
END