Embed Size (px)
Citation preview
RESEARCH ARTICLE
The microscopic relationships between
triangular arbitrage and cross-currency
correlations in a simple agent based model of
foreign exchange markets
Alberto CiacciID1,2☯*, Takumi Sueshige3☯, Hideki Takayasu4,5, Kim Christensen1,2,
Misako Takayasu3,4*
1 Blackett Laboratory, Imperial College London, London, England, United Kingdom, 2 Center for Complexity
Science, Imperial College London, London, England, United Kingdom, 3 Department of Mathematical and
Computing Science, School of Computing, Tokyo Institute of Technology, Nagatsuta-cho, Midori-ku,
Yokohama, Japan, 4 Institute of Innovative Research, Tokyo Institute of Technology, Nagatsuta-cho,
Yokohama, Japan, 5 Sony Computer Science Laboratories, Higashigotanda, Shinagawa-ku, Tokyo, Japan
☯ These authors contributed equally to this work.
* [email protected] (AC); [email protected] (MT)
Abstract
Foreign exchange rates movements exhibit significant cross-correlations even on very short
time-scales. The effect of these statistical relationships become evident during extreme
market events, such as flash crashes. Although a deep understanding of cross-currency
correlations would be clearly beneficial for conceiving more stable and safer foreign
exchange markets, the microscopic origins of these interdependencies have not been
extensively investigated. This paper introduces an agent-based model which describes the
emergence of cross-currency correlations from the interactions between market makers
and an arbitrager. The model qualitatively replicates the time-scale vs. cross-correlation dia-
grams observed in real trading data, suggesting that triangular arbitrage plays a primary role
in the entanglement of the dynamics of different foreign exchange rates. Furthermore, the
model shows how the features of the cross-correlation function between two foreign
exchange rates, such as its sign and value, emerge from the interplay between triangular
arbitrage and trend-following strategies. In particular, the interaction of these trading strate-
gies favors certain combinations of price trend signs across markets, thus altering the prob-
ability of observing two foreign exchange rates drifting in the same or opposite direction.
Ultimately, this entangles the dynamics of foreign exchange rate pairs, leading to cross-cor-
relation functions that resemble those observed in real trading data.
1 Introduction
Various non-trivial statistical regularities, known as stylized facts [1], have been documented
in trading data from markets of different asset classes [2]. The available literature examined
PLOS ONE
PLOS ONE | https://doi.org/10.1371/journal.pone.0234709 June 24, 2020 1 / 19
a1111111111
a1111111111
a1111111111
a1111111111
a1111111111
OPEN ACCESS
Citation: Ciacci A, Sueshige T, Takayasu H,
Christensen K, Takayasu M (2020) The
microscopic relationships between triangular
arbitrage and cross-currency correlations in a
simple agent based model of foreign exchange
markets. PLoS ONE 15(6): e0234709. https://doi.
org/10.1371/journal.pone.0234709
Editor: J E. Trinidad Segovia, University of Almeria,
SPAIN
Received: February 12, 2020
Accepted: May 31, 2020
Published: June 24, 2020
Copyright: © 2020 Ciacci et al. This is an open
access article distributed under the terms of the
Creative Commons Attribution License, which
permits unrestricted use, distribution, and
reproduction in any medium, provided the original
author and source are credited.
Data Availability Statement: The raw data used in
this study was purchased from EBS Service
Company Limited, with no special access
privileges. Since EBS Service Company Limited
created this dataset for sales purpose, the contract
between EBS Service Company Limited and the
authors does not allow to distribute data samples.
Those researchers interested in analyzing historical
data of the EBS Market are advised to contact EBS
Service Company Limited at the following website:
https://www.cmegroup.com/tools-information/
the heavy-tailed distribution of price changes [3–6], the long memory in the absolute mid-
price changes (volatility clustering) [4, 6–10], the long memory in the direction of the order
flow [10–13] and the absence of significant autocorrelation in mid-price returns time series,
with the exclusion of negative, weak but still significant autocorrelation observed on extremely
short time-scales [6, 9, 14–16]. Different research communities (e.g., physics, economics,
information theory) took up the open-ended challenge of devising models that could repro-
duce these regularities and provide insights on their origins [2, 17, 18]. Economists have tradi-
tionally dealt with optimal decision-making problems in which perfectly rational agents
implement trading strategies to maximize their individual utility [2, 17, 18]. Previous studies
have looked at cut-off decisions [19–21], asymmetric information and fundamental prices
[22–26] and price impact of trades [27–30]. In the last thirty years the orthodox assumptions
of full rationality and perfect markets have been increasingly disputed by emerging disciplines,
such as behavioral economics, statistics and artificial intelligence [17]. The physics community
have also entered this quest for simple models of non-rational choice [17] by taking viewpoints
and approaches, such as zero-intelligence and agent-based models, that often stray from those
that are common among economists. Agent-based models (ABMs henceforth) rely on simula-
tions of interactions between agents whose actions are driven by idealized human behaviors
[17]. A seminal attempt to describe agents interactions through ABM is the Santa Fe StockMarket [31], which neglects the perfect rationality assumption by taking an artificial intelli-
gence approach [17]. The model successfully replicates various stylized facts of financial mar-
kets (e.g., heavy-tailed distribution of returns and volatility clustering), hinting that the lack of
full rationality has a primary role in the emergence of these statistical regularities [17]. Follow-
ing [31], several ABMs [32–44] have further examined the relationships between the micro-
scopic interactions between agents and the macroscopic behavior of financial markets.
This study introduces a new ABM of the foreign exchange (FX henceforth) market. The FX
market is characterized by singular institutional features, such as the absence of a central
exchange, exceptionally large traded volumes and a declining, yet significant dealer-centric
nature [45]. Electronic trading has rapidly emerged as a key channel through which investors
can access liquidity in the FX market [45, 46]. For instance, more than 70% of the volume in
the FX Spot market is exchanged electronically [46]. A peculiar stylized fact of the FX market
is the significant correlation among movements of different currency prices. These interdepen-
dencies are time-scale dependent [47, 48], their strength evolves in time and become extremely
evident in the occurrence of extreme price swings, known as flash crashes. In these events, var-
ious foreign exchange rates related to a certain currency abruptly appreciate or depreciate,
affecting the trading activity of several FX markets. A recent example is the large and rapid
appreciation of the Japanese Yen against multiple currencies on January 2nd 2019. The largest
intraday price changes peaked +11% against Australian Dollar, +8% against Turkish Lira and
+4% against US Dollar [49]. The relationship between triangular arbitrage [50–53] and cross-
currency correlations remains unclear. Mizuno et al. [47] observed that the cross-correlation
between real and implied prices of Japanese Yen is significantly below the unit on very short
time-scales, conjecturing that this counter-intuitive property highlights how the same currency
could be purchased and sold at different prices by implementing a triangular arbitrage strategy.
Aiba and Hatano [37] proposed an ABM relying on the intriguing idea that triangular arbi-
trage influences the price dynamics in different currency markets. However, this study fails to
explain whether and how reactions to triangular arbitrage opportunities lead to the character-
istic shape of the time-scale vs. cross-correlation diagrams observed in real trading data
[47, 48].
Building on these observations, the present study aims to obtain further insights on the
microscopic origins of the correlations among currency pairs by introducing an ABM model
PLOS ONE Modelling the microscopic relationships between triangular arbitrage and cross-currency correlations
PLOS ONE | https://doi.org/10.1371/journal.pone.0234709 June 24, 2020 2 / 19
contacts-list/ebs-support.html. To access the
dataset employed in this study, researchers should
discuss the availability and sales of historical limit
order book data of the EUR/USD, USD/JPY and
EUR/JPY EBS spot FX markets between January
1st 2011 and December 31st 2014.
Funding: This study is partially supported by the
JSPS KAKENHI (Grant Numbers 17J10781 to TS),
EPSRC (Grant Numbers EP/L015129/1 to AC), the
Joint Collaborative Research Laboratory for MUFG
AI Financial Market Analysis. The funders had no
role in study design, data collection and analysis,
decision to publish, or preparation of the
manuscript. The other commercial affiliations
mentioned in the’competing interest statement’
(Sony Computer Science Laboratories, Inc and
FNA) provide unrelated salaries to HT and AC.
However, these commercial affiliations neither
provided any financial support to this study nor
influenced study design, data collection and
analysis, decision to publish, or preparation of the
manuscript. The specific roles of these authors are
articulated in the ‘Author Contributions’ section.
Competing interests: We have the following
interests. MT receives research funding (the Joint
Collaborative Research Laboratory for MUFG AI
Financial Market Analysis) from a commercial
source (Mitsubishi UFJ financial group) as
consultancy of AI trading strategies. AC provides
consultancy services (data science) to FNA. This
interaction did not have any influence in this
manuscript. HT has dual employment in Sony
Computer Science Laboratories, Inc. and Tokyo
Institute of Technology. HT main focus at Sony
Computer Science Laboratories, Inc., is semi-
conductor data analysis research. On the other
hand, HT main focus at Tokyo Institute of
Technology is financial markets and economics
network research. As HT work at Sony Computer
Science Laboratories, Inc. is not directly related to
this study, this interaction did not have any
influence in this manuscript. This does not alter our
adherence to all the PLOS ONE policies on sharing
data and materials, as detailed online in the guide
for authors. There are no patents, products in
development or marketed products to declare.
in which two species (i.e., market makers and the arbitrager) interact across three inter-dealer
markets where trading is organized in limit order books. The model qualitatively replicates the
characteristic shape of the cross-correlation functions between currency pairs observed in real
trading data. This suggests that triangular arbitrage is a pivotal microscopic mechanism behind
the formation of cross-currency interdependencies. Furthermore, the model elucidates how
the features of these statistical relationships, such as the sign and value of the time-scale vs.
cross-correlation diagram, stem from the interplay between trend-following and triangular
arbitrage strategies.
This paper is organized as follows. Section 2 outlines the basic concepts, discusses the
employed dataset and provides a detailed description of the proposed model. Section 3 exam-
ines the behavior of the model in order to collect insights on the microscopic origins of cross-
currency interdependencies. Section 4 concludes and provides an outlook on the research
paths that could be developed from the outcomes of this study. Technical details, further
empirical analyses and an extended version of the model are presented in the supporting infor-
mation sections.
2 Methods
2.1 Concepts
2.1.1 Limit order books. Electronic trading takes place in an online platform where
traders submit buy and sell orders for a certain assets through an online computer program.
Unmatched orders await for execution in electronic records known as limit order books
(LOBs henceforth), see Fig 1. By submitting an order, traders pledge to sell (buy) up to a cer-
tain quantity of a given asset for a price that is greater (less) than or equal to its limit price [2,
54]. The submission activates a trade-matching algorithm which determines whether the
order can be immediately matched against earlier orders that are still queued in the LOB
[54]. A matching occurs anytime a buy (sell) order includes a price that is greater (less) than
or equal to the one included in a sell (buy) order. When this occurs, the owners of the
matched orders engage in a transaction. Orders that are completely matched upon entering
into the system are called market orders. Conversely, orders that are partially matched or
completely unmatched upon entering into the system (i.e., limit orders) are queued in the
LOB until they are completely matched by forthcoming orders or deleted by their owners
[54].
The limit order with the best price (i.e., the highest bid or the lowest ask quote) is always
the first to be matched against a forthcoming order. The adoption of a minimum price incre-
ment δ forces the price to move in a discrete grid, hence the same price can be occupied by
multiple limit orders at the same time. As a result, exchanges adopt an additional rule to pri-
oritize the execution of orders bearing the same price. A very common scheme is the price-time priority rule which uses the submission time to set the priority among limit orders
occupying the same price level, i.e., the order that entered the LOB earlier is executed first
[54].
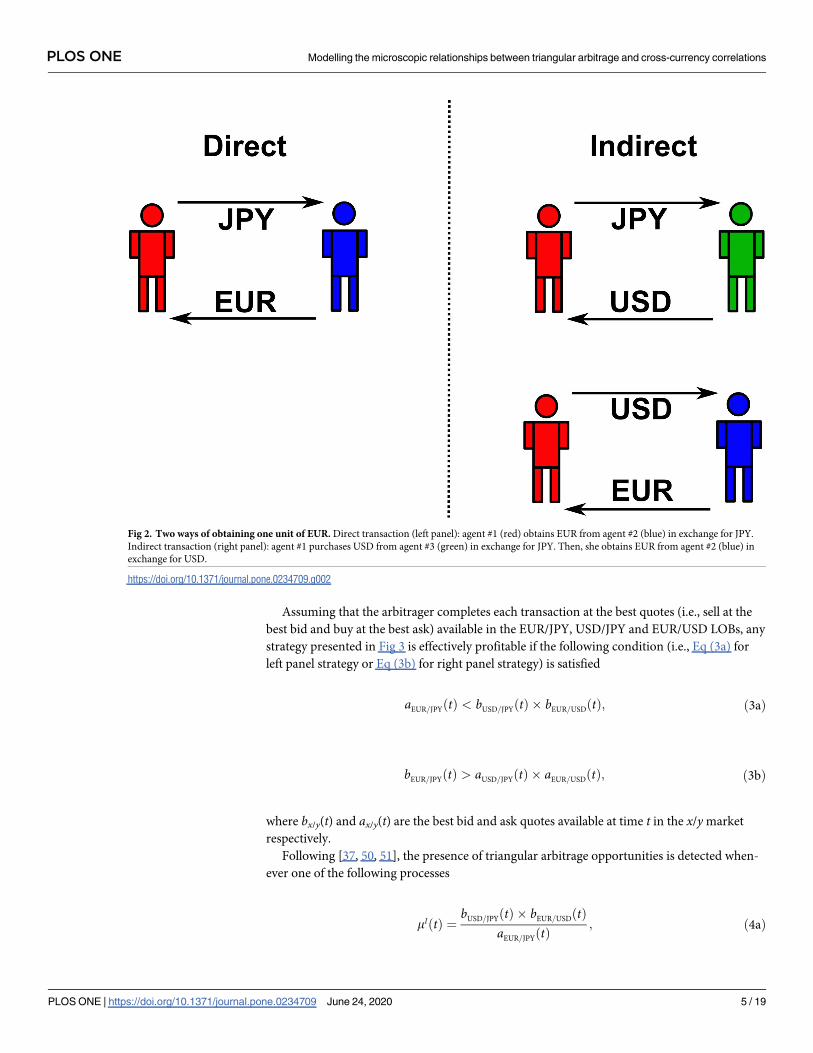
2.1.2 Triangular arbitrage. In the FX market, the price of a currency is always expressed
in units of another currency and it is commonly known as foreign exchange rate (FX rate
henceforth). For instance, the price of one Euro (EUR henceforth) in Japanese Yen (JPY
henceforth) is denoted by EUR/JPY. The same FX rate can be obtained from the product of
two other FX rates, e.g., EUR/JPY = USD/JPY × EUR/USD, where USD indicates US Dollars.
In the former case EUR is purchased directly while in the latter case EUR is purchased indi-
rectly through a third currency (i.e., USD), see Fig 2.
PLOS ONE Modelling the microscopic relationships between triangular arbitrage and cross-currency correlations
PLOS ONE | https://doi.org/10.1371/journal.pone.0234709 June 24, 2020 3 / 19
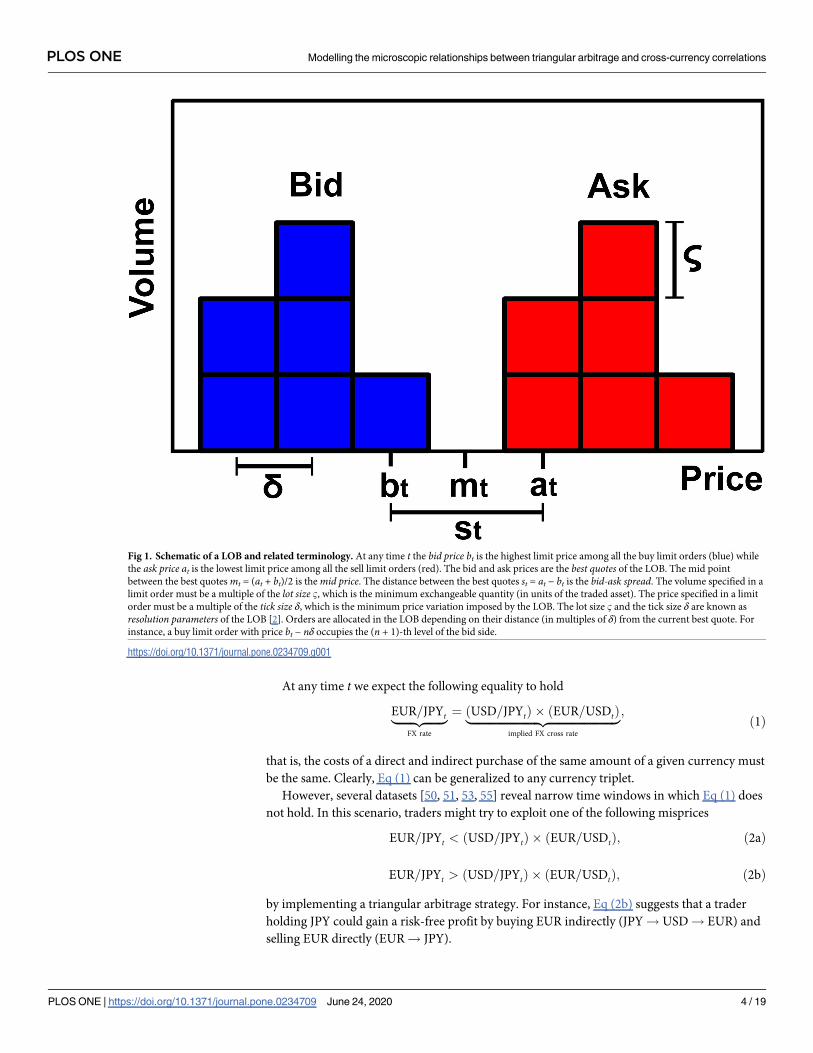
At any time t we expect the following equality to hold
EUR=JPYt|fflfflfflfflfflffl{zfflfflfflfflfflffl}FX rate
¼ ðUSD=JPYtÞ � ðEUR=USDtÞ|fflfflfflfflfflfflfflfflfflfflfflfflfflfflfflfflfflfflfflfflfflfflfflffl{zfflfflfflfflfflfflfflfflfflfflfflfflfflfflfflfflfflfflfflfflfflfflfflffl}implied FX cross rate
;ð1Þ
that is, the costs of a direct and indirect purchase of the same amount of a given currency must
be the same. Clearly, Eq (1) can be generalized to any currency triplet.
However, several datasets [50, 51, 53, 55] reveal narrow time windows in which Eq (1) does
not hold. In this scenario, traders might try to exploit one of the following misprices
EUR=JPYt < ðUSD=JPYtÞ � ðEUR=USDtÞ; ð2aÞ
EUR=JPYt > ðUSD=JPYtÞ � ðEUR=USDtÞ; ð2bÞ
by implementing a triangular arbitrage strategy. For instance, Eq (2b) suggests that a trader
holding JPY could gain a risk-free profit by buying EUR indirectly (JPY! USD! EUR) and
selling EUR directly (EUR! JPY).
Fig 1. Schematic of a LOB and related terminology. At any time t the bid price bt is the highest limit price among all the buy limit orders (blue) while
the ask price at is the lowest limit price among all the sell limit orders (red). The bid and ask prices are the best quotes of the LOB. The mid point
between the best quotes mt = (at + bt)/2 is the mid price. The distance between the best quotes st = at − bt is the bid-ask spread. The volume specified in a
limit order must be a multiple of the lot size B, which is the minimum exchangeable quantity (in units of the traded asset). The price specified in a limit
order must be a multiple of the tick size δ, which is the minimum price variation imposed by the LOB. The lot size B and the tick size δ are known as
resolution parameters of the LOB [2]. Orders are allocated in the LOB depending on their distance (in multiples of δ) from the current best quote. For
instance, a buy limit order with price bt − nδ occupies the (n + 1)-th level of the bid side.
https://doi.org/10.1371/journal.pone.0234709.g001
PLOS ONE Modelling the microscopic relationships between triangular arbitrage and cross-currency correlations
PLOS ONE | https://doi.org/10.1371/journal.pone.0234709 June 24, 2020 4 / 19
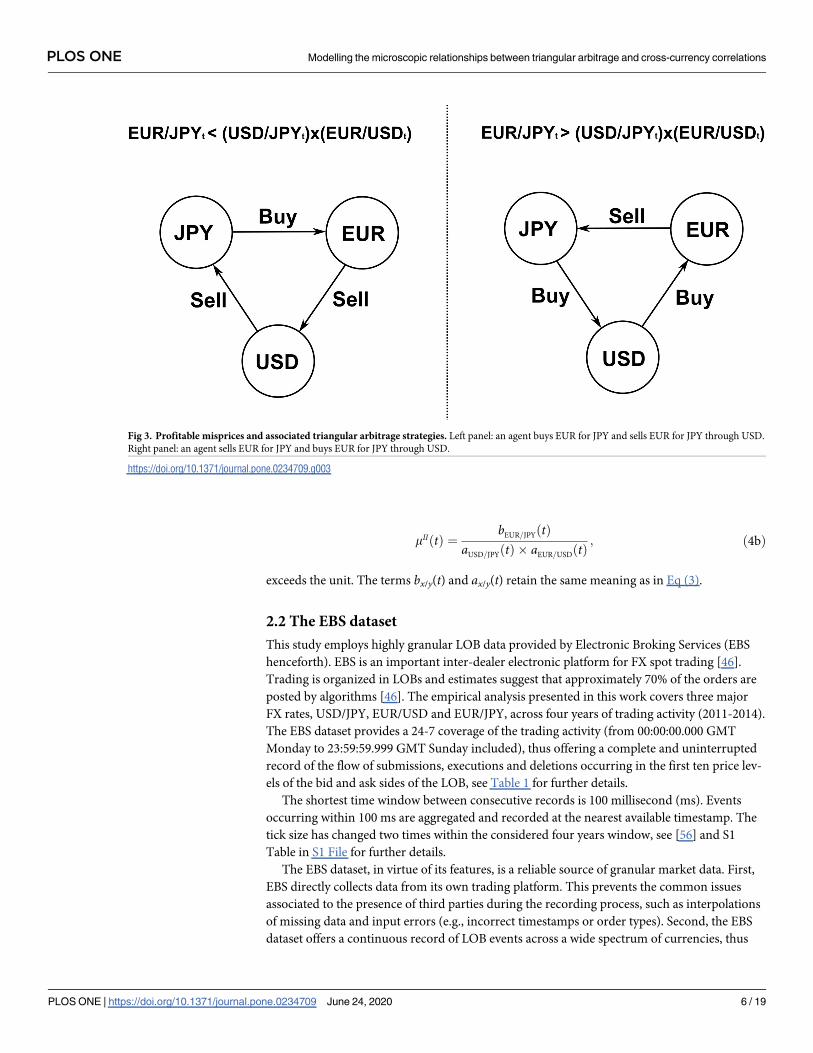
Assuming that the arbitrager completes each transaction at the best quotes (i.e., sell at the
best bid and buy at the best ask) available in the EUR/JPY, USD/JPY and EUR/USD LOBs, any
strategy presented in Fig 3 is effectively profitable if the following condition (i.e., Eq (3a) for
left panel strategy or Eq (3b) for right panel strategy) is satisfied
aEUR=JPYðtÞ < bUSD=JPYðtÞ � bEUR=USDðtÞ; ð3aÞ
bEUR=JPYðtÞ > aUSD=JPYðtÞ � aEUR=USDðtÞ; ð3bÞ
where bx/y(t) and ax/y(t) are the best bid and ask quotes available at time t in the x/y market
respectively.
Following [37, 50, 51], the presence of triangular arbitrage opportunities is detected when-
ever one of the following processes
mIðtÞ ¼bUSD=JPYðtÞ � bEUR=USDðtÞ
aEUR=JPYðtÞ; ð4aÞ
Fig 2. Two ways of obtaining one unit of EUR. Direct transaction (left panel): agent #1 (red) obtains EUR from agent #2 (blue) in exchange for JPY.
Indirect transaction (right panel): agent #1 purchases USD from agent #3 (green) in exchange for JPY. Then, she obtains EUR from agent #2 (blue) in
exchange for USD.
https://doi.org/10.1371/journal.pone.0234709.g002
PLOS ONE Modelling the microscopic relationships between triangular arbitrage and cross-currency correlations
PLOS ONE | https://doi.org/10.1371/journal.pone.0234709 June 24, 2020 5 / 19
mIIðtÞ ¼bEUR=JPYðtÞ
aUSD=JPYðtÞ � aEUR=USDðtÞ; ð4bÞ
exceeds the unit. The terms bx/y(t) and ax/y(t) retain the same meaning as in Eq (3).
2.2 The EBS dataset
This study employs highly granular LOB data provided by Electronic Broking Services (EBS
henceforth). EBS is an important inter-dealer electronic platform for FX spot trading [46].
Trading is organized in LOBs and estimates suggest that approximately 70% of the orders are
posted by algorithms [46]. The empirical analysis presented in this work covers three major
FX rates, USD/JPY, EUR/USD and EUR/JPY, across four years of trading activity (2011-2014).
The EBS dataset provides a 24-7 coverage of the trading activity (from 00:00:00.000 GMT
Monday to 23:59:59.999 GMT Sunday included), thus offering a complete and uninterrupted
record of the flow of submissions, executions and deletions occurring in the first ten price lev-
els of the bid and ask sides of the LOB, see Table 1 for further details.
The shortest time window between consecutive records is 100 millisecond (ms). Events
occurring within 100 ms are aggregated and recorded at the nearest available timestamp. The
tick size has changed two times within the considered four years window, see [56] and S1
Table in S1 File for further details.
The EBS dataset, in virtue of its features, is a reliable source of granular market data. First,
EBS directly collects data from its own trading platform. This prevents the common issues
associated to the presence of third parties during the recording process, such as interpolations
of missing data and input errors (e.g., incorrect timestamps or order types). Second, the EBS
dataset offers a continuous record of LOB events across a wide spectrum of currencies, thus
Fig 3. Profitable misprices and associated triangular arbitrage strategies. Left panel: an agent buys EUR for JPY and sells EUR for JPY through USD.
Right panel: an agent sells EUR for JPY and buys EUR for JPY through USD.
https://doi.org/10.1371/journal.pone.0234709.g003
PLOS ONE Modelling the microscopic relationships between triangular arbitrage and cross-currency correlations
PLOS ONE | https://doi.org/10.1371/journal.pone.0234709 June 24, 2020 6 / 19
becoming a natural choice for cross-sectional studies (e.g., triangular arbitrage or correlation
networks). Third, in spite of the increasing competition, the EBS platform has remained a key
channel for accessing FX markets for more than two decades by connecting traders across
more than 50 countries [57, 58]. The enduring relevance of this platform has been guaranteed
by the fairness and the competitiveness of the quoted prices.
2.3 The Arbitrager Model
To meet the goals of this study, a model (Arbitrager Model henceforth) of three co-existing
inter-dealer FX markets is introduced. The scope of this framework is to mimic the interac-
tions between different trading strategies across multiple FX markets and capture the mecha-
nisms through which these interactions shape the documented cross-correlation among FX
rate fluctuations [47, 48]. In the Arbitrager Model, each market hosts a fixed number of agents
who interact by exchanging a given FX rate. Trading is organized in simplified LOBs where
prices move in a continuous grid. Agents provide liquidity to the market by adjusting limit
orders through which they quote a bid and an ask price, thus acting as market makers. To set
these prices, market makers adopt simple trend-based strategies. Furthermore, market makers
cannot interact across markets, that is, they can only trade in the market they have been
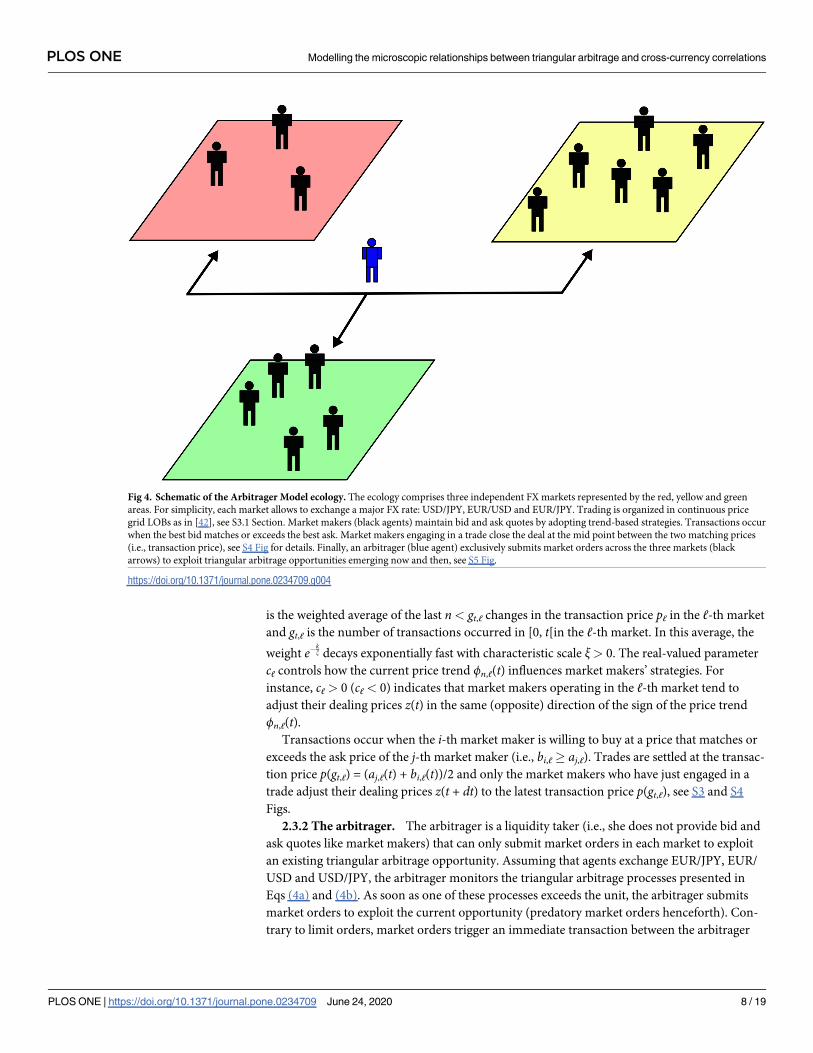
assigned to. Finally, echoing [37], the ecology hosts a special agent (i.e., the arbitrager) that is
allowed to submit market orders in any market to exploit triangular arbitrage opportunities,
see Fig 4.
2.3.1 Market makers. The i-th market maker operating in the ℓ-th market actively man-
ages a bid quote bi,ℓ(t) and an ask quote ai,ℓ(t) separated by a constant spread Lℓ = ai,ℓ(t) −bi,ℓ(t). To do so, the i-th market maker updates its dealing price zi,ℓ(t), which is the mid point
between the two quotes (i.e., zi,ℓ(t) = ai,ℓ(t) − Lℓ/2 = bi,ℓ(t) + Lℓ/2), by adopting a trend-based
strategy
dzi;‘ðtÞdt
¼ c‘�n;‘ðtÞ þ s‘�i;‘ðtÞ; i ¼ 1; � � � ;N‘ð5Þ
where Nℓ is the number of market makers participating the ℓ-th market, σℓ> 0, and �i,ℓ(t) is a
Gaussian white noise. The term
�n;‘ðtÞ ¼
Xn� 1
k¼0
p‘ðgt;‘ � kÞ � p‘ðgt;‘ � k � 1Þ� �
e�kx
Xn� 1
k¼0
e�kx
; ‘ ¼ 1; . . . ; d ð6Þ
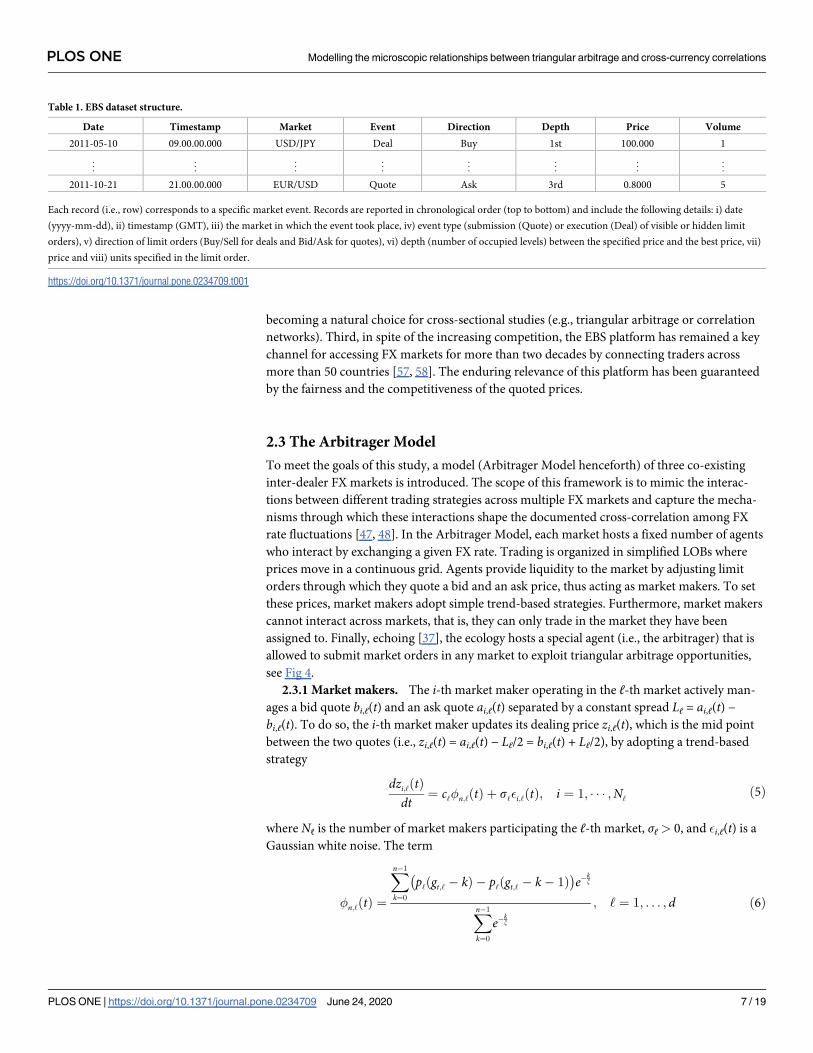
Table 1. EBS dataset structure.
Date Timestamp Market Event Direction Depth Price Volume
2011-05-10 09.00.00.000 USD/JPY Deal Buy 1st 100.000 1
..
. ... ..
. ... ..
. ... ..
. ...
2011-10-21 21.00.00.000 EUR/USD Quote Ask 3rd 0.8000 5
Each record (i.e., row) corresponds to a specific market event. Records are reported in chronological order (top to bottom) and include the following details: i) date
(yyyy-mm-dd), ii) timestamp (GMT), iii) the market in which the event took place, iv) event type (submission (Quote) or execution (Deal) of visible or hidden limit
orders), v) direction of limit orders (Buy/Sell for deals and Bid/Ask for quotes), vi) depth (number of occupied levels) between the specified price and the best price, vii)
price and viii) units specified in the limit order.
https://doi.org/10.1371/journal.pone.0234709.t001
PLOS ONE Modelling the microscopic relationships between triangular arbitrage and cross-currency correlations
PLOS ONE | https://doi.org/10.1371/journal.pone.0234709 June 24, 2020 7 / 19
is the weighted average of the last n< gt,ℓ changes in the transaction price pℓ in the ℓ-th market
and gt,ℓ is the number of transactions occurred in [0, t[in the ℓ-th market. In this average, the
weight e�kx decays exponentially fast with characteristic scale ξ> 0. The real-valued parameter
cℓ controls how the current price trend ϕn,ℓ(t) influences market makers’ strategies. For
instance, cℓ> 0 (cℓ< 0) indicates that market makers operating in the ℓ-th market tend to
adjust their dealing prices z(t) in the same (opposite) direction of the sign of the price trend
ϕn,ℓ(t).Transactions occur when the i-th market maker is willing to buy at a price that matches or
exceeds the ask price of the j-th market maker (i.e., bi,ℓ� aj,ℓ). Trades are settled at the transac-
tion price p(gt,ℓ) = (aj,ℓ(t) + bi,ℓ(t))/2 and only the market makers who have just engaged in a
trade adjust their dealing prices z(t + dt) to the latest transaction price p(gt,ℓ), see S3 and S4
Figs.
2.3.2 The arbitrager. The arbitrager is a liquidity taker (i.e., she does not provide bid and
ask quotes like market makers) that can only submit market orders in each market to exploit
an existing triangular arbitrage opportunity. Assuming that agents exchange EUR/JPY, EUR/
USD and USD/JPY, the arbitrager monitors the triangular arbitrage processes presented in
Eqs (4a) and (4b). As soon as one of these processes exceeds the unit, the arbitrager submits
market orders to exploit the current opportunity (predatory market orders henceforth). Con-
trary to limit orders, market orders trigger an immediate transaction between the arbitrager
Fig 4. Schematic of the Arbitrager Model ecology. The ecology comprises three independent FX markets represented by the red, yellow and green
areas. For simplicity, each market allows to exchange a major FX rate: USD/JPY, EUR/USD and EUR/JPY. Trading is organized in continuous price
grid LOBs as in [42], see S3.1 Section. Market makers (black agents) maintain bid and ask quotes by adopting trend-based strategies. Transactions occur
when the best bid matches or exceeds the best ask. Market makers engaging in a trade close the deal at the mid point between the two matching prices
(i.e., transaction price), see S4 Fig for details. Finally, an arbitrager (blue agent) exclusively submits market orders across the three markets (black
arrows) to exploit triangular arbitrage opportunities emerging now and then, see S5 Fig.
https://doi.org/10.1371/journal.pone.0234709.g004
PLOS ONE Modelling the microscopic relationships between triangular arbitrage and cross-currency correlations
PLOS ONE | https://doi.org/10.1371/journal.pone.0234709 June 24, 2020 8 / 19
and the market maker providing the best quote on the opposite side of the LOB. This implies
that transactions involving the arbitrager are always settled at the bid or ask quote offered by
the matched market maker, which are by the definition the current best bid or ask quote of the
LOB. Following the post-transaction update rule, the matched market maker adjust its dealing
price to its own matched bid or ask quote, that is, zi,ℓ(t + dt)!ai,ℓ(t) in case of a buy predatory
market order or zi,ℓ(t + dt)!bi,ℓ(t) in case of a sell predatory market order, see S5 Fig.
2.3.3 The Arbitrager Model in context. The Arbitrager Model builds on various existing
studies. The structure of each market mimics, with few exceptions, the one introduced in the
Dealer Model [42], where a number of autonomous market makers interact in a continuous
price-grid LOB by managing limit orders. In the Arbitrager Model, the strategic behavior of
market makers is driven by a simple process, see Eq (5), that is reminiscent of those proposed
in the Dealer Model [42] and, more recently, in the HFT Model [59]. Finally, the idea of an
arbitrager acting as a connection between otherwise independent markets was introduced in
the Aiba and Hatano Model [37]. In particular, the authors advanced the intriguing compari-
son between an ecology comprising multiple markets, such as the Arbitrager Model, and a
spring-mass system in which the dynamics of three random walkers (i.e., the markets) are con-
strained by a restoring force (i.e., the arbitrager) acting on the center of gravity of the system.
The Arbitrager Model presents the main features of the ABM approach [60]. First, it is com-
posed by several actors (i.e., agents) who autonomously evaluate the current state of the system
before taking a certain decision, such as re-adjusting their limit orders. Second, the decision
making processes, the available trading strategies and the rules governing the interactions
among agents retain a remarkable simplicity. This reduces the computational effort required
to build and simulate the dynamics of the model and facilitates the understanding and inter-
pretation of its outcomes. Third, the Arbitrager Model does not achieve its goal by directly
modelling cross-currency correlations. Instead, this statistical regularity of FX markets is con-
ceived as a macroscopic phenomenon which emerges from the iteration of simple, antagonistic
interactions occurring on a more microscopic level.
3 Results
3.1 Cross-correlation functions
Echoing previous empirical studies [47, 48], the cross-correlation function between fluctua-
tions of two foreign exchange rates is
ri;jðoÞ ¼hDmiðtÞDmjðtÞi � hDmiðtÞihDmjðtÞi
sDmisDmj
; ð7aÞ
s2Dm‘¼ hDm‘ðtÞ
2i � hDm‘ðtÞi
2; ð7bÞ
where the time-scale ω is the interval (i.e., in seconds) between two consecutive observations
of the ℓ-th mid price mℓ time series, Δmℓ(t)�mℓ(t) −mℓ(t − ω) is the linear change between
consecutive observations, sDm‘ is the standard deviation of Δmℓ(t) and hi denotes average
values.
In real trading data, the value of the cross-correlation function ρi,j(ω) varies with ω on very
short time-scales (ω< 1 sec). This time-scale dependency starts to weaken after ω� 1 sec
and vanishes beyond ω� 10 sec, see Fig 5(a). The characteristic shape of ρi,j(ω) displayed in
Fig 5(a) is compatible with the one found by Mizuno et al. [47]. However, the trading data-
based cross-correlation functions presented in this study stabilize on much shorter time-scales.
Considering that [47] employed trading data collected in 1999, a period where lower levels of
PLOS ONE Modelling the microscopic relationships between triangular arbitrage and cross-currency correlations
PLOS ONE | https://doi.org/10.1371/journal.pone.0234709 June 24, 2020 9 / 19
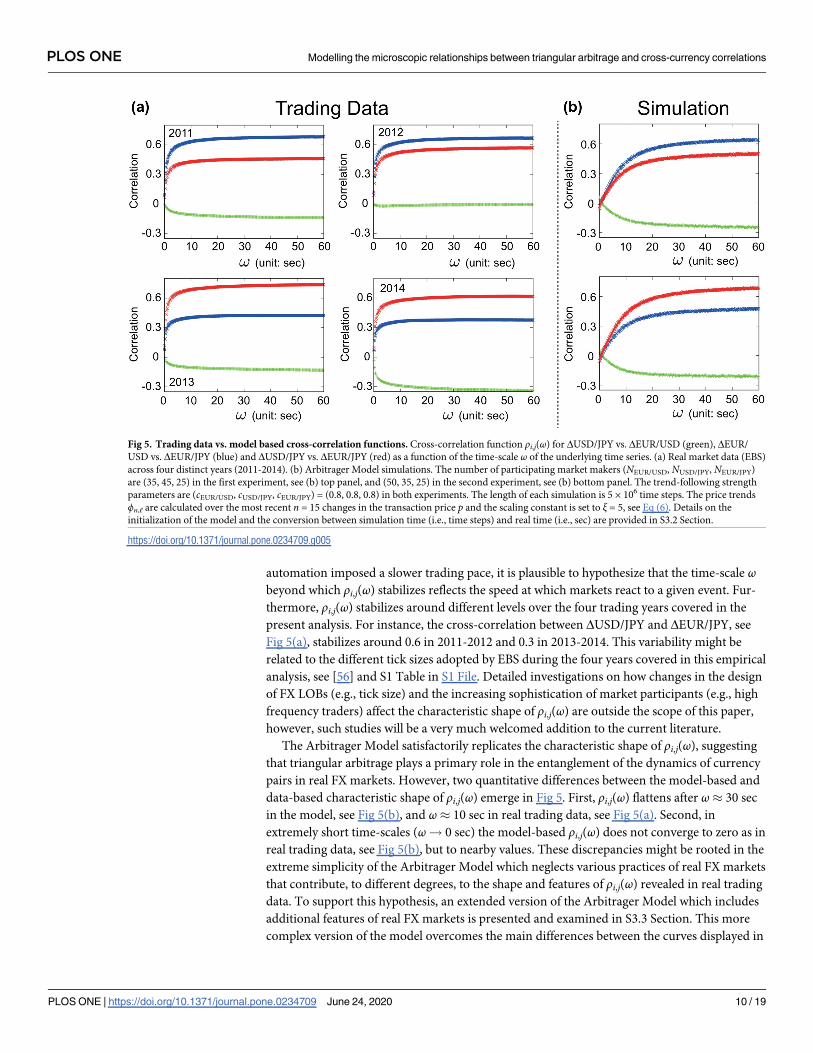
automation imposed a slower trading pace, it is plausible to hypothesize that the time-scale ωbeyond which ρi,j(ω) stabilizes reflects the speed at which markets react to a given event. Fur-
thermore, ρi,j(ω) stabilizes around different levels over the four trading years covered in the
present analysis. For instance, the cross-correlation between ΔUSD/JPY and ΔEUR/JPY, see
Fig 5(a), stabilizes around 0.6 in 2011-2012 and 0.3 in 2013-2014. This variability might be
related to the different tick sizes adopted by EBS during the four years covered in this empirical
analysis, see [56] and S1 Table in S1 File. Detailed investigations on how changes in the design
of FX LOBs (e.g., tick size) and the increasing sophistication of market participants (e.g., high
frequency traders) affect the characteristic shape of ρi,j(ω) are outside the scope of this paper,
however, such studies will be a very much welcomed addition to the current literature.
The Arbitrager Model satisfactorily replicates the characteristic shape of ρi,j(ω), suggesting
that triangular arbitrage plays a primary role in the entanglement of the dynamics of currency
pairs in real FX markets. However, two quantitative differences between the model-based and
data-based characteristic shape of ρi,j(ω) emerge in Fig 5. First, ρi,j(ω) flattens after ω� 30 sec
in the model, see Fig 5(b), and ω� 10 sec in real trading data, see Fig 5(a). Second, in
extremely short time-scales (ω! 0 sec) the model-based ρi,j(ω) does not converge to zero as in
real trading data, see Fig 5(b), but to nearby values. These discrepancies might be rooted in the
extreme simplicity of the Arbitrager Model which neglects various practices of real FX markets
that contribute, to different degrees, to the shape and features of ρi,j(ω) revealed in real trading
data. To support this hypothesis, an extended version of the Arbitrager Model which includes
additional features of real FX markets is presented and examined in S3.3 Section. This more
complex version of the model overcomes the main differences between the curves displayed in
Fig 5. Trading data vs. model based cross-correlation functions. Cross-correlation function ρi,j(ω) for ΔUSD/JPY vs. ΔEUR/USD (green), ΔEUR/
USD vs. ΔEUR/JPY (blue) and ΔUSD/JPY vs. ΔEUR/JPY (red) as a function of the time-scale ω of the underlying time series. (a) Real market data (EBS)
across four distinct years (2011-2014). (b) Arbitrager Model simulations. The number of participating market makers (NEUR/USD, NUSD/JPY, NEUR/JPY)
are (35, 45, 25) in the first experiment, see (b) top panel, and (50, 35, 25) in the second experiment, see (b) bottom panel. The trend-following strength
parameters are (cEUR/USD, cUSD/JPY, cEUR/JPY) = (0.8, 0.8, 0.8) in both experiments. The length of each simulation is 5 × 10⁶ time steps. The price trends
ϕn,ℓ are calculated over the most recent n = 15 changes in the transaction price p and the scaling constant is set to ξ = 5, see Eq (6). Details on the
initialization of the model and the conversion between simulation time (i.e., time steps) and real time (i.e., sec) are provided in S3.2 Section.
https://doi.org/10.1371/journal.pone.0234709.g005
PLOS ONE Modelling the microscopic relationships between triangular arbitrage and cross-currency correlations
PLOS ONE | https://doi.org/10.1371/journal.pone.0234709 June 24, 2020 10 / 19
Fig 5(a) and 5(b), reproducing cross-correlation functions ρi,j(ω) that approach zero when
ω! 0 sec and stabilize on shorter time-scales than those emerged in the baseline model.
3.2 The interplay between triangular arbitrage and trend-following
strategies intertwines FX rates dynamics
The Arbitrager Model, reproducing the characteristic shape of ρi,j(ω), suggests that triangular
arbitrage plays a primary role in the formation of the cross-correlations among currencies.
However, it is not clear how the features of ρi,j(ω), such as its sign and values, stem from the
interplay between the different types of strategies adopted by agents operating in the ecology.
Addressing this open question is one of the main objectives of the present study.
The actual state of the j-th market νj(t) is defined as the sign of the current price trend
sgn(ϕn,ℓ(t)) 2 {−, +}, see Eq (6). It follows that the current configuration of the ecology
q(t) = {ν1(t), ν2(t), ν3(t)} is the combination of the states of each market. The Arbitrager Model,
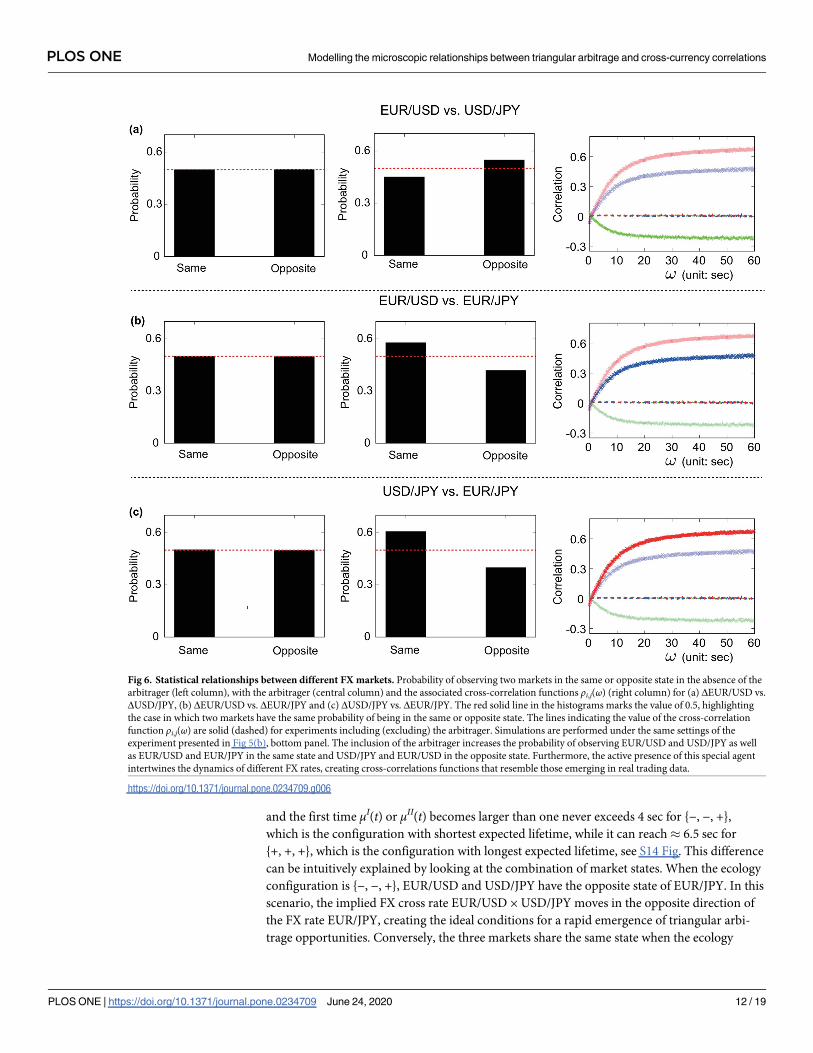
considering three markets, admits 23 = 8 different ecology configurations. When the arbitrager
is not included in the system, two markets have the same probability of being in the same and
opposite state, see first column of Fig 6. This occurs because price trends are driven by transac-
tions triggered by endogenous decisions, that is, events occurring in different markets remain
completely unrelated. As a consequence, market states flip independently and at the same rate.
It follows that the eight possible combinations of market states share the same appearance
probabilities 1/23 and expected lifetimes, see Fig 7. In these settings, the dynamics of the mid
price of FX rate pairs do not present any significant correlation, see third column of Fig 6.
The inclusion of the arbitrager has a major impact on the overall behavior of the model.
Imbalances in the probability of observing two markets in the same or opposite state emerge
in each FX rate pair. For instance, the EUR/USD and EUR/JPY markets have the same state in
� 57% of the experiment duration, see Fig 6(b). Movements of FX rate pairs become corre-
lated, revealing cross-correlation functions ρi,j(ω) whose shapes qualitatively mimic those
found in real trading data. The sign and stabilization levels of these functions are consistent
with the sign and size of the probabilities imbalances, suggesting that these two results are two
faces of the same coin.
The statistical properties of the eight ecology configurations shall be examined in order to
understand how the findings presented in Fig 6 unfold. The presence of the arbitrager intro-
duces a degree of heterogeneity in both the expected lifetimes and appearance probabilities of
ecology configurations, see Fig 7. This reveals three interesting facts. First, the average lifetime
of every ecology configuration is smaller than its counterpart in an arbitrager-free system. To
explain this feature, recall that predatory market orders trigger three simultaneous transactions
(i.e., one in each market) altering the current price trends ϕn,ℓ(t), see Eq (6). When the latest
change in transaction price pℓ(gt,ℓ) − pℓ(gt,ℓ − 1) induced by a predatory market order and
ϕn,ℓ(t − dt) have opposite signs, the actions of the arbitrager weaken (i.e., |ϕn,ℓ(t)| < |ϕn,ℓ(t −dt)|) or even flip the sign (i.e., ϕn,ℓ(t)ϕn,ℓ(t − dt)<0) of the price trend. When this occurs, the
arbitrager weakens the trend-following behaviors of market makers in at least one of the three
markets, thus increasing the likelihood of a transition to another ecology configuration. As tri-
angular arbitrage opportunities of both types appear, with different incidences, during any
ecology configuration, see S15 Fig, the expected lifetimes of these configurations are, to differ-
ent extents, shorter than in an arbitrager-free system.
Second, certain ecology configurations are expected to last more than others (i.e., single epi-
sodes). As reactions to triangular arbitrage opportunities increase the likelihood of flipping a
market state, the average lifetime of a given configuration relate to the time required for the
first triangular arbitrage opportunity to emerge. For instance, the time between the inception
PLOS ONE Modelling the microscopic relationships between triangular arbitrage and cross-currency correlations
PLOS ONE | https://doi.org/10.1371/journal.pone.0234709 June 24, 2020 11 / 19
and the first time μI(t) or μII(t) becomes larger than one never exceeds 4 sec for {−, −, +},
which is the configuration with shortest expected lifetime, while it can reach� 6.5 sec for
{+, +, +}, which is the configuration with longest expected lifetime, see S14 Fig. This difference
can be intuitively explained by looking at the combination of market states. When the ecology
configuration is {−, −, +}, EUR/USD and USD/JPY have the opposite state of EUR/JPY. In this
scenario, the implied FX cross rate EUR/USD × USD/JPY moves in the opposite direction of
the FX rate EUR/JPY, creating the ideal conditions for a rapid emergence of triangular arbi-
trage opportunities. Conversely, the three markets share the same state when the ecology
Fig 6. Statistical relationships between different FX markets. Probability of observing two markets in the same or opposite state in the absence of the
arbitrager (left column), with the arbitrager (central column) and the associated cross-correlation functions ρi,j(ω) (right column) for (a) ΔEUR/USD vs.
ΔUSD/JPY, (b) ΔEUR/USD vs. ΔEUR/JPY and (c) ΔUSD/JPY vs. ΔEUR/JPY. The red solid line in the histograms marks the value of 0.5, highlighting
the case in which two markets have the same probability of being in the same or opposite state. The lines indicating the value of the cross-correlation
function ρi,j(ω) are solid (dashed) for experiments including (excluding) the arbitrager. Simulations are performed under the same settings of the
experiment presented in Fig 5(b), bottom panel. The inclusion of the arbitrager increases the probability of observing EUR/USD and USD/JPY as well
as EUR/USD and EUR/JPY in the same state and USD/JPY and EUR/USD in the opposite state. Furthermore, the active presence of this special agent
intertwines the dynamics of different FX rates, creating cross-correlations functions that resemble those emerging in real trading data.
https://doi.org/10.1371/journal.pone.0234709.g006
PLOS ONE Modelling the microscopic relationships between triangular arbitrage and cross-currency correlations
PLOS ONE | https://doi.org/10.1371/journal.pone.0234709 June 24, 2020 12 / 19
configuration is {+, +, +}. In this case, both the FX rate and the implied FX cross rate move in
the same direction, extending the time required by these prices to create a gap that can be
exploited by the arbitrager.
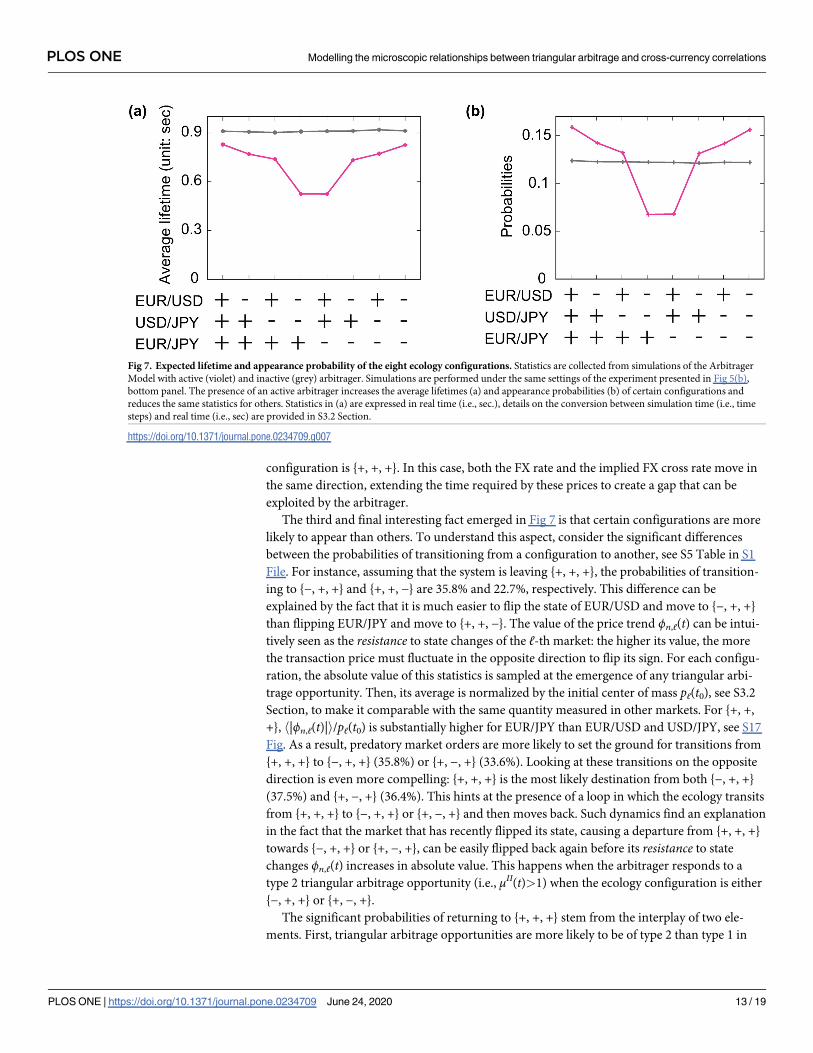
The third and final interesting fact emerged in Fig 7 is that certain configurations are more
likely to appear than others. To understand this aspect, consider the significant differences
between the probabilities of transitioning from a configuration to another, see S5 Table in S1
File. For instance, assuming that the system is leaving {+, +, +}, the probabilities of transition-
ing to {−, +, +} and {+, +, −} are 35.8% and 22.7%, respectively. This difference can be
explained by the fact that it is much easier to flip the state of EUR/USD and move to {−, +, +}
than flipping EUR/JPY and move to {+, +, −}. The value of the price trend ϕn,ℓ(t) can be intui-
tively seen as the resistance to state changes of the ℓ-th market: the higher its value, the more
the transaction price must fluctuate in the opposite direction to flip its sign. For each configu-
ration, the absolute value of this statistics is sampled at the emergence of any triangular arbi-
trage opportunity. Then, its average is normalized by the initial center of mass pℓ(t0), see S3.2
Section, to make it comparable with the same quantity measured in other markets. For {+, +,
+}, h|ϕn,ℓ(t)|i/pℓ(t0) is substantially higher for EUR/JPY than EUR/USD and USD/JPY, see S17
Fig. As a result, predatory market orders are more likely to set the ground for transitions from
{+, +, +} to {−, +, +} (35.8%) or {+, −, +} (33.6%). Looking at these transitions on the opposite
direction is even more compelling: {+, +, +} is the most likely destination from both {−, +, +}
(37.5%) and {+, −, +} (36.4%). This hints at the presence of a loop in which the ecology transits
from {+, +, +} to {−, +, +} or {+, −, +} and then moves back. Such dynamics find an explanation
in the fact that the market that has recently flipped its state, causing a departure from {+, +, +}
towards {−, +, +} or {+, −, +}, can be easily flipped back again before its resistance to state
changes ϕn,ℓ(t) increases in absolute value. This happens when the arbitrager responds to a
type 2 triangular arbitrage opportunity (i.e., μII(t)>1) when the ecology configuration is either
{−, +, +} or {+, −, +}.
The significant probabilities of returning to {+, +, +} stem from the interplay of two ele-
ments. First, triangular arbitrage opportunities are more likely to be of type 2 than type 1 in
Fig 7. Expected lifetime and appearance probability of the eight ecology configurations. Statistics are collected from simulations of the Arbitrager
Model with active (violet) and inactive (grey) arbitrager. Simulations are performed under the same settings of the experiment presented in Fig 5(b),
bottom panel. The presence of an active arbitrager increases the average lifetimes (a) and appearance probabilities (b) of certain configurations and
reduces the same statistics for others. Statistics in (a) are expressed in real time (i.e., sec.), details on the conversion between simulation time (i.e., time
steps) and real time (i.e., sec) are provided in S3.2 Section.
https://doi.org/10.1371/journal.pone.0234709.g007
PLOS ONE Modelling the microscopic relationships between triangular arbitrage and cross-currency correlations
PLOS ONE | https://doi.org/10.1371/journal.pone.0234709 June 24, 2020 13 / 19
both {−, +, +} and {+, −, +}, see S15 Fig. Second, the markets with lowest resistance to state
changes h|ϕn,ℓ(t)|i/pℓ(t0) are EUR/USD for {−, +, +} and USD/JPY for {+, −, +}, see S17 Fig,
which are exactly the states that should be flipped to return to {+, +, +}. The conditional transi-
tion probability matrix displayed in S5 Table in S1 File reveals the presence of another configu-
ration triplet (i.e., {−, −, −}, {−, +, −} and {+, −, −}) exhibiting an analogous behavior while {−,
−, +} and {+, +, −} are the only two configurations that are not part of any loop. S16 Fig shows
this mechanism in action by displaying the sequence of ecology configurations during a seg-
ment of the model simulation. It is easy to observe how the system tends to move across con-
figurations belonging to the same looping triplet for long, uninterrupted time windows.
Ultimately, this peculiar mechanism increases, to different degrees, the appearance probabili-
ties of configurations involved in these loops at the expenses of {−, −, +} and {+, +, −}.
To sum up, the Arbitrager Model elucidates how the interplay between different trading
strategies entangles the dynamics of different FX rates, leading to the characteristic shape of
the cross-correlation functions observed in real trading data. The Arbitrager Model restricts its
focus to the interactions between two types of strategies, namely triangular arbitrage and
trend-following. Despite the simplicity of this framework, the interplay between these two
strategies alone satisfactorily reproduces the cross-correlation functions observed in real trad-
ing data. In particular, trend-following strategies preserve the current combination of market
states for some time while reactions to triangular arbitrage opportunities influence the behavior
of trend-following market makers by altering the price trend signals used in their dealing strat-
egies. The interactions between these two strategies constantly push the system towards certain
configurations and away from others through multiple mechanisms. This can be easily seen in
Fig 7 as two distinct statistics, the average expected lifetimes and the appearance probability,
put the eight configurations in the same order. For instance {+, +, +} has the longer expected
lifetime but also the highest appearance probability. This force shapes the features of the statis-
tical relationships between currency pairs. FX rates traded in markets that share the same state
in configurations with higher (lower) appearance probabilities and longer (shorter) expected
lifetimes are more likely to fluctuate in the same (opposite) direction. For instance, consider
USD/JPY and EUR/JPY. These two markets have the same states in the four configurations
with higher probabilities (i.e., {+, +, +}, {−, +, +}, {+, −, −} and {−, −, −}) and opposite states in
those with lower probabilities (i.e., {+, −, +}, {−, −, +}, {+, +, −} and {−, +, −}). It follows that
the probability of observing USD/JPY and EUR/JPY in the same state at a given point in time tis� 60%, see Fig 6. In these settings, the mid price dynamics of two FX rates become perma-
nently entangled, leading to the cross-correlation functions displayed in Figs 5(b) and 6.
4 Discussion and outlook
The purpose of this study was to obtain further insights into the microscopic origins of the
widely documented cross-correlations among currencies. To take up this challenge, a new
ABM, the Arbitrager Model, has been proposed as a simple tool to describe the interplay
between trend-following and triangular arbitrage strategies across three FX markets. In these
settings, the model reproduced the characteristic shape of the cross-correlation function
between fluctuations of FX rate pairs under the assumption that triangular arbitrage is the only
mechanism through which the different FX rates become synchronized. This suggests that tri-
angular arbitrage plays a primary role in the entanglement of the dynamics of currency pairs
in real FX markets. In addition, the model explains how the features of ρi,j(ω) emerges from
the interplay between triangular arbitrage and trend-following strategies. In particular, trian-
gular arbitrage influences the trend-following behaviors of liquidity providers, driving the sys-
tem towards certain combinations of price trend signs and away from others. This affects the
PLOS ONE Modelling the microscopic relationships between triangular arbitrage and cross-currency correlations
PLOS ONE | https://doi.org/10.1371/journal.pone.0234709 June 24, 2020 14 / 19
probabilities of observing two FX rates drifting in the same or opposite direction, making one
of the two scenarios more likely than the other. Ultimately, this entangles the dynamics of
these prices, creating the significant cross-currency correlations that are reproduced in our
model and observed in real trading data.
The present study, finding a common ground between previous microscopic ABMs of the
FX market and triangular arbitrage [37, 42, 59], sets a new benchmark for further investiga-
tions on the relationships between agent interactions and market interdependencies. In partic-
ular, it is the first ABM to provide a complete picture on the microscopic origins of cross-
currency correlations.
The outcomes of this work open different research paths and raise new challenges that shall
be considered in future studies:
• The Arbitrager Model could be further generalized by including a larger number of curren-
cies, allowing traders to monitor different currency triangles. Extending the number of
available currencies could reveal new insights into i) statistical regularities related to the tri-
angular arbitrage processes, such the distributions of μI(t) and μII(t), and ii) how the features
of the cross-correlation function between two FX rates stem from a much more complex sys-
tem in which the same FX rate is part of several triangles.
• A potential extension of this model should consider the active presence of special agents
operating in FX markets. For instance, simulating public interventions implemented by cen-
tral banks could be a valuable exercise to understand how the large volumes moved by these
entities affect the dynamics of the triangular arbitrage processes μI(t) and μII(t) and the local
correlations (i.e., in the intervention time window) between currency pairs.
• Another interesting path leads to market design problems. This study advanced the hypothe-
sis that changes in the stabilization levels of the cross-correlation functions ρi,j(ω) might be
rooted in the different tick sizes adopted by EBS in the period covered by the employed data-
set. Calling for further investigations, an extended version of the present model should
examine how different tick sizes affect the correlations between FX rates.
• Future works shall also consider established (e.g., AR family models) and novel [61] tools to
exploit further properties of FX rates co-movements. Such investigations might reveal addi-
tional statistical relationships whose mechanistic origins can be studied in an augmented
version of the Arbitrager Model.
The model introduced in the present study could be subject of meaningful extensions and
enhancements aimed to turn this framework into a valuable tool that could be used by
exchanges, regulators and market designers. In particular, its simple settings would allow these
entities to make predictions on how regulations or design changes could affect the relation-
ships between FX rates and the properties (e.g., frequency, magnitude, duration, etc.) of trian-
gular arbitrage opportunities in a given market. Furthermore, its applicability might attract the
attention of other actors operating in the FX market, such as central banks. The ultimate objec-
tive of this work and its potential future extensions shall remain the provision of useful means
to enhance the understanding of financial market dynamics, assisting the aforementioned enti-
ties in conceiving safer and more efficient trading environments.
Supporting information
S1 Fig.
(TIF)
PLOS ONE Modelling the microscopic relationships between triangular arbitrage and cross-currency correlations
PLOS ONE | https://doi.org/10.1371/journal.pone.0234709 June 24, 2020 15 / 19
S2 Fig.
(TIF)
S3 Fig.
(TIF)
S4 Fig.
(TIF)
S5 Fig.
(TIF)
S6 Fig.
(TIF)
S7 Fig.
(TIF)
S8 Fig.
(TIF)
S9 Fig.
(TIF)
S10 Fig.
(TIF)
S11 Fig.
(TIF)
S12 Fig.
(TIF)
S13 Fig.
(TIF)
S14 Fig.
(TIF)
S15 Fig.
(TIF)
S16 Fig.
(TIF)
S17 Fig.
(TIF)
S1 File.
(PDF)
S2 File.
(TEX)
Acknowledgments
The authors thank EBS, NEX Group plc. for providing the data employed in this study. Alberto
Ciacci and Takumi Sueshige thank Kiyoshi Kanazawa for fruitful discussions.
PLOS ONE Modelling the microscopic relationships between triangular arbitrage and cross-currency correlations
PLOS ONE | https://doi.org/10.1371/journal.pone.0234709 June 24, 2020 16 / 19
Author Contributions
Conceptualization: Alberto Ciacci, Takumi Sueshige, Hideki Takayasu, Misako Takayasu.
Data curation: Alberto Ciacci, Takumi Sueshige.
Formal analysis: Alberto Ciacci, Takumi Sueshige.
Funding acquisition: Alberto Ciacci, Takumi Sueshige, Misako Takayasu.
Investigation: Alberto Ciacci, Takumi Sueshige.
Methodology: Alberto Ciacci, Takumi Sueshige, Hideki Takayasu, Misako Takayasu.
Project administration: Hideki Takayasu, Kim Christensen, Misako Takayasu.
Resources: Alberto Ciacci, Takumi Sueshige, Misako Takayasu.
Software: Alberto Ciacci, Takumi Sueshige.
Supervision: Hideki Takayasu, Kim Christensen, Misako Takayasu.
Validation: Alberto Ciacci, Takumi Sueshige.
Visualization: Alberto Ciacci, Takumi Sueshige.
Writing – original draft: Alberto Ciacci, Takumi Sueshige.
Writing – review & editing: Alberto Ciacci, Takumi Sueshige, Hideki Takayasu, Kim Chris-
tensen, Misako Takayasu.
References1. Buchanan M. It’s a (stylized) fact! Nature Physics. 2011; 8(1):3. https://doi.org/10.1038/nphys2191
2. Gould MD, Porter MA, Williams S, McDonald M, Fenn DJ, Howison SD. Limit order books. Quantitative
Finance. 2013; 13(11):1709–1742. https://doi.org/10.1080/14697688.2013.803148
3. Gopikrishnan P, Meyer M, Amaral LN, Stanley HE. Inverse cubic law for the distribution of stock price
variations. The European Physical Journal B-Condensed Matter and Complex Systems. 1998; 3
(2):139–140. https://doi.org/10.1007/s100510050292
4. Cont R. Empirical properties of asset returns: stylized facts and statistical issues. Quantitative Finance.
2001; 1(2). https://doi.org/10.1080/713665670
5. Plerou V, Stanley HE. Stock return distributions: tests of scaling and universality from three distinct
stock markets. Physical Review E. 2008; 77(3):037101. https://doi.org/10.1103/PhysRevE.77.037101
6. Chakraborti A, Toke IM, Patriarca M, Abergel F. Econophysics review: I. Empirical facts. Quantitative
Finance. 2011; 11(7):991–1012. https://doi.org/10.1080/14697688.2010.539248
7. Liu Y, Cizeau P, Meyer M, Peng CK, Stanley HE. Correlations in economic time series. Physica A: Sta-
tistical Mechanics and its Applications. 1997; 245(3-4):437–440. https://doi.org/10.1016/S0378-4371
(97)00368-3
8. Cont R. Volatility clustering in financial markets: empirical facts and agent-based models. In: Long
memory in economics. Springer; 2007. p. 289–309.
9. Stanley HE, Plerou V, Gabaix X. A statistical physics view of financial fluctuations: Evidence for scaling
and universality. Physica A: Statistical Mechanics and its Applications. 2008; 387(15):3967–3981.
https://doi.org/10.1016/j.physa.2008.01.093
10. Gu GF, Zhou WX. Emergence of long memory in stock volatility from a modified Mike-Farmer model.
EPL (Europhysics Letters). 2009; 86(4):48002. https://doi.org/10.1209/0295-5075/86/48002
11. Zovko I, Farmer JD, et al. The power of patience: a behavioural regularity in limit-order placement.
Quantitative finance. 2002; 2(5):387–392. https://doi.org/10.1088/1469-7688/2/5/308
12. Lillo F, Farmer JD. The long memory of the efficient market. Studies in nonlinear dynamics & economet-
rics. 2004; 8(3).
13. Bouchaud JP, Gefen Y, Potters M, Wyart M. Fluctuations and response in financial markets: the subtle
nature of ‘random’price changes. Quantitative Finance. 2004; 4(2):176–190. https://doi.org/10.1080/
14697680400000022
PLOS ONE Modelling the microscopic relationships between triangular arbitrage and cross-currency correlations
PLOS ONE | https://doi.org/10.1371/journal.pone.0234709 June 24, 2020 17 / 19
14. Cont R. Long range dependence in financial markets. In: Fractals in engineering. Springer; 2005.
p. 159–179.
15. Zhao L. A model of limit-order book dynamics and a consistent estimation procedure. Citeseer; 2010.
16. Aït-Sahalia Y, Mykland PA, Zhang L. Ultra high frequency volatility estimation with dependent micro-
structure noise. Journal of Econometrics. 2011; 160(1):160–175. https://doi.org/10.1016/j.jeconom.
2010.03.028
17. Farmer JD, Shubik M, Smith E. Is economics the next physical science? Physics today. 2005; 58
(9):37–42. https://doi.org/10.1063/1.2117821
18. Parlour CA, Seppi DJ. Limit order markets: A survey. Handbook of financial intermediation and banking.
2008; 5:63–95. https://doi.org/10.1016/B978-044451558-2.50007-6
19. Chakravarty S, Holden CW. An integrated model of market and limit orders. Journal of Financial Inter-
mediation. 1995; 4(3):213–241. https://doi.org/10.1006/jfin.1995.1010
20. Parlour CA. Price dynamics in limit order markets. The Review of Financial Studies. 1998; 11(4):789–
816. https://doi.org/10.1093/rfs/11.4.789
21. Foucault T. Order flow composition and trading costs in a dynamic limit order market1. Journal of Finan-
cial Markets. 1999; 2(2):99–134. https://doi.org/10.1016/S1386-4181(98)00012-3
22. Glosten LR, Milgrom PR. Bid, ask and transaction prices in a specialist market with heterogeneously
informed traders. Journal of Financial Economics. 1985; 14(1):71–100. https://doi.org/10.1016/0304-
405X(85)90044-3
23. Kyle AS. Continuous auctions and insider trading. Econometrica: Journal of the Econometric Society.
1985; p. 1315–1335. https://doi.org/10.2307/1913210
24. Goettler R, Parlour C, Rajan U, et al. Microstructure effects and asset pricing. Preprint, available at
http://en.scientificcommons.org/33345856. 2006;.
25. Roşu I. A dynamic model of the limit order book. The Review of Financial Studies. 2009; 22(11):4601–
4641. https://doi.org/10.1093/rfs/hhp011
26. Rosu I, et al. Liquidity and information in order driven markets. Chicago Booth School of Business.
2010;.
27. Bertsimas D, Lo AW. Optimal control of execution costs. Journal of Financial Markets. 1998; 1(1):1–50.
https://doi.org/10.1016/S1386-4181(97)00012-8
28. Almgren R, Chriss N. Optimal execution of portfolio transactions. Journal of Risk. 2001; 3:5–40. https://
doi.org/10.21314/JOR.2001.041
29. Alfonsi A, Fruth A, Schied A. Optimal execution strategies in limit order books with general shape func-
tions. Quantitative Finance. 2010; 10(2):143–157. https://doi.org/10.1080/14697680802595700
30. Obizhaeva AA, Wang J. Optimal trading strategy and supply/demand dynamics. Journal of Financial
Markets. 2013; 16(1):1–32. https://doi.org/10.1016/j.finmar.2012.09.001
31. Anderson P, Arrow K, Pines D. The economy as an evolving complex system Addison-Wesley. Red-
wood City. 1988;.
32. Takayasu H, Miura H, Hirabayashi T, Hamada K. Statistical properties of deterministic threshold ele-
ments—the case of market price. Physica A: Statistical Mechanics and its Applications. 1992; 184(1-
2):127–134. https://doi.org/10.1016/0378-4371(92)90161-I
33. Sato AH, Takayasu H. Dynamic numerical models of stock market price: from microscopic determinism
to macroscopic randomness. Physica A: Statistical Mechanics and its Applications. 1998; 250(1-
4):231–252. https://doi.org/10.1016/S0378-4371(97)00569-4
34. Cont R, Bouchaud JP. Herd behavior and aggregate fluctuations in financial markets. Macroeconomic
Dynamics. 2000; 4(2):170–196. https://doi.org/10.1017/S1365100500015029
35. Chiarella C, Iori G, et al. A simulation analysis of the microstructure of double auction markets*. Quanti-
tative Finance. 2002; 2(5):346–353. https://doi.org/10.1088/1469-7688/2/5/303
36. Challet D, Stinchcombe R, et al. Non-constant rates and over-diffusive prices in a simple model of limit
order markets. Quantitative Finance. 2003; 3(3):155–162. https://doi.org/10.1088/1469-7688/3/3/301
37. Aiba Y, Hatano N. A microscopic model of triangular arbitrage. Physica A: Statistical Mechanics and its
Applications. 2006; 371(2):572–584. https://doi.org/10.1016/j.physa.2006.05.046
38. Preis T, Golke S, Paul W, Schneider JJ. Multi-agent-based order book model of financial markets. EPL
(Europhysics Letters). 2006; 75(3):510. https://doi.org/10.1209/epl/i2006-10139-0
39. Preis T, Golke S, Paul W, Schneider JJ. Statistical analysis of financial returns for a multiagent order
book model of asset trading. Physical Review E. 2007; 76(1):016108. https://doi.org/10.1103/
PhysRevE.76.016108
PLOS ONE Modelling the microscopic relationships between triangular arbitrage and cross-currency correlations
PLOS ONE | https://doi.org/10.1371/journal.pone.0234709 June 24, 2020 18 / 19
40. Lillo F. Limit order placement as an utility maximization problem and the origin of power law distribution
of limit order prices. The European Physical Journal B. 2007; 55(4):453–459. https://doi.org/10.1140/
epjb/e2007-00067-9
41. Yamada K, Takayasu H, Takayasu M. Characterization of foreign exchange market using the thresh-
old-dealer-model. Physica A: Statistical Mechanics and its Applications. 2007; 382(1):340–346. https://
doi.org/10.1016/j.physa.2007.02.027
42. Yamada K, Takayasu H, Ito T, Takayasu M. Solvable stochastic dealer models for financial markets.
Physical Review E. 2009; 79(5):051120. https://doi.org/10.1103/PhysRevE.79.051120
43. Lee S, Lee K. Heterogeneous expectations leading to bubbles and crashes in asset markets: Tipping
point, herding behavior and group effect in an agent-based model. Journal of Open Innovation: Technol-
ogy, Market, and Complexity. 2015; 1(1):12. https://doi.org/10.1186/s40852-015-0013-9
44. Cocco L, Concas G, Marchesi M. Using an artificial financial market for studying a cryptocurrency mar-
ket. Journal of Economic Interaction and Coordination. 2017; 12(2):345–365. https://doi.org/10.1007/
s11403-015-0168-2
45. Rime D, Schrimpf A. The anatomy of the global FX market through the lens of the 2013 Triennial Sur-
vey. BIS Quarterly Review, December. 2013;.
46. Bank for International Settlements (BIS). Monitoring of fast-paced electronic markets, Report submitted
by a Study Group established by the Market Committee; 2018. Available from: https://www.bis.org/publ/
mktc10.pdf.
47. Mizuno T, Kurihara S, Takayasu M, Takayasu H. Time-scale dependence of correlations among foreign
currencies. In: The Application of Econophysics. Springer; 2004. p. 24–29. https://doi.org/10.1007/978-
4-431-53947-6_3
48. Wang GJ, Xie C, Chen YJ, Chen S. Statistical properties of the foreign exchange network at different
time scales: evidence from detrended cross-correlation coefficient and minimum spanning tree.
Entropy. 2013; 15(5):1643–1662. https://doi.org/10.3390/e15051643
49. Han MF, Westelius MNJ. Anatomy of Sudden Yen Appreciations. International Monetary Fund; 2019.
50. Aiba Y, Hatano N, Takayasu H, Marumo K, Shimizu T. Triangular arbitrage as an interaction among for-
eign exchange rates. Physica A: Statistical Mechanics and its Applications. 2002; 310(3-4):467–479.
https://doi.org/10.1016/S0378-4371(02)00799-9
51. Fenn DJ, Howison SD, McDonald M, Williams S, Johnson NF. The mirage of triangular arbitrage in the
spot foreign exchange market. International Journal of Theoretical and Applied Finance. 2009; 12
(08):1105–1123. https://doi.org/10.1142/S0219024909005609
52. Kozhan R, Tham WW. Execution risk in high-frequency arbitrage. Management Science. 2012; 58
(11):2131–2149. https://doi.org/10.1287/mnsc.1120.1541
53. Foucault T, Kozhan R, Tham WW. Toxic arbitrage. The Review of Financial Studies. 2016; 30(4):1053–
1094. https://doi.org/10.1093/rfs/hhw103
54. Bonart J, Lillo F. A continuous and efficient fundamental price on the discrete order book grid. Physica
A: Statistical Mechanics and its Applications. 2018; 503:698–713. https://doi.org/10.1016/j.physa.2018.
03.002
55. Marshall B, Treepongkaruna S, Young M. Exploitable arbitrage opportunities exist in the foreign
exchange market. American Finance Association Annual Meeting, New Orleans. 2008;.
56. Mahmoodzadeh S, Gencay R. Tick size change in the wholesale foreign exchange market; 2014.
57. CME Group. EBS; 2019. Available from: https://www.cmegroup.com/trading/market-tech-and-data-
services/ebs.html.
58. CME Group. EBS Platforms; 2019. Available from: https://www.cmegroup.com/trading/market-tech-
and-data-services/ebs/platforms.html.
59. Kanazawa K, Sueshige T, Takayasu H, Takayasu M. Derivation of the Boltzmann equation for financial
Brownian motion: Direct observation of the collective motion of high-frequency traders. Physical Review
Letters. 2018; 120(13):138301. https://doi.org/10.1103/PhysRevLett.120.138301 PMID: 29694225
60. Bonabeau E. Agent-based modeling: Methods and techniques for simulating human systems. Proceed-
ings of the National Academy of Sciences. 2002; 99(suppl 3):7280–7287. https://doi.org/10.1073/pnas.
082080899
61. Ramos-Requena JP, Trinidad-Segovia JE, Sanchez-Granero MA. An Alternative Approach to Measure
Co-Movement between Two Time Series. Mathematics. 2020; 8(2):261.
PLOS ONE Modelling the microscopic relationships between triangular arbitrage and cross-currency correlations
PLOS ONE | https://doi.org/10.1371/journal.pone.0234709 June 24, 2020 19 / 19