Embed Size (px)
Citation preview
The Microarray Facility
QC Report for FOAR03-S1-0005-IB014
The following QC report is a summary for a batch and may not reflect individual slide anomalies.
QC Data AcquisitionQC method: 9-mer HybridizationScanner: Packard ScanArray ExpressImage analysis: Imagene version 8.0.0QC script: version 1.71 on February 22, 2008
Microarray SpecificsPrint date: February 2008Printer type: MG IIDNA type: OligonucleotideSlide substrate: Erie C28: AminosalineNumber of subgrids: 48 (12 rows x 4 columns)Number of spots / subgrid: 702 (26 rows x 27 columns)Total number of spots: 33696
Spot Diameter for Sample SpotsMedian: 96.08 micronsMean: 96.68 micronsInterquartile range: 90.62 - 101.55 microns
SNR Flags Size Flags Total Flags % SNR Flags % Size Flags % Total Flags Total SpotsSample 330 78 367 1.1 0.3 1.2 30194Control 0 12 12 0.0 0.6 0.6 2140GFP 0 11 11 0.0 3.8 3.8 288Buffer 927 0 927 99.7 0.0 99.7 930Empty 144 0 144 100.0 0.0 100.0 144
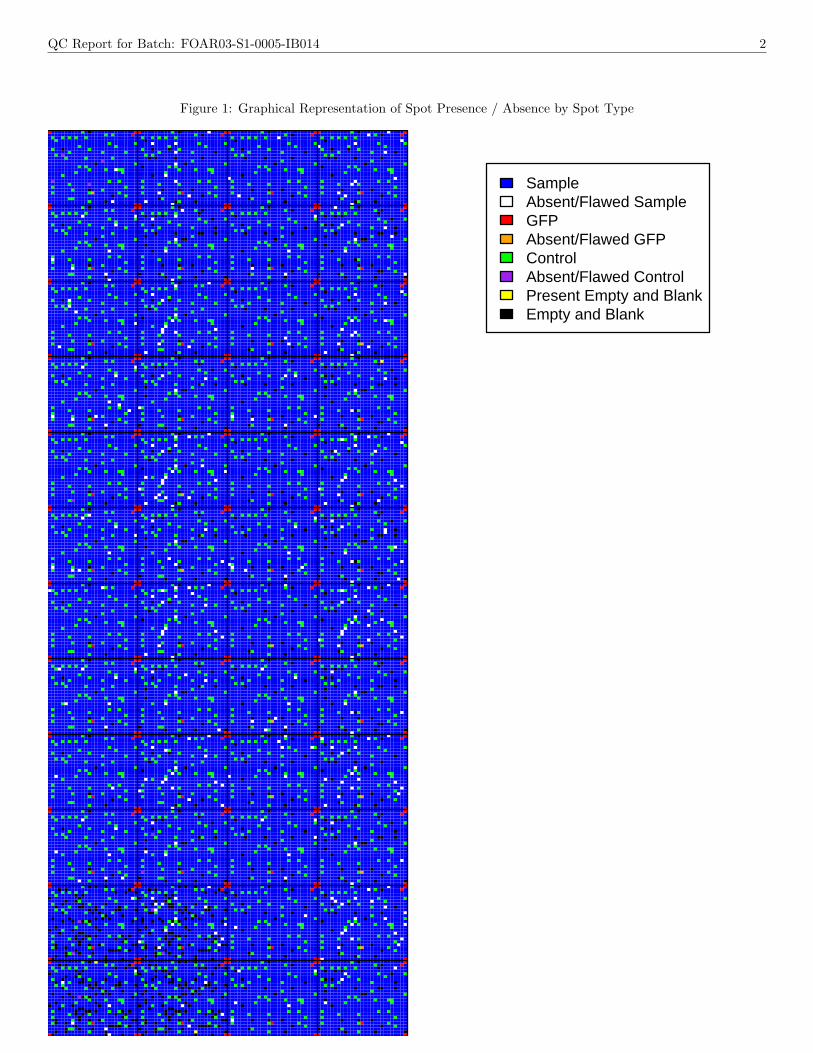
Spot Flags by Spot Type. The table summarizes the frequency and percentage of flags that are assigned tothe different spot types. Spots that are flagged are either absent or flawed. Empty (no material spotted)and Buffer (spotting solution) spots should be absent and therefore should be flagged. GFP (control spotsused for grid positioning), Control (negative and positive control spots) and Sample (spots that are targetsfor a gene) spots should be present.
The signal to noise ratio (SNR) flag column represents the number of spots that have failed the SNRcriteria ( signal mean−local background mean
background standard deviation > 4) for every microarray tested from the batch. The size flag columnrepresents the number of spots that have failed the spot size criteria (minimum spot diameter greater than70 microns and max spot diameter less than 155 microns) for every microarray tested from the batch. Thetotal flag column represents the number of spots that fail either the SNR criteria or the spot size criteria forevery microarray tested from the batch. Spot types that should be present must have a total flag percentageless than 5% for the batch to be considered on spec. Spot types that should be absent must have a totalflag percentage greater than 95% for the batch to be considered on spec. See Figure 1 for the graphicalrepresentation of this table.
QC Report for Batch: FOAR03-S1-0005-IB014 2
Figure 1: Graphical Representation of Spot Presence / Absence by Spot Type
SampleAbsent/Flawed SampleGFPAbsent/Flawed GFPControlAbsent/Flawed ControlPresent Empty and BlankEmpty and Blank


![fileProduct Cauliflower Onions Parsley (Herb) Peas Product Cert. No] 00064- PTKPT_ 0005 00064- PTKTF- 0005 00064- p TKNX- 0005 00064- p TKTT- 0005](https://img.pdfslide.us/doc/110x75/5e07c61b61631c3fb5083934/cauliflower-onions-parsley-herb-peas-product-cert-no-00064-ptkpt-0005-00064-.jpg)