Embed Size (px)
Citation preview

Economic History Review
, LIX, 3 (2006), pp. 498–538
©
Economic History Society 2005. Published by Blackwell Publishing, 9600 Garsington Road, Oxford OX4 2DQ, UK and 350 Main Street,Malden, MA 02148, USA.
Blackwell Publishing Ltd.Oxford, UK and Malden, USAEHRThe Economic History Review0013-0117Economic History Society 20052006
LIX
3498538Articles
EARLY LONDON CAPITAL MARKET
FOUNDATIONSANN M. CARLOS AND LARRY NEAL
The micro-foundations of the early London capital market: Bank of England shareholders during and
after the South Sea Bubble, 1720–25
1
By ANN M. CARLOS AND LARRY NEAL
SUMMARY
Using two sources, Bank of England Transfer Books and Stock Ledgers, thisarticle explores the nature of the ‘customer base’ for Bank shares during andafter the South Sea Bubble. This examination uncovers the nature of individ-ual participation in this early capital market. The Transfer Ledgers recordroughly 7,000 transfers during 1720, while the Ledger Books from 1720–25record over 8,000 individuals holding stock. The analysis finds the customerbase had breadth and depth, comprising individuals from across the socialspectrum, from all over England and Europe. The market was diverse andliquid. Activity during the Bubble came from those living in and aroundLondon, with most traders participating in the market only twice at most.While the majority of participants were men, there was a sizeable femalepresence. Men as a group lost money from their market activity, but womenmade money. In the five years after the Bubble, the customer base wassustained. The analysis argues that the secondary market in financial assetscannot be dismissed as mere gambling devices, and that the basis for amutually productive interaction between the financial sector and the realsector of the economy was already in existence and was sustained through theshock of the South Sea Bubble and its collapse.
I
iscussions of the development of English capital markets generate aninteresting and unresolved tension between the disruptive and possibly
irrational South Sea bubble in 1720 on the one hand, and the strength,
1
A very early draft of this paper was presented at the Economic History Society meeting 2002. Thispaper has benefited greatly from comments and suggestions by the anonymous referees and participantsin workshops at Trinity College Dublin, University of Oxford, University of British Columbia, andUniversity of California, Los Angeles. The authors gratefully acknowledge the financial support of theNational Science Foundation. We must acknowledge the help and expertise of the Bank of Englandarchivists, especially Henry Gillett and Sarah Millard. All errors unfortunately remain our own.
D

EARLY LONDON CAPITAL MARKET FOUNDATIONS
499
© Economic History Society 2005
Economic History Review
, LIX, 3 (2006)
durability, and sheer vitality of eighteenth-century English public financeon the other. Indeed, the role of the South Sea bubble in the long-rundevelopment of modern financial markets, and especially of the Londonstock market, remains an open issue, both for historians and economists.The first historian of the episode, Adam Anderson, hoped that his chroniclemight ‘serve for a perpetual memento to the legislators and ministers of ourown nation, never to leave it in the power of any, hereafter, to hoodwinkmankind into so shameful and baneful an imposition on the credulity of thepeople, thereby diverted from their lawful industry’.
2
The most recentlypublished account of the South Sea Bubble ‘claims no more than to havereaffirmed Anderson’s cautionary conclusion that from time to time marketscan go mad’.
3
Yet, even Adam Anderson acknowledged that no lastingdamage was done to the development of the British financial sector, andvirtually all subsequent treatments of the South Sea episode have confirmedAnderson’s implicit assessment.
4
The absence of impact of the bubble episode, especially in relation to thesubsequent development of the public capital market, raises what we con-sider to be two contrasting views. Was the British economy so backward in1720 that a financial shock of the magnitude of the South Sea Bubbleaffected but a small sliver of the economy, as some argue?
5
Or was it possiblethat the institutional framework of the British financial sector had, even by1720, acquired the resiliency necessary to withstand such a shock andrecover quickly? In this article we argue that the financial sector was resilientand so able to absorb the price movements across 1720.
6
Our investigation,focusing on the market for Bank of England stock, provides measures ofthe depth and breadth of the capital market during and after 1720. We focuson Bank stock that was widely understood at the time to be the leastspeculative stock among the major joint-stock companies whose shares wereavailable to investors.
7
Our examination uncovers the nature of individualparticipation in this early capital market, what stock market specialists todaycall the ‘customer base’. We are impressed with the characteristics of thisearly customer base, unique in Europe for its diversity and size, and with
2
Anderson,
Historical and chronological deduction
, pp. 91–2.
3
Dale,
First crash
, p. 183.
4
At least, that is our reading of Andreades,
History;
Brewer,
Sinews of power
; Carswell,
South SeaBubble
; Clapham,
Bank of England
; Dickson,
Financial revolution
; Harris,
Industrializing English law
; andScott,
Constitution and finance
. Even Anderson,
Historical and chronological deduction
, omits furthermention of the South Sea when he moves on to the years after 1723, when the final breakup of theCompany was accomplished.
5
Hoppit, ‘Myths’.
6
For a contrasting view, see Ibid., who concludes ‘Fundamentally, the Bubble was about high politics,high finance, and high society’, p. 158. His assessment is based on the participation of investors in theSouth Sea Company at the time, while ours is based on an analysis of the entire range of investors inthe Bank of England.
7
Over the previous five years of increasingly active stock market activity, the coefficient of variationof Bank of England stock was only 7.8%, compared to 19.0% for East India Company stock and 9.9%for South Sea Company stock. (Calculations from ICPSR Study 1008, COEDAILY.dat, available at:http://webapp.icpsr.umich.edu/cocoon/ICPSR-PRA/01008.xml).

500
ANN M. CARLOS AND LARRY NEAL
© Economic History Society 2005
Economic History Review
, LIX, 3 (2006)
the level of liquidity for the financial assets available. These unique featuresare key to understanding why London was able to emerge from the SouthSea Bubble and eventually fashion itself into the stock market for the world,a role it continued to play until the outbreak of the First World War.
To make our case, we have constructed two new data sets that documentwho was active in Bank of England stock during 1720, the level of turnoverin Bank stock, and who held stock at the end of the bubble and in thesubsequent years. We find that the level of liquidity was very high. Activityin the Bank stock during the Bubble came primarily from those living inand around London, although Dutch buyers came into the market at theend of the year. The participants in London came from across the socialspectrum, ranging from those who classified themselves as nobility or gen-tlemen, to those who were merchants, tradesmen, or servants. While themajority of those in the market were men, there was a substantial femalepresence. Although more men made money than lost money, because of thesize of their losses, men as a group lost money from their market activityduring the bubble. In contrast, we find that women made money, belyingthe perception then and ever since that women were the new, gullibleinvestors in the stock market. Those men who classified themselves asmerchants and gentlemen experienced the largest losses, while seamen andsoldiers experienced gains, as did those in the food sector.
The aggregate holdings of stock after the Bubble were geographicallymore widely diffused relative to those who bought and sold during theBubble period. In the five years following 1720, women increased theirownership from 10.8 per cent of the 1720 capital stock to 14.5 per cent ofa much larger capital stock in 1725. Perhaps it was women’s positiveexperience using the market during the price movements of the Bubble thatdrove their greater participation. In addition, foreigners increased theirownership of the capital stock from 7.2 per cent in 1720 to 16.4 per centin 1725. Mean holdings of Bank shares increased for those with occupationsin building trades, finance, manufacturing, military, and services, as well asfor titled-men, while holdings in other occupations either fell or remainedthe same. A few individuals were exceptionally active, but they seemed tobe performing more as dealers, intent on maintaining a certain inventoryof the Bank stock to meet customers’ demands, rather than riding theBubble.
8
Rather than becoming moribund as a rentier asset, Bank stock inthis critical period for the future of the London capital market became morewidely held, by an even more diverse set of customers than had held Bankstock before the South Sea Bubble. Before discussing these findings ingreater detail, and to underscore the importance of these findings, we needto review the role played by the Bank of England before, during, and afterthe South Sea Bubble, and the historiography of the Bubble and the Bank.
8
By contrast, Temin and Voth, ‘Riding’, find convincing evidence that Richard and Benjamin Hoaredid ride the Bubble, but in South Sea stock, not in Bank stock, which they also owned.
EARLY LONDON CAPITAL MARKET FOUNDATIONS
501
© Economic History Society 2005
Economic History Review
, LIX, 3 (2006)
II
In the years following the Treaty of Utrecht in 1713, the English governmentgrew increasingly concerned about the size of its outstanding debt. Themonied companies—the Bank of England (1694), the New East IndiaCompany (1698), and the South Sea Company (1710)—had already shownthat through a debt for equity swap they could reduce the government’sdebt service.
9
By 1719, such a strategy again seemed appropriate, especiallyin view of the apparent success of John Law’s Mississippi scheme in France.Although the proposal to undertake such a further debt for equity swapcame from the directors of the South Sea Company, by the end of 1719,the directors of the Bank of England had entered into competition for thisbusiness.
10
The impact of such competition was to increase the price thateach company offered the government for the privilege of undertaking aswap. Ultimately, the South Sea Company offer was chosen. The bareoutlines of the agreement meant that the government would receive a£7.5 million loan from the South Sea Company and that the Companywould issue roughly £31 million of new capital, roughly half the shares tobe exchanged with existing government-debt holders and the remainder asa new share issue. One result of this debt for equity exchange is that itbrought existing holders of government debt annuities into the alreadyflourishing private capital market for equities.
The Bubble began in February 1720 with parliamentary approval of theSouth Sea Company’s plan to redeem outstanding government debt notalready held by that company, the Bank of England, or the East India Com-pany. The higher the market price of South Sea stock, the more attractivewould be the inducement for debt holders to exchange existing governmentdebt for South Sea Company stock, and the more attractive for the company,which would need less stock per unit of debt redeemed.
11
Thus, the incentiveswere set for the directors of the company to focus on the market value of theexisting stock. Rather than place all the stock issue on the market at once,the company decided to do so in a number of stages or subscriptions. Suchwas the enthusiastic response by debt holders that, with each successive sub-scription of new stock, the price of South Sea shares rose spectacularly, andwith it the share prices of other companies.
12
The transfer books of the South
9
See Neal,
Financial capitalism
, ch. 4 for a more complete discussion of the nature of the debt forequity swaps.
10
Dickson,
Financial revolution
, ch. 5.
11
The contract between the government and the South Sea Company did not specify the price atwhich the debt-for-equity swap would take place.
12
Those companies competing for investors’ favour against the booming South Sea Company beganat this time to take defensive measures. Their standard response was to mortgage a portion of theircapital stock, reducing the number of their stock available for trade on the stock market, while at thesame time providing relatively cheap credit to their stockholders. This credit could be used to purchasestock in any company or for financial settlement purposes. Starting on 10 May 1720, the Bank ofEngland, most threatened by the probable success of the South Sea Company, mortgaged 29% of itscapital stock. The East India Company and the Royal African Company followed suit. Indeed, the RoyalAfrican Company made a new equity issue that more than tripled the value of the existing capital stock.

502
ANN M. CARLOS AND LARRY NEAL
© Economic History Society 2005
Economic History Review
, LIX, 3 (2006)
Sea Company closed from 23 June to 22 August 1720 to allow the clerks timeto catch up on recording all of the subscriptions that had been received.
13
When the South Sea Company’s transfer books reopened in August, theopening price was essentially as in mid-June. Immediately thereafter, theprice of its stock began to fall, and a general scramble for liquidity ensued.The rise and fall of share prices in 1720 is called the South Sea Bubble.
14
In September 1720, the South Sea Company’s attempt to enlist the aidof the Bank of England in completing the debt conversion had collapsed.This occurred when it became evident that the Company’s banking affiliate,the Sword Blade Company, was out of cash. A solution to the crisis wasfurther delayed with the change of government caused by the sudden deathin February 1721 of Lord Stanhope, head of the cabinet, and the reshufflingof ministers that brought Robert Walpole back to power as First Lord ofthe Treasury and Chancellor of the Exchequer, and thus, in effect, PrimeMinister. Resolution of the South Sea affair began with the Bank treaty in1722, whereby the Bank of England would add nearly £3.5 million to itscapital stock, relieving the South Sea Company of that part of the govern-ment debt it had acquired during the tumult of the Bubble.
15
The South Sea Bubble has generated considerable interest among schol-ars. In his revised classic on the South Sea Bubble, Carswell concluded thatthe repercussions of the Bubble Act of 1720, which limited charteredcorporations to stay within the terms of their original charter, had seriousconsequences for the market, and as a result may have delayed industrial-ization until the end of the century. In contrast, Harris has demonstratedthat joint-stock corporations continued to use the market to finance theelaborate infrastructure of eighteenth-century Britain, from roads to canalsto gas and waterworks.
16
Furthermore, not only did the economy recoverquickly from whatever the financial disruption created by the bursting ofthe bubble, but the British government was able successfully to finance eachsubsequent war (aside from a temporary embarrassment with some frac-tious colonies), culminating with victory over Napoleon in 1815.
17
13
The price quoted for South Sea Company stock during this period was, therefore, a forward price,adding a forward premium of the current market rate of interest to the expected future spot price atthe end of August. The transfer books for the other companies remained open. This means that theactions of these stockholders during this period of intense reassessment of the market can be observed.
14
Hoppit, ‘Myths’, p. 163 notes that only in 1771 did the term ‘South Sea Bubble’ appear in print,in the first edition of the
Encyclopaedia Britannica
. Until then, the literature referred to the episode asthe ‘South Sea scheme’ or ‘affair’.
15
The capital of the South Sea Company was split in half: £16 million as stock in the trading companyand £16 million as fixed interest stock: the so-called ‘South Sea Annuities’. These were perpetualannuities with a 5% annual return, later reduced to 4% in 1727, arguably the saving financial innovationof the age, as they were redeemable at the will of the government, whenever market interest rates fellbelow the fixed rate. The success of these securities led eventually to the issue of the 3% Bank Annuityof 1726, and from 1727 to 1751, successive 3% perpetual annuities issued by the government butmanaged by the Bank. In 1751, these were all consolidated into the Three Per Cent Consol, the classicgovernment debt instrument for the next century and a half. Neal,
Financial capitalism
, ch. 4.
16
Carswell,
South Sea Bubble
, p. 243; Harris,
Industrializing English law
.
17
Brewer,
Sinews of power
; Ferguson,
Cash nexus
.

EARLY LONDON CAPITAL MARKET FOUNDATIONS
503
© Economic History Society 2005
Economic History Review
, LIX, 3 (2006)
In terms of the recovery from the Bubble, Carswell gives most credit tothe political genius of Robert Walpole for restoring the viability of theLondon capital market, especially for government debt. Walpole’s decisionto impose amnesties and ‘acts of oblivion’ on the thousands of privatebargains that had been made during the height of financial frenzy basicallyput most people back to where they had begun. However, all histories agreethat a key role in the resolution of the financial crisis was played by theBank of England and Sir Gilbert Heathcote, senior Director and formerGovernor of the Bank, who led the team of negotiators from the Bank whomet with a delegation of South Sea Directors in the last weeks of September1720. Walpole attended this meeting, apparently merely taking notes onbehalf of the government.
18
The terms of the so-called Bank contract out-lined in Walpole’s notes were, however, not to be realized for nearly two years.
Not all authors would give the Bank such a prominent role. Clapham, inhis classic history of the Bank, notes with pleasure that ‘With most of themadness and fraud of 1720 the Bank, fortunately for its good name, hadlittle concern’.
19
Clapham’s assessment was a good deal more restrainedthan that of Andreades, who concluded that only because of its enemies didthe Bank escape from duplicating the misadventures of John Law in France’sMississippi Bubble. It escaped the dangers from the failure of the SouthSea Company ‘only by breaking its word [the 1720 Bank Contract], and itwithstood the run upon it by using methods unworthy of a great establish-ment’.
20
Dickson, however, agrees with Carswell, and argues that the Bankplayed a major role in the resolution of the crisis during the period fromSeptember 1720 to June 1723 when the South Sea Company’ stock wasfinally divided in half, after ceding £3.5 million of its stock to the Bank.The ‘Bank contract’, finally signed between the two companies in February1722, accomplished the victory of the Bank over the presumptions of theSouth Sea Company. Dickson concludes that for the rest of the centuryEnglish public finance ‘remained more honest, as well as more efficient,than that of any other country in Europe’ and the Bank of England was theunchallenged keystone of the British financial system.
21
Clearly, the Bank of England was important both during and after thecollapse of the South Sea Bubble. Yet all discussions focusing on the directorsof the Bank, or the nature of the Bank contract, ignore the market for Bankof England stock. What we explore here is not the Bank as an institution,which has been explored by others, but rather the characteristics and actionsof those who made up the market for Bank stock during and after 1720.
22
18
Carswell,
South Sea Bubble
, p. 243; Harris,
Industrializing English law
, pp. 150–56.
19
Clapham,
Bank of England
, vol. 1, p. 84.
20
Andreades,
History
, p. 145.
21
Dickson,
Financial revolution
, pp. 157–187 passim, p. 198.
22
While Dickson,
Financial revolution
, also examined the composition of holders of Bank stock in thisperiod, he was limited to samples of the stockholders as part of the general body of holders of Englishgovernment debt. Our results are derived from a complete listing of the Bank’s shareholders and ourinterest is to see how they responded to the shock of the South Sea Bubble.

504
ANN M. CARLOS AND LARRY NEAL
© Economic History Society 2005
Economic History Review
, LIX, 3 (2006)
III
In 1720, Bank of England shares were one of a number of securities publiclyavailable. An investor could have purchased shares in, for example, theRoyal African Company, Million Bank, the East India Company, or theSouth Sea Company. In contrast to Royal African Company shares—whoseprice was only £2 in 1712—on a par value of £100, Bank of England shareprices had remained above par from at least 1698. By January 1720, thecorresponding share prices for these two companies were £20 and £150.
23
Share prices for each of the other three companies, (Million Bank, EastIndia, and South Sea) was 126, 201, and 128 per cent of par respectivelyin January 1720. Scott notes that in the first five months of 1720 shareprices moved unevenly: taking the price on 20 May 1720, Bank of Englandshares rose 36 per cent, East India Company 34 per cent, the South SeaCompany 225 per cent, and the Royal African Company 300 per cent.
24
Relative to volatility in the years prior to 1720 and relative price changesduring 1720, Bank of England shares were a stable asset.
25
Bank shares started 1720 at 150 per cent of par, rose to 180 at thebeginning of May, 204 on 20 May, 250 in June, and fell back to 147 on thelast day of the year (see figure 1). The price movements over the Bubblewere driven in part by the uncertainty in January and February over whichcompany would get to undertake the debt-for-equity swap, while in May,the Bank of England’s extended loans to share holders on the collateral oftheir shares and the resulting mortgages removed £1.6 million book valueof shares from the market.
26
It has also been argued that the resultingpublicity and competition among the monied companies brought moreindividuals into active participation in the stock market.
27
Our investigationof the market for Bank of England shares, a relatively stable asset, willultimately provide a benchmark against which to compare and contrastmarket activity in other companies.
28
Here we use two separate sources from the Bank of England archives:Bank of England transfer books 1720 (AC28/1545–1554) and Bank ofEngland stock ledgers 1720–1725 (AC27/434–437) with their alphabets(AC 27/430–433). Each source gives a distinct but interrelated picture of
23
All share prices are listed relative to a par value of £100.
24
Scott,
Constitution and finance
, vol. 1, p. 413.
25
Dividends were paid from the annual revenue owed by the government to the Bank as a result ofits own prior debt-for-equity transactions. Only in the event of a government default would this incomestream disappear. The Glorious Revolution and success in war had made this event less likely.
26
These transfers are recorded in separate mortgage ledgers.
27
Mortimer,
Every man
, pp. xix–xx.
28
We are collecting data for these other companies. Obviously, we would really like to have informationon shareholding in the South Sea Company, but these transfer books are missing. We are inferring thatinformation from the ledgers of the South Sea Annuities created in 1723. These annuities were allottedproportionately to the South Sea shareholders as of June 1723. See, A. M. Carlos, L. Neal andK. Wandschneider, ‘The origins of national debt: the financing and re-financing of the War of theSpanish Succession’. Working Paper, 2005.

EARLY LONDON CAPITAL MARKET FOUNDATIONS
505
© Economic History Society 2005Economic History Review, LIX, 3 (2006)
shareholders’ market activity. All joint stock companies kept careful recordsof those who owned shares. This was necessary not just for dividend pay-ments, but also to know who could vote at the annual meeting and whowas eligible for election to the Board of Directors.29 The transfer booksdocument all sales and purchases of Bank of England stock. By the time ofthe South Sea Bubble, the Bank’s clerks kept four folio-sized transfer books,corresponding alphabetically by last name of shareholders to the four stockledgers in which entries were made for every transfer of stock, regardless ofamount. Each folio in a transfer book contained four pre-printed forms withblanks where the name of the seller, the name of the purchaser, the date ofthe transfer, and the amount transferred were entered by hand.30 In many
29 Eligibility to vote and to stand for the board of directors was based on the number of shares owned.A shareholder had to own £500 book value of shares to vote, £2,000 to be elected to a director, £3,000to be elected deputy-governor, and £4,000 to be elected governor. Scott, Constitution and finance,vol. 3, p. 205. Given the essential legal nature of the relationship between the firm and the shareholders,the Bank had to ensure that the details were accurate. This focus on the accuracy of such informationis, for example, very visible in the records of the Royal African Company.
30 The date in the transfer book is the date when the transfer is recorded and not necessarily whenthe sale took place, but the date recorded is in effect the date of official transfer. We also have no reasonto believe that much time existed between sale and transfer.
Figure 1. Bank of England stock, 1720Source: Neal, Financial capitalism
0
50
date
100
150
200
250
300
1/1
Perc
ent o
f pa
r
Bank
1/19 2/5 2/2
33/1
13/2
94/1
5 5/3 5/20 6/7 7/1
27/2
98/1
6 9/2 9/20
10/7
11/11
11/29
12/166/2
410
/25

506 ANN M. CARLOS AND LARRY NEAL
© Economic History Society 2005Economic History Review, LIX, 3 (2006)
cases, we have information on occupation and address of both seller andbuyer. Each completed form was then signed by the parties to the transac-tion, with the Bank clerk acting as witness. The edge of the folio was thenembossed to show that the small transfer fee had been paid, and the folionumbers written in where the debit from the seller’s account and the creditto the buyer’s account had been entered in the respective stock ledgers. All6,844 transfers of Bank stock that occurred over the year 1720 have beenencoded and are analysed below.
Whereas the transfer books represent a flow over time, the alphabet andstock ledgers give stock ownership at points in time. At irregular intervals,the Bank of England started new ledger books, with correspondingalphabetic ledgers, to follow the activity of those who owned shares.The ledgers that we use were opened on 29 September 1720 and continuethrough to 29 September 1725.31 Over this period, 7,924 accounts wereentered in the four stock ledgers, which contained the accounts of eachstockholder, arranged alphabetically by last name, with space for fiveaccounts on each folio. Sales of stock in par value were then entered onthe left-hand folio, while purchases were entered on the right-hand side,each with the date of the transfer, the folio number of the counter-party,and the corresponding folio number in the transfer book. Marginal notesindicate life events—deaths, bankruptcies, trusts for minors, and letters ofattorney—details of which can be found in the registers corresponding tothe stock ledgers.
To help the clerks keep track of where each account was located whenevertransfers were made, or dividends paid out, the Bank’s clerks opened alpha-bet ledgers in which they entered details on the occupation, location, andsocial status of each stockholder, as well as the folio number where theaccount was entered in the stock ledgers. Active traders would have severalfolio numbers by their name in the alphabet ledger as their account wouldhave to be continued on a new folio when the space for recording theirtransaction filled up in the original folio. Especially useful for our purposeswere the red-ink entries indicating the folio number in the previous period’sstock ledger where the stockholder’s account had been, and the folio num-ber in the next period’s stock ledger where the stockholder’s account wastransferred. These entries helped us to identify the pattern of turnoveramong the stockholders as explained below. To sum up, the stock ledgers,together with the alphabet ledgers, represent the population of all individ-uals (and a few organizations) who ever held part of the Bank’s capital stockduring this particular period. They, therefore, provide a window into thestructure of holdings at the end of the South Sea Bubble and in theimmediate aftermath of the Bubble. But the notations used by the Bankclerks in the alphabet ledgers also tell us who owned stock during theBubble period. Given the different perspectives provided by these three
31 The prior ledger had been opened in 1711, and thus covers a decade of Bank activity.

EARLY LONDON CAPITAL MARKET FOUNDATIONS 507
© Economic History Society 2005Economic History Review, LIX, 3 (2006)
sources, we believe they provide a compelling picture of the nature ofactivity in the London capital market at this time.32
The book value of the Bank of England stock outstanding at the begin-ning of 1720 was £5,559,995.33 The actual book value of transfers for 1720exceeded £5.9 million. In essence, the capital stock of the Bank turned overcompletely. For just the period from 1 January 1720 to 1 November 1720,a total of 6,844 transfers of Bank stock took place. This is considerablyhigher than activity in 1719 or the years before that date. According toDickson’s rough count, done by multiplying the average number of entriesper page by the number of pages in the transfer books, there were 2,102transfers in 1717; 2,081 in 1718; 2,181 in 1719; and 7,352 for 1720.34 Suchextremely large volumes of activity were also evident in other companies.Over this same period, the book value of the East India and Royal Africancompanies turned over one and half times. The former had a book value of£3.2 million, while the Royal African Company had a book value of£450,000.35 The Bubble year, 1720, therefore, represents a period of intenseactivity in all the major companies trading on the market.
Across 1720, there were 6,844 total transactions in Bank stock with anaverage book value per transaction of £871.30 (see table 1 and figure 2).As noted earlier, the high level of transactions and activity in February
32 Thanks to the financial support of the National Science Foundation and the professional supportof the Bank of England archivists, Henry Gillett and Sara Millard, the Bank’s stock ledgers and alphabetledgers for this period have been digitally scanned and are available on CDs from the Bank to interestedresearchers.
33 See Scott, Constitution and finance, vol. 3.34 Dickson, Financial revolution, app. D.35 See Carlos, Moyen, and Hill, ‘Royal African Company stock’, for information on the Royal African
Company. The numbers for the East India Company are derived from preliminary estimates on thatcompany. A rough estimate of stock market capitalization at the beginning of 1720 is £21 million dollars,of which half was generated by the South Sea Company, probably the company which experienced thehighest level of activity.
Table 1. Transactions in Bank of England shares, 1720
Number Book value £ Book value per transfer
January 325 382,007 1175.41February 821 981,533 1195.53March 289 301,632 1043.71April 775 685,122 884.03May 1,131 961,023 849.71June 937 673,948 719.26July 507 384,547 758.48August 698 554,227 794.02September 416 325,672 782.87October 411 363,051 883.34November 536 352,524 657.69Total 6,846 5,965,286
Source: Bank of England transfer books 1720—AC 28/1545–1554

508 ANN M. CARLOS AND LARRY NEAL
© Economic History Society 2005Economic History Review, LIX, 3 (2006)
probably related to the uncertainty over which company the governmentwould choose to undertake the debt for equity swap. The low number oftransactions in March reflects the fact that the Bank closed the transferoffice for two weeks in preparation for its semi-annual dividend. What isevident in table 1 is that the book value per transfer in March remainedhigh. Overall, the average book value of transactions in the first half of theyear was higher than in the second; £924 relative to £770. Of course,individuals could and did have multiple transactions. Thus, although therewere 6,844 separate transactions of a sale and purchase of Bank stockrecorded, there were 2,233 unique sellers of Bank of England stock and2,304 unique buyers.36 Of these unique sellers, 406 or 18 per cent of thetotal were women; of the buyers, 366 or 16.3 per cent of the total werewomen. When measured by the percentage of book value of sales andpurchases, women comprised only 10 per cent and 8 per cent respectively.37
36 Account had to be taken of variation in spelling both of first names and surnames. We havestandardized all spelling, keeping the original and the standardized form in the master list. We have usedthe other information in the ledgers to differentiate between people with the same name or the sameperson whose name has been given an alternative spelling.
37 This point has been made by others. See Dickson, Financial revolution, or Ingrassia, Authorship,commerce and gender. However, when talking about women in the market, care needs to be taken overwhether one is examining the total number of women shareholders, the percentage of the capital heldby women, or the number of women actively trading shares. The percentages of those actively tradingare smaller than the percentage of total women holding Bank shares, as noted later in the text. For amore in-depth discussion, see Carlos and Neal, ‘Women investors in early capital markets’.
Figure 2. Transactions in Bank of England shares, 1720Source: Transfer books of the Bank of England—AC 28/1545–1554
0
50
100
150
200
250
300
350
19 22 25 28 31 34 37 40 43 46
Weekly: January to November 1720
Num
ber
of tr
ansa
ctio
ns
4 7 10 13 161

EARLY LONDON CAPITAL MARKET FOUNDATIONS 509
© Economic History Society 2005Economic History Review, LIX, 3 (2006)
On a per-sale basis, a woman’s average sale of Bank stock was £658, whilethe average purchase was £675. Women were also present in the market forthe more speculative Royal African Company shares. There, however, theyconstituted only 4.7 per cent of sellers and 6.1 per cent of buyers, and only3.4 per cent and 4.2 per cent respectively of the book value of sales andpurchases of the senior stock. This is a consistently lower level of involve-ment than in the market for Bank stock.38
The difference in mean transfer between men and women in Bank stockcan be explained by differences in access to funds. Yet despite the inequalityin the income distribution and women’s lack of access to land and possiblyother forms of credit, the data show that some women, and not merely titledwomen, did hold large portfolios of this financial asset. An examination ofthe distribution of transactions by book value or block size, as described intable 2 and figure 3, shows a broad access to the market in that there wereboth small and very large transactions. Although a single share was denom-inated as £100 book value, a share could be subdivided. There were 106transactions with a book value of less than £100. There were 86 transactionsof £5,000 book value or greater. The majority of the transfers occurred at
38 Detailed discussion of women investors in the Royal African Company can be found in Carlos,A. M., Maguire, K., and Neal, L., ‘Financial acumen, women speculators and the Royal AfricanCompany, 1720,’ University of Colorado Working Paper, 2005.
Table 2. Number of transactions by block size
Block size £ Number of transactions
0–99 106100 492101–199 81200 456201–299 75300 217301–399 30400 132401–499 28500 2,242501–999 2181000 1,9381001–1499 571500 1301501–1599 242000 3392001–2499 212500–2999 353000–4999 1395000+ 86Total transactions 6,846
Source: See table 1

510 ANN M. CARLOS AND LARRY NEAL
© Economic History Society 2005Economic History Review, LIX, 3 (2006)
the £500 or £1,000 book value amount. There were 2,242 transfers of £500blocks and 1,938 transfers of £1,000 blocks. Ownership of £500 book valueof stock or more carried with it the right to vote in Bank elections. But itmust be recognized that there were 1,617 transfers, 24 per cent of the total,which took place at levels that carried no voting rights.39
Discussions of the number of unique individuals and size of transfers donot tell us how individuals were using the market. Do we see individualsmaking many transactions, or do we have the majority of individuals in themarket only once or twice, and a small number of individuals who have avery large number of transactions? Table 3 shows the breakdown of uniquesellers and buyers by the number of transactions, while table 4 gives thenumber of unique sellers and buyers by their largest transactions. What isimmediately evident from tables 3 and 4 is that 58 per cent of all sellers andpurchasers of Bank of England stock came into the market only once during1720, and 77 per cent were in the market only once or twice. Overall,market activity in Bank stock across the Bubble was driven by people whocame into the market only once as either a seller or a buyer. Clearly therewas a small group of individuals who were in the market multiple times.
39 Voting procedures were based on ownership of stock, not on amount. A shareholder had to hold aminimum of £500 book value of stock in order to be eligible to vote. However, in the original charter,no person had more than one vote irrespective of the amount of stock owned. Dickson, Financialrevolution, argues that the £500 size of transactions and above reflects both the fact that people wanteda vote for the Court of Directors and a demand from big institutions in London. That this block sizecarried voting rights is clear, but whether those rights were exercised is not. As we note later in thearticle, the liquidity and transparency of Bank of England stock made them valuable in their own rightas insurance and collateral.
Figure 3. Number of transfers by block sizeSource: See figure 2
0
500
1,000
1,500
2,000
2,500
0-99
100-
199
200-
299
300-
399
400-
499
500
501-
999
1000
1001
-199
9
2000
-299
9
3000
-499
9
5000
+
Block Size

EARLY LONDON CAPITAL MARKET FOUNDATIONS 511
© Economic History Society 2005Economic History Review, LIX, 3 (2006)
Table 4. Unique sellers and buyers by largest transaction
Book value: transactionUnique sellers
(Number)Unique buyers
(Number)
1–99 24 25100 165 199101–199 35 27200 162 197201–299 37 27300 79 97301–399 15 9400 51 60401–499 19 10500 675 659501–999 122 1031000 685 6691001–1499 39 261500 65 591501–1599 13 112000 164 1752001–2499 16 142500–2999 26 233000–4999 87 765000+ 60 59
Total 2,539 2,525
Source: See table 1
Table 3. Number of unique sellers and buyers by number of transactions
Number of transactionsUnique sellers
(Number)Unique buyers
(Number)
1 1,463 1,4712 497 4783 214 2194 103 1135 67 626 43 337 29 218 14 169 19 17
10 12 1011 10 1112 6 1012 8 914 3 615+ 51 49
Total 2,539 2,525
Source: See table 1

512 ANN M. CARLOS AND LARRY NEAL
© Economic History Society 2005Economic History Review, LIX, 3 (2006)
There were roughly 50 individuals who had more than 15 transactions aseither as seller or as a buyer. But within this group there is an even smallergroup of 15 individuals who, for the main part, had more than 30 transac-tions on either side of the market. These 15 individuals appear to be actingas middlemen for the stock. The most active were George Caswall andRobert Westley, each of whom had over 400 entries, comprising roughly200 plus purchases and a similar numbers of sales. Others in this groupinclude Samuel Strode and Moses Hart, listed in the transfer ledgers asbrokers; James Martin, a goldsmith; Francis Pereira and Anthony da Costa,both merchants; and Johanna Cock, a widow. Robert Westley was listed asa merchant tailor, and George Caswall as knight.40 Together, the activity ofthese 15 individuals comprises roughly 38 per cent of the total marketactivity. While important, the market was not, however, dominated by thisgroup, but by those with one or two transactions.
What makes 1720 an interesting year for an analysis of market activity isnot just that share prices showed considerable variation across the year, butalso the large number of people who were involved in the market. In a land-based communication system, information could flow only as quickly as thefastest horse or boat. Thus one might expect those closest to the centre tohave more and better information.41 Or at the very least, they would haveinformation in the timeliest manner. When we examine stock market activityby location, we find, not unexpectedly, that activity in Bank of Englandshares was a London phenomenon, which was also noted by Dickson.Whether we examine location of seller or of buyer, 77 per cent of all thoseinvolved were listed as having an address in London; only 17 per centof sellers and 15 per cent of buyers lived outside London, while only5 per cent of sellers and 7 per cent of buyers were foreign. For those wholived outside London, there is a noticeable home-counties effect.42 Of the137 foreign sellers, 107 lived in the Netherlands, while another 17 lived inSwitzerland. There were then a few sellers from Germany, Ireland, Portugal,France, and Belgium, and the pattern was similar for foreign buyers.
40 For a more complete discussion of the construction of broker networks for Bank of England stock,see Carlos, A. M., Neal, L., and Wandschneider, K., ‘Broker networks during the South Sea Bubble:the strength of weak ties’, presented at the Business History Conference, Le Creusot, May 2004.
41 Those living outside London would be able to use the newspapers to obtain information on theLondon market. As Laurence has shown, someone living in Yorkshire could receive a London newspapereveryday. See Laurence, A., ‘That “nasty South Sea affair”: the Hastings sisters, Mrs Bonnell and therage to speculate’, unpublished ms, Open University, April 2004.
42 Roughly 50% of those living outside London lived in the home counties. While a number of theseareas would eventually be incorporated into the Greater London region, in 1720, they lay outsideLondon. We use an A–Z for 1747 to determine what lay within the city limits, which gives a slightoverestimate for London residence relative to the home counties, as one would expect London to haveexpanded from 1720 to 1747. It is, of course, possible that some of those who had London addressesalso had houses in other parts of the county. Those classified as nobility would be one such group. Aswill be seen, those classified as nobility make up only a small percentage of those in the market. It wasoften the case that for this group, no address was given. We take only the address listed in the stocktransfer book.

EARLY LONDON CAPITAL MARKET FOUNDATIONS 513
© Economic History Society 2005Economic History Review, LIX, 3 (2006)
The transfer books also provide information on socio-occupational cate-gories.43 The level of detail is such that we know if a shareholder was acheesemonger, plumber, salter, tanner, notary, barber, major, gentleman,duke, duchess, wife, widow, or spinster. To deal with this level of detail, weaggregated up occupations and social groups into an intermediate and thenfinal classification structure. The socio-occupational classifications are givenin appendix A. We have 14 final classifications, of which 10 are occupationbased, two are based on social status, and the remaining two list those forwhom the occupation is ‘unknown’, or, ‘other’, those for whom the indi-vidual is a minor or the stock was held in trust. The most aggregatedclassification is ‘commerce’. Here we have those who gave an occupation asa trader or dealer in products, those involved in the sale or preparation offood, anyone who could be considered a shopkeeper, and those who gavetheir occupation as merchant. Manufacturing is both an intermediate andfinal classification. As an intermediate category it includes all those whowere listed as makers of a product, such as brick-maker, cabinet-maker,cooper, and razor-maker. And as a final classification, it now includeseveryone involved in the textile industry; silkman, weaver, tailor, spinner,and dyer. ‘Services’ covers the full range of shopkeepers from apothecariesto warehousemen, and artisans from barbers to wire-workers. ‘Professional’includes church (curate, rector, vicar) and professional (alderman, attorneyat law, burgo master, scholar, surgeon).44 Those in the financial sector,somewhat formally defined, such as banker, goldsmith, scrivener, or broker,comprised only 3 per cent of total participants.
For socially defined groups, we have created two intermediate classifica-tions. For men, we have gentlemen and nobility. The gentleman categoryincludes all of those listed as gentleman or esquire. The nobility classificationincludes all social designations from ‘honourable’ up the peerage, as well asthose listed as Lord Bishop or Lord Chief Justice.45 These two intermediategroups are then aggregated as titled-men. Because marital status for womendominates any occupation, women were listed either as spinster, widow,
43 For much of the early modern period, we have quite restricted information on what people did. Wehave Gregory King’s table for 1688 and Joseph Massie’s table for the 1750s. The Marriage Duties Actof 1694 taxed people by economic and marital status and so provides us with census-like local returns,especially for London, see Lindert, P., ‘Lucrens Angliae: the distribution of English private wealth since1670’, and ‘Appendices’ Working Papers 18 & 19, Agricultural History Center, UC-Davis (February1985), p. 687. Lindert, working with burial registers between 1660 and 1815, was able to unearthoccupational reporting for at least 70% of the decedents, for periods of nine or more years, for about404 parishes. These data provide us with a reference point against which to compare the socio-occupational status of Bank of England stockholders.
44 Ultimately, the inclusion of an occupation in one group relative to another is somewhat arbitrary.Wherever possible we have tried to follow the breakdown used by Lindert, ‘Lucrens Angliae’, in hiswork on social tables. In the transfer books, an individual who had more than one transaction couldhave more than one occupation. In the majority of these cases, which were not many, one occupationwas just more specific, such as woolen draper and merchant. In the ledger books, each person had onlyone occupation listed.
45 Lord Bishop could have equally been placed in the church category. While entering him in nobilityincreases the size of that classification, the bias reinforces the very small size of this group in the market.

514 ANN M. CARLOS AND LARRY NEAL
© Economic History Society 2005Economic History Review, LIX, 3 (2006)
wife, or nobility. So we grouped women into ‘women-commoner’ and‘women-nobility’, and then up into a single group ‘titled-women’. What isevident from the data is the very small number of shareholders who werein the nobility. In the case of women, only 34 women or 5.5 per cent ofsellers and 21 women or 4.0 per cent of buyers were in the nobility. Formen, 35 per cent were listed as gentleman or esquire, and only a further4 per cent were nobility.46 The implication of this is that the majority ofthose involved in the market in 1720 did not come from the top end of thesocial order. Table 5 gives the number of unique individuals by occupationand then by number of transactions for both the selling and buying side ofthe market. Market activity was spread over all sectors. These distributionsreinforce the fact that individuals from all sectors had access to the market.
Share price for Bank of England stock began the year at £150, rising to£180 in May, to £250 in June, and back to £147 on the last day of 1720.However, as is evident in figure 1, neither the price rise nor the decline wasuniform. There were declines in the price during the upswing and ralliesduring the downswing. This is important because the extent of gains orlosses from market activity depended on when an individual was in themarket. We divide individual market participation into three distinct cate-gories: individuals who only purchased stock, individuals who only soldstock, and individuals who both bought and sold. For an individual whoonly purchased stock, that person could have had either a single purchaseor multiple purchases. Similarly, a person who only sold, could have soldeither once or multiple times. Those individuals who both bought and soldwere either net sellers, net buyers, or sold and purchased an equal book-value amount of stock. There were, in total, 3,827 unique individuals whoparticipated in the market either as buyers or sellers only, or on both sidesof the market; 3,233 men and 594 women.47
We determine the within-year (1720) financial position for each individ-ual and then aggregate over all individuals who bought or sold Bank stockduring 1720.48 In essence, we are looking to find the speculative gains orlosses of those who were in the market. Each investor was assigned themarket price for the stock on the date of transfer. For those who onlypurchased, we took their within-year position relative to the price on31 December 1720. For those who only sold, we acted as if the stock had
46 Using titles to provide identification gives us a lower bound estimate. But it is likely to be reasonablyreliable.
47 In this exercise, we did not include the top 15 most active participants in the market. These 15appear to have been brokers in the stock. Their net positions are laid out in Carlos, Neal, andWandschneider, ‘Broker networks’. What we are interested in here are those individuals who were makingportfolio decisions concerning their position in Bank stock.
48 There are, of course, alternative ways of estimating gains and losses. In this article we take people’spaper position only for 1720. We have good data on prices and for who was in the market, and we donot incorporate the role of dividends. In essence, we are looking at the speculative gains of those whowere in the market. Obviously, one could also take the actual date of purchase and sale for each of the3,827 unique individuals. Because some individuals held shares for quite lengthy periods of time, wewould also have to incorporate the income-earning capacity of shares.

EARLY LONDON CAPITAL MARKET FOUNDATIONS 515
© Economic History Society 2005Economic History Review, LIX, 3 (2006)
been purchased on 1 January 1720. For net buyers and sellers, we pricedall transactions on the date of transfer and then determined the net positionrelative to the end or beginning of the year. For those who bought and soldthe same book value amount, we priced all transactions on the day of
Table 5. Unique sellers by total number of transactions and profession (final classification)
Tran
sact
ions
Agr
icul
ture
Bui
ldin
g tr
ades
Com
mer
ce
Fin
anci
al
Man
ufac
turi
ng
Mar
itim
e
Mili
tary
Pro
fess
ions
Ser
vant
s
Ser
vice
s
Titl
ed-m
en
Titl
ed-w
omen
Tota
l
1 7 11 371 36 68 13 42 42 6 63 472 271 14022 1 2 125 12 17 2 13 19 1 19 181 90 4823 0 1 69 8 13 0 4 3 0 4 86 20 2084 0 0 39 4 6 0 4 2 0 1 37 8 1015 0 0 26 6 2 0 0 2 0 1 20 6 636 0 0 13 5 1 0 3 1 0 2 14 3 427 0 0 14 3 1 0 4 0 0 0 7 0 298 0 0 7 2 0 0 0 0 0 0 5 0 149 0 0 7 1 0 0 1 1 0 1 8 0 19
10 0 0 3 1 0 0 0 0 0 0 6 1 1111 0 0 5 3 0 0 0 0 0 0 2 0 1012 0 0 2 2 0 0 0 0 0 0 1 0 513 0 0 5 1 0 0 0 0 0 0 2 0 814 0 0 2 1 0 0 0 0 0 0 0 0 315+ 0 0 26 9 1 0 0 0 0 1 12 1 50
Total 8 14 714 94 109 15 71 70 7 92 853 400 2447
Unique buyers by total number of transactions and profession (final classification)
Tran
sact
ions
Agr
icul
ture
Bui
ldin
g tr
ades
Com
mer
ce
Fin
anci
al
Man
ufac
turi
ng
Mar
itim
e
Mili
tary
Pro
fess
ions
Ser
vant
s
Ser
vice
s
Titl
ed-m
en
Titl
ed-w
omen
Tota
l1 5 7 381 40 64 6 41 40 5 58 500 255 14022 1 3 159 13 20 0 14 11 1 19 158 72 4713 0 0 60 9 10 0 5 4 0 9 94 21 2124 0 0 51 3 7 0 1 4 0 1 33 8 1085 0 1 26 6 1 0 1 0 0 0 26 1 626 0 0 13 4 0 0 3 0 0 0 11 2 337 0 0 10 2 0 0 1 0 0 0 7 0 208 0 0 10 0 0 0 1 0 0 1 6 0 189 0 0 5 1 1 0 0 0 0 0 7 0 14
10 0 0 2 1 0 0 1 0 0 0 3 0 711 0 0 6 2 1 0 1 1 0 3 2 0 1612 0 0 4 0 0 0 0 0 0 1 3 0 813 0 0 7 0 0 0 1 1 0 0 1 0 1014 0 0 1 2 0 0 0 0 0 0 3 0 615+ 0 0 26 7 0 0 0 0 0 0 17 1 51
Total 6 11 761 90 104 6 70 61 6 92 871 360 2438
Source: See table 1

516 ANN M. CARLOS AND LARRY NEAL
© Economic History Society 2005Economic History Review, LIX, 3 (2006)
transfer and then estimated their net gain or loss on the transactions.Measured over all market participants, we find a net negative position of£7 per person. However, this was not uniformly distributed. There weregainers and losers. In aggregate, the men who participated in the marketlost money and the women made money. Men lost on average £14 perperson while women gained roughly £25 per person.49
Table 6 shows the distribution of gains and losses within each of the sevenpossibilities for customer transactions and by gender. What is immediatelyevident is that there were gainers and losers in each category and for bothmen and women. As might be expected, those who only purchased or thosewho were net purchasers had higher losses than those who sold during theBubble. But even here investors could and did make money. These werepeople who purchased at a point where the market price was lower than theprice on December 31. Indeed, relative to 31 December 1720, pricesdeclined until 1722 and then rose gradually, ending in 1725 at 140, asdescribed in figure 4. What is also apparent is that women generally tendedboth to have smaller losses and smaller gains than men. In the case ofmultiple purchases, women had bigger gains per head and bigger losses perhead than the men in the same category.50 For women, there is no difference
49 This finding is in line with recent research on gender and markets. See Barber and Odean, ‘Boyswill be boys’.
50 We are in the process of exploring the timing of transactions by investors within each category. Inparticular, we want to examine how investors responded to changes in the market price in the precedingfew days or weeks.
Figure 4. Bank stock, 1720–25
0
50
100
150
200
250
300
0
1/1/20
6/24/2
0
12/16
/20
6/9/21
12/1/
21
5/25/2
2
11/16
/22
5/10/2
3
11/1/
23
4/24/2
4
10/16
/24
4/9/25
Perc
ent o
f pa
r

EARLY LONDON CAPITAL MARKET FOUNDATIONS 517
© Economic History Society 2005Economic History Review, LIX, 3 (2006)
Tab
le 6
.Va
lue
of g
ains
and
loss
es b
y ge
nder
, and
by
freq
uenc
y an
d ty
pe o
f m
arke
t ac
tivity
Men
Wom
en
Gai
nsL
osse
sG
ains
Los
ses
£N
umbe
rga
in/c
ap£
Num
ber
loss
/cap
£N
umbe
rga
in/c
ap£
Num
ber
loss
/cap
Sin
gle
purc
hase
3,50
216
022
−144
,062
514
−280
530
3416
−34,
210
122
−280
Mul
tipl
e pu
rcha
ses
5,43
339
139
−166
,031
206
−806
3,31
78
415
−36,
392
35−1
,040
Sin
gle
sale
159,
302
727
219
−7,2
1220
1−3
633
,450
137
244
−1,2
1147
−26
Mul
tipl
e sa
les
150,
028
182
824
−7,5
4386
−88
22,9
0241
559
−1,2
1720
−61
Net
pur
chas
es74
,653
111
673
−346
,494
234
−1,4
814,
188
1429
9−8
,830
20−4
41B
uy =
sel
l11
9,51
526
545
1−4
5,38
021
2−2
1415
,235
5229
3−1
,926
18−1
07N
et s
ales
207,
462
186
1,11
5−4
8,14
511
0−4
3821
,222
3266
3−2
,005
14−1
43
Tot
al71
9,89
61,
670
431
−764
,867
1,56
3−4
8910
0,84
531
831
7−8
5,79
127
6−3
11
Sou
rce:
See
tab
le 1

518 ANN M. CARLOS AND LARRY NEAL
© Economic History Society 2005Economic History Review, LIX, 3 (2006)
in the conduct of widows or spinsters across the bubble. Some widows gainand some lose, and similarly for spinsters.51
Gains and losses for men can be examined by occupational classificationshown in table 7. Here we use our intermediate classification. In terms ofaggregate gainers and losers, more people gained than lost. There were 13groups that had net gains and only six groups with net losses. It is the largelosses generated by ‘gentlemen’ and ‘merchants’ that drives the overall netloss position for men. When we look at the absolute number of individuals ineach category who had a capital gain relative to those with a capital loss, thepattern is quite different as shown in table 8. In 10 of the groups, more menlost money than gained through their transactions. Although 605 gentlemenhad positive gains from the market, 549 experienced a loss, and their losseswere very large. For merchants, there were fewer merchants experiencinggains relative to those who lost.52 In the food sector, 205 individuals had anaggregate gain similar to the aggregate loss of 63 men. We have, therefore, tobe careful in our understanding of market experience. Is it the size of thegain or loss, or the number of people with a positive or negative experiencethat will determine a perception of the market as a risky environment?
As a result of the increased trading in Bank of England stock thatoccurred during the Bubble, by the time the semi-annual dividend was duein October 1720, the then-existing ledger books, which had been openedin 1711, were filled up.53 As a result, a new set of ledgers was begun on 29September 1720. These ledger books were themselves closed in September1725. The alphabets to the stock ledgers record the full name of theshareholder, his or her address, occupation, and social or marital status.The stock ledgers then record the book value of stock held, the folio numberwhere the account had been kept in the previous set of ledgers (which coverthe period from 1711 to September 1720), and where the account wasplaced in the current set of ledgers. And, if the stockholder persisted inholding the stock after the end of September 1725 when this set of ledgerswas full, the clerks noted the new folio number where the stockholder’stransactions were recorded. Thus, in addition to the social status, occupa-tion, gender, and address, the ledgers provide a measure of persistence ofshareholding across time.54 In comparison to the transfer books, whichshowed who was active in the market in 1720, these ledgers show theaggregate pattern of holdings by all shareholders, and thus allow us to
51 For a complete discussion of women in the market, see Carlos and Neal, ‘Women investors’.52 In order not to bias the results, we have not included the 15 people most involved in purchases and
sales of Bank stock. Therefore, these data do not reflect the gains and/or losses of Sir George Caswall,Robert Westley, James Martin, Francis Pereira, Abraham Craiesteyn, Samuel Strode, Solomon Pereira,Thomas Houghton, Gerard Bolwerk, Moses Hart, Robert Tothill, Anthony da Costa, Johanna Cock,and Philip Vanenderen.
53 In fact, the influx of new stockholders before the dividend date had been so large that, to accom-modate them, a supplementary ledger had been opened, and then an extra supplementary ledger.
54 The alphabet ledgers also record miscellaneous information with respect to death, bankruptcies,probates, trusts, guardianships, and powers of attorney in order to help clerks determine what legalrestrictions applied to the disposal of certain stockholdings.

EARLY LONDON CAPITAL MARKET FOUNDATIONS 519
© Economic History Society 2005Economic History Review, LIX, 3 (2006)
Tab
le 7
.Va
lue
of g
ains
and
loss
es b
y oc
cupa
tion,
and
by
freq
uenc
y an
d ty
pe o
f mar
ket a
ctiv
ity (
inte
rmed
iate
cla
ssifi
catio
n)
Occ
upat
iona
lcl
assi
ficat
ion
Sin
gle
purc
hase
Mul
tiple
pur
chas
esS
ingl
e sa
leM
ultip
le s
ales
Pur
chas
e =
sale
sN
et b
uyer
Net
sel
ler
Tota
l(£
)G
ains
(£)
Los
ses
(£)
Gai
ns(£
)L
osse
s(£
)G
ains
(£)
Los
ses
(£)
Gai
ns(£
)L
osse
s(£
)G
ains
(£)
Los
ses
(£)
Gai
ns(£
)L
osse
s(£
)G
ains
(£)
Los
ses
(£)
Agr
icul
ture
10−3
4816
509
−10
200
−60
252
569
Bui
ldin
g tr
ades
−337
70−1
454
1−5
3−6
615
4−5
164
−394
126
−237
−52
Chu
rch
41−1
8813
−93
5,05
8−5
61,
356
250
43−1
,643
4,78
0D
eale
r7
−853
−6,1
502,
442
−114
−10
6,81
698
9−7
2853
7−1
912,
746
Dec
ease
d9,
266
−13
234
−26
19,5
37−8
,352
20,6
46F
inan
cial
51−2
,765
12−3
,199
2,25
1−2
4925
5−1
91,
254
2,73
33,
612
−35,
452
1,81
9−6
66−3
0,36
4F
ood
55−1
,273
−2,3
204,
845
−203
1,11
9−8
508
−991
636
−2,7
0553
,130
−13,
462
39,3
32G
entl
eman
1,42
5−6
6,96
42,
566
−51,
521
56,5
92−3
,448
64,8
47−3
,043
41,0
24−1
4,71
522
,072
−120
,980
3,84
3−2
79−6
8,58
2M
anuf
actu
ring
94−2
,692
−4,4
571,
056
−41
1,97
2−3
41,
500
−565
1,00
9−1
5750
9−1
,806
Mar
itim
e16
1,94
253
321
0−9
064
,396
−15,
631
51,3
76M
erch
ant
591
−30,
511
2,06
1−6
3,33
829
,774
−877
52,5
18−2
,132
17,2
74−1
7,06
731
,592
−139
,694
27,4
24−8
12−9
3,19
6M
ilita
ry42
1−6
,731
61−4
,122
5,40
0−2
265,
774
−517
15,2
00−3
542,
267
−10,
341
7,91
9−1
,862
12,8
89N
obili
ty11
3−6
,807
275
−11,
643
7,01
9−8
717,
458
−1,1
7014
,375
−5,7
916,
573
−12,
163
2,83
8−9
511
2P
rofe
ssio
ns15
5−4
,726
100
−2,2
133,
901
−178
3,55
4−2
212,
634
−198
2,54
0−3
,650
1,69
8S
erva
nts
15−1
,389
−99
2,34
7−1
−48
3,99
5−3
,827
993
Ser
vice
s18
8−4
,039
24−9
,441
8,50
9−2
781,
367
−102
3,50
6−1
,364
−3,7
978,
122
−2,2
4744
8S
hopk
eepe
r12
4−8
,339
22−6
,093
11,4
88−2
064,
285
−98
8,79
3−6
,114
2,02
2−3
,414
5,20
9−4
837,
197
Tex
tile
32−2
,002
26−8
032,
295
−182
607
1,29
3−6
5674
7−5
,159
78−3
,724
Unk
now
n16
4−4
,101
188
−525
4,06
9−2
063,
950
−96
4,72
6−9
713
6−6
,218
7,98
09,
970
Tot
al3,
502
−144
,063
5,43
3−1
66,0
3115
9,30
4−7
,212
150,
028
−7,5
4311
9,51
5−4
5,38
074
,653
−346
,494
207,
462
−48,
145
−44,
969

520 ANN M. CARLOS AND LARRY NEAL
© Economic History Society 2005Economic History Review, LIX, 3 (2006)
Tab
le 8
.N
umbe
r of
gai
ners
and
lose
rs b
y oc
cupa
tion,
and
by
freq
uenc
y an
d ty
pe o
f m
arke
t ac
tivity
(i
nter
med
iate
cla
ssifi
catio
n)
Occ
upat
iona
lC
lass
ifica
tion
Sin
gle
purc
hase
Mul
tiple
pu
rcha
ses
Sin
gle
sale
Mul
tiple
sal
esP
urch
ase
= sa
les
Net
buy
erN
et s
elle
r
Win
ners
Los
ers
Win
ners
Los
ers
Win
ners
Los
ers
Win
ners
Los
ers
Win
ners
Los
ers
Win
ners
Los
ers
Win
ners
Los
ers
Agr
icul
ture
12
14
11
11
Bui
ldin
g tr
ades
41
13
11
31
12
11
Chu
rch
23
11
101
31
11
Dea
ler
15
35
21
23
21
1D
ecea
sed
71
11
1316
Fin
anci
al3
102
87
42
111
93
137
2F
ood
410
613
73
13
73
649
35G
entl
eman
6120
88
7131
988
7334
9863
4182
53
Man
ufac
turi
ng7
135
101
71
69
42
1M
arit
ime
18
12
247
31M
erch
ant
3211
113
5971
3249
2149
5132
6910
3M
ilita
ry6
153
818
86
49
63
97
2N
obili
ty6
203
716
1111
710
85
115
1P
rofe
ssio
ns6
161
511
95
35
43
2S
erva
nts
14
14
13
96
Ser
vice
s7
221
915
66
44
1913
118
8S
hopk
eepe
r8
382
1335
1411
530
247
1910
1T
exti
le4
111
314
42
78
28
1U
nkno
wn
1022
26
1610
32
103
27
2
Tot
al16
051
439
206
727
201
182
8626
521
211
123
418
611
0
Sou
rce:
See
tab
le 1

EARLY LONDON CAPITAL MARKET FOUNDATIONS 521
© Economic History Society 2005Economic History Review, LIX, 3 (2006)
understand who was holding Bank shares after the Bubble relative to thosewho were trading Bank stock in the market during the Bubble.
The four ledgers generate a set of 7,924 individuals who owned sharesin the Bank of England sometime between September 1720 and September1725.55 Over this five-year period, 6,284 of the shareholders were men and1,640 (nearly 21 per cent) were women. If we look only at those who heldshares at the end of September 1720, we have 3,163 shareholders, of whom640 or 20 per cent were women. So while men made up from 85 per centto 90 per cent of transfer activity during the Bubble period (depending ondefinition of activity), they comprised only 80 per cent of total ownershipof Bank stock at the end of 1720. These results are the same as those foundby Dickson.56 Of course, people held shares for different reasons. Some mayhave been involved in the market for speculative gains, while others heldshares for long-term income/dividend flows. Despite their speculative gains,women appear somewhat more conservative overall than men in terms oftheir activity in the market, and also over more risky assets such as the RoyalAfrican Company stock.
Altogether, while there were close to 8,000 differently named share-holders, these might not represent separate households. Sons and daugh-ters, widows and spinsters, nieces and nephews holding individualaccounts may or may not have lived in a single household, or even whenliving apart may or may not have been independent investors. Given theserecords, we will not be able to resolve totally the level of independence ofindividual shareholders. But can we ask how many unique surnames therewere? On the one hand, the number of unique surnames is biasedbecause we have no way to capture households related through the mar-riage of daughters. On the other hand, forcing all 63 Smiths to be relatedcreates a bias in the opposite direction. As with all relatively commonnames, we would not expect these people all to be related. In total, wehave 3,906 unique last names and 6,960 unique first and last namecombinations.57 The surnames themselves show the presence of some ofthe well-known groupings within the mercantile community. The most
55 The original entries are, of course, handwritten, so we transcribed this information into a basicspreadsheet form. The ledgers include a number of duplicate entries, so we actually started with almost9,000 holders. Variation in spelling because of entry by different clerks or because of the lack ofuniformity of spelling in the period had to be taken into account. Although variation in spelling is notan issue when one is looking at just one company, because the ultimate goal is to be able to compareownership across many different financial instruments, we had to make adjustments in the basic spellingof names to make them computer compatible. Thus the many variations of Eleanor, Matthew, or evenAnne, as well as Smith, Smyth, and Smythe were standardized. The original spellings are maintainedin the master file.
56 Dickson, Financial revolution, tabs., 36, 38, 40, 43.57 Of the other common last names, there were 45 Clarkes, 18 Brownes, 22 Edwards, 30 Halls, and
21 Taylors. The use of first name, address, and occupation allows us to differentiate between many ofthese people. This sample of shareholders in the market is considerably larger than that used by de Krey,Fractured society, or Gauci, Politics of trade, both of whom endeavoured to construct a sample toinvestigate ‘middling’ London. See ibid, p. 19. The sample used here examines a fuller range ofparticipation in the market.

522 ANN M. CARLOS AND LARRY NEAL
© Economic History Society 2005Economic History Review, LIX, 3 (2006)
evident are the Sephardic Jewish community: Henriques, Pereira, Correa,Nunes, Peixoto, Medina, Mocatta, and da Costa; and the major Hugue-not families: Des Bouverie, Houblon, and Lethieullier.58 The other dis-tinctive group is of the obviously Dutch names: van de Wall, van Beeck,and van Groenendyk, for example.
Those shareholders who were active in the market during 1720 came, aswe have seen, from London, with less than 20 per cent living outside ofLondon or England. Examination of the stock of shareholders shows amuch wider geographical distribution of shareholding. The level of detail inthe alphabet ledgers is greater than was given in the transfer ledgers. Oftenthe clerks would note the street address, most especially for those withaddresses in London. Thus, following Earle, we are able to divide many ofthose who lived in London into those who had a street address within theCity of London proper (the square mile), and those who lived in other partsof the city. In addition, we have those who resided in England but outsideof London, and those who resided outside of England.59
The breakdown of shareholder by residence is given in table 9. Of thetotal, 12 per cent of shareholders had an address outside of England, androughly 20 per cent lived outside of London. There were 5 per cent ofshareholders for whom we had no address. The remaining 64 per cent livedin the London area. Of these, at least 24 per cent lived in the City of Londonproper. For those who lived outside London, shareholders can be found inalmost every county. There is, as might be expected, a noticeable home-county effect, with 45 per cent of shareholders living in Essex, Kent,Middlesex, and Surrey. The home-county effect, however, is smaller thanfor those active during the Bubble. For those who lived outside of England,77 per cent or 725 lived in the Netherlands. The next largest group livedin Switzerland, with 95 shareholders. Belgium, Germany, and Ireland had34, 23, and 26 shareholders respectively, with a few shareholders living inDenmark, Italy, Jamaica, Poland, and Sweden. The share of Dutch share-holders active in the market is very much in line with the percentage ofshares held. The Swiss, on the other hand, held 10 per cent of foreign sharesbut represented 12 per cent of foreign selling activity.
In addition to documenting the geographical breakdown of share owner-ship, table 9 also provides information on shareholder residence over time.Using the alphabet ledgers in conjunction with the stock ledgers, we wereable to generate some information on the duration of holding by individualshareholders. The data allow us to separate the population of shareholdersdown into four groups:
58 Many of these same names could be found in the business of the Bank in bills and gold. SeeClapham, Bank of England, pp. 127, 136, 137, vol. 1; Earle, City full of people.
59 While we have considerable information for many shareholders, there were some cases where theclerk just wrote London, and 423 cases for which no information was given. Many of those for whomno address was listed are in the nobility, and would have had multiple residences. We do not includeanyone for whom we have no address.

EARLY LONDON CAPITAL MARKET FOUNDATIONS 523
© Economic History Society 2005Economic History Review, LIX, 3 (2006)
(A) those who bought and sold only in the five years of these ledgers (October1720 to September 1725), in other words after the Bubble;
(B) those who owned shares during the bubble (or prior to October 1720) but soldout before September 1725;
(C) those who bought shares after September 1720 and continued to hold themafter September 1725; and
(D) those who held shares prior to the opening of the new ledgers and continuedafter they closed.
Although this breakdown gives us a measure of duration, these are notabsolute measures because we do not pinpoint the exact date on whichthe shareholder bought and sold. What these data do show is that 2,022 or25 per cent of the shareholders held shares from before September 1720
Table 9. Residence of stockholders
(raw numbers)
Location All obs A B C D
Foreign 940 133 63 582 162Outside London 1542 269 229 631 413London outside City 3120 709 553 980 878City of London 1900 560 258 698 384Unknown 422 62 73 102 185
Total 7924 1733 1176 2993 2022
(percentages)
Location All obs A B C D
Foreign 11.86% 1.68% 0.80% 7.34% 2.04%Outside London 19.46% 3.39% 2.89% 7.96% 5.21%London outside City 39.37% 8.95% 6.98% 12.37% 11.08%City of London 23.98% 7.07% 3.26% 8.81% 4.85%Unknown 5.33% 0.78% 0.92% 1.29% 2.33%
Total 100.00% 21.87% 14.84% 37.77% 25.52%
(column percentages)
Location All obs A B C D
Foreign 11.86% 7.67% 5.36% 19.45% 8.01%Outside London 19.46% 15.52% 19.47% 21.08% 20.43%London outside City 39.37% 40.91% 47.02% 32.74% 43.42%City of London 23.98% 32.31% 21.94% 23.32% 18.99%Unknown 5.33% 3.58% 6.21% 3.41% 9.15%
Total 100.00% 100.00% 100.00% 100.00% 100.00%
Notes:All obs = All shareholdersA = Bought or sold only in five years of the ledgers (October 1720 to September 1725)B = Held during the Bubble but sold out by September 1725C = Bought shares after September 1720 and continued to hold after September 1725D = Held shares prior to the opening of the ledgers (September 1720) and continued to hold after their close(September 1725)Source: Source: Bank of England—Alphabet ledgers AC 27/430–433, stock ledgers AC/6439–6450, and text

524 ANN M. CARLOS AND LARRY NEAL
© Economic History Society 2005Economic History Review, LIX, 3 (2006)
until after September 1725. In total, 40 per cent (B + D) of these shareholdersowned shares during the Bubble period, and 60 per cent of the shareholdersbought their shares after the end of the South Sea Bubble. There is, however,differential movement in and out of Bank of England shares by location ofshareholder (shown in panel C). What we see is a disproportionately higherrelative entry of foreign shareholders after the South Sea Bubble. By 1725,Dutch shareholders owned 16.4 per cent of the capital stock.60
As noted earlier, the capital stock of the Bank increased by £3.5 millionin 1723. This brought the capitalized value of the Bank from £5.5 to roughly£9 million.61 From the ledgers, we have ascertained who purchased thisnew subscription. In total, 1,661 individuals purchased this new offering.Half of these subscribers (818) were first-time subscribers of Bank ofEngland shares. Indeed, for 650 (or 74 per cent) of these 818 first-timesubscribers, this purchase represented their only purchase of Bank stockduring the life of these ledgers. The other 843 purchasers already held Bankstock. But for this group, only 49 per cent continued to hold shares afterthe close of the ledgers. The first-time buyers also tended to be predomi-nantly male. Whereas in the whole population women comprised somewhatover 20 per cent of all shareholders, they accounted for 15 per cent of first-time buyers. Only 4 per cent of these new shareholders were foreign. Theseshares were bought predominantly by those resident in England. Of thosewho lived outside London, there is an even stronger home-county biasamong these first-time buyers, with 63 per cent having addresses in Essex,Kent, Middlesex, and Surrey relative to 55 per cent of continuing buyers.
The mean purchase for this new issue was £1,989, but the variance wasvery large. The modal and median purchase was the same as for the trans-fers, £500 and £1000 book value of stock. There were six individuals whohad purchases of more than £30,000 book value of shares. The single largestpurchaser of this issue was James Martin, a goldsmith. He bought £96,200book value of shares. He was followed by Thomas, the Earl of Pembroke,who purchased £65,000. William Wilson, a woollen draper by occupationbought £40,000; Robert Westley, a merchant tailor, £34,700; and BarentGompertz, a merchant, £34,000. Charles Selwyn, esquire, purchased£31,500.62 At the lower end were 12 purchases of £100 book valueamounts, with another 46 individuals purchasing either £200 or £250. Theoccupations among this group of small purchasers look remarkably similarto the purchasers of large amounts: goldsmith, broker, gentleman, tailor,vintner, and surgeon.
60 Dickson, Financial revolution, pp. 311–12 and Clapham, Bank of England, vol. 1, p. 282, imply thatthe Dutch were the predominant shareholding group. Dutch shareholders are an important group, butthey hold roughly the same percentage, for example, as do women.
61 The increase in capital stock was part of the solution to the South Sea debacle. This issue matchedan amount of government debts taken over from the South Sea Company.
62 Two of the six largest purchasers were also in the top 15 major brokers of Bank stock during theBubble—James Martin and Robert Westley.

EARLY LONDON CAPITAL MARKET FOUNDATIONS 525
© Economic History Society 2005Economic History Review, LIX, 3 (2006)
From the transfer books, we noted that roughly 70 per cent of all transferswere undertaken by those with occupations in commerce (dealers, foodmerchants, and shopkeepers) and titled-men. From the stock ledgers, wehave a measure of the occupational dispersion of shareholding for all share-holders during these five years after the Bubble, shown in table 10 for bothintermediate and final occupational classifications. The relative size of aggre-gate shareholding by those in commerce was only 24.2 per cent of the total,while titled-men held 33 per cent of the stock. The holdings by titled-menare the same as the percentage of market activity during the Bubble.Men in commerce, on the other hand, owned 24.2 per cent of shares afterthe Bubble, but comprised 38.6 per cent of all buyer transactionsand 37 per cent of all seller transactions. In contrast, women owned20.56 per cent of shares, but had been involved in less than 10 per cent oftransactions. Clapham notes that the peerage was better represented in 1721relative to 1701, yet from the Bank of England records we know that nobilitymade up only 4 per cent by this time. These data reinforce the role ofcommerce-based occupations in the market for Bank of England sharesduring the Bubble period. What needs to be investigated is whether thisconduct carried over to transactions in the shares of other companies. Thecommerce, financial and manufacturing sectors were predominantlyLondon-based; shareholders who had an occupation in commerce lived toa greater extent than any other group within the City of London proper(40.45 per cent) and outside of England (38 per cent). The titled-men groupare distributed more equally across all areas: 18.4 per cent in the City;38 per cent in London outside of the City; 45 per cent in England outsideof London; and 30 per cent outside of England. Women shareholders werequite equally distributed across all regions. Location would, of course,increase ease of access to the market.
There is a depth and breadth to the holding of Bank of England stock,both in terms of geographical distribution of holdings and also in terms ofthe occupational structure of the shareholdings. Shares were held acrossEngland and beyond, and by individuals down the social and occupationalladder. Servants and shopkeepers, as well as lords and duchesses, ownedshares. Of course, one would expect there to be differences by wealth orincome. Unfortunately, good measures of individual levels of wealth do notexist. From the work of Lindert, we know that London merchants andshopkeepers had wealth levels greater than found in other parts of thecountry. This, perhaps, helps explain the broad distribution of shareownership in London. What we are able to accomplish using the shareledgers is an examination of average holdings of Bank of England shares byoccupational class for September 1720, when these ledgers were opened,relative to September 1725, when they closed. It was also during this periodthat the capital stock of the Bank increased by £3.5 million. A useful statisticto keep in mind before we examine the distribution of shareholdings indetail below is that the summary Gini coefficient for the distribution of

526 ANN M. CARLOS AND LARRY NEAL
© Economic History Society 2005Economic History Review, LIX, 3 (2006)
Tab
le 1
0.D
ispe
rsio
n of
sha
reho
ldin
g by
occ
upat
iona
l cla
ssifi
catio
n (i
nter
med
iate
and
fina
l)
Raw
num
bers
Inte
rmed
iate
:A
ll ob
sA
BC
DF
inal
:A
ll ob
sA
BC
D
Agr
icul
ture
355
88
14A
gric
ultu
re35
58
814
Bui
ldin
g tr
ades
479
818
12B
uild
ing
trad
es47
98
1812
Dea
ler/
trad
er63
2311
1712
(Com
mer
ce)
——
——
—F
ood
152
3632
5232
(Com
mer
ce)
——
——
—M
erch
ant
1266
318
163
510
275
(Com
mer
ce)
——
——
—S
hopk
eepe
r43
810
573
141
119
Com
mer
ce19
1848
227
972
043
7F
inan
cial
165
6624
3837
Fin
anci
al16
566
2438
37M
anuf
actu
ring
170
4519
5947
(Man
ufac
turi
ng)
——
——
—T
exti
le19
045
3156
58M
anuf
actu
ring
360
9050
115
105
Mar
itim
e55
1111
1914
Mar
itim
e55
1111
1914
Mili
tary
176
4327
7036
Mili
tary
176
4327
7036
Oth
er33
13
821
Oth
er32
13
820
Chu
rch
648
722
27(P
rofe
ssio
ns)
——
——
—P
rofe
ssio
ns16
126
3155
49P
rofe
ssio
ns22
534
3877
76S
erva
nts
293
77
12S
erva
nts
293
77
12S
ervi
ces
318
5841
144
75S
ervi
ces
318
5841
144
75G
entl
emen
2358
549
320
917
572
(Tit
led-
men
)—
——
——
Nob
ility
-men
272
4257
9578
Tit
led-
men
2630
591
377
1012
650
Wom
en15
0726
822
064
437
5(W
omen
)—
——
——
Nob
ility
-wom
en65
1210
2617
Wom
en16
3629
023
668
842
2U
nkno
wn
360
6073
8714
0U
nkno
wn
298
5067
6911
2
Tot
al79
2417
3311
7629
9320
22T
otal
7924
1733
1176
2993
2022

EARLY LONDON CAPITAL MARKET FOUNDATIONS 527
© Economic History Society 2005Economic History Review, LIX, 3 (2006)
Perc
enta
ge
Inte
rmed
iate
:A
ll ob
sA
BC
DF
inal
:A
ll ob
sA
BC
D
Agr
icul
ture
0.44
%0.
06%
0.10
%0.
10%
0.18
%A
gric
ultu
re0.
44%
0.06
%0.
10%
0.10
%0.
18%
Bui
ldin
g tr
ades
0.59
%0.
11%
0.10
%0.
23%
0.15
%B
uild
ing
trad
es0.
59%
0.11
%0.
10%
0.23
%0.
15%
Dea
ler/
trad
er0.
80%
0.29
%0.
14%
0.21
%0.
15%
(Com
mer
ce)
——
——
—F
ood
1.92
%0.
45%
0.40
%0.
66%
0.40
%(C
omm
erce
)—
——
——
Mer
chan
t15
.98%
4.01
%2.
06%
6.44
%3.
47%
(Com
mer
ce)
——
——
—S
hopk
eepe
r5.
53%
1.33
%0.
92%
1.78
%1.
50%
Com
mer
ce24
.20%
6.08
%3.
52%
9.09
%5.
51%
Fin
anci
al2.
08%
0.83
%0.
30%
0.48
%0.
47%
Fin
anci
al2.
08%
0.83
%0.
30%
0.48
%0.
47%
Man
ufac
turi
ng2.
15%
0.57
%0.
24%
0.74
%0.
59%
(Man
ufac
turi
ng)
——
——
—T
exti
le2.
40%
0.57
%0.
39%
0.71
%0.
73%
Man
ufac
turi
ng4.
54%
1.14
%0.
63%
1.45
%1.
33%
Mar
itim
e0.
69%
0.14
%0.
14%
0.24
%0.
18%
Mar
itim
e0.
69%
0.14
%0.
14%
0.24
%0.
18%
Mili
tary
2.22
%0.
54%
0.34
%0.
88%
0.45
%M
ilita
ry2.
22%
0.54
%0.
34%
0.88
%0.
45%
Oth
er0.
42%
0.01
%0.
04%
0.10
%0.
27%
Oth
er0.
40%
0.01
%0.
04%
0.10
%0.
25%
Chu
rch
0.81
%0.
10%
0.09
%0.
28%
0.34
%(P
rofe
ssio
ns)
——
——
Pro
fess
ions
2.03
%0.
33%
0.39
%0.
69%
0.62
%P
rofe
ssio
ns2.
84%
0.43
%0.
48%
0.97
%0.
96%
Ser
vant
s0.
37%
0.04
%0.
09%
0.09
%0.
15%
Ser
vant
s0.
37%
0.04
%0.
09%
0.09
%0.
15%
Ser
vice
s4.
01%
0.73
%0.
52%
1.82
%0.
95%
Ser
vice
s4.
01%
0.73
%0.
52%
1.82
%0.
95%
Gen
tlem
en29
.76%
6.93
%4.
04%
11.5
7%7.
22%
(Tit
led-
men
)—
——
——
Nob
ility
-men
3.43
%0.
53%
0.72
%1.
20%
0.98
%T
itle
d-m
en33
.19%
7.46
%4.
76%
12.7
7%8.
20%
Wom
en19
.02%
3.38
%2.
78%
8.13
%4.
73%
(Wom
en)
——
——
—N
obili
ty-w
omen
0.82
%0.
15%
0.13
%0.
33%
0.21
%T
itle
d-w
omen
20.6
5%3.
66%
2.98
%8.
68%
5.33
%U
nkno
wn
4.54
%0.
76%
0.92
%1.
10%
1.77
%U
nkno
wn
3.76
%0.
63%
0.85
%0.
87%
1.41
%
Tot
al10
0.00
%21
.87%
14.8
4%37
.77%
25.5
2%T
otal
100.
00%
21.8
7%14
.84%
37.7
7%25
.52%
Sou
rce:
See
tab
le 9
and
tex
t

528 ANN M. CARLOS AND LARRY NEAL
© Economic History Society 2005Economic History Review, LIX, 3 (2006)
shareholdings across all shareholders in 1720 was 0.626, and, at 0.638, hadscarcely changed by 1725. While indicating a much higher degree of ine-quality than Lindert (1983) found for income distribution in England inthe years 1688 and 1759, these Gini coefficients indicate that shareholdingin Bank stock was likely more equally distributed than other forms of wealthin the English economy of the time.63
The average shareholding had increased from £1,781 in 1720 to £1,820in 1725. In table 11 and figure 5, we give measures of the book value ofshare holding by occupational classification for these two dates.64 Table 11gives the mean and the median holding, the minimum and maximumholdings by occupational class, the numbers in each occupational group,the standard deviation, and a Z test. While the minimum holding cannotbe zero or negative, the maximum that any one person could hold wasbounded only by personal wealth or access to credit. Reflecting the datapresented earlier, commerce and titled-men both have individual sharehold-ers with extremely large book value holdings of bank stock.
For commerce, the minimum book value holding was £5, while themaximum was £109,605. The maximum was held by Francis Pereira, amember of the Sephardic Jewish community, whose occupation is given asa merchant. Francis Pereira was also one of the top 15 most active share-holders during the bubble period, when he made 82 separate purchases ofBank stock and had 42 separate sales. His net position from that activitywas a book value acquisition of over £33,000 across the Bubble year 1720.His positive balance in Bank stock increased in the next five years to
63 Lindert, ‘Lucrens Angliae’, p. 98, found Gini coefficients of 0.468 among 13 classes of householdsand single individuals, rising to 0.487 in 1759 among the same 13 classes.
64 Here we include only those shareholders who held a positive amount of stock on each of these twodates.
Figure 5. Mean book value of shareholding by occupation: 1720 and 1725Source: Stock ledgers of the Bank of England—1720–1725 AC 27/6439–6450
0
500
1000
1500
2000
2500
Agricu
lture
Army
Buildin
g Trad
es
Commerc
e
Financ
ial
Man
ufac
turing
Mari
time
Other
Profes
sions
Servan
ts
Service
s
Titled
-men
Unkno
wn
Wom
en
Occupations
Mea
n bo
ok v
alue
of
hold
ings
Mean1720
Mean1725
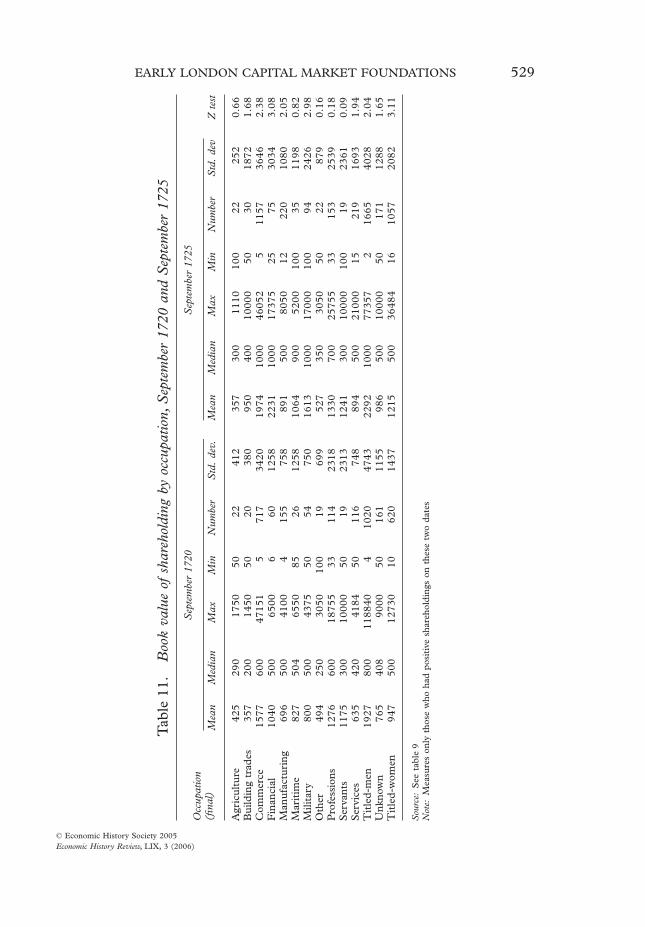
EARLY LONDON CAPITAL MARKET FOUNDATIONS 529
© Economic History Society 2005Economic History Review, LIX, 3 (2006)
Tab
le 1
1.B
ook
valu
e of
sha
reho
ldin
g by
occ
upat
ion,
Sep
tem
ber
1720
and
Sep
tem
ber
1725
Occ
upat
ion
(fina
l)
Sep
tem
ber
1720
Sep
tem
ber
1725
Z t
est
Mea
nM
edia
nM
axM
inN
umbe
rS
td.
dev.
Mea
nM
edia
nM
axM
inN
umbe
rS
td.
dev
Agr
icul
ture
425
290
1750
5022
412
357
300
1110
100
2225
20.
66B
uild
ing
trad
es35
720
014
5050
2038
095
040
010
000
5030
1872
1.68
Com
mer
ce15
7760
047
151
571
734
2019
7410
0046
052
511
5736
462.
38F
inan
cial
1040
500
6500
660
1258
2231
1000
1737
525
7530
343.
08M
anuf
actu
ring
696
500
4100
415
575
889
150
080
5012
220
1080
2.05
Mar
itim
e82
750
465
5085
2612
5810
6490
052
0010
035
1198
0.82
Mili
tary
800
500
4375
5054
750
1613
1000
1700
010
094
2426
2.98
Oth
er49
425
030
5010
019
699
527
350
3050
5022
879
0.16
Pro
fess
ions
1276
600
1875
533
114
2318
1330
700
2575
533
153
2539
0.18
Ser
vant
s11
7530
010
000
5019
2313
1241
300
1000
010
019
2361
0.09
Ser
vice
s63
542
041
8450
116
748
894
500
2100
015
219
1693
1.94
Tit
led-
men
1927
800
1188
404
1020
4743
2292
1000
7735
72
1665
4028
2.04
Unk
now
n76
540
890
0050
161
1155
986
500
1000
050
171
1288
1.65
Tit
led-
wom
en94
750
012
730
1062
014
3712
1550
036
484
1610
5720
823.
11
Sou
rce:
See
tab
le 9
Not
e:M
easu
res
only
tho
se w
ho h
ad p
osit
ive
shar
ehol
ding
s on
the
se t
wo
date
s

530 ANN M. CARLOS AND LARRY NEAL
© Economic History Society 2005Economic History Review, LIX, 3 (2006)
£114,840. Pereira purchased £24,000 in the 1723 stock offer, but resold£18,768. The next three largest shareholders in this occupational groupwere Anthony da Costa, Solomon de Moses Pereira, and AbrahamCraiesteyn, each of whom is listed as a merchant living in London andwere also in the top 15 measured by activity across 1720. However, theyheld merely one-third the book value of Francis Pereira at £47,151,£42,052, and £39,450 respectively in September 1720. By 1725, Solomonde Moses Pereira and Abraham Craeisteyn increased their holdings to£46,000, while Anthony da Costa reduced the book value of his holdingsto £36,878 by that same date. Given the very extreme position held byFrancis Pereira, the figures given in table 11 do not include his holdings;rather they reflect the holdings for all the other shareholders in this group.The mean holding in commerce is £1,577, but rises to £1,729 if weinclude Pereira. The minimum amount of bank stock held in this groupwas £5 held by Benjamin Poole, a merchant, who had the same book valueof holdings in September 1725. The median holding is considerably lessthan the mean at £600.
The titled-men category again reflects the large holdings by some mem-bers of this group.65 The two largest shareholders listed were Sir Peter Delméand John, Duke of Marlborough. Peter Delmé had a book value of holdingsof £118,840 at the end of 1720. Indeed, he again was one of the top 15most active in terms of transactions during the Bubble. If we were not toinclude his holdings in the titled-men group, the mean book value ofholdings falls only from £1,927 to £1,884. John, Duke of Marlborough,had a book value of holdings of £74,805 by the end 1720. The records showthat his holdings had increased to £83,355 by 1725. However, the Duke ofMarlborough died in 1722. Depending on the disposition of his holdings,this could increase the holdings of his wife Sarah, who already held £36,000book value of stock in her own right, to £119,355. We did not include theholdings of the Duke of Marlborough in the 1725 calculations in table 11.All of the remaining 1,019 shareholders in this group had individual hold-ings of less than £30,000 book value. Indeed, the median holding was £800,while the smallest amount was held by Sir Joseph Hodges, with a book valueof £4. The median holding increased from £800 to £1000 over these fiveyears.
Over the five years from the end of 1720, the mean holdings in allgroups but agriculture increased. What is evident, however, is that theincreases were not evenly distributed. In some occupational categories,the mean changed by very little, including maritime, other, professions,and servants. In building trades, financial, manufacturing, military, ser-vices, and women, the mean holding increased. Indeed, the mean holding
65 We did not include John Hanger, John Rudge, Thomas Scawen, and Gerard Conyers, each of whomwere listed as holding £200,000 plus book value of stock. This reflects stock mortgaged to the Bank byindividual shareholders and not personal holdings.

EARLY LONDON CAPITAL MARKET FOUNDATIONS 531
© Economic History Society 2005Economic History Review, LIX, 3 (2006)
tripled for building trades, doubled for military, nearly doubled for finan-cial, and merely increased by £200 for the service category. Without a lotmore information on the individual portfolio histories, we can only makesome very general inferences about these changes. The increases, how-ever, are significant at either the 5 or 10 per cent level. Interestingly,maritime and professions as well as military, services, and women allexperienced positive gains as a result of activity during the Bubble period,but it is only in the latter three that we see significant increases in meanholdings. By 1725, the figure for mean holdings for women was greaterthan for building trades, manufacturing, maritime, other, services, andunknown. Building trades and manufacturing had net losses as a result ofmarket activity, even though the losses in the building trades group cameto less than £3 per head. Manufacturing also experienced net losses, butthe number of people who actually gained was greater than of those wholost.
IV
While we cannot determine the specific motives of each investor, or eventhe motives for each occupation, location, gender, or social class of investor,we see clearly that, whatever the motives of the Bank’s shareholders in1720, they probably did not change all that much over the five yearsfollowing of the collapse of the bubble. All our measures of diversity anddistribution of stock holdings look more similar than not for 1720 (when anew set of ledgers was opened), for 1723 (when the capital stock wasincreased by half), and for 1725 (when our ledgers were closed). In thisarticle, we have substantiated that a large, diverse, and, most importantly,stable customer base for the capital stock of the Bank of England hademerged before the South Sea Bubble, and was sustained throughout theBubble year of 1720, as well as through the adjustments to the South SeaCompany and the Bank of England that occurred over the following fiveyears. We have shown who was in the market, their activity level in themarket, and their gains and losses from this activity. Given the nature ofthe data set, we cannot explore why any one person used the market. Inline with our examination of women shareholders, and on brokers, furtherwork will explore the activities of various sub-groups of shareholders, suchas the Jewish and Dutch expatriate communities, as well as by members ofthe liveried companies in the City. The basis for a mutually productiveinteraction between the financial sector and the real sector of the economywas already in existence and was sustained through the shock of the SouthSea Bubble and its collapse.
This finding is important. Over the last decade, the relationship betweengrowth and financial development, both theoretically and empirically, in alarge number of countries and in different periods of history has beenstudied extensively with scholars finding a positive connection, usually with

532 ANN M. CARLOS AND LARRY NEAL
© Economic History Society 2005Economic History Review, LIX, 3 (2006)
finance tending to lead growth.66 The growing body of empirical researchshows consistently that countries with either large, privately owned banksor liquid stock exchanges tend to grow faster.67 It is now clear that secondarymarkets in financial assets cannot be dismissed as mere gambling facilitiesthat divert individuals from potentially more constructive activities in theeconomy, as is argued by some today and certainly was argued by many in1720 London. The enduring and positive aspects of stock markets are thatthey provide liquidity for financial assets, and liquidity is the mechanism bywhich original lenders can re-sell their claims on borrowers to other savers.Knowing that they can acquire this liquidity whenever they require it, theoriginal lenders are more willing to lend in the first place. Their replace-ments are also more willing to invest as well, having witnessed marketoperation in the past. As a result of trading activities within financial mar-kets, households and businesses gain better insurance against shocks andbetter risk diversification. In addition, tradable financial assets can be usedas collateral for a wide variety of additional investments in other areas.68
Stock markets therefore provide insurance through liquidity and affect theways individuals and families can allocate their resources and manage riskover time, increasing welfare and the prospects for economic growth.
For secondary markets to play these beneficial roles effectively, however,there has to be a large number of individuals in the market with a varietyof savings objectives or time horizons. Capital markets create opportunitiesfor investors by providing a potential income stream through the paymentsof dividends and through the capital gains that may come from rising valuesin the market. If everyone in the stock market simply wants to receiveregular dividends indefinitely, or if everyone wants to cash out at the sametime, there will be very little liquidity in the stock market. Lack of liquiditymeans that prices of the seldom-traded assets will swing wildly, increasingthe risks for both borrowers and lenders and impeding expansion of firmsand industries. In much of the recent literature, the proxy for financialmarket development is the volume of stock traded relative to market capi-talization. A high turnover ratio could imply a large and diverse customerbase, but, as critics of stock markets have always noted, high turnover canbe created by specialist traders simply churning a few securities amongthemselves.69 As Zingales notes, such proxies could do with improvement.70
What one would like is a direct measure of the size, variety, and tradingactivity of the customer base.
66 For a survey of the finance-growth nexus, see Levine, ‘Financial development and economicgrowth’. The evidence is compelling, both historically: Rousseau, ‘Financial systems’; Rousseau andSylla, ‘Emerging financial markets’; Neal, Financial capitalism; and, in recent decades, comparatively:Levine, ‘More on finance’; Rajan and Zingales ‘Financial dependence’.
67 Levine, ‘More on finance’, p. 31.68 See, in particular, Gelderblom and Jonker, ‘Finance of the Dutch East India trade’.69 See Levine and Zervox, ‘Stock markets’ and Zingales, ‘Commentary’, for discussion of measure-
ment issues. See de la Vega, Confusion; Defoe, Anatomy; Mortimer, Every man; and innumerable workssince for discussion of the market historically.
70 Zingales, ‘Commentary’.

EARLY LONDON CAPITAL MARKET FOUNDATIONS 533
© Economic History Society 2005Economic History Review, LIX, 3 (2006)
That is precisely what we have created for the benchmark security avail-able to investors in the London capital market at the beginning of the riseof financial capitalism. Despite what might appear as the disruptions causedby the financial activity that accompanied the blowing-up and bursting ofthe South Sea Bubble, the thousands of stakeholders in the joint stock ofthe Bank of England maintained an active and ultimately beneficial second-ary market in the Bank’s equity capital. Nearly 8,000 individuals came torealize the benefits of this stock market. Indeed, despite the cries of com-plaints among the new subscribers into the South Sea Company when theirnew-found paper wealth vanished with the collapse of share prices back toJanuary 1720 levels, investors in the alternative outlets such as the Bank ofEngland stock did well.71 Well enough, in fact, to draw to the Bank’s stocknew investors seeking the security of dividend income and a measure offinancial independence, new investors seeking higher rates of return thanwere available elsewhere, and investors who desired the liquidity associatedwith these assets. Their commitment to the new vehicles for savings pro-vided by England’s financial revolution provided the foundation of a solid‘customer base’ upon which Walpole could build his new and enduringstructure of English public finance.
University of ColoradoUniversity of Illinois
Date submitted 18 February 2003Revised version submitted 30 April 2005Accepted 14 June 2005
DOI: 10.1111/j.1468-0289.2005.00332.x
71 Hoppit, ‘Myths’, notes that as most of the payments due on the successive subscriptions werecancelled by Parliament in 1721 and subscribers were credited with full shares, the actual monetarylosses were much reduced.

534 ANN M. CARLOS AND LARRY NEAL
© Economic History Society 2005Economic History Review, LIX, 3 (2006)
APPENDIX A. Classification of occupations and social categories
Occupation/Social Occupation/Social Intermediate Final
Farmer Agriculture AgricultureGardenerHusbandmanStablekeeperYeomanCaptain Military MilitaryColonelCommanderDasherGeneralGunnerMajorSoldierVice admiralRear admiralBricklayer Building trades Building tradesCarpenterMasonPlasterPlumberShipcarpenterShipwrightTarmanTinplate workerTurnerWiredrawerCheesemonger Dealer CommerceDrysalterFeltmongerFishmongerIronmongerWoodmongerWoolmongerBaconman Food CommerceBakerBrasierBrewerButcherConfectionerCookGingerbread bakerGirdlerMalsterPoultererSalterSugar bakerSugar refinerVictuallerVintner

EARLY LONDON CAPITAL MARKET FOUNDATIONS 535
© Economic History Society 2005Economic History Review, LIX, 3 (2006)
Blackwellhallfactor Merchant CommerceCoal merchantCornfactorFactorHop merchantMealfactorMerchantOrange merchantTimber merchantTurkey merchantWharfingerBookseller Meatman Shopkeeper CommerceChandler MercerColorman PrintsellerDraper ShopkeeperGrocer StationerHaberdasher Tallow chandlerHairseller TobacconistHosier ToymanInn keeper ToysellerLeather seller Wax chandlerLinendraper WoolendraperMealman YarnsellerBanker Financial FinancialBrokerGoldsmithScriveneBlacksmith Lorimer Manufacturing ManufacturingBlockmaker Mask makerBrickmaker NeedlemakerBuckett maker PeriwigmakerButton maker PictureframemakerCabinetmaker PotterChairmaker Razor makerClockmaker RefinerCoachmaker RopemakerCollarmaker SadlerCombmaker SilversmithCooper SoapmakerCordwainer SpectaclemakerCutler StaymakerDistiller WatchmakerInstrument maker WhipmakerIvoryturner WigmakerLeatherdresser Wine cooperClothier Silk weaver Textile ManufacturingClothworker SilkmanCrewellman SilkthrowerCurrier SkinnerDyer SpinnerEmbroiderer StockinerFrameworker TailorGlover TannerHatmaker ThreadmanLeatherseller WeaverMilliner Wool staplerShoemaker Woolcomber
Occupation/Social Occupation/Social Intermediate Final
APPENDIX A. Continued

536 ANN M. CARLOS AND LARRY NEAL
© Economic History Society 2005Economic History Review, LIX, 3 (2006)
Bargemaster Maritime MaritimeLightermanMarinerMasterSeamanGuardian Other OtherIn holderIn trustMinorArchdeacon Church ProfessionsBishopCurateDDRectorVicarAccountant general Judge Professions ProfessionsAgent solicitor Master of artsAlderman MayorAttorney at law MinisterBachelor of arts NotaryBurger of Notary publicBurgo master President of ? generalChamberlin Receiver of customsChuchwarden ScholarCommissary School masterDoctor SecretaryDoctor in physick SergeantDoctor of law Sergeant at lawFree lord SolicitorFrench minister Surgeon
Tide surveyorCottager Servants ServantsFellowLackeyServantApothecary Glazier Services ServicesBarber JewellerBarbersurgeon JoynerButton seller LacemanCalender LapedaryCaneseller LimnerCarman MillerCarver OilmanChapman PackerChaser PainterClerk PewtererCoachman SalesmanCoffeeman TopsellerCollector UndertakerCouncellor UpholderDruggist UpholstererEngraver WarehousemanFarrier WatermanGilder WireworkerEsquire Gentlemen Titled-menGentleman
Occupation/Social Occupation/Social Intermediate Final
APPENDIX A. Continued

EARLY LONDON CAPITAL MARKET FOUNDATIONS 537
© Economic History Society 2005Economic History Review, LIX, 3 (2006)
Footnote referencesAnderson, A., An historical and chronological deduction of the origin of commerce, 4 vols. (1801; reprinted
New York, 1967).Andreades, A. M., History of the Bank of England (1909).Bank of England, Alphabet ledgers, 1720–25, AC 27/430–433.Bank of England, Stock ledgers, 1720–1725, AC 27/6439–6450Bank of England, Transfer books 1720, AC 28/1545–1554.Barber, B. M. and Odean, T., ‘Boys will be boys: gender, overconfidence, and common stock invest-
ment’, Quarterly Journal of Economics, 116, 1 (2001), pp. 261–92. Brewer, J., The sinews of power: war, money and the English state, 1688–1783 (1989).Carlos, A. M., Moyen, N., and Hill, J., ‘Royal African Company stock prices during the South Sea
Bubble’, Explorations in Economic History, 39, 1 (2002), pp. 61–87. Carlos, A. M. and Neal, L., ‘Women investors in early capital markets, 1720–1725’, Financial History
Review, 11, 2 (2004), pp. 197–224.Carswell, J., The South Sea Bubble (revised edn. 1993).Chancellor, E., Devil take the hindmost: a history of financial speculation (New York, 1999).Clapham, J., The Bank of England: a history, 2 vols. (Cambridge, 1966).Dale, R., The first crash: lessons from the South Sea Bubble (Princeton, 2004).Defoe, D., Anatomy of Exchange-Alley, or, a system of stock-jobbing (1719).Dickson, P. G. M., The financial revolution in England: a study in the development of public credit, 1688–
1756 (1967).Earle, P., A city full of people: men and women of London, 1650–1750 (1994).Ferguson, N., The cash nexus: money and power in the modern world (New York, 2001).Gauci, P., The politics of trade: the overseas merchant in state and society, 1660–1720, (Oxford, 2001).Gelderblom, O. and Jonker, J., ‘The finance of the Dutch East India trade and the rise of the Amsterdam
capital market, 1595–1612’, Journal of Economic History, 64 (2004), pp. 641–72. Harris, R., Industrializing English law: entrepreneurship and business organization, 1720–1844, (Cambridge,
2000).
Baron Nobility-men Titled-menBaronetCountDukeEarlHonorableKnightLordLord bishopLord chief justiceLord viscountMarquisNobleViscompteSister Commoner-women Titled-womenSpinsterWidowWifeBaroness Nobility-women Titled-womenCountessDutchessHonorable ladyLady
Unknown
Occupation/Social Occupation/Social Intermediate Final
APPENDIX A. Continued

538 ANN M. CARLOS AND LARRY NEAL
© Economic History Society 2005Economic History Review, LIX, 3 (2006)
Hoppit, J., ‘The myths of the South Sea Bubble’, Transactions of the Royal Historical Society, 12 (2002),pp. 141–65.
Hyde, R., The A to Z of Georgian London (Lympne Castle, Kent, 1981).Ingrassia, C., Authorship, commerce, and gender in early eighteenth-century England: a culture of paper credit
(Cambridge, 1998).de Krey, G. S., A fractured society: the politics of London (Oxford, 1985).Laurence, A., ‘That “nasty South Sea affair”: the Hastings sisters, Mrs Bonnell and the rage to
speculate’, unpublished manuscript, Open University, April 2004.Levine, R., ‘Financial development and economic growth: views and agenda’, Journal of Economic
Literature, 35 (1997), pp. 688–726. Levine, R., ‘More on finance and growth: more finance, more growth?’, Federal Reserve Bank of St. Louis
Review, 85, 4 (2003), pp. 31–46. Levine, R. and Zervox, S., ‘Stock markets, banks, and economic growth,’ American Economic Review,
88 (1998), pp. 537–58. Lindert, P., ‘Reinterpreting England’s social tables, 1688–1913’, Explorations in Economic History, 20
(1983), pp. 94–109. Lindert, P., ‘Unequal English wealth since 1670’, Journal of Political Economy, 94 (1986), pp. 1127–62. Lindert, P., ‘English occupations, 1670–1811’, Journal of Economic History, 40 (1980), pp. 685–712. Mortimer, T., Every man his own broker, or a guide to the Stock Exchange (11th edn. 1801).Neal, L., The rise of financial capitalism: international capital markets in the Age of Reason (Cambridge,
1990).Neal, L., ‘How it all began: the monetary and financial architecture of Europe during the first global
capital markets: 1648–1815’, Financial History Review, October (2000), pp. 117–40. Rajan, R. G. and Zingales, L., ‘Financial dependence and growth’, American Economic Review, 88
(1998), pp. 559–86. Rousseau, P., ‘Financial systems, economic growth and globalization’, Historical perspectives on financial
development and economic growth, Federal Reserve Bank of St. Louis, 84, 4 (2003), pp. 81–105. Rousseau, P. and Sylla, R., ‘Emerging financial markets and early U.S. growth’, Explorations in Economic
History, 14, 1 pp. 1–26.Scott, W. R., The constitution and finance of English, Scottish and Irish joint-stock companies to 1720, 3 vols
(New York, 1951).Temin, P. and Voth, H.-J., ‘Riding the South Sea Bubble’, American Economic Review, 95, 5 (2004),
pp. 1654–68. de la Vega, J., Confusion de confusiones, translated by H. Kellenbenz (Amsterdam, 1688; reprinted Boston,
Mass., 1957).Zingales, L., ‘Commentary’, Historical perspectives on financial development and economic growth, Federal
Reserve Bank of St. Louis, 84, 4 (2003), pp. 47–52.