Embed Size (px)
Citation preview
The Michael Price Student Investment Fund
_______________________________________
Semi-Annual Report February 28, 2006
THE MICHAEL PRICE STUDENT INVESTMENT FUND
THE EXECUTIVE COMMITTEE
FALL 2005
President Stephanie Lee, CFA Treasurer Brijesh Gulati Portfolio Manager- Fixed Income Fund Chi-Kwan (Angela) Chiu, CFA Co-Portfolio Manager - Growth Fund Robert E. Du Boff, CFA Co-Portfolio Manager - Growth Fund Polly Sung Co-Portfolio Manager - Small Cap Fund Donald Sauber, CFA Co-Portfolio Manager - Small Cap Fund Ricky L.J. Sun, Ph.D. Co-Portfolio Manager - Value Fund Michael Stohler, Ph.D. Co-Portfolio Manager - Value Fund Michael J. Turgel, CPA Faculty Advisor Professor Richard Levich
SPRING 2006
President Debbie Jones Treasurer Gregory Lee Portfolio Manager- Fixed Income Fund Marc Strauss Co-Portfolio Manager - Growth Fund Rafael Tejada Co-Portfolio Manager - Growth Fund Nelson Shim, CFA Co-Portfolio Manager - Small Cap Fund Lei Mu Co-Portfolio Manager - Small Cap Fund Shivanker Saxena Co-Portfolio Manager - Value Fund Chao Mui Co-Portfolio Manager - Value Fund Benjamin Macdonald Faculty Advisor Professor Richard Levich
MANAGEMENT ADVISORY COUNCIL
Nomi Ghez, Co-founding partner of Circle Financial Group, retired Partner and Managing Director, Goldman Sachs Randall Haase, Portfolio Manager, Baron Fifth Avenue Growth Fund Christopher Long, Director of the North American Financing Desk, Tudor Investment Corporation Ruchi Madan, Managing Director, Citigroup Investment Research Kevin Parker, Managing Director and Global Head, Deutsche Asset Management
BOARD OF ADVISORS
Dean Thomas Cooley, Stern School of Business, New York University Dean Dennis E. Logue, Price College of Business, University of Oklahoma Michael F. Price, Benefactor Paul Affuso, Associate Dean, Stern School of Business Martin Gruber, Professor of Finance, Stern School of Business Richard Levich, Professor of Finance, Stern School of Business Arthur Zeikel, Adjunct Professor of Finance, Stern School of Business
RESOURCE FACULTY
Aswath Damodaran, Professor of Finance, Stern School of Business Fred Renwick, Emeritus Professor of Finance, Stern School of Business Edward Kerschner, Adjunct Professor of Finance, Stern School of Business Jennifer Carpenter, Associate Professor of Finance, Stern School of Business
THE MICHAEL PRICE STUDENT INVESTMENT FUND

NYU STERN’S MICHAEL PRICE STUDENT INVESTMENT FUND: A FAMILY OF FUNDS MANAGED BY
NYU STERN SCHOOL OF BUSINESS MBA STUDENTS What is the Michael Price Student Investment Fund? With more than $2 million currently under management, the Michael Price Student Investment Fund (“MPSIF” or “the Funds”) is a family of funds managed directly by NYU Stern MBA students. The Funds, part of the overall NYU endowment, were established in 1999 through a generous gift from Michael Price, Managing Partner, MFP Investors, LLC and former Chairman of Franklin Mutual Series Funds. What is unique about the Fund? The Michael Price Student Investment Fund provides Stern MBA students with hands on experience managing real Funds with significant assets. In addition, the Funds are required to pay an annual 5% dividend to the University of Oklahoma Price School of Business, Mr. Price’s undergraduate alma mater. This dividend pays students’ tuition so they can attend summer classes at Stern. What is the portfolio composition? For diversification purposes, MPSIF is divided into three equity Funds - Growth, Value and Small Cap - and one Fixed Income Fund. While each sub-Fund has its own performance benchmark (Russell 1000 Growth Index, Russell 1000 Value Index, Russell 2000 and the Vanguard Total Bond Index, respectively), MPSIF’s primary goal is to deliver overall positive returns. What role do Stern MBA students play in managing the Funds? Students must go through a competitive process to become a portfolio manager or analyst with the Funds, which is the basis of Stern’s “Managing Investment Funds” course. Stern MBAs must apply to this course, and demand has always exceeded available spots. About 45 students enroll each year and are then responsible for all Fund activities—screening and evaluating stocks, preparing and presenting pitches for buy and sell recommendations and strategizing on broader portfolio issues as they relate to sectors allocation. For the Fixed Income Fund the primary role of analysts is to make tactical allocation recommendations and decisions based on market outlook and economic analyses among various product sectors.
THE MICHAEL PRICE STUDENT INVESTMENT FUND

THE MICHAEL PRICE STUDENT INVESTMENT FUND
TABLE OF CONTENTS THE MICHAEL PRICE STUDENT INVESTMENT FUND 2 LETTER FROM THE FACULTY ADVISOR 2 LETTER FROM THE PRESIDENT 3 REVIEW OF OPERATIONS 4 PERFORMANCE as of FEBRUARY 28, 2006 6 BENCHMARK INDEX DESCRIPTION 8 STYLE AND CAPITALIZATION 9 FUND TURNOVER 9 ASSET ALLOCATION 10 MACROECONOMIC AND MARKET REVIEW 11 FINANCIAL STATEMENTS 12
THE FIXED INCOME FUND 14 MESSAGE FROM THE PORTFOLIO MANAGER 14 PERFORMANCE 16 ASSET ALLOCATION 17 FUND PROFILE 18 INVESTMENT STYLE AND OUTLOOK 19 FIXED INCOME SECTOR REVIEW AND OUTLOOK 20
THE GROWTH FUND 21 MESSAGE FROM THE PORTFOLIO MANAGER 21 PERFORMANCE 22 ASSET ALLOCATION 24 FUND PROFILE 25 INVESTMENT STYLE AND STRATEGY 26
THE SMALL CAP FUND 27 MESSAGE FROM THE PORTFOLIO MANAGER 27 PERFORMANCE 28 ASSET ALLOCATION 30 FUND PROFILE 31 INVESTMENT STYLE AND STRATEGY 32
THE VALUE FUND 33 MESSAGE FROM THE PORTFOLIO MANAGER 33 PERFORMANCE 34 ASSET ALLOCATION 36 FUND PROFILE 37 INVESTMENT STYLE AND STRATEGY 38
THE MANAGEMENT 39 ANALYST BIOGRAPHIES 41
THE MICHAEL PRICE STUDENT INVESTMENT FUND
- 2 -
LETTER FROM THE FACULTY ADVISOR On behalf of the students who participate in the Michael Price Student Investment Fund, I am delighted to introduce the Semi-Annual Report for the six-month period ending February 28, 2006. Our collective efforts over the last semester allow me to highlight another set of fresh achievements and firsts for MPSIF. On the financial side, U.S. equity markets continued their steady upward trend. The most popular indices of U.S. equity performance, the Dow Jones Industrials, the S&P 500, and the NASDAQ Composite, advanced by roughly 5-6% over the six-month period. Compared to this rising tide, the three MPSIF equity funds (Growth, Small Cap and Value) achieved returns of 8.7%, 15.7% and 5.1%, respectively. Including our Fixed Income Fund, MPSIF earned 7.4% overall vs. 5.6% for our blended benchmark. This excess performance, coupled with three straight years of returns in excess of our mandated 5% distribution, has enabled MPSIF to grow its assets under management to $2.01 million, the highest total in our six-year history. On the academic side, I am proud to announce the formation of a new Management Advisory Council to interact with the students. The Advisory Council for fiscal year 2005-06 includes Nomi Ghez, Randall Haase, Christopher Long, Ruchi Madan and Kevin Parker, all of whom are Stern alumni with significant experience in investment management. Members of the Advisory Council participated in our December annual report meeting, followed by classroom visits in February and March. The Advisory Council takes its participation seriously and has offered many useful suggestions regarding our stock selection and portfolio monitoring process. On March 2nd, MPSIF hosted its first ever Student-Alumni Mixer. About 30 MPSIF alumni attended (including three past Presidents), joining 20 current students for an evening of reminiscing about the past (when MPSIF began and NASDAQ was at 4,800) and networking in the present. We hope to make this an annual event. In April, MPSIF will for the first time reach out to a larger audience of Stern alumni. We hope that this open alumni gathering will make the real-world investment management experience available to Stern students and the financial track record they have achieved more well known in our community. In closing, I offer my thanks to the MPSIF students and advisors who have helped guide our Funds over the last semester and to our MPSIF alumni who established a sturdy foundation for us and continue to be supportive. Without them, the educational experience in MPSIF and the track record would not have been possible. Sincerely,
Richard M. Levich Professor of Finance Deputy Chairman, Department of Finance March 15, 2006
THE FUND

- 3 -
MESSAGE FROM THE PRESIDENT We are pleased to present the Semi-Annual Report for fiscal 2006 to our Board of Advisors, Fund participants, and other interested parties. The Fund, which underperformed its blended benchmark by almost 140 bps for fiscal 2005, has started off strong in fiscal 2006, beating its blended benchmark by 177 bps. Small Cap’s performance has continued to give the Fund an edge, with the Growth Fund also showing strong returns for the first six months of the fiscal year. The Fund continues to attract talented and experienced Stern students, who are arguably responsible for the Fund’s continued ability to beat its benchmark. As MPSIF analysts, students are entrusted to grow the Fund’s assets to provide scholarship opportunities for students from the Michael F. Price College of Business at the University of Oklahoma to study at the Stern school. In doing so, MPSIF students gain the opportunity to obtain first hand investment management experience. Ultimately, it is the students and Faculty advisor who are responsible for the learning component of MPSIF experience. Recently the fund has also gained valuable feedback from our Management Advisory Council. Given the number of MPSIF alumni who have begun to show interest in the Fund, we plan to seek out guidance from those alumni who are now part of the professional investment management community. A new Executive Committee position, Vice President of Training and Development, has been created to facilitate procedures and events focused on teaching investment management skills involving current students, Stern faculty, and alumni. Having finished our sixth year of existence, the MPSIF students who have benefited from the experience would like to extend our continued thanks and appreciation to Michael Price, without whom this opportunity would not be possible. I would also like to thank our Faculty Advisor Professor Richard Levich for his guidance throughout the year. Sincerely,
Debbie Jones, President
THE FUND
- 4 -
REVIEW OF OPERATIONS The Michael Price Student Investment Fund is divided into four autonomous sub-funds: the Fixed Income Fund, the Growth Fund, the Small Cap Fund and the Value Fund. While the goal of each fund is to purchase under-valued securities within its respective investment universe, each fund is free to determine the best way to identify those opportunities. Portfolio managers and analysts endeavor to improve the stock selection process by applying their own professional experience, learning from their peers, and building upon the knowledge base and previous fund participants. From an overall portfolio perspective, the Executive Committee, which is comprised of the President, the Treasurer, the Portfolio Managers, and the Faculty Advisor, seeks to develop and enhance best practices across the Fund in order to position the overall portfolio for continued success. Over the past year the Executive Committee completed a number of initiatives and goals including:
• Recruited the guidance of five leading Stern alumni to serve year-long tenures on a newly formed Management Advisory Council, who attended our Fall meeting, classes in the Spring and will review this semi-annual report in late April;
• Held MPSIF’s first Alumni/Student Reception on March 2, 2006 at the Torch Club for twenty alumni and thirty current MPSIF analysts to meet and network;
• Created a one page MPSIF overview that provides a quick and easy picture of the Fund and its performance record to increase awareness throughout the Stern Community;
• Secured an invitation by Admissions to present to incoming students an overview of MPSIF and sample stock pitches during Spring Preview, to be held in late April;
• Established an official process by which proxy voting is executed; • For the first time since inception of the Fund, MPSIF’s total assets under management
grew to over $2 million; • Developed a position on the Executive Board for a Vice President of Training and
Development; • Began implementation of Wilshire Analytic’s software to help track performance, style
and risk exposure Initiatives that the Executive Committee is currently working to implement include:
• Continued training of Wilshire Analytics tools for all MPSIF analysts; • Increasing awareness for MPSIF within the Stern community and to prospective students
to gain exposure for the Fund and to attract the best candidates; • Implementing consistent stop-loss and trading procedures for all funds; • Organization of training sessions given by Stern Faculty and MPSIF alumni
We believe that the ongoing success of the Fund will depend not only on superior security selection, but also in adequate promotion of the course both within the Stern community and beyond in order to attract the most qualified students. We are confident that with careful planning and ongoing improvement, the Fund’s success (both financially and within the curriculum) will continue into the future.
THE FUND

- 5 -
First Annual Alumni/Student Reception
THE FUND
- 6 -
PERFORMANCE as of February 28, 2006
Inception
Date 6 Month 1 Year 5 Year* Since
Inception*
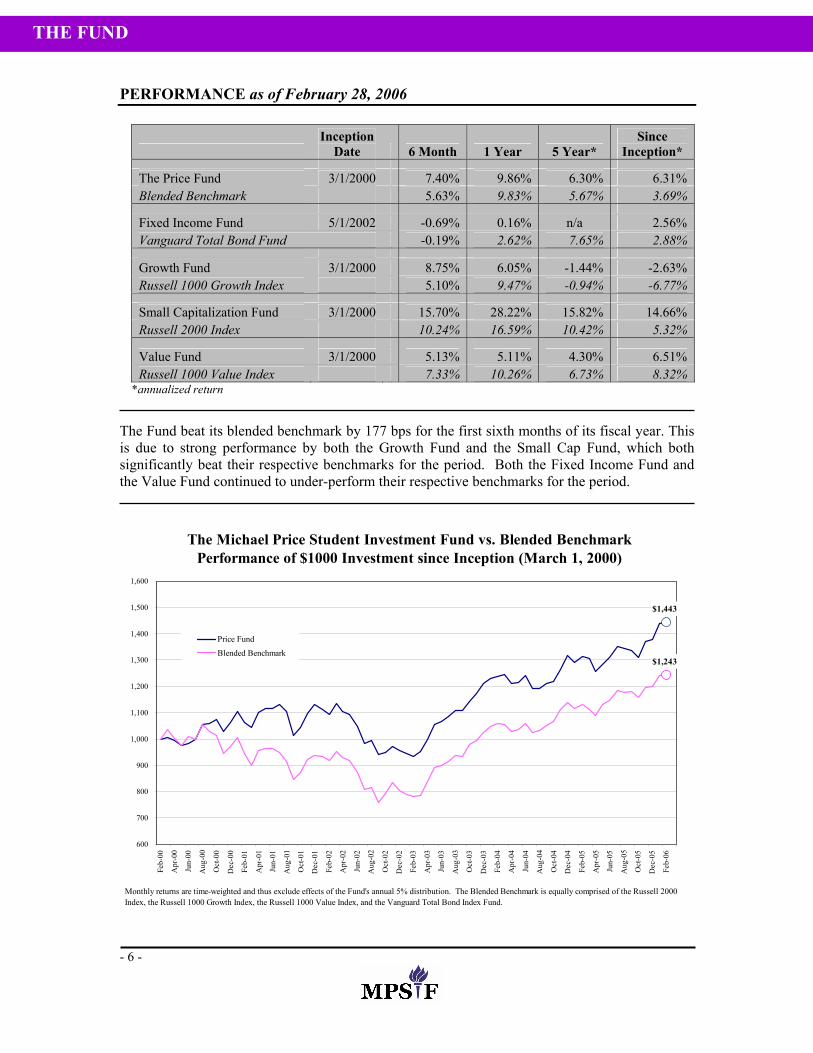
The Price Fund 3/1/2000 7.40% 9.86% 6.30% 6.31% Blended Benchmark 5.63% 9.83% 5.67% 3.69%
Fixed Income Fund 5/1/2002 -0.69% 0.16% n/a 2.56% Vanguard Total Bond Fund -0.19% 2.62% 7.65% 2.88%
Growth Fund 3/1/2000 8.75% 6.05% -1.44% -2.63% Russell 1000 Growth Index 5.10% 9.47% -0.94% -6.77%
Small Capitalization Fund 3/1/2000 15.70% 28.22% 15.82% 14.66% Russell 2000 Index 10.24% 16.59% 10.42% 5.32%
Value Fund 3/1/2000 5.13% 5.11% 4.30% 6.51% Russell 1000 Value Index 7.33% 10.26% 6.73% 8.32%
*annualized return
The Fund beat its blended benchmark by 177 bps for the first sixth months of its fiscal year. This is due to strong performance by both the Growth Fund and the Small Cap Fund, which both significantly beat their respective benchmarks for the period. Both the Fixed Income Fund and the Value Fund continued to under-perform their respective benchmarks for the period.
The Michael Price Student Investment Fund vs. Blended BenchmarkPerformance of $1000 Investment since Inception (March 1, 2000)
$1,443
$1,243
600
700
800
900
1,000
1,100
1,200
1,300
1,400
1,500
1,600
Feb-
00
Apr
-00
Jun-
00
Aug
-00
Oct
-00
Dec
-00
Feb-
01
Apr
-01
Jun-
01
Aug
-01
Oct
-01
Dec
-01
Feb-
02
Apr
-02
Jun-
02
Aug
-02
Oct
-02
Dec
-02
Feb-
03
Apr
-03
Jun-
03
Aug
-03
Oct
-03
Dec
-03
Feb-
04
Apr
-04
Jun-
04
Aug
-04
Oct
-04
Dec
-04
Feb-
05
Apr
-05
Jun-
05
Aug
-05
Oct
-05
Dec
-05
Feb-
06
Price Fund
Blended Benchmark
Monthly returns are time-weighted and thus exclude effects of the Fund's annual 5% distribution. The Blended Benchmark is equally comprised of the Russell 2000 Index, the Russell 1000 Growth Index, the Russell 1000 Value Index, and the Vanguard Total Bond Index Fund.
THE FUND
- 7 -
PERFORMANCE as of February 28, 2006
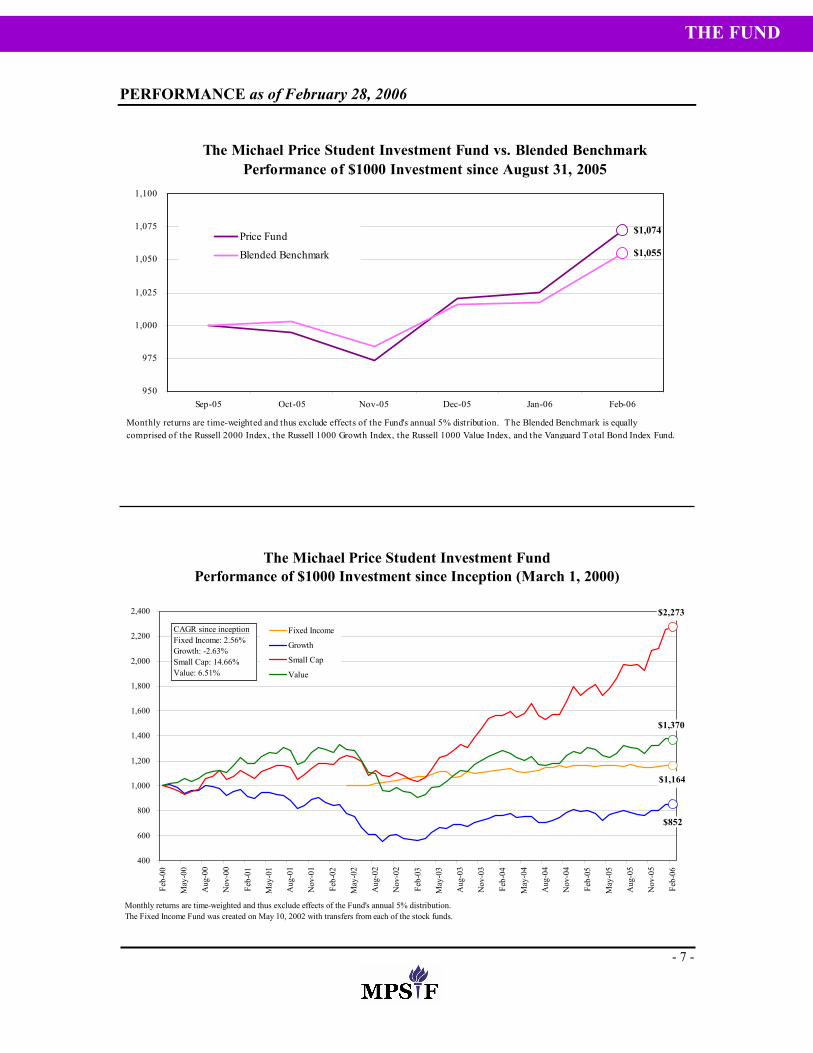
The Michael Price Student Investment Fund vs. Blended BenchmarkPerformance of $1000 Investment since August 31, 2005
$1,074
$1,055
950
975
1,000
1,025
1,050
1,075
1,100
Sep-05 Oct-05 Nov-05 Dec-05 Jan-06 Feb-06
Price Fund
Blended Benchmark
Monthly returns are t ime-weighted and thus exclude effects of the Fund's annual 5% distribution. The Blended Benchmark is equally comprised of the Russell 2000 Index, the Russell 1000 Growth Index, the Russell 1000 Value Index, and the Vanguard Total Bond Index Fund.
The Michael Price Student Investment FundPerformance of $1000 Investment since Inception (March 1, 2000)
$1,164
$852
$2,273
$1,370
400
600
800
1,000
1,200
1,400
1,600
1,800
2,000
2,200
2,400
Feb-
00
May
-00
Aug
-00
Nov
-00
Feb-
01
May
-01
Aug
-01
Nov
-01
Feb-
02
May
-02
Aug
-02
Nov
-02
Feb-
03
May
-03
Aug
-03
Nov
-03
Feb-
04
May
-04
Aug
-04
Nov
-04
Feb-
05
May
-05
Aug
-05
Nov
-05
Feb-
06
Fixed Income
Growth
Small Cap
Value
CAGR since inceptionFixed Income: 2.56%Growth: -2.63%Small Cap: 14.66%Value: 6.51%
Monthly returns are time-weighted and thus exclude effects of the Fund's annual 5% distribution. The Fixed Income Fund was created on May 10, 2002 with transfers from each of the stock funds.
THE FUND
- 8 -
BENCHMARK INDEX DESCRPIPTION The purpose of benchmarking is to track the Funds’ performance relative to the index that most closely resembles the investment mandate of the Funds. While it is important to note that the Funds are measured against the market, it is also critical to remember that we have a competing goal of providing an absolute rate of return that exceeds our annual distribution mandate to the University of Oklahoma plus the rate of inflation in a given year. Therefore, although we consider the aforementioned indices/fund our benchmark, we are also keenly focused on risk management in the construction of each sub-Fund. Each of the four sub-Funds, Fixed Income, Growth, Small Cap, and Value, are benchmarked to a leading index in order to measure relative performance. The benchmarks are as follows:
• Fixed Income: Vanguard Total Return Bond Index Fund • Growth: Russell 1000 Growth Index • Small Cap: Russell 2000 Index • Value: Russell 1000 Value Index
Russell 2000® Index measures the performance of the 2,000 smallest companies in the Russell 3000 Index, representing almost 9% of the total market capitalization of the Russell 3000 Index. As of the latest reconstitution, the average market capitalization was approximately $664.9 million; the median market capitalization was approximately $539.5 million. The largest company in the index had an approximate market capitalization of $1.8 billion.
Russell 1000® Growth Index measures the performance of those Russell 1000 companies with higher price-to-book ratios and higher forecasted growth values. Russell 1000® Value Index measures the performance of those Russell 1000 companies with lower price-to-book ratios and lower forecasted growth values. Vanguard Total Return Bond Index Fund measures the performance of fixed income securities. The benchmark has following characteristics:
• Invests in U.S. Treasury, investment-grade corporate, mortgage-backed, and asset-backed securities
• Seeks to track the performance of the Lehman Brothers Aggregate Bond Index • Broadly diversified exposure to investment-grade U.S. bond market • Passively managed using index sampling • Intermediate-duration portfolio • Provides moderate current income with high credit quality
THE FUND
- 9 -
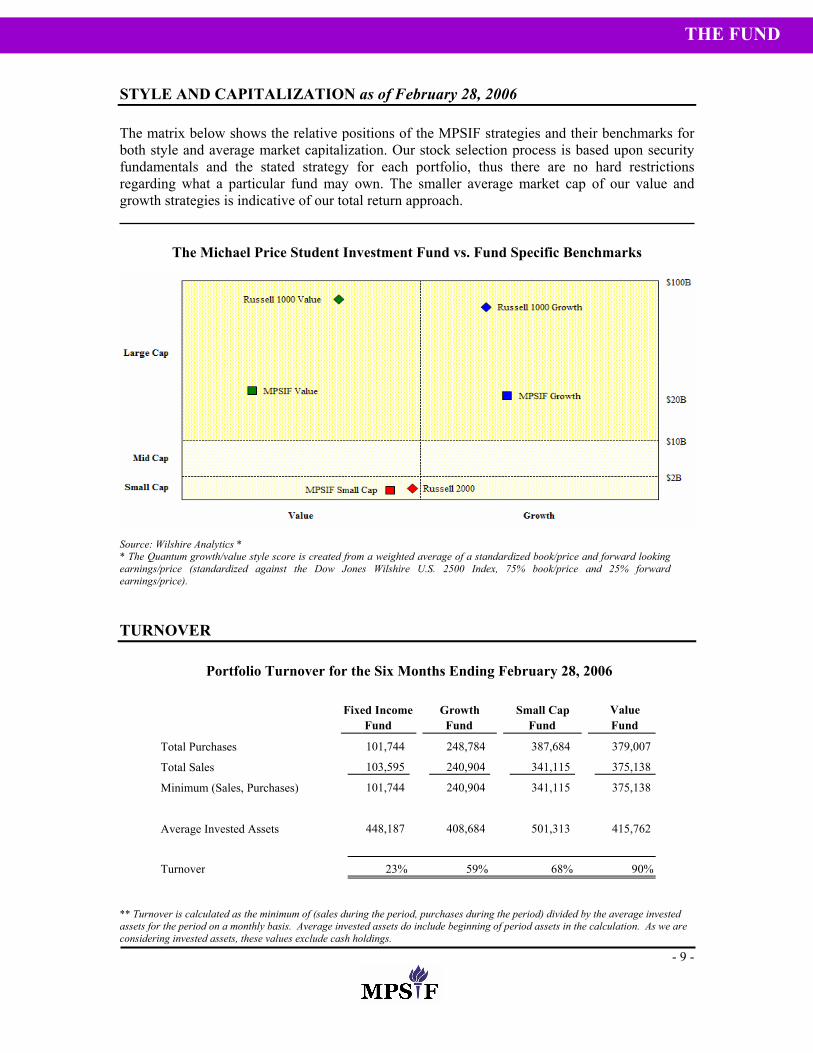
STYLE AND CAPITALIZATION as of February 28, 2006 The matrix below shows the relative positions of the MPSIF strategies and their benchmarks for both style and average market capitalization. Our stock selection process is based upon security fundamentals and the stated strategy for each portfolio, thus there are no hard restrictions regarding what a particular fund may own. The smaller average market cap of our value and growth strategies is indicative of our total return approach.
The Michael Price Student Investment Fund vs. Fund Specific Benchmarks
Source: Wilshire Analytics * * The Quantum growth/value style score is created from a weighted average of a standardized book/price and forward looking earnings/price (standardized against the Dow Jones Wilshire U.S. 2500 Index, 75% book/price and 25% forward earnings/price). TURNOVER
** Turnover is calculated as the minimum of (sales during the period, purchases during the period) divided by the average invested assets for the period on a monthly basis. Average invested assets do include beginning of period assets in the calculation. As we are considering invested assets, these values exclude cash holdings.
Fixed Income Fund
Growth Fund
Small Cap Fund
Value Fund
Total Purchases 101,744 248,784 387,684 379,007 Total Sales 103,595 240,904 341,115 375,138 Minimum (Sales, Purchases) 101,744 240,904 341,115 375,138
Average Invested Assets 448,187 408,684 501,313 415,762
Turnover 23% 59% 68% 90%
Portfolio Turnover for the Six Months Ending February 28, 2006
THE FUND
- 10 -
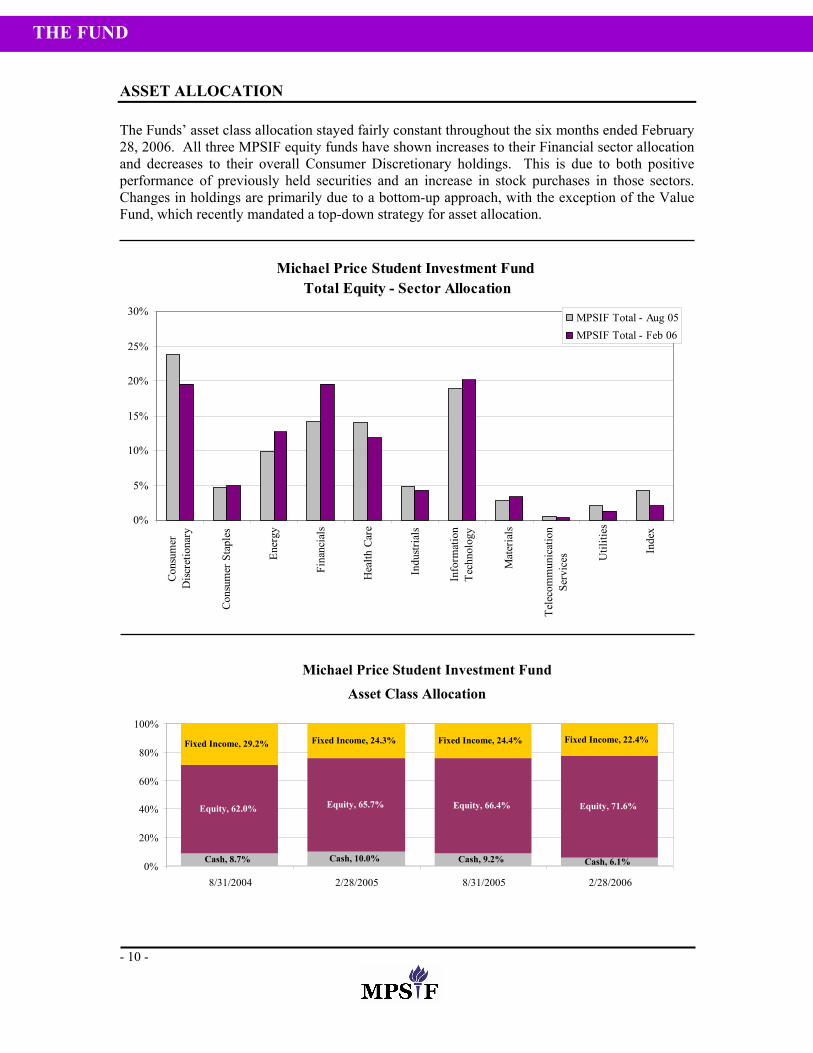
ASSET ALLOCATION The Funds’ asset class allocation stayed fairly constant throughout the six months ended February 28, 2006. All three MPSIF equity funds have shown increases to their Financial sector allocation and decreases to their overall Consumer Discretionary holdings. This is due to both positive performance of previously held securities and an increase in stock purchases in those sectors. Changes in holdings are primarily due to a bottom-up approach, with the exception of the Value Fund, which recently mandated a top-down strategy for asset allocation.
Michael Price Student Investment Fund Total Equity - Sector Allocation
0%
5%
10%
15%
20%
25%
30%
Cons
umer
Disc
retio
nary
Cons
umer
Sta
ples
Ener
gy
Fina
ncia
ls
Hea
lth C
are
Indu
stria
ls
Info
rmat
ion
Tech
nolo
gy
Mat
eria
ls
Tele
com
mun
icat
ion
Serv
ices U
tiliti
es
Inde
x
MPSIF Total - Aug 05MPSIF Total - Feb 06
Michael Price Student Investment FundAsset Class Allocation
Cash, 8.7% Cash, 10.0% Cash, 9.2% Cash, 6.1%
Equity, 62.0% Equity, 65.7% Equity, 66.4% Equity, 71.6%
Fixed Income, 29.2% Fixed Income, 24.3% Fixed Income, 24.4% Fixed Income, 22.4%
0%
20%
40%
60%
80%
100%
8/31/2004 2/28/2005 8/31/2005 2/28/2006
THE FUND
- 11 -
MACROECONOMIC AND MARKET REVIEW The performance of the equity markets was mostly favorable during the six months ended February 28, 2006. The S&P 500 Index gained 4.94% during this period. However, the Materials and Financial sectors had strong returns of 13.90% and 11.08%, respectively. This performance took place against the backdrop of rising short-term interest rates and a favorable business and economic environment. The Federal Reserve raised its target Federal Funds rate for the 14th consecutive time, reaching 4.50% on January 31, 2006. In other Fed news, Ben Bernanke succeeded Alan Greenspan to become the 14th Chairman of the Federal Reserve. The economy was strong during the period. GDP growth was 1.7% in the last quarter of 2005 and most analysts expect a growth rate of 4.5% in the first quarter of 2006. Corporate profits grew 16.4% in 2005, marking one of the longest expansions in record. The Consumer Price Index (CPI), as reported through February 2006, was 3.6% (annualized). However the core rate of inflation (excluding food and energy) was only 2.1%. Energy price inflation stood at 20%, explaining the difference between the two indices. Crude oil prices remained above $60 per barrel at the end of February. The historically high price for crude oil is largely a function of growing global demand (most notably in emerging markets such as China), tight capacity and inclement weather in the summer months in several oil rich regions. High energy prices hindered sales of both commercial and consumer goods as fuel prices took a larger chunk out of discretionary budgets. The 10-year Treasury note was under pressure during the period but its yield increased moderately. The yield started at 4.02% at the onset of the period and finished February at just 4.55%. Relatively low rates at the long end of the yield curve resulted in a flattening and slight inversion of the yield curve during the period.
THE FUND
- 12 -
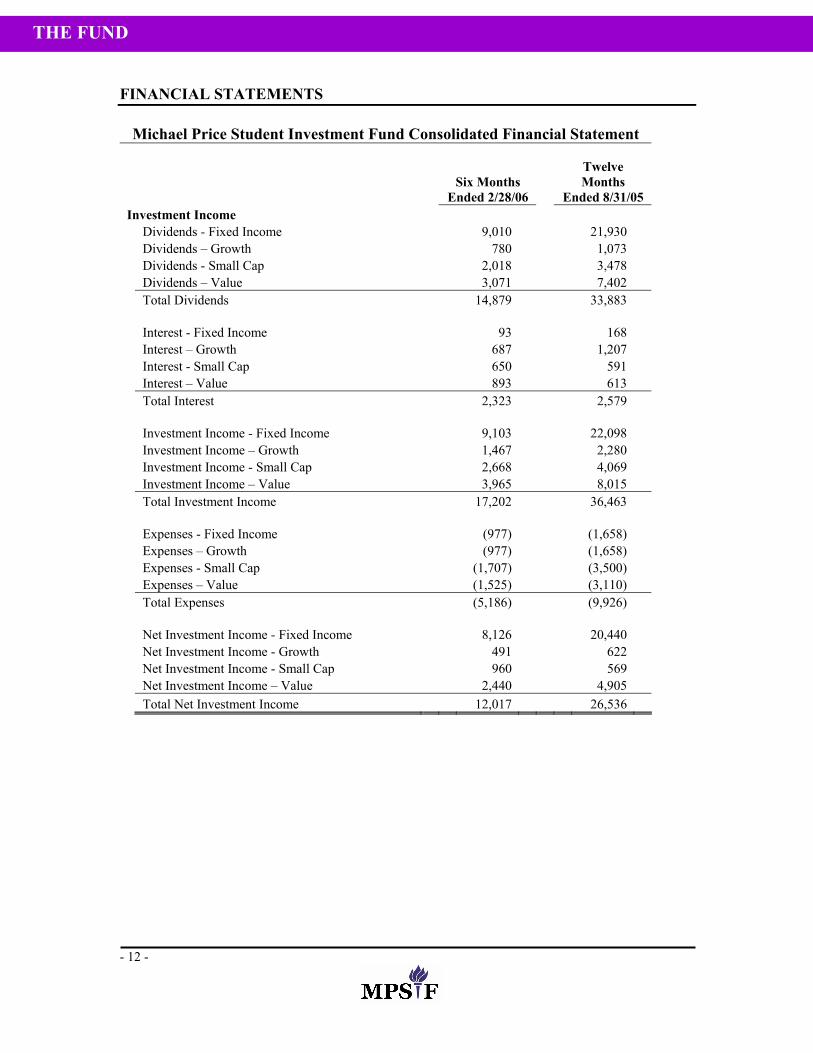
FINANCIAL STATEMENTS
Michael Price Student Investment Fund Consolidated Financial Statement
Six Months
Ended 2/28/06
Twelve Months
Ended 8/31/05 Investment Income Dividends - Fixed Income 9,010 21,930 Dividends – Growth 780 1,073 Dividends - Small Cap 2,018 3,478 Dividends – Value 3,071 7,402 Total Dividends 14,879 33,883 Interest - Fixed Income 93 168 Interest – Growth 687 1,207 Interest - Small Cap 650 591 Interest – Value 893 613 Total Interest 2,323 2,579 Investment Income - Fixed Income 9,103 22,098 Investment Income – Growth 1,467 2,280 Investment Income - Small Cap 2,668 4,069 Investment Income – Value 3,965 8,015 Total Investment Income 17,202 36,463 Expenses - Fixed Income (977) (1,658) Expenses – Growth (977) (1,658) Expenses - Small Cap (1,707) (3,500) Expenses – Value (1,525) (3,110) Total Expenses (5,186) (9,926) Net Investment Income - Fixed Income 8,126 20,440 Net Investment Income - Growth 491 622 Net Investment Income - Small Cap 960 569 Net Investment Income – Value 2,440 4,905 Total Net Investment Income 12,017 26,536
THE FUND
- 13 -
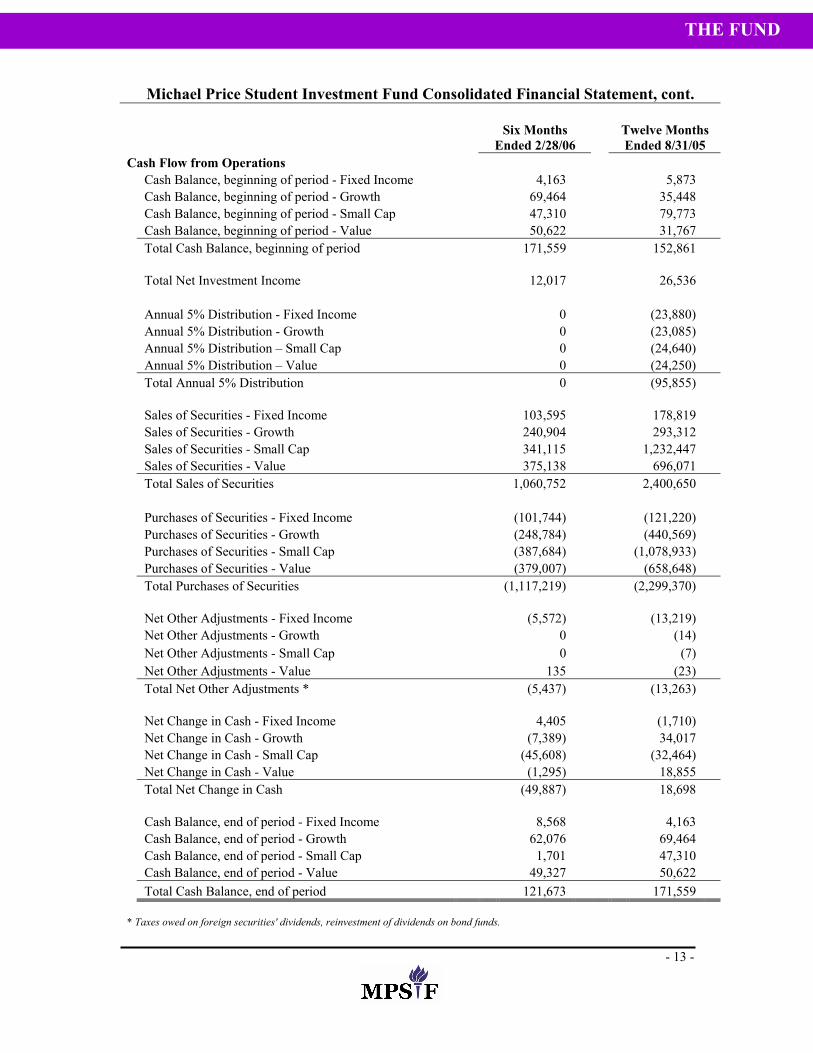
Michael Price Student Investment Fund Consolidated Financial Statement, cont.
Six Months
Ended 2/28/06 Twelve Months Ended 8/31/05
Cash Flow from Operations Cash Balance, beginning of period - Fixed Income 4,163 5,873 Cash Balance, beginning of period - Growth 69,464 35,448 Cash Balance, beginning of period - Small Cap 47,310 79,773 Cash Balance, beginning of period - Value 50,622 31,767 Total Cash Balance, beginning of period 171,559 152,861 Total Net Investment Income 12,017 26,536 Annual 5% Distribution - Fixed Income 0 (23,880) Annual 5% Distribution - Growth 0 (23,085) Annual 5% Distribution – Small Cap 0 (24,640) Annual 5% Distribution – Value 0 (24,250) Total Annual 5% Distribution 0 (95,855) Sales of Securities - Fixed Income 103,595 178,819 Sales of Securities - Growth 240,904 293,312 Sales of Securities - Small Cap 341,115 1,232,447 Sales of Securities - Value 375,138 696,071 Total Sales of Securities 1,060,752 2,400,650 Purchases of Securities - Fixed Income (101,744) (121,220) Purchases of Securities - Growth (248,784) (440,569) Purchases of Securities - Small Cap (387,684) (1,078,933) Purchases of Securities - Value (379,007) (658,648) Total Purchases of Securities (1,117,219) (2,299,370) Net Other Adjustments - Fixed Income (5,572) (13,219) Net Other Adjustments - Growth 0 (14) Net Other Adjustments - Small Cap 0 (7) Net Other Adjustments - Value 135 (23) Total Net Other Adjustments * (5,437) (13,263) Net Change in Cash - Fixed Income 4,405 (1,710) Net Change in Cash - Growth (7,389) 34,017 Net Change in Cash - Small Cap (45,608) (32,464) Net Change in Cash - Value (1,295) 18,855 Total Net Change in Cash (49,887) 18,698 Cash Balance, end of period - Fixed Income 8,568 4,163 Cash Balance, end of period - Growth 62,076 69,464 Cash Balance, end of period - Small Cap 1,701 47,310 Cash Balance, end of period - Value 49,327 50,622 Total Cash Balance, end of period 121,673 171,559
* Taxes owed on foreign securities' dividends, reinvestment of dividends on bond funds.
THE FUND
- 14 -
MESSAGE FROM THE PORTFOLIO MANAGER The Fixed Income Fund (“the Fund”) navigated through a capricious half-year in the fixed income markets. The onset of the time period was met by the burly winds of Hurricane Katrina. Although the storm’s catastrophic repercussions sent shockwaves through the financial markets, the U.S. economy continued to chug along as consumers kept the market afloat, even as the Federal Reserve continued to raise the Fed Funds rate to 4.50%. Much of the attention on the Treasury markets was focused on the inversion of the yield curve. Despite rising commodity prices and global inflation concerns, long-term yields remain relatively low and have ultimately fallen below short-term yields. The yield curve, as measured by the spread between 2-year and 10-year yields, first inverted at the end of calendar year 2005. While an inverted yield curve usually proceeds an economic recession, most economists believe that the economy will continue to grow at a healthy clip, and point to aggressive Fed policy and low future inflation expectations as the cause of the inversion. As we begin fiscal year 2006 we face many questions. Of utmost importance is how long will the Fed continue to raise rates, and when, if at all, we can expect an easing of rates as the Fed changes to a more accommodative policy. We also need remain wary of a shift in the reserve accumulation of Asian nations away from government debt, which may cause long-term treasury yields to rise, thereby hindering economic growth. Interest rates will also continue to play a major role in the mortgage market, as interest payments on adjustable rate mortgages become more expensive. Not only will this have a profound impact on the nation’s economy, as it reduces the ability of many consumers to spend on discretionary items, but its also increases the likelihood that default rates on asset backed debt increase, marking a deterioration in the credit quality of various asset-backed and mortgage-backed securities. Likewise, the credit markets also face ongoing challenges. After numerous downgrades in the auto sector in 2005, spreads initially widened, then stabilized and continue to remain tight from a historical perspective. Should the economy sputter or credit quality should erode, spreads run the risk of rising further. The Fund must remain vigilant in monitoring its credit exposure. Furthermore, as interest rate policy shifts to a level of neutrality and economic expansion slows, we expect to see an increase in default rates, which are coming off of previous historic lows in recent years. Finally, emerging market spreads remain at extremely low levels, as prudent fiscal policy has strengthened the credit profile of what were once considered to be volatile economies. As such, given current foreign sovereign debt holdings, the Fund is susceptible to a good deal of event risk, which can cause spreads to widen dramatically. While the Fund continues to grow in terms of size and membership, we still face many challenges. The relatively small size of the Fund prohibited efficient execution at institutional pricing levels and the achievement of appropriate levels of diversification by investing in any particular bond issue. Therefore, the Fund continued to invest in mutual funds, in the form of open-ended funds, as well as exchange traded funds (ETFs). The primary goal of the Fund’s investment team is to express specific views towards each sector, namely U.S. Treasuries, Corporates, MBS/ABS and Foreign, by shifting capital between the Fund’s six holdings.
THE FIXED INCOME FUND
- 15 -
Looking forward, the Fund is anxiously awaiting changes in policy that will enable it to buy various individual bonds. The change will enable the Fund to express its views in the most accurate and cost efficient manner, and increase the learning experience of analysts as we continue to integrate the real world experience of running a fixed income fund into the classroom. Although these changes afford analysts the opportunity to invest in individual securities that are best suited to meet investment objectives, maintaining adequate levels of due diligence and dynamic security valuation will become increasingly important in order for analysts to carry on successful management of the Fund’s assets. Sincerely
Marc Strauss, Portfolio Manager
THE FIXED INCOME FUND
- 16 -
PERFORMANCE as of February 28, 2006
Inception
Date 6 Month 1 Year 5 Year* Since
Inception* Fixed Income Fund 5/1/2002 -0.69% 0.16% n/a 2.56% Vanguard Total Bond Fund -0.19% 2.62% 7.65% 2.88%
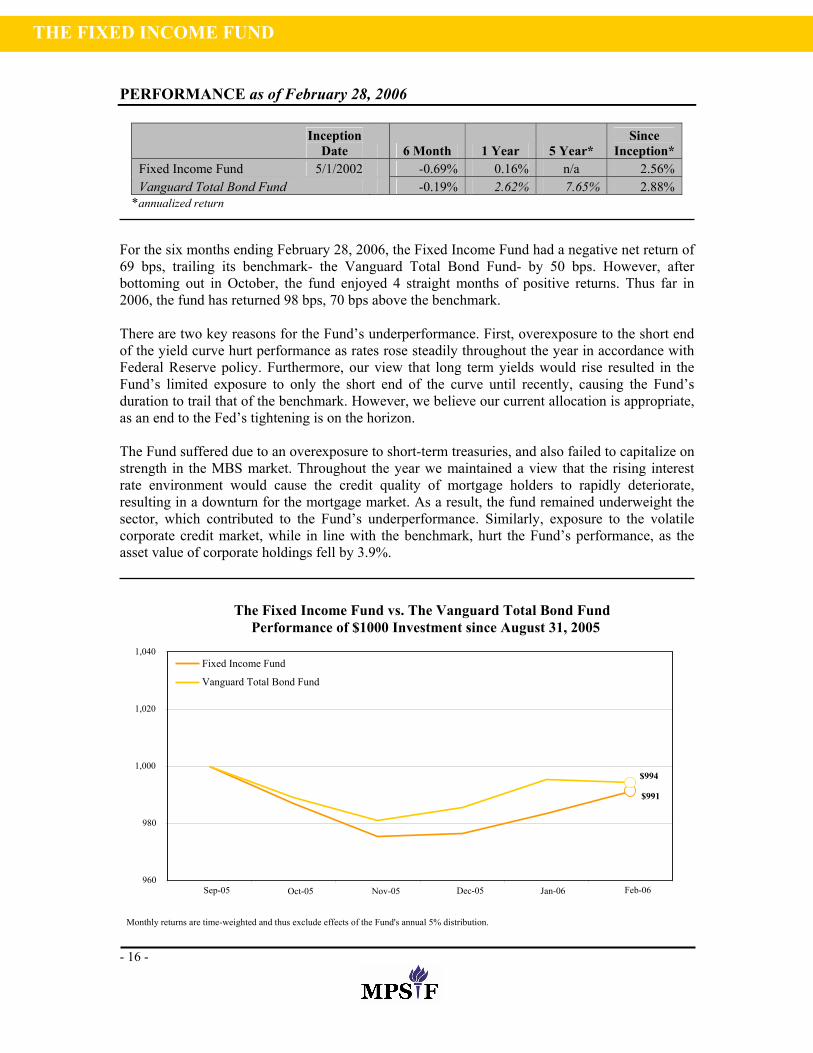
*annualized return For the six months ending February 28, 2006, the Fixed Income Fund had a negative net return of 69 bps, trailing its benchmark- the Vanguard Total Bond Fund- by 50 bps. However, after bottoming out in October, the fund enjoyed 4 straight months of positive returns. Thus far in 2006, the fund has returned 98 bps, 70 bps above the benchmark. There are two key reasons for the Fund’s underperformance. First, overexposure to the short end of the yield curve hurt performance as rates rose steadily throughout the year in accordance with Federal Reserve policy. Furthermore, our view that long term yields would rise resulted in the Fund’s limited exposure to only the short end of the curve until recently, causing the Fund’s duration to trail that of the benchmark. However, we believe our current allocation is appropriate, as an end to the Fed’s tightening is on the horizon. The Fund suffered due to an overexposure to short-term treasuries, and also failed to capitalize on strength in the MBS market. Throughout the year we maintained a view that the rising interest rate environment would cause the credit quality of mortgage holders to rapidly deteriorate, resulting in a downturn for the mortgage market. As a result, the fund remained underweight the sector, which contributed to the Fund’s underperformance. Similarly, exposure to the volatile corporate credit market, while in line with the benchmark, hurt the Fund’s performance, as the asset value of corporate holdings fell by 3.9%.
The Fixed Income Fund vs. The Vanguard Total Bond Fund Performance of $1000 Investment since August 31, 2005
$991
$994
960
980
1,000
1,020
1,040
Sep-05 Oct-05 Nov-05 Dec-05 Jan-06 Feb-06
Fixed Income Fund
Vanguard Total Bond Fund
Monthly returns are time-weighted and thus exclude effects of the Fund's annual 5% distribution.
THE FIXED INCOME FUND
- 17 -
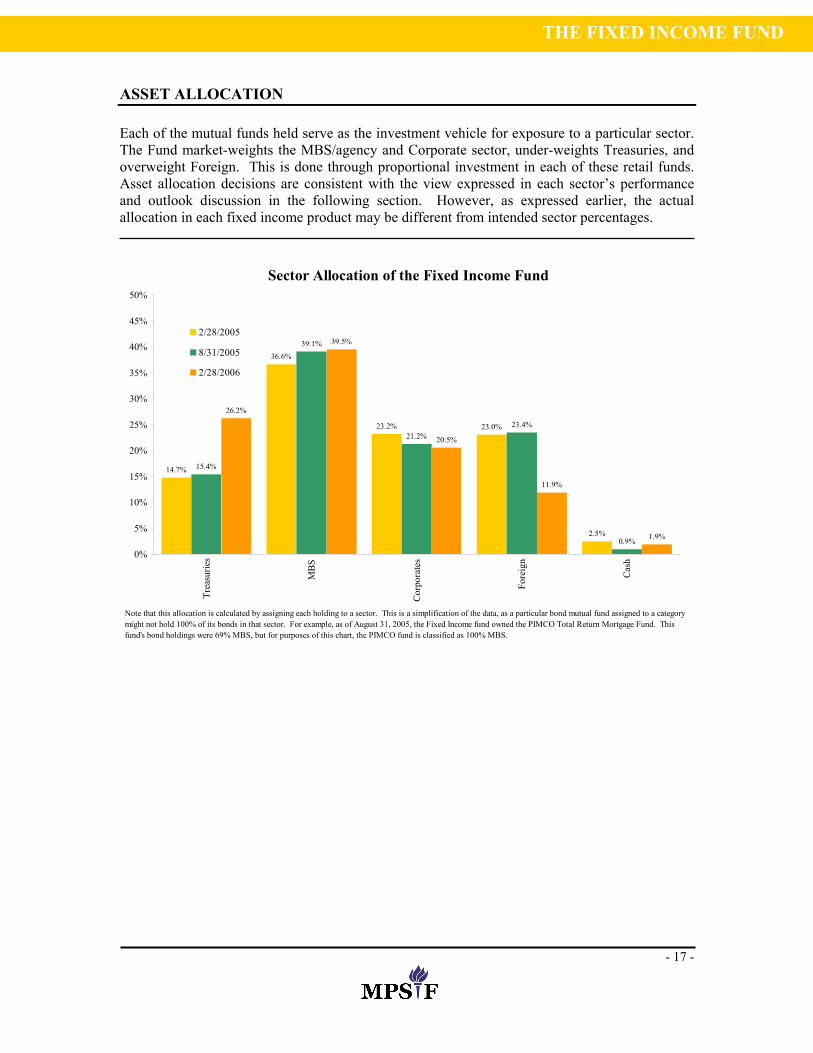
ASSET ALLOCATION Each of the mutual funds held serve as the investment vehicle for exposure to a particular sector. The Fund market-weights the MBS/agency and Corporate sector, under-weights Treasuries, and overweight Foreign. This is done through proportional investment in each of these retail funds. Asset allocation decisions are consistent with the view expressed in each sector’s performance and outlook discussion in the following section. However, as expressed earlier, the actual allocation in each fixed income product may be different from intended sector percentages.
Sector Allocation of the Fixed Income Fund
14.7%
36.6%
23.2% 23.0%
2.5%
15.4%
39.1%
21.2%23.4%
0.9%
26.2%
39.5%
20.5%
11.9%
1.9%
0%
5%
10%
15%
20%
25%
30%
35%
40%
45%
50%
Trea
surie
s
MB
S
Cor
pora
tes
Fore
ign
Cash
2/28/2005
8/31/2005
2/28/2006
Note that this allocation is calculated by assigning each holding to a sector. This is a simplification of the data, as a particular bond mutual fund assigned to a category might not hold 100% of its bonds in that sector. For example, as of August 31, 2005, the Fixed Income fund owned the PIMCO Total Return Mortgage Fund. This fund's bond holdings were 69% MBS, but for purposes of this chart, the PIMCO fund is classified as 100% MBS.
THE FIXED INCOME FUND
- 18 -
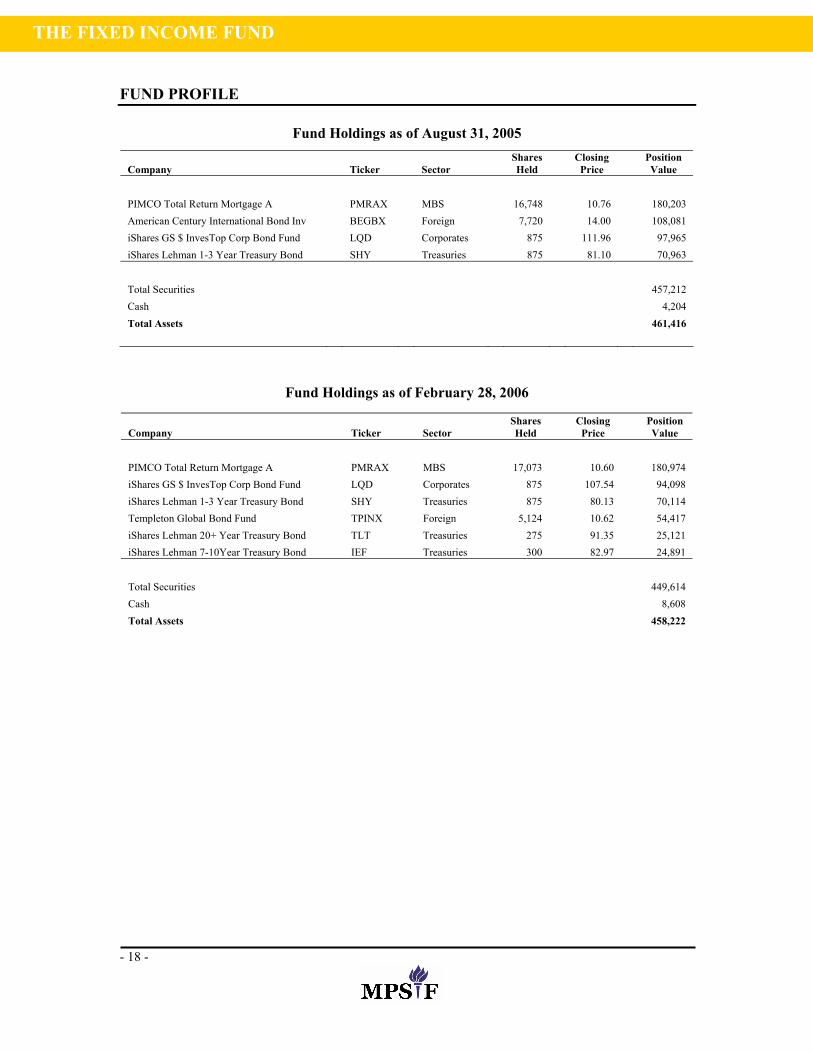
FUND PROFILE
Fund Holdings as of August 31, 2005
Company Ticker Sector Shares Held
Closing Price
Position Value
PIMCO Total Return Mortgage A PMRAX MBS 16,748 10.76 180,203 American Century International Bond Inv BEGBX Foreign 7,720 14.00 108,081 iShares GS $ InvesTop Corp Bond Fund LQD Corporates 875 111.96 97,965 iShares Lehman 1-3 Year Treasury Bond SHY Treasuries 875 81.10 70,963
Total Securities 457,212 Cash 4,204 Total Assets 461,416
Fund Holdings as of February 28, 2006
Company Ticker Sector Shares Held
Closing Price
Position Value
PIMCO Total Return Mortgage A PMRAX MBS 17,073 10.60 180,974 iShares GS $ InvesTop Corp Bond Fund LQD Corporates 875 107.54 94,098 iShares Lehman 1-3 Year Treasury Bond SHY Treasuries 875 80.13 70,114 Templeton Global Bond Fund TPINX Foreign 5,124 10.62 54,417 iShares Lehman 20+ Year Treasury Bond TLT Treasuries 275 91.35 25,121 iShares Lehman 7-10Year Treasury Bond IEF Treasuries 300 82.97 24,891
Total Securities 449,614 Cash 8,608 Total Assets 458,222
THE FIXED INCOME FUND
- 19 -
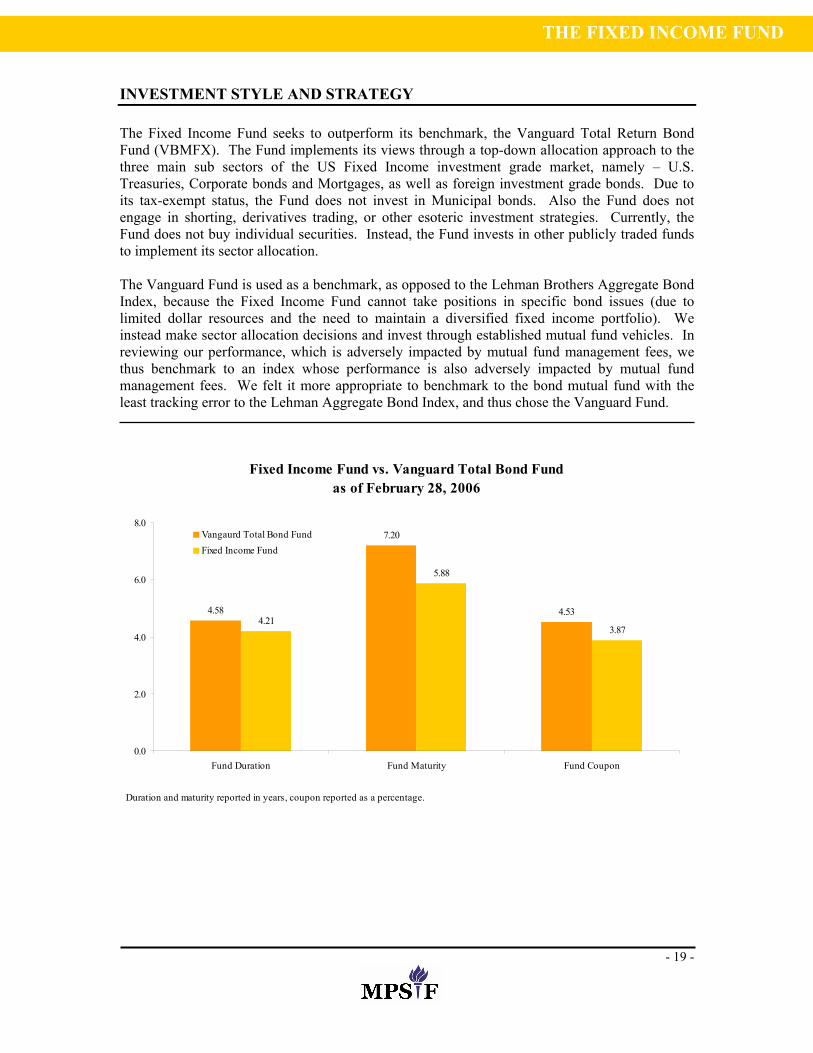
INVESTMENT STYLE AND STRATEGY The Fixed Income Fund seeks to outperform its benchmark, the Vanguard Total Return Bond Fund (VBMFX). The Fund implements its views through a top-down allocation approach to the three main sub sectors of the US Fixed Income investment grade market, namely – U.S. Treasuries, Corporate bonds and Mortgages, as well as foreign investment grade bonds. Due to its tax-exempt status, the Fund does not invest in Municipal bonds. Also the Fund does not engage in shorting, derivatives trading, or other esoteric investment strategies. Currently, the Fund does not buy individual securities. Instead, the Fund invests in other publicly traded funds to implement its sector allocation. The Vanguard Fund is used as a benchmark, as opposed to the Lehman Brothers Aggregate Bond Index, because the Fixed Income Fund cannot take positions in specific bond issues (due to limited dollar resources and the need to maintain a diversified fixed income portfolio). We instead make sector allocation decisions and invest through established mutual fund vehicles. In reviewing our performance, which is adversely impacted by mutual fund management fees, we thus benchmark to an index whose performance is also adversely impacted by mutual fund management fees. We felt it more appropriate to benchmark to the bond mutual fund with the least tracking error to the Lehman Aggregate Bond Index, and thus chose the Vanguard Fund.
Fixed Income Fund vs. Vanguard Total Bond Fund as of February 28, 2006
4.58
7.20
4.534.21
5.88
3.87
0.0
2.0
4.0
6.0
8.0
Fund Duration Fund Maturity Fund Coupon
Vangaurd Total Bond FundFixed Income Fund
Duration and maturity reported in years, coupon reported as a percentage.
THE FIXED INCOME FUND
- 20 -
SECTOR REVIEW AND OUTLOOK US Treasuries: During the six months ending February 28, 2006, the yield curve remained flat and strong demand from domestic and foreign investors for the newly reintroduced 30-year bond in February did nothing to change matters. Because the economy is back on track, the Federal Reserve, reacting to some inflation fears, may raise rates twice more before pausing. Although the calendar year started with softness in the Treasury market, we are bullish on Treasuries and recommend overweighting the index with longer duration positions through ETFs such as IEF and TLT. Mortgage-Backed Securities (MBS): With mortgage rates forecasted to rise to as much as 6.40% by the fourth quarter of 2006, slower growth in the housing market is expected. Higher rates will slow prepayments and curb home price appreciation, creating potential credit challenges ahead. AAA MBS spreads may widen by June and we may take a slightly underweight position with respect to the index. Corporate Bonds: Against all expectations, corporate spreads have continued to tighten as investors seek out higher yields. Strong demand has also enabled managers to become increasingly shareholder friendly, returning cash through buybacks and dividends. S&P believes investment grade spreads should be about 140 bps and high yield spreads should be about 415 bps, indicating that investors may not be adequately compensated for risk. In terms of business fundamentals, competition from China and India has challenged many U.S. companies and industries. Foreign: The dollar has continued to strengthen against the Euro and Yen as foreign funds poured into the U.S. on the strength of Fed rate increases and a widening spread between respective interest rates. While the Fed raised interest rates eight times in 2005 alone (to 4.25%), the European Central Bank raised rates once in December (to 2.25%). Meanwhile, Japan kept rates at zero. For 2006, we are somewhat bearish on the dollar. If the Fed stops tightening rates while the ECB and BOJ start tightening, the interest rate differentials could turn against the US. A shrinking interest rate differential coupled with an ever growing current account deficit could spell trouble for the dollar. Nevertheless, we may seek to bring our overweight position in the foreign sector closer to the benchmark.
THE FIXED INCOME FUND
- 21 -
MESSAGE FROM THE CO-PORTFOLIO MANAGERS The Growth Fund (“the Fund”) exhibited solid performance through the six months ended February 28, 2006. The Fund returned 8.75% compared to 5.10% for the Russell 1000 Growth benchmark, outperforming the index by 365 bps over this time period. The time period began in the wake of Hurricanes Katrina and Rita and amid concerns about their after-effects on GDP growth, inflation, and the Federal Reserve’s interest rate policy. Oil was trading near $70/barrel, and economists expected energy costs to seep into core CPI. These events factored into the Fund’s decision to overweight energy and reduce exposure to consumer discretionary names in the mid to late part of 2005. The Growth Fund continues to be weighted towards the energy, healthcare and technology sectors. Several of the Fund’s energy and healthcare companies outperformed the benchmark as many of these growth story plays became fully realized. In line with the Fund’s investment philosophy, profits from these stocks continue to be taken as companies become fully valued. The investment style of favoring mid to large-capitalization stocks worked for the portfolio at the end of calendar year 2005 as mid to large-capitalization stocks outperformed small-cap stocks. Regardless of the fluctuations in the equity markets, the Fund steadfastly maintains its investment philosophy of pursuing growth opportunities that are characterized in the following ways: companies which are pioneering a new product or service that will see dramatic future demand, altering pre-established norms in a static industry and gaining significant market share or companies which are applying their business model to new regions or leading in an industry that is experiencing high levels of growth. Finally, the Fund would like to thank Michael Price for his generous gift to the Stern School of Business. MPSIF has provided invaluable hands-on experience to students who are eager to apply theory from more traditional classes as they prepare for successful careers in investment management. Sincerely,
Nelson Shim and Rafael Tejada, Co-Portfolio Managers
THE GROWTH FUND
- 22 -
PERFORMANCE as of February 28, 2006
Inception
Date 6 Month 1 Year 5 Year* Since
Inception*
Growth Fund 3/1/2000 8.75% 6.05% -1.44% -2.63% Russell 1000 Growth Index 5.10% 9.47% -0.94% -6.77%
*annualized return
The Fund outperformed the Russell 1000 Growth Index by 365 basis points for the six months ending February 28, 2006, posting an absolute return of 8.75% (versus 5.10% for the Index). Contributing to the Fund’s positive performance were significant gains from Deckers Outdoor Corporation (+51%), RightNow Technologies, Inc. (+39%), Telik (34%), Weatherford International Ltd. (+34%) and GFI Group Inc. (+33%). Deckers Outdoor Corporation steadily increased revenue by increasing sales of its popular Ugg Brand and beat earnings estimates by 7% and 42% in September and December of 2005, respectively. The strong management team at Rightnow Technologies has leveraged its superior On-Demand CRM business model in tandem with the nimbleness characteristic of a smaller player to take advantage of the "CRM Vacuum" created by Oracle's acquisition of Siebel. This resulted in the company beating its earnings estimates by 75% and 12% in September and December 2005, respectively. Telik’s strong performance is mainly due to strong biotech tape across the board in the latter part of the year, as well as the increased expectations associated with Telik's three ASSIST clinical trial results for ovarian and non small-cell lung cancer that are to be announced within the next few months. Weatherford International’s price appreciated due to the continued demand for oil and oil services. Lastly, through strong management, GFI Group continued their momentum by posting respectful earnings and strong forecasts. The Fund’s successful investments, included Varian Medical Systems (+178%), Amgen (+38%), IRIS International (+25%) and Onyx Pharmaceuticals (+25%), where returns were calculated from purchase date to sale date. These position were sold once the companies reached their price targets and analysts concluded that continued growth prospects were diminished. The Growth Fund also had its share of disappointments. These include XM Satellite Radio Holdings (-37%), Tempur-Pedic International (-27%), NGAS Resources (21%), and Dell (-18%). XM Satellite Radio had a disagreement of management as one director left over differences in future strategy. XM Satellite Radio has not generated positive cash flow yet and some feel that the company should take strides to attain that goal sooner than later. Shares of Tempur-Pedic plummeted in mid-September 2005 after the company issued updated guidance for the third quarter and full year 2005 indicating lower than previously expected net sales and earnings per share. Despite the success of most energy based companies, NGAS Resources missed earnings by 75% and 40% in September and December 2005, respectively, mainly due to a failure to increase its revenues. Dell Inc. had better than expected 4Q earnings, but its guidance indicated slower revenue growth than expected. In addition, Dell lost a portion of a significant contract with Phillips. The Fund cut its losses on Martek Biosciences Group (-51%), FARO Technologies (-39%), and Corinthian Colleges (-24%) as analysts reevaluated the companies’ growth prospects and decided to free up those funds to allocate elsewhere.
THE GROWTH FUND
- 23 -
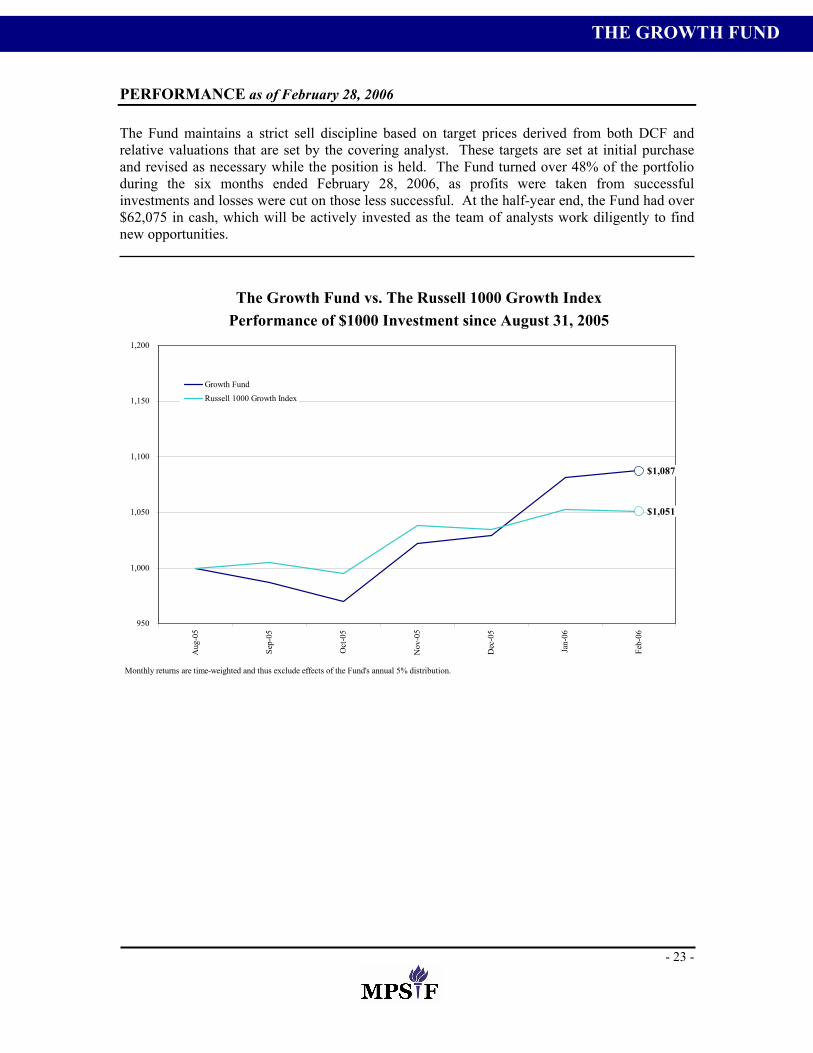
PERFORMANCE as of February 28, 2006 The Fund maintains a strict sell discipline based on target prices derived from both DCF and relative valuations that are set by the covering analyst. These targets are set at initial purchase and revised as necessary while the position is held. The Fund turned over 48% of the portfolio during the six months ended February 28, 2006, as profits were taken from successful investments and losses were cut on those less successful. At the half-year end, the Fund had over $62,075 in cash, which will be actively invested as the team of analysts work diligently to find new opportunities.
The Growth Fund vs. The Russell 1000 Growth IndexPerformance of $1000 Investment since August 31, 2005
$1,087
$1,051
950
1,000
1,050
1,100
1,150
1,200
Aug
-05
Sep-
05
Oct
-05
Nov
-05
Dec
-05
Jan-
06
Feb-
06
Growth Fund
Russell 1000 Growth Index
Monthly returns are time-weighted and thus exclude effects of the Fund's annual 5% distribution.
THE GROWTH FUND
The Growth Fund vs. The Russell 1000 Growth Index Performance of $1000 Investment since August 31, 2005
- 24 -
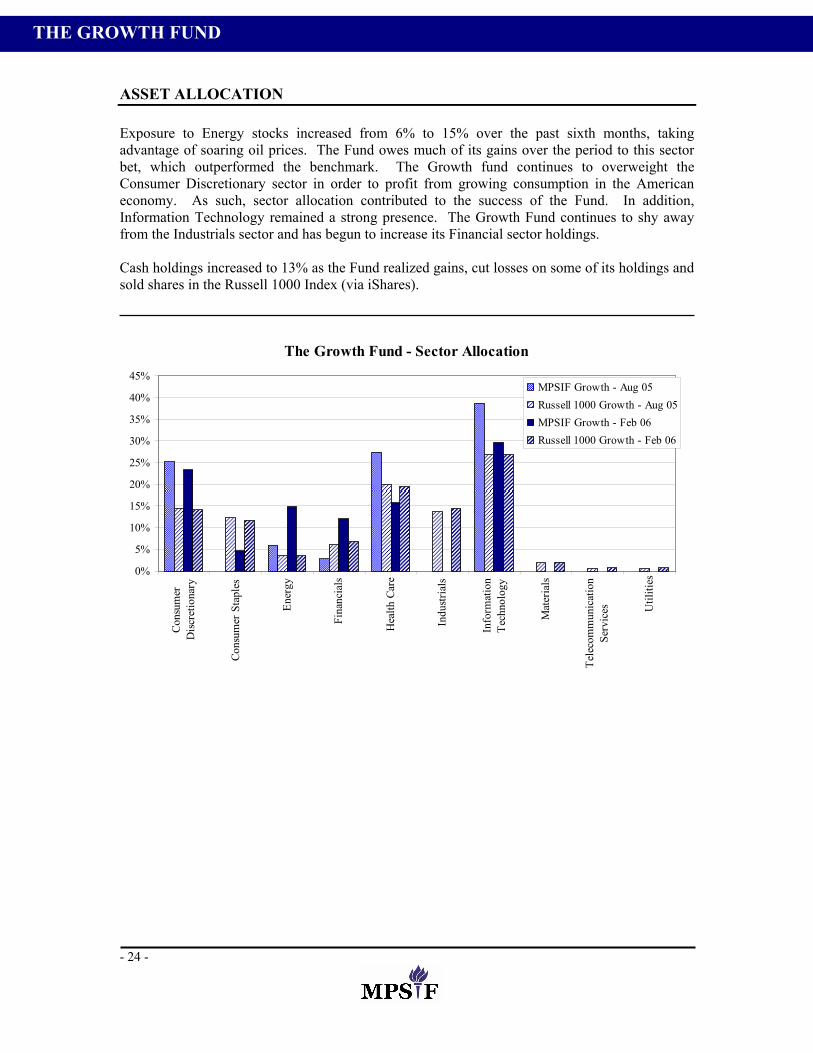
ASSET ALLOCATION Exposure to Energy stocks increased from 6% to 15% over the past sixth months, taking advantage of soaring oil prices. The Fund owes much of its gains over the period to this sector bet, which outperformed the benchmark. The Growth fund continues to overweight the Consumer Discretionary sector in order to profit from growing consumption in the American economy. As such, sector allocation contributed to the success of the Fund. In addition, Information Technology remained a strong presence. The Growth Fund continues to shy away from the Industrials sector and has begun to increase its Financial sector holdings. Cash holdings increased to 13% as the Fund realized gains, cut losses on some of its holdings and sold shares in the Russell 1000 Index (via iShares).
The Growth Fund - Sector Allocation
0%
5%
10%
15%
20%
25%
30%
35%
40%
45%
Cons
umer
Disc
retio
nary
Cons
umer
Sta
ples
Ener
gy
Fina
ncia
ls
Hea
lth C
are
Indu
stria
ls
Info
rmat
ion
Tech
nolo
gy
Mat
eria
ls
Tele
com
mun
icat
ion
Serv
ices U
tiliti
es
MPSIF Growth - Aug 05Russell 1000 Growth - Aug 05MPSIF Growth - Feb 06Russell 1000 Growth - Feb 06
THE GROWTH FUND
- 25 -
FUND PROFILE
Fund Holdings as of August 31, 2005
Company Name Ticker Sector Shares Held
Closing Price
Position Value
% of Equity
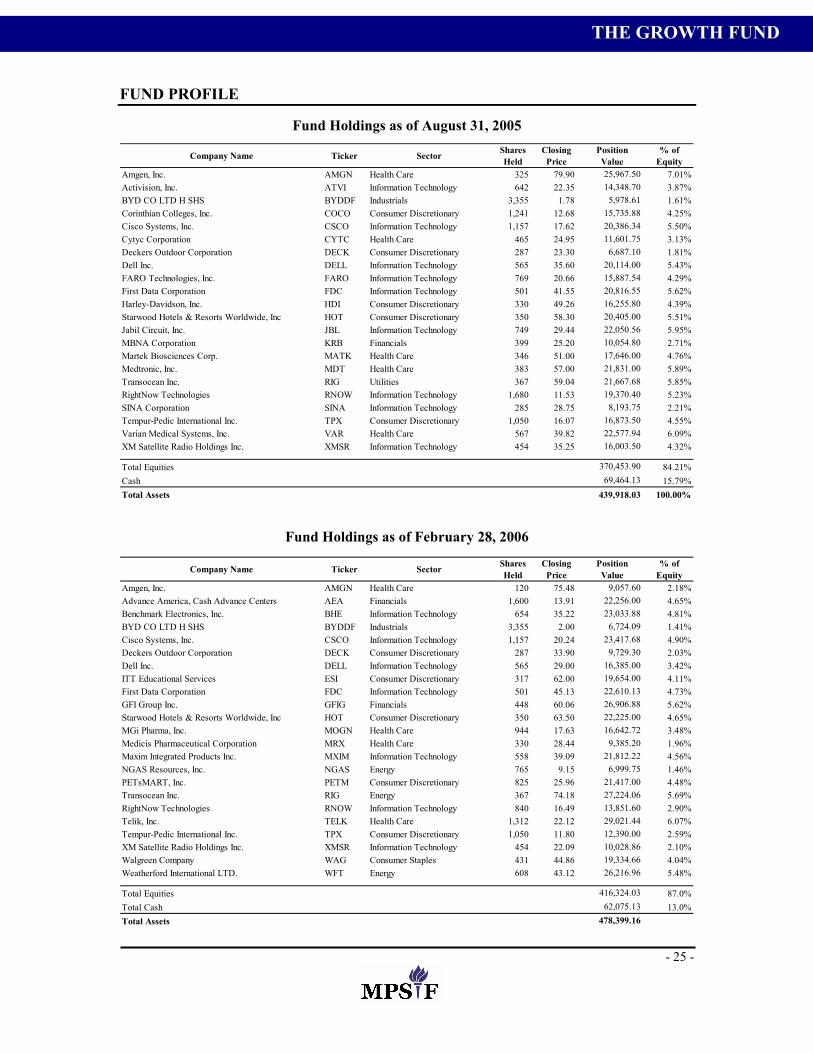
Amgen, Inc. AMGN Health Care 325 79.90 25,967.50 7.01%Activision, Inc. ATVI Information Technology 642 22.35 14,348.70 3.87%BYD CO LTD H SHS BYDDF Industrials 3,355 1.78 5,978.61 1.61%Corinthian Colleges, Inc. COCO Consumer Discretionary 1,241 12.68 15,735.88 4.25%Cisco Systems, Inc. CSCO Information Technology 1,157 17.62 20,386.34 5.50%Cytyc Corporation CYTC Health Care 465 24.95 11,601.75 3.13%Deckers Outdoor Corporation DECK Consumer Discretionary 287 23.30 6,687.10 1.81%Dell Inc. DELL Information Technology 565 35.60 20,114.00 5.43%FARO Technologies, Inc. FARO Information Technology 769 20.66 15,887.54 4.29%First Data Corporation FDC Information Technology 501 41.55 20,816.55 5.62%Harley-Davidson, Inc. HDI Consumer Discretionary 330 49.26 16,255.80 4.39%Starwood Hotels & Resorts Worldwide, Inc HOT Consumer Discretionary 350 58.30 20,405.00 5.51%Jabil Circuit, Inc. JBL Information Technology 749 29.44 22,050.56 5.95%MBNA Corporation KRB Financials 399 25.20 10,054.80 2.71%Martek Biosciences Corp. MATK Health Care 346 51.00 17,646.00 4.76%Medtronic, Inc. MDT Health Care 383 57.00 21,831.00 5.89%Transocean Inc. RIG Utilities 367 59.04 21,667.68 5.85%RightNow Technologies RNOW Information Technology 1,680 11.53 19,370.40 5.23%SINA Corporation SINA Information Technology 285 28.75 8,193.75 2.21%Tempur-Pedic International Inc. TPX Consumer Discretionary 1,050 16.07 16,873.50 4.55%Varian Medical Systems, Inc. VAR Health Care 567 39.82 22,577.94 6.09%XM Satellite Radio Holdings Inc. XMSR Information Technology 454 35.25 16,003.50 4.32%
Total Equities 370,453.90 84.21%Cash 69,464.13 15.79%Total Assets 439,918.03 100.00%
Fund Holdings as of February 28, 2006
Company Name Ticker Sector Shares Held
Closing Price
Position Value
% of Equity
Amgen, Inc. AMGN Health Care 120 75.48 9,057.60 2.18%Advance America, Cash Advance Centers AEA Financials 1,600 13.91 22,256.00 4.65%Benchmark Electronics, Inc. BHE Information Technology 654 35.22 23,033.88 4.81%BYD CO LTD H SHS BYDDF Industrials 3,355 2.00 6,724.09 1.41%Cisco Systems, Inc. CSCO Information Technology 1,157 20.24 23,417.68 4.90%Deckers Outdoor Corporation DECK Consumer Discretionary 287 33.90 9,729.30 2.03%Dell Inc. DELL Information Technology 565 29.00 16,385.00 3.42%ITT Educational Services ESI Consumer Discretionary 317 62.00 19,654.00 4.11%First Data Corporation FDC Information Technology 501 45.13 22,610.13 4.73%GFI Group Inc. GFIG Financials 448 60.06 26,906.88 5.62%Starwood Hotels & Resorts Worldwide, Inc HOT Consumer Discretionary 350 63.50 22,225.00 4.65%MGi Pharma, Inc. MOGN Health Care 944 17.63 16,642.72 3.48%Medicis Pharmaceutical Corporation MRX Health Care 330 28.44 9,385.20 1.96%Maxim Integrated Products Inc. MXIM Information Technology 558 39.09 21,812.22 4.56%NGAS Resources, Inc. NGAS Energy 765 9.15 6,999.75 1.46%PETsMART, Inc. PETM Consumer Discretionary 825 25.96 21,417.00 4.48%Transocean Inc. RIG Energy 367 74.18 27,224.06 5.69%RightNow Technologies RNOW Information Technology 840 16.49 13,851.60 2.90%Telik, Inc. TELK Health Care 1,312 22.12 29,021.44 6.07%Tempur-Pedic International Inc. TPX Consumer Discretionary 1,050 11.80 12,390.00 2.59%XM Satellite Radio Holdings Inc. XMSR Information Technology 454 22.09 10,028.86 2.10%Walgreen Company WAG Consumer Staples 431 44.86 19,334.66 4.04%Weatherford International LTD. WFT Energy 608 43.12 26,216.96 5.48%
Total Equities 416,324.03 87.0%Total Cash 62,075.13 13.0%Total Assets 478,399.16
THE GROWTH FUND
- 26 -
INVESTMENT STYLE AND STRATEGY The goal of the Growth Fund is to identify and take advantage of opportunities that represent significant growth opportunities. These growth opportunities may be a function of a unique business model or occupying a strong competitive position in a rapidly growing industry. We believe that a company that has these characteristics can achieve abnormally high (over 15% over the next five years) earnings growth and in turn stock price appreciation. The goal of the Fund is to identify these opportunities and capitalize on them. However, we also firmly believe in not overpaying for these growth prospects. These growth opportunities can be uncovered by finding companies that are pioneering a new product or service that will see dramatic future demand. We also try to find companies that may be altering pre-established norms in a static industry and are gaining significant market share. Additionally, these companies could be applying their business model to new regions. Companies could simply be a leader in an industry that is experiencing high levels of growth. Our goal is to identify these opportunities and to determine which of these opportunities are attractively priced. The objective is to achieve returns above those of the Russell 1000 Growth Index and to achieve an absolute return in accordance with our positioning as a portion of a university endowment. Investment Process: a Growth Fund analyst begins the investment process by asking a qualitative question, "What is the catalyst for growth?" Once the analyst defines this universe, a quantitative analysis will be applied. The analyst begins with balance sheet analysis, revenue and earnings trends. The analyst will examine relative valuations and then finally performs a fundamental analysis of the company. Analysts in the Growth Fund take a holistic approach to investing. We examine a company’s strategy, competition, management, industry and marketing to fully understand its catalysts for growth. After the analyst finishes his/her assessment, he/she presents the stock to the class. The class analyzes the data and the cash flow model and debates the merits of the stock. After this rigorous process, the group decides whether to purchase the stock. Sell Discipline: We will consider reducing our exposure to a specific stock when:
• The issuer's growth rate deteriorates or its performance otherwise disappoints. • The price of the security attains our price target or otherwise appears relatively high to
the Fund's analysts. • The company publishes negative earnings announcements that affect the company’s long-
term outlook. • Unfavorable changes in management. • Changes in the Fund’s overall economic outlook dictate a re-weighting of sector
allocations.
Why Growth Stocks?
• Growth companies, by definition, are the fastest growing companies in the economy. Management believes that earnings growth is the principal factor determining common stock prices over time.
• Thus, we believe investing in the fastest growing companies that are not currently overpriced should lead to realization of potentially superior long term investment returns.
• The fastest growing companies also tend to be the most adaptable and dynamic companies within the economy. We believe these qualities should also lead to potentially superior returns for investors over the long term. Growth investing has especially outperformed other strategies when the overall growth rate of the market is positive.
THE GROWTH FUND
- 27 -
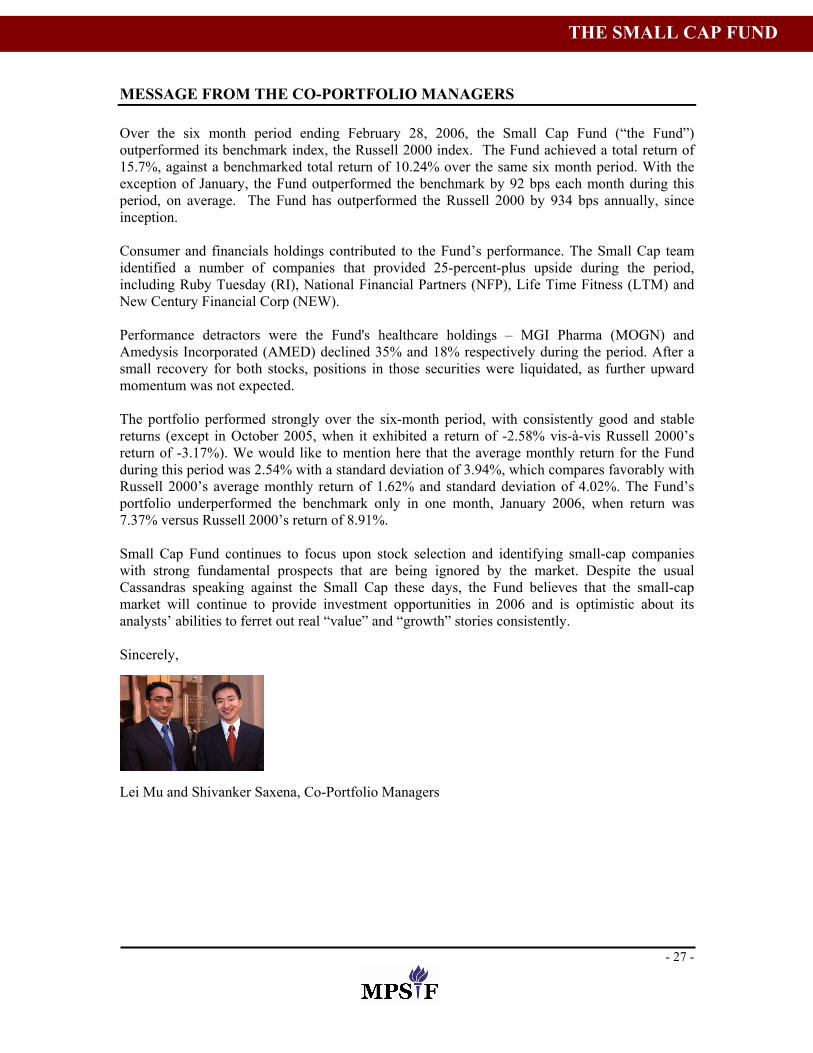
MESSAGE FROM THE CO-PORTFOLIO MANAGERS Over the six month period ending February 28, 2006, the Small Cap Fund (“the Fund”) outperformed its benchmark index, the Russell 2000 index. The Fund achieved a total return of 15.7%, against a benchmarked total return of 10.24% over the same six month period. With the exception of January, the Fund outperformed the benchmark by 92 bps each month during this period, on average. The Fund has outperformed the Russell 2000 by 934 bps annually, since inception. Consumer and financials holdings contributed to the Fund’s performance. The Small Cap team identified a number of companies that provided 25-percent-plus upside during the period, including Ruby Tuesday (RI), National Financial Partners (NFP), Life Time Fitness (LTM) and New Century Financial Corp (NEW). Performance detractors were the Fund's healthcare holdings – MGI Pharma (MOGN) and Amedysis Incorporated (AMED) declined 35% and 18% respectively during the period. After a small recovery for both stocks, positions in those securities were liquidated, as further upward momentum was not expected. The portfolio performed strongly over the six-month period, with consistently good and stable returns (except in October 2005, when it exhibited a return of -2.58% vis-à-vis Russell 2000’s return of -3.17%). We would like to mention here that the average monthly return for the Fund during this period was 2.54% with a standard deviation of 3.94%, which compares favorably with Russell 2000’s average monthly return of 1.62% and standard deviation of 4.02%. The Fund’s portfolio underperformed the benchmark only in one month, January 2006, when return was 7.37% versus Russell 2000’s return of 8.91%. Small Cap Fund continues to focus upon stock selection and identifying small-cap companies with strong fundamental prospects that are being ignored by the market. Despite the usual Cassandras speaking against the Small Cap these days, the Fund believes that the small-cap market will continue to provide investment opportunities in 2006 and is optimistic about its analysts’ abilities to ferret out real “value” and “growth” stories consistently. Sincerely,
Lei Mu and Shivanker Saxena, Co-Portfolio Managers
THE SMALL CAP FUND
- 28 -
PERFORMANCE as of February 28, 2006
Inception
Date 6 Month 1 Year 5 Year* Since
Inception*
Small Capitalization Fund 3/1/2000 15.70% 28.22% 15.82% 14.66% Russell 2000 Index 10.24% 16.59% 10.42% 5.32%
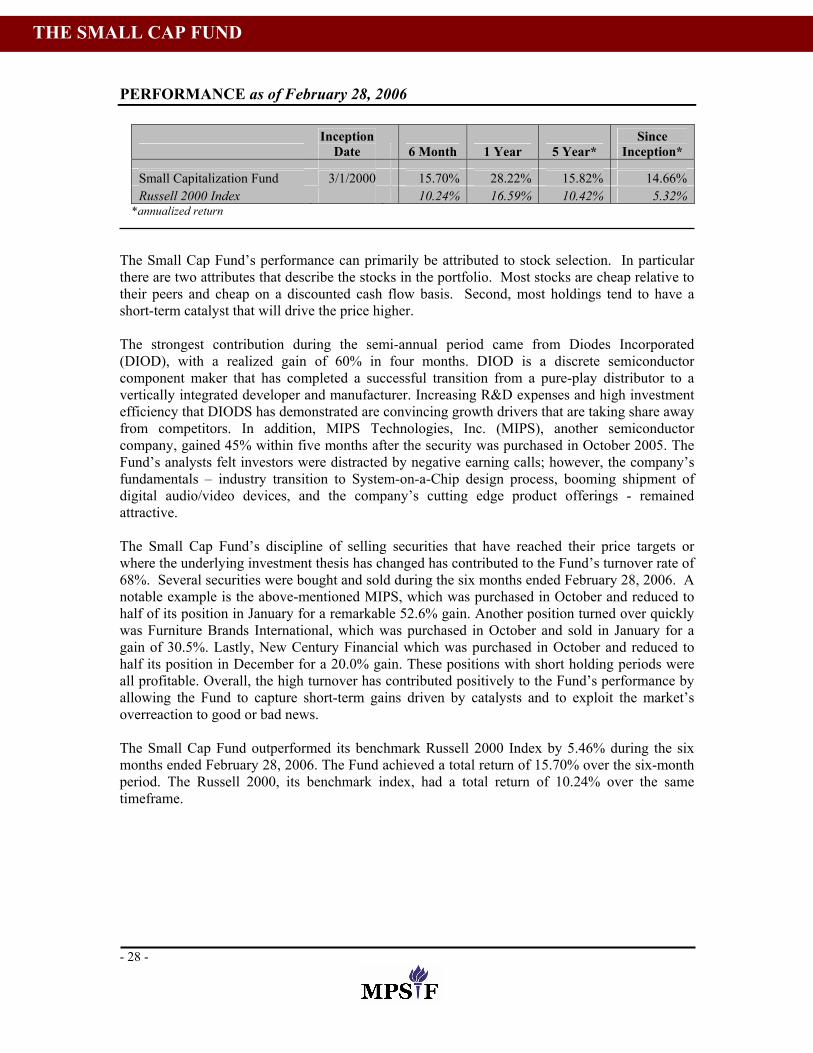
*annualized return The Small Cap Fund’s performance can primarily be attributed to stock selection. In particular there are two attributes that describe the stocks in the portfolio. Most stocks are cheap relative to their peers and cheap on a discounted cash flow basis. Second, most holdings tend to have a short-term catalyst that will drive the price higher. The strongest contribution during the semi-annual period came from Diodes Incorporated (DIOD), with a realized gain of 60% in four months. DIOD is a discrete semiconductor component maker that has completed a successful transition from a pure-play distributor to a vertically integrated developer and manufacturer. Increasing R&D expenses and high investment efficiency that DIODS has demonstrated are convincing growth drivers that are taking share away from competitors. In addition, MIPS Technologies, Inc. (MIPS), another semiconductor company, gained 45% within five months after the security was purchased in October 2005. The Fund’s analysts felt investors were distracted by negative earning calls; however, the company’s fundamentals – industry transition to System-on-a-Chip design process, booming shipment of digital audio/video devices, and the company’s cutting edge product offerings - remained attractive. The Small Cap Fund’s discipline of selling securities that have reached their price targets or where the underlying investment thesis has changed has contributed to the Fund’s turnover rate of 68%. Several securities were bought and sold during the six months ended February 28, 2006. A notable example is the above-mentioned MIPS, which was purchased in October and reduced to half of its position in January for a remarkable 52.6% gain. Another position turned over quickly was Furniture Brands International, which was purchased in October and sold in January for a gain of 30.5%. Lastly, New Century Financial which was purchased in October and reduced to half its position in December for a 20.0% gain. These positions with short holding periods were all profitable. Overall, the high turnover has contributed positively to the Fund’s performance by allowing the Fund to capture short-term gains driven by catalysts and to exploit the market’s overreaction to good or bad news. The Small Cap Fund outperformed its benchmark Russell 2000 Index by 5.46% during the six months ended February 28, 2006. The Fund achieved a total return of 15.70% over the six-month period. The Russell 2000, its benchmark index, had a total return of 10.24% over the same timeframe.
THE SMALL CAP FUND
- 29 -
PERFORMANCE as of February 28, 2006
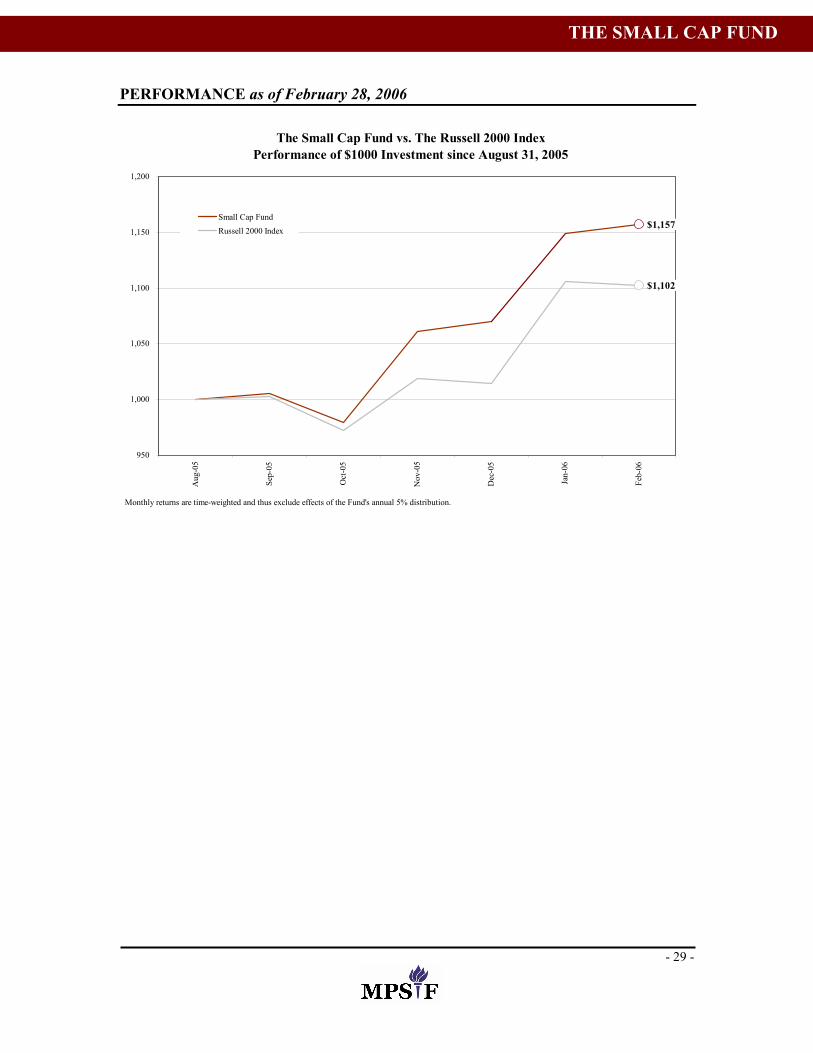
The Small Cap Fund vs. The Russell 2000 IndexPerformance of $1000 Investment since August 31, 2005
$1,157
$1,102
950
1,000
1,050
1,100
1,150
1,200
Aug
-05
Sep-
05
Oct
-05
Nov
-05
Dec
-05
Jan-
06
Feb-
06
Small Cap FundRussell 2000 Index
Monthly returns are time-weighted and thus exclude effects of the Fund's annual 5% distribution.
THE SMALL CAP FUND
- 30 -
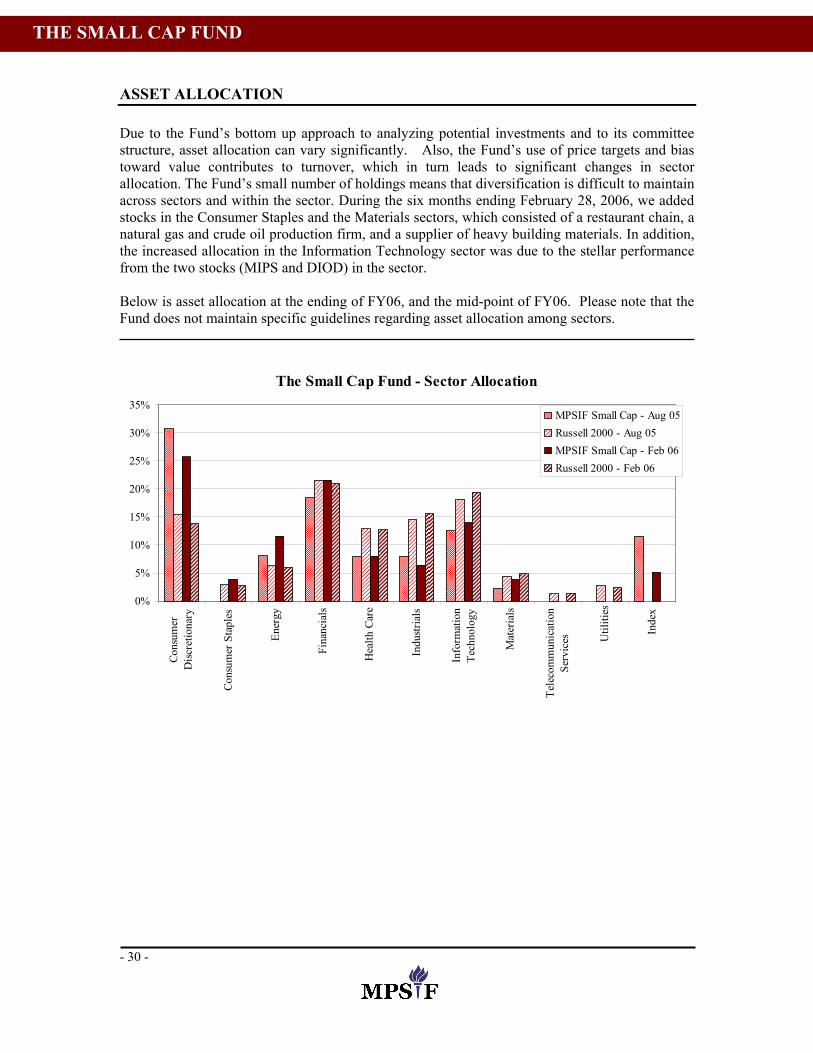
ASSET ALLOCATION Due to the Fund’s bottom up approach to analyzing potential investments and to its committee structure, asset allocation can vary significantly. Also, the Fund’s use of price targets and bias toward value contributes to turnover, which in turn leads to significant changes in sector allocation. The Fund’s small number of holdings means that diversification is difficult to maintain across sectors and within the sector. During the six months ending February 28, 2006, we added stocks in the Consumer Staples and the Materials sectors, which consisted of a restaurant chain, a natural gas and crude oil production firm, and a supplier of heavy building materials. In addition, the increased allocation in the Information Technology sector was due to the stellar performance from the two stocks (MIPS and DIOD) in the sector. Below is asset allocation at the ending of FY06, and the mid-point of FY06. Please note that the Fund does not maintain specific guidelines regarding asset allocation among sectors.
The Small Cap Fund - Sector Allocation
0%
5%
10%
15%
20%
25%
30%
35%
Cons
umer
Disc
retio
nary
Cons
umer
Sta
ples
Ener
gy
Fina
ncia
ls
Hea
lth C
are
Indu
stria
ls
Info
rmat
ion
Tech
nolo
gy
Mat
eria
ls
Tele
com
mun
icat
ion
Serv
ices U
tiliti
es
Inde
x
MPSIF Small Cap - Aug 05Russell 2000 - Aug 05MPSIF Small Cap - Feb 06Russell 2000 - Feb 06
THE SMALL CAP FUND
- 31 -
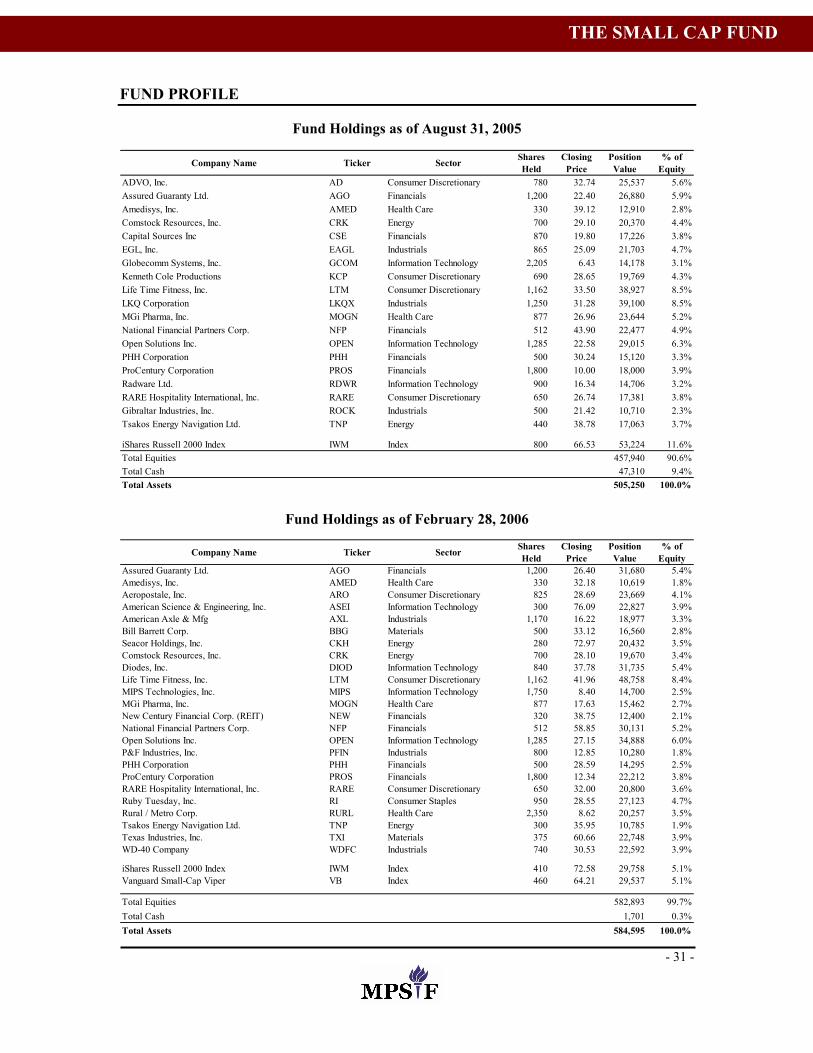
FUND PROFILE
Fund Holdings as of August 31, 2005
Company Name Ticker Sector Shares Held
Closing Price
Position Value
% of Equity
ADVO, Inc. AD Consumer Discretionary 780 32.74 25,537 5.6%Assured Guaranty Ltd. AGO Financials 1,200 22.40 26,880 5.9%Amedisys, Inc. AMED Health Care 330 39.12 12,910 2.8%Comstock Resources, Inc. CRK Energy 700 29.10 20,370 4.4%Capital Sources Inc CSE Financials 870 19.80 17,226 3.8%EGL, Inc. EAGL Industrials 865 25.09 21,703 4.7%Globecomm Systems, Inc. GCOM Information Technology 2,205 6.43 14,178 3.1%Kenneth Cole Productions KCP Consumer Discretionary 690 28.65 19,769 4.3%Life Time Fitness, Inc. LTM Consumer Discretionary 1,162 33.50 38,927 8.5%LKQ Corporation LKQX Industrials 1,250 31.28 39,100 8.5%MGi Pharma, Inc. MOGN Health Care 877 26.96 23,644 5.2%National Financial Partners Corp. NFP Financials 512 43.90 22,477 4.9%Open Solutions Inc. OPEN Information Technology 1,285 22.58 29,015 6.3%PHH Corporation PHH Financials 500 30.24 15,120 3.3%ProCentury Corporation PROS Financials 1,800 10.00 18,000 3.9%Radware Ltd. RDWR Information Technology 900 16.34 14,706 3.2%RARE Hospitality International, Inc. RARE Consumer Discretionary 650 26.74 17,381 3.8%Gibraltar Industries, Inc. ROCK Industrials 500 21.42 10,710 2.3%Tsakos Energy Navigation Ltd. TNP Energy 440 38.78 17,063 3.7%
iShares Russell 2000 Index IWM Index 800 66.53 53,224 11.6%Total Equities 457,940 90.6%Total Cash 47,310 9.4%Total Assets 505,250 100.0%
Fund Holdings as of February 28, 2006
Company Name Ticker Sector Shares Held
Closing Price
Position Value
% of Equity
Assured Guaranty Ltd. AGO Financials 1,200 26.40 31,680 5.4%Amedisys, Inc. AMED Health Care 330 32.18 10,619 1.8%Aeropostale, Inc. ARO Consumer Discretionary 825 28.69 23,669 4.1%American Science & Engineering, Inc. ASEI Information Technology 300 76.09 22,827 3.9%American Axle & Mfg AXL Industrials 1,170 16.22 18,977 3.3%Bill Barrett Corp. BBG Materials 500 33.12 16,560 2.8%Seacor Holdings, Inc. CKH Energy 280 72.97 20,432 3.5%Comstock Resources, Inc. CRK Energy 700 28.10 19,670 3.4%Diodes, Inc. DIOD Information Technology 840 37.78 31,735 5.4%Life Time Fitness, Inc. LTM Consumer Discretionary 1,162 41.96 48,758 8.4%MIPS Technologies, Inc. MIPS Information Technology 1,750 8.40 14,700 2.5%MGi Pharma, Inc. MOGN Health Care 877 17.63 15,462 2.7%New Century Financial Corp. (REIT) NEW Financials 320 38.75 12,400 2.1%National Financial Partners Corp. NFP Financials 512 58.85 30,131 5.2%Open Solutions Inc. OPEN Information Technology 1,285 27.15 34,888 6.0%P&F Industries, Inc. PFIN Industrials 800 12.85 10,280 1.8%PHH Corporation PHH Financials 500 28.59 14,295 2.5%ProCentury Corporation PROS Financials 1,800 12.34 22,212 3.8%RARE Hospitality International, Inc. RARE Consumer Discretionary 650 32.00 20,800 3.6%Ruby Tuesday, Inc. RI Consumer Staples 950 28.55 27,123 4.7%Rural / Metro Corp. RURL Health Care 2,350 8.62 20,257 3.5%Tsakos Energy Navigation Ltd. TNP Energy 300 35.95 10,785 1.9%Texas Industries, Inc. TXI Materials 375 60.66 22,748 3.9%WD-40 Company WDFC Industrials 740 30.53 22,592 3.9%
iShares Russell 2000 Index IWM Index 410 72.58 29,758 5.1%Vanguard Small-Cap Viper VB Index 460 64.21 29,537 5.1%
Total Equities 582,893 99.7%Total Cash 1,701 0.3%Total Assets 584,595 100.0%
THE SMALL CAP FUND
- 32 -
INVESTMENT STYLE AND STRATEGY The objective of the Small Cap Fund is to achieve a total return in excess of the Russell 2000 Index through both capital appreciation and dividends. As an endowment fund, a longer-term goal is to ensure positive returns in excess of the mandated yearly five percent distribution rate plus the annual rate of inflation. The Fund will be invested exclusively in Unites States traded equities, primarily with market capitalizations of less than $2 billion or the equivalent of the largest stock in the Russell 2000 Index. While the Fund does not have an explicit bias toward “growth” or “value” investing, the substantial use of discounted cash flow analysis as a valuation tool may bias our portfolio slightly toward a price-to-earnings ratio lower than that of the Russell benchmark. The Small Cap Fund is intended to be a concentrated portfolio of 20 to 25 positions, with a standard position size of $20,000. Security selection is driven by bottom-up fundamental research in conjunction with the team’s overall sector and economic views. While the Fund is not bound to strict sector guidelines, it is the aim of the Portfolio Managers to be continually aware of the portfolio’s sector weights versus those of the benchmark; the Fund may elect to overweight or underweight specific sectors as appropriate. Historically, the Fund is less actively managed during the winter break (January 2006), as most analysts are away from the desk. To offset the risk inherent in passive management, the Portfolio Managers completed a thorough review of the Fund’s holdings in December 2005 and scaled back on investments that displayed large amounts of volatility. As the session has progressed, the Portfolio Managers, in consultation with the coverage analysts, have made the decision to institute stop loss orders and sell recommendations for number of stocks that have either consistently declined in value or have achieved or exceeded the recommended target price. The excess cash has been placed into two exchange traded funds, IWM (Russell 2000 iShares) and VB (Vanguard Small Cap VIPERs), in an effort to better position the portfolio. The sale of a number of both short-term and long-term holdings left the portfolio with a position of 10.4% in cash, Russell 2000 iShares and Vanguard Small Cap VIPERS, as of February 28, 2006. We have been aggressively identifying new investment opportunities to reduce this cash position.
THE SMALL CAP FUND

- 33 -
MESSAGE FROM THE CO-PORTFOLIO MANAGERS For the six months ended February 28, 2006, the Value Fund (“the Fund”) returned 5.13% versus 7.33% for the benchmark Russell 1000 Value Index. The 2.19% underperformance was primarily due to cash drag and a couple of blowups. U.S. stocks showed robust returns. However, the story is one of two distinct phases - the fourth quarter of 2005 showed limited returns across the market, while the first quarter of 2006 performed more strongly. The growth was also not consistent across all stocks. Small caps outperformed large caps particularly in the later half of this period. The Russell 1000 Value Index outpaced its growth counterpart by 103 bps in this period while the Russell 2000 Value Index outpaced our larger cap fund benchmark by nearly 700 bps! The average P/E ratio across the U.S. equity markets is currently about 17.8x (Russell 1000 Value at 15x). This is well below the frothy figures of the late 1990s, but still not cheap by historical averages. Thus the broader market remains vulnerable to an economic downturn. In the Spring semester the Fund implemented a change in strategy. A commitment was made to increase the investment discipline of the Fund. The Fund moved to a top down portfolio allocation strategy from the previous bottom up stock picking approach. Once attractive sectors are identified, stocks are then screened so the Fund can reach targeted sector allocations. A heavy priority is given to stocks within the Russell Value 1000 index, and the Fund aims to avoid smaller stocks (less than $1Billion market cap). The Fund is also moving to a target portfolio of around 30 stocks from the current 15-20 positions. The greater number of stocks will reduce the effects of blowups as well as enable our sector allocation strategy to reach targeted allocations. The Fund incorporated ETFs in its strategy to reduce cash drag. The ETFs will be replaced when new opportunities are identified. A further operational enhancement was implemented in the last six months, with a strict policy of stop loss levels for all holdings. The Fund was hit by the poor performance of a number of holdings (most recently Boston Communication and Sanderson Farms), and a forced sale at the floor price would have insulated us from much of these losses. At this time, the Fund is aiming to be overweight Consumer Staples, Energy, Healthcare and Information Technology, and to be underweight Financials and Utilities. While the Fund has been hurt by a small number of poor investments, we feel that the additional discipline added to the investment policies of the Fund will allow us to meet our three strategic goals: returning solid absolute returns, outperforming the Russell 1000 Value Index, and being a true Value-based large cap investment fund. Finally, we would like to thank the enthusiastic and skillful student members of our Team. Sincerely,
Chao Mui and Ben Macdonald, Co-Portfolio Managers
THE VALUE FUND

- 34 -
PERFORMANCE as of February 28, 2006
Inception
Date 6 Month 1 Year 5 Year* Since
Inception*
Value Fund 3/1/2000 5.13% 5.11% 4.30% 6.51% Russell 1000 Value Index 7.33% 10.26% 6.73% 8.32%
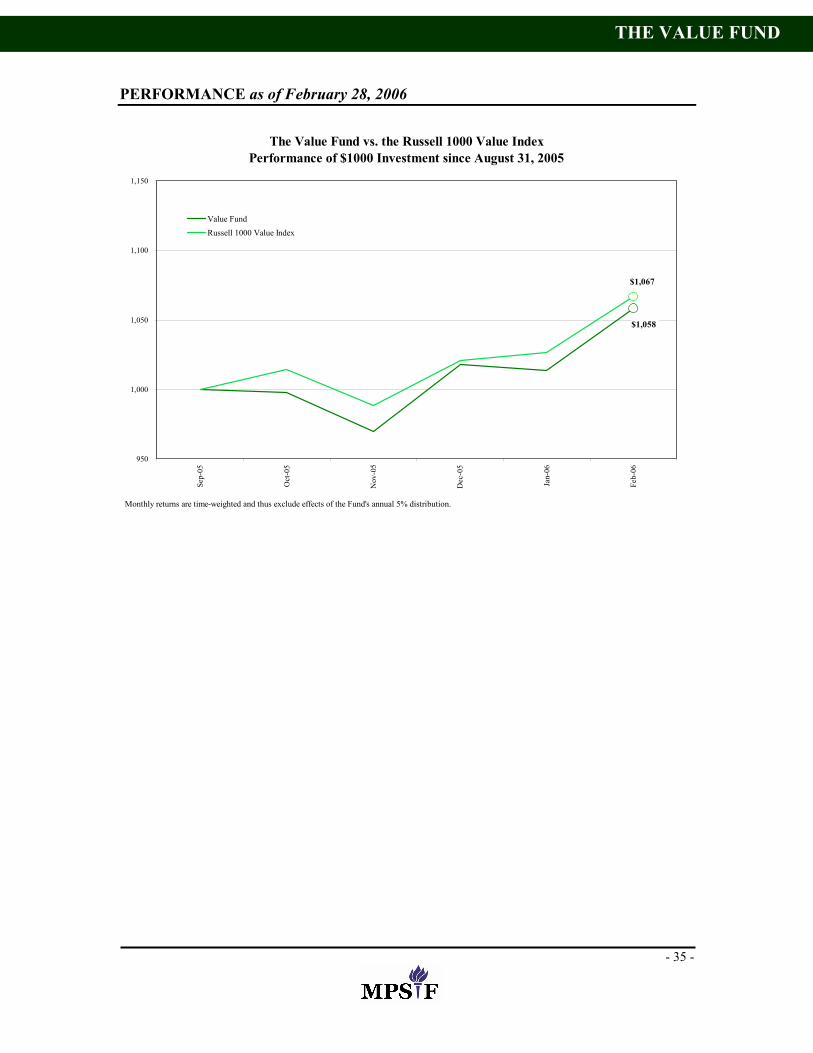
*annualized return For the six months ending February 28, 2006, the Value Fund returned 5.13%, gaining $23,889 in total assets. The Value Fund underperformed the Russell 1000 Value Index by 2.19% for the first half of FY 2006, most noticeably in September (-1.60%). The Fund’s best performer and the largest contributor to the overall performance for the period was Seagate Technology (STX). Purchased on November 2, STX appreciated almost 79% and is now the single largest stock position in the Fund. Freescale Semiconductor continued its strong performance through February, gaining an additional 12.6% return. Sanderson Farms, Inc. (SAFM) has hurt performance steadily since the Fund took a position on October 13, 2005. Through February 28, SAFM is down approximately 36% and remains our largest unrealized loss. Positions suffering major losses in the previous year failed to yield positive returns. Helen of Troy Ltd (HELE) and Boston Communications Group, Inc. (BCGI) continued to stumble depreciating about 12% and 10%, respectively. Lear Corporation (LEA) fell an additional 22% before the Fund sold out of its position. In Energy sector, Pogo Producing Company (PPP) gave back most gains earned in the previous year, depreciating almost 11% in the first half of FY 2006. The Fund chose to eliminate holdings in both Petrokazakhstan Inc. (PKZ) and PG&E Corp (PCG). The remainder of the PKZ position was sold after flat performance in two weeks in FY 2006, while PCG was sold following a 4% loss in the period. Two new holdings in the sector, Apache Corporation (APA) and Cimarex Energy Co. (XEC) had offsetting performance of +3.8% and -2.7%, respectively. The Value Fund’s performance throughout the year is detailed in the following chart and tables.
THE VALUE FUND
- 35 -
PERFORMANCE as of February 28, 2006
The Value Fund vs. the Russell 1000 Value IndexPerformance of $1000 Investment since August 31, 2005
$1,058
$1,067
950
1,000
1,050
1,100
1,150
Sep-
05
Oct
-05
Nov
-05
Dec
-05
Jan-
06
Feb-
06
Value FundRussell 1000 Value Index
Monthly returns are time-weighted and thus exclude effects of the Fund's annual 5% distribution.
THE VALUE FUND
- 36 -
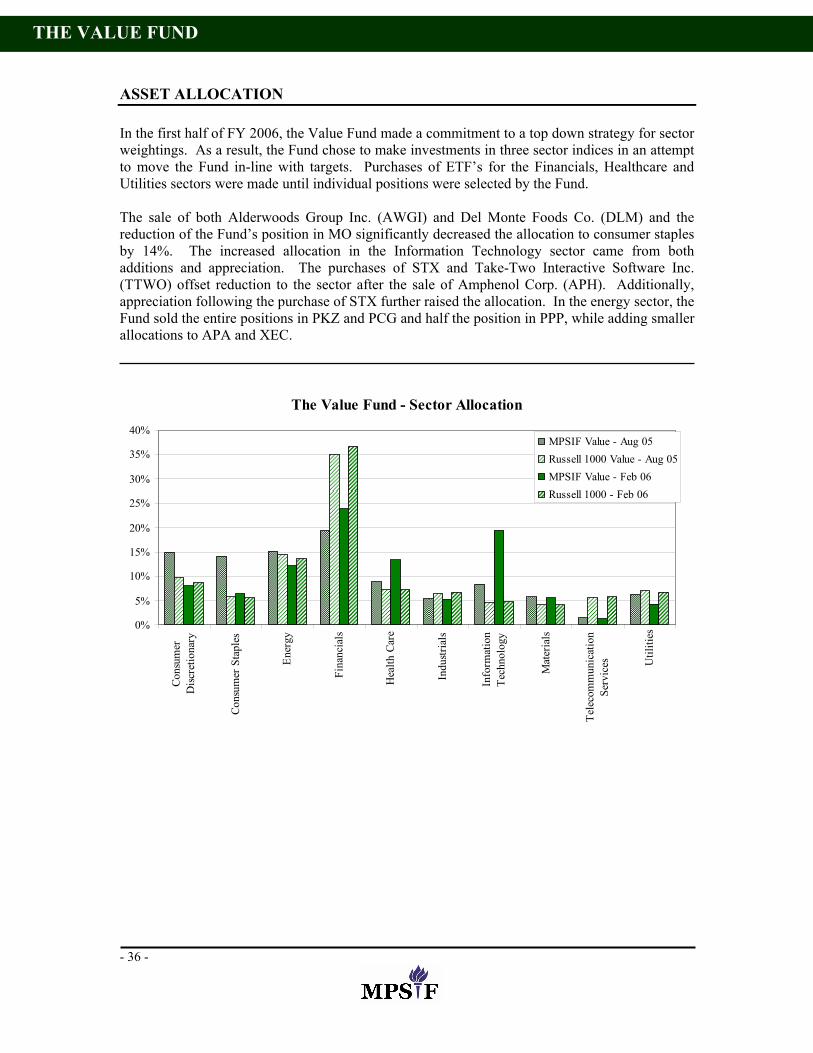
ASSET ALLOCATION In the first half of FY 2006, the Value Fund made a commitment to a top down strategy for sector weightings. As a result, the Fund chose to make investments in three sector indices in an attempt to move the Fund in-line with targets. Purchases of ETF’s for the Financials, Healthcare and Utilities sectors were made until individual positions were selected by the Fund. The sale of both Alderwoods Group Inc. (AWGI) and Del Monte Foods Co. (DLM) and the reduction of the Fund’s position in MO significantly decreased the allocation to consumer staples by 14%. The increased allocation in the Information Technology sector came from both additions and appreciation. The purchases of STX and Take-Two Interactive Software Inc. (TTWO) offset reduction to the sector after the sale of Amphenol Corp. (APH). Additionally, appreciation following the purchase of STX further raised the allocation. In the energy sector, the Fund sold the entire positions in PKZ and PCG and half the position in PPP, while adding smaller allocations to APA and XEC.
The Value Fund - Sector Allocation
0%
5%
10%
15%
20%
25%
30%
35%
40%
Cons
umer
Disc
retio
nary
Cons
umer
Sta
ples
Ener
gy
Fina
ncia
ls
Hea
lth C
are
Indu
stria
ls
Info
rmat
ion
Tech
nolo
gy
Mat
eria
ls
Tele
com
mun
icat
ion
Serv
ices U
tiliti
es
MPSIF Value - Aug 05Russell 1000 Value - Aug 05MPSIF Value - Feb 06Russell 1000 - Feb 06
THE VALUE FUND
- 37 -
FUND PROFILE
Fund Holdings as of August 31, 2005
Company Name Ticker Sector Shares Held
Closing Price
Position Value
% of Equity
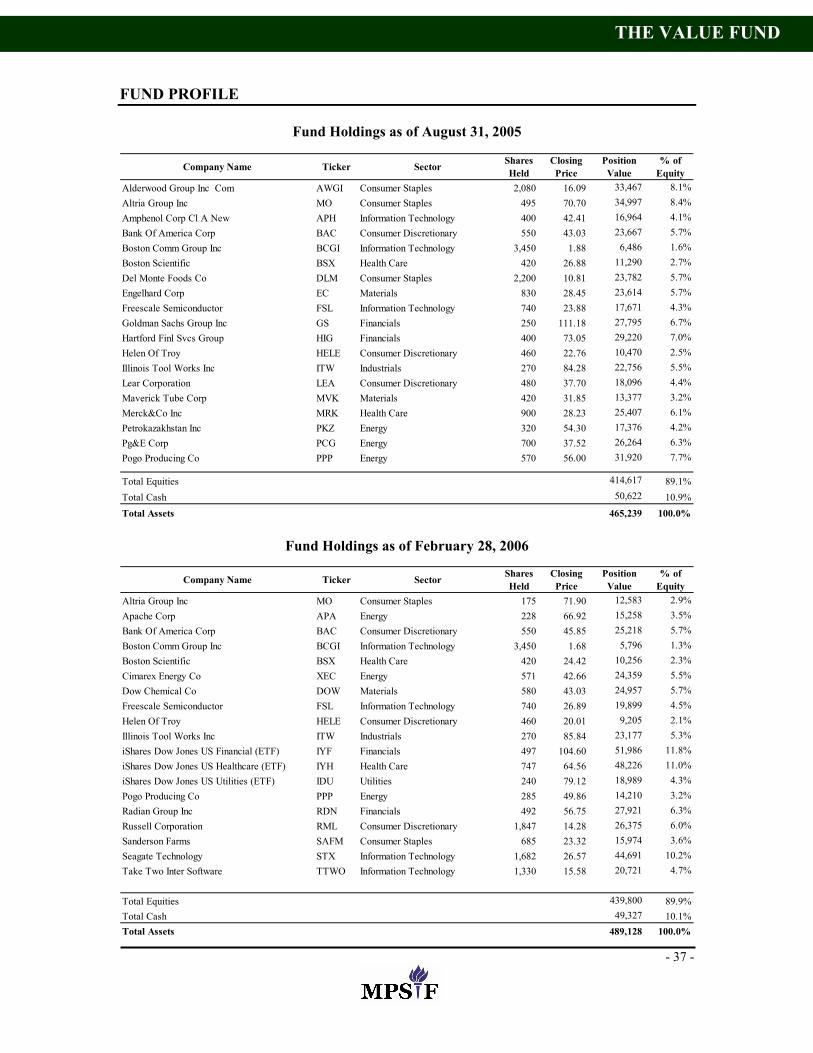
Alderwood Group Inc Com AWGI Consumer Staples 2,080 16.09 33,467 8.1%Altria Group Inc MO Consumer Staples 495 70.70 34,997 8.4%Amphenol Corp Cl A New APH Information Technology 400 42.41 16,964 4.1%Bank Of America Corp BAC Consumer Discretionary 550 43.03 23,667 5.7%Boston Comm Group Inc BCGI Information Technology 3,450 1.88 6,486 1.6%Boston Scientific BSX Health Care 420 26.88 11,290 2.7%Del Monte Foods Co DLM Consumer Staples 2,200 10.81 23,782 5.7%Engelhard Corp EC Materials 830 28.45 23,614 5.7%Freescale Semiconductor FSL Information Technology 740 23.88 17,671 4.3%Goldman Sachs Group Inc GS Financials 250 111.18 27,795 6.7%Hartford Finl Svcs Group HIG Financials 400 73.05 29,220 7.0%Helen Of Troy HELE Consumer Discretionary 460 22.76 10,470 2.5%Illinois Tool Works Inc ITW Industrials 270 84.28 22,756 5.5%Lear Corporation LEA Consumer Discretionary 480 37.70 18,096 4.4%Maverick Tube Corp MVK Materials 420 31.85 13,377 3.2%Merck&Co Inc MRK Health Care 900 28.23 25,407 6.1%Petrokazakhstan Inc PKZ Energy 320 54.30 17,376 4.2%Pg&E Corp PCG Energy 700 37.52 26,264 6.3%Pogo Producing Co PPP Energy 570 56.00 31,920 7.7%
Total Equities 414,617 89.1%Total Cash 50,622 10.9%Total Assets 465,239 100.0%
Fund Holdings as of February 28, 2006
Company Name Ticker Sector Shares Held
Closing Price
Position Value
% of Equity
Altria Group Inc MO Consumer Staples 175 71.90 12,583 2.9%Apache Corp APA Energy 228 66.92 15,258 3.5%Bank Of America Corp BAC Consumer Discretionary 550 45.85 25,218 5.7%Boston Comm Group Inc BCGI Information Technology 3,450 1.68 5,796 1.3%Boston Scientific BSX Health Care 420 24.42 10,256 2.3%Cimarex Energy Co XEC Energy 571 42.66 24,359 5.5%Dow Chemical Co DOW Materials 580 43.03 24,957 5.7%Freescale Semiconductor FSL Information Technology 740 26.89 19,899 4.5%Helen Of Troy HELE Consumer Discretionary 460 20.01 9,205 2.1%Illinois Tool Works Inc ITW Industrials 270 85.84 23,177 5.3%iShares Dow Jones US Financial (ETF) IYF Financials 497 104.60 51,986 11.8%iShares Dow Jones US Healthcare (ETF) IYH Health Care 747 64.56 48,226 11.0%iShares Dow Jones US Utilities (ETF) IDU Utilities 240 79.12 18,989 4.3%Pogo Producing Co PPP Energy 285 49.86 14,210 3.2%Radian Group Inc RDN Financials 492 56.75 27,921 6.3%Russell Corporation RML Consumer Discretionary 1,847 14.28 26,375 6.0%Sanderson Farms SAFM Consumer Staples 685 23.32 15,974 3.6%Seagate Technology STX Information Technology 1,682 26.57 44,691 10.2%Take Two Inter Software TTWO Information Technology 1,330 15.58 20,721 4.7%
Total Equities 439,800 89.9%Total Cash 49,327 10.1%Total Assets 489,128 100.0%
THE VALUE FUND
- 38 -
INVESTMENT STYLE AND STRATEGY Fund Objective: Outperform the benchmark on a total return basis by investing in securities that provide superior returns on a risk/return basis through capital appreciation and dividends. Benchmark: Russell 1000 Value Index Fund Strategy: The Value Fund utilizes a top down approach. The Value Team will evaluate the sector allocation twice per year. In the beginning of each semester the Value Team will determine the sector allocation based on macroeconomic factors. Within each sector, Value analysts will go through a vigorous screening process to select deep value positions. The Team will pursue this strategy by investing primarily in mid to large capitalization companies with consistent year over year earnings that are trading at a discount relative to their peer group. The metrics that will be closely monitored include, but are not limited to: price-earnings, PEG, price to book, DCF, dividend yields, and various free-cash-flow ratios. There is, however, no specific country or region quota. The Fund seeks to outperform its benchmark, the Russell 1000 Value, without significantly deviating from the index’s risk profile. What is Value? Value stocks are stocks that tend to be out of favor. A value stock is one that is under priced by the market for reasons that have nothing to do with the business itself. They are undervalued relative to their comparables on multiple metrics such as PE, PEG, PB, PS, etc. Stocks that are undervalued on metrics compared to the index may not be Value stocks because sectors trade differently. Historical trading multiples is a good indicator of whether the sector is in favor or not. Number of Holdings: 30 positions, approximately 3.3% of assets under management per new position Cash: The goal of the Fund is to be fully invested. However, the Value team may target an allocation to cash in the beginning of the semester. Excess cash may be invested in iShares ETFs in sectors that are underweight our target. The current policy maximum on cash is 10% of assets under management.
THE VALUE FUND
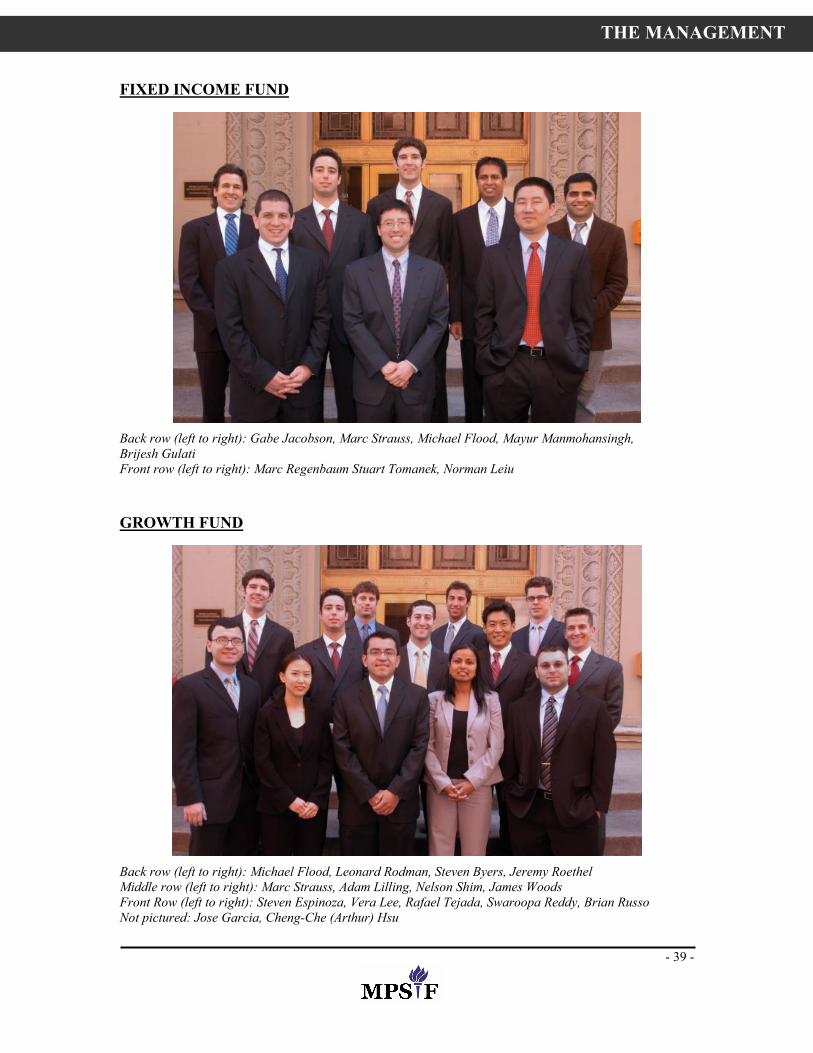
- 39 -
FIXED INCOME FUND
Back row (left to right): Gabe Jacobson, Marc Strauss, Michael Flood, Mayur Manmohansingh, Brijesh Gulati Front row (left to right): Marc Regenbaum Stuart Tomanek, Norman Leiu GROWTH FUND
Back row (left to right): Michael Flood, Leonard Rodman, Steven Byers, Jeremy Roethel Middle row (left to right): Marc Strauss, Adam Lilling, Nelson Shim, James Woods Front Row (left to right): Steven Espinoza, Vera Lee, Rafael Tejada, Swaroopa Reddy, Brian Russo Not pictured: Jose Garcia, Cheng-Che (Arthur) Hsu
THE MANAGEMENT
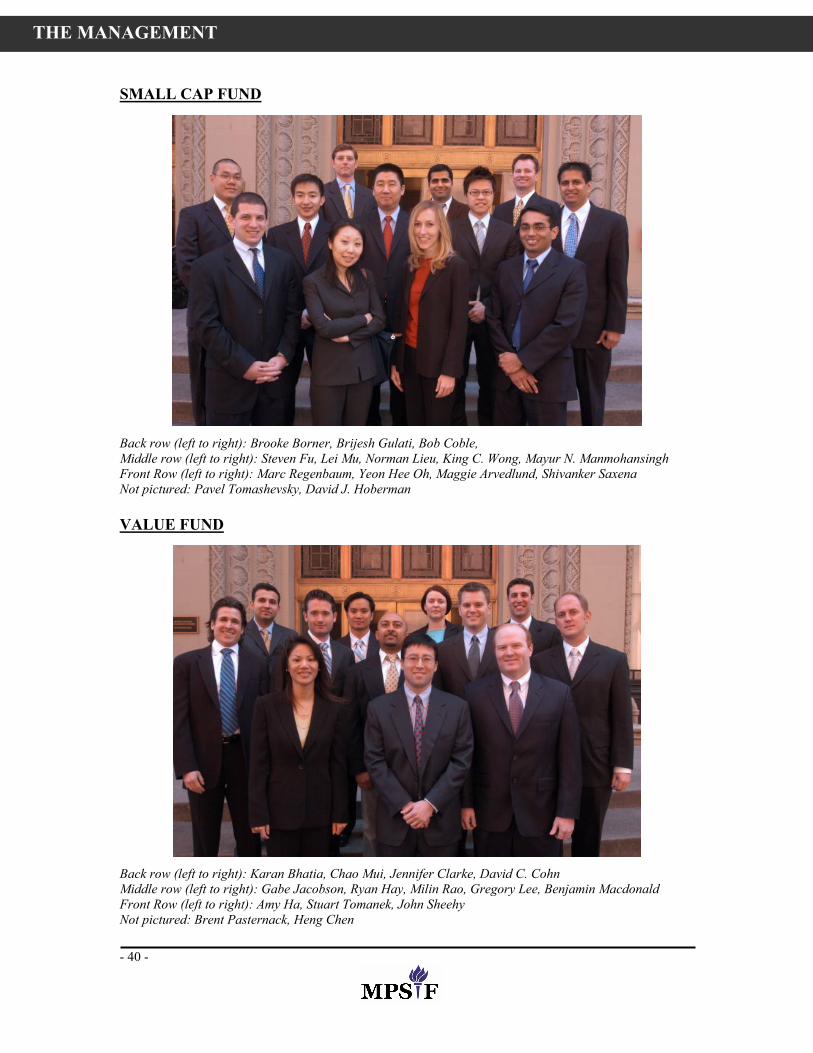
- 40 -
SMALL CAP FUND
Back row (left to right): Brooke Borner, Brijesh Gulati, Bob Coble, Middle row (left to right): Steven Fu, Lei Mu, Norman Lieu, King C. Wong, Mayur N. Manmohansingh Front Row (left to right): Marc Regenbaum, Yeon Hee Oh, Maggie Arvedlund, Shivanker Saxena Not pictured: Pavel Tomashevsky, David J. Hoberman VALUE FUND
Back row (left to right): Karan Bhatia, Chao Mui, Jennifer Clarke, David C. Cohn Middle row (left to right): Gabe Jacobson, Ryan Hay, Milin Rao, Gregory Lee, Benjamin Macdonald Front Row (left to right): Amy Ha, Stuart Tomanek, John Sheehy Not pictured: Brent Pasternack, Heng Chen
THE MANAGEMENT
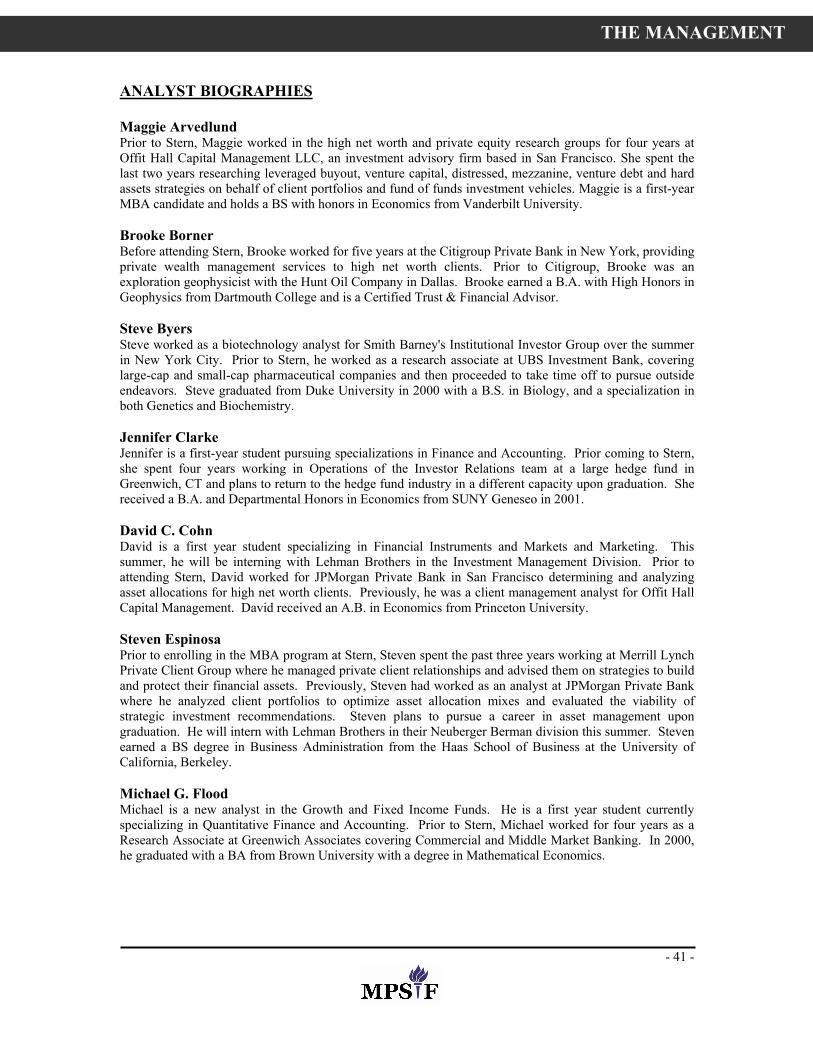
- 41 -
ANALYST BIOGRAPHIES Maggie Arvedlund Prior to Stern, Maggie worked in the high net worth and private equity research groups for four years at Offit Hall Capital Management LLC, an investment advisory firm based in San Francisco. She spent the last two years researching leveraged buyout, venture capital, distressed, mezzanine, venture debt and hard assets strategies on behalf of client portfolios and fund of funds investment vehicles. Maggie is a first-year MBA candidate and holds a BS with honors in Economics from Vanderbilt University. Brooke Borner Before attending Stern, Brooke worked for five years at the Citigroup Private Bank in New York, providing private wealth management services to high net worth clients. Prior to Citigroup, Brooke was an exploration geophysicist with the Hunt Oil Company in Dallas. Brooke earned a B.A. with High Honors in Geophysics from Dartmouth College and is a Certified Trust & Financial Advisor. Steve Byers Steve worked as a biotechnology analyst for Smith Barney's Institutional Investor Group over the summer in New York City. Prior to Stern, he worked as a research associate at UBS Investment Bank, covering large-cap and small-cap pharmaceutical companies and then proceeded to take time off to pursue outside endeavors. Steve graduated from Duke University in 2000 with a B.S. in Biology, and a specialization in both Genetics and Biochemistry. Jennifer Clarke Jennifer is a first-year student pursuing specializations in Finance and Accounting. Prior coming to Stern, she spent four years working in Operations of the Investor Relations team at a large hedge fund in Greenwich, CT and plans to return to the hedge fund industry in a different capacity upon graduation. She received a B.A. and Departmental Honors in Economics from SUNY Geneseo in 2001. David C. Cohn David is a first year student specializing in Financial Instruments and Markets and Marketing. This summer, he will be interning with Lehman Brothers in the Investment Management Division. Prior to attending Stern, David worked for JPMorgan Private Bank in San Francisco determining and analyzing asset allocations for high net worth clients. Previously, he was a client management analyst for Offit Hall Capital Management. David received an A.B. in Economics from Princeton University. Steven Espinosa Prior to enrolling in the MBA program at Stern, Steven spent the past three years working at Merrill Lynch Private Client Group where he managed private client relationships and advised them on strategies to build and protect their financial assets. Previously, Steven had worked as an analyst at JPMorgan Private Bank where he analyzed client portfolios to optimize asset allocation mixes and evaluated the viability of strategic investment recommendations. Steven plans to pursue a career in asset management upon graduation. He will intern with Lehman Brothers in their Neuberger Berman division this summer. Steven earned a BS degree in Business Administration from the Haas School of Business at the University of California, Berkeley. Michael G. Flood Michael is a new analyst in the Growth and Fixed Income Funds. He is a first year student currently specializing in Quantitative Finance and Accounting. Prior to Stern, Michael worked for four years as a Research Associate at Greenwich Associates covering Commercial and Middle Market Banking. In 2000, he graduated with a BA from Brown University with a degree in Mathematical Economics.
THE MANAGEMENT
- 42 -
Steven Fu Prior to Stern, Steven was a Senior Research Associate at Driehaus Capital Management in Chicago. He interned as a Summer Associate with the Investment Management Division of Lehman Brothers, where he rotated through the Alternative Investment Management group and Neuberger Berman Equity Research. He received his BA in Economics from the University of Chicago and is a CFA Level III Candidate Amy Ha, CFA Prior to attending Stern, Amy worked in the Pension Consulting Division of Wilshire Associates, Inc., as a supervisor of investment performance. This past summer, she worked at Citigroup in the Corporate Banking division where she covered the technology and healthcare sectors. Amy received her B.A. in Economics from University of California, Los Angeles. David Hoberman Prior to Stern, David was a Senior Loan Analyst with a leading mortgage company. This past summer he worked in Equity Research at a hedge fund. David holds a Bachelor of Science in Finance from the Rutgers University. Ryan H. Hay Prior to attending Stern, Ryan was a junior portfolio manager and equity analyst at LibertyView Capital Management, a Division of Neuberger Berman. There he focused on Risk Arbitrage and Special Situation equity Long / Short investing. Ryan will be spending this summer at Lehman Brothers in their Sales & Trading division. He received his B.S. from Rutgers, The State University of New Jersey in 2001. Cheng-Che (Arthur) Hsu Prior to Stern, Arthur spent four years as a product and project manager in Ericsson, a leading telecommunication equipment vendor. This past summer he worked as a research associate for Smith Barney, Citigroup. Arthur holds a Master of Science in Electrical Engineering from National Taiwan University, and is currently a CFA Level III candidate. Gabe Jacobson Prior to Stern, Gabe was an associate in the corporate department at Latham & Watkins LLP in New York. Gabe's legal practice focused on the representation of issuers and underwriters in connection with primary securities offerings. Gabe holds a B.S. in Industrial and Labor Relations from Cornell University and a J.D. for New York University's School of Law. Debbie Jones Debbie spent her summer working at Deutsche Bank in Equity Research covering the Telecom industry and the Gaming, Lodging and Leisure sector. Prior to Stern, she researched investment funds offered through insurance products for a financial services company in Los Angeles. She holds a B.A. in Economics and Psychology from Claremont McKenna College. Gregory Lee Prior to Stern, Greg worked as an equity research associate for Raymond James & Associates covering companies in the technology sector. Greg is currently employed on a part-time basis as an equity analyst covering the consumer goods sector at Legg Mason. Greg graduated cum laude from the University of Pennsylvania in 2002 with a B.A. in Economics and is a CFA Level III candidate. Vera S. Lee Prior to Stern, Vera was an equity research associate at BNP Paribas Securities Korea, where she covered Telecom and Technology industries. She spent the past summer working in the portfolio management group and risk management group at GE Capital - Energy Financial Services. Vera holds a B.B.A degree from Ewha Womans University in Seoul, Korea.
THE MANAGEMENT

- 43 -
Adam S. Lilling Prior to Stern, Adam worked in Relationship Banking at ABN AMRO and in Global Credit at Bear Stearns. This summer he will be working at UBS in Equity Research. Adam graduated in 2002 from the University of Michigan Business School with a Bachelors of Business Administration in Finance and is a candidate for Level III of the CFA Program. Ben Macdonald Over the summer, Ben worked in Standard & Poor's Structured Finance Ratings Division, with most of his time spent analyzing Asset-Backed Securities in the rental fleet, student loan and dealer floor plan areas. His previous career was in IT consulting, where he worked as a software developer and technical architect in projects across Australia and the U.S. Ben has undergraduate degrees in Science and Electrical Engineering from Sydney University. Mayur Manmohansingh, CFA, CPA Mayur worked for four years as a financial audit consultant with Ernst & Young LLP specializing in audits of investment companies. He has worked in the Stamford, New York City and Cayman Island offices of Ernst & Young LLP. Prior to this, he was an investment analyst at Royal Bank Trust Company of Trinidad and Tobago. Mayur graduated from McGill University with a Bachelor’s of Commerce with concentrations in Accounting and Finance. He is a member of both the New York Society of Security Analysts and the American Institute of Certified Public Accountants. Lei Mu Lei spent his summer interning at Mohr, Davidow Ventures (MDV) and Mayfield at California Bay Area. Prior to Stern, he was an associate with E-Millennium L.P., a private equity investment arm of Deutsche Bank, where he evaluated and screened hundreds of business plans per annum. Before his private equity tenure, Lei was working at The Boston Consulting Group (BCG) as an associate, where he was involved in founding and operating the BCG’s high-tech investment fund in Shanghai. He received his Dual Bachelor of Science degrees in Mechanical Engineering and Electrical Engineering from Tsinghua University at Beijing, China. Chao Mui Chao spent his summer with Banc of America Securities (BAS) in the Corporate & Investment Banking Division focusing on Financial Institutions, Healthcare and Media Telecom. Chao will join BAS after graduation in the Financial Institutions Group. Prior to Stern, Chao was a Senior Business Analyst at American Express Financial Advisors (now Ameriprise) in the Asset Management Group and a Financial Advisor at Morgan Stanley. Chao received his B.S.B. in Finance and Management Information Systems from the University of Minnesota and is a CFA Level III Candidate. Yeon Hee Oh Prior to attending Stern, Yeon Hee worked in the Investment Banking Division of JPMorgan Chase and the Corporate Banking Division of RBS Greenwich Capital. Yeon Hee received B.A. in Economics from Barnard College. Brent Pasternack Brent spent the past summer working with Edward Altman and the NYU Salomon Center as a research assistant, focusing on the high yield market and distressed debt. Brent is currently working part-time as a research analyst for the Haberman Value Fund, a long-short hedge fund in Manhattan. Prior to Stern, Brent worked for five years at UBS Wealth Management. Brent received his B.B.A. from the Goizueta Business School at Emory University, and is currently a CFA Level II candidate. Milin Rao, CFA Prior to Stern, Milin had five years of business development and project management experience at Capital IQ, Inc. (a division of Standard & Poors,) a leading financial data and analytics provider. Milin holds a BS in Economics (with Departmental Honors) from The State University of New York at Stony Brook and he is a CFA Charterholder.
THE MANAGEMENT

- 44 -
Swaroopa Reddy Prior to Stern, Swaroopa worked at Ernst & Young within the Technology and Security Risk Group. She managed client relationships while providing consulting and advisory services to clients within the financial services sector. Swaroopa holds a Bachelors degree in Economics and Politics from Brandeis University. Additionally, she holds a Masters from the London School of Economics in Management of Information Systems focusing on Security & Privacy Risk. Marc Regenbaum Prior to attending Stern, Marc was a research associate covering the Retail and Consumer Products sectors at Helios Partners Fund Management, a long/short equity hedge fund based in New York. Prior to Helios, Marc served as an associate at Tower Capital, a hedge fund of funds, and for three years as a financial analyst in the Retail Investment Banking group at Credit Suisse First Boston. Marc graduated Magna Cum Laude from Duke University in 2000 with a Bachelor of Arts in Economics. Jeremy Roethel, CFA During the forthcoming summer, Jeremy will be working for Merrill Lynch's Global Markets group in London. Before attending Stern, he was a Senior Equity Systems Analyst for DuPont Capital Management, focusing on products and development for International Equities. Jeremy received an Honors B.S. in Finance and a B.S. in Economics from the University of Delaware, is a CFA Charterholder, and is a member of the New York Society of Securities Analysts. Marco Ruiz Marco currently works as Senior Portfolio Analyst at the International Reserves Department of the Central Bank of Colombia. He is part of the investment team that designs and implements foreign exchange, fixed income and money market strategies for a $6 billion portfolio. He holds a bachelor's degree in Economics from the University of the Andes and passed the CFA Level II examination. Brian Russo Mr. Russo spent the summer working at Brocair Partners, a boutique investment bank focused on Healthcare. He previously worked for the leading health insurance IT services firm, Hewitt Associates, where he led a team of software analysts in the implementation of health management systems for Liberty Mutual Insurance, United Technologies, and other Fortune 500 companies. Previous to this he earned a patent as an engineer with Pitney Bowes, and before that redesigned operations for Pratt & Whitney. Mr. Russo holds a bachelor's degree in Mechanical Engineering from the University of Connecticut. Shivanker Saxena Prior to Stern, Mr. Shivanker was Relationship Manager in Corporate Credit with ICICI Bank, India’s largest private sector bank. He has also worked with ICICI Limited in Project Finance and with PricewaterhouseCoopers in Audit and Business Advisory Group in India. This past summer, he worked in Credit Research at Fore Research & Management, a credit/convertible arbitrage hedge fund in New York. Shivanker is a Chartered Accountant (equivalent to US CPA) and holds a Bachelor of Commerce (Honors) from the University of Delhi in India. John Sheehy, CPA Prior to attending Stern, John worked as an Audit and Assurance Manager for Deloitte & Touche LLP, specializing in consumer products and manufacturing companies. John received his B.A. in Economics and Accounting from The College of the Holy Cross in Worcester, Massachusetts. John is a certified public accountant in both the Commonwealth of Massachusetts and the State of New Jersey. John will be working as a Summer Associate in Equity Research at Morgan Stanley. Nelson Shim Nelson spent the summer working as a credit analyst at the Bank of New York. Prior to Stern he was a capital markets analyst with E-loan and an investment banking analyst with SG Cowen Securities. Nelson received a B.A. in Economics from Stanford University. He has passed the CFA Level III exam and is currently awaiting the award of his CFA charter.
THE MANAGEMENT

- 45 -
Marc Strauss Marc Strauss is a second year student specializing in Quantitative Finance and Financial Instruments and Markets. Following graduation, he will be joining Barclays Capital as a Fixed Income Sales Associate. Prior to business school, Marc spent four years as an analyst for Deutsche Bank in their Debt Capital Markets group, where he focused on both investment grade and high yield credits. Marc earned a B.S. in both Finance and Accounting from Lehigh University in 2000. Rafael Tejada Prior to joining the Growth Fund, Rafael worked at Cornell University Medical College as a research associate in oncology/hematology. He spent the summer of 2005 at Lehman Brothers working as a desk analyst/trader for the healthcare cash-trading desk. Rafael received his B.S. in Biology from Georgetown University in 2001. Stuart Tomanek Prior to joining the Value and Fixed Income funds, Stuart worked at JP Morgan Securities in New York as a business manager for the fixed income sales force. He sent the summer of 2005 as an associate with Lehman Brothers in New York where he will be returning to the Capital Markets Sales and Trading division. Stuart earned a B.A. in Economics from Bucknell University in 1998, and is currently a CFA Level II candidate. Paul Tomashevsky Prior to Stern, Paul worked as an Underwriter for The CIT Group in its assed based lending division, working on secured lines of credit to mostly middle market clients. This past summer, Paul has worked for Bear Sterns and Co. as an investment banking associate. Paul will also be joining Bear full time upon his graduation. He has a Bachelors degree in Finance from Pace University. King Wong King currently works as an associate at The Dellacorte Group, a middle market private equity investment firm in addition to his second role as an equity research associate at Leerink Swann & Company, a healthcare boutique investment bank, covering the medical devices and specialty pharmaceuticals sectors. Prior to Stern, King was a management consultant at PricewaterhouseCoopers’ Management Consulting Services (now IBM Business Consulting Services) in the Supply Chain Operations and Strategy practice. King received a B.S. in Industrial Engineering (summa cum laude) and a B.A. in Psychology (summa cum laude) from State University of New York at Buffalo. James Woods, CFA Prior to Stern, Jim spent four years in financial reporting and analysis at CIGNA Corporation in Philadelphia. This followed two years at The Vanguard Group, where he spent time in the Operations and Compliance departments. Jim earned a B.S. in Finance from Bentley College in 1999. He is a CFA charterholder and member of the New York Society of Security Analysts.
THE MANAGEMENT

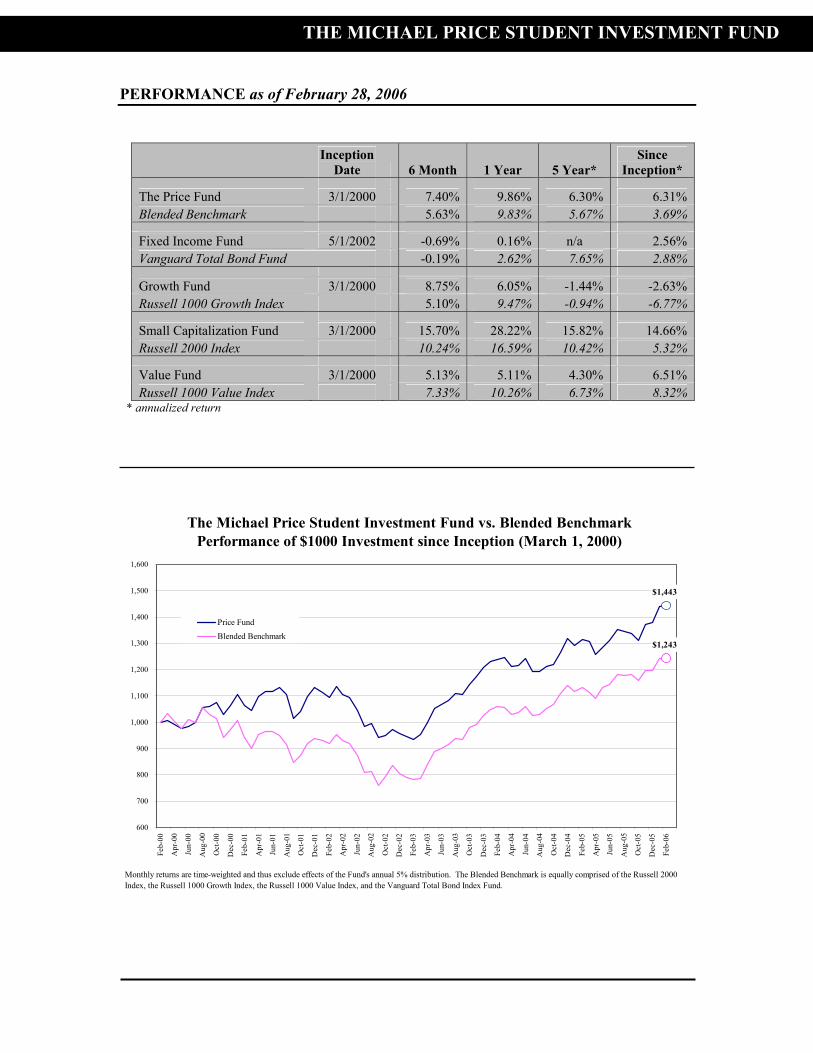
PERFORMANCE as of February 28, 2006
Inception
Date 6 Month 1 Year 5 Year* Since
Inception*
The Price Fund 3/1/2000 7.40% 9.86% 6.30% 6.31% Blended Benchmark 5.63% 9.83% 5.67% 3.69%
Fixed Income Fund 5/1/2002 -0.69% 0.16% n/a 2.56% Vanguard Total Bond Fund -0.19% 2.62% 7.65% 2.88%
Growth Fund 3/1/2000 8.75% 6.05% -1.44% -2.63% Russell 1000 Growth Index 5.10% 9.47% -0.94% -6.77%
Small Capitalization Fund 3/1/2000 15.70% 28.22% 15.82% 14.66% Russell 2000 Index 10.24% 16.59% 10.42% 5.32%
Value Fund 3/1/2000 5.13% 5.11% 4.30% 6.51% Russell 1000 Value Index 7.33% 10.26% 6.73% 8.32%
* annualized return
The Michael Price Student Investment Fund vs. Blended BenchmarkPerformance of $1000 Investment since Inception (March 1, 2000)
$1,443
$1,243
600
700
800
900
1,000
1,100
1,200
1,300
1,400
1,500
1,600
Feb-
00
Apr
-00
Jun-
00
Aug
-00
Oct
-00
Dec
-00
Feb-
01
Apr
-01
Jun-
01
Aug
-01
Oct
-01
Dec
-01
Feb-
02
Apr
-02
Jun-
02
Aug
-02
Oct
-02
Dec
-02
Feb-
03
Apr
-03
Jun-
03
Aug
-03
Oct
-03
Dec
-03
Feb-
04
Apr
-04
Jun-
04
Aug
-04
Oct
-04
Dec
-04
Feb-
05
Apr
-05
Jun-
05
Aug
-05
Oct
-05
Dec
-05
Feb-
06
Price Fund
Blended Benchmark
Monthly returns are time-weighted and thus exclude effects of the Fund's annual 5% distribution. The Blended Benchmark is equally comprised of the Russell 2000 Index, the Russell 1000 Growth Index, the Russell 1000 Value Index, and the Vanguard Total Bond Index Fund.
THE MICHAEL PRICE STUDENT INVESTMENT FUND
The Michael Price Student Investment Fund _______________________________________
The Funds Fixed Income Growth Small Cap Value
THE MICHAEL PRICE STUDENT INVESTMENT FUND