Embed Size (px)
Citation preview
2018 GLOBAL VIDEO
BENCHMARKS
THE METEORIC RISE OF CONNECTED TV
INNOVID’S GLOBAL VIDEO BENCHMARKS
Welcome
The insights and data that comprise this report
are culled from every campaign that ran
with Innovid between January 1st, 2018 and
December 31st, 2018 – a sample representing
roughly one third of all U.S. video impressions.
While these benchmarks provide a critical
snapshot of the state of video advertising in
2019, we know that savvy marketers need
more than data points and baselines to
accurately assess their campaign performance.
That’s why we’ll go beyond the numbers to
provide insights powered by a combination
of Innovid’s original data and a decade of
experience as the only end-to-end global
connected TV and video advertising platform.
As always, this report will help you to compare the
performance of standard pre-roll video to that of
interactive video across devices and channels, as
well as offer benchmarks and overall performance
for key video KPIs including click-through rates,
engagement, completion rate, and time-earned.
We’ll also examine the impact of data-driven
video in a world that increasingly demands
personalization to make messages meaningful. But
we’ll also go beyond video to explore the future of
television advertising. Our data shows significant
change as streaming consumers shift their
viewing habits to connected TV platforms. For
marketers and broadcast publishers, this means
new opportunities and a realignment of budgets
and strategy to meet consumer expectations. To
that end, we offer benchmarks and insights to
help the industry surf this transformative wave.
Table of contents
1 Welcome & Key Findings
3 Connected TV Takes Off
7 Personalization & Interactive
13 Video Benchmarks
1 2018 Global Video Benchmarks Report | innovid.com
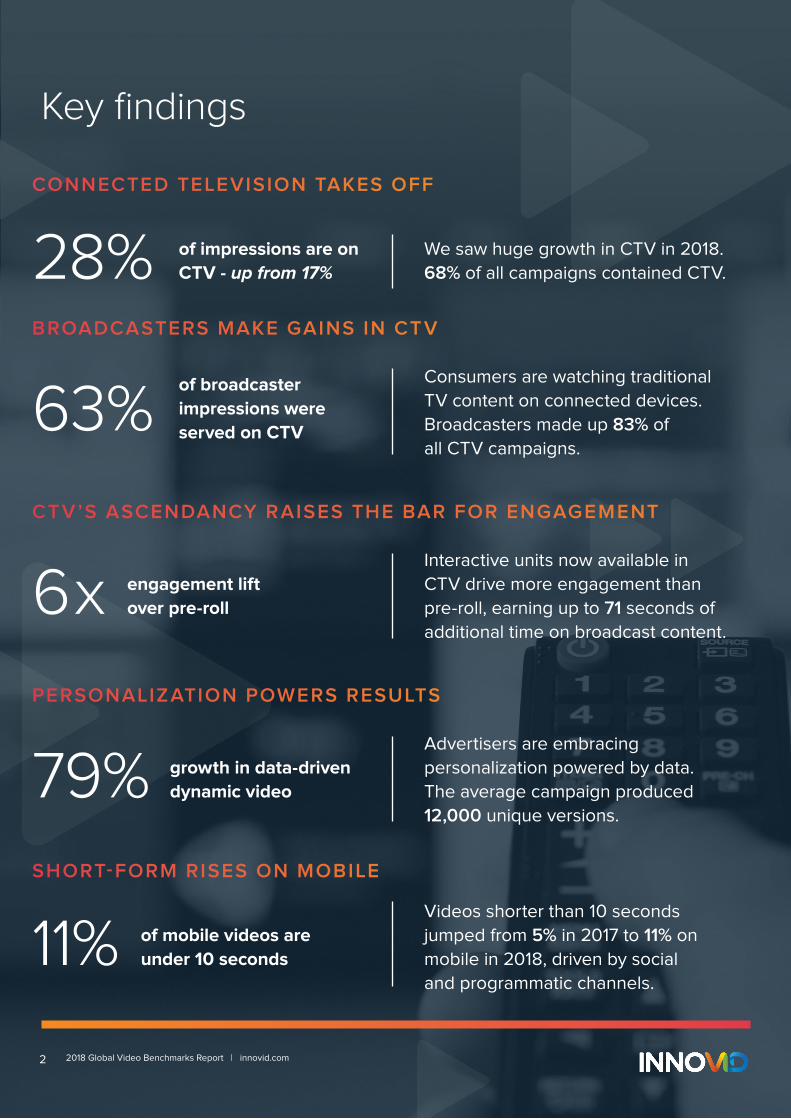
Interactive units now available in
CTV drive more engagement than
pre-roll, earning up to 71 seconds of
additional time on broadcast content.
Advertisers are embracing
personalization powered by data.
The average campaign produced
12,000 unique versions.
Videos shorter than 10 seconds
jumped from 5% in 2017 to 11% on
mobile in 2018, driven by social
and programmatic channels.
6x
79%
11%
engagement lift
over pre-roll
growth in data-driven
dynamic video
of mobile videos are
under 10 seconds
We saw huge growth in CTV in 2018.
68% of all campaigns contained CTV. 28% of impressions are on
CTV - up from 17%
CONNECTED TELEVISION TAKES OFF
Consumers are watching traditional
TV content on connected devices.
Broadcasters made up 83% of
all CTV campaigns.
63%of broadcaster
impressions were
served on CTV
BROADCASTERS MAKE GAINS IN CTV
CTV’S ASCENDANCY RAISES THE BAR FOR ENGAGEMENT
PERSONALIZATION POWERS RESULTS
SHORT-FORM RISES ON MOBILE
Key findings
2 2018 Global Video Benchmarks Report | innovid.com
The average American spends 5 hours and
11 minutes per day* watching television in
some form. Not only is that number gradually
increasing, but it’s increasingly weighted
toward content consumed via connected
devices. Over 55% of the US population**
currently owns a connected TV device –
that’s roughly 182.6 million people – a
figure that is expected to climb to 60.1% by
the year 2022. In other words, connected
television is surging. That surge represents
a fundamental change in viewing habits
and media consumption for the majority of
consumers and a host of new opportunities
for advertisers. Modern advertisers have
become increasingly accustomed to
working in digital, with its dense metrics
and potential for meaningful engagement
and interaction. The rise of connected
TV will allow top marketers to bring those
same expectations to advertising’s most
powerful channel, television. In 2018 the
number of impressions served on connected
TV platforms jumped from 17% in 2017 to
28%. All signs indicate that number will
continue to rise as connected TV audiences
continue to grow and broadcasters and
other publishers shift more content into
connected TV. Furthermore, it’s clear
that digital ad dollars are following eyes.
Spending on desktop display declined
last year from 37% of all impressions
in 2017 to 25% in 2018, a shift that was
offset by rising connected TV spend.
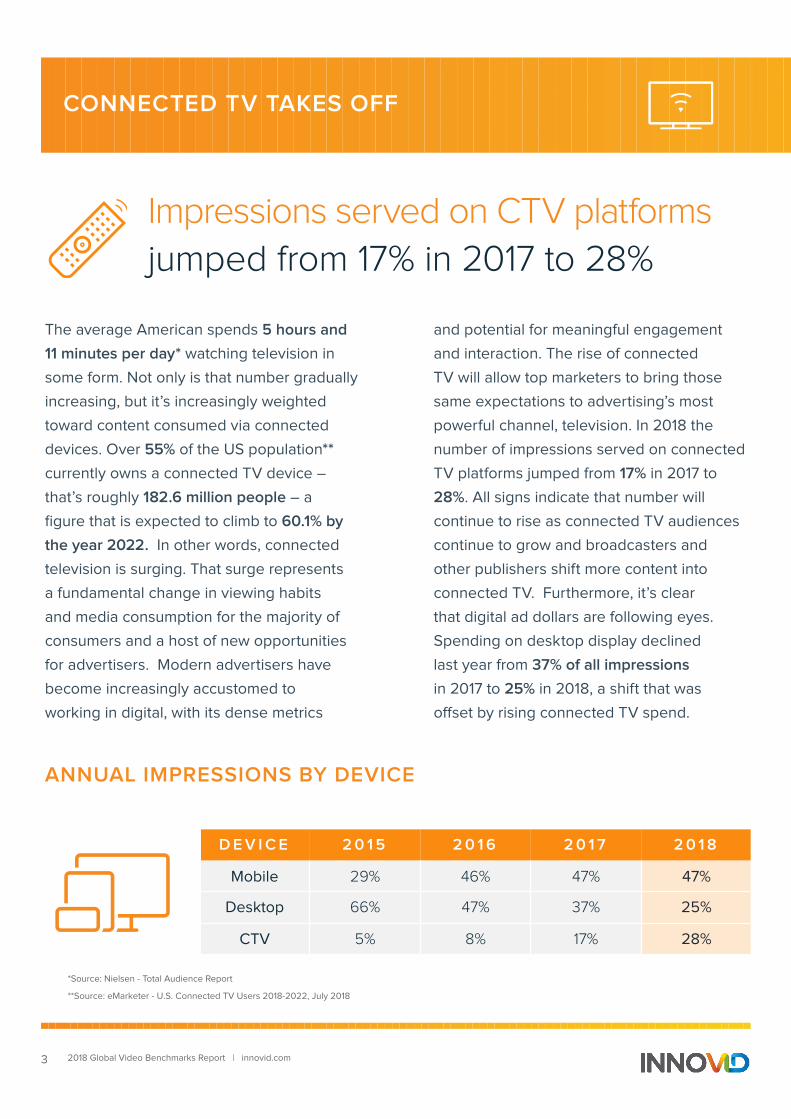
Impressions served on CTV platforms
jumped from 17% in 2017 to 28%
CONNECTED TV TAKES OFF
3 2018 Global Video Benchmarks Report | innovid.com
*Source: Nielsen - Total Audience Report
**Source: eMarketer - U.S. Connected TV Users 2018-2022, July 2018
ANNUAL IMPRESSIONS BY DEVICE
D E V I C E 2 0 1 5 2 0 1 6 2 0 1 7 2 0 1 8
Mobile 29% 46% 47% 47%
Desktop 66% 47% 37% 25%
CTV 5% 8% 17% 28%
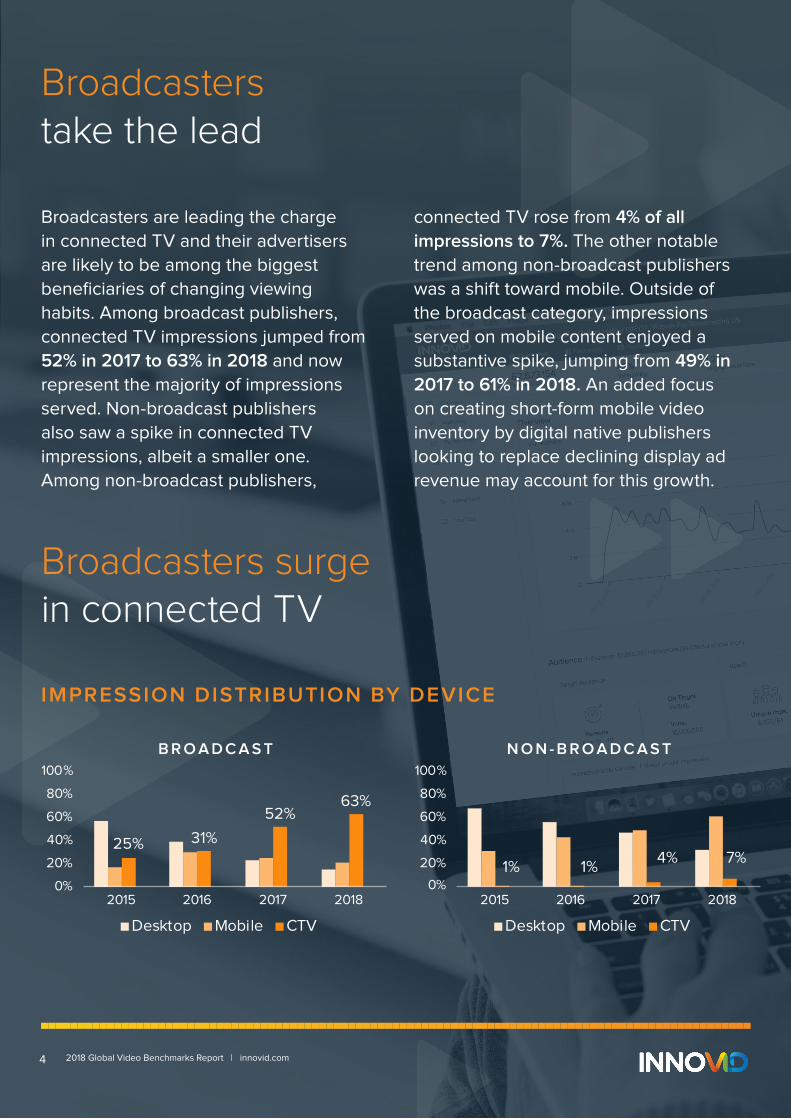
Broadcasters are leading the charge
in connected TV and their advertisers
are likely to be among the biggest
beneficiaries of changing viewing
habits. Among broadcast publishers,
connected TV impressions jumped from
52% in 2017 to 63% in 2018 and now
represent the majority of impressions
served. Non-broadcast publishers
also saw a spike in connected TV
impressions, albeit a smaller one.
Among non-broadcast publishers,
connected TV rose from 4% of all
impressions to 7%. The other notable
trend among non-broadcast publishers
was a shift toward mobile. Outside of
the broadcast category, impressions
served on mobile content enjoyed a
substantive spike, jumping from 49% in
2017 to 61% in 2018. An added focus
on creating short-form mobile video
inventory by digital native publishers
looking to replace declining display ad
revenue may account for this growth.
Broadcasters take the lead
Broadcasters surge in connected TV
25% 31%
52%63%
0%
20%
40%
60%
80%
100%
2015 2016 2017 2018
B R O A D C A S T
Desktop Mobile CTV
1% 1%4% 7%
0%
20%
40%
60%
80%
100%
2015 2016 2017 2018
N O N - B R O A D C A S T
Desktop Mobile CTV
IMPRESSION DISTRIBUTION BY DEVICE
4 2018 Global Video Benchmarks Report | innovid.com
CONNECTED TV TAKES OFFCONNECTED TV TAKES OFF
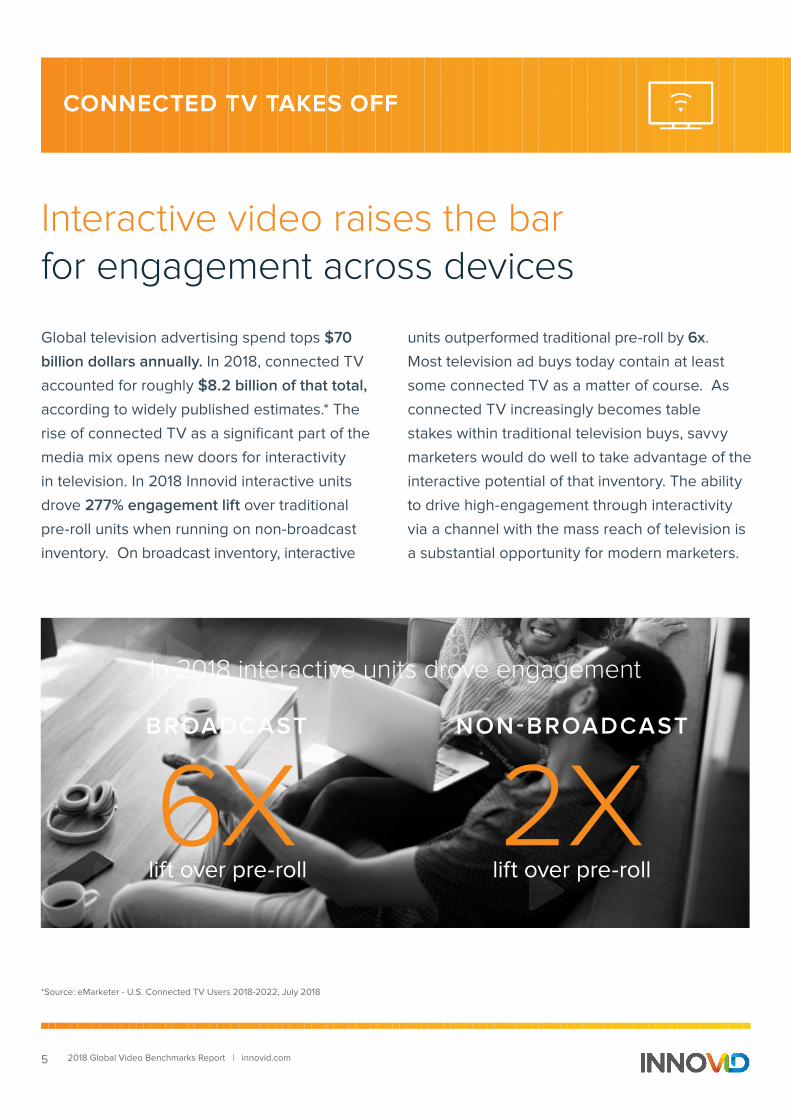
Interactive video raises the bar for engagement across devices
Global television advertising spend tops $70
billion dollars annually. In 2018, connected TV
accounted for roughly $8.2 billion of that total,
according to widely published estimates.* The
rise of connected TV as a significant part of the
media mix opens new doors for interactivity
in television. In 2018 Innovid interactive units
drove 277% engagement lift over traditional
pre-roll units when running on non-broadcast
inventory. On broadcast inventory, interactive
units outperformed traditional pre-roll by 6x.
Most television ad buys today contain at least
some connected TV as a matter of course. As
connected TV increasingly becomes table
stakes within traditional television buys, savvy
marketers would do well to take advantage of the
interactive potential of that inventory. The ability
to drive high-engagement through interactivity
via a channel with the mass reach of television is
a substantial opportunity for modern marketers.
5 2018 Global Video Benchmarks Report | innovid.com
6X 2XBROADCAST NON-BROADCAST
In 2018 interactive units drove engagement
*Source: eMarketer - U.S. Connected TV Users 2018-2022, July 2018
lift over pre-roll lift over pre-roll
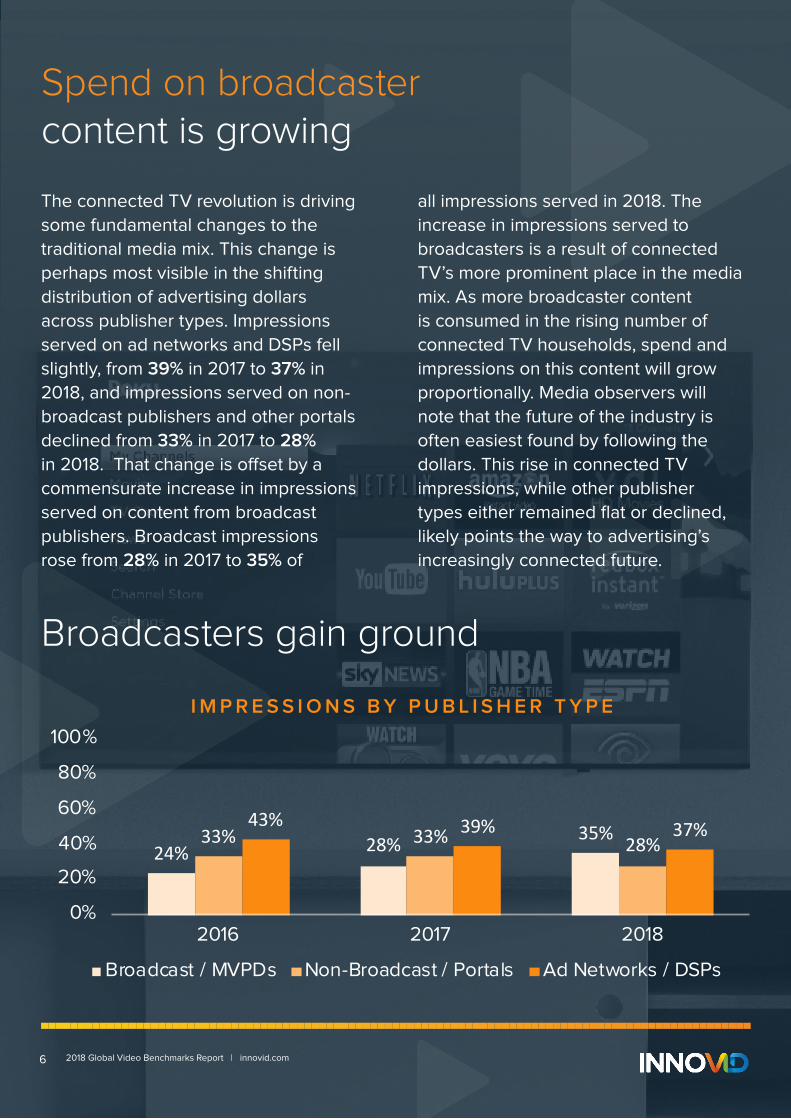
Spend on broadcaster content is growing
The connected TV revolution is driving
some fundamental changes to the
traditional media mix. This change is
perhaps most visible in the shifting
distribution of advertising dollars
across publisher types. Impressions
served on ad networks and DSPs fell
slightly, from 39% in 2017 to 37% in
2018, and impressions served on non-
broadcast publishers and other portals
declined from 33% in 2017 to 28%
in 2018. That change is offset by a
commensurate increase in impressions
served on content from broadcast
publishers. Broadcast impressions
rose from 28% in 2017 to 35% of
all impressions served in 2018. The
increase in impressions served to
broadcasters is a result of connected
TV’s more prominent place in the media
mix. As more broadcaster content
is consumed in the rising number of
connected TV households, spend and
impressions on this content will grow
proportionally. Media observers will
note that the future of the industry is
often easiest found by following the
dollars. This rise in connected TV
impressions, while other publisher
types either remained flat or declined,
likely points the way to advertising’s
increasingly connected future.
Broadcasters gain ground
24% 28% 35%33% 33% 28%43% 39% 37%
0%
20%
40%
60%
80%
100%
2016 2017 2018
I M P R E S S I O N S B Y P U B L I S H E R T Y P E
Broadcast / MVPDs Non-Broadcast / Portals Ad Networks / DSPs
6 2018 Global Video Benchmarks Report | innovid.com
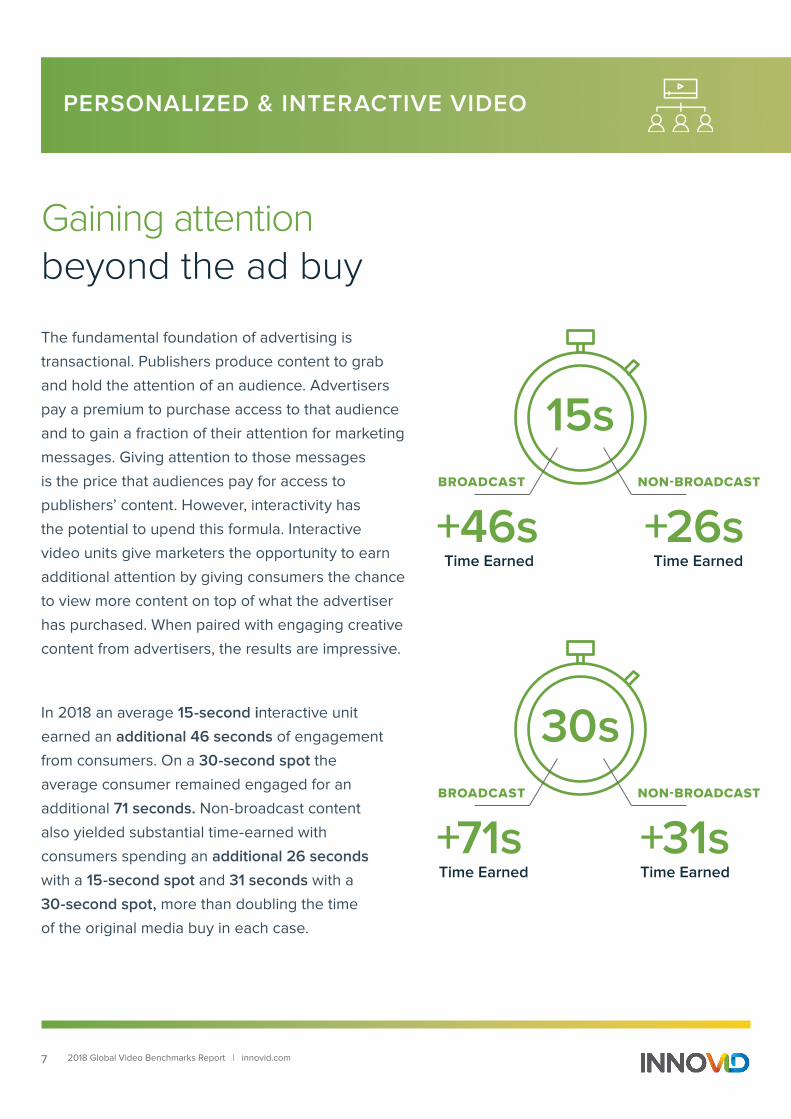
PERSONALIZED & INTERACTIVE VIDEOPERSONALIZED & INTERACTIVE VIDEO
The fundamental foundation of advertising is
transactional. Publishers produce content to grab
and hold the attention of an audience. Advertisers
pay a premium to purchase access to that audience
and to gain a fraction of their attention for marketing
messages. Giving attention to those messages
is the price that audiences pay for access to
publishers’ content. However, interactivity has
the potential to upend this formula. Interactive
video units give marketers the opportunity to earn
additional attention by giving consumers the chance
to view more content on top of what the advertiser
has purchased. When paired with engaging creative
content from advertisers, the results are impressive.
In 2018 an average 15-second interactive unit
earned an additional 46 seconds of engagement
from consumers. On a 30-second spot the
average consumer remained engaged for an
additional 71 seconds. Non-broadcast content
also yielded substantial time-earned with
consumers spending an additional 26 seconds
with a 15-second spot and 31 seconds with a
30-second spot, more than doubling the time
of the original media buy in each case.
Gaining attention beyond the ad buy
7 2018 Global Video Benchmarks Report | innovid.com
30s
+71sTime Earned Time Earned
+31sBROADCAST NON-BROADCAST
15s
+46sTime Earned Time Earned
+26sBROADCAST NON-BROADCAST
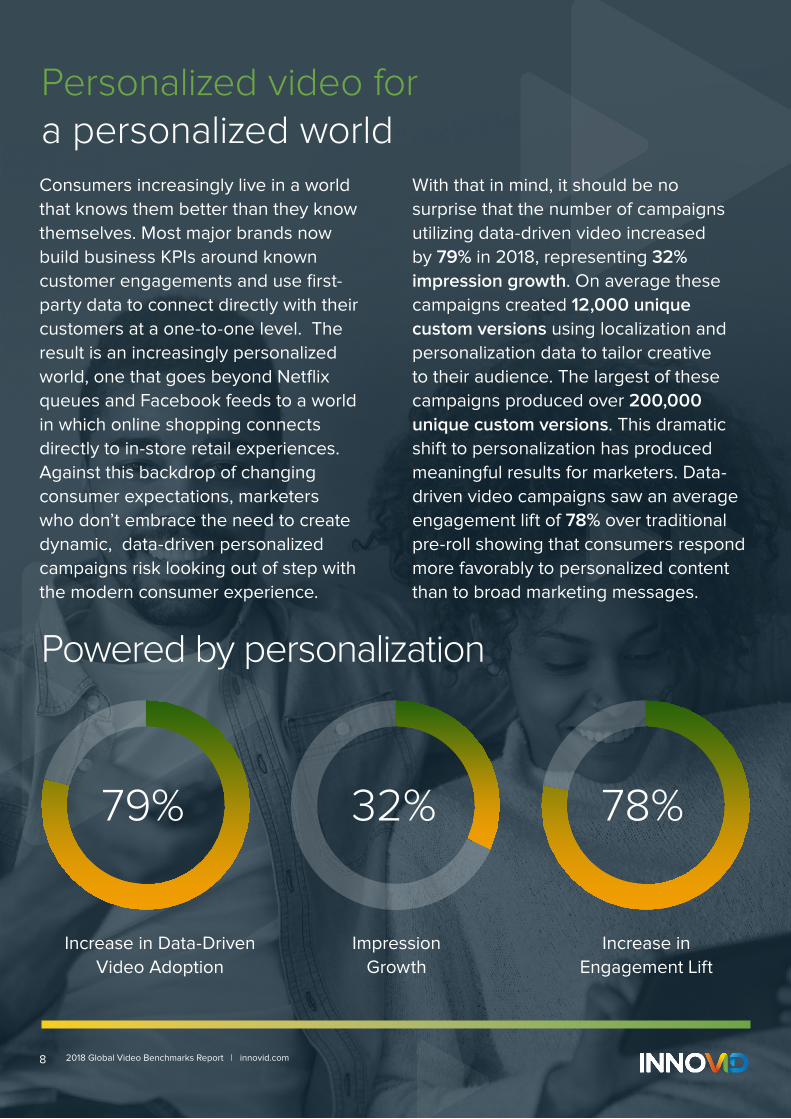
Impression
Growth
Increase in Data-Driven
Video Adoption
Increase in
Engagement Lift
79% 32% 78%
Consumers increasingly live in a world
that knows them better than they know
themselves. Most major brands now
build business KPIs around known
customer engagements and use first-
party data to connect directly with their
customers at a one-to-one level. The
result is an increasingly personalized
world, one that goes beyond Netflix
queues and Facebook feeds to a world
in which online shopping connects
directly to in-store retail experiences.
Against this backdrop of changing
consumer expectations, marketers
who don’t embrace the need to create
dynamic, data-driven personalized
campaigns risk looking out of step with
the modern consumer experience.
With that in mind, it should be no
surprise that the number of campaigns
utilizing data-driven video increased
by 79% in 2018, representing 32%
impression growth. On average these
campaigns created 12,000 unique
custom versions using localization and
personalization data to tailor creative
to their audience. The largest of these
campaigns produced over 200,000
unique custom versions. This dramatic
shift to personalization has produced
meaningful results for marketers. Data-
driven video campaigns saw an average
engagement lift of 78% over traditional
pre-roll showing that consumers respond
more favorably to personalized content
than to broad marketing messages.
Personalized video for a personalized world
Powered by personalization
2018 Global Video Benchmarks Report | innovid.com8
PERSONALIZED & INTERACTIVE VIDEO
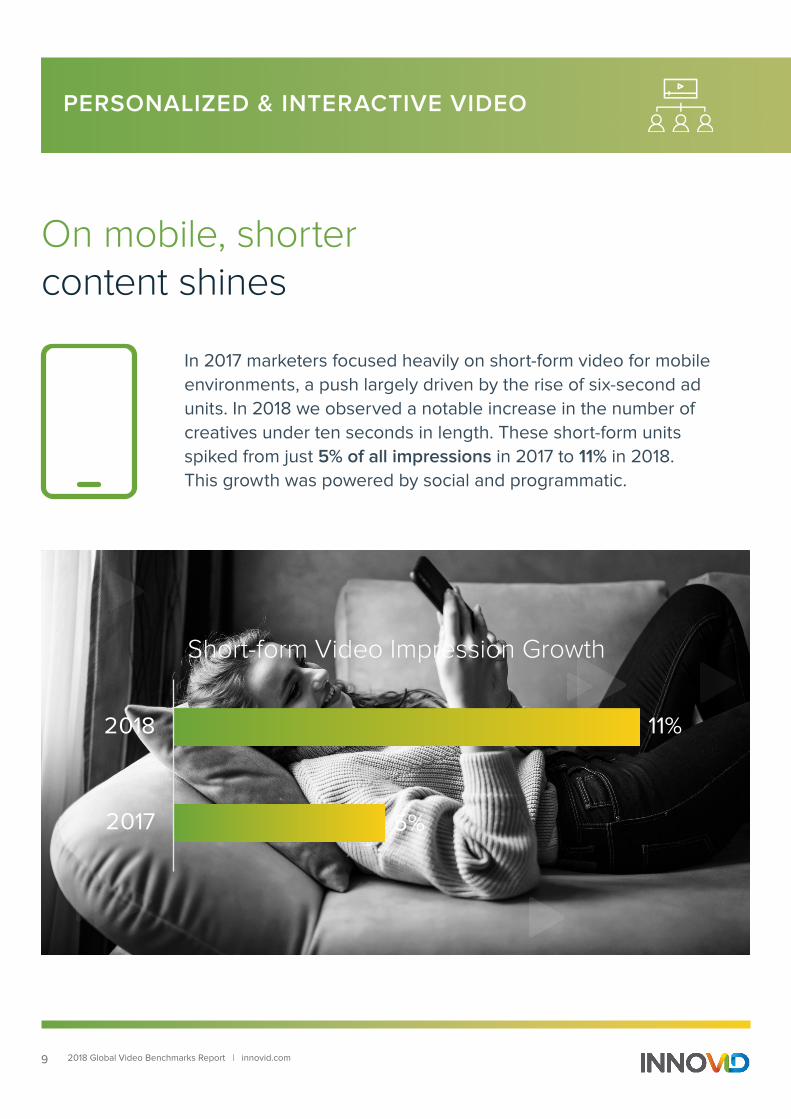
On mobile, shorter content shines
In 2017 marketers focused heavily on short-form video for mobile
environments, a push largely driven by the rise of six-second ad
units. In 2018 we observed a notable increase in the number of
creatives under ten seconds in length. These short-form units
spiked from just 5% of all impressions in 2017 to 11% in 2018.
This growth was powered by social and programmatic.
9 2018 Global Video Benchmarks Report | innovid.com
5%
11%
2017
2018
Short-form Video Impression Growth
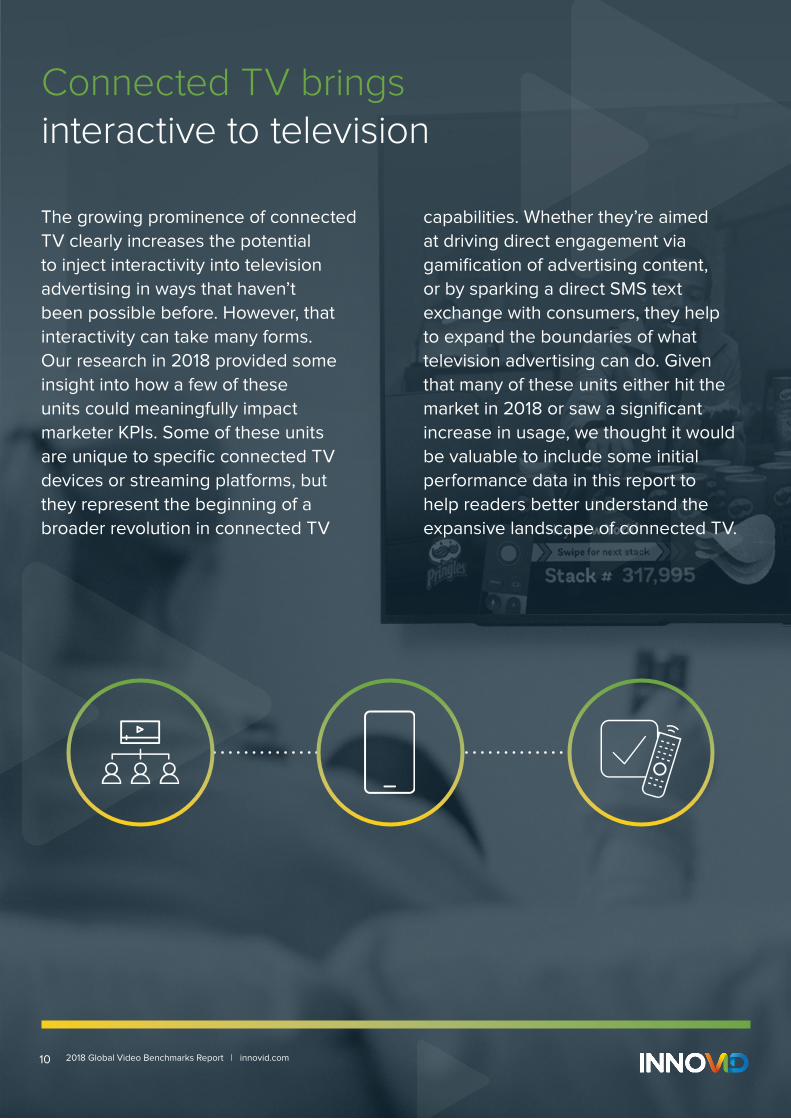
Connected TV brings interactive to television
The growing prominence of connected
TV clearly increases the potential
to inject interactivity into television
advertising in ways that haven’t
been possible before. However, that
interactivity can take many forms.
Our research in 2018 provided some
insight into how a few of these
units could meaningfully impact
marketer KPIs. Some of these units
are unique to specific connected TV
devices or streaming platforms, but
they represent the beginning of a
broader revolution in connected TV
capabilities. Whether they’re aimed
at driving direct engagement via
gamification of advertising content,
or by sparking a direct SMS text
exchange with consumers, they help
to expand the boundaries of what
television advertising can do. Given
that many of these units either hit the
market in 2018 or saw a significant
increase in usage, we thought it would
be valuable to include some initial
performance data in this report to
help readers better understand the
expansive landscape of connected TV.
2018 Global Video Benchmarks Report | innovid.com10
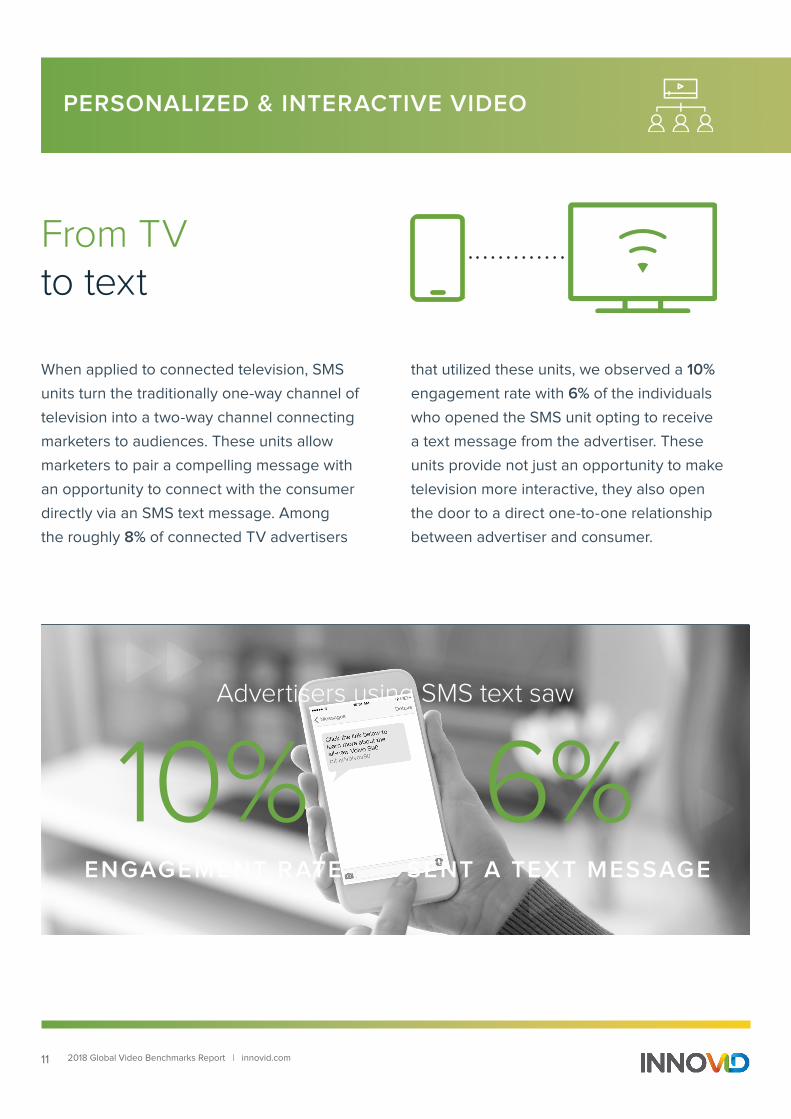
PERSONALIZED & INTERACTIVE VIDEO
When applied to connected television, SMS
units turn the traditionally one-way channel of
television into a two-way channel connecting
marketers to audiences. These units allow
marketers to pair a compelling message with
an opportunity to connect with the consumer
directly via an SMS text message. Among
the roughly 8% of connected TV advertisers
that utilized these units, we observed a 10%
engagement rate with 6% of the individuals
who opened the SMS unit opting to receive
a text message from the advertiser. These
units provide not just an opportunity to make
television more interactive, they also open
the door to a direct one-to-one relationship
between advertiser and consumer.
From TV to text
11 2018 Global Video Benchmarks Report | innovid.com
10%ENGAGEMENT RATE
6%SENT A TEXT MESSAGE
Advertisers using SMS text saw
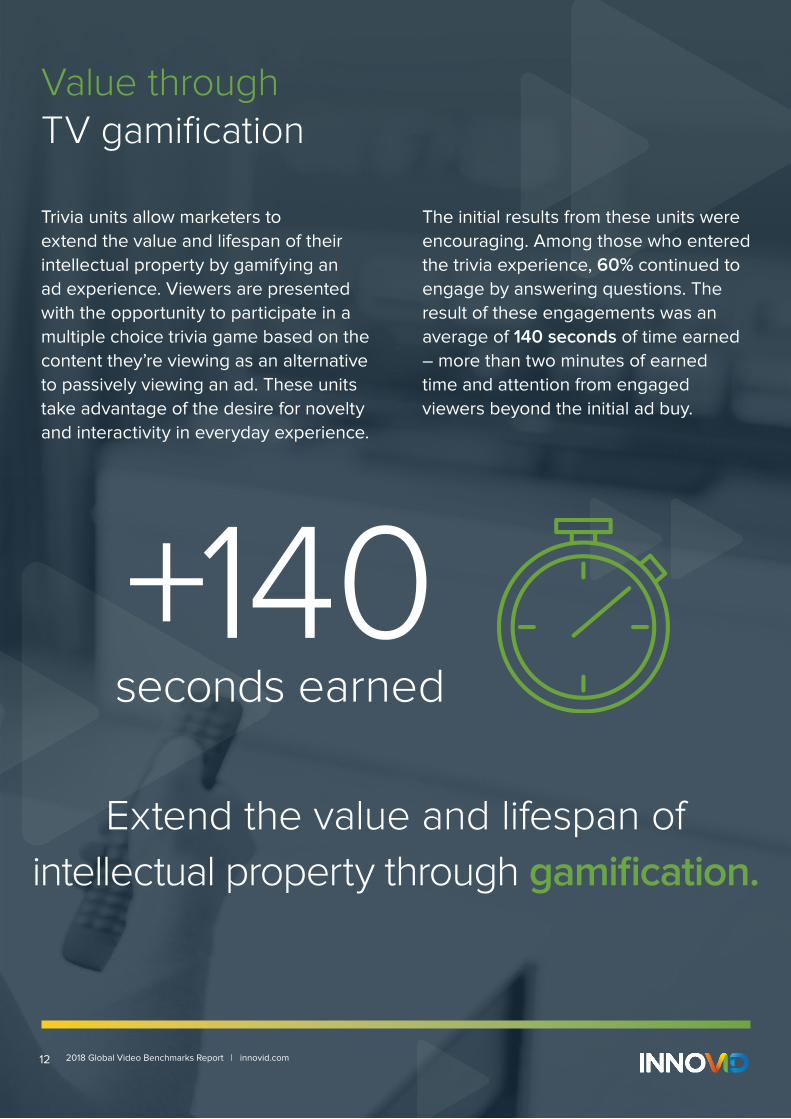
Trivia units allow marketers to
extend the value and lifespan of their
intellectual property by gamifying an
ad experience. Viewers are presented
with the opportunity to participate in a
multiple choice trivia game based on the
content they’re viewing as an alternative
to passively viewing an ad. These units
take advantage of the desire for novelty
and interactivity in everyday experience.
The initial results from these units were
encouraging. Among those who entered
the trivia experience, 60% continued to
engage by answering questions. The
result of these engagements was an
average of 140 seconds of time earned
– more than two minutes of earned
time and attention from engaged
viewers beyond the initial ad buy.
Value throughTV gamification
Extend the value and lifespan of
intellectual property through gamification.
2018 Global Video Benchmarks Report | innovid.com12
seconds earned
+140
VIDEO BENCHMARKS
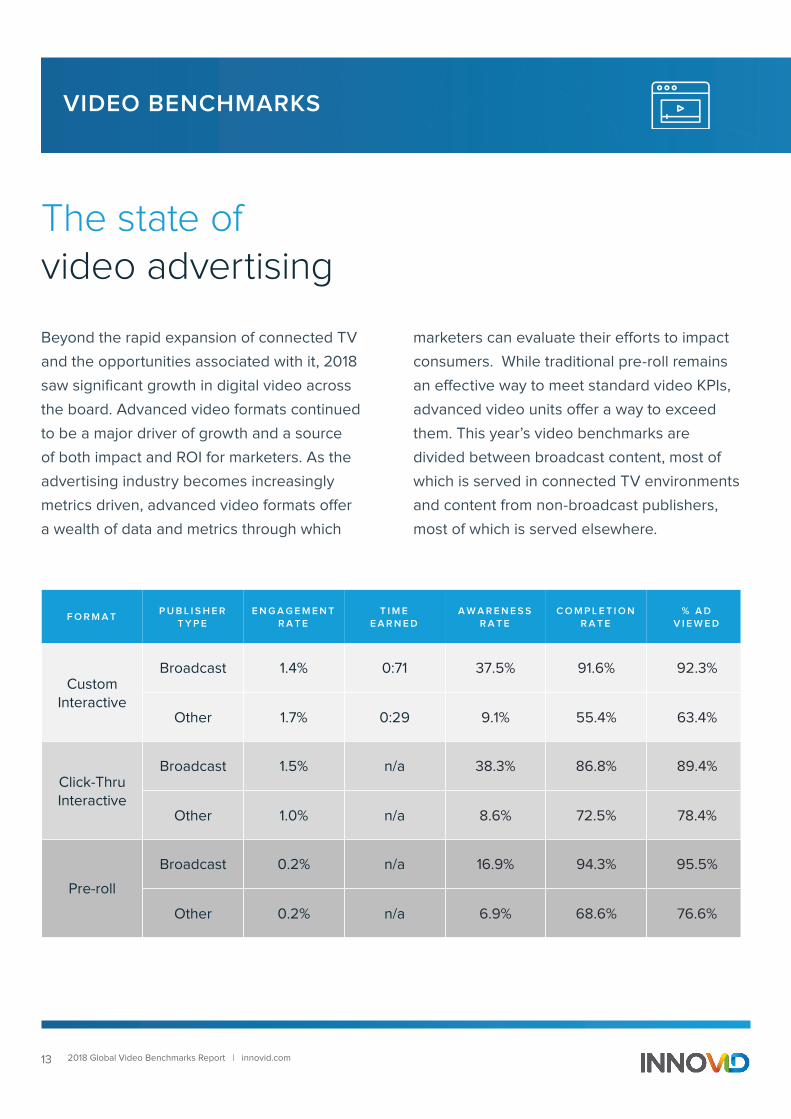
The state of video advertising
Beyond the rapid expansion of connected TV
and the opportunities associated with it, 2018
saw significant growth in digital video across
the board. Advanced video formats continued
to be a major driver of growth and a source
of both impact and ROI for marketers. As the
advertising industry becomes increasingly
metrics driven, advanced video formats offer
a wealth of data and metrics through which
marketers can evaluate their efforts to impact
consumers. While traditional pre-roll remains
an effective way to meet standard video KPIs,
advanced video units offer a way to exceed
them. This year’s video benchmarks are
divided between broadcast content, most of
which is served in connected TV environments
and content from non-broadcast publishers,
most of which is served elsewhere.
F O R M A TP U B L I S H E R
T Y P EE N G A G E M E N T
R A T ET I M E
E A R N E DA W A R E N E S S
R A T EC O M P L E T I O N
R A T E% A D
V I E W E D
Custom Interactive
Broadcast 1.4% 0:71 37.5% 91.6% 92.3%
Other 1.7% 0:29 9.1% 55.4% 63.4%
Click-Thru Interactive
Broadcast 1.5% n/a 38.3% 86.8% 89.4%
Other 1.0% n/a 8.6% 72.5% 78.4%
Pre-roll
Broadcast 0.2% n/a 16.9% 94.3% 95.5%
Other 0.2% n/a 6.9% 68.6% 76.6%
13 2018 Global Video Benchmarks Report | innovid.com
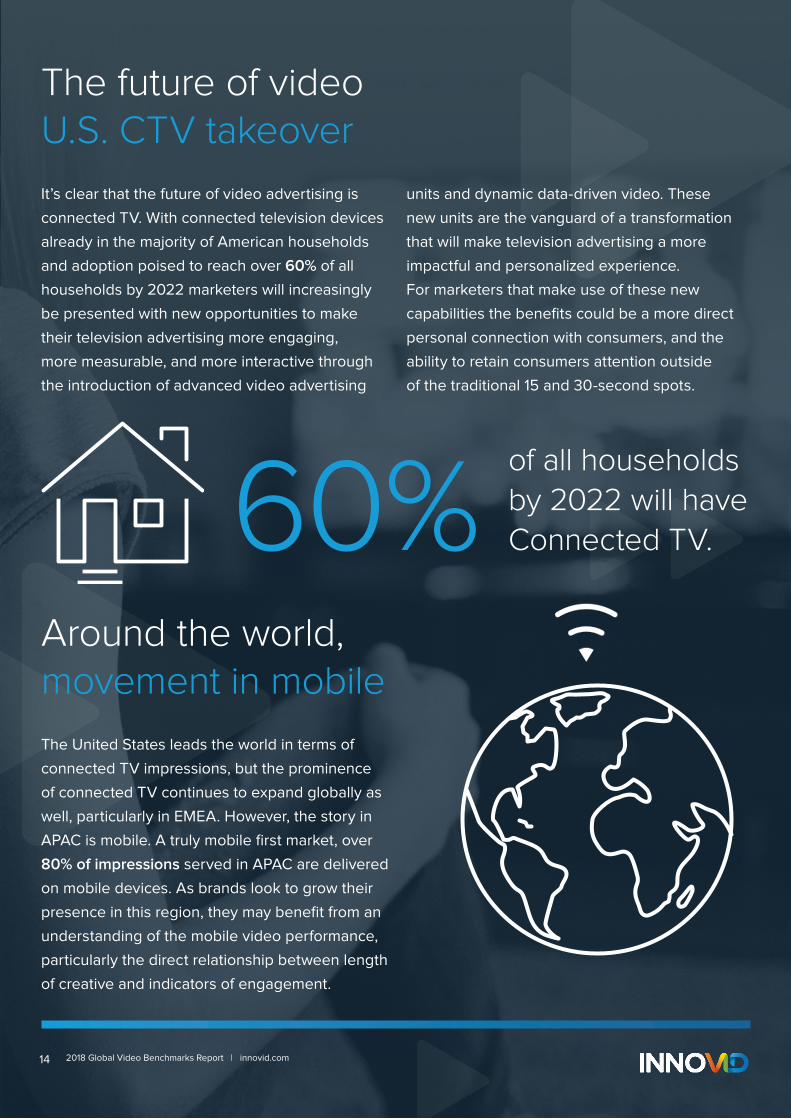
It’s clear that the future of video advertising is
connected TV. With connected television devices
already in the majority of American households
and adoption poised to reach over 60% of all
households by 2022 marketers will increasingly
be presented with new opportunities to make
their television advertising more engaging,
more measurable, and more interactive through
the introduction of advanced video advertising
units and dynamic data-driven video. These
new units are the vanguard of a transformation
that will make television advertising a more
impactful and personalized experience.
For marketers that make use of these new
capabilities the benefits could be a more direct
personal connection with consumers, and the
ability to retain consumers attention outside
of the traditional 15 and 30-second spots.
The future of videoU.S. CTV takeover
of all households by 2022 will have Connected TV.
The United States leads the world in terms of
connected TV impressions, but the prominence
of connected TV continues to expand globally as
well, particularly in EMEA. However, the story in
APAC is mobile. A truly mobile first market, over
80% of impressions served in APAC are delivered
on mobile devices. As brands look to grow their
presence in this region, they may benefit from an
understanding of the mobile video performance,
particularly the direct relationship between length
of creative and indicators of engagement.
Around the world, movement in mobile
2018 Global Video Benchmarks Report | innovid.com14
60%
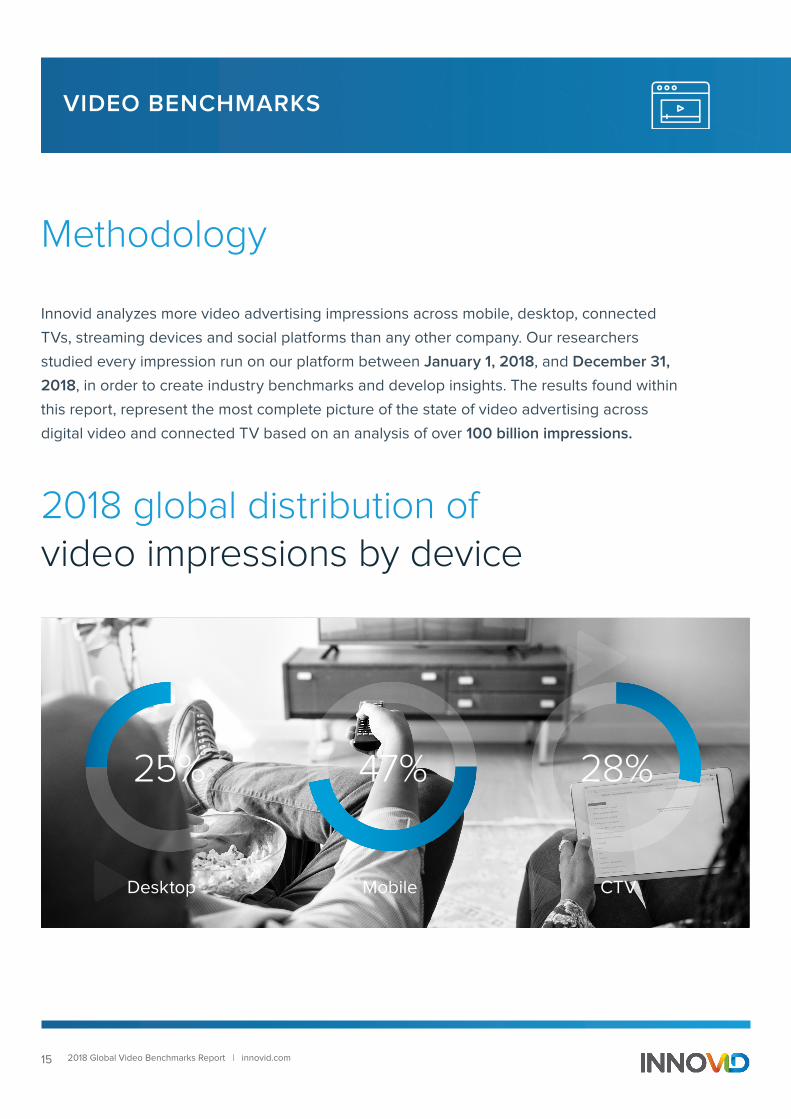
VIDEO BENCHMARKS
Methodology
Innovid analyzes more video advertising impressions across mobile, desktop, connected
TVs, streaming devices and social platforms than any other company. Our researchers
studied every impression run on our platform between January 1, 2018, and December 31,
2018, in order to create industry benchmarks and develop insights. The results found within
this report, represent the most complete picture of the state of video advertising across
digital video and connected TV based on an analysis of over 100 billion impressions.
2018 global distribution of video impressions by device
10% engagement
6% sent text
Mobile CTVDesktop
47% 28%25%
15 2018 Global Video Benchmarks Report | innovid.com
Innovid is the world’s leading connected TV and video advertising
platform, delivering more video than any company across mobile,
desktop, connected TVs, streaming devices and social platforms.
Innovid partners with brands, agencies, and publishers to deliver new
advertising models that increase engagement and time spent in ways
that also provide more value to viewers. Our video platform enables
personalization of creative, seamless cross-screen delivery, and holistic
measurement to fuel next-generation video experiences and grow revenue.
Innovid has offices in New York, Chicago, San Francisco, Los
Angeles, London, Tel Aviv, Sydney, and Singapore. .
To learn more about how to maximize the impact of your video spend contact [email protected] | innovid.com