Embed Size (px)
Citation preview
Jizheng Chen,1 Ning Wang,2 Mei Dong,2 Min Guo,1 Yang Zhao,3 Zhiyong Zhuo,3
Chao Zhang,3 Xiumei Chi,4 Yu Pan,4 Jing Jiang,4 Hong Tang,1 Junqi Niu,4
Dongliang Yang,5 Zhong Li,2 Xiao Han,2 Qian Wang,2 and Xinwen Chen1
The Metabolic Regulator HistoneDeacetylase 9 Contributes to GlucoseHomeostasis Abnormality Induced byHepatitis C Virus InfectionDiabetes 2015;64:4088–4098 | DOI: 10.2337/db15-0197
Class IIa histone deacetylases (HDACs), such as HDAC4,HDAC5, and HDAC7, provide critical mechanisms forregulating glucose homeostasis. Here we report thatHDAC9, another class IIa HDAC, regulates hepatic glu-coneogenesis via deacetylation of a Forkhead box O(FoxO) family transcription factor, FoxO1, together withHDAC3. Specifically, HDAC9 expression can be stronglyinduced upon hepatitis C virus (HCV) infection. HCV-induced HDAC9 upregulation enhances gluconeogenesisby promoting the expression of gluconeogenic genes, in-cluding phosphoenolpyruvate carboxykinase and glucose-6-phosphatase, indicating a major role for HDAC9 in thedevelopment of HCV-associated exaggerated gluco-neogenic responses. Moreover, HDAC9 expression lev-els and gluconeogenic activities were elevated in liversfrom HCV-infected patients and persistent HCV-infectedmice, emphasizing the clinical relevance of theseresults. Our results suggest HDAC9 is involved inglucose metabolism, HCV-induced abnormal glucosehomeostasis, and type 2 diabetes.
Hepatitis C virus (HCV) infection is the leading cause ofviral hepatitis, which may lead to chronic hepatitis in upto 60–80% of infected adults and can progress to liverfibrosis, cirrhosis, and eventually hepatocellular carci-noma (1,2). In addition, HCV infection may cause a varietyof clinical extrahepatic manifestations (3). It is now widelyrecognized that chronic HCV infection is a metabolic disease
that is associated with the subsequent development of hy-perglycemia and type 2 diabetes mellitus (T2DM) (4).
The association between HCV and T2DM was recog-nized over 30 years ago (5). Since then, many observa-tional studies assessing the association between HCV andT2DM have been published, which have provided mixedresults. However, meta-analyses have demonstrated thatHCV infection can promote the increased prevalence ofT2DM (6). It is generally accepted that glucose intoleranceis more prevalent in chronic hepatitis associated withHCV infection than in other chronic liver diseases, includ-ing hepatitis B infection (7). HCV infection per se is as-sociated with insulin resistance in the target pathways ofendogenous glucose production and total-body glucosedisposal (8). Thus, chronic HCV infection may directlypredispose the host to abnormal glucose metabolismand is thus considered to be a risk factor for developingT2DM. However, the precise mechanisms underlyingT2DM manifestation are poorly understood.
Glucose homeostasis is maintained physiologicallythrough a balance between glucose production by theliver and glucose utilization by the peripheral tissues viathe gluconeogenic and glycolytic pathways, respectively.Gluconeogenesis is largely controlled at the transcriptionallevel by rate-limiting enzymes such as phosphoenolpy-ruvate carboxykinase (PEPCK) and glucose-6-phosphatase(G6PC). Expression of these enzymes is controlled by thehormonal modulation of transcription factors and coactivators,
1State Key Laboratory of Virology, Wuhan Institute of Virology, Chinese Academyof Sciences, Wuhan, China2Jiangsu Province Key Laboratory of Human Functional Genomics, Department ofBiochemistry and Molecular Biology, Nanjing Medical University, Nanjing, China3Key Laboratory of Infection and Immunity, Institute of Biophysics, Chinese Acad-emy of Sciences, Beijing, China4Department of Hepatology, The First Hospital of Jilin University, Changchun,China5Department of Infectious Diseases, Wuhan Union Hospital, Tongji MedicalCollege, Huazhong University of Science and Technology, Wuhan, China
Corresponding author: Qian Wang, [email protected].
Received 10 February 2015 and accepted 9 July 2015.
This article contains Supplementary Data online at http://diabetes.diabetesjournals.org/lookup/suppl/doi:10.2337/db15-0197/-/DC1.
© 2015 by the American Diabetes Association. Readers may use this article aslong as the work is properly cited, the use is educational and not for profit, andthe work is not altered.
4088 Diabetes Volume 64, December 2015
METABOLISM
including Forkhead box O (FoxO) proteins (9). The insulin-signaling pathway is a major pathway responsible forsuppressing gluconeogenic transcription. Insulin-dependentcontrol of gluconeogenesis is largely mediated through Akt,which phosphorylates and inactivates FoxO transcriptionfactors (mainly FoxO1 and FoxO3) in mammalian livers(10). Recent studies indicate that HCV promotes hepaticgluconeogenesis through a phospho-FoxO1–dependent path-way (11,12). In addition to phosphorylation-dependent reg-ulation, however, FoxO activity is also modulated throughacetylation by histone acetyltransferase enzymes such asp300. Acetylation of FoxO transcription factors occurs inresponse to oxidative stress or DNA binding, and it can bereversed by the action of deacetylases (13).
Four families of histone deacetylases (HDACs) counteractthe activity of histone acetyltransferases: class I (HDAC1, 2,3, and 8) and II HDACs; class III NAD+-dependent HDACs,known as sirtuins (SIRTs; SIRT1–7); and HDAC11, the soleclass IV HDAC (14). Class II HDACs are further subdividedinto the IIa (HDAC4, 5, 7, and 9) and IIb (HDAC6 and 10)subfamilies. Among the HDACs, HDAC3 and SIRT1 are well-known regulators of both fatty acid and glucose metabolism(15,16). Recent studies indicate that class IIa HDACs (HDAC4,5, and 7) are hormone-activated regulators of FoxO and mam-malian glucose homeostasis, especially gluconeogenesis (17).It is of great interest and importance to understand thebiology of other HDACs in glucose homeostasis regulationand whether HDACs influence glucose metabolism abnor-mality in HCV-infected hepatocytes.
Here, we report that HDAC9 regulates hepatic gluconeo-genesis via deacetylation of FoxO1 and HCV-induced HDAC9upregulation, causing an exaggerated gluconeogenic response.Moreover, both persistent HCV-infected transgenic miceand HCV-infected patients exhibited upregulated HDAC9in liver and induced gluconeogenic activity. These findingsprovide a clue to the possible mechanisms underlying thedevelopment of HCV-induced abnormal glucose homeostasisand T2DM.
RESEARCH DESIGN AND METHODS
Patients and BiopsiesHuman liver tissue samples from fine-needle biopsieswere obtained from HCV-infected patients. Normal hu-man liver tissue was obtained from either spare donortissue intended for transplantation or from normal livertissue resected from patients with benign hepatic tumors.All human tissue samples were collected from the LiverUnit of The First Hospital of Jilin University and TongjiHospital, Tongji Medical College of Huazhong Universityof Science and Technology, with local research ethicscommittee approval and informed patient consent. Di-agnosis of patients with chronic HCV infection andanalysis of all biopsies were based on standard serologicalassays and the presence of abnormal serum aminotrans-ferase concentrations for at least 6 months. All patientswith HCV tested positive for HCV antibody based ona third-generation ELISA test. HCV infection was confirmed
by detection of circulating HCV RNA using an HCV PCR-based assay (Qiagen). At time of biopsy, liver tissue (2–3 mm)was immediately frozen in TRIzol and stored at 280°C.Fasting glucose and insulin were measured on the days ofbiopsy. Insulin resistance was assessed by the HOMA-insulinresistance (HOMA-IR) score (calculated as [fasting insulin3fasting glucose]/22.5).
Cells and VirusHuman hepatoma HuH7.5.1 cell lines (provided by FrankChisari) were cultured as described elsewhere (18). HuH7.5.1-H77 cells (H77; genotype 1a), HuH7.5.1-Con1 cells (CON1;genotype 1b), and HuH7.5.1-SGR-JFH-1 cells (SGR; geno-type 2a), which harbor the subgenomic HCV replicon, werederived from HuH7.5.1 cells and maintained in the samemedium as HuH7.5.1 cells supplemented with 0.5 mg/mLG418 (Gibco). Primary hepatocyte cells isolated from C/OTg
mice were performed as described elsewhere (19). The HCVJ399EM strain was derived from the JFH-1 virus by in-serting enhanced green fluorescent protein into the HCVNS5A region (20). Virus production and infection wereperformed as described elsewhere (21). Mock-infectionamong controls was performed in parallel to virus infec-tions but in the absence of virus. For infection in vitro,PHTTg or HuH7.5.1 cells (1 3 106) were infected withJ399EM for the indicated time, with the indicated multi-plicities of infection (MOIs).
Real-Time PCR and Western Blot AnalysisRNA isolation, cDNA synthesis, quantitative PCR withindicated primers (Supplementary Table 1), and Westernblotting were performed as described elsewhere (21).The NS5A antibody was a gift from Dr. C. Rice (TheRockefeller University). All other antibodies were pur-chased from Abcam (HDAC9, ab18970); Santa CruzBiotechnology (acetyl-FoxO1, sc-49437; phospho-FoxO1[Ser256], sc-16307; and ACTIN, sc1616); or Cell SignalingTechnology (FoxO1, 9454; HDAC3, 3949; PEPCK, 12940;and GAPDH, 2118).
RNA InterferenceFor knockdown experiments, 50 pmol small interfering RNA(siRNA) specific for HDAC9 and a negative control (siNC)(Qiagen) (Supplementary Table 1) were transfected intoHuH7.5.1 or SGR cells via Lipofectamine 2000 (Invitrogen).
Glucose Production AssayThe production of glucose was measured using an AmplexRed Glucose/Glucose Oxidase Assay Kit (Invitrogen) accord-ing to the manufacturer’s instructions.
Coimmunoprecipitation and ImmunofluorescenceAssaysCoimmunoprecipitation and immunofluorescence assayswere performed as described elsewhere (21).
PEPCK Activity AssayPEPCK enzyme activity was assayed using an NADH-coupled system as described elsewhere (22).
diabetes.diabetesjournals.org Chen and Associates 4089
Transgenic Mice and Animal Study DesignThe transgenic C/OTg mice harboring both the human CD81and occludin (OCLN) genes were constructed as describedpreviously (19). We used 8- to 12-week-old and sex-matchedmice for in vivo experiments. The information about HCV-infected (n = 36) and mock-infected (n = 12) C/OTg miceraised in synchronization are listed in Supplementary Table2, and more information has been published previously (19).The animal studies were approved by the Institutional AnimalCare and Use Committee of Nanjing Medical University.
Metabolic StudiesGlucose and insulin tolerance tests were performed byintraperitoneal injection of mice with glucose (2.0 g/kg),insulin (0.5 units/kg), or pyruvate (2.0 g/kg), according tomethods described previously (23). Concentrations of in-sulin and C-peptide were quantified using a FLEXMAP 3Dquantification system (Luminex, Austin, TX).
Statistical AnalysisData are presented as means 6 SEMs. Statistical analysiswas carried out using the Student t test when comparing twogroups and ANOVA when comparing multiple groups. Dif-ferences were considered significant at P , 0.05. Statisticalanalyses were performed using GraphPad Prism software.
RESULTS
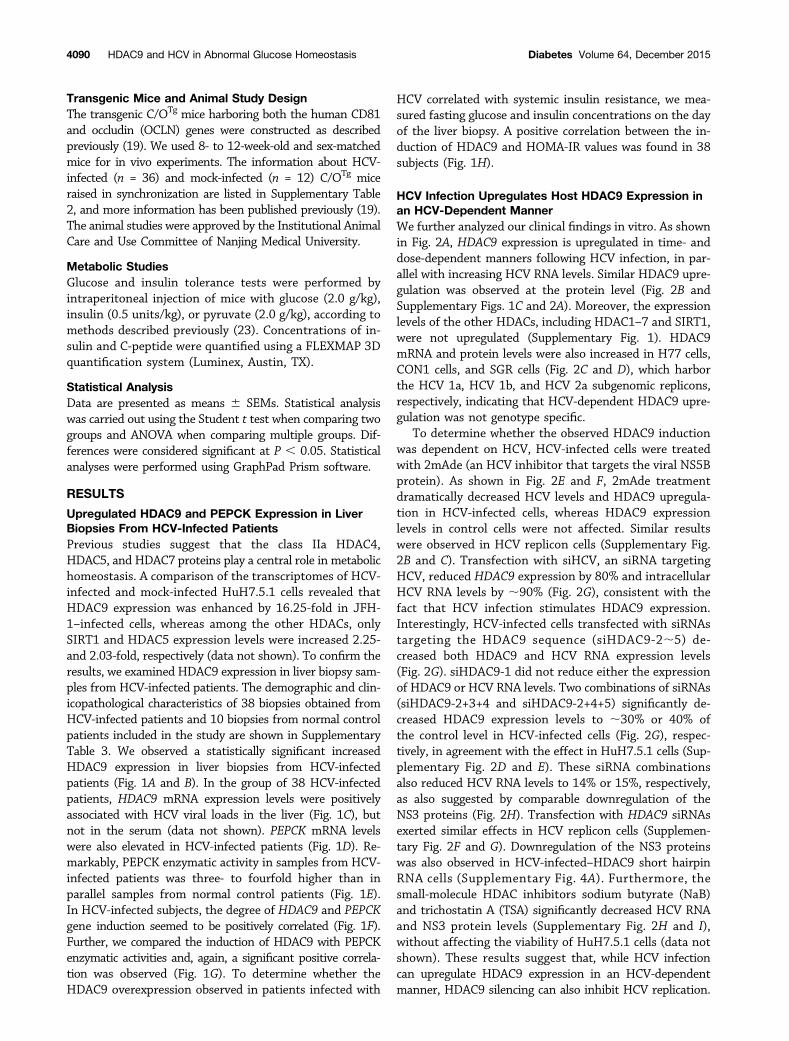
Upregulated HDAC9 and PEPCK Expression in LiverBiopsies From HCV-Infected PatientsPrevious studies suggest that the class IIa HDAC4,HDAC5, and HDAC7 proteins play a central role in metabolichomeostasis. A comparison of the transcriptomes of HCV-infected and mock-infected HuH7.5.1 cells revealed thatHDAC9 expression was enhanced by 16.25-fold in JFH-1–infected cells, whereas among the other HDACs, onlySIRT1 and HDAC5 expression levels were increased 2.25-and 2.03-fold, respectively (data not shown). To confirm theresults, we examined HDAC9 expression in liver biopsy sam-ples from HCV-infected patients. The demographic and clin-icopathological characteristics of 38 biopsies obtained fromHCV-infected patients and 10 biopsies from normal controlpatients included in the study are shown in SupplementaryTable 3. We observed a statistically significant increasedHDAC9 expression in liver biopsies from HCV-infectedpatients (Fig. 1A and B). In the group of 38 HCV-infectedpatients, HDAC9 mRNA expression levels were positivelyassociated with HCV viral loads in the liver (Fig. 1C), butnot in the serum (data not shown). PEPCK mRNA levelswere also elevated in HCV-infected patients (Fig. 1D). Re-markably, PEPCK enzymatic activity in samples from HCV-infected patients was three- to fourfold higher than inparallel samples from normal control patients (Fig. 1E).In HCV-infected subjects, the degree of HDAC9 and PEPCKgene induction seemed to be positively correlated (Fig. 1F).Further, we compared the induction of HDAC9 with PEPCKenzymatic activities and, again, a significant positive correla-tion was observed (Fig. 1G). To determine whether theHDAC9 overexpression observed in patients infected with
HCV correlated with systemic insulin resistance, we mea-sured fasting glucose and insulin concentrations on the dayof the liver biopsy. A positive correlation between the in-duction of HDAC9 and HOMA-IR values was found in 38subjects (Fig. 1H).
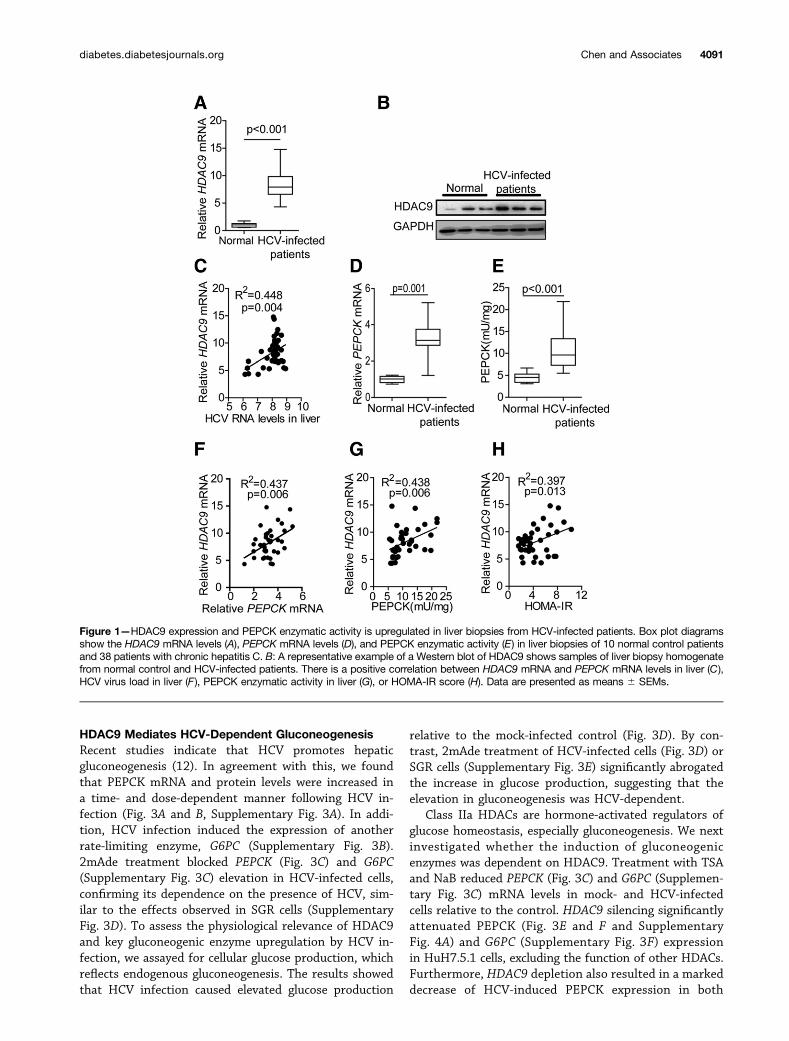
HCV Infection Upregulates Host HDAC9 Expression inan HCV-Dependent MannerWe further analyzed our clinical findings in vitro. As shownin Fig. 2A, HDAC9 expression is upregulated in time- anddose-dependent manners following HCV infection, in par-allel with increasing HCV RNA levels. Similar HDAC9 upre-gulation was observed at the protein level (Fig. 2B andSupplementary Figs. 1C and 2A). Moreover, the expressionlevels of the other HDACs, including HDAC1–7 and SIRT1,were not upregulated (Supplementary Fig. 1). HDAC9mRNA and protein levels were also increased in H77 cells,CON1 cells, and SGR cells (Fig. 2C and D), which harborthe HCV 1a, HCV 1b, and HCV 2a subgenomic replicons,respectively, indicating that HCV-dependent HDAC9 upre-gulation was not genotype specific.
To determine whether the observed HDAC9 inductionwas dependent on HCV, HCV-infected cells were treatedwith 2mAde (an HCV inhibitor that targets the viral NS5Bprotein). As shown in Fig. 2E and F, 2mAde treatmentdramatically decreased HCV levels and HDAC9 upregula-tion in HCV-infected cells, whereas HDAC9 expressionlevels in control cells were not affected. Similar resultswere observed in HCV replicon cells (Supplementary Fig.2B and C). Transfection with siHCV, an siRNA targetingHCV, reduced HDAC9 expression by 80% and intracellularHCV RNA levels by ;90% (Fig. 2G), consistent with thefact that HCV infection stimulates HDAC9 expression.Interestingly, HCV-infected cells transfected with siRNAstargeting the HDAC9 sequence (siHDAC9-2;5) de-creased both HDAC9 and HCV RNA expression levels(Fig. 2G). siHDAC9-1 did not reduce either the expressionof HDAC9 or HCV RNA levels. Two combinations of siRNAs(siHDAC9-2+3+4 and siHDAC9-2+4+5) significantly de-creased HDAC9 expression levels to ;30% or 40% ofthe control level in HCV-infected cells (Fig. 2G), respec-tively, in agreement with the effect in HuH7.5.1 cells (Sup-plementary Fig. 2D and E). These siRNA combinationsalso reduced HCV RNA levels to 14% or 15%, respectively,as also suggested by comparable downregulation of theNS3 proteins (Fig. 2H). Transfection with HDAC9 siRNAsexerted similar effects in HCV replicon cells (Supplemen-tary Fig. 2F and G). Downregulation of the NS3 proteinswas also observed in HCV-infected–HDAC9 short hairpinRNA cells (Supplementary Fig. 4A). Furthermore, thesmall-molecule HDAC inhibitors sodium butyrate (NaB)and trichostatin A (TSA) significantly decreased HCV RNAand NS3 protein levels (Supplementary Fig. 2H and I),without affecting the viability of HuH7.5.1 cells (data notshown). These results suggest that, while HCV infectioncan upregulate HDAC9 expression in an HCV-dependentmanner, HDAC9 silencing can also inhibit HCV replication.
4090 HDAC9 and HCV in Abnormal Glucose Homeostasis Diabetes Volume 64, December 2015
HDAC9 Mediates HCV-Dependent GluconeogenesisRecent studies indicate that HCV promotes hepaticgluconeogenesis (12). In agreement with this, we foundthat PEPCK mRNA and protein levels were increased ina time- and dose-dependent manner following HCV in-fection (Fig. 3A and B, Supplementary Fig. 3A). In addi-tion, HCV infection induced the expression of anotherrate-limiting enzyme, G6PC (Supplementary Fig. 3B).2mAde treatment blocked PEPCK (Fig. 3C) and G6PC(Supplementary Fig. 3C) elevation in HCV-infected cells,confirming its dependence on the presence of HCV, sim-ilar to the effects observed in SGR cells (SupplementaryFig. 3D). To assess the physiological relevance of HDAC9and key gluconeogenic enzyme upregulation by HCV in-fection, we assayed for cellular glucose production, whichreflects endogenous gluconeogenesis. The results showedthat HCV infection caused elevated glucose production
relative to the mock-infected control (Fig. 3D). By con-trast, 2mAde treatment of HCV-infected cells (Fig. 3D) orSGR cells (Supplementary Fig. 3E) significantly abrogatedthe increase in glucose production, suggesting that theelevation in gluconeogenesis was HCV-dependent.
Class IIa HDACs are hormone-activated regulators ofglucose homeostasis, especially gluconeogenesis. We nextinvestigated whether the induction of gluconeogenicenzymes was dependent on HDAC9. Treatment with TSAand NaB reduced PEPCK (Fig. 3C) and G6PC (Supplemen-tary Fig. 3C) mRNA levels in mock- and HCV-infectedcells relative to the control. HDAC9 silencing significantlyattenuated PEPCK (Fig. 3E and F and SupplementaryFig. 4A) and G6PC (Supplementary Fig. 3F) expressionin HuH7.5.1 cells, excluding the function of other HDACs.Furthermore, HDAC9 depletion also resulted in a markeddecrease of HCV-induced PEPCK expression in both
Figure 1—HDAC9 expression and PEPCK enzymatic activity is upregulated in liver biopsies from HCV-infected patients. Box plot diagramsshow the HDAC9 mRNA levels (A), PEPCK mRNA levels (D), and PEPCK enzymatic activity (E) in liver biopsies of 10 normal control patientsand 38 patients with chronic hepatitis C. B: A representative example of a Western blot of HDAC9 shows samples of liver biopsy homogenatefrom normal control and HCV-infected patients. There is a positive correlation between HDAC9 mRNA and PEPCK mRNA levels in liver (C),HCV virus load in liver (F), PEPCK enzymatic activity in liver (G), or HOMA-IR score (H). Data are presented as means 6 SEMs.
diabetes.diabetesjournals.org Chen and Associates 4091
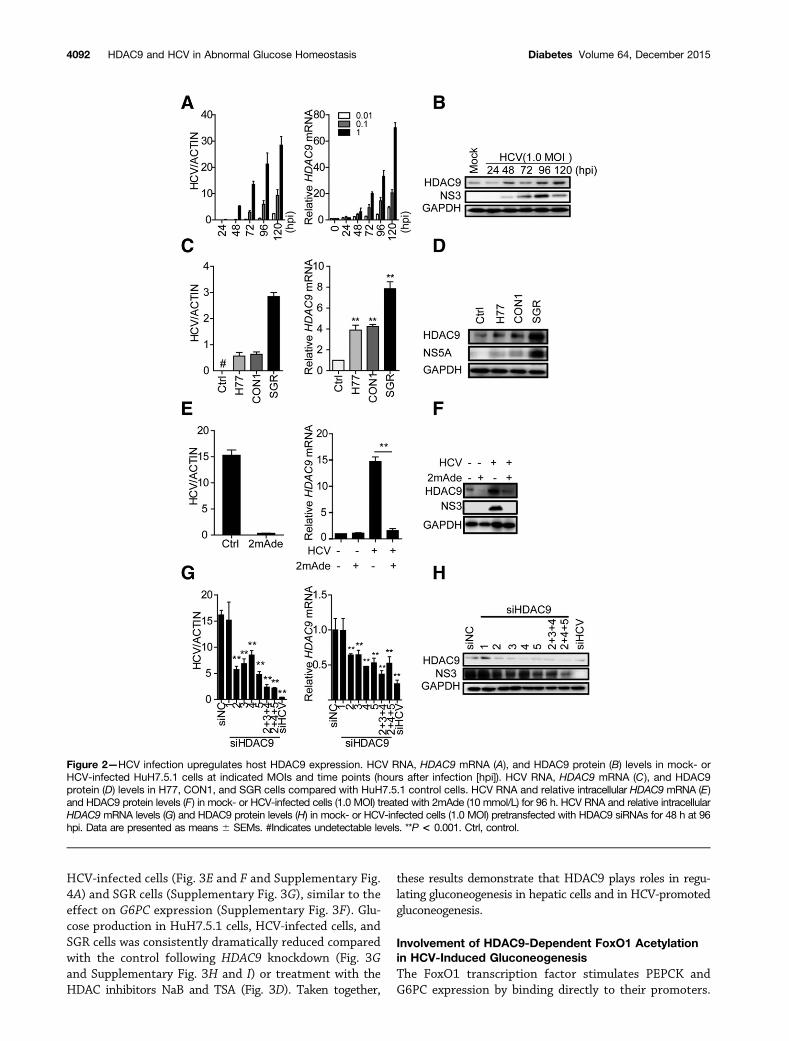
HCV-infected cells (Fig. 3E and F and Supplementary Fig.4A) and SGR cells (Supplementary Fig. 3G), similar to theeffect on G6PC expression (Supplementary Fig. 3F). Glu-cose production in HuH7.5.1 cells, HCV-infected cells, andSGR cells was consistently dramatically reduced comparedwith the control following HDAC9 knockdown (Fig. 3Gand Supplementary Fig. 3H and I) or treatment with theHDAC inhibitors NaB and TSA (Fig. 3D). Taken together,
these results demonstrate that HDAC9 plays roles in regu-lating gluconeogenesis in hepatic cells and in HCV-promotedgluconeogenesis.
Involvement of HDAC9-Dependent FoxO1 Acetylationin HCV-Induced GluconeogenesisThe FoxO1 transcription factor stimulates PEPCK andG6PC expression by binding directly to their promoters.
Figure 2—HCV infection upregulates host HDAC9 expression. HCV RNA, HDAC9 mRNA (A), and HDAC9 protein (B) levels in mock- orHCV-infected HuH7.5.1 cells at indicated MOIs and time points (hours after infection [hpi]). HCV RNA, HDAC9 mRNA (C), and HDAC9protein (D) levels in H77, CON1, and SGR cells compared with HuH7.5.1 control cells. HCV RNA and relative intracellular HDAC9 mRNA (E)and HDAC9 protein levels (F) in mock- or HCV-infected cells (1.0 MOI) treated with 2mAde (10 mmol/L) for 96 h. HCV RNA and relative intracellularHDAC9 mRNA levels (G) and HDAC9 protein levels (H) in mock- or HCV-infected cells (1.0 MOI) pretransfected with HDAC9 siRNAs for 48 h at 96hpi. Data are presented as means 6 SEMs. #Indicates undetectable levels. **P < 0.001. Ctrl, control.
4092 HDAC9 and HCV in Abnormal Glucose Homeostasis Diabetes Volume 64, December 2015
This binding is controlled by various posttranslationalmodifications, including phosphorylation, ubiquitylation,and acetylation. We examined whether HDAC9 influencesthe acetylation of FoxO1.
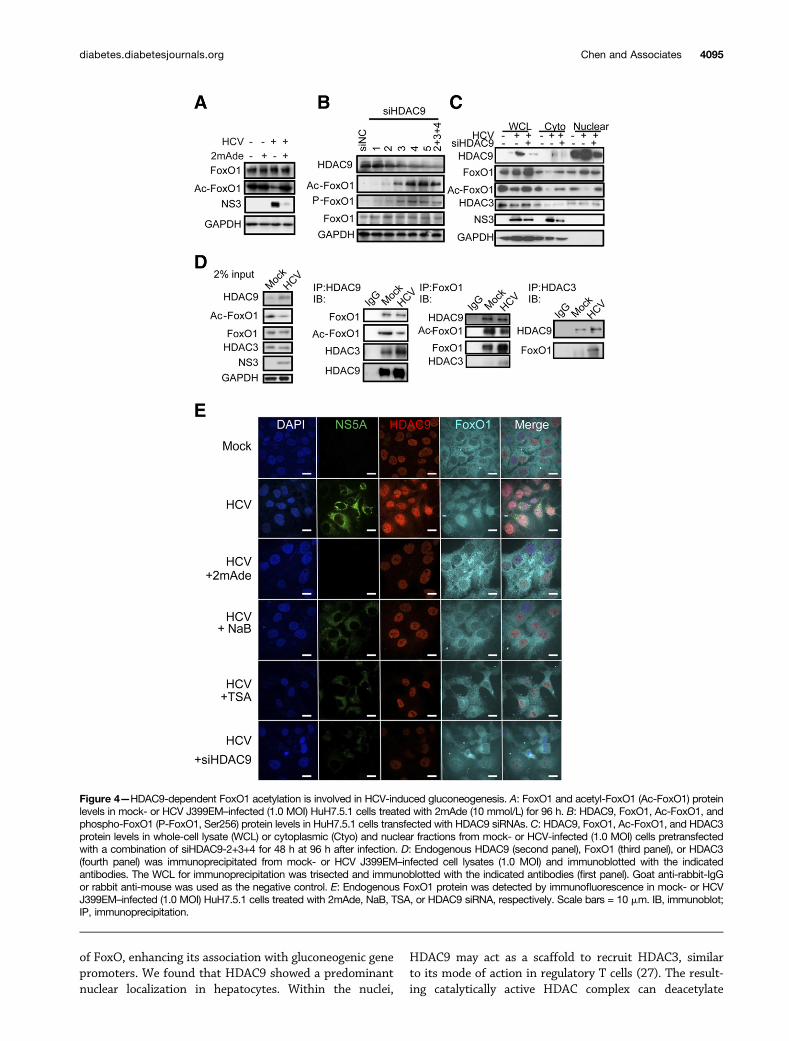
Immunoblot analysis revealed that FoxO1 acetylationwas dramatically decreased in HCV-infected cells com-pared with the mock-infected control, whereas total FoxO1
protein levels were comparable (Fig. 4A). Conversely, treat-ment of HCV-infected cells with 2mAde restored FoxO1acetylation to approximately the same level as occurredin mock-infected cells (Fig. 4A). In addition, HDAC9 de-pletion led to increased acetylation of endogenous FoxO1in both HuH7.5.1 (Fig. 4B) and HCV-infected cells (Fig. 4Cand Supplementary Fig. 4A). In a parallel experiment,
Figure 3—HDAC9 mediates HCV-dependent gluconeogenesis. Relative intracellular PEPCK mRNA (A) and protein (B) levels in mock- orHCV-infected HuH7.5.1 cells at the indicated MOIs and time points. Relative intracellular PEPCK mRNA levels (C) and cellular glucoseproduction (D) in mock- or HCV J399EM–infected HuH7.5.1 cells treated with 2mAde (10 mmol/L) for 96 h, NaB (10 mmol/L) for 72 h, or TSA(400 nmol/L) for 24 h, respectively. Relative intracellular PEPCK mRNA levels (E), protein levels (F), and cellular glucose production (G) as inFig. 2G. Data are presented as means 6 SEMs. *P < 0.05; **P < 0.001. hpi, hours after infection.
diabetes.diabetesjournals.org Chen and Associates 4093
HCV replicon cells exhibited a similar result following2mAde treatment or HDAC9 knockdown (Supplemen-tary Fig. 4B and C).
We further tested whether HDAC9 and FoxO1 arephysically associated. HDAC9 coimmunoprecipitated withboth the acetylated and nonacetylated forms of FoxO1 inboth mock- and HCV-infected cells (Fig. 4D, second andthird panels). It has been reported that class IIa HDACs arecatalytically inactive and exhibit activity only when associ-ated with the catalytically active class I HDAC family mem-ber HDAC3 (17,24). Consistent with these observations,endogenous HDAC9 coimmunoprecipitated with HDAC3(Fig. 4D, second and fourth panels). Of note, HCV infectiongreatly enhanced the association between endogenousFoxO1 and HDAC3, suggesting that HDAC9 upregulationstabilizes complex formation between HDAC9, FoxO1, andHDAC3 (Fig. 4D, third and fourth panels).
Data from a previous study show that HCV infection inhuman hepatocytes can impair insulin-induced FoxO1translocation from the nucleus to the cytoplasm (25). Wetested whether HDAC9 is involved in HCV-promotedFoxO1 nuclear accumulation. Mock-infected HuH7.5.1cells were treated similarly for comparison purposes(Fig. 4E and Supplementary Fig. 4D). Consistent withthe decreased levels of endogenous FoxO1 acetylation ob-served in HCV-infected cells, most HCV-infected cells dis-played nuclear FoxO1 localization, whereas treatmentwith 2mAde induced FoxO1 translocation to the cyto-plasm (Fig. 4E). HDAC9 knockdown increased endogenousFoxO1 acetylation (Fig. 4C), which was excluded from thenuclei in these cells (Fig. 4E and Supplementary Fig. 4E).Similar results were observed following NaB and TSAtreatment (Fig. 4E). A cell fractionation study further in-dicated that HDAC9 depletion reduced nuclear FoxO1 inHCV-infected cells, and the acetylation form of FoxO1was significantly reduced in both cytoplasmic and nuclearfractions (Fig. 4C). Moreover, HDAC9 accumulated in thenuclear fraction in both mock- and HCV-infected cells(Fig. 4C and E).
Taken together, these results suggest that HDAC9 cancontrol FoxO1 acetylation in hepatocytes and that HCV-induced nuclear HDAC9 upregulation suppresses FoxO1acetylation, leading to the nuclear accumulation of FoxO1.
Exaggerated Gluconeogenic Response via HDAC9Upregulation in Persistent HCV-Infected MiceWe further demonstrated the relevance of our clinical andin vitro findings in transgenic ICR mice (C/OTg) that spe-cifically expressed human CD81 and OCLN in their hepa-tocytes. The same cohort of transgenic mice, which cansupport persistent infection by HCV particles derivedfrom either cell cultures or chronically infected patients,was described previously (19). Elevated fasting plasmaglucose levels were observed in chronically HCV-infectedC/OTg mice during the 10 months after infection, com-pared with mock-infected control mice (Supplementary Table2). Administration of glucose to HCV-infected transgenic
mice revealed a significant impairment of glucose toler-ance at 1 month after infection, compared with controlmice of the same age (Fig. 5A). The insulin tolerance testconducted at 1 month after infection revealed that thereduction in plasma glucose concentrations after intraper-itoneal insulin administration was impaired in chronicHCV-infected C/OTg mice, which displayed higher plasmaglucose concentrations than did control mice at all timepoints measured (Fig. 5B). Accordingly, the HOMA-IRvalues, a measure of systemic insulin resistance, werealso elevated in HCV-infected mice compared with con-trols (Supplementary Table 2).
We then determined the effect of HCV infection on glu-coneogenesis in vivo by examining blood glucose concentra-tions in mice following intraperitoneal injection of pyruvate,a major gluconeogenic substrate. HCV infection inducedpyruvate tolerance in C/OTg mice, as represented by a signif-icant increase in the area under the curve (AUC) (Fig. 5C),suggesting an increased hepatic glucose output in HCV-infected C/OTg mice. Furthermore, PEPCK enzymatic activitiesin liver samples of C/OTg mice were significant increased overtime following HCV infection for over 10 months (Fig. 5D).
HDAC9 expression levels were analyzed to assess thecorrelation between HDAC9 expression and glucose ho-meostasis abnormality in HCV-infected mice. In contrast tomock-infected mice, HDAC9 expression at both the mRNAand protein levels increased continuously during the 10months after infection among chronically HCV-infectedC/OTg mice (Fig. 5E and F and Supplementary Fig. 5). Thisresult was confirmed by in vitro studies showing that in-fection of primary hepatocytes isolated from C/OTg micewith HCV induced HDAC9 expression (Fig. 5G and H).Consistent with the in vitro findings, FoxO1 acetylationand phosphorylation dramatically decreased in both HCV-infected C/OTg mice (Fig. 5F) and primary hepatocytes(Fig. 5H) compared with the controls, whereas total FoxO1protein levels were comparable.
DISCUSSION
HDACs regulate acetylation of histones and transcrip-tional factors involved in glucose homeostasis and playa central role in the regulation of glucose metabolism(26). In this study we demonstrated that HDAC9, a classIIa HDAC, is involved in gluconeogenesis in liver viadeacetylation of the FoxO1 transcription factor togetherwith HDAC3. In particular, HDAC9 can be strongly in-duced upon stimulation, such as HCV infection. HDAC9upregulation induced by HCV infection promoted the ex-pression of gluconeogenic genes such as PEPCK and en-hanced gluconeogenesis. These results suggest a plausiblemolecular mechanism for HCV-induced abnormal glucosehomeostasis and T2DM.
Previous studies showed that class IIa HDACs such asHDAC4, 5, and 7 regulate FoxO and glucose homeostasisresponses to the fasting hormone glucagon in the liver(17). Glucagon-induced dephosphorylation of HDAC4, 5,and 7 results in the nuclear translocation and deacetylation
4094 HDAC9 and HCV in Abnormal Glucose Homeostasis Diabetes Volume 64, December 2015
of FoxO, enhancing its association with gluconeogenic genepromoters. We found that HDAC9 showed a predominantnuclear localization in hepatocytes. Within the nuclei,
HDAC9 may act as a scaffold to recruit HDAC3, similarto its mode of action in regulatory T cells (27). The result-ing catalytically active HDAC complex can deacetylate
Figure 4—HDAC9-dependent FoxO1 acetylation is involved in HCV-induced gluconeogenesis. A: FoxO1 and acetyl-FoxO1 (Ac-FoxO1) proteinlevels in mock- or HCV J399EM–infected (1.0 MOI) HuH7.5.1 cells treated with 2mAde (10 mmol/L) for 96 h. B: HDAC9, FoxO1, Ac-FoxO1, andphospho-FoxO1 (P-FoxO1, Ser256) protein levels in HuH7.5.1 cells transfected with HDAC9 siRNAs. C: HDAC9, FoxO1, Ac-FoxO1, and HDAC3protein levels in whole-cell lysate (WCL) or cytoplasmic (Ctyo) and nuclear fractions from mock- or HCV-infected (1.0 MOI) cells pretransfectedwith a combination of siHDAC9-2+3+4 for 48 h at 96 h after infection. D: Endogenous HDAC9 (second panel), FoxO1 (third panel), or HDAC3(fourth panel) was immunoprecipitated from mock- or HCV J399EM–infected cell lysates (1.0 MOI) and immunoblotted with the indicatedantibodies. The WCL for immunoprecipitation was trisected and immunoblotted with the indicated antibodies (first panel). Goat anti-rabbit-IgGor rabbit anti-mouse was used as the negative control. E: Endogenous FoxO1 protein was detected by immunofluorescence in mock- or HCVJ399EM–infected (1.0 MOI) HuH7.5.1 cells treated with 2mAde, NaB, TSA, or HDAC9 siRNA, respectively. Scale bars = 10 mm. IB, immunoblot;IP, immunoprecipitation.
diabetes.diabetesjournals.org Chen and Associates 4095
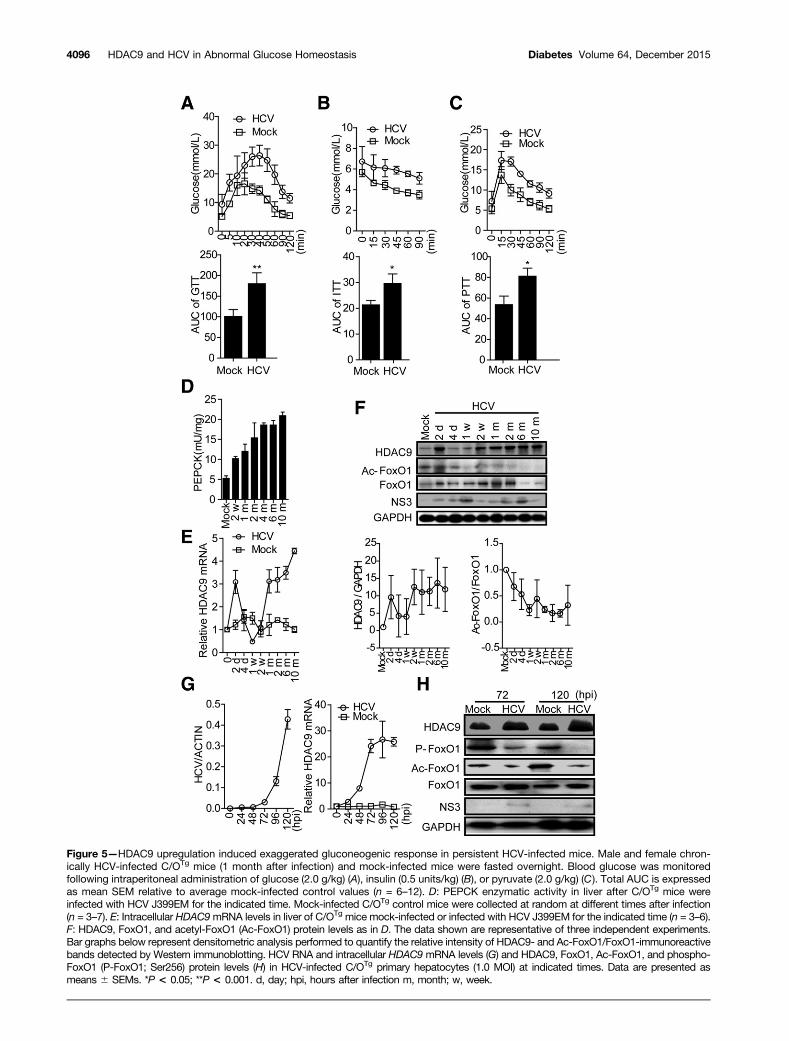
Figure 5—HDAC9 upregulation induced exaggerated gluconeogenic response in persistent HCV-infected mice. Male and female chron-ically HCV-infected C/OTg mice (1 month after infection) and mock-infected mice were fasted overnight. Blood glucose was monitoredfollowing intraperitoneal administration of glucose (2.0 g/kg) (A), insulin (0.5 units/kg) (B), or pyruvate (2.0 g/kg) (C). Total AUC is expressedas mean SEM relative to average mock-infected control values (n = 6–12). D: PEPCK enzymatic activity in liver after C/OTg mice wereinfected with HCV J399EM for the indicated time. Mock-infected C/OTg control mice were collected at random at different times after infection(n = 3–7). E: Intracellular HDAC9mRNA levels in liver of C/OTg mice mock-infected or infected with HCV J399EM for the indicated time (n = 3–6).F: HDAC9, FoxO1, and acetyl-FoxO1 (Ac-FoxO1) protein levels as in D. The data shown are representative of three independent experiments.Bar graphs below represent densitometric analysis performed to quantify the relative intensity of HDAC9- and Ac-FoxO1/FoxO1-immunoreactivebands detected by Western immunoblotting. HCV RNA and intracellular HDAC9 mRNA levels (G) and HDAC9, FoxO1, Ac-FoxO1, and phospho-FoxO1 (P-FoxO1; Ser256) protein levels (H) in HCV-infected C/OTg primary hepatocytes (1.0 MOI) at indicated times. Data are presented asmeans 6 SEMs. *P < 0.05; **P < 0.001. d, day; hpi, hours after infection m, month; w, week.
4096 HDAC9 and HCV in Abnormal Glucose Homeostasis Diabetes Volume 64, December 2015
nuclear FoxO1, leading to the acute transcriptional induc-tion of gluconeogenic enzymes. HDAC9 suppression in he-patocytes results in the inhibition of gluconeogenic genesand gluconeogenesis. These results indicate HDAC9 mayregulate glucose homeostasis under normal physiologicalconditions. Unlike other class IIa HDACs that are regulatedby posttranslational modification responses to fasting inliver (17), HDAC9 regulates gluconeogenesis specificallyvia eliciting gene expression–level changes. HCV infectionsignificantly upregulated the expression of only HDAC9,not other HDACs, suggesting that class IIa HDACs maybe induced via different mechanisms. It is of interest toidentify the stimulus for HDAC9 induction under physio-logical conditions and to investigate the mechanismwhereby HDAC9 responds to a given stimulus to maintainnormal glucose homeostasis. Knockdown of HDAC9 ex-pression in vivo completely protected mice from the con-sequences of high-fat feeding, including elevated bloodglucose, cholesterol levels, and fatty liver disease (28).Thus, HDAC9 may play a role in regulating gluconeogenesisand glucose homeostasis during high-fat feeding.
It has been reported that increased oxidative stressmay be an initial key event that triggers high-fat diet–induced insulin resistance (29,30). Hepatic oxidativestress is a prominent feature of chronic HCV infection,and oxidative stress upregulates HDAC activity (31,32).We found that HCV-induced oxidative stress increasedHDAC9 expression, whereas the antioxidant N-acetyl-L-cysteine restored HDAC9 expression in HCV-infected cells(Supplementary Fig. 6A and B) and HCV replicon cells(Supplementary Fig. 6D and E). However, while antioxi-dant treatment markedly reduced glucose production andgluconeogenesis following HCV infection (SupplementaryFig. 6C and F), its effect on gluconeogenesis was weakerthan that of an HDAC9 siRNA or an HDAC inhibitor,suggesting that HDAC expression is regulated by otherfactors in addition to reactive oxygen species. However,the individual expression of each HCV protein could notenhance HDAC9 expression (data not shown). HCV rep-lication is associated with the endoplasmic reticulum (ER),where the virus causes stress. It is reported that ER stressis emerging as a potential contributor to the onset ofT2DM by making cells resistant to insulin. Understandingthe role of HCV in ER stress will provide insight. More-over, since the best-characterized 14-3-3 target chromatin-modifying enzymes are class IIa HDACs (33,34), it will beinteresting to determine whether HCV also regulates HDACregulators, such as the 14-3-3 proteins.
FoxO1 regulates multiple metabolic pathways in theliver, including gluconeogenesis, glycolysis, and lipogene-sis (9). HCV infection may promote FoxO1 activation bya two-pronged mechanism, whereby diminished insulinsignaling results in dephosphorylation of the Akt sitesin FoxO1, allowing its reentry into the nucleus (12,25).In addition, HCV-induced expression of HDAC9 maycause deacetylation of nuclear FoxO1, enhancing FoxO1DNA-binding activity and association with gluconeogenic
gene promoters, thereby enhancing the transcription ofrate-controlling gluconeogenic enzymes. HDAC9 knock-down in both hepatic cells and HCV replicon cells resultedin increased acetylation and phosphorylation of endoge-nous FoxO1 (Fig. 4B and Supplementary Fig. 4C). Theseresults support the observation that FoxO acetylation ren-ders FoxO phosphorylation sites more accessible to Aktand other inactivating kinases (35). Our findings thereforesuggest a mechanism by which aberrant HDAC9 inductionmay contribute to the development of HCV-induced glu-cose homeostasis abnormality.
Our recent study showed that transgenic ICR miceexpressing both the human CD81 and OCLN genes (C/OTg)are permissive to HCV infection (19). Persistent HCV in-fection in this murine model further exhibited diseasemanifestations, including chronic viral hepatitis, steatosis,and fibrosis. Here, we report that persistent HCV infectionin this model also resulted in insulin resistance and hyper-glycemia, as reported in patients with chronic HCV infec-tion (Supplementary Tables 2 and 3). Furthermore, bothHDAC9 expression levels and gluconeogenic activity wereincreased in liver tissues from chronic HCV-infected rodentmodels and HCV-infected patients. Thus, HCV infectionmay lead to abnormal glucose homeostasis throughHDAC9 upregulation, which results in deacetylation ofnuclear FoxO1, enhancement of FoxO1 DNA-binding activ-ity and association with gluconeogenic gene promoters, andfinally increased hepatic gluconeogenesis. This potentialmechanism indicates that HDAC9 may be a potential thera-peutic target for suppressing hepatic gluconeogenesis andlowering blood glucose, and small-molecule inhibitors of classI/IIa HDACs may be useful as HCV-associated T2DM thera-peutics. Several pan-HDAC inhibitors are currently in phaseI–III clinical trials. Vorinostat, the first HDAC inhibitor de-veloped, has already been approved for treatment of a malig-nant disease (36,37). The potential utility of HDAC inhibitorsfor treating metabolic disease therefore merits consideration.
Acknowledgments. The authors are grateful to Dr. T. Wakita (NationalInstitute of Infectious Diseases, Japan) for pJFH-1 clone; Dr. F. Chisari (TheScripps Research Institute) for the HuH7.5.1 cell line; and Dr. C. Rice (TheRockefeller University) for NS5A antibody.Funding. This work was supported by grants from the National NaturalScience Foundation of China (grants 81271828, 31101011, 31271268); theNational Basic Research Program of China (grant 2015CB554304); and a projectfunded by the Priority Academic Program Development of Jiangsu HigherEducation.Duality of Interest. No potential conflicts of interest relevant to this articlewere reported.Author Contributions. J.C. and Q.W. designed the study. J.C., M.D., andM.G. performed experiments in HCV-infected cells. J.C., X.Chi, Y.P., and J.J.performed patients’ studies. J.C., Y.Z., Z.Z., and C.Z. performed transgenic miceand animal studies. N.W. and Q.W. performed experiments in replicon cells. J.C.,H.T., J.N., D.Y., Z.L., X.H., Q.W., and X.Che. performed experimental analysis.Q.W. wrote the manuscript. Q.W. is the guarantor of this work and, as such, hadfull access to all the data in the study and takes responsibility for the integrity ofthe data and the accuracy of the data analysis.
diabetes.diabetesjournals.org Chen and Associates 4097
References1. Lauer GM, Walker BD. Hepatitis C virus infection. N Engl J Med 2001;345:41–522. Magiorkinis G, Magiorkinis E, Paraskevis D, et al. The global spread ofhepatitis C virus 1a and 1b: a phylodynamic and phylogeographic analysis. PLoSMed 2009;6:e10001983. Agnello V, De Rosa FG. Extrahepatic disease manifestations of HCV in-fection: some current issues. J Hepatol 2004;40:341–3524. Lecube A, Hernández C, Genescà J, Simó R. Glucose abnormalities inpatients with hepatitis C virus infection: Epidemiology and pathogenesis. DiabetesCare 2006;29:1140–11495. Allison ME, Wreghitt T, Palmer CR, Alexander GJ. Evidence for a link be-tween hepatitis C virus infection and diabetes mellitus in a cirrhotic population.J Hepatol 1994;21:1135–11396. White DL, Ratziu V, El-Serag HB. Hepatitis C infection and risk of diabetes:a systematic review and meta-analysis. J Hepatol 2008;49:831–8447. Mason AL, Lau JY, Hoang N, et al. Association of diabetes mellitus andchronic hepatitis C virus infection. Hepatology 1999;29:328–3338. Vanni E, Abate ML, Gentilcore E, et al. Sites and mechanisms of insulinresistance in nonobese, nondiabetic patients with chronic hepatitis C. Hepatology2009;50:697–7069. Zhang W, Patil S, Chauhan B, et al. FoxO1 regulates multiple metabolicpathways in the liver: effects on gluconeogenic, glycolytic, and lipogenic geneexpression. J Biol Chem 2006;281:10105–1011710. Puigserver P, Rhee J, Donovan J, et al. Insulin-regulated hepatic gluco-neogenesis through FOXO1-PGC-1alpha interaction. Nature 2003;423:550–55511. Bernsmeier C, Calabrese D, Heim MH, Duong HT. Hepatitis C virus dysre-gulates glucose homeostasis by a dual mechanism involving induction of PGC1aand dephosphorylation of FoxO1. J Viral Hepat 2014;21:9–1812. Deng L, Shoji I, Ogawa W, et al. Hepatitis C virus infection promotes hepaticgluconeogenesis through an NS5A-mediated, FoxO1-dependent pathway. J Virol2011;85:8556–856813. Calnan DR, Brunet A. The FoxO code. Oncogene 2008;27:2276–228814. Yang XJ, Grégoire S. Class II histone deacetylases: from sequence tofunction, regulation, and clinical implication. Mol Cell Biol 2005;25:2873–288415. Sun Z, Miller RA, Patel RT, et al. Hepatic Hdac3 promotes gluconeogenesisby repressing lipid synthesis and sequestration. Nat Med 2012;18:934–94216. Rodgers JT, Lerin C, Haas W, Gygi SP, Spiegelman BM, Puigserver P.Nutrient control of glucose homeostasis through a complex of PGC-1alpha andSIRT1. Nature 2005;434:113–11817. Mihaylova MM, Vasquez DS, Ravnskjaer K, et al. Class IIa histone deace-tylases are hormone-activated regulators of FOXO and mammalian glucose ho-meostasis. Cell 2011;145:607–62118. Pei R, Zhang X, Xu S, et al. Regulation of hepatitis C virus replication andgene expression by the MAPK-ERK pathway. Virol Sin 2012;27:278–28519. Chen J, Zhao Y, Zhang C, et al. Persistent hepatitis C virus infections andhepatopathological manifestations in immune-competent humanized mice. CellRes 2014;24:1050–1066
20. Han Q, Xu C, Wu C, Zhu W, Yang R, Chen X. Compensatory mutations inNS3 and NS5A proteins enhance the virus production capability of hepatitis Creporter virus. Virus Res 2009;145:63–73
21. Wang Q, Chen J, Wang Y, Han X, Chen X. Hepatitis C virus induced a novelapoptosis-like death of pancreatic beta cells through a caspase 3-dependentpathway. PLoS One 2012;7:e38522
22. She P, Shiota M, Shelton KD, Chalkley R, Postic C, Magnuson MA. Phos-phoenolpyruvate carboxykinase is necessary for the integration of hepatic energymetabolism. Mol Cell Biol 2000;20:6508–6517
23. Crapo PA, Kolterman OG, Henry RR. Metabolic consequence of two-weekfructose feeding in diabetic subjects. Diabetes Care 1986;9:111–119
24. Fischle W, Dequiedt F, Hendzel MJ, et al. Enzymatic activity associated withclass II HDACs is dependent on a multiprotein complex containing HDAC3 andSMRT/N-CoR. Mol Cell 2002;9:45–57
25. Banerjee A, Meyer K, Mazumdar B, Ray RB, Ray R. Hepatitis C virusdifferentially modulates activation of forkhead transcription factors and insulin-induced metabolic gene expression. J Virol 2010;84:5936–594626. Crunkhorn S. Metabolic disease: new role for HDACs in glucose homeo-stasis. Nat Rev Drug Discov 2011;10:49227. de Zoeten EF, Wang L, Sai H, Dillmann WH, Hancock WW. Inhibition ofHDAC9 increases T regulatory cell function and prevents colitis in mice. Gas-troenterology 2010;138:583–59428. Chatterjee TK, Basford JE, Knoll E, et al. HDAC9 knockout mice are pro-tected from adipose tissue dysfunction and systemic metabolic disease duringhigh-fat feeding. Diabetes 2014;63:176–18729. Vial G, Dubouchaud H, Couturier K, et al. Effects of a high-fat diet on energymetabolism and ROS production in rat liver. J Hepatol 2011;54:348–35630. Matsuzawa-Nagata N, Takamura T, Ando H, et al. Increased oxidative stressprecedes the onset of high-fat diet-induced insulin resistance and obesity. Me-tabolism 2008;57:1071–107731. Shimazu T, Hirschey MD, Newman J, et al. Suppression of oxidative stressby b-hydroxybutyrate, an endogenous histone deacetylase inhibitor. Science2013;339:211–21432. Miura K, Taura K, Kodama Y, Schnabl B, Brenner DA. Hepatitis C virus-induced oxidative stress suppresses hepcidin expression through increasedhistone deacetylase activity. Hepatology 2008;48:1420–142933. Grozinger CM, Schreiber SL. Regulation of histone deacetylase 4 and 5 andtranscriptional activity by 14-3-3-dependent cellular localization. Proc Natl AcadSci U S A 2000;97:7835–784034. Nishino TG, Miyazaki M, Hoshino H, Miwa Y, Horinouchi S, Yoshida M. 14-3-3regulates the nuclear import of class IIa histone deacetylases. Biochem BiophysRes Commun 2008;377:852–85635. Qiang L, Banks AS, Accili D. Uncoupling of acetylation from phosphorylationregulates FoxO1 function independent of its subcellular localization. J Biol Chem2010;285:27396–2740136. Witt O, Deubzer HE, Milde T, Oehme I. HDAC family: what are the cancerrelevant targets? Cancer Lett 2009;277:8–2137. Walkinshaw DR, Yang XJ. Histone deacetylase inhibitors as novel anticancertherapeutics. Curr Oncol 2008;15:237–243
4098 HDAC9 and HCV in Abnormal Glucose Homeostasis Diabetes Volume 64, December 2015