Embed Size (px)
Citation preview

EUROBAROMETER 58.2
Written by:
THE EUROPEAN OPINIONRESEARCH GROUP (EORG)
For:
The SANCODirectorate-General
Survey managed and organised by:
Directorate-GeneralPress and Communication
"Opinion Polls, Press Reviews, Europe Direct"
April 2003
THE MENTAL HEALTH STATUS OFTHE EUROPEAN POPULATION

THE MENTAL HEALTH STATUS OF THE EUROPEAN POPULATIONThe European Opinion Research Group
April 2003
This public opinion survey was carried out at the request of the Research Directorate-
General Health and Consumer's Protection and was managed and organised by the Public
Opinion Analysis Unit of the Press and Communication Service.
It was conducted in all the Member at States of the European Union between October 28 and
December 8, 2002, under the general coordination of the European Opinion Research Group
EEIG. in Brussels.
The technical specifications, the names of the institutes involved in the research and the
questionnaire are annexed.
The European Commission accepts no liability of any kind arising from this report.
The original language of this report is English.

THE MENTAL HEALTH STATUS OF THE EUROPEAN POPULATIONThe European Opinion Research Group
April 2003
Table of contents
1. Introduction .......................................................................................................... 1
2. The methods ........................................................................................................ 2
3. The results ........................................................................................................... 4
4. Discussion.......................................................................................................... 14
5. Methodological issues........................................................................................ 14
ANNEXES .................................................................................................................18
Questionnaire......................................................................................................19Technical specifications ......................................................................................23

THE MENTAL HEALTH STATUS OF THE EUROPEAN POPULATION
The European Opinion Research Group
April 2003
1
1. Introduction
As a part of the standard, twice a year conducted Eurobarometer survey; a population
of 16000 people from 15 countries and 2 regions (East Germany and Northern Ireland)
within the European Union were interviewed face-to-face between 28 October and 8
December 2002. The interview covered a wide variety of issues from opinions on
political, financial or other EU-related topics to experiences about personal mental- and
other health. Among other topics, the interview schedule included questions focusing on
experiences of one's mental health status in terms of current symptoms of depression
or anxiety, sense of psychic distress, sense of positive experience of energy and vitality
and awareness of a social support network. The mental health related questions were
from standardized questionnaires that belong to the 'Minimum data set of European
mental health indicators', proposed and tested by a European project (1999-2002)
funded from the EU Health Monitoring Programme. These survey methods have been
used earlier e.g. in a multi-national European ODIN-survey and other surveys or studies
(Dowrick et al 1998, Bijl & Ravelli 1996). Apart from the ODIN -survey there are no
previous published surveys or studies on the cross-national variation of mental health
problems or mental disorders within Europe in the general population.
THE MENTAL HEALTH STATUS OF THE EUROPEAN POPULATION
The European Opinion Research Group
April 2003
2
2. The methods
The mental health measures in the 2002 Eurobarometer survey were established
questionnaires about either negative or positive dimension of mental health. In addition,
a question about the use of services was asked. The measure of the occurrence of
current mental health problems (MHI-5) and that of positive mental health (EVI), are
part of the SF-36 Health Survey -instrument (Ware et al 1993, McCabe et al 1996, Bijl &
Ravelli 1996). SF-36 measures perceived health status with a sum score of the different
indexes ranging from 0 to 100, and it is generally considered a feasible instrument for
evaluating several different dimensions of health.
The reliability of the SF-36 in general has been reported in several studies to be good.
This includes the internal consistency (alpha coefficients) ranging from 0.62 to 0.94 and
the test-retest coefficients ranging from 0.43 to 0.90 for a 6-month interval and from
0.60 to 0.81 for a 2 week interval. As for validity, it has been shown to correlate
moderately well with other well-known health measures.
The 5-item mental health index (MHI-5) of the SF-36 has been reported to correlate
highly with the GHQ-12 -questionnaire which is a well-established indicator of psychic
distress (McCabe et al 1996, Ayuso-Mateos et al. 1999) as well as with different
versions of the SCL questionnaire (Strand et al. 2003). Internal consistency estimates
for MHI-5 range from 0.65 to 0.80. With regard to assumed validity, the MHI-5 is equal
to a longer version, MHI-18 and another questionnaire GHQ-30 in detecting the mental
disorders diagnosed with an established and standardised DIS -interview schedule
(Weinstein et al 1989).
Another of the eight subscales or dimensions of the SF-36 is a measure of
psychological well-being called the energy and vitality scale (EVI), which includes four
questions giving a sum score range of 0-100 (McDowell & Newell 1996, Bijl & Ravell
2000). Its psychometric properties along with the general SF-36 instrument have been
estimated to be good.

THE MENTAL HEALTH STATUS OF THE EUROPEAN POPULATION
The European Opinion Research Group
April 2003
3
The use of services for mental health problems was covered with a single question
about seeking help from somebody in respect of a mental health problem during the last
12 months. The nine alternative answers were in the analyses categorised into four
classes, including not seeking help, seeking it from general practice, seeking from a
specialist or from somebody else.
In measuring social support, the 3-item Oslo social support scale was used (Brevik &
Dalgard 1996). The three questions cover the reported number of close friends and
perceived concern and practical help from others and the sum score ranges from 3-12.
Scores 3-7 are considered as poor, scores 8-10 as moderate and scores 11-12 as
strong.
The standard Eurobarometer surveys cover the population of the respective
nationalities of the EU member states, aged 15 years and over, resident in each of the
member states. The basic sample design applied in all member states is a multi-stage,
random (probability) one. In each EU country, a number of sampling points is drawn
with probability proportional to population size (for a total coverage of the country) and
to population density. The net sample sizes are about 1000 per country/region, except
Luxembourg (about 600) and Northern Ireland (about 300). The response rates varied
from 23% (Great Britain) to 84% (France). In 8 of the countries/regions the response
rate was less than 50%.
Data from these interviews were analysed using basic statistical methods for the
purposes of this report. Contingency tables were created and tests of significance
included the chi-square test and ANOVA. A multivariate logistic regression model was
performed in which basic variables were entered as independent variables and the MHI-
5 estimated caseness for mental health problems was the dependent variable. Weight
adjustments were made when counting the proportions and mean scores for the whole
EU.

THE MENTAL HEALTH STATUS OF THE EUROPEAN POPULATION
The European Opinion Research Group
April 2003
4
3. The results
In the following, estimates of the occurrence (%) of mental health problems in terms of a
sum score of 52 or less using the MHI-5 of the SF-36 are reported by country in relation
to age, sex, marital and employment status, concern showed by others, availability of
practical help, number of close relationships and a total score of social support (Tables
1-8).
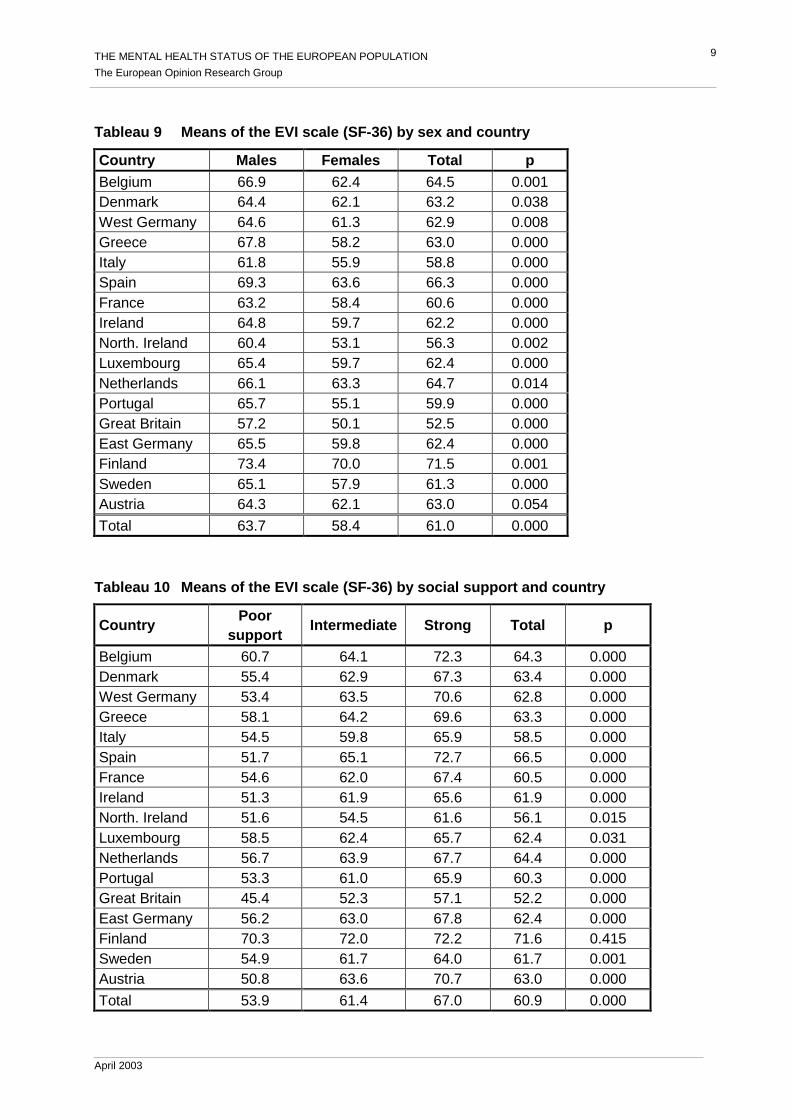
Furthermore, the mean score of the energy and vitality scale (EVI) is presented by sex
and country (table 9) and by social support and country (table 10). The correlation
between MHI-5 score and EVI is seen in table 11.
A logistic regression model is presented, in which mental health problems are explained
by country. West Germany as a large country with medium score of mental health
problems was chosen as the reference country and age, sex, marital status,
professional status, social support item and use of services were entered as
background variables. The results in terms of OR for mental health problems by country
are presented in table 12. As can be seen, the differences between the countries mainly
remained also after controlling for several confounding variables.
The total sum of social support is presented in table 13. The use of any health services
in the last 12 months in relation to mental health problems (MHI-5 caseness) and
country is presented in table 14. The use of a general practitioner and the use of a
psychiatrist or a psychologist are presented in tables 15 and 16.
In a separate analysis, the internal consistency of the EVI and MHI-5 scales were
estimated within the countries/regions. In case of the EVI scale, the Cronbach's Alpha
was found to range from o.74 (Italy) to 0.87 (Northern Ireland), and MHI-5 scale from
0.79 (Luxembourg) to 0.88 (Northern Ireland).

THE MENTAL HEALTH STATUS OF THE EUROPEAN POPULATION
The European Opinion Research Group
April 2003
5
Tableau 1 Occurrence of MHI-5 cases (score 52 or less) by sex and country (%)
Country Males Females Total pBelgium 15.4 22.4 19.1 0.004Denmark 14.1 18.3 16.2 0.080West Germany 17.2 22.8 20.1 0.031Greece 14.9 32.0 23.5 0.000Italy 22.9 37.1 30.2 0.000Spain 14.2 20.8 17.6 0.007France 20.4 30.8 25.9 0.000Ireland 12.4 18.9 15.7 0.006North. Ireland 21.1 21.7 21.4 0.894Luxembourg 14.9 22.1 18.7 0.027Netherlands 13.4 14.3 13.9 0.677Portugal 17.0 40.7 29.8 0.000Great Britain 25.8 34.5 31.5 0.005East Germany 18.1 27.9 23.4 0.000Finland 9.0 9.4 9.3 0.846Sweden 8.7 15.7 12.4 0.001Austria 17.0 21.2 19.5 0.110
Total 18.9 27.6 23.4 0.000
Tableau 2 Occurrence of MHI-5 cases (score = 52 or less) by age and country (%)
Country 15 - 25 26 - 44 45 - 64 65+ years Total pBelgium 13.8 18.8 23.1 18.1 19.1 0.095Denmark 18.9 13.7 17.9 15.6 16.2 0.417W. Germany 17.4 15.5 20.2 28.4 20.1 0.003Greece 16.3 20.4 25.4 33.3 23.5 0.001Italy 26.9 29.0 32.6 31.5 30.2 0.562Spain 12.0 14.2 22.3 25.0 17.6 0.001France 19.1 24.1 30.7 30.3 25.9 0.020Ireland 6.8 15.4 21.4 19.1 15.7 0.000N. Ireland 23.2 0.0 18.8 34.4 23.5 0.664Luxembourg 15.3 18.9 21.3 16.8 18.7 0.619Netherlands 11.4 12.7 16.6 13.0 13.9 0.308Portugal 14.9 16.9 41.3 49.7 29.8 0.000Great Britain 26.4 33.1 35.1 27.5 31.5 0.157E. Germany 19.0 23.1 22.5 27.6 23.4 0.299Finland 8.2 8.1 11.0 9.1 9.3 0.595Sweden 17.3 15.7 10.6 7.2 12.4 0.006Austria 12.8 16.4 22.0 28.9 20.5 0.001
Total 18.3 21.7 26.2 27.2 23.4 0.000

THE MENTAL HEALTH STATUS OF THE EUROPEAN POPULATION
The European Opinion Research Group
April 2003
6
Tableau 3 Occurrence of MHI-5 cases (score 52 or less) by marital status and country (%)
Country Married Cohabit. Single Divorced Widowed Total pBelgium 15.3 13.4 16.2 36.0 26.9 19.1 0.000Denmark 10.0 11.9 20.9 27.2 29.4 16.2 0.000W. Germany 17.5 11.6 17.9 23.1 36.6 20.1 0.000Greece 23.5 7.1 19.1 32.6 43.5 23.5 0.000Italy 28.0 28.9 27.5 44.1 45.6 30.2 0.003Spain 16.8 17.0 11.0 29.6 43.1 17.6 0.000France 23.8 21.8 19.3 35.6 31.5 25.9 0.002Ireland 16.8 17.0 6.9 33.8 26.2 15.7 0.000N. Ireland 23.2 0.0 18.8 34.4 23.5 21.4 0.019Luxembourg 15.5 13.6 16.9 32.4 33.3 18.7 0.002Netherlands 9.9 11.4 14.8 25.0 32.1 13.9 0.000Portugal 29.5 22.2 15.5 45.7 56.1 29.8 0.000Great Britain 26.5 26.1 30.8 44.9 36.5 31.5 0.000E. Germany 19.1 15.0 18.4 30.9 40.0 23.4 0.000Finland 6.1 7.1 11.0 16.7 7.0 9.3 0.001Sweden 8.1 10.6 18.7 22.9 6.5 12.4 0.000Austria 18.9 14.5 13.6 20.0 34.7 19.5 0.001
Total 20.9 17.5 19.8 34.0 36.0 23.4 0.000
Tableau 4 Occurrence of MHI-5 cases (score 52 or less) by employment country (%)
CountryWhitecoll.
Bluecollar
Unempl. Retired Other Total p
Belgium 19.1 15.4 27.8 23.7 26.9 19.1 0.011Denmark 13.0 12.8 26.5 20.5 15.7 16.2 0.021W. Germany 15.4 17.7 25.0 26.9 18.2 20.1 0.008Greece 16.6 22.0 37.8 34.8 22.0 23.5 0.000Italy 30.0 30.6 25.6 29.9 31.5 30.2 0.964Spain 18.6 11.4 17.1 29.0 15.4 17.6 0.000France 24.4 21.8 19.3 35.6 31.5 25.9 0.004Ireland 13.2 15.7 35.3 20.2 15.6 15.7 0.099N. Ireland 20.7 16.0 27.3 24.5 24.7 21.4 0.677Luxembourg 19.3 16.0 85.7 13.8 20.7 18.7 0.000Netherlands 12.9 10.0 15.0 17.6 16.2 13.9 0.197Portugal 18.5 23.2 26.5 50.7 30.5 29.8 0.000Great Britain 26.4 26.2 46.9 37.2 33.0 31.5 0.003E. Germany 23.0 18.0 23.9 29.3 15.5 23.4 0.012Finland 9.2 7.7 10.0 9.9 10.2 9.3 0.893Sweden 12.7 12.7 22.2 8.8 14.5 12.4 0.081Austria 15.9 14.4 54.2 28.9 16.3 19.5 0.000
Total 21.3 19.4 31.4 29.2 22.1 23.4 0.000

THE MENTAL HEALTH STATUS OF THE EUROPEAN POPULATION
The European Opinion Research Group
April 2003
7
Tableau 5 Occurrence of MHI-5 cases (score = 52 or less) by concern showed by othersand country (%)
Country No or little Some Lot ofconcern Total p
Belgium 25.9 17.6 12.9 19.1 0.001Denmark 21.3 15.3 15.0 16.2 0.226West Germany 36.8 19.6 12.4 20.1 0.000Greece 40.9 24.3 17.6 23.5 0.000Italy 38.5 27.7 24.8 30.2 0.002Spain 48.9 17.2 11.3 17.6 0.000France 38.9 20.8 21.3 25.9 0.000Ireland 30.7 13.3 13.1 15.7 0.000North. Ireland 26.1 17.8 23.5 21.4 0.392Luxembourg 23.9 16.4 19.8 18.7 0.248Netherlands 27.2 13.0 11.8 13.9 0.000Portugal 40.0 26.4 29.1 29.8 0.009Great Britain 39.4 31.1 29.0 31.5 0.052East Germany 40.1 24.8 14.6 23.4 0.000Finland 7.0 9.8 11.1 9.3 0.263Sweden 13.1 12.0 12.6 12.4 0.920Austria 45.5 18.7 12.2 19.5 0.000
Total 36.5 21.8 18.0 23.4 0.000
Tableau 6 Occurrence of MHI-5 cases (score = 52 or less) by availability of practicalhelp and country (%)
Country Difficult orvery difficult Easy Help very
easy Total p
Belgium 29.2 16.5 13.8 18.9 0.000Denmark 31.5 13.7 12.3 16.1 0.000West Germany 38.5 15.8 14.5 20.0 0.000Greece 32.8 18.3 17.9 23.0 0.000Italy 38.4 25.5 21.1 30.2 0.000Spain 37.8 16.6 9.9 17.4 0.000France 36.3 24.8 15.8 26.4 0.000Ireland 28.4 17.8 10.1 15.6 0.000North. Ireland 43.2 18.6 16.9 21.1 0.002Luxembourg 22.6 16.7 18.3 18.5 0.406Netherlands 20.2 15.3 8.1 14.1 0.000Portugal 37.5 28.5 25.5 30.1 0.035Great Britain 45.0 30.8 24.4 32.0 0.000East Germany 40.0 20.9 13.5 23.1 0.000Finland 14.1 8.3 7.0 9.2 0.018Sweden 21.8 10.0 9.9 12.0 0.000Austria 43.3 13.5 16.0 19.7 0.000
Total 36.9 20.6 15.9 23.4 0.000

THE MENTAL HEALTH STATUS OF THE EUROPEAN POPULATION
The European Opinion Research Group
April 2003
8
Tableau 7 Occurrence of MHI-5 cases (score = 52 or less) by number of closerelationships and country (%)
Country None 1 or 2 3 or more Total pBelgium 41.4 23.9 14.3 19.1 0.000Denmark 45.5 23.0 13.3 16.2 0.000West Germany 36.4 23.0 14.1 20.1 0.000Greece 39.5 26.2 17.0 23.5 0.000Italy 47.4 37.1 26.0 30.2 0.000Spain 61.5 29.7 13.2 17.6 0.000France 66.7 33.0 18.8 25.9 0.000Ireland 36.7 21.1 12.1 15.7 0.000North. Ireland 21.4 32.5 17.5 21.4 0.023Luxembourg 25.0 22.9 16.9 18.7 0.197Netherlands 36.4 15.8 12.6 13.9 0.000Portugal 63.9 34.3 23.8 29.8 0.000Great Britain 45.2 40.7 26.0 31.5 0.000East Germany 51.7 27.0 15.4 23.4 0.000Finland 21.4 11.3 7.4 9.3 0.010Sweden 12.5 24.5 10.4 12.4 0.000Austria 36.7 28.8 12.6 19.5 0.000
Total 45.5 29.8 18.3 23.4 0.000
Tableau 8 Occurrence of MHI-5 cases (score = 52 or less) by social support and country(%)
Country Poor support Intermediate Strong Total pBelgium 28.1 16.7 9.0 18.8 0.000Denmark 25.8 14.7 11.2 16.0 0.000West Germany 36.0 15.6 13.2 19.3 0.000Greece 39.3 18.3 10.9 23.5 0.000Italy 41.4 26.1 15.2 30.6 0.000Spain 48.1 18.4 14.1 17.2 0.000France 40.6 21.3 16.7 26.5 0.000Ireland 40.7 14.8 9.8 16.0 0.000North. Ireland 35.5 20.2 18.4 21.5 0.123Luxembourg 25.3 17.1 18.5 18.8 0.208Netherlands 26.2 15.0 9.6 14.4 0.000Portugal 44.7 27.2 23.1 29.5 0.000Great Britain 52.1 28.4 19.4 32.1 0.000East Germany 43.2 19.4 12.3 23.3 0.000Finland 12.9 8.2 7.7 9.2 0.103Sweden 21.2 10.5 10.5 12.0 0.000Austria 47.6 16.4 10.5 20.4 0.000
Total 40.8 20.0 14.8 23.5 0.000
THE MENTAL HEALTH STATUS OF THE EUROPEAN POPULATION
The European Opinion Research Group
April 2003
9
Tableau 9 Means of the EVI scale (SF-36) by sex and country
Country Males Females Total pBelgium 66.9 62.4 64.5 0.001Denmark 64.4 62.1 63.2 0.038West Germany 64.6 61.3 62.9 0.008Greece 67.8 58.2 63.0 0.000Italy 61.8 55.9 58.8 0.000Spain 69.3 63.6 66.3 0.000France 63.2 58.4 60.6 0.000Ireland 64.8 59.7 62.2 0.000North. Ireland 60.4 53.1 56.3 0.002Luxembourg 65.4 59.7 62.4 0.000Netherlands 66.1 63.3 64.7 0.014Portugal 65.7 55.1 59.9 0.000Great Britain 57.2 50.1 52.5 0.000East Germany 65.5 59.8 62.4 0.000Finland 73.4 70.0 71.5 0.001Sweden 65.1 57.9 61.3 0.000Austria 64.3 62.1 63.0 0.054
Total 63.7 58.4 61.0 0.000
Tableau 10 Means of the EVI scale (SF-36) by social support and country
CountryPoor
supportIntermediate Strong Total p
Belgium 60.7 64.1 72.3 64.3 0.000Denmark 55.4 62.9 67.3 63.4 0.000West Germany 53.4 63.5 70.6 62.8 0.000Greece 58.1 64.2 69.6 63.3 0.000Italy 54.5 59.8 65.9 58.5 0.000Spain 51.7 65.1 72.7 66.5 0.000France 54.6 62.0 67.4 60.5 0.000Ireland 51.3 61.9 65.6 61.9 0.000North. Ireland 51.6 54.5 61.6 56.1 0.015Luxembourg 58.5 62.4 65.7 62.4 0.031Netherlands 56.7 63.9 67.7 64.4 0.000Portugal 53.3 61.0 65.9 60.3 0.000Great Britain 45.4 52.3 57.1 52.2 0.000East Germany 56.2 63.0 67.8 62.4 0.000Finland 70.3 72.0 72.2 71.6 0.415Sweden 54.9 61.7 64.0 61.7 0.001Austria 50.8 63.6 70.7 63.0 0.000
Total 53.9 61.4 67.0 60.9 0.000

THE MENTAL HEALTH STATUS OF THE EUROPEAN POPULATION
The European Opinion Research Group
April 2003
10
Tableau 11 Pearson correlation between MHI-5 and EVI by country
Country N CorrelationBelgium 1064 .770***Denmark 925 .743***West Germany 966 .779***Greece 995 .722***Italy 958 .729***Spain 951 .773***France 992 .737***Ireland 951 .715***Northern Ireland 297 .750***Luxembourg 576 .716***Netherlands 1015 .642***Portugal 972 .748***Great Britain 991 .712***East Germany 958 .759***Finland 1005 .759***Sweden 977 .711***Austria 975 .820***
Total 15531 .740***
Tableau 12 Logistic regression analysis of the risk for MHI-5 caseness by country (theanalysis includes sex. age. marital status. employment status. socialsupport items and use of mental health services)
Country Significance Odds ratio 95% confidence intervalBelgium 0.273 0.864 0.666 - 1.122Denmark 0.869 0.977 0.739 - 1.291West Germany 1.0Greece 0.007 1.418 1.100 - 1.827Italy 0.000 2.033 1.585 - 2.608Spain 0.038 1.333 1.015 -1.749France 0.022 1.343 1.044 - 1.728Ireland 0.489 1.102 0.837 - 1.452Northern Ireland 0.021 1.534 1.065 - 2.209Luxembourg 0.227 1.205 0.891 - 1.629Netherlands 0.111 0.799 0.606 - 1.053Portugal 0.000 1.996 1.555 - 2.564Great Britain 0.000 2.158 1.687 - 2.759East Germany 0.265 1.156 0.896 - 1.492Finland 0.000 0.390 0.287 - 0.529Sweden 0.007 0.667 0.497 - 0.895Austria 0.157 1.209 0.930 - 1.571

THE MENTAL HEALTH STATUS OF THE EUROPEAN POPULATION
The European Opinion Research Group
April 2003
11
Tableau 13 Social support by country (%)
Country Strong Intermediate Poor support TotalBelgium 14.7 56.7 28.6 100.0Denmark 31.1 56.4 12.5 100.0West Germany 16.7 64.7 18.6 100.0Greece 10.1 65.5 24.4 100.0Italy 9.1 54.8 36.1 100.0Spain 35.1 17.2 11.3 100.0France 13.5 56.3 30.2 100.0Ireland 28.2 61.2 10.6 100.0North. Ireland 27.3 61.5 11.2 100.0Luxembourg 20.2 62.9 16.9 100.0Netherlands 34.4 54.2 11.4 100.0Portugal 10.8 73.1 16.1 100.0Great Britain 24.2 57.4 18.5 100.0East Germany 16.9 62.1 21.0 100.0Finland 8.5 67.8 23.7 100.0Sweden 28.4 61.4 10.2 100.0Austria 21.5 61.3 17.1 100.0
Total 21.7 59.1 19.2 100.0
Tableau 14 Use of some health service in last 12 months due to mental healthproblems by MHI-5 caseness (score 52 or lower) and country (%)
Country No case Case Total pBelgium 6.6 35.6 12.1 0.000Denmark 4.6 27.0 8.2 0.000W. Germany 5.3 28.9 10.0 0.000Greece 3.0 15.4 5.9 0.000Italy 3.9 12.8 6.6 0.000Spain 3.0 22.4 6.4 0.000France 6.7 33.5 13.6 0.000Ireland 4.4 28.9 8.3 0.000N. Ireland 3.4 31.3 9.4 0.000Luxembourg 4.9 29.4 9.4 0.000Netherlands 8.4 40.1 12.8 0.000Portugal 5.4 25.9 11.5 0.000Great Britain 6.9 29.0 13.9 0.000E. Germany 5.0 30.0 10.8 0.000Finland 5.8 22.6 7.4 0.000Sweden 5.6 34.4 9.2 0.000Austria 2.6 33.2 8.6 0.000
Total 5.3 25.6 10.0 0.000

THE MENTAL HEALTH STATUS OF THE EUROPEAN POPULATION
The European Opinion Research Group
April 2003
12
Tableau 15 Table 15. Use of GP in last 12 months due to mental health problems by sexand country (%)
Country Male Female Total pBelgium 4.5 9.0 6.8 0.004Denmark 4.4 6.3 5.4 0.181W. Germany 5.2 9.0 7.1 0.021Greece 2.2 2.8 2.5 0.547Italy 2.4 1.7 2.0 0.418Spain 3.1 3.7 3.4 0.603France 7.1 8.0 7.6 0.585Ireland 3.7 7.7 5.7 0.006N. Ireland 5.9 9.0 7.6 0.320Luxembourg 2.1 4.7 3.5 0.079Netherlands 5.8 5.4 5.6 0.791Portugal 3.7 10.1 7.2 0.000Great Britain 9.6 10.5 10.2 0.648E. Germany 5.1 8.4 6.9 0.036Finland 2.1 3.1 2.6 0.320Sweden 2.1 6.8 4.6 0.000Austria 3.2 6.1 4.9 0.035
Total 5.0 6.8 5.9 0.000
Tableau 16 Use of psychiatrist or psychologist in last 12 months due to mental healthproblems by MHI-5 caseness (score 52 or lower) and country (%)
Country No case Case Total pBelgium 2.0 11.7 3.8 0.000Denmark 1.7 13.8 3.6 0.000W. Germany 0.1 4.6 1.0 0.000Greece 0.5 5.6 1.7 0.000Italy 1.5 4.7 2.4 0.002Spain 0.8 10.6 2.5 0.000France 2.0 13.5 5.0 0.000Ireland 0.4 3.9 0.9 0.000N. Ireland 0.9 10.9 3.0 0.000Luxembourg 1.7 12.8 3.8 0.000Netherlands 3.1 16.2 4.9 0.000Portugal 1.3 8.3 3.4 0.000Great Britain 0.6 3.8 1.6 0.000E. Germany 0.9 5.3 2.0 0.000Finland 2.2 7.5 2.7 0.002Sweden 1.5 16.4 3.4 0.000Austria 0.4 6.7 1.6 0.000
Total 1.0 7.1 2.5 0.000

THE MENTAL HEALTH STATUS OF THE EUROPEAN POPULATION
The European Opinion Research Group
April 2003
13
Tableau 17 The response rates for the Eurobarometer survey in participating countries
Country Response rateEB58.2
Belgium 49Danmark 32West Germany 78East Germany 77Greece 41Spain 73France 84Ireland 33North Ireland 43Italy 60Luxembourg 59Netherlands 47Austria 68Portugal 66Finland 44Sweden 51Great Britain 23

THE MENTAL HEALTH STATUS OF THE EUROPEAN POPULATION
The European Opinion Research Group
April 2003
14
4. Discussion
In the mental health measures presented for the first time in the Eurobarometer survey,
differences were found in the occurrence scores of mental health problems, in reported
energy and vitality and in perceived social support between the 17 participating
European countries/regions. The lowest scores for mental health problems were found
for Finland and Sweden in both univariate- and multivariate analyses. The highest
scores and in addition, remarkable sex-differences in terms of higher female to male
ratios, were found for Italy and Portugal. The socio-demographic and other background
variables associated with mental health problems more or less expectedly and mostly in
accordance with what is known on the distribution of these characteristics.
5. Methodological issues
In interpreting the figures now presented, several notes have to be made.
Questionnaires used in detecting the dimensions of mental health are well-established
and tested in several previous studies. However, and despite an instructed translation
process, the possibility of slight conceptual differences in final translated questionnaires
between countries cannot be fully excluded. The psychometric properties of the
instruments have been tested to some extent, but their true validity in a multicultural
context remains questionable in many regards.
The interviews have been conducted by professional agencies and at least a minimum
level of expertise in interviewing can be expected. However, differences may well exist
in the orientation of these agencies toward mental health questioning, leading to some
additional variation between countries. Furthermore, the cultural differences most likely
influence the act of interviewing to some extent. The interaction and roles of the
participants as well as understanding and interpretation of terms and concepts may
differ and cause variation between participating countries.
THE MENTAL HEALTH STATUS OF THE EUROPEAN POPULATION
The European Opinion Research Group
April 2003
15
It has to be remembered that service systems and the role of different organisations
differ remarkably between the countries. As the utilisation is much dependent on the
availability and nature of these service systems, it would be premature to draw
conclusions about the help-seeking behaviour of the studied subjects from comparisons
between the countries.
The mental health measures used in this survey are supposed to be reliable and valid
for issues now investigated in EU-countries. The differences found between the EU-
nations most likely reflect some true differences in study populations as for instance in
the case of Ireland and UK using the same English-language instrument. The tests for
internal consistency (Cronbach's Alpha) of the main instruments support the validity of
comparisons. However, a part of the differences or their effect-sizes may be explained
by methodological issues, including poor response rates in some countries, translation-
related and conceptual differences or cultural and contextual differences related to the
act of interviewing. The response rates - reported in table 17 - may raise questions
regarding both representativeness of the interviewed and the validity of cross-national
comparisons.

THE MENTAL HEALTH STATUS OF THE EUROPEAN POPULATION
The European Opinion Research Group
April 2003
16
References:
Ayuso-Mateos JL, Lasa L, Vázquez-Barquero JL, Oviedo A, Diez-Manrique JF.
Measuring health status in psychiatric community surveys: internal and external validity
of the Spanish version of the SF-36. Acta Psychiatr Scand 1999:99:26-32
Berwick DM, Murphy JM, Goldman PA, et al: Performance of a five-item mental health
screening test. Med Care 29:169–176, 1991.
Bijl RV, Ravelli A. Current and residual functional disability associated with
psychopathology: findings from the Netherlands Mental Health Survey and Incidence
Study (NEMESIS). Psychological Medicine 2000; 30:657-668.
Brevik, JI, Dalgard,OS. The Health Profile Inventory. Oslo, 1996.
Dowrick C, Casey P, Dalgard O, Hosman C, Lehtinen V, Vazquez-Barquero JL,
Wilkinson G. Outcomes of Depression International Network (ODIN). Background,
methods and field trials. ODIN Group. British Journal of Psychiatry 1998; 172:359-363.
Handbook of Psychiatric Measures. American Psychiatric Association, Washington, DC
2000.
McCabe CJ, Thomas KJ, Brazier JE, et al. Measuring the mental health status of a
population: a comparison of the GHQ-12 and the SF-36 (MHI-5). Br J Psychiatry 1996;
169:517-521.
McDowell I, Newell C. Quality of life, chapter 9. Measuring health. A guide to rating
scales and questionnaires. Second edition, Oxford, Oxford University Press 1996.
McHorney CA, Ware JE, Raczek AE: The MOS 36-Item Short-Form Health Survey
(SF-36), II: psychometric and clinical tests of validity in measuring physical and mental
health constructs. Med Care 1993; 31:247-263.

THE MENTAL HEALTH STATUS OF THE EUROPEAN POPULATION
The European Opinion Research Group
April 2003
17
Strand BH, Dalgard OS, Tambs K, Rognerud M. Measuring the mental health status of
the Norvegian population: a comparison of the instruments SCL-25, SCL-10, SCL-5 and
MHI-5 (SF-36). Nord J Psychiatry 2003:57, in press.
Ware JE, Snow KK, Kosinski M, et al. SF-36 Health Survey: Manual and interpretation
guide. Boston MA, Health Institute, New England Medical Center, 1993.
Weinstein MC, Berwick DM, Goldman PA, et al: A comparison of three psychiatric
screening
tests using receiver operating characteristics (ROC) analysis. Med Care 1989;
27:593–607.

THE MENTAL HEALTH STATUS OF THE EUROPEAN POPULATION
The European Opinion Research Group
April 2003
18
ANNEXES

THE MENTAL HEALTH STATUS OF THE EUROPEAN POPULATION
The European Opinion Research Group
April 2003
19
QUESTIONNAIRE
Q. 37. In the past month, have you felt full of life?(SHOW CARD - READ OUT - ONE ANSWER ONLY)
All the time………………………………………………………………………………………….. 1 (263)
Very often…………………………………………………………………………………………… 2
Often………………………………………………………………………………………………… 3
Rarely……………………………………………………………………………………………….. 4
Very rarely………………………………………………………………………………………….. 5
Never……………………………………………………………………………………………….. 6
Don't know/Don't remember (SPONTANEOUS)……………………………………………….. 7
EB58.2 - NEW
Q. 38. In the past month, have you felt particularly tense?(SHOW SAME CARD - READ OUT - ONE ANSWER ONLY)
All the time………………………………………………………………………………………….. 1 (264)
Very often…………………………………………………………………………………………… 2
Often………………………………………………………………………………………………… 3
Rarely……………………………………………………………………………………………….. 4
Very rarely………………………………………………………………………………………….. 5
Never……………………………………………………………………………………………….. 6
Don't know/Don't remember (SPONTANEOUS)……………………………………………….. 7
EB58.2 - NEW
Q. 39. In the past month, have you felt so down in the dumps that nothing could cheer you up?(SHOW SAME CARD - READ OUT - ONE ANSWER ONLY)
All the time………………………………………………………………………………………….. 1 (265)
Very often…………………………………………………………………………………………… 2
Often………………………………………………………………………………………………… 3
Rarely……………………………………………………………………………………………….. 4
Very rarely………………………………………………………………………………………….. 5
Never……………………………………………………………………………………………….. 6
Don't know/Don't remember (SPONTANEOUS)……………………………………………….. 7
EB58.2 - NEW

THE MENTAL HEALTH STATUS OF THE EUROPEAN POPULATION
The European Opinion Research Group
April 2003
20
Q. 40. In the past month, have you felt calm and peaceful?(SHOW SAME CARD - READ OUT - ONE ANSWER ONLY)
All the time………………………………………………………………………………………….. 1 (266)
Very often…………………………………………………………………………………………… 2
Often………………………………………………………………………………………………… 3
Rarely……………………………………………………………………………………………….. 4
Very rarely………………………………………………………………………………………….. 5
Never……………………………………………………………………………………………….. 6
Don't know/Don't remember (SPONTANEOUS)……………………………………………….. 7
EB58.2 - NEW
Q. 41. In the past month, did you have lots of energy?(SHOW SAME CARD - READ OUT - ONE ANSWER ONLY)
All the time………………………………………………………………………………………….. 1 (267)
Very often…………………………………………………………………………………………… 2
Often………………………………………………………………………………………………… 3
Rarely……………………………………………………………………………………………….. 4
Very rarely………………………………………………………………………………………….. 5
Never……………………………………………………………………………………………….. 6
Don't know/Don't remember (SPONTANEOUS)……………………………………………….. 7
EB58.2 - NEW
Q. 42. In the past month, have you felt downhearted and miserable?(SHOW SAME CARD - READ OUT - ONE ANSWER ONLY)
All the time………………………………………………………………………………………….. 1 (268)
Very often…………………………………………………………………………………………… 2
Often………………………………………………………………………………………………… 3
Rarely……………………………………………………………………………………………….. 4
Very rarely………………………………………………………………………………………….. 5
Never……………………………………………………………………………………………….. 6
Don't know/Don't remember (SPONTANEOUS)……………………………………………….. 7
EB58.2 - NEW

THE MENTAL HEALTH STATUS OF THE EUROPEAN POPULATION
The European Opinion Research Group
April 2003
21
Q. 43. In the past month, have you felt worn out?(SHOW SAME CARD - READ OUT - ONE ANSWER ONLY)
All the time………………………………………………………………………………………….. 1 (269)
Very often…………………………………………………………………………………………… 2
Often………………………………………………………………………………………………… 3
Rarely……………………………………………………………………………………………….. 4
Very rarely………………………………………………………………………………………….. 5
Never……………………………………………………………………………………………….. 6
Don't know/Don't remember (SPONTANEOUS)……………………………………………….. 7
EB58.2 - NEW
Q. 44. In the past month, have you felt happy?(SHOW SAME CARD - READ OUT - ONE ANSWER ONLY)
All the time………………………………………………………………………………………….. 1 (270)
Very often…………………………………………………………………………………………… 2
Often………………………………………………………………………………………………… 3
Rarely……………………………………………………………………………………………….. 4
Very rarely………………………………………………………………………………………….. 5
Never……………………………………………………………………………………………….. 6
Don't know/Don't remember (SPONTANEOUS)……………………………………………….. 7
EB58.2 - NEW
Q. 45. In the past month, did you feel tired?(SHOW SAME CARD - READ OUT - ONE ANSWER ONLY)
All the time………………………………………………………………………………………….. 1 (271)
Very often…………………………………………………………………………………………… 2
Often………………………………………………………………………………………………… 3
Rarely……………………………………………………………………………………………….. 4
Very rarely………………………………………………………………………………………….. 5
Never……………………………………………………………………………………………….. 6
Don't know/Don't remember (SPONTANEOUS)……………………………………………….. 7
EB58.2 - NEW

THE MENTAL HEALTH STATUS OF THE EUROPEAN POPULATION
The European Opinion Research Group
April 2003
22
Q. 46. In the last 12 months, did you seek help from somebody in respect of a mental healthproblem? (IF YES) Indicate who in the following list.(SHOW CARD - READ OUT - MULTIPLE ANSWERS POSSIBLE)
No…………………………………………………………………………………………………... 1, (272 – 281)
Yes, a general practitioner ……………………………………………………………………… 2,
Yes, a chemist……... ……………………………………………………………………………. 3,
Yes, a psychiatrist………………………………………………………………………………… 4,
Yes, a psychologist………………………………………………………………………………. 5,
Yes, a nurse………………………………………………………………………………………. 6,
Yes, a social worker………………………………………………………………………………. 7,
Yes, other professional help……………………………………………………………………… 8,
Yes, other (SPONTANEOUS)……………………………………………………………………. 9,
DK……………………………………………………………………………………………………. 10,
EB58.2 - NEW
Q. 47. If you had serious personal problems, how many close relations could you really count on?(READ OUT – ONE ANSWER ONLY)
None………………………………………………………………………………………………. 1 (282)
1 or 2………………………………………………………………………………………………. 2
From 3 to 5………………………………………………………………………………………... 3
More than 5………………………………………………………………………………………. 4
DK…………………………………………………………………………………………………. 5
EB58.2 - NEW
Q. 48. How much concern do people show about what you are doing?(SHOW CARD - READ OUT - ONE ANSWER ONLY)
A lot of concern…………………………………………………………………………………….. 1 (283)
Some concern……………………………………………………………………………………… 2
Little concern……………………………………………………………………………………….. 3
No concern…………………………………………………………………………………………. 4
DK………………………..…………………………………………………………………………. 5
EB58.2 - NEW
Q. 49. How easy is it to get practical help from neighbours if you should need it?(SHOW CARD - READ OUT - ONE ANSWER ONLY)
Very easy………………………………………………………………………………………….1 (284)
Easy………………………………………………………………………………………………. 2
Difficult …………………………………………………………………………………………… 3
Very difficult ………………………………………………………………………………………4
DK………………………………………………………………………………………………….5
EB58.2 - NEW

THE MENTAL HEALTH STATUS OF THE EUROPEAN POPULATION
The European Opinion Research Group
April 2003
23
STANDARD EUROBAROMETER 58.2TECHNICAL SPECIFICATIONS
Between 28th October 2002 and 8th December 2002, the European Opinion Research Group, a consortium of Market and PublicOpinion Research agencies, made out of INRA in Belgium – I.C.O. and GfK Worldwide, carried out wave 58.2 of the standardEurobarometer, on request of the EUROPEAN COMMISSION, Directorate-General Press and Communication, Opinion Polls.
The Standard EUROBAROMETER 58.2 covers the population of the respective nationalities of the European Union Member States,aged 15 years and over, resident in each of the Member States. The basic sample design applied in all Member States is a multi-stage, random (probability) one. In each EU country, a number of sampling points was drawn with probability proportional topopulation size (for a total coverage of the country) and to population density.
For doing so, the points were drawn systematically from each of the "administrative regional units", after stratification by individual unitand type of area. They thus represent the whole territory of the Member States according to the EUROSTAT NUTS 2 (or equivalent)and according to the distribution of the resident population of the respective EU-nationalities in terms of metropolitan, urban and ruralareas. In each of the selected sampling points, a starting address was drawn, at random. Further addresses were selected as everyNth address by standard random route procedures, from the initial address. In each household, the respondent was drawn, at random.All interviews were face-to-face in people's home and in the appropriate national language.
COUNTRIES INSTITUTES N° INTERVIEWS FIELDWORK DATES POPULATION 15+ (x 000)Belgium INRA BELGIUM 1,110 4/11 – 28/11 8,326Denmark GfK DENMARK 1,000 6/11 – 6/12 4,338Germany (East) INRA DEUTSCHLAND 1,020 1/11 – 19/11 13,028Germany (West) INRA DEUTSCHLAND 1,022 1/11 – 20/11 55,782Greece MARKET ANALYSIS 1,003 31/10 – 30/11 8,793Spain INRA ESPAÑA 1,000 5/11 – 28/11 33,024France CSA-TMO 1,037 28/10 – 29/11 46,945Ireland LANSDOWNE Market Research 1,013 3/11 – 29/11 2,980Italy INRA Demoskopea 1,027 6/11 – 30/11 49,017Luxembourg ILRes 602 28/10 – 3/12 364The Netherlands INTOMART 1,035 1/11 – 2/12 12,705Austria SPECTRA 1,023 31/10 – 20/11 6,668Portugal METRIS 1,002 1/11 – 26/11 8,217Finland MDC MARKETING RESEARCH 1,024 6/11 – 8/12 4,165Sweden GfK SVERIGE 1,000 1/11 – 3/12 7,183Great Britain MARTIN HAMBLIN LTD 1,010 28/10 – 30/11 46,077Northern Ireland ULSTER MARKETING SURVEYS 302 30/10 – 29/11 1,273
TOTAL NUMBER OF INTERVIEWS 16,230
For each country a comparison between the sample and the universe was carried out. The Universe description was derived fromEurostat population data or from national statistics. For all EU member-countries a national weighting procedure, using marginal andintercellular weighting, was carried out based on this Universe description. As such in all countries, minimum gender, age, regionNUTS 2 were introduced in the iteration procedure. For international weighting (i.e. EU averages), INRA (EUROPE) applies the officialpopulation figures as provided by EUROSTAT in the Regional Statistics Yearbook (data for 1997). The total population figures forinput in this post-weighting procedure are listed above.
The results of the Eurobarometer studies are reported in the form of tables, datafiles and analyses. Per question a table of results isgiven with the full question text in English, French and German. The results are expressed as a percentage of the total. The results ofthe Eurobarometer surveys are analysed and made available through the Directorate-General Press and Communication, OpinionPolls of the European Commission, rue de la Loi 200, B-1049 Brussels. The results are published on the Internet server of theEuropean Commission: http://europa.eu.int/comm/dg10/epo. All Eurobarometer datafiles are stored at the Zentral Archiv (UniversitätKöln, Bachemer Strasse, 40, D-50869 Köln-Lindenthal), available through the CESSDA Databasehttp://www.nsd.uib.no/cessda/europe.html. They are at the disposal of all institutes members of the European Consortium for PoliticalResearch (Essex), of the Inter-University Consortium for Political and Social Research (Michigan) and of all those interested in socialscience research.
Readers are reminded that survey results are estimations, the accuracy of which, everything being equal, rests upon the sample sizeand upon the observed percentage. With samples of about 1,000 interviews, the real percentages vary within the following confidencelimits:
Observed percentages 10% or 90% 20% or 80% 30% or 70% 40% or 60% 50%
Confidence limits ± 1.9% ± 2.5% ± 2.7% ± 3.0% ± 3.1%

THE MENTAL HEALTH STATUS OF THE EUROPEAN POPULATION
The European Opinion Research Group
April 2003
24
STANDARD EUROBAROMETER 58.2CO-OPERATING AGENCIES AND RESEARCH EXECUTIVES
The European Opinion Research Group EEIGP.a. INRA (EUROPE) - European Coordination Office SA/NV
Christine KOTARAKOS159, avenue de la Couronne
B -1050 BRUSSELS – BELGIUMTel. ++/32 2 642 47 11 – Fax: ++/32 2 648 34 08
e-mail: [email protected]
BELGIQUE INRA BELGIUM Ms Verena MELAN tel. ++/32 2 642 47 11159, avenue de la Couronne [email protected] fax ++/32 2 648 34 08B-1050 BRUXELLES
DANMARK GfK DANMARK Mr Erik CHRISTIANSEN tel. ++/45 38 32 20 00Sylows Allé, 1 [email protected] fax ++/45 38 32 20 01DK-2000 FREDERIKSBERG
DEUTSCHLAND INRA DEUTSCHLAND Mr Christian HOLST tel. ++/49 4542 801 0Papenkamp, 2-6 [email protected] fax ++/49 4542 801 201D-23879 MÖLLN
ELLAS Market Analysis Mr. Spyros Camileris tel. ++/30 1 75 64 688190 Hymettus Street markanalysis@ fax. ++/30/1/70 19 355GR-11635 ATHENA marketanalysis.gr
ESPAÑA INRA ESPAÑA Ms Victoria MIQUEL tel. ++/34 91 7672199Avda de Burgos Nº 12, 8ª planta v.miquel@ fax ++/34 91 383425428036 Madrid consulting.ecoipsos.esSPAIN
FRANCE CSA-TMO Mr. Bruno JEANBART tel. ++/33 1 44 94 59 1030, rue Saint Augustin [email protected] fax ++/33 1 44 94 40 01F-75002 PARIS
IRELAND LANSDOWNE Market Research Mr Roger JUPP tel. ++/353 1 661 34 8349, St. Stephen’s Green [email protected] fax ++/353 1 661 34 79IRL-DUBLIN 2
ITALIA INRA Demoskopea Mrs Maria-Adelaïde SANTILLI tel. ++/39 06 85 37 521Via Salaria, 290 [email protected] fax ++/39 06 85 35 01 75I-00199 ROMA
LUXEMBOURG ILReS Mr Charles MARGUE tel. ++/352 49 92 9146, rue du Cimetière [email protected] fax ++/352 49 92 95 555L-1338 LUXEMBOURG
NEDERLAND Intomart Mr. Dré Koks tel. ++/31/35/625 84 11Noordse Bosje 13-15 [email protected] fax ++/31/35/625 84 33NL - 1201 DA HILVERSUM
AUSTRIA SPECTRA Ms Jitka NEUMANN tel. ++/43/732/6901Brucknerstrasse, 3-5/4 [email protected] fax ++/43/732/6901-4A-4020 LINZ
PORTUGAL MetrisGFK Ms Mafalda BRASIL tel. ++/351 210 000 200Rua Marquês da Fronteira, 8 – 1° Andar [email protected] fax ++/351 210 000 2901070 - 296 LISBOA
FINLAND MDC MARKETING RESEARCH Ltd Mrs Anu SIMULA tel. ++/358 9 613 500Itätuulenkuja 10 A [email protected] fax ++/358 9 613 50 423FIN-02100 ESPOO
SWEDEN GfK SVERIGE Mr Rikard EKDAHL tel. ++/46 46 18 16 00S:t Lars väg 46 [email protected] fax ++/46 46 18 16 11S-221 00 LUND
GREAT BRITAIN MARTIN HAMBLIN LTD Mr. Ross Williams tel. ++/44 207 222 81 81Mulberry House, Smith Square 36 ross.williams@ fax ++/44 207 396 90 46UK-London Swip 3HL martinhamblin.co.uk