Embed Size (px)
Citation preview
SOUTHERN CALIFORNIA CHAPTERHEALTHCARE FINANCIAL MANAGEMENT
ASSOCIATION
THE MEDICARE WAGE INDEXBy
Dale BakerBaker Healthcare Consulting, Inc.
November 12, 2009

TOPICS
The Basics2010 Wage Indexes Unique Aspects of California Wage IndexesState by State Rural Floor Budget NeutralityHot TopicsThe Future of the Wage Index

3
THE BASICS

4

5
Cost Reporting Data Used For Wage Indexes By Year
• Data for FFY 2007 (cost reporting periods beginning October 1, 2006 through September 29, 2007) will be used for FFY 2011 wage index computation.
• For short periods beginning October 1, 2006 through September 29, 2007, CMS uses the longest period, or if two periods are the same length, the most recent period. CMS annualizes short period data.
6
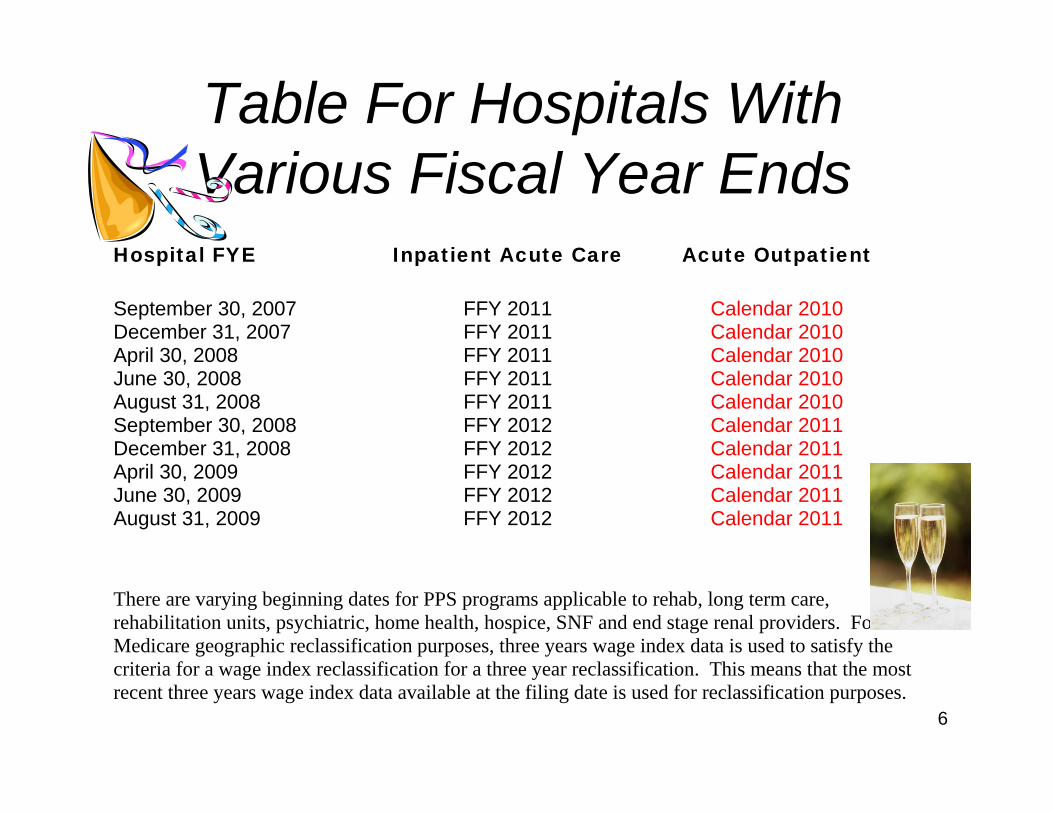
Hospital FYE Inpatient Acute Care Acute Outpatient
September 30, 2007 FFY 2011 Calendar 2010 December 31, 2007 FFY 2011 Calendar 2010 April 30, 2008 FFY 2011 Calendar 2010 June 30, 2008 FFY 2011 Calendar 2010 August 31, 2008 FFY 2011 Calendar 2010 September 30, 2008 FFY 2012 Calendar 2011 December 31, 2008 FFY 2012 Calendar 2011 April 30, 2009 FFY 2012 Calendar 2011 June 30, 2009 FFY 2012 Calendar 2011 August 31, 2009 FFY 2012 Calendar 2011 There are varying beginning dates for PPS programs applicable to rehab, long term care, rehabilitation units, psychiatric, home health, hospice, SNF and end stage renal providers. For Medicare geographic reclassification purposes, three years wage index data is used to satisfy the criteria for a wage index reclassification for a three year reclassification. This means that the most recent three years wage index data available at the filing date is used for reclassification purposes.
Table For Hospitals With Various Fiscal Year Ends
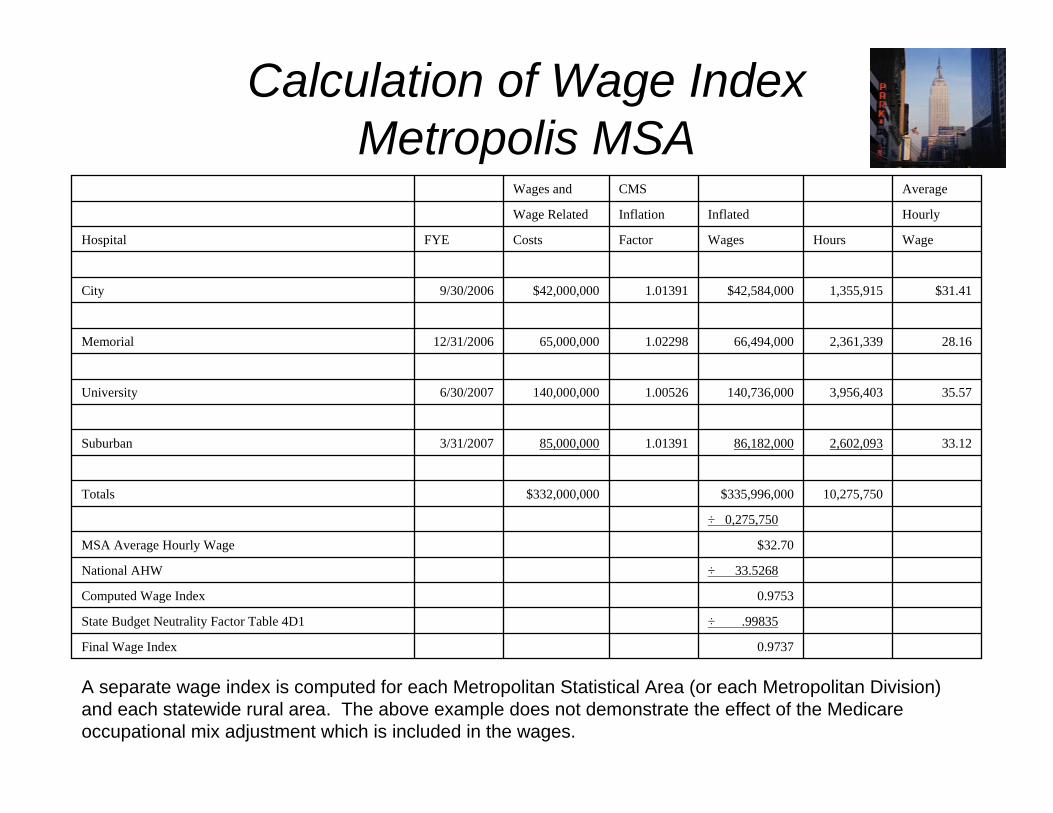
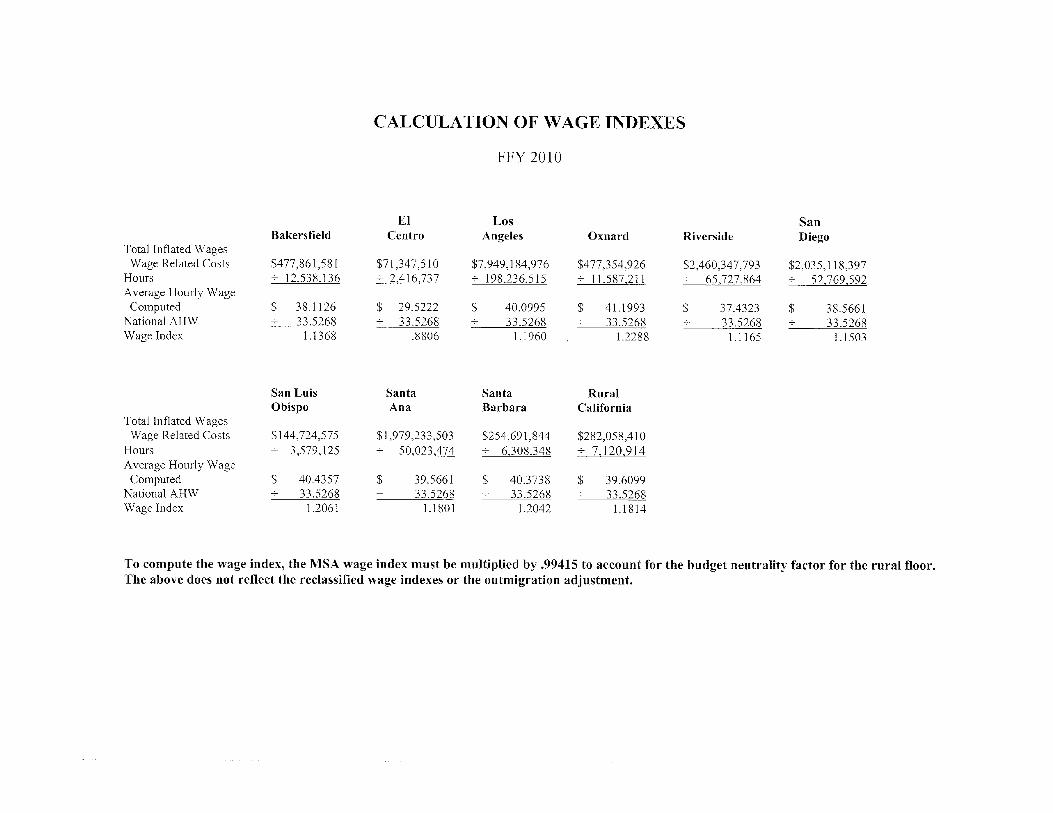
Calculation of Wage IndexMetropolis MSA
A separate wage index is computed for each Metropolitan Statistical Area (or each Metropolitan Division) and each statewide rural area. The above example does not demonstrate the effect of the Medicare occupational mix adjustment which is included in the wages.
0.9737Final Wage Index
÷ .99835State Budget Neutrality Factor Table 4D1
0.9753Computed Wage Index
÷ 33.5268National AHW
$32.70 MSA Average Hourly Wage
÷ 0,275,750
10,275,750$335,996,000 $332,000,000 Totals
33.122,602,09386,182,0001.0139185,000,0003/31/2007Suburban
35.573,956,403140,736,0001.00526140,000,0006/30/2007University
28.162,361,33966,494,0001.0229865,000,00012/31/2006Memorial
$31.41 1,355,915$42,584,000 1.01391$42,000,000 9/30/2006City
WageHoursWagesFactorCostsFYEHospital
HourlyInflatedInflationWage Related
AverageCMSWages and
8
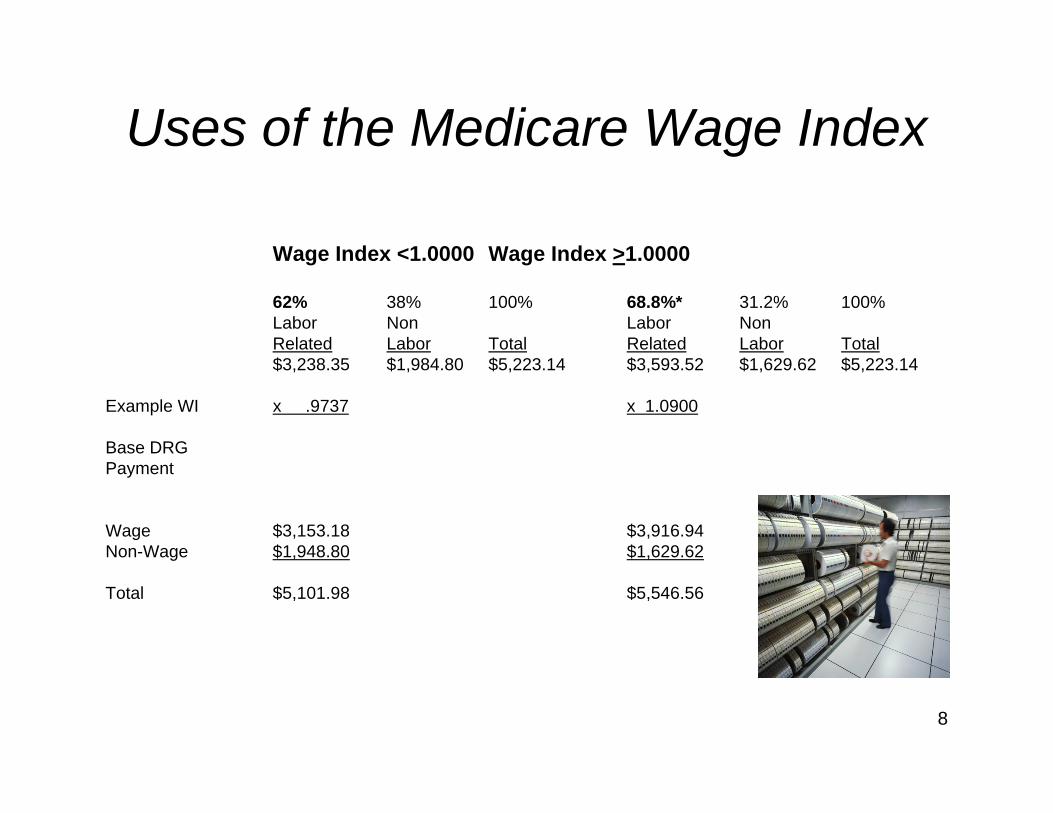
Uses of the Medicare Wage Index
Wage Index <1.0000 Wage Index >1.0000
62% 38% 100% 68.8%* 31.2% 100%Labor Non Labor NonRelated Labor Total Related Labor Total$3,238.35 $1,984.80 $5,223.14 $3,593.52 $1,629.62 $5,223.14
Example WI x .9737 x 1.0900
Base DRGPayment
Wage $3,153.18 $3,916.94Non-Wage $1,948.80 $1,629.62
Total $5,101.98 $5,546.56
9
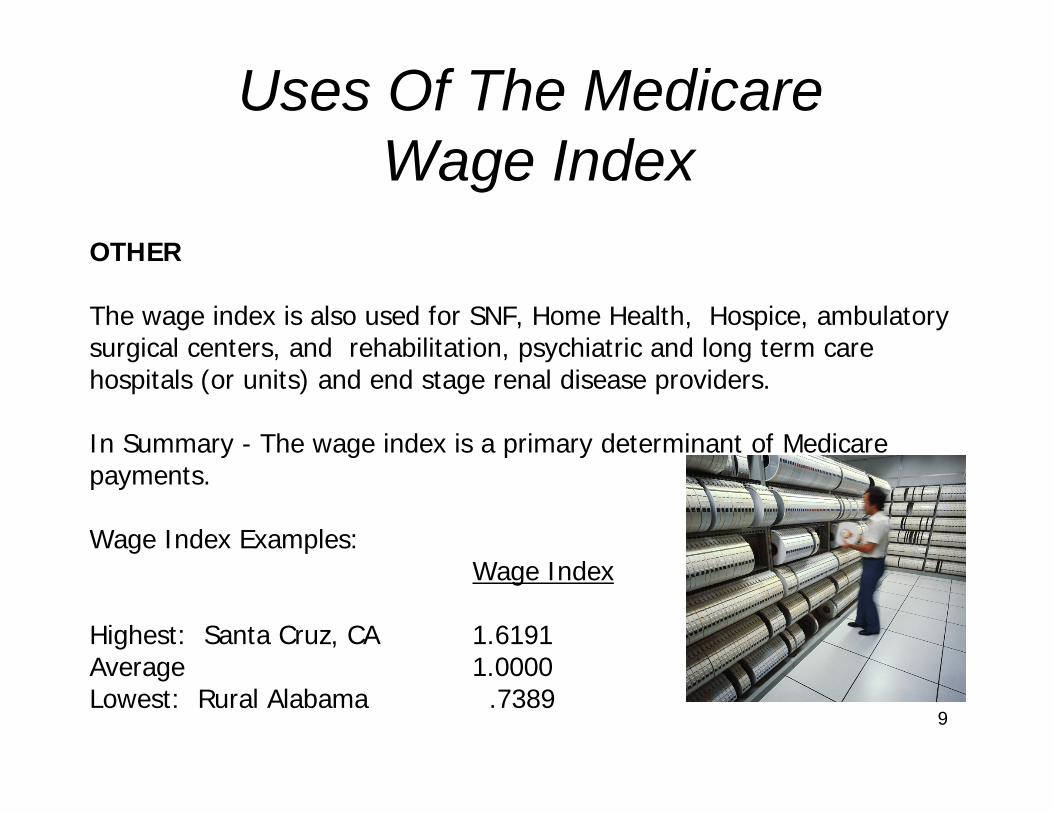
Uses Of The MedicareWage Index
OTHER
The wage index is also used for SNF, Home Health, Hospice, ambulatory surgical centers, and rehabilitation, psychiatric and long term care hospitals (or units) and end stage renal disease providers.
In Summary - The wage index is a primary determinant of Medicare payments.
Wage Index Examples:Wage Index
Highest: Santa Cruz, CA 1.6191Average 1.0000Lowest: Rural Alabama .7389
10
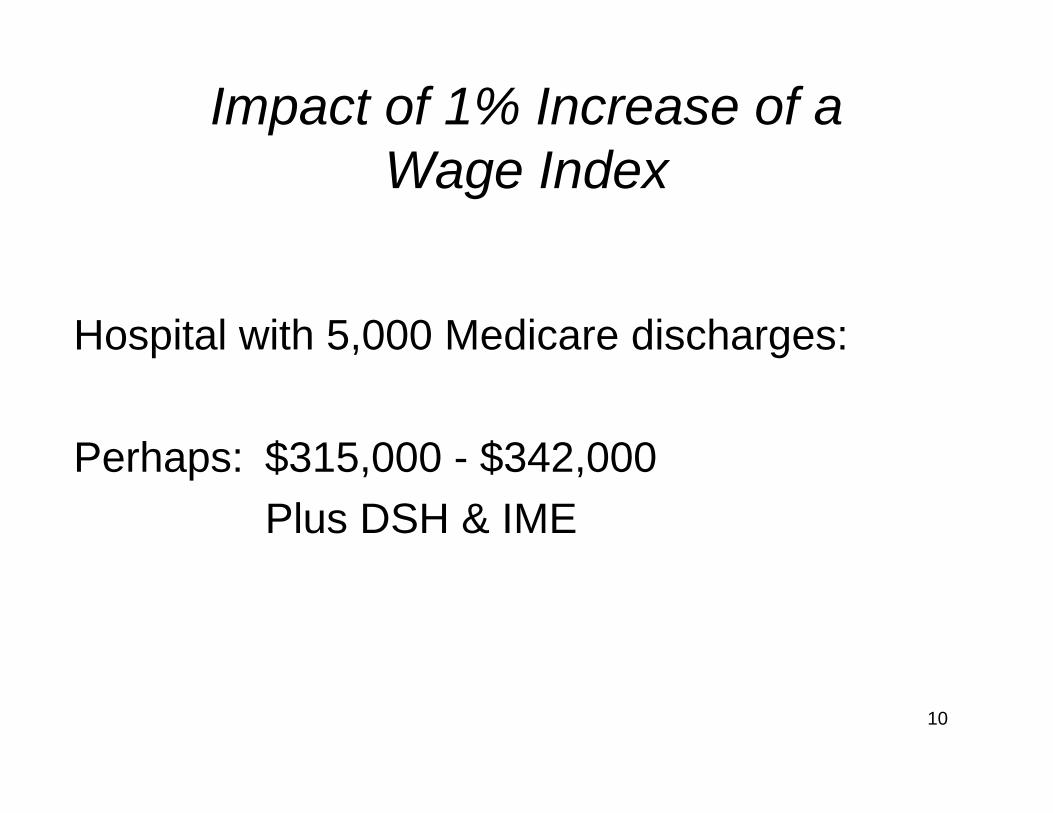
Impact of 1% Increase of a Wage Index
Hospital with 5,000 Medicare discharges:
Perhaps: $315,000 - $342,000 Plus DSH & IME
11
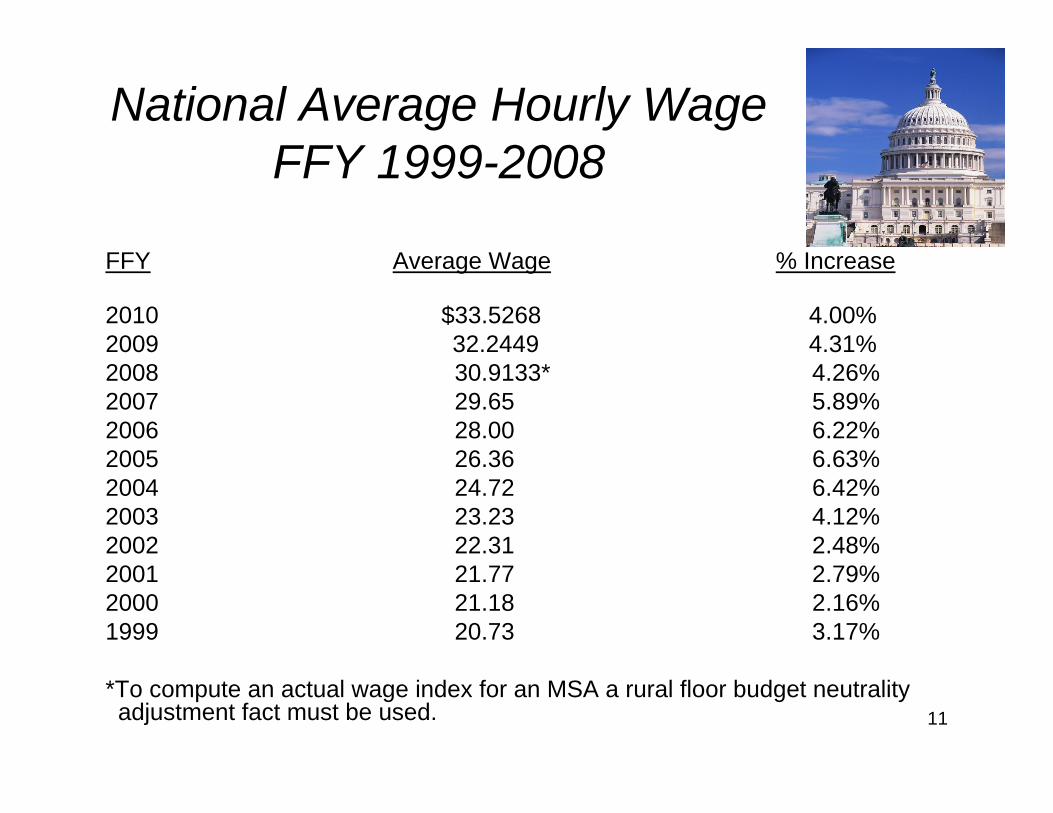
National Average Hourly WageFFY 1999-2008
FFY Average Wage % Increase
2010 $33.5268 4.00%2009 32.2449 4.31%2008 30.9133* 4.26%2007 29.65 5.89%2006 28.00 6.22%2005 26.36 6.63%2004 24.72 6.42%2003 23.23 4.12%2002 22.31 2.48%2001 21.77 2.79%2000 21.18 2.16%1999 20.73 3.17%
*To compute an actual wage index for an MSA a rural floor budget neutrality adjustment fact must be used.


Selected Large City 2010 Wage Indexes
(9) Anchorage, AK 1.1920(8) Boston, MA 1.2293(7) Bridgeport, CT 1.2592(13) Chicago, IL 1.0385(11) Las Vegas, NV 1.1812(10) Los Angeles, CA 1.1890(12) Minneapolis, MN 1.0945(6) Nassau-Suffolk, NY 1.2718(5) New York City, NY 1.3190(2) Oakland, CA 1.5857(4) Sacramento, CA 1.3594(3) San Francisco 1.5454(1) San Jose 1.6059
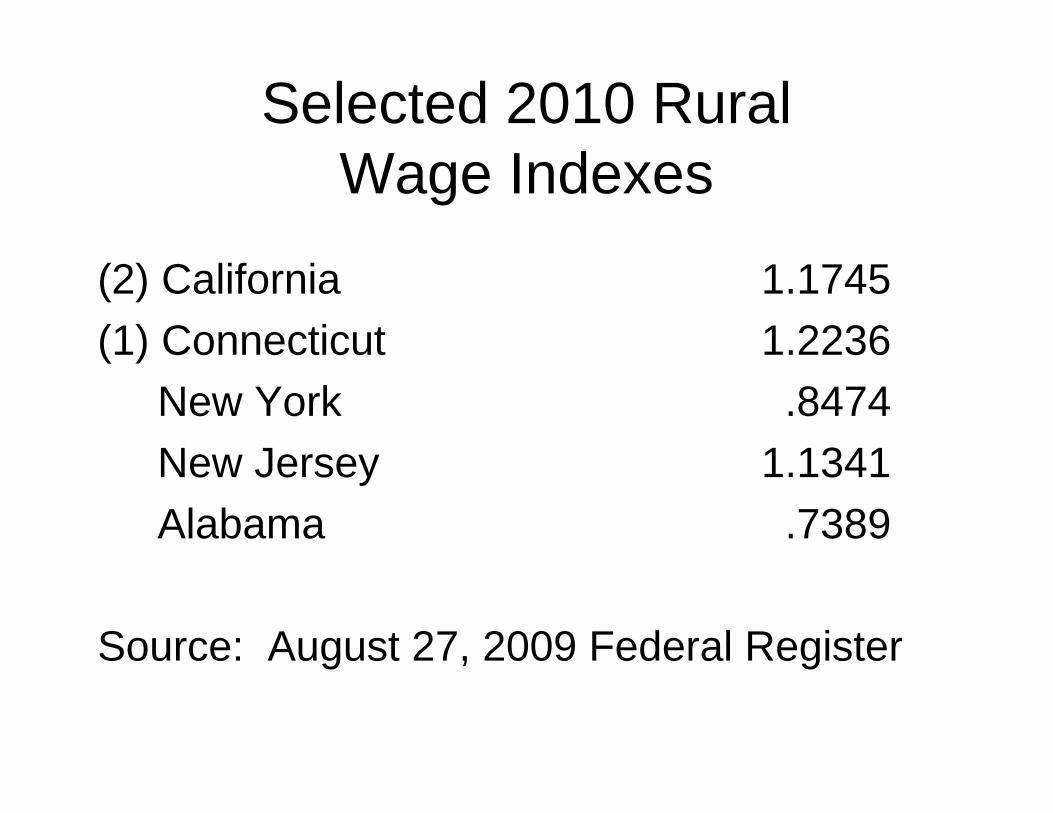
Selected 2010 Rural Wage Indexes
(2) California 1.1745(1) Connecticut 1.2236
New York .8474New Jersey 1.1341Alabama .7389
Source: August 27, 2009 Federal Register

What is unique about California wage index?
• Highest wage indexes in the country.1-3 San Francisco Bay Area (1.6191-1.5454)4 Sacramento 1.35948 Los Angeles 1.1890
• 2nd highest rural floor in the country.

What is unique about California wage index?
• Rural Floor used by the following MSAs:BakersfieldChicoEl CentroFresnoHanford-CorcoranRiverside-San Bernardino-OntarioSan Diego-Carlsbad-San MarcosSanta Anna-Anaheim-IrvineVisalia-Porterville Yuba City
• Approximately 110 hospitals use the rural floor set by 16 hospitals.


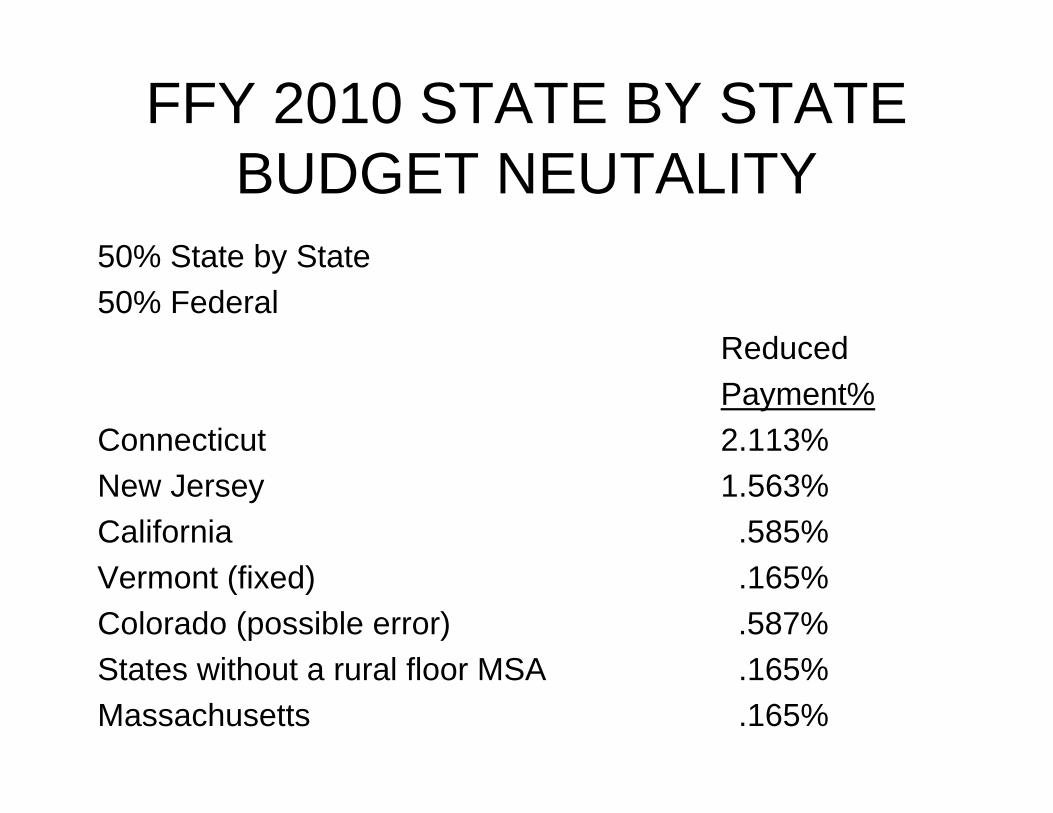
FFY 2010 STATE BY STATE BUDGET NEUTALITY
50% State by State50% Federal
ReducedPayment%
Connecticut 2.113%New Jersey 1.563%California .585%Vermont (fixed) .165%Colorado (possible error) .587%States without a rural floor MSA .165%Massachusetts .165%

Why did CMS change regulations?
MassachusettsNantucket Cottage Hospital (Nantucket Island)Purchased by a Boston systemConverted from CAH to IPPS4 year lag in dataWill set rural floor to be used by all Massachusetts hospitals.CMS (4/30/08 Federal Register) "We estimated that payments in the State would increase more than $200 million in a single year".Return to National Budget Neutrality is in Senate Health Reform Bill (no known opposition).
22
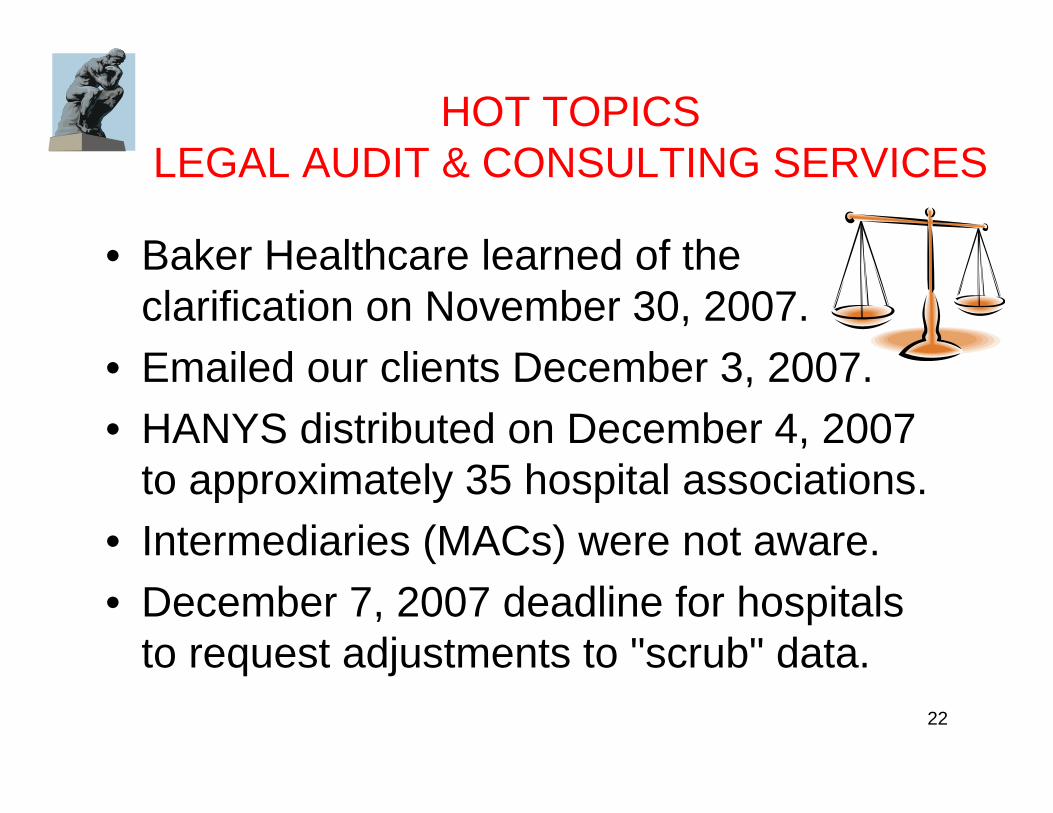
HOT TOPICSLEGAL AUDIT & CONSULTING SERVICES
• Baker Healthcare learned of the clarification on November 30, 2007.
• Emailed our clients December 3, 2007.• HANYS distributed on December 4, 2007
to approximately 35 hospital associations.• Intermediaries (MACs) were not aware. • December 7, 2007 deadline for hospitals
to request adjustments to "scrub" data.

23
HOT TOPICSLEGAL AUDIT & CONSULTING SERVICES
• What is included?
“Any contract service included on Worksheet A, line 6, column 2. Contract information service, legal services, tax preparation services, and cost report preparation services are examples of contract labor costs includable on line 22.01”.
24
HOT TOPICSLEGAL AUDIT & CONSULTING SERVICES
• CMS also clarified that on line 9.03 Personnel Costs for Contract Management and Administrative Services include such positions as “Director of Pediatrics, Laboratory Services, Administrator, Blood Bank Manager, Administrative Assistant in the Department of Cardiology, SICU Ward Clerk, and Medical Secretary in the Obstetrics Department.”
• CMS has broadly defined what is includable.

25
HOT TOPICSLEGAL AUDIT & CONSULTING SERVICES
• Scour "purchased services" for high hourly amounts that are includable.
• How about medical record coding engagements?
– Employment agency fees– Executive recruiter fees
• Get creative!!
26
HOT TOPICSLEGAL AUDIT & CONSULTING SERVICES
Now – the dark side:
Revision 20 to the PRM (August 2009) in the instructions to line 22.01 (contract A&G).
"Do not include on line 22.01 any costs for contract labor home office personnel (these costs are not currently included in the wage index".


28
HOT TOPICSLEGAL AUDIT & CONSULTING
SERVICES (cont.)This instruction does not apply to line 11 (home office
costs). It is possible that such legal, audit actuarial and consulting, as well as hospital CEO and CFO salaries Paid by the home office are includable on line 11.
We are seeking assistance from the Federation of American Hospitals and the AHA.
Some hospital associations contemplate "going political".
Good public policy demands an appropriate CMS response.
29
HOT TOPICSLEGAL AUDIT & CONSULTING
SERVICES
Aggressive PositionHours and Rates right off the invoices.
Precedent – Agency NursesNot in accordance with CMS' instructions
(for Agency Nurses or for other)Back-up Position
Only wages and hours applicable to engagement.
30
OTHER CHANGESCMS manualizes policy to exclude hours, wage
related costs and salaries of capitalized salaries.Un-accrued PTO hours at year end are to be
recognized on the "cash basis" – when paid in the subsequent year.
Some hospitals had excluded these hours in subsequent year.
CMS claims better matching (paid vacation hours of prior year are consistent year to year.
Fully accrued hours should be fine and includable.But are very rare in hospital system.
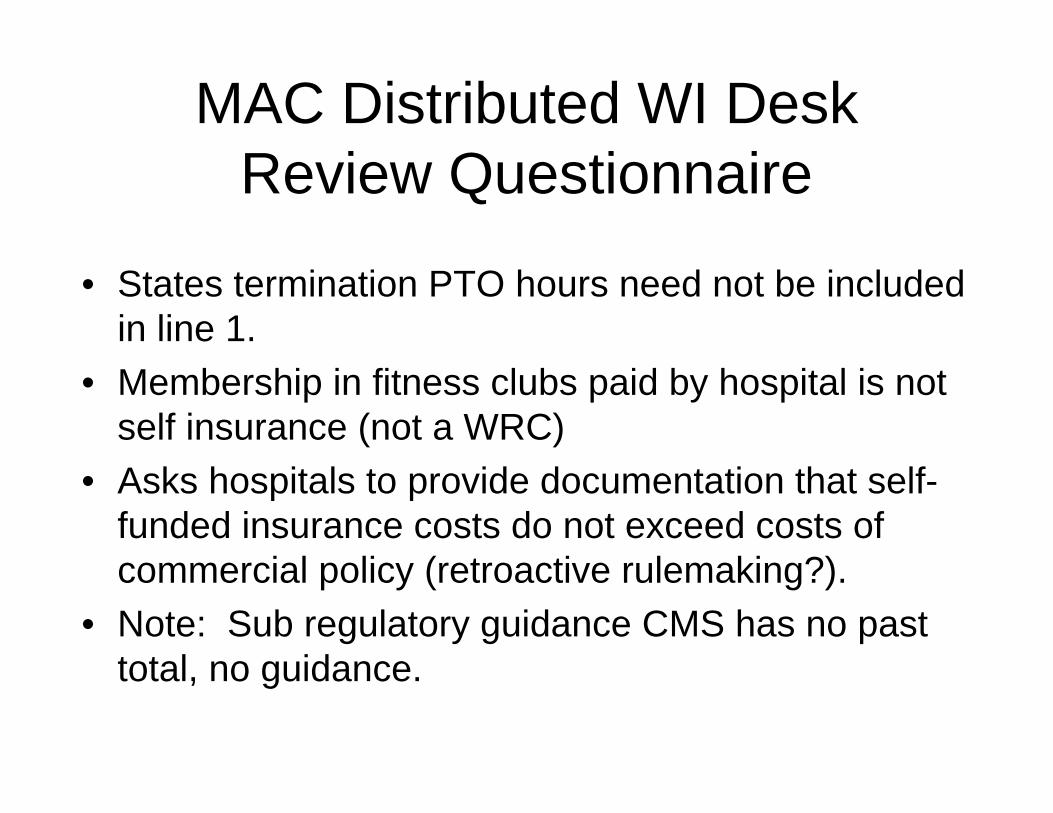
MAC Distributed WI Desk Review Questionnaire
• States termination PTO hours need not be included in line 1.
• Membership in fitness clubs paid by hospital is not self insurance (not a WRC)
• Asks hospitals to provide documentation that self-funded insurance costs do not exceed costs of commercial policy (retroactive rulemaking?).
• Note: Sub regulatory guidance CMS has no past total, no guidance.
32
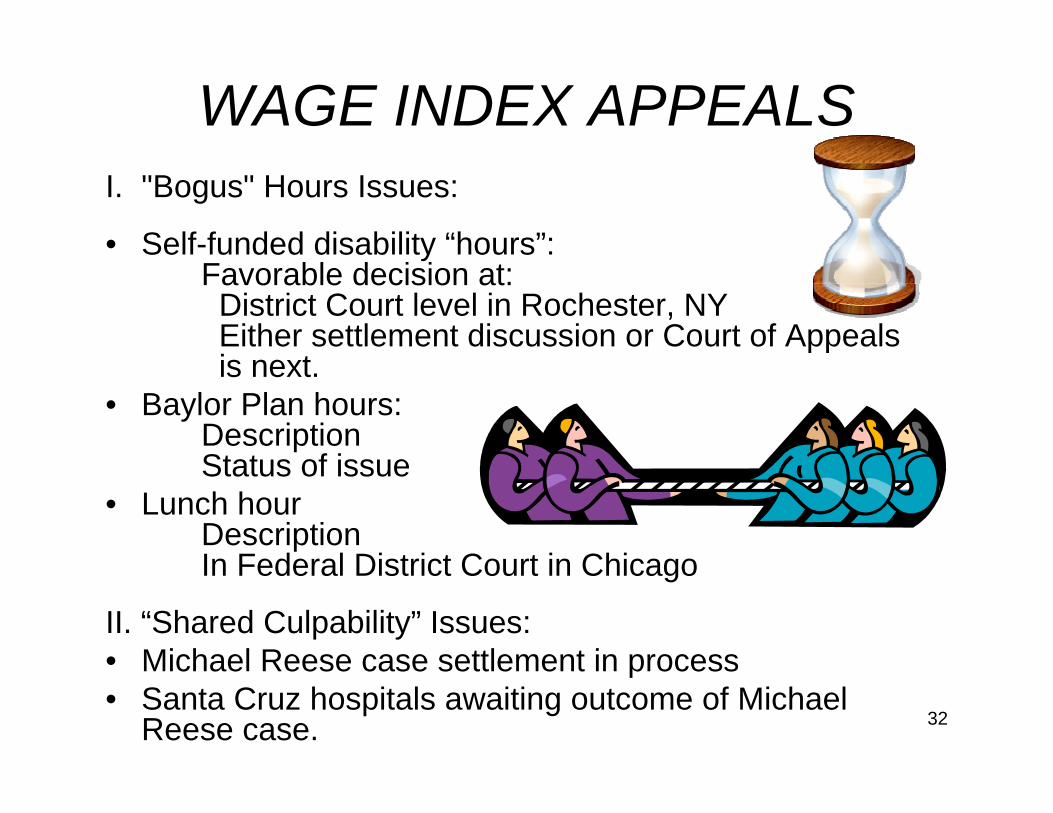
WAGE INDEX APPEALSI. "Bogus" Hours Issues:
• Self-funded disability “hours”:Favorable decision at:District Court level in Rochester, NYEither settlement discussion or Court of Appealsis next.
• Baylor Plan hours:DescriptionStatus of issue
• Lunch hourDescriptionIn Federal District Court in Chicago
II. “Shared Culpability” Issues:• Michael Reese case settlement in process• Santa Cruz hospitals awaiting outcome of Michael
Reese case.
33
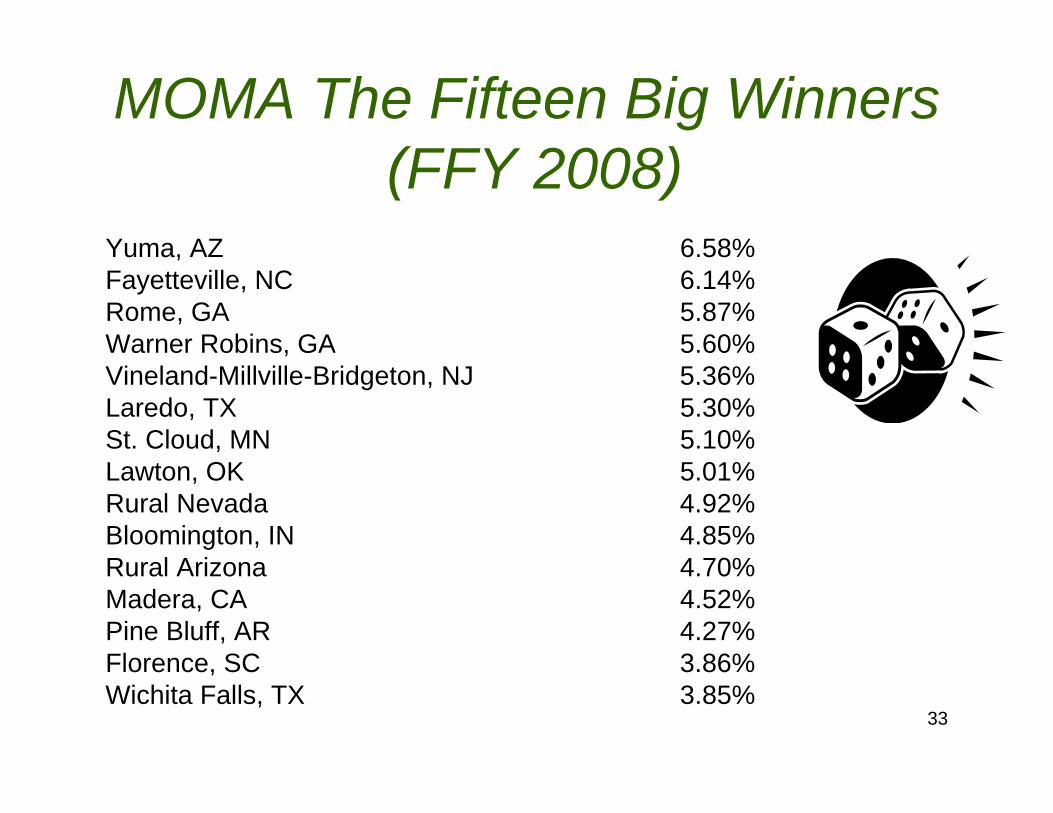
MOMA The Fifteen Big Winners(FFY 2008)
Yuma, AZ 6.58%Fayetteville, NC 6.14%Rome, GA 5.87%Warner Robins, GA 5.60%Vineland-Millville-Bridgeton, NJ 5.36%Laredo, TX 5.30%St. Cloud, MN 5.10%Lawton, OK 5.01%Rural Nevada 4.92%Bloomington, IN 4.85%Rural Arizona 4.70%Madera, CA 4.52%Pine Bluff, AR 4.27%Florence, SC 3.86%Wichita Falls, TX 3.85%

34
MOMA The Fifteen Biggest Rural Winners (FFY 2008)
Nevada 4.92%Arizona 4.70%Louisiana 3.16%Texas 3.16%Georgia 2.92%Oklahoma 2.91%Missouri 2.54%Virginia 2.31%Tennessee 2.12%Arkansas 2.12%North Dakota 2.03%West Virginia 1.80%Florida 1.65%Utah 1.49%Hawaii 1.48%
35
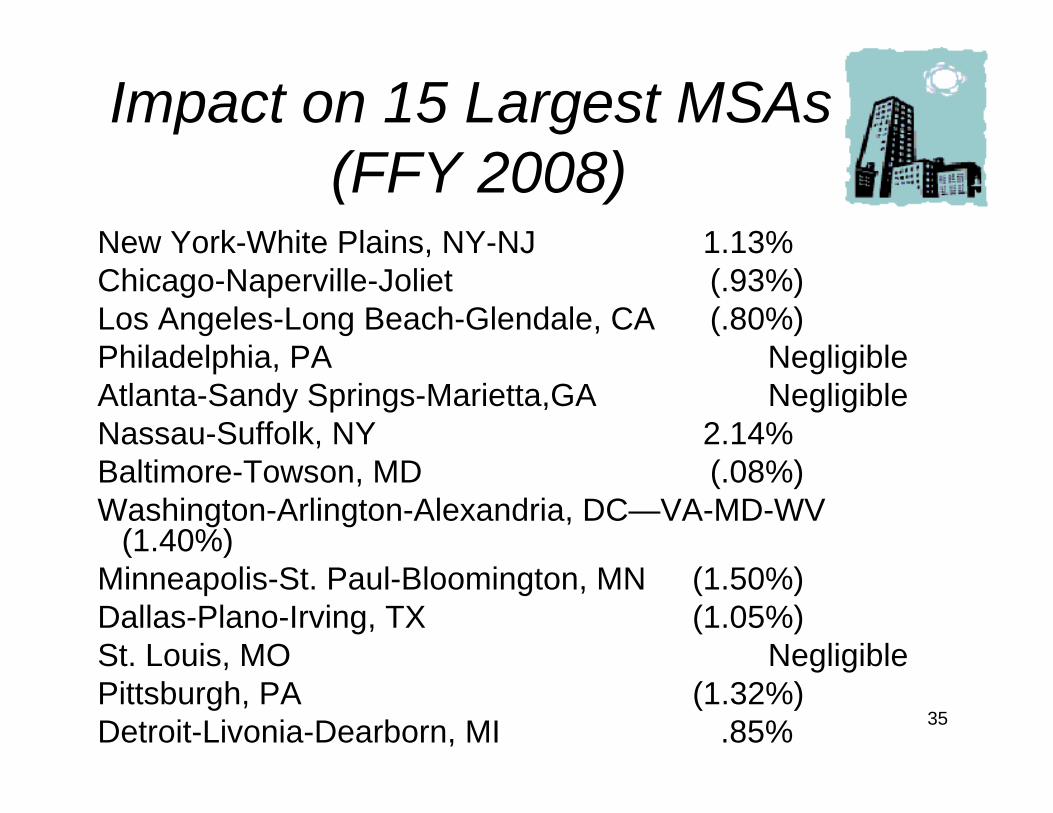
Impact on 15 Largest MSAs(FFY 2008)
New York-White Plains, NY-NJ 1.13%Chicago-Naperville-Joliet (.93%)Los Angeles-Long Beach-Glendale, CA (.80%)Philadelphia, PA NegligibleAtlanta-Sandy Springs-Marietta,GA NegligibleNassau-Suffolk, NY 2.14%Baltimore-Towson, MD (.08%)Washington-Arlington-Alexandria, DC—VA-MD-WV
(1.40%)Minneapolis-St. Paul-Bloomington, MN (1.50%)Dallas-Plano-Irving, TX (1.05%)St. Louis, MO NegligiblePittsburgh, PA (1.32%)Detroit-Livonia-Dearborn, MI .85%
36
MOMA BASICSBest to worst line items
1. Nursing aides, orderlies & assistants2. Medical assistants3. LPNs and surgical technologies4. RNs (includes management personnel
separately reported in prior survey)
“All other” is a neutral but generally desirablecategory.

37
Simplified Areas to Review Submissions
• Nursing Administration – Most RNS that are "performing solely administrative functions would be included in the all other occupations category.
• Advanced practice nurses billing under Part B should be excluded from the survey.
• Review RNs on nursing floors that are solely administrative, education oriented or are entirely managerial.
• Carefully review the instructions under All Other Occupations "for nurses that do not directly supervise staff nurses who provide patient care and do not provide direct patient care themselves".
• Also – review instructions related to multi-functional employees.• Graduate Nurses pending licensure should be in Nursing Aides, etc.
38
Nursing Aides, Orderlies & Attendants
• You may reclassify individuals into this category that are recorded in other categories on the general ledger.Example:
Transporters "who move patients".Housekeepers "who change linens".Telemetry TechsLift TeamsDoulasSitters
• Instructions indicate that ward clerks or unit secretaries must be excluded from nursing aides….
• Workers must be "under direction of nursing staff".• Direct and indirect direction should satisfy requirement.
39
BAKER HEALTHCARE CONSULTING WEBSITE
Baker Healthcare Consulting, Inc. website –Baker-Healthcare.com
Download the following tools:


42
THE FUTURE OF THE WAGE INDEX

43
Tax Relief & Health Care Act of 2006
Signed into law December 20, 2006 by
Lame Duck CongressSection 106
Required MedPAC to issue a report by June 30, 2007 including “alternatives the Commission recommends to the method to compute the wage index.
Provides $2 million funding for the study
and
44
Tax Relief & Health Care Act of 2006(TRISHA)
Requires the Secretary of HHS to issue for FFY 2009 one or more proposals taking into account the MedPAC report in the IPPS proposed rule due to be published in April 2008. CMS/HHS shall consider:
• Problems defining labor markets.• Modify/eliminate geographic reclassification.• Possibly use BLS data.• Minimizing variations between and within MSAs and statewide rural areas.• Applying components to other care settings (home health, SNF, etc.)• Minimize volatility while maintaining budget neutrality.• Regional effects and effects on providers.• Implementation phase in.• Issues related to occupational mix and effect on quality of care and patient
safety.
45
46
47
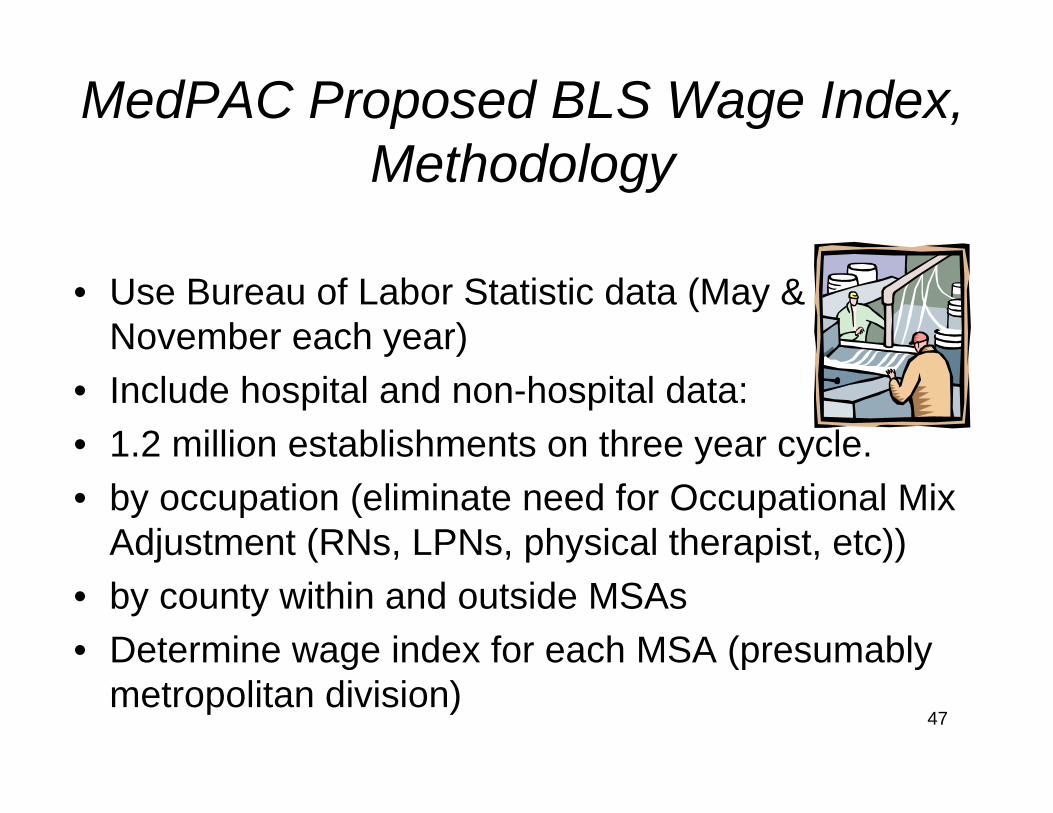
MedPAC Proposed BLS Wage Index, Methodology
• Use Bureau of Labor Statistic data (May & November each year)
• Include hospital and non-hospital data:• 1.2 million establishments on three year cycle.• by occupation (eliminate need for Occupational Mix
Adjustment (RNs, LPNs, physical therapist, etc))• by county within and outside MSAs• Determine wage index for each MSA (presumably
metropolitan division)
48
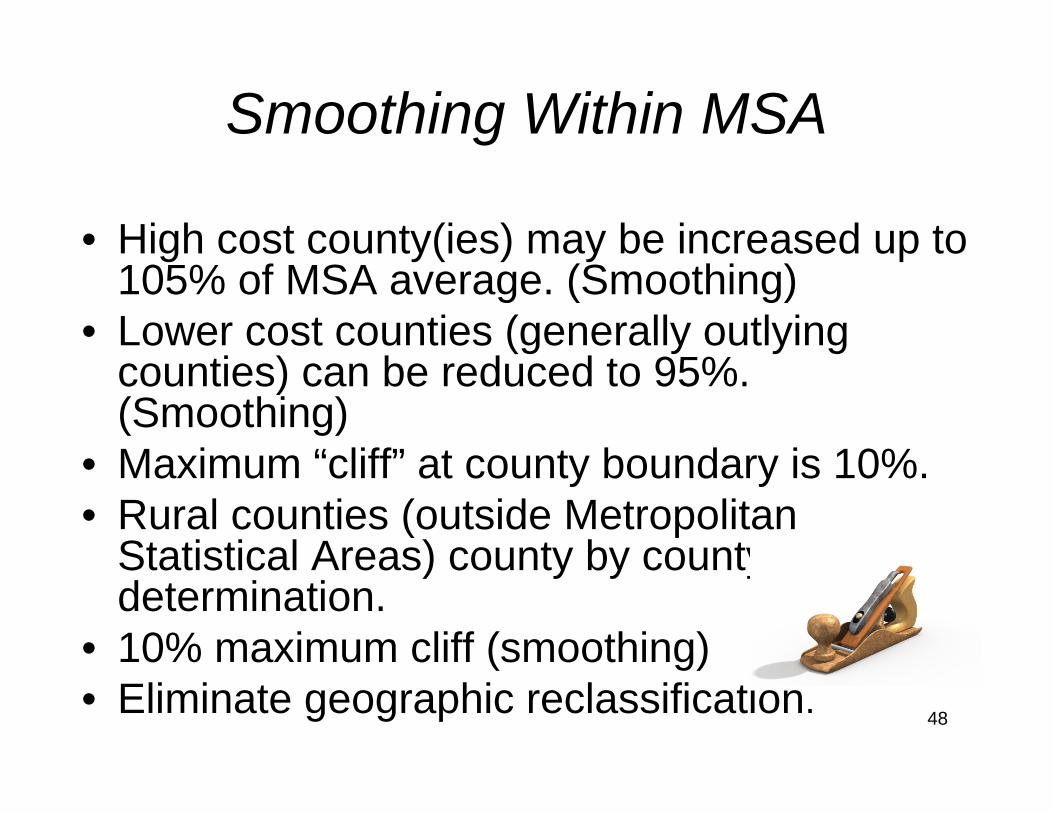
Smoothing Within MSA
• High cost county(ies) may be increased up to 105% of MSA average. (Smoothing)
• Lower cost counties (generally outlying counties) can be reduced to 95%. (Smoothing)
• Maximum “cliff” at county boundary is 10%.• Rural counties (outside Metropolitan
Statistical Areas) county by county determination.
• 10% maximum cliff (smoothing)• Eliminate geographic reclassification.
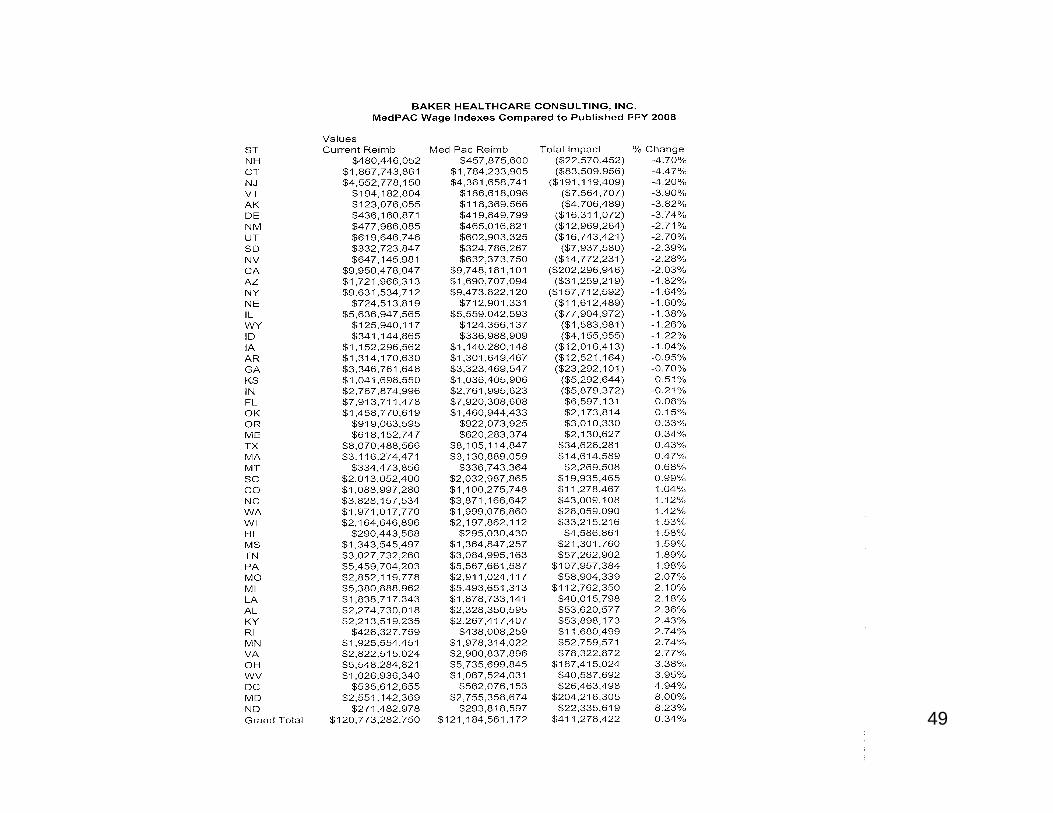
49
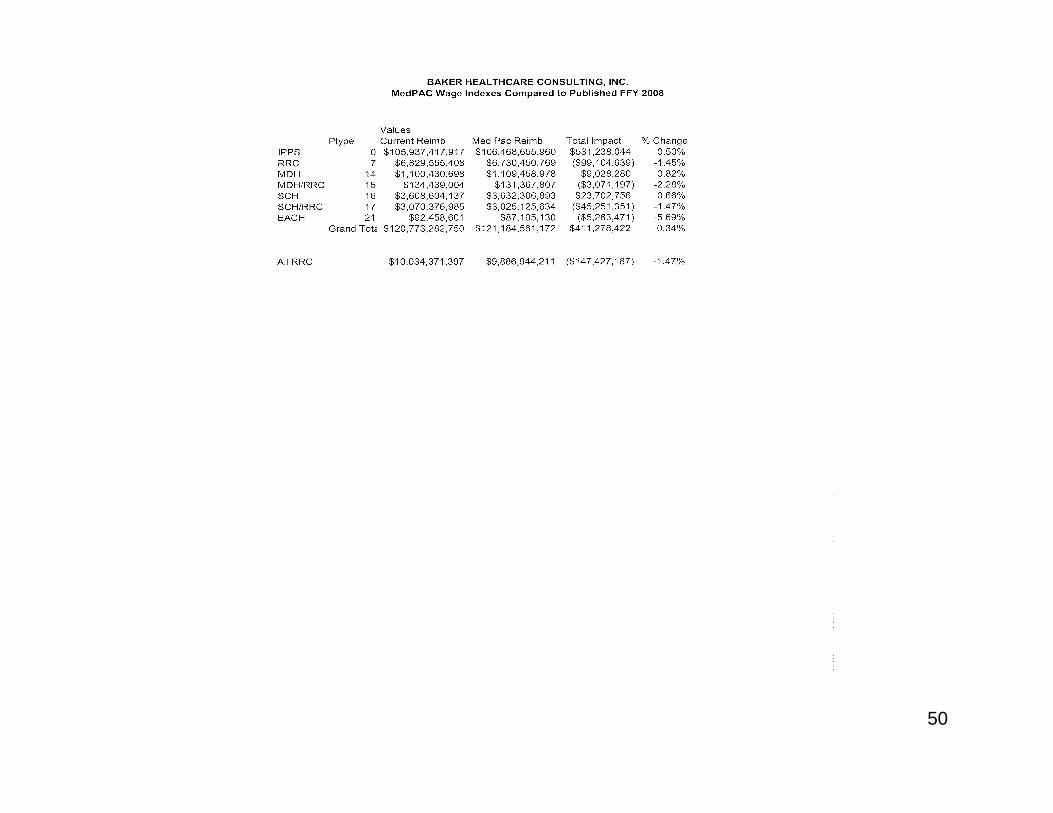
50

51
What’s wrong with the MedPAC proposal?
• Today’s wage index:Mandatory system virtually all IPPS hospitals participate.Full Year historical hospital data “scrubbed” by hospitals with 100% desk review by FIs (MACs).
• MedPAC proposal:Wage indexes subjectively modified by “smoothing”Cliffs could be 8%, 10% or 12%affecting payment by billions of dollars

52
What’s wrong with the MedPAC proposal?
Accuracy Issues
• Today’s wage index:
Single data source (S-3) sorted based on Census/OMB designated MSAs (statewide rural areas reconciled to cost reports). Wages, fringes and hours are consistent.
• MedPAC proposal:Sample data (two payroll periods May and November)Participation by employers is voluntary and confidential.BLS may secretly impute data for non-responsive employers, CMS would not know.
• MedPAC notes that data is not as accurate as current data and that it understates the highest wage indexes (San Francisco Bay Area andNYC, for example).
53
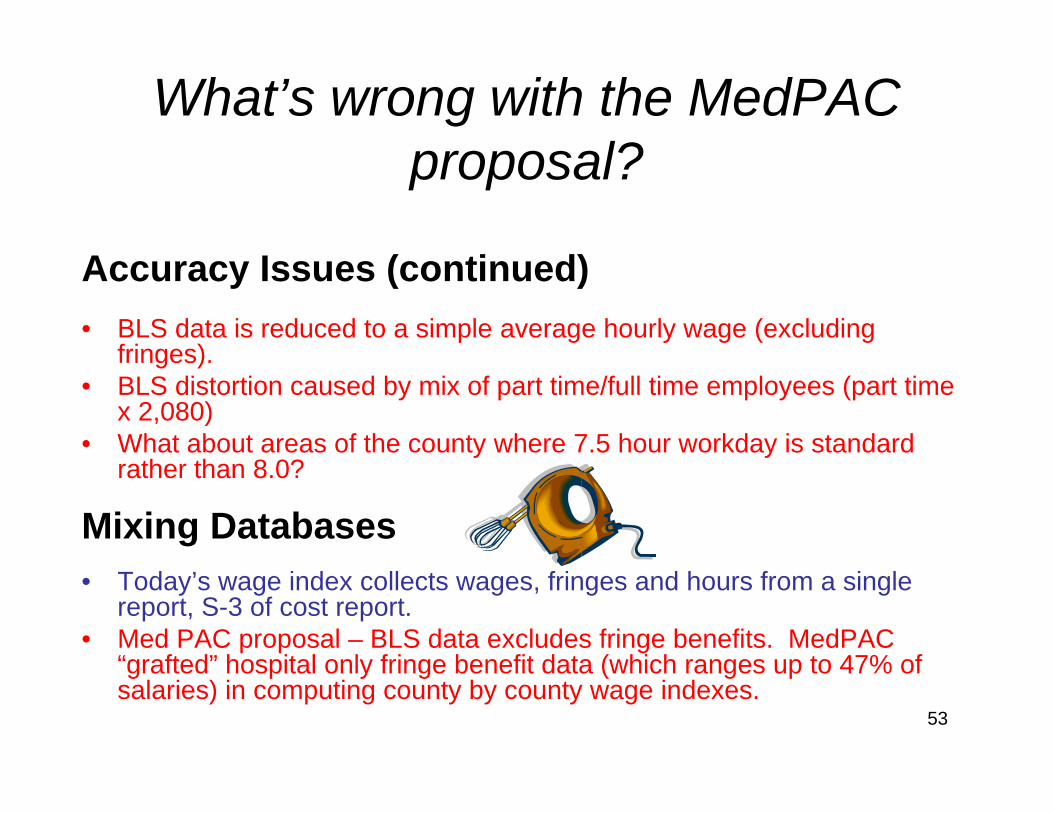
What’s wrong with the MedPAC proposal?
Accuracy Issues (continued)• BLS data is reduced to a simple average hourly wage (excluding
fringes).• BLS distortion caused by mix of part time/full time employees (part time
x 2,080)• What about areas of the county where 7.5 hour workday is standard
rather than 8.0?
Mixing Databases• Today’s wage index collects wages, fringes and hours from a single
report, S-3 of cost report.• Med PAC proposal – BLS data excludes fringe benefits. MedPAC
“grafted” hospital only fringe benefit data (which ranges up to 47% of salaries) in computing county by county wage indexes.
54
What’s wrong with the MedPAC proposal?
Transparency• Today’s wage index – detailed S-3 data published in Public
Use Files in October, February and May. Available earlier on cost report publicly available data. CMS indicates a “final file” will be available in future years. Data is very transparent.
• MedPAC proposal – Voluntary confidential data no transparency to CMS or the public
• Imputed data is secret.

55
Possible Manipulation of Data
• Today’s wage index:
This would be fraud or abuse and unlawful.
• MedPAC proposal:
Incentives for low cost employers to not participate SNFs, physician offices, etc.
Probably legal since it is a voluntary system.

56
Lack of Comparability
• MedPAC proposal:Includes CAHs with low wages (distortion of rural wage indexes in counties with both IPPS and CAH hospitals).BLS does not pick up salaried physician Part A services.BLS does not pick up contract physician Part A services (required by law in California and possibly Texas).BLS pick up agency nursing and other contract services in the county where the agency is located rather than the hospital county.Agency nurses amount paid to nurses, not amounts paid per hour worked by the hospital.

57
Acumen, LLCAwarded a Task Order
Where?Burlingame California (SFO Airport)
Who? Stanford University "Scholars"
Management Team: Thomas MaCurdy – Professor ofEconomicsMargaret (Peggy) O'Brien-Starn – Gardner Center of StanfordJonathan Wilwerding – Research Fellow atStanford Institute for Economic PolicyResearch

58
Acumen LLC
TasksTwo General Tasks
1. Impact Analysis comparing MedPAC recommended wage index with CMSwage indexes.
2. Provide Analysis and research that assistsCMS in developing a proposal(s)addressing the nine points TRISHArequired.
Accumen has completed Task 1.See: http://www.acumenllc.com/reports/cms
and http://www.acumenllc.com/reports/cms/ImpactAnalysis2009_AppendixA.htm

59
Acumen LLC Findings
MedPAC wage indexes (county level) compared to:1. CMS' pre-reclassification, no floor wage index 2008.2. CMS' post-reclassified (final) wage index for 2008.ALSO: Acumen compared the two CMS wage indexes with the
MedPAC hospital compensation index (which includes fringe benefits from Worksheet A).
BHC is focusing on MedPAC hospital compensation index compared to CMS' Post Reclassification (final wage index)
Acumen included 3426 hospitals and 1595 counties. Their analysis is both hospital specific and countywide. Individual hospitals also sorted on urban/rural, bed size, geographic region, teaching status, DSH, SCH, RRC, MDH ownership (government, investor owned, voluntary).
Acumen removed the effects of Section 505 (Out-migration) and Section 508 Adjustments.
60
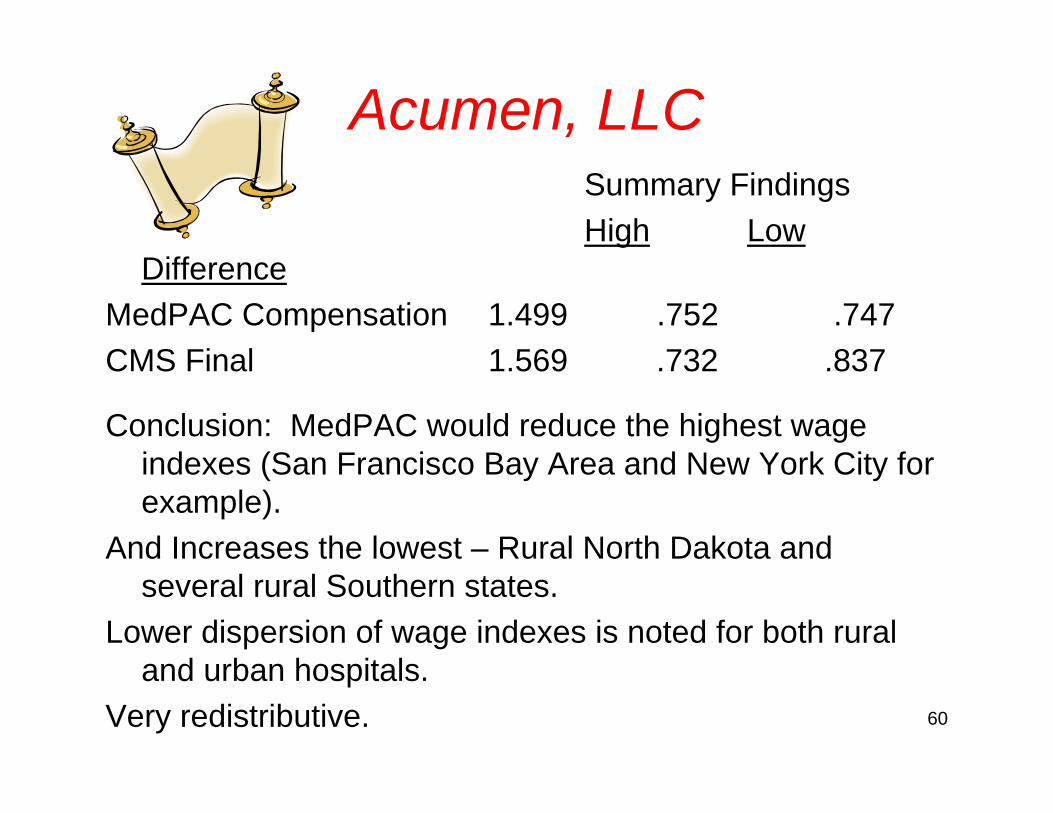
Acumen, LLCSummary FindingsHigh Low
DifferenceMedPAC Compensation 1.499 .752 .747CMS Final 1.569 .732 .837
Conclusion: MedPAC would reduce the highest wage indexes (San Francisco Bay Area and New York City for example).
And Increases the lowest – Rural North Dakota and several rural Southern states.
Lower dispersion of wage indexes is noted for both rural and urban hospitals.
Very redistributive.
61
Industry Support for MedPAC Proposal
• Opposed by AHA
• Opposed by FAH

America's Healthy Future Act of 2009 Chairman's Mark Released by the Senate Committee on Finance 9/16/09
• By December 31, 2011, Secretary of HHS must provide a plan to Congress for Reform of the Medicare Wage Index System.
• This plan must consider the goals set forth in the MedPAC June 2007 report.
• Use Bureau of Labor Statistics or other data or methodologies.
• Minimize wage index adjustments between and within CBSA and statewide rural areas.
America's Healthy Future Act of 2009
• Include methods to minimize volatility while maintaining budget neutrality.
• Analyze the affect on health care providers and regions.
• Address issues related to occupational mix.
• Consider evidence on quality of care.• Provide for a transition.
Wage Index is an Emotional Issue
• MedPAC:Gail WilenskyNancy Ann DeParleTom Scully
• Congressional Offices:Senator LugarSenate Finance Committee
• Not a "purity" issue. Example: 508 renewed 3 times.
What can the industry do?
• Nothing:
– Allow MedPAC to shape one or more proposals.
– Allow CMS to publish one or more proposals.– Allow consultants such as Acumen LLC to
evaluate proposals.

What can the industry do?
Or• The industry could proactively suggest
a solution.– Shape the solution– minimize re-distributional impact– achieve as close to consensus as possible– While satisfying objectives stated by Senate
Finance and the 2006 TRISHA law.

Our proposal to fix the wage index
1. Use a two year rolling average to compute wage indexes rather than a single years data.
2. Implement a 1 ½% annual stop loss floorfor individual hospitals suffering a decrease in wage index for any reason.
3. Implement post acute care payment equity changes by paying non-acute PPS services based on the actual average WI in use by CBSA or statewide rural area.

Our proposal to fix the wage index
4. Implement a geographic adjustment factor (WI to the power of .6848) type of approach to increase all wage indexes lower than 1.0000.
5. Eliminate the state by state budget neutrality provisions being phased in by CMS beginning in FFY 2009.
6. Preserve geographic reclassification perhaps rolling back the criteria to their historical levels.

Two Year Rolling Wage Index• This reduces volatility by 50%.• Results in identical payments to each
wage index area over a two year period (i.e. no redistributive effect).
• Can be implemented immediately. Data would be accumulated under the current system from the S-3, Part II. Implementation immediate. Cost of implementation zero. No new data required.
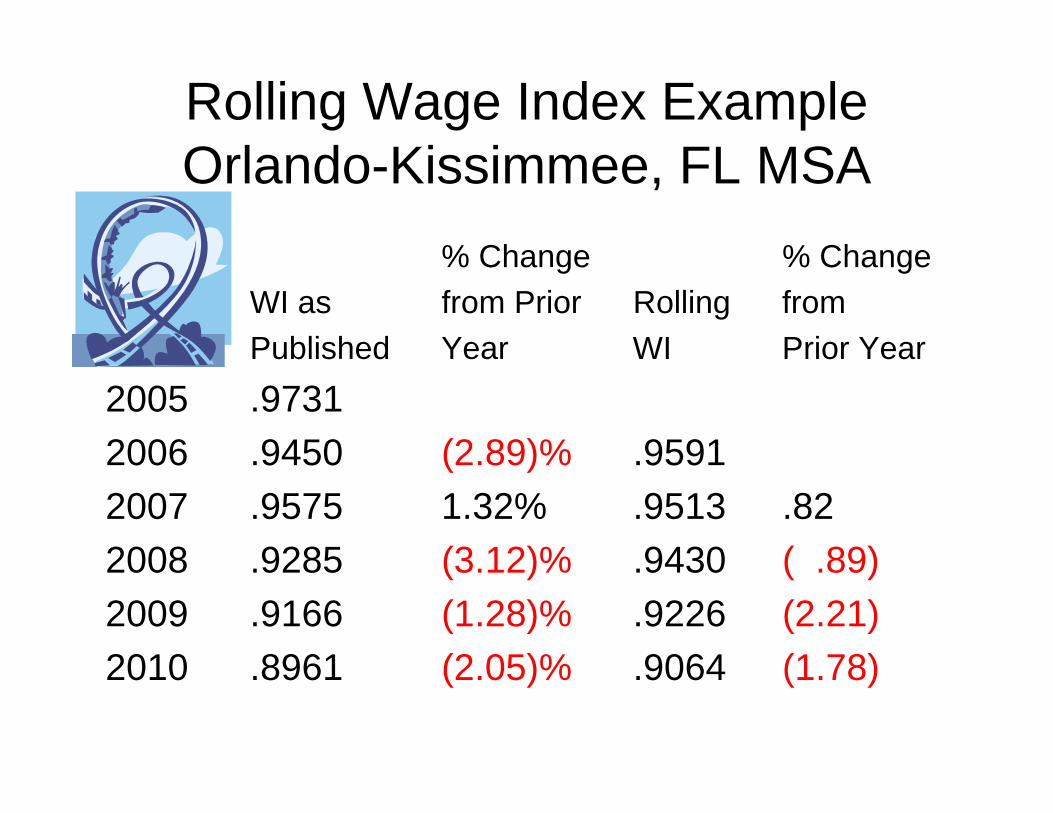
Rolling Wage Index ExampleOrlando-Kissimmee, FL MSA
% Change % ChangeWI as from Prior Rolling fromPublished Year WI Prior Year
2005 .97312006 .9450 (2.89)% .95912007 .9575 1.32% .9513 .822008 .9285 (3.12)% .9430 ( .89)2009 .9166 (1.28)% .9226 (2.21)2010 .8961 (2.05)% .9064 (1.78)
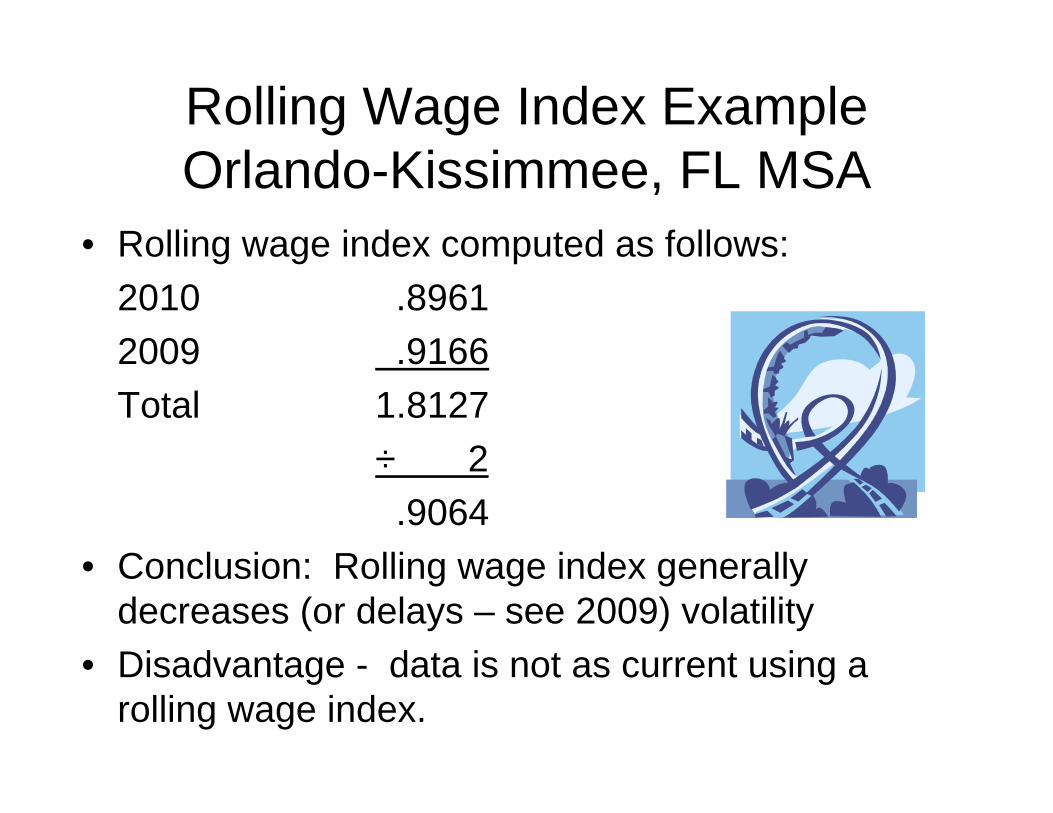
Rolling Wage Index ExampleOrlando-Kissimmee, FL MSA
• Rolling wage index computed as follows:2010 .89612009 .9166Total 1.8127
÷ 2.9064
• Conclusion: Rolling wage index generally decreases (or delays – see 2009) volatility
• Disadvantage - data is not as current using a rolling wage index.

72
1½% Annual Stop Loss Floor
• A Connecticut Hospital Association proposal.• Implement a wage index stop loss floor of 1.5% per year.• Applies to all hospitals individually regardless of reasons
including:
Loss of reclassificationBad dataPension funding nuances
• Baker Healthcare estimated costs in the fall of 2006 for FFY 2007.
• Cost $287 million (without a rolling wage index).• Nancy Johnson thought it could be implemented (new
money and budget neutral).
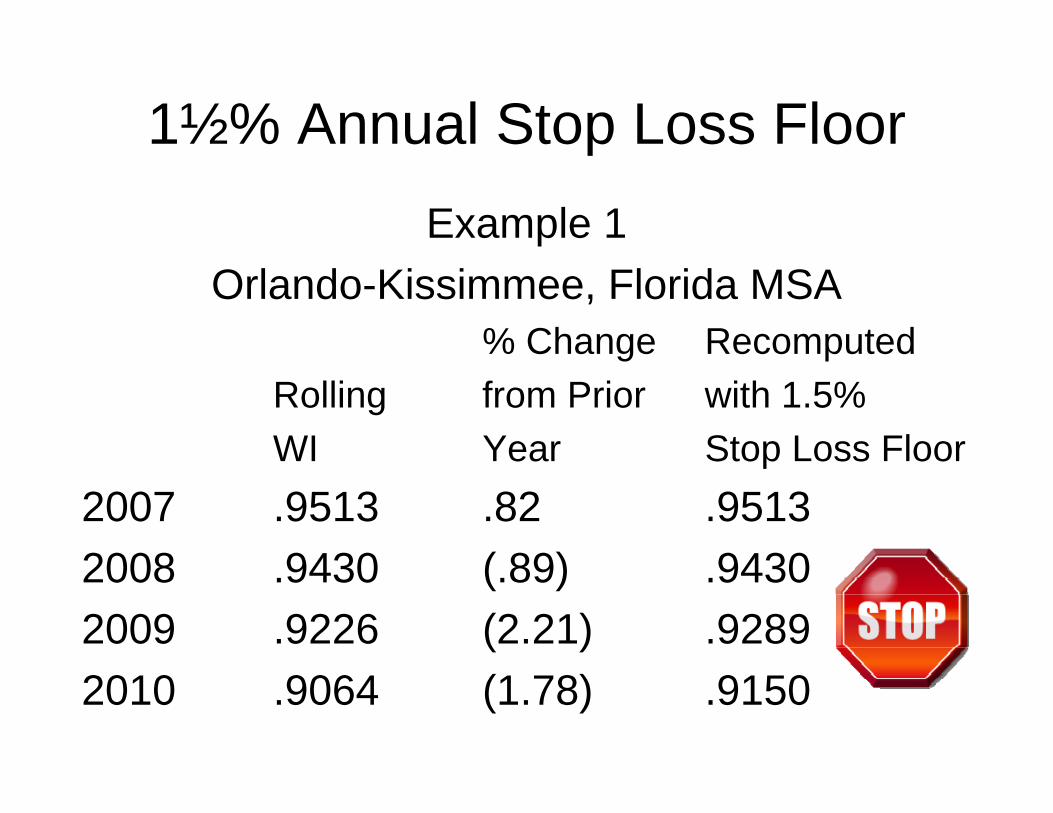
1½% Annual Stop Loss FloorExample 1
Orlando-Kissimmee, Florida MSA% Change Recomputed
Rolling from Prior with 1.5%WI Year Stop Loss Floor
2007 .9513 .82 .95132008 .9430 (.89) .94302009 .9226 (2.21) .92892010 .9064 (1.78) .9150
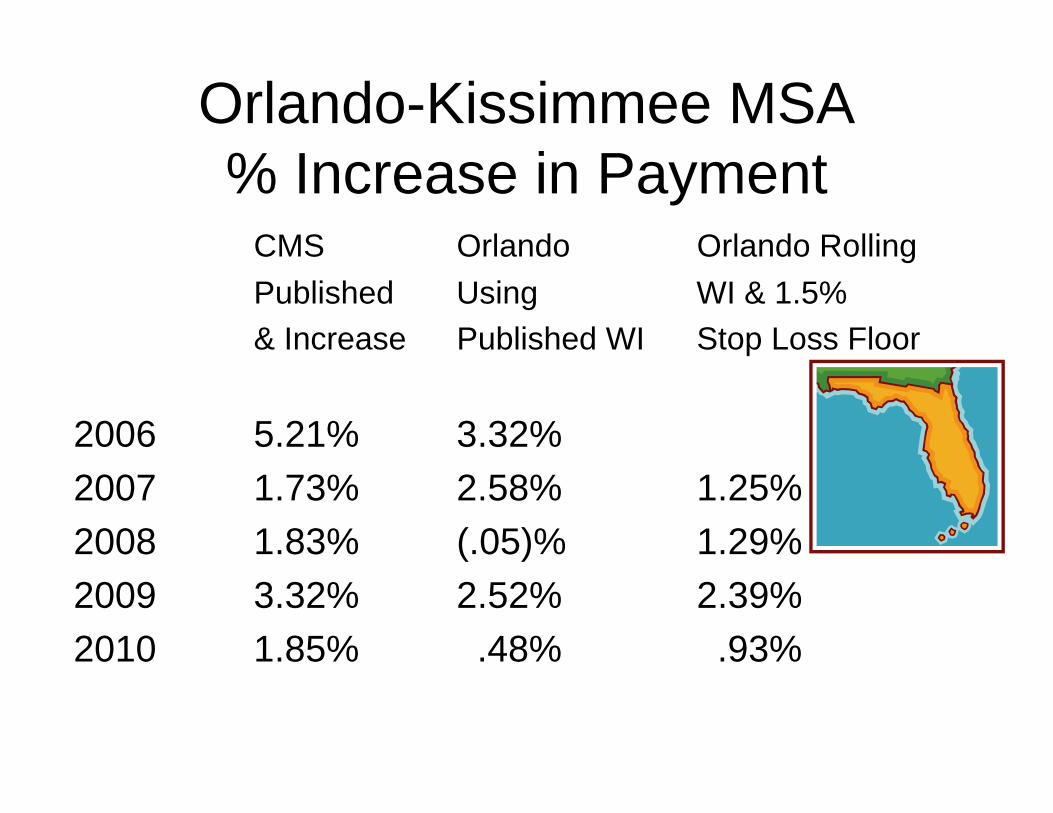
Orlando-Kissimmee MSA% Increase in Payment
CMS Orlando Orlando RollingPublished Using WI & 1.5%& Increase Published WI Stop Loss Floor
2006 5.21% 3.32%2007 1.73% 2.58% 1.25%2008 1.83% (.05)% 1.29%2009 3.32% 2.52% 2.39%2010 1.85% .48% .93%

1½% Annual Stop Loss FloorExample 2
Hospitals losing wage index reclassificationCentral Illinois hospital
Chicago reclassified 2010 wage index 1.0385Rural Illinois 2010 wage index .8322
Medicare payment per standardized case – Chicago rates $5,361.49
Rural Illinois $4,679.74Percent decrease (12.72%)With 1.5% stop loss floor
1.0385 x .985 = 102.29 $5,305.43% decrease (1.05%)
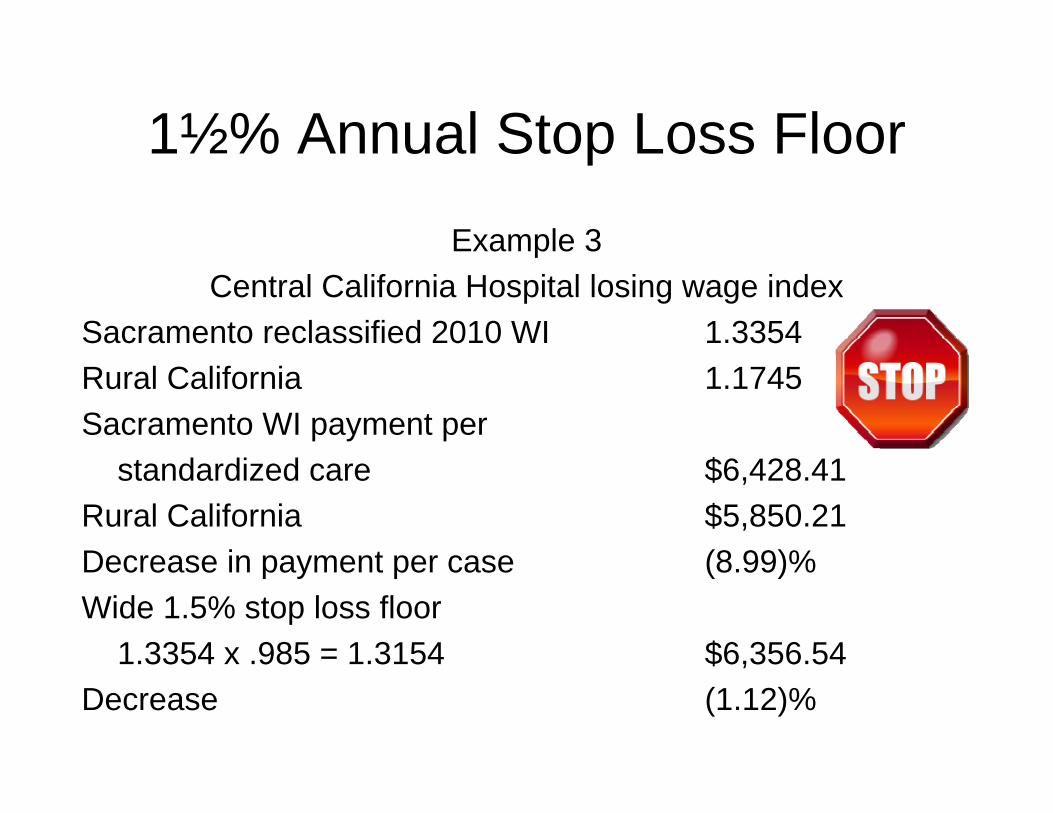
1½% Annual Stop Loss Floor
Example 3Central California Hospital losing wage index
Sacramento reclassified 2010 WI 1.3354Rural California 1.1745Sacramento WI payment per
standardized care $6,428.41Rural California $5,850.21Decrease in payment per case (8.99)%Wide 1.5% stop loss floor
1.3354 x .985 = 1.3154 $6,356.54Decrease (1.12)%

Geo Adjustment Factor for Wage Indexes Less Than 1.000
• MedPAC report criticized current wage index system because of "circularity".
• The rich get richer – they $eldom complain.• The poor get poorer – they always complain• $olution – Congress creates a new money fix for
hospitals with wage indexes lower than 1.0000. • Let the rich get richer.
Geo Adjustment Factor for Wage Indexes Less Than 1.000
• CMS implements using a GAF methodology which would include the following.
• Lowest wage indexes increase the most. As wage indexes get closer to 1.0000 the amount of the increase decreases.
• This maintains all hospitals in the same rank and order as current wages and preserves the incentive to "scrub" wage index data. This is essential!

Geo Adjustment Factor for Wage Indexes Less Than 1.000
• Congress can decide the funding of this and CMS can easily compute the power (such as .6848) used to compute the newly revised wage indexes. This maintains the incentive for all hospitals to keep current and accurate wage index data.
• Alternatives such as a "floor" (perhaps 95%) changes wage index incentives and can result in the opposite from what is intended.

Use of Geographic Adjustment Factor
Approach to increasing low wage indexesWI to the power of .80 and .90
GAFWI WI1.00 .6848 WI .80 WI .90
Rural Alabama .7389 .8128 .7850 .7616Rural Florida .8594 .8594 .8858 .8725Orlando-Kissimmee .8961 .9276 .9160 .9060
• GAF is used by CMS as an adjustment used for the wage index for computing the capital cost prospective payments.
Post Acute Care Prospective Payment Systems
• PPS programs utilizing the unadjusted Medicare wage index. Unadjusted means no rural floor and no geographic reclassifications. Users include:
Skilled nursing facilitiesHome health agenciesEnd stage renal disease providersHospice providersRehabilitative hospitals and unitsLong term care hospitalsPsychiatric hospitals and units

Post Acute Care ProvidersExamples of percent post acute WI lower than actual average WI used by acute care hospitals.Madera, CA 45.19%El Centro, CA 33.54%Farmington, NM 29.16%St. George, UT 23.37%Burlington-South Burlington, VT 22.24%Williamsport, PA 20.52%Scranton--Wilkes-Barre, PA 17.70%Decatur, AL 12.93%Oxnard-Thousand Oaks-Ventura, CA 11.48%Gary, IN 10.81%Newark-Union, NJ-PA 8.71%Rural IN 8.54%Santa Ana-Anaheim-Irvine, CA 1.91%
Two Other Fixes That Should Be Made
• Eliminate state by state rural floor budget neutrality adjustments.
• These unduly penalize hospitals in Vermont, New Hampshire, Connecticut, New Jersey and California.
• Very punitive adjustments in generally small states that are competitive with surrounding states (the northeastern states).
Two Other Fixes That Should Be Made
• Implementation of state by state rural floor budget neutral adjustments makes Medicare look more like Medicaid.
• What's next? DSH? IME?

SUMMARY OF PROPOSED WI FIX
• Rolling 2 year wage index.• 1½% annual stop loss floor.• These 2 budget neutral steps will reduce volatility
and reduce wage index issues.• GAF type adjustment to low wage indexes.
New money fix – eliminates circularity.• Post acute care payment equity cures unequal
payments. Budget neutral or new money?• Restore geo reclass criteria and eliminate state by
state rural floor budget neutrality.
TIMING
• After health reform• Lobbying at the hospital level, the
association level and post acute care provider and association level.
• Circulate legislative proposals during winter and spring 2010.

87
QUESTIONS