Embed Size (px)
Citation preview
THE M.ECORV DNA-(ADENINE N6)-METHYLTRANSFERASE
USES DNA BENDING FOR RECOGNITION OF AN EXPANDED
ECODAM RECOGNITION SITE Tomasz P. Jurkowski1, Nils Anspach2, Liliya Kulishova3,4, Wolfgang Nellen2 and
Albert Jeltsch1,*
From 1) Biochemistry Lab, School of Engineering and Science, Jacobs University Bremen,
Campus Ring 1, 28759 Bremen, Germany, 2) Abt. Genetik, CINSaT, Universität Kassel,
Heinrich-Plett-Str. 40, 34132 Kassel, Germany, 3) BioRec program, Jacobs University Bremen,
School of Engineering and Science, Campus Ring 1, 28759 Bremen, Germany 4) present address:
Institut für Molekulare Enzymtechnologie der Heinrich-Heine Universität Düsseldorf, FZ-Jülich,
52426 Jülich, Germany
Address correspondence to Albert Jeltsch, School of Engineering and Science, Jacobs University
Bremen, Campus Ring 1, 28759 Bremen, Germany, Phone: +49 421 200 3247, Fax: +49 421 200
3249, [email protected], http://www.jacobs-university.de/ses/ajeltsch/
The M.EcoRV DNA methyltransferase
recognizes GATATC sites. It is related to
EcoDam, which methylates GATC sites.
The DNA binding domain of M.EcoRV is
similar to that of EcoDam suggesting a
similar mechanism of DNA recognition.
We show that amino acid residue K11 of
M.EcoRV is involved in recognition of
Gua1 and R128 contacts the Gua in base
pair six. These residues correspond to K9
and R124 in EcoDam, which recognize
the Gua residues in both strands of the
Dam recognition sequence, indicating that
M.EcoRV and EcoDam make similar
contacts to outermost base pairs of their
recognition sequences and M.EcoRV
recognizes its target site as an expanded
GATC site. In contrast to EcoDam,
M.EcoRV considerably bends the DNA
(59±4°) suggesting indirect readout of the
AT rich inner sequence. Recognition of an
expanded target site by DNA bending is a
new principle for changing DNA
recognition specificity of proteins during
molecular evolution. R128A is inefficient
in DNA bending and binding whereas
K11A bends DNA with relaxed sequence
specificity. These results suggest a
temporal order of the formation of
protein-DNA contacts in which the Gua6-
R128 contact forms early followed by
DNA bending and, finally, the formation
of the K11-Gua1 contact.
1
http://www.jbc.org/cgi/doi/10.1074/jbc.M706933200The latest version is at JBC Papers in Press. Published on October 31, 2007 as Manuscript M706933200
Copyright 2007 by The American Society for Biochemistry and Molecular Biology, Inc.
by guest on June 26, 2018http://w
ww
.jbc.org/D
ownloaded from
Sequence specific recognition of DNA by
proteins is essential for life, because the
biological effect of each gene is regulated by
transcription factors, which bind to the
promoter elements of target genes and
stimulate or repress the expression of the
corresponding gene (review: 1). Also many
nucleic acid interacting enzymes, like DNA
methyltransferases (reviews: 2,3,4),
aminoacyl-tRNA synthetases (review: 5),
DNA repair enzymes (review: 6) and
restriction endonucleases (review: 7) interact
with nucleic acids in a highly sequence
specific manner. In general, DNA
recognition follows two paradigms: direct
and indirect readout (review: 1). For direct
readout, proteins form contacts (including
hydrogen bonds and van der Waals contacts)
in the major (and to a lesser degree also the
minor) groove of the DNA to the edges of
the base pairs to probe the DNA sequence
(8). For indirect readout, proteins form
contacts to the DNA backbone. Since
structural preferences and dynamics of the
DNA are sequence dependent, the
interaction energy associated with a
particular DNA conformation can be used to
read the DNA sequence (9).
DNA methyltransferases are an important
example of enzymes that recognize specific
DNA sequences (reviews: 2,3,4). DNA-
(adenine N6)-MTases, as studied here,
transfer a methyl group to the N6-position of
adenine residues embedded in a specific
recognition sequence. In E.coli, the EcoDam
enzyme which methylates DNA at GATC
sites is involved in the coordination of DNA
replication and cell cycle, post-replicative
mismatch repair and regulation of the
expression of several genes (review: 4).
Recently, the structure of the EcoDam
enzyme in complex with specific DNA was
solved illustrating the mechanism of
sequence specific DNA interaction of this
enzyme (10). The protein comprises two
domains, a catalytic domain that is
conserved among DNA MTases and a DNA
binding domain that folds into a five-helix
bundle. The DNA interactions are made by a
ß-hairpin (residues 118-139) which is part of
the DNA binding domain and an N-terminal
extension of the catalytic domain (Fig. 1A).
Key DNA recognition contacts between
EcoDam and the GATC site are a hydrogen
bond between K9 and Gua1, contacts of
L122 and P134 to base pair 3 and an
interaction of R124 to the Gua in the 4th
base pair (see Fig. 1B). Exchange of any of
these residues led to major changes in the
DNA recognition specificity of EcoDam
(10,11). The enzyme forms contacts also
with the backbone of the DNA but there is
no apparent deformation of the DNA (apart
from flipping out the target base for
methylation and its partner base) which
suggests that indirect readout is secondary
for DNA recognition. The EcoDam enzyme
2
by guest on June 26, 2018http://w
ww
.jbc.org/D
ownloaded from
is related to the phage T4 encoded T4Dam
enzyme, which also recognizes GATC sites
(Fig. 1A). The T4Dam has a very similar
structure and mode of DNA recognition as
EcoDam (11,12), with the only exception
that recognition of Gua1 is not based on an
interaction with the N-terminal loop of the
enzyme (T4Dam carries an alanine at the
position corresponding to EcoDam K9, see
Fig. 1A), but on a bidentate hydrogen bond
between R130 located at the basis of the ß-
hairpin and the guanine.
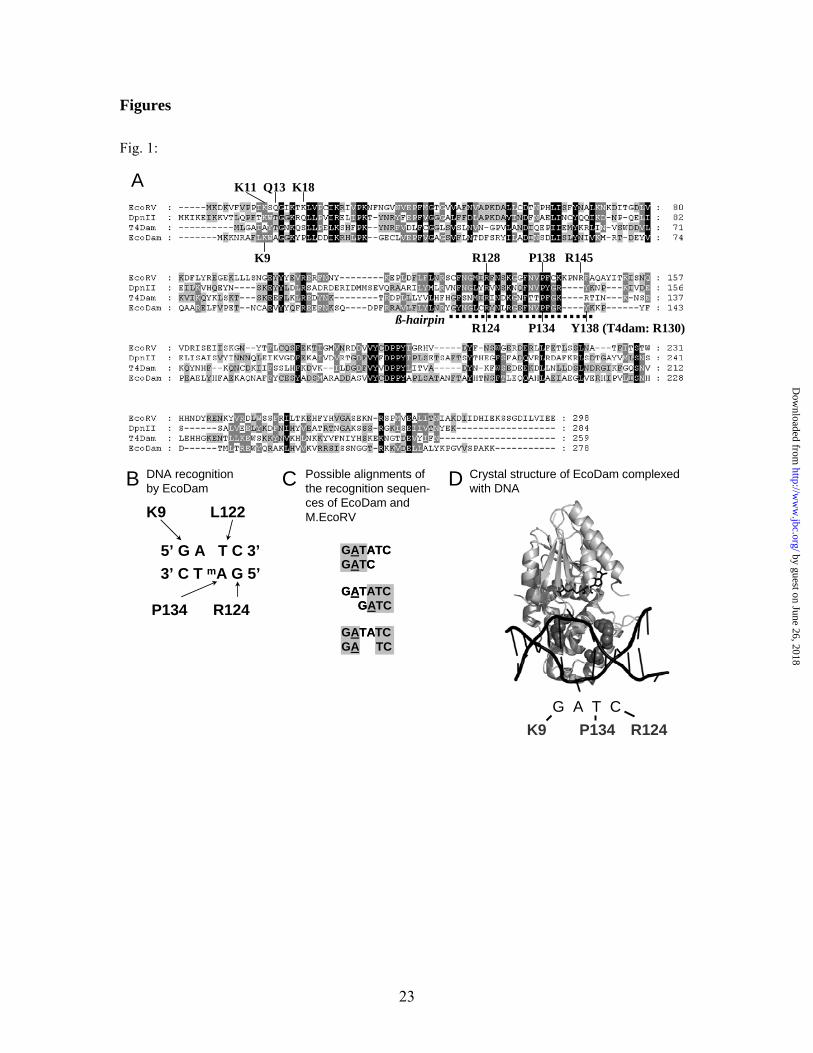
The M.EcoRV enzyme, which is the subject
of the present work, is part of a
restriction/modification system that protects
the bacterial host against bacteriophage
infection (review: 4). Although, restriction
enzymes and methyltransferases can
recognize the same sequence, they have
evolved independently and use different
mechanisms for DNA recognition. The
M.EcoRV enzyme is related to the Dam
family (Fig. 1A), but it recognizes GATATC
sites and modifies the first adenine within
the sequence (13). The DNA binding
domain of M.EcoRV is similar to that of
EcoDam, which suggests a similar
mechanism of DNA recognition (14,15). In
EcoDam and T4Dam, the target base is
flipped out of the DNA helix (10,11), which
most likely is also happening in the
M.EcoRV-DNA complex (16). For
methylation, the target base is inserted into a
pocket formed by a DPPY tetrapeptide that
is the most highly conserved part of N-
MTases (review: 2). The M.EcoRV DNA
interaction has been shown to invoke strong
bending of the DNA of approx. 61° (17),
and to induce large structural changes of the
DNA (18). Furthermore, binding of
sinefungin, an AdoMet analogue, increased
DNA binding by M.EcoRV 20 fold (19)
which indicates that there is communication
between the coenzyme and DNA binding
site.
The M.EcoRV/EcoDam system has been
studied as a paradigm of how proteins
change their DNA recognition during
evolution. One central prerequisite to answer
this question is to determine which structural
elements of M.EcoRV correspond to
EcoDam, meaning how the six base pair
recognition sequence of EcoRV should be
aligned to the EcoDam sequence (Fig. 1C).
Given the fact, that both enzymes methylate
the second adenine in a GAT sequence, an
alignment of the GAT parts of both
sequences appeared likely (20,21). Then, the
difference between M.EcoRV and EcoDam
DNA recognition sequence would lie in the
ATC part of the EcoRV site and M.EcoRV
would require some structural elements for
its recognition. The availability of the
T4Dam and EcoDam-DNA complex
structure shed new light on this question,
because the part of the ß-hairpin which is
3
by guest on June 26, 2018http://w
ww
.jbc.org/D
ownloaded from
responsible for the recognition of the TC
part of the target site is fully conserved
between EcoRV and EcoDam as well as
other members of the family (10,11). This
observation would suggest that the last bases
of the target sites correspond to each other
and the recognition of the first part has been
altered between M.EcoRV and EcoDam.
This model is supported by the observation
that it is the recognition of Gua1 that is
altered between EcoDam and T4Dam (10)
suggesting that this is an evolutionary
flexible contact. Here, we show that both
these models are incorrect, because
recognition of the first and last base pairs of
the target site is conserved between
M.EcoRV and EcoDam. Hence, M.EcoRV
recognizes GATATC sites as an expanded
GATC site, with DNA bending introduced
to accommodate the increased distance
between the first at last bases of the target
site. Furthermore, we show that R128A is
inefficient in DNA binding and bending
whereas K11A shows relaxed sequence
specificity in DNA binding and bending.
These results suggest that the DNA contact
of R128 is an early contact between the
enzyme and the DNA whose formation is
followed by bending of the DNA and
making of the contact between K11 and
Gua1.
Experimental procedures
Oligonucleotides - Oligonucleotides were
purchased from Thermo Hybaid (Ulm,
Germany). We used one canonical substrate
LD20 and 13 near cognate substrates in
which one base pair of the recognition
sequence had been altered. Hemimethylated
substrates were used to specify which strand
of the near cognate substrates became
methylated. Double-stranded substrates were
prepared by mixing equimolar (20 µM)
amounts of each strand, heating to 95°C for
5 min, and slowly cooling to room
temperature. Following oligonucleotides
were used (all written in 5’ to 3’ orientation,
Bt stands for Biotinylation, mA for 6-
methyladenine):
LD20: d (GAT CGT AGA TAT CTC ATC
GA) / Bt-d (TCG ATG CGmA TAT CTA
CGA TC)
LD20 G1T: d (GAT CGT ATA TAT CTC
ATC GA) / Bt-d (TCG ATG CGmA TAT
ATA CGA TC)
LD20 G1C: d (GAT CGT ACA TAT CTC
ATC GA) / Bt-d (TCG ATG CGmA TAT
GTA CGA TC)
LD20 G1A: d (GAT CGT AAA TCT CTC
ATC GA) / Bt-d (TCG ATG CGmA TAT
TTA CGA TC)
LD20 T3A: d (GAT CGT AGA AAT CTC
ATC GA) / Bt-d (TCG ATG CGmA TTT
CTA CGA TC)
4
by guest on June 26, 2018http://w
ww
.jbc.org/D
ownloaded from
LD20 T3C: d (GAT CGT AGA CAT CTC
ATC GA) / Bt-d (TCG ATG CGmA TGT
ATA CGA TC)
LD20 T3G: d (GAT CGT ATA GAT CTC
ATC GA) / Bt-d (TCG ATG CGmA TCT
ATA CGA TC)
LD20 A4C: d (GAT CGT AGA TCT CTC
ATC GA) / Bt-d (TCG ATG CGmA GAT
CTA CGA TC)
LD20 A4T: d (GAT CGT AGA TTT CTC
ATC GA) / Bt-d (TCG ATG CGmA AAT
CTA CGA TC)
LD20 A4G: d (GAT CGT AGA TGT CTC
ATC GA) / Bt-d (TCG ATG CGmA CAT
CTA CGA TC)
LD20 T5C: (GAT CGT AGA CAC CTC
ATC GA) / Bt-d (TCG ATG CGG TGT
CTA CGA TC)
LD20 T5A: d (GAT CGT AGA TCA CTC
ATC GA) / Bt-d (TCG ATG CGT GAT
CTA CGA TC)
LD20 T5G: d (GAT CGT AGA TAG CTC
ATC GA) / Bt-d (TCG ATG CGC TAT
CTA CGA TC)
LD20 C6T: d (GAT CGT AGA TAT TTC
ATC GA) / Bt-d (TCG ATG CAmA TAT
CTA CGA TC)
Site-directed mutagenesis, protein
expression and protein purification - The
M.EcoRV mutants were generated by the
megaprimer site-directed mutagenesis
method as described before (22). The
pGEXMRV plasmid (23), which encodes
M.EcoRV N-terminally fused to GST, was
used as a template. The mutagenic primer
contained the designated single substitution
and the screening restriction site to confirm
the mutation. Mutant plasmids were selected
by restriction analysis of marker sites
introduced together with the mutation. The
absence of non-desired mutations was
confirmed by complete sequencing of all
variant genes. Protein expression was
performed as described before (20), except
that cells were harvested 3h after the
induction of protein expression. Purification
of the GST-fusion proteins was done by
chromatography over GSH-Sepharose
(Pharmacia Biotech) basically as described
before (20), except that the sonication buffer
contained 500mM NaCl. Usually purified
proteins were >95 % pure (see Suppl. Fig. 1
for some representative examples of the
protein purifications used). Protein
concentrations were determined by
densitometric analysis of Coomassie stained
SDS PAGE gels.
Kinetic analysis using in vitro methylation
assay - Quantitative determination of the
catalytic activity of the wild type M.EcoRV
and its variants was carried out in vitro with
a biotin/avidin methylation assay as
described (24). All the methylation reactions
were performed under single turnover
conditions, because multiple turnover
experiments are not suited to probe the
5
by guest on June 26, 2018http://w
ww
.jbc.org/D
ownloaded from

transition state of the DNA methylation
reaction by M.EcoRV, since the turnover of
M.EcoRV is limited by product release (25).
In order to determine comparable catalytic
activities of wild type and mutants, equal
concentrations of the enzymes (1 μM) were
used in the individual reactions. All the
reactions were performed in 40 µL reaction
mixture containing 1 µM oligonucleotide, 1
µM enzyme, 2.6 µM [3H]AdoMed, 500
ng/mL BSA, 1 mM EDTA, 50 mM Tris-HCl
(pH 7.5) and 100 mM NaCl. All kinetics
were done at least in triplicate and the
results averaged.
Kinetic data analysis - Linear reaction
progress curves were analyzed by linear
regression to determine the initial slope
(kmet). Hyperbolic reaction curves were
analyzed by a single exponential fit followed
by a linear phase:
CPMtheo(t) = F (1-e-kst t) + kmt t + BL (eq. 1)
kst single turnover rate constant for DNA
methylation, [1/min]; kmt multiple turnover
rate constant for DNA methylation
[CPM/min]; F size of the exponential phase
in [CPM]; BL background.
Since the single turnover rate (kst) of
M.EcoRV is much faster than the multiple
turnover rate (kcat) (25), under our conditions
the single turnover rate dominates the results
with kmt contributing less than 5% to kmet.
To determine the initial rate of enzyme turnover (kmet) the equation 1 is differentiated at t→0 to obtain:
kmet = F kst + kmt (eq 2)
The initial rate depends on the saturation
level of substrate with enzyme, which
depends on the DNA binding constant.
Since wild type M.EcoRV and all mutants
bind to the L20 substrate with an affinity of
about Kd=1x10⁻⁷ M or weaker (15), the
initial slopes determined here reflect kst/Kd
which is a well established measure of
enzyme specificity (26).
To compare the relative activity of wild type
and variant enzyme for methylation at a
modified target site (X), specificity factors
were calculated, where denotes the
methylation rate of one particular substrate
by one M.EcoRV variant or the wild type:
substratevariantk
substrateX typewild
GATATC typewild
substrateXvariant
GATATCvariant
/kk/kkS −
−
=
An increase in specificity is indicated by
S>1, loss of specificity by S<1.
Electrophoretic mobility shift experiments -
In order to investigate the DNA binding and
bending by M.EcoRV, two different 150 bp
DNA fragments called E (for “end”) and M
(for “middle”) were used. Both substrates
had a single EcoRV target site, E at the end
of the fragment and M in the middle. Both
6
by guest on June 26, 2018http://w
ww
.jbc.org/D
ownloaded from

substrates were constructed by PCR
amplification of pET28a(+) vector using two
sets of oligonucleotides: 5’-ATC CCA CTA
CCG AGA TAT CCG CACC-3’ / 5’-TGT
CCG GTT TTC AAC AAA CCA TGC-3’
for E and 5’-AAT CCT GTT TGA TGG
TGG TTA ACG3’ / 5’-TGG TTG CCA
ACG ATC AGA TGG CG-3’ for M. Both
substrates were radioactively labeled with γ-32P-ATP using T4 polynucleotide kinase
(NEB).
The band shift assay was carried out as
previously described (17). In 20 µl, the
reaction mixtures contained 50 mM HEPES-
NaOH, pH 7.0, 1 mM EDTA, 100 mM NaCl,
5 mM dithiothretoitol, and 1 µg of
acetylated bovine serum albumin, 0.2 mM
sinefungin (Sigma), approx. 100 pM of each
amplified DNA and 100 nM of M.EcoRV
wild type protein (200 – 800 nM for the
M.EcoRV variants). The reactions were
incubated at room temperature for 15-30
min and loaded on a 8% non-denaturating
polyacrylamide gel run in 0.5 x TBE buffer,
followed by 6 hours electrophoresis at room
temperature (300V, 250 mA). The separated
complexes were visualized by
autoradiography using the phosphoimager
system (Fuji).
Scanning-force microscopy experiments -
A 406 bp DNA substrate was obtained by
PCR amplification of the pET28a(+) using
the primers: 5’-GCG TAT TGG GCG CCA
GGG 3’ and 5’- GGC TGG CAT AAA TAT
CTC ACT CGC-3’. It contains one EcoRV
site located in the center of the sequence.
DNA-protein complexes were established in
a total volume of 10 µl by combining 30 nM
DNA with either 250 nM of M.EcoRV (wt),
300 nM of K11A or 800 nM of R128A
protein in 50 mM HEPES (pH 7,5), 250 mM
NaCl, 1 mM EDTA and 100 µM of
sinefungin. The protein concentration had to
be increased in case of the mutants, to
observe a sufficient numbers of complexes.
Samples were incubated for 15 min at room
temperature. Then, 1 µl of the complex
solution was mixed with 9 µl of 5 mM
MgCl2 solution and deposited on freshly
cleaved mica (Plano, Wetzlar), allowed to
adhere for 40 seconds and washed with 1 ml
of bi-distilled water afterwards. The sample
was dried using compressed air.
Protein-DNA complexes were observed by
tapping mode in air using a Multimode
AFM with a Nanoscope III controller
(Digital instruments, Santa Barbara, CA).
We used NST-NCHF silicon cantilevers
(Nascatec, Stuttgart) with a nominal spring
constant of 50 N/m and a resonance
frequency of ~350 kHz. All images were
obtained with a scanning speed of 0.5-1 Hz
and a resolution of 512×512 pixels.
Experiments were carried out blinded, i.e.
the operator of the microscope did not know
7
by guest on June 26, 2018http://w
ww
.jbc.org/D
ownloaded from

the previous data for each variant. To
remove background slope, raw images were
flattened using the Nanoscope software.
Particles on the DNA with a diameter of >8
nm and exceeding the height of the DNA
molecule by >50% were considered to be
bound protein.
Since the orientation of the DNA could not
be determined in the images, the distance of
a bound protein to the closest end of the
molecule was measured. When two proteins
were bound to one DNA molecule, distances
were measured with respect to the closest
end of each single protein. Distances were
evaluated after subdividing the 406 bp DNA
substrate into 14 sections of approx. 5 nm
each. The specific binding site is located in
segment 14. Segments 2, 3, 9, and 10
contain GAT sites which was important for
the analysis of the K11A variant. Bending
angles were measured by drawing straight
lines through the DNA arms adjacent to a
binding protein using the section tool of the
Nanosope software (Version 6.11r1). The
angle is given as deviation from the straight
line across the binding protein.
Results and Discussion
We applied double mutant cycles for the
identification of enzyme-DNA contacts
relevant for DNA recognition. To this end,
we prepared variants of M.EcoRV in which
candidate amino acid side chains were
exchanged against alanine and studied their
methylation activity using the cognate
substrate GATATC and several near-
cognate substrates, in which one base pair
had been altered. The underlying idea of
these experiments is illustrated in Fig. 2A. If
an enzyme-DNA contact is present between
amino acid D and base pair Z, the wild type
enzyme will methylate near-cognate
substrates altered at base pair Z at reduced
rate because of the loss of the contact. Since
a variant mutated at D lacks the contact it
often will show reduced activity at the
cognate site. However, it will also show
reduced ability to discriminate between
cognate and near cognate substrates having
altered bases at Z. Therefore, the near
cognate substrate Z will show a less
pronounced drop in activity (when
compared with the activity at the cognate
site) with mutant D than with the wild type
enzyme. It is this absence of decline in
activity that is indicative of a contact
between D and Z. In contrast, removal of
one contact between the enzyme and the
DNA might make recognition of other bases
become more stringent, because a complex
of the protein mutated at D with a near-
cognate substrate that carries a base pair
exchange at a site other than Z will contain
two defects, one introduced by the mutation
in the protein the other by the base pair
exchange. Hence, if an enzyme variant
shows an increased accuracy of recognition
8
by guest on June 26, 2018http://w
ww
.jbc.org/D
ownloaded from
of a near-cognate substrate, one can
conclude that the mutated amino acid side
chain is not involved in recognition of that
particular base pair, but it may be involved
in recognition of other base pairs or in
indirect readout of the DNA sequence.
Selection of M.EcoRV variants - On the
basis of the EcoDam crystal structure and
the alignment of M.EcoRV with members of
the Dam family (Fig. 1), we selected several
residues for a mutational study, namely:
K11, which corresponds to EcoDam K9,
Q13 and K18 which are on the N-terminal
loop and hence should be close to the DNA.
Structural modeling suggested that these
residues might be candidates for the
recognition of the inner AT bases of the
M.EcoRV sequence (data not shown). The
R128 and P138 residues correspond to
EcoDam R124 and P134. R145 presumably
is located at the basis of the ß-hairpin which
forms many of the specific contacts to the
DNA in EcoDam and T4Dam (10,11). These
M.EcoRV variants had been studied already
(20), but in the former project all
experiments were designed based on the
assumption that the GAT parts of the
M.EcoRV and EcoDam recognition sites
should be aligned (which is not correct),
such that the influence of the exchanges had
only been studied on the 3’ part of the
recognition sequence. Also, in that paper
only one near-cognate substrate (A4C in the
nomenclature used here) had been used with
the mutant enzymes. Here, we investigated
methylation of 13 near-cognate substrates by
all variants, an approach that was successful
in the identification of enzyme-DNA
contacts of the EcoDam enzyme (10,11).
Catalytic Activity of the M.EcoRV and its
variants at cognate substrates - To
investigate the specific recognition of the
DNA by the M.EcoRV, we exchanged 6
amino acid residues to alanine, purified the
proteins and determined their DNA
methylation activity using the L20 substrate
(which contains a cognate GATATC site) in
vitro. The single turnover methylation rate
constant of wild type M.EcoRV was 0.18
(±0.03) min-1, which is similar to values
determined earlier (20). The relative
turnover rates of M.EcoRV and its variants
averaged over 3-5 experiments are given in
Fig. 2B, representative examples of
individual methylation experiments are
shown in Suppl. Fig. 2. The K11A, R128A
and R145A showed strong reduction in
activity, which indicates that these residues
are functionally important for the enzyme.
The activities of Q13A, K18A and P138A
were only slightly reduced or not reduced at
all. However, this does not rule out a role of
these residues in DNA recognition, because
the EcoDam P134 is a key residue for the
recognition of the third base pair, although
9
by guest on June 26, 2018http://w
ww
.jbc.org/D
ownloaded from

the P134A variant also did not exhibit
reduced activity at the cognate substrate (11).
Specificity of DNA Methylation Activity by
M.EcoRV - To determine the stringency of
recognition of the individual base pairs of
the M.EcoRV site, we have performed
methylation kinetics using a set of 13 near
cognate substrates that differ from the
cognate GATATC site by single base pair
exchanges. The rates of methylation were
compared with the rate of methylation of the
L20 reference substrate to obtain a
specificity profile for M.EcoRV (Fig. 2C,
Suppl. Fig. 2). All experiments were
performed using hemimethylated substrates
to direct the methyl group transfer to one
target strand. As shown previously (20,21),
M.EcoRV displayed considerable activity
towards cognate and near-cognate
substrates; relative to GATATC near-
cognate substrates were methylated with the
10-1000 reduced rates. In general, the
specificity of M.EcoRV is lower than that of
EcoDam as indicated by the observation that
the relative activity of EcoDam was below
1% with all near-cognate substrates and 4
out of 8 substrates were methylated with
relative rates of 1/1000 or below (11). In
contrast, M.EcoRV methylated 9 out the 13
near-cognate substrates with relative rates
that are higher than 1% and all of them were
methylated with a relative rate higher than
1/1000.
The activity of M.EcoRV towards the A4C
substrate was reduced by about one order of
magnitude, which is in agreement with an
earlier result (20). It is interesting to note
that the T3C and T5C exchanges were most
inhibitory to catalytic activity. This result
distinguishes M.EcoRV from EcoDam,
which tolerated transitions better than
transversions (11). Like in the EcoDam
enzyme (10), at position Gua1, the Gua to
Ade exchange was tolerated best by
M.EcoRV. In EcoDam this result is in
agreement with the observation that the
enzyme contacts the Gua1 by a hydrogen
bond to the N7 atom, which is available in
guanine and adenine residues.
To identify amino acid residues, involved in
specific contacts to the target sequence, we
performed methylation kinetics using all
near-cognate substrates with the M.EcoRV
variants as well. The specificity profiles of
the six M.EcoRV variants studied here are
shown in Fig. 2D. Due to its low overall
activity the detection limit with the R128A
variant was at a level of 1% of the activity
observed with L20; with all other variants
relative activities of 0.1% could be analyzed
quantitatively. In order to compare these
specificities with the wild type enzyme, a
specificity factor S was calculated which
compares the relative specificity of
M.EcoRV variant and wild type.
10
by guest on June 26, 2018http://w
ww
.jbc.org/D
ownloaded from
The accuracy of recognition (A) of each
base pair can be described as the relative
loss of activity at near cognate sites
modified at this base pair (A= kGATATC/kX-
substrate). Changes in the DNA recognition of
enzyme variants are identified by calculating
the S factor which is defined as the ratio of
the accuracies of the mutant and wild type
(S=Avariant/Awild type). S>1 indicates that
recognition is more stringent in the variant
than in wild type (=higher specificity), an S
factor <1 indicates that the recognition is
reduced in the variant to a certain degree
(=lower specificity). As described above,
increased specificity of a variant indicates
that the amino acid residue exchanged does
not play a role in the recognition of that
particular base pair. Reduced specificity
indicates the potential presence of an
enzyme-DNA contact.
The S factors of all variants are displayed in
Fig. 3. On the basis of the accuracy of the
individual methylation rates as shown in Fig.
2, S factors >10 or <0.1 are highly
significant and will be discussed in the
following paragraphs. There were two
outstanding results, namely the loss of
specificity of K11A and R128A for
recognition of the first and last base pair,
respectively. No other variant than R128A
showed loss of recognition of the last base
pair. For the first base pair it was only K11A
that displayed a consistent loss of
recognition with all three substrates tested.
R128A showed a minor loss of recognition
with G1A, but this effect was small (about
3-fold) and the same variant showed an
increase in recognition of G1T. In addition,
we observed loss of recognition with one (or
several) of the near cognate substrates
substituted at the third position with K11A,
Q13A, R128A, P138A and R145A. Because
of its lack of specificity, this effect was not
attributed to direct base recognition.
Recognition of the outer base pairs of the
M.EcoRV site – The K11A variant
displayed the largest changes in specificity,
because it showed a pronounced increase in
specificity in the interaction with the A4G
and C6T substrates. At the same time, it
displayed a considerable loss of specificity
for the G1T substrate. In EcoDam K9, the
residue homologous to K11 in M.EcoRV,
forms a hydrogen bond to the N7-position of
Gua1 (10). In the EcoDam-DNA complex
K9 (which is K11A is the only variant of
M.EcoRV which showed a reduced
recognition of the first base pair, suggesting
that it forms a similar hydrogen bond. The
K11A exchange almost did not affect the
interaction with G1A, while G1C and
particularly G1T showed loss of recognition.
The same pattern of residual activities had
been observed with EcoDam. It supports the
notion that K11 contacts the N7 of Gua1,
11
by guest on June 26, 2018http://w
ww
.jbc.org/D
ownloaded from

because such contact cannot contribute to
the discrimination of guanine and adenine.
In extrapolation these results suggest a
comparable role of the N-terminal loop in
M.EcoRV and EcoDam, which explains the
finding that cofactor binding influences
DNA recognition by M.EcoRV (19),
because we have recently shown that slight
structural rearrangements of this loop in
EcoDam couple coenzyme binding,
recognition of the first base pair and
insertion of the flipped target base into the
base binding pocket of the enzyme (27).
The R128A variant showed a 20 fold
reduced activity at GATATC sites and it
displayed no detectable activity at most near
cognate sites. However, the GATATT site
was modified with the same rate as
GATATC indicating a clear loss of
recognition of the C6T substrate, which is
accompanied by increased selectivity for
G1A and exchanges at the 4th base pair.
These results can be compared with the
EcoDam R124A variant which showed a
strongly reduced catalytic activity at the
canonical and no activity at most near
cognate sites except GATG and GATT
which were methylated at the same rate as
the GATC site (11). Therefore, the
properties of the M.EcoRV R128A and the
EcoDam R124A variant are very similar to
each other. Combined with the position of
M.EcoRV R128 in the alignment of
M.EcoRV and EcoDam and the structural
data demonstrating that EcoDam R124
contacts the Gua of the fourth base pair in
the EcoDam-DNA complex, these data
strongly suggest that M.EcoRV R128 forms
a contact to the Gua in the sixth base pair of
the GATATC site in M.EcoRV.
Recognition of the inner part of the
M.EcoRV recognition sequence - The
Q13A variant showed an increased
recognition of all near cognate substrates
except T3C. Therefore, it is unlikely that
Q13 is involved in any base specific contact.
K18A and P138A did not show large
changes in the specificity profile when
compared with the wild type enzyme. Hence,
the P138 residue seems not to be involved in
the recognition of the Thy5, although in
EcoDam P134 has a van der Waals contact
to the TA base pair that plays an important
role in sequence readout (11). This
difference in the results obtained with
M.EcoRV and EcoDam suggests that the
structure of the M.EcoRV-DNA complexe
differs from the EcoDam-DNA complex at
Thy5. We also could not identify any other
residue that appears to be responsible for the
recognition of the central TAT part of the
M.EcoRV site.
DNA bending by M.EcoRV - The lack of
direct contacts to the central part of the
recognition sequence observed here for
12
by guest on June 26, 2018http://w
ww
.jbc.org/D
ownloaded from
M.EcoRV is very similar to what is seen
with the R.EcoRV restriction enzyme, were
crystal structure analyses did not provide
any evidence of direct readout of the inner
AT base pair (28). However, R.EcoRV
bends the DNA during specific complex
formation (28,29). Since the stacking energy
of TA and AT dinucleotide steps is lowest,
the unstacking that accompanies bending
enables the enzyme to interact specifically
with GATATC sites. M.EcoRV had been
reported to bend its target DNA upon
specific binding (17) like many other DNA
MTases do as well (30-32). To investigate
the influence of the mutants investigated
here on DNA bending, we have set up an
electrophoretic mobility shift assay to detect
DNA binding. It uses two DNA fragments
of equal length that carry the EcoRV site in
the middle (M) or towards the end (E) of the
fragment. DNA bending would result in a
reduced gel mobility of the M fragment as
compared to E (33), which is what we
observed reproducibly (Fig. 4).
DNA bending by EcoRV variants - Given
the observation that K11 and R128
recognize the inner and outer base pair of
the EcoRV sequence, we wanted to
determine the effect of an exchange of one
of these residues to alanine on DNA binding
specificity and DNA bending. Therefore,
DNA binding by K11A, Q13A, R128A and
R145A was studied by gel retardation
experiments. All four proteins showed
reduced DNA binding such that higher
protein concentrations had to be used. Under
these conditions, non-specific binding was
observed as well (Fig. 4) and the specifically
shifted band was only detectable with K11A,
Q13A and R128A. However, the difference
in the relative mobility of the M and E
fragments was much smaller with the
variants (Fig. 4). This result could mean that
either specificity of DNA binding is reduced
and many complexes bind and bend at non-
specific sites or that specific binding no
longer led to DNA bending. In order to
distinguish between these alternatives, and
to derive DNA bending angles Scanning
force microscopy (SFM) experiments were
carried out.
SFM analysis of DNA binding specificity
and DNA bending - SFM experiments were
carried out in tapping mode using a 406 bp
DNA substrate containing one GATATC
site located in the center of the molecule.
Representative examples of SFM images
obtained are shown in Fig. 5; the data are
summarized in Supplemental Table 1. As
shown in Fig. 5A, the wild type enzyme
bound specifically to segment 14 which
contains the specific binding site (about 30%
of all bound proteins). Since there are 400
non-specific target sites and one specific site,
specific binding is preferred about 120 fold.
As observed previously for other nucleic
13
by guest on June 26, 2018http://w
ww
.jbc.org/D
ownloaded from

acid binding proteins, there is an additional
binding preference to segment 1 that
represents the open ends (34-36). The K11A
(Fig. 5B) and even more R128A (Fig. 5C)
variants showed reduced DNA binding.
Both variants displayed a reduced specificity,
because only about 20% all molecules were
bound to the specific site. Close inspection
of the binding profile of K11A revealed that
additional binding occurred mainly in
segments that contain degenerate NNNATC
sites (segments 2, 3, 9, 10). We could not
determine a rule describing how R128A
selects its alternative binding sites. These
results confirm a role of K11 and R128 in
specific DNA recognition by M.EcoRV.
When bending angles are determined and
plotted for protein-DNA complexes, there
was a peak at small angles below 20° and a
second peak at 59.4° ±4.3° for the wild type
and at 60.9° ±3.7° for the K11A mutant but
not for R128A indicating that R128A has
almost lost its ability to bend the DNA (Fig.
6). The SFM derived bending angle for wild
type M.EcoRV is very similar to an angle
determined previously in detailed gel
retardation and phasing analyses (61±3°)
(17). The small angle peak reflects the
intrinsic flexibility of the DNA, since it was
also observed without the addition of protein
(Fig. 6D). When only complexes showing
the specific bending of 60° were plotted
along the length of the molecule, almost all
of them were found in segment 14 for the
wild type. This result indicates that with
wild type M.EcoRV stable DNA bending
only occurs at specific sites. With K11A
bending was also observed at degenerate
NNNATC sites (segments 2, 3, 9, 10, 14,
see Fig. 7 and Suppl. Fig. 3). Therefore, the
exchange of K11 by Ala leads to relaxation
in DNA recognition and stable bending
occurs at degenerate target sites as well.
This result is in agreement with the general
loss of specificity in the interaction with the
first and third base pair observed in the
kinetic experiments.
The SFM results obtained with R128A and
K11A are in agreement with the gel
retardation analyses which indicated a loss
of the difference in the electrophoretic
mobility of the M and E substrates which
carry the GATATC sites in the middle or at
the end. In the case of R128A, this can be
explained by the general and strong
reduction of specific bending. In the case of
K11A, DNA bending occurs at the specific,
but also at additional sites. Therefore, the
influence of the position of the GATATC
sites on the electrophoretic mobility of the
DNA molecule gets smaller and both
substrates run similarly in a gel shift with
K11A.
Conclusions
14
by guest on June 26, 2018http://w
ww
.jbc.org/D
ownloaded from
Our results demonstrate that M.EcoRV
recognizes the outer base pairs of the
GATATC target site with residues
corresponding to those that recognize the
outer base pairs of the GATC target site in
the EcoDam enzyme. Hence, the EcoRV site
is recognized as an expanded EcoDam site,
with DNA bending being introduced to
shorten the distance between the outermost
base pairs of the recognition site. This
allows M.EcoRV to interact with a 6 bps site
using structural elements positioned for an
interaction with bases separated by only four
base pairs in unbend conformation (Fig. 8).
In EcoDam, the distance between Gua1 and
Cyt4 is 14.6 Å, which is already larger than
the distance required for 4 base pairs,
because EcoDam, like T4Dam, intercalates
an aromatic residue into the DNA, thereby
expanding it to a length corresponding
roughly to 5 base pairs (10,11). However,
interaction with 6 base pairs would
correspond to a further elongation of the
helix to about 17 Å in B-DNA. Taking these
numbers, geometric calculations show that
bending the DNA by 57° would be required
to bring the first and sixth base pair in
M.EcoRV in a distance of 14.6 Å. Although
this is a very rough estimate, which does not
consider the helical structure of the DNA, it
fits almost perfectly to the bending angle of
M.EcoRV observed by us and others. The
change in helical positioning of the outmost
GC base pairs by insertion of two additional
bases in the GATC sequence, may be
compensated by the unwinding that often
accompanies DNA bending. For example, in
the case of the R.EcoRV restriction enzyme,
the minor grooves sides of both guanines
point in one direction and face the body of
the enzyme (28). Given the structure of
EcoDam, we propose that the major groove
of the bent DNA will faces the protein in the
M.EcoRV-DNA complex. The interaction of
K11 and R128 with their target bases serves
as a binding clamp that enforces the bending
of the DNA. We speculate that the KPNR
insertion in the M.EcoRV sequence that
occurs at the edge of the ß-hairpin may
function as a wedge to enforce DNA
bending and allow expansion of the
recognition sequence. DNA bending could
be a general mechanism for expansion of the
recognition site of DNA methyltransferase
and restriction enzymes, like M.EcoRI and
R.EcoRV.
We could not identify base specific contacts
to the inner part of the GATATC site, which
suggests that indirect readout is operative.
The EcoRV restriction enzyme follows the
same mechanism for the recognition of the
inner AT part of the GATATC site (28).
Indirect readout of the inner base pairs of the
M.EcoRV site explains why in M.EcoRV
the T3C and T5C exchanges are most
deleterious for catalysis, although transitions
were the most well tolerated exchanges in
15
by guest on June 26, 2018http://w
ww
.jbc.org/D
ownloaded from
the EcoDam system (11). Since it is AT rich
DNA that is easily bendable, introduction of
a single CG base pair would change this
property and, thereby, interfere with
catalysis. Bending of the DNA by M.EcoRV
also explains abnormalities at the central
base pairs like strong binding of M.EcoRV
to substrates with the central bases modified
by bulky adducts (37) and the strong change
in 2-aminopurine fluorescence with GAT-2
aminopurine-TC substrates (18).
DNA bending by adenine-N6 MTases has
been also shown for M.EcoRI which bends
DNA by 51° +/-17° (31). Later, Allan and
colleagues showed that the H235D exchange
in M.EcoRI led to loss of DNA bending
which was accompanied by a 10-fold loss of
DNA and cofactor binding (38). These
results are comparable with our data for the
M.EcoRV R128A variant. The EcoRI
H235D variant showed an increase in
selectivity for the target site, which is seen
for the R128A variant here as well, because
near cognate sites were methylated with
reduced rates (with the notable exception of
C6T and partially T3G). However, the exact
molecular role of H235 in M.EcoRI could
not be elucidated.
Our results allow arranging some of steps in
enzyme DNA interaction in their temporal
order (Fig. 8). DNA MTases localize their
target site by linear diffusion (39,40).
T4Dam could be crystallized in complex
with partial recognition sites, which only
contained the TC part of the GATC site (11).
In these complexes the characteristic
bidentate hydrogen bond of R116 to the Gua
(corresponding to R128 in M.EcoRV) was
already formed. This observation suggests
that formation of this contact is an early
event of site recognition. In M.EcoRV,
removal of R128 prevents DNA bending,
which indicates that the contact precedes the
bending event. Mutation of K11 in
M.EcoRV does not prevent bending, but
rather makes it less specific suggesting that
the contact of K11 to Gua1 is formed only
after bending and that the docking of the
first part of the recognition site to K11 is
used to discriminate bending at target and
near cognate sites. If this docking is less
tight, the overall efficiency of bending at the
specific site is reduced (compare 42% of all
complexes bound at the specific site for
K11A with 54 % for wild type). In addition,
the K11A forms a more stable interaction
with bend DNA at NNNATC sites than wild
type M.EcoRV, where bending at non-
GATATC sites was not detectable.
In summary, our data shed light on the
mechanism of molecular evolution that leads
to changes in the DNA recognition
specificity of DNA interacting enzymes.
Furthermore, they show the temporal order
of molecular event associated with DNA
16
by guest on June 26, 2018http://w
ww
.jbc.org/D
ownloaded from

17
recognition by M.EcoRV which likely can
be generalized to other enzymes of the
EcoDam family.
Acknowledgements. This work has been
supported by the DFG (JE252/2 and
JE252/5).
by guest on June 26, 2018http://w
ww
.jbc.org/D
ownloaded from
References
1. Garvie, C. W., and Wolberger, C. (2001) Mol Cell 8(5), 937-946 2. Cheng, X. (1995) Annu. Rev. Biophys. Biomol. Struct. 24, 293-318 3. Cheng, X., and Roberts, R. J. (2001) Nucleic Acids Res. 29(18), 3784-3795. 4. Jeltsch, A. (2002) ChemBioChem 3, 274-293 5. Lee, S. W., Cho, B. H., Park, S. G., and Kim, S. (2004) J Cell Sci 117(Pt 17),
3725-3734 6. Singer, B., and Hang, B. (1997) Chem Res Toxicol 10(7), 713-732 7. Pingoud, A., and Jeltsch, A. (2001) Nucleic Acids Res 29(18), 3705-3727 8. Seeman, N. C., Rosenberg, J. M., and Rich, A. (1976) Proc Natl Acad Sci U S A
73(3), 804-808 9. Travers, A. A. (1989) Annu Rev Biochem 58, 427-452 10. Horton, J. R., Liebert, K., Bekes, M., Jeltsch, A., and Cheng, X. (2006) J Mol Biol
358(2), 559-570 11. Horton, J. R., Liebert, K., Hattman, S., Jeltsch, A., and Cheng, X. (2005) Cell
121(3), 349-361 12. Yang, Z., Horton, J. R., Zhou, L., Zhang, X. J., Dong, A., Zhang, X., Schlagman,
S. L., Kossykh, V., Hattman, S., and Cheng, X. (2003) Nat. Struct. Biol. 10(10), 849-855
13. Nwosu, V. U., Connolly, B. A., Halford, S. E., and Garnett, J. (1988) Nucleic Acids Res 16(9), 3705-3720
14. Lauster, R., Kriebardis, A., and Guschlbauer, W. (1987) FEBS Lett 220(1), 167-176
15. Roth, M., Helm-Kruse, S., Friedrich, T., and Jeltsch, A. (1998) J. Biol. Chem. 273, 17333-17342
16. Jeltsch, A., Roth, M., and Friedrich, T. (1999) J. Mol. Biol. 285, 1121-1130 17. Cal, S., and Connolly, B. A. (1996) J Biol Chem 271(2), 1008-1015 18. Gowher, H., and Jeltsch, A. (2000) J. Mol. Biol. 303, 93-110 19. Szczelkun, M. D., and Connolly, B. A. (1995) Biochemistry 34(34), 10724-10733 20. Beck, C., Cranz, S., Solmaz, M., Roth, M., and Jeltsch, A. (2001) Biochemistry
40(37), 10956-10965. 21. Beck, C., and Jeltsch, A. (2002) Biochemistry 41(48), 14103-14110 22. Jeltsch, A., and Lanio, T. (2002) Methods Mol. Biol. 182, 85-94 23. Friedrich, T., Roth, M., Helm-Kruse, S., and Jeltsch, A. (1998) Biol Chem 379(4-
5), 475-480 24. Roth, M., and Jeltsch, A. (2000) Biol. Chem. 381, 269-272 25. Jeltsch, A., Friedrich, T., and Roth, M. (1998) J Mol Biol 275(5), 747-758 26. Fersht, A. (1998) Structure and Mechanism in Protein Science, W.H. Freeman
and Company, New York 27. Liebert, K., Horton, J. R., Chahar, S., Orwick, M., Cheng, X., and Jeltsch, A.
(2007) J Biol Chem, in press 28. Winkler, F. K., Banner, D. W., Oefner, C., Tsernoglou, D., Brown, R. S.,
Heathman, S. P., Bryan, R. K., Martin, P. D., Petratos, K., and Wilson, K. S. (1993) Embo J 12(5), 1781-1795
18
by guest on June 26, 2018http://w
ww
.jbc.org/D
ownloaded from

29. Stöver, T., Kohler, E., Fagin, U., Wende, W., Wolfes, H., and Pingoud, A. (1993) J Biol Chem 268(12), 8645-8650
30. Dubey, A. K., and Bhattacharya, S. K. (1997) Nucleic Acids Res 25(10), 2025-2029
31. Garcia, R. A., Bustamante, C. J., and Reich, N. O. (1996) Proc Natl Acad Sci U S A 93(15), 7618-7622
32. Rasko, T., Finta, C., and Kiss, A. (2000) Nucleic Acids Res 28(16), 3083-3091 33. Hagerman, P. J. (1990) Annu Rev Biochem 59, 755-781 34. Bonin, M., Oberstrass, J., Lukacs, N., Ewert, K., Oesterschulze, E., Kassing, R.,
and Nellen, W. (2000) Rna 6(4), 563-570 35. Bonin, M., Oberstrass, J., Vogt, U., Wassenegger, M., and Nellen, W. (2001) Biol
Chem 382(8), 1157-1162 36. Klaue, Y., Kallman, A. M., Bonin, M., Nellen, W., and Ohman, M. (2003) Rna
9(7), 839-846 37. Cal, S., and Connolly, B. A. (1997) J Biol Chem 272(1), 490-496 38. Allan, B. W., Garcia, R., Maegley, K., Mort, J., Wong, D., Lindstrom, W.,
Beechem, J. M., and Reich, N. O. (1999) J Biol Chem 274(27), 19269-19275 39. Surby, M. A., and Reich, N. O. (1996) Biochemistry 35(7), 2201-2208 40. Urig, S., Gowher, H., Hermann, A., Beck, C., Fatemi, M., Humeny, A., and
Jeltsch, A. (2002) J Mol Biol 319(5), 1085-1096
19
by guest on June 26, 2018http://w
ww
.jbc.org/D
ownloaded from
Figure legends
Fig. 1: Sequence and structure comparisons of M.EcoRV and EcoDam.
A) Multiple sequence alignment of M.EcoRV (GATATC) with members of the EcoDam family
(all GATC). Important residues in M.EcoRV and EcoDam are labeled.
B) Schematic figure of the DNA contacts of EcoDam (10,11).
C) Possible alignments of the recognition sequences of M.EcoRV and EcoDam.
D) Crystal structure of EcoDam complexed with DNA. The amino acid residues making specific
contacts to recognized bases are represented in a space fill mode and colored in dark grey.
Fig. 2: Relative rates of methylation of various substrates by M.EcoRV and M.EcoRV variants.
A) Principle of the double mutant cycle approach for the identification of protein-DNA contacts
applied here. In this example removal of amino acid D will abolish recognition of the Z base.
This means that the specificity of the variant on near-cognate substrates in which the 4th base pair
is altered is lost. In contrast, recognition of the W, X and Y bases becomes more specific.
B) Catalytic activity of M.EcoRV and its variants on the canonical GATATC substrate. Rates are
given relative to the wild-type enzyme activity.
C, D) DNA methylation specificities of M.EcoRV and its variants. In these panels, all activities
were given in comparison to the methylation activity with the canonical substrate. Rates are given
relative to the GATATC substrate. The y-axis is scaled to reflect the detection limit of activity in
the individual experiments.
All results in B-D are averaged over 3-5 independent experiments, the error bars denote the
standard error of the mean.
Fig. 3: Specificity factors of M.EcoRV and M.EcoRV variants. Specificity factors are given
relative to the wild type enzyme. An increase in specificity is indicated by S>1, loss of specificity
by S<1. For bars marked by * or ↑, no activity was detectable with the variant. In cases marked
by ↑, the lower detection limit of the variants’ activity was used to calculate a lower estimate for
the increase in specificity. In cases marked by the * no bar is shown, because the relative activity
of the wild type with this substrate was below the detection limit of activity for the variant.
20
by guest on June 26, 2018http://w
ww
.jbc.org/D
ownloaded from
Fig. 4: DNA binding and bending analysis by gel retardation experiments.
A) Gel retardation analysis of DNA binding and bending by M.EcoRV and M.EcoRV variants.
The experiments were carried out with two DNA substrates of equal length, each bearing a single
M.EcoRV site which was located centrally in the fragment labeled with M (“middle”) and
towards the end of the molecule in the fragment labeled with E (“end”).
B) Quantitative analysis of the relative mobility of the E and M fragments in 3-5 independent gels.
For each experiment, µE and µM were determined and their ratio plotted in the figure as one line.
The thicker line labeled with an asterisk represents the average value.
Fig. 5: Distribution of M.EcoRV wild type and mutant enzymes on the substrate containing the
GATATC binding site in the center (segment 14). Enzymes bound to segments 1 to 13 are bound
to one of the corresponding segments on either arm. In A) the DNA molecule is schematically
shown with the GATATC site at segment 14 being depicted by a grey box, and positions of
degenerate EcoRV sites represented by black balls for NNNATC sites, diamonds for NATATC
sites and triangle for GATC sites.
A) Distribution of wild type enzyme, B) of mutant K11A and C) of mutant R128A. The total
numbers of counted protein molecules are given in for each variant. Representative SFM images
of wild type M.EcoRV, K11A and R128A mutant protein bound to the DNA substrate are shown
on the right-hand site of each plot. In each case the height is 8 nm and the bar is 100 nm.
Fig. 6: DNA bending angle distribution of M.EcoRV and its variants determined at all binding
positions. For the wild type (A) and for mutant K11A (B) a peak at 60° bending was observed in
addition to a peak between 0° and 20°. No 60° peak was found for mutant R128A (C) and for
DNA molecules incubated without enzyme (D). In the control without protein, bending was only
measured in the center of the DNA molecule.
21
by guest on June 26, 2018http://w
ww
.jbc.org/D
ownloaded from

Fig. 7: The position of all complexes displaying a bending by 60° is plotted along the length of
the DNA molecule. For the wild type (A), 60° bending is mainly seen in segment 14, while the
mutant K11A (B) binds and bends in additional segments containing close to cognate binding
sites (GAT). The DNA molecule is schematically shown in (A) with the GATATC site at
segment 14 being depicted by a grey box, and positions of degenerate EcoRV sites represented by
black balls for NNNATC sites, diamonds for NATATC sites and triangle for GATC sites.
Fig. 8: Schematic summary of the results.
A) Model to explain the expansion of target site by DNA bending in the evolution from 4 to 6
base pair recognizing enzyme.
B) Reaction mechanism of M.EcoRV. The enzyme searches for its target site by linear diffusion.
It pauses at NNNATC sites, initiates DNA bending and contacts the first part of the recognition
sequence. If the sequence matches the catalytic cycle will continue. The K11A lacks one contact
to the first part of the recognition sequence. Hence DNA bending is less efficient and it becomes
less specific. R128A lacks one contact to the second part of the recognition sequence. Therefore,
the efficiency of recognition of NNNATC sites and initiation of DNA bending is reduced.
22
by guest on June 26, 2018http://w
ww
.jbc.org/D
ownloaded from
Figures
Fig. 1:
K11 Q13 K18
R128 P138 R145
ß-hairpinR124 P134 Y138 (T4dam: R130)
K9
A
5’ G A T C 3’3’ C T mA G 5’
R124
K9
P134
L122
B Possible alignments of the recognition sequen-ces of EcoDam and M.EcoRV
GATATCGATCGATATCGATC
GATATCGATC
GATATCGATC
GATATCGA TCGATATCGA TC
CDNA recognitionby EcoDam D
G A T CK9 P134 R124
Crystal structure of EcoDam complexedwith DNA
23
by guest on June 26, 2018http://w
ww
.jbc.org/D
ownloaded from

Fig. 2:
Wild type M.EcoRV
0.001
0.01
0.1
1
L20
G1A G1T
G1C T3G
T3A
T3C
A4G A4
TA
4C T5G
T5A
T5C
C6T
Wild type M.EcoRV
0.001
0.01
0.1
1
L20
G1A G1T
G1C T3G
T3A
T3C
A4G A4
TA
4C T5G
T5A
T5C
C6T
Methylation of GATATC substrates
0
0.4
0.8
1.2
wt
K11
A
K18
A
Q13
A
R12
8A
P138
A
R14
5A
Methylation of GATATC substrates
0
0.4
0.8
1.2
wt
K11
A
K18
A
Q13
A
R12
8A
P138
A
R14
5A
0.001
0.01
0.1
1
L20
G1A G1T
G1C T3G
T3A
T3C
A4G A4T
A4C T5G
T5A
T5C
C6T
Q13A
0.001
0.01
0.1
1
L20
G1A G1T
G1C T3G
T3A
T3C
A4G A4T
A4C T5G
T5A
T5C
C6T
Q13A
0.001
0.01
0.1
1
L20
G1A G1T
G1C T3G
T3A
T3C
A4G
A4T
A4C
T5G
T5A
T5C
C6T
K11A
0.001
0.01
0.1
1
L20
G1A G1T
G1C T3G
T3A
T3C
A4G
A4T
A4C
T5G
T5A
T5C
C6T
K11A
0.001
0.01
0.1
1
L20
G1A G1T
G1C T3G
T3A
T3C
A4G
A4T
A4C T5G
T5A
T5C
C6T
R145A
0.001
0.01
0.1
1
L20
G1A G1T
G1C T3G
T3A
T3C
A4G
A4T
A4C T5G
T5A
T5C
C6T
R145A
0.001
0.01
0.1
1
L20
G1A G1T
G1C T3G
T3A
T3C
A4T
A4C
T5G
T5A
T5C
C6T
P138A
0.001
0.01
0.1
1
L20
G1A G1T
G1C T3G
T3A
T3C
A4T
A4C
T5G
T5A
T5C
C6T
P138A
0.01
0.1
1
L20
G1A
G1T
G1C T3G
T3A
T3C
A4G
A4T
A4C
T5G
T5A
T5C
C6T
R128A
0.01
0.1
1
L20
G1A
G1T
G1C T3G
T3A
T3C
A4G
A4T
A4C
T5G
T5A
T5C
C6T
R128A
K18A
0.001
0.01
0.1
1
L20
G1A G1T
G1C T3G
T3A
T3C
A4G
A4T
A4C
T5G
T5A
T5C
C6T
K18A
0.001
0.01
0.1
1
L20
G1A G1T
G1C T3G
T3A
T3C
A4G
A4T
A4C
T5G
T5A
T5C
C6T
A B C D| | | |W X Y Z
A B C □| | |W X Y Z
recognition of Z is lost
A B C □| |
□ X Y Zrecognition of W, X and
Y is more stringent(synergistic effects)
A)
B) C)
D)
24
by guest on June 26, 2018http://w
ww
.jbc.org/D
ownloaded from
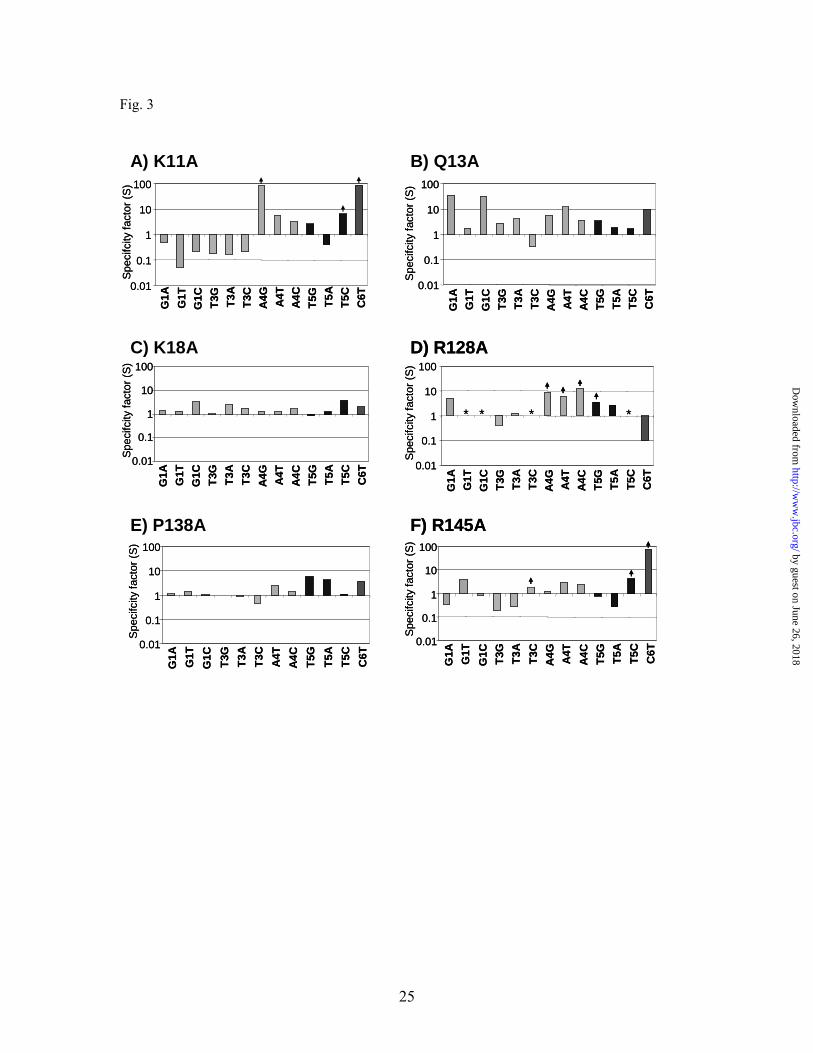
Fig. 3
A) K11A B) Q13A
C) K18A
E) P138A
0.01
0.1
1
10
100
G1A G1T
G1C T3G
T3A
T3C
A4G A4T
A4C T5G
T5A
T5C
C6T
Spe
cifc
ityfa
ctor
(S)
0.01
0.1
1
10
100
G1A G1T
G1C T3G
T3A
T3C
A4G A4T
A4C T5G
T5A
T5C
C6T
Spe
cifc
ityfa
ctor
(S)
0.01
0.1
1
10
100
G1A
G1T
G1C T3G
T3A
T3C
A4G A4T
A4C
T5G
T5A
T5C
C6T
Spec
ifcity
fact
or (S
)
0.01
0.1
1
10
100
G1A
G1T
G1C T3G
T3A
T3C
A4G A4T
A4C
T5G
T5A
T5C
C6T
Spec
ifcity
fact
or (S
)
0.01
0.1
1
10
100
G1A G1T
G1C T3G
T3A
T3C
A4G A4T
A4C T5G
T5A
T5C
C6T
Spec
ifcity
fact
or (S
)
0.01
0.1
1
10
100
G1A G1T
G1C T3G
T3A
T3C
A4G A4T
A4C T5G
T5A
T5C
C6T
Spec
ifcity
fact
or (S
)
0.01
0.1
1
10
100
G1A G1T
G1C T3G
T3A
T3C
A4T
A4C T5G
T5A
T5C
C6T
Spe
cifc
ityfa
ctor
(S)
0.01
0.1
1
10
100
G1A G1T
G1C T3G
T3A
T3C
A4T
A4C T5G
T5A
T5C
C6T
Spe
cifc
ityfa
ctor
(S)
D) R128A
0.01
0.1
1
10
100
G1A G1T
G1C T3G
T3A
T3C
A4G A4T
A4C T5G
T5A
T5C
C6T
Spe
cifc
ityfa
ctor
(S)
* * * *
D) R128A
0.01
0.1
1
10
100
G1A G1T
G1C T3G
T3A
T3C
A4G A4T
A4C T5G
T5A
T5C
C6T
Spe
cifc
ityfa
ctor
(S)
* * * *
F) R145A
0.01
0.1
1
10
100
G1A G1T
G1C T3G
T3A
T3C
A4G A4T
A4C T5G
T5A
T5C
C6T
Spe
cifc
ityfa
ctor
(S)
F) R145A
0.01
0.1
1
10
100
G1A G1T
G1C T3G
T3A
T3C
A4G A4T
A4C T5G
T5A
T5C
C6T
Spe
cifc
ityfa
ctor
(S)
25
by guest on June 26, 2018http://w
ww
.jbc.org/D
ownloaded from
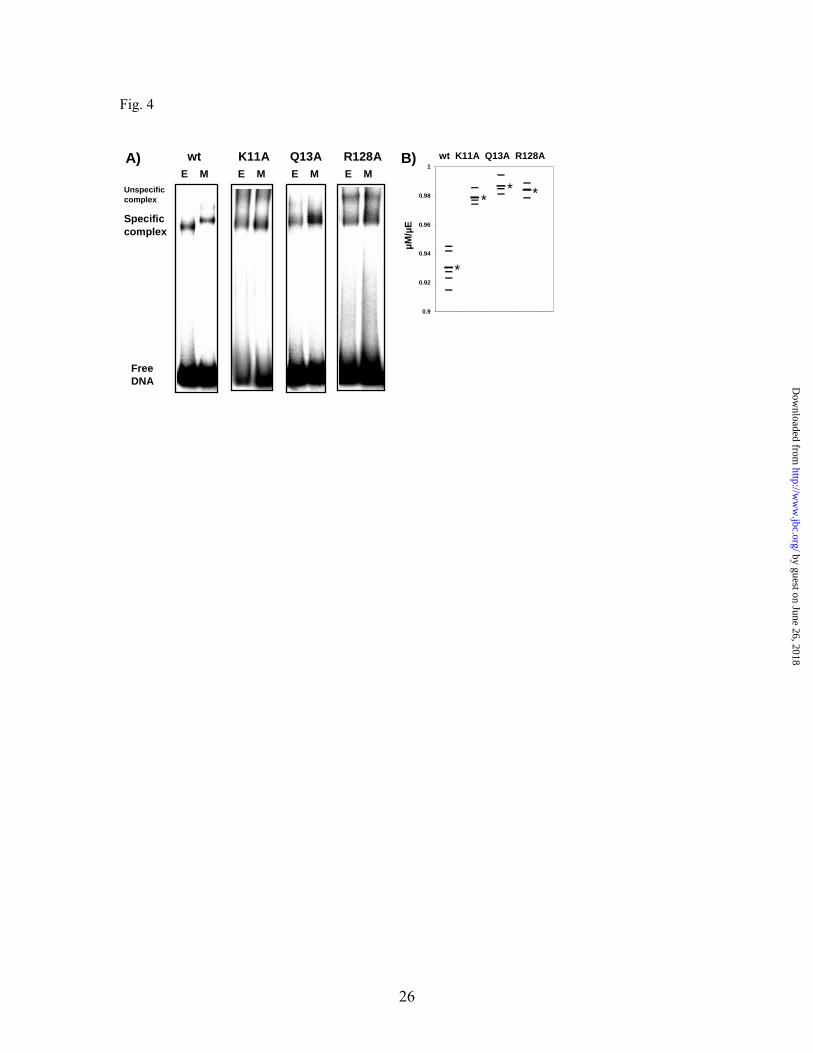
Fig. 4
0.9
0.92
0.94
0.96
0.98
1
µM/µ
E
wt K11A Q13A R128AA) B)wt Q13A R128AK11A
FreeDNA
Specific complex
Unspecificcomplex
E M E M E M E M
*
** *
26
by guest on June 26, 2018http://w
ww
.jbc.org/D
ownloaded from
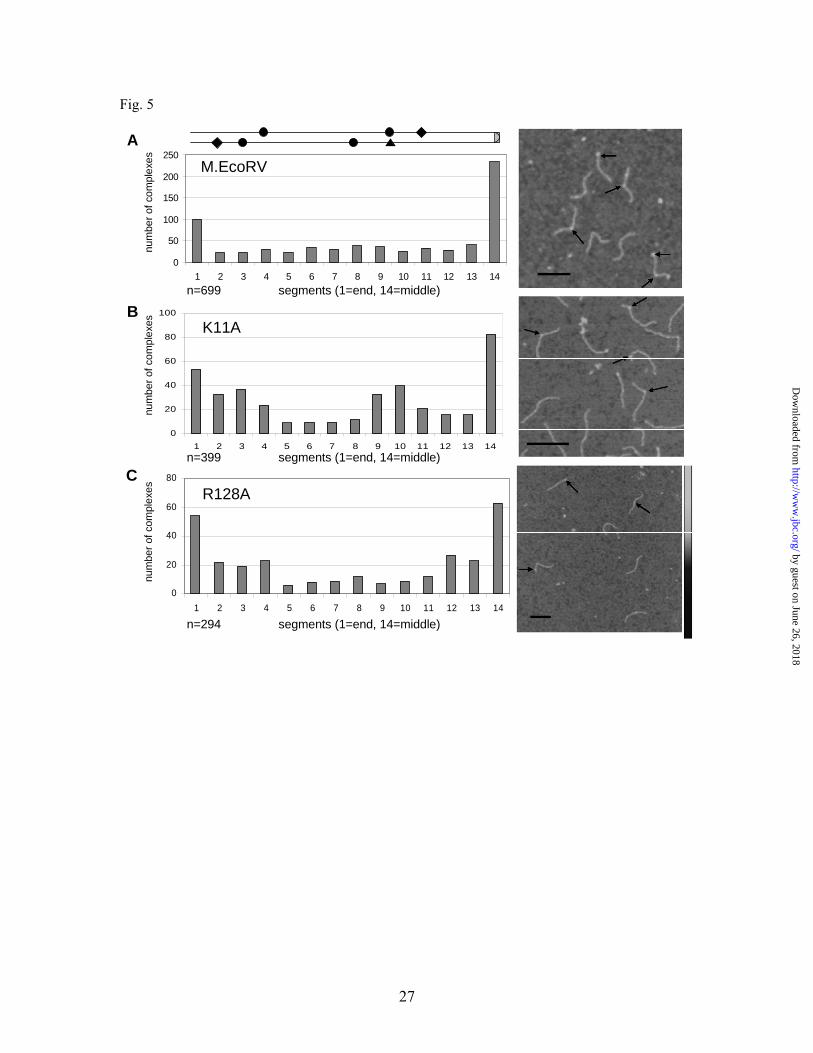
Fig. 5
0
50
100
150
200
250
1 2 3 4 5 6 7 8 9 10 11 12 13 14
M.EcoRV
n=699 segments (1=end, 14=middle)
Anu
mbe
r of c
ompl
exes
0
20
40
60
80
100
1 2 3 4 5 6 7 8 9 10 11 12 13 14n=399 segments (1=end, 14=middle)
K11AB
num
ber o
f com
plex
es
0
20
40
60
80
1 2 3 4 5 6 7 8 9 10 11 12 13 14
R128A
n=294 segments (1=end, 14=middle)
C
num
ber o
f com
plex
es
27
by guest on June 26, 2018http://w
ww
.jbc.org/D
ownloaded from

Fig. 6
M.EcoRV n=693A
num
ber o
f com
plex
es
030
6090
120150
180
0-5
10-1
5
20-2
5
30-3
5
40-4
5
50-5
5
60-6
5
70-7
5
80-8
5
90-9
5
100-
105
110-
115
120-
125
130-
135
140-
145
K11A n=399B
num
ber o
f com
plex
es
0
20
40
60
80
100
0-5
10-1
5
20-2
5
30-3
5
40-4
5
50-5
5
60-6
5
70-7
5
80-8
5
90-9
5
100-
105
110-
115
120-
125
130-
135
140-
145
C
num
ber o
f com
plex
es
bending angle (°)
D
num
ber o
f com
plex
es
R128A n=294
0
2040
60
80100
120
0-5
10-1
5
20-2
5
30-3
5
40-4
5
50-5
5
60-6
5
70-7
5
80-8
5
90-9
5
100-
105
110-
115
120-
125
130-
135
140-
145
0
10
20
30
40
50without enzyme n=149
0-5
10-1
5
20-2
5
30-3
5
40-4
5
50-5
5
60-6
5
70-7
5
80-8
5
90-9
5
100-
105
110-
115
120-
125
130-
135
140-
145
28
by guest on June 26, 2018http://w
ww
.jbc.org/D
ownloaded from
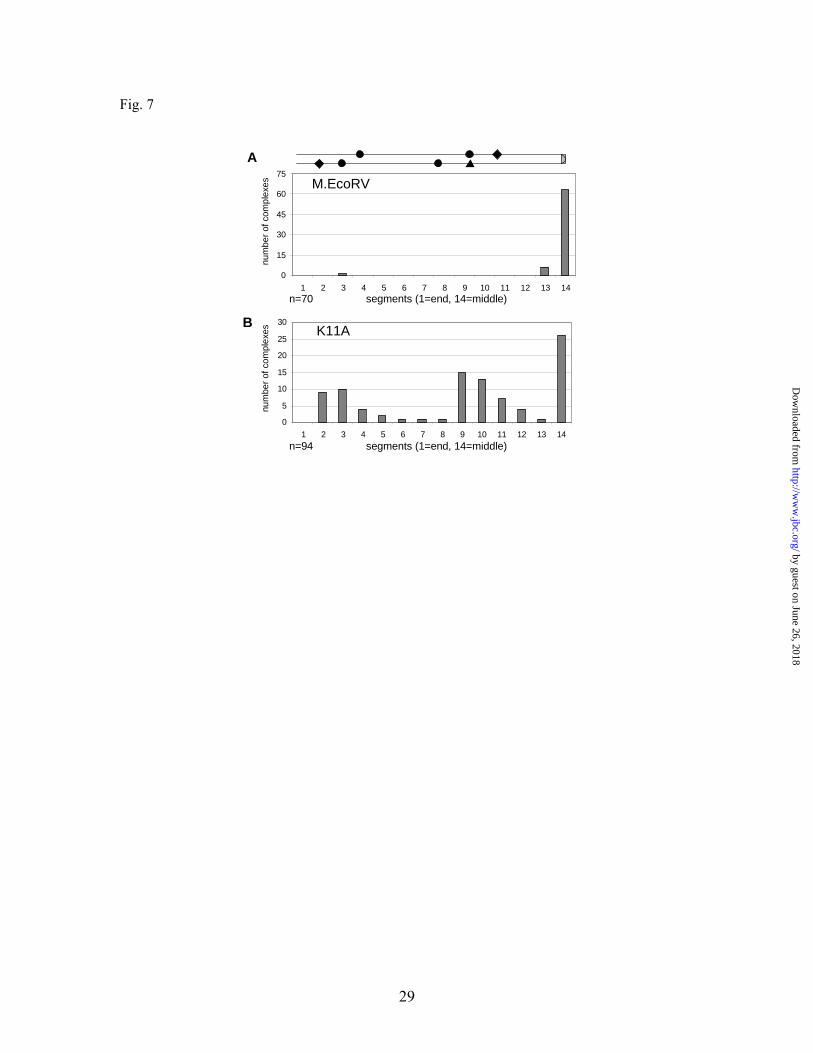
Fig. 7
M.EcoRV
n=70 segments (1=end, 14=middle)
0
5
10
15
20
25
30
1 2 3 4 5 6 7 8 9 10 11 12 13 14
K11A
n=94 segments (1=end, 14=middle)
B
num
ber o
f com
plex
esnu
mbe
r of c
ompl
exes
A
0
15
30
45
60
75
1 2 3 4 5 6 7 8 9 10 11 12 13 14
29
by guest on June 26, 2018http://w
ww
.jbc.org/D
ownloaded from

Fig. 8
EcoDam
G A T CK P R
G A T A T C
K P R
M.EcoRV
K P R
M.EcoRV
G A T A T C
K
PR
M.EcoRVK
PR
M.EcoRV
G A T
A T C
K
PR
M.EcoRVG A T
A T C
K
PR
M.EcoRVK
PR
M.EcoRV
N N N A T C
K
PR
M.EcoRVK
PR
M.EcoRV
N N N
A T C
K
PR
M.EcoRVN N N
A T C
K
PR
M.EcoRVK
PR
M.EcoRV
Base flipping, DNA methylationand product release
G A T A T C N N N A T C
K
PR
M.EcoRVK
PR
M.EcoRV
A B
30
by guest on June 26, 2018http://w
ww
.jbc.org/D
ownloaded from
Supplemental information
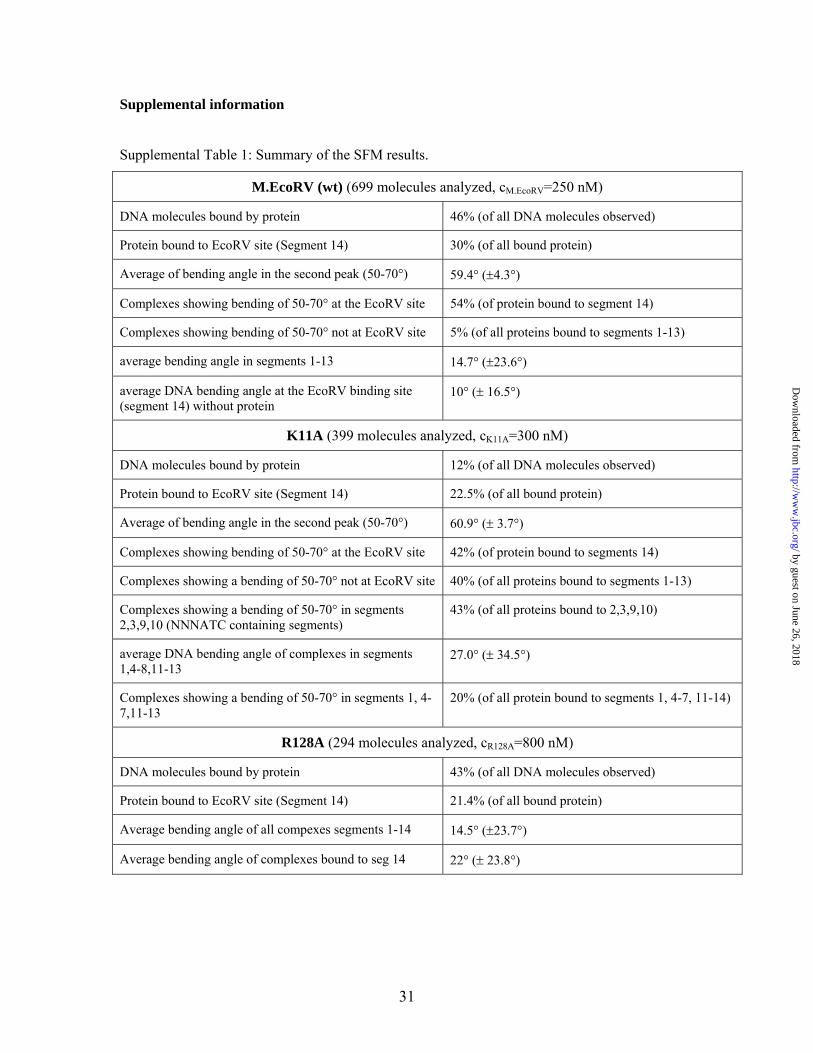
Supplemental Table 1: Summary of the SFM results.
M.EcoRV (wt) (699 molecules analyzed, cM.EcoRV=250 nM)
DNA molecules bound by protein 46% (of all DNA molecules observed)
Protein bound to EcoRV site (Segment 14) 30% (of all bound protein)
Average of bending angle in the second peak (50-70°) 59.4° (±4.3°)
Complexes showing bending of 50-70° at the EcoRV site 54% (of protein bound to segment 14)
Complexes showing bending of 50-70° not at EcoRV site 5% (of all proteins bound to segments 1-13)
average bending angle in segments 1-13 14.7° (±23.6°)
average DNA bending angle at the EcoRV binding site (segment 14) without protein
10° (± 16.5°)
K11A (399 molecules analyzed, cK11A=300 nM)
DNA molecules bound by protein 12% (of all DNA molecules observed)
Protein bound to EcoRV site (Segment 14) 22.5% (of all bound protein)
Average of bending angle in the second peak (50-70°) 60.9° (± 3.7°)
Complexes showing bending of 50-70° at the EcoRV site 42% (of protein bound to segments 14)
Complexes showing a bending of 50-70° not at EcoRV site 40% (of all proteins bound to segments 1-13)
Complexes showing a bending of 50-70° in segments 2,3,9,10 (NNNATC containing segments)
43% (of all proteins bound to 2,3,9,10)
average DNA bending angle of complexes in segments 1,4-8,11-13
27.0° (± 34.5°)
Complexes showing a bending of 50-70° in segments 1, 4-7,11-13
20% (of all protein bound to segments 1, 4-7, 11-14)
R128A (294 molecules analyzed, cR128A=800 nM)
DNA molecules bound by protein 43% (of all DNA molecules observed)
Protein bound to EcoRV site (Segment 14) 21.4% (of all bound protein)
Average bending angle of all compexes segments 1-14 14.5° (±23.7°)
Average bending angle of complexes bound to seg 14 22° (± 23.8°)
31
by guest on June 26, 2018http://w
ww
.jbc.org/D
ownloaded from
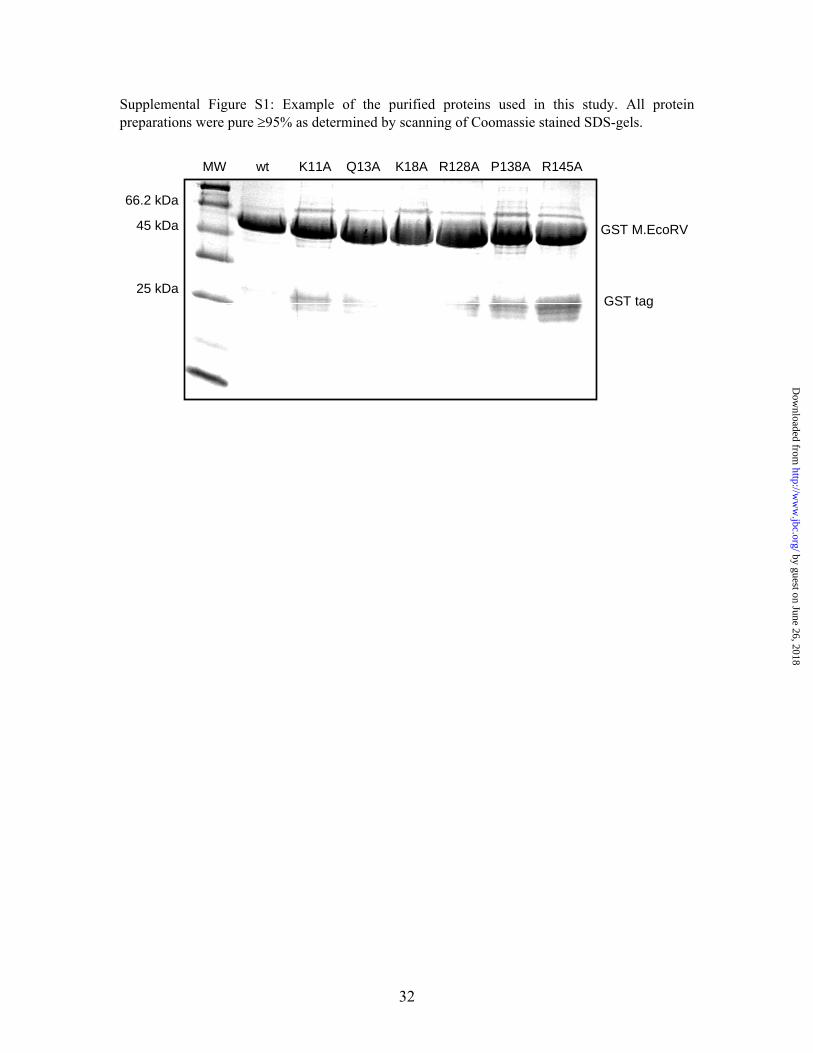
Supplemental Figure S1: Example of the purified proteins used in this study. All protein preparations were pure ≥95% as determined by scanning of Coomassie stained SDS-gels.
MW wt K11A Q13A K18A R128A P138A R145A
66.2 kDa
45 kDa
25 kDa
GST M.EcoRV
GST tag
32
by guest on June 26, 2018http://w
ww
.jbc.org/D
ownloaded from
Supplemental Figure S2: Examples of the kinetic data used to calculate the data shown in Figs. 2
and 3.
GATATC
C6TG1AT3A
0
250
500
750
1000
1250
0 5 10 15 20
Time, min
CPM
0
1000
2000
3000
4000
5000
6000
0 5 10 15 20Time, min
CPM
0
1000
2000
3000
4000
5000
6000
0 5 10 15 20
Time, min
CPM
0
1000
2000
3000
4000
5000
6000
0 5 10 15 20Time, min
CPM
GATATC
A4CC6TT5G
0
40
80
120
160
200
240
0 5 10 15 20
Time, min
CPM
0
1000
2000
3000
4000
5000
6000
0 5 10 15 20Time, min
CPM
0
300
600
900
1200
1500
0 5 10 15 20Time, min
CP
M
GATATC
G1AT3AC6T
GATATC
G1AT3AC6T
GATATC
T3AG1AC6T
GATATC
C6T
T5GA4C
GATATC
A4C
C6TT5G
wt wt
K11A R128A
P138AQ13A
R145A
33
by guest on June 26, 2018http://w
ww
.jbc.org/D
ownloaded from

Supplemental Figure S3: DNA bending of K11A at EcoRV sites half sites (NNNATC). The
distribution of bending angles observed with K11A is compared for enzyme molecules bound at
the specific site (A), bound at NNNATC sites (B) and bound at unrelated sites (C).
0
20
40
60
80
100
0 10 20 30 40 50 60 70 80 90 100
110
120
130
140
n=316 bending angle (°)
DNA bending in segments 1-13
0
20
40
60
80
100
0 10 20 30 40 50 60 70 80 90 100
110
120
130
140
n=316 bending angle (°)
DNA bending in segments 1-13
0
10
20
30
40
0 10 20 30 40 50 60 70 80 90 100
110
120
130
140
n=143 bending angle (°)
Segments containing NNNATC sites (2,3,9,10)
0
10
20
30
40
0 10 20 30 40 50 60 70 80 90 100
110
120
130
140
n=143 bending angle (°)
Segments containing NNNATC sites (2,3,9,10)
0
15
30
45
60
75
0 10 20 30 40 50 60 70 80 90 100
110
120
130
140
n=173 bending angle (°)
Segments without NNNATC sites (1, 4-8, 11-13)
0
15
30
45
60
75
0 10 20 30 40 50 60 70 80 90 100
110
120
130
140
n=173 bending angle (°)
Segments without NNNATC sites (1, 4-8, 11-13)
A
B
C
34
by guest on June 26, 2018http://w
ww
.jbc.org/D
ownloaded from

Tomasz P. Jurkowski, Nils Anspach, Liliya Kulishova, Wolfgang Nellen and Albert Jeltschrecognition of an expanded ecodam recognition site
The M.EcoRV DNA-(adenine N6)-methyltransferase uses DNA bending for
published online October 31, 2007J. Biol. Chem.
10.1074/jbc.M706933200Access the most updated version of this article at doi:
Alerts:
When a correction for this article is posted•
When this article is cited•
to choose from all of JBC's e-mail alertsClick here
Supplemental material:
http://www.jbc.org/content/suppl/2007/11/08/M706933200.DC1
by guest on June 26, 2018http://w
ww
.jbc.org/D
ownloaded from