Embed Size (px)
Citation preview
Abstract—This study introduces an objective measurement of
budgetary slack based on ex post measure of firm’s annual
budget achievability with the exclusion of earnings management
through discretionary accruals rather than the traditional
subjective measurement based on management’s perceptions.
Also, this study empirically examines the association between
budgetary slack and its determinants under various budgetary
slack measurements. This study uses data from survey
questionnaires and data from the annual financial statements
for the year ended 2009 of listed non-financial and
non-rehabilitation companies in Thailand. The population
covers 387 firms and there are 38 returned and usable
questionnaires which is 10% response rate. Although the
objective measurement of budgetary slack is statistically found
to be positively related to the traditional subjective
measurement, the suggested objective measurement is
considered to be a superior one. Moreover, the association
between budgetary slack and its determinants is relatively
sensitive to the measurements of budgetary slack.
Index Terms—Budget achievability, budgetary slack,
discretionary accruals, earnings management.
I. INTRODUCTION
Although budgeting is the cornerstone of the management
planning and control processes in nearly all organizations and
is widely used, it is far from perfect. When organizations use
budgets for performance evaluation, traditional budget-based
compensation plans provide economic incentives for
subordinates to misrepresent their productivity and build
slack into the budgets. The slack then creates budget bias and
can reduce firms’ profits due to costly planning errors and
greater compensation or perquisite consumption for
subordinates.
Budgetary slack is created by managers who can manage
to conceal some private information from their supervisors
and deliberately misrepresent that information in order to
maximize their own utility through the introduction of slack.
Budgetary slack in this paper is defined as the subordinates’
intentional biasing of performance targets below their
expected levels which is consistent with [1]. Empirical
evidence suggests that, in most entities, significant amounts
of budgetary slack exist. Ref. [2], [3] Examine the
determinants of budgetary slack and also report that, on
average, manufacturing companies in Thailand have
moderate level of budgetary slack.
Manuscript received September 10, 2013; revised November 11, 2013.
P. Damrongsukniwat and D. Kunpanitchakit are with the Department of
Accounting, Faculty of Business Administration, Kasetsart University,
Bangkok, Thailand (e-mail: [email protected]).
S. Durongwatana is with the Department of Statistics, Faculty of
Commerce and Accountancy, Chulalongkorn University, Bangkok,
Thailand.
Traditional budgetary slack measurements are subjective
measures based on respondents’ subjective view, i.e.,
―managers’ perception of the target achievability‖. These
types of measurements have long been proposed and utilized
in most budgetary slack studies even though they possess
drawback, e.g., respondents may have different perceptions
under the same environment. As such, an objective
measurement of budgetary slack based on numerically
measurable and insensitive to each respondent’s perception is
sought to ensure its reliability. Nevertheless, budgetary slack
is not directly observable. Thus, this study intends to propose
an objective measurement of budgetary slack in the hope to
improve the reliability and the quality of such.
This study employs both primary data from mailed survey
questionnaires and secondary data from the annual financial
statements in the analysis. The sampled firms are companies
listed on the Stock Exchange of Thailand (SET) and the
Market for Alternative Investment (MAI) as of the year
ended 2009, all of which use budget for performance
evaluation. This study excludes companies in financial
industry and companies under rehabilitation for the reason
that their financial reporting requirements and their
characteristics of business operation are different. Survey
data on budget figures of the year 2009, perceived budget
achievability, and all determinant factors are gleaned from
the management at the corporate level of the listed companies
to match their companies’ annual financial statements. The
final set of samples in this study consists of 38 firms,
representing 10% of the total population (387 firms). The
small sample size is due to the difficulty in obtaining the
firm’s internal and confidential data.
Generally, the results show that the suggested objective
measurement of budgetary slack is significantly, positively
correlated (r = 0.58, p < 0.01) with the subjective
measurement (reversed score of perceived difficulty of
budget achievability); however, the correlation between the
suggested objective measurement and another subjective
measurement (perceived ease of budget achievability) is
insignificant. Although the objective and the subjective
measurement of budgetary slack are significantly and
positively correlated, we still believe that the objective
approach of budgetary slack measurement suggested in this
study do provide another objective measurement of slack.
The inconclusive results of the association between
budgetary slack and its determinants in prior research might
result from the different measures of budgetary slack.
Therefore, this study empirically examines the association
between budgetary slack and its determinants by comparing
the objective and the subjective slack measurements. The
empirical results in our study corroborate the fact that the
association between budgetary slack and its determinants is
sensitive to slack measurements.
The Measurements of Budgetary Slack: The Empirical
Evidence of Listed Companies in Thailand
Pornpan Damrongsukniwat, Danuja Kunpanitchakit, and Supol Durongwatana
DOI: 10.7763/JOEBM.2015.V3.188 244
Journal of Economics, Business and Management, Vol. 3, No. 2, February 2015
This study contributes to prior literature by adding to it an
objective measurement of budgetary slack as prior survey
studies usually measure slack from a subjective view,
although it is a perceptual dependent variable. Besides, this
study empirically examines the association between
budgetary slack and its determinants by comparing the
objective and the subjective slack measurements which the
results reveal that the association between budgetary slack
and its determinants is sensitive to the measurements of slack,
i.e., subjective and objective measurements or even between
the two subjective measurements.
II. LITERATURE REVIEW
A. Budgetary Slack
Budgetary slack has been defined in the literature under a
variety of ways, e.g., it can be defined as the intentional
biasing of performance targets below their expected levels
[1]; the consumption of organizational resources by
employees in excess of what is required [4]; the amount by
which managers overstate their needs for resources to
complete a task or understate their productive capability
when given the opportunity to influence the standard against
which their performance will be evaluated [5]; and the
difference between the subjects’ expected performance and
chosen budget [6].
Consistent with [1], the definition of budgetary slack in
this study is the subordinates’ intentional biasing of
performance targets below their expected levels.
Budgetary slack creation often takes place when tight
results controls are in use. That is, when employees, mostly at
management levels, are evaluated primarily on whether or
not they achieve their budget targets [7]. Managers who miss
their target face the prospect of interventions in their jobs, the
loss of organizational resources, the loss of annual bonuses
and pay raises, and sometimes even the loss of their job [8].
So they may look for ways to protect themselves from the
downside risks of missing budget targets and the stigma
attached to underachievers [9]. Possible ways of protection
can be obtained by negotiating for highly achievable targets
(i.e., budgetary slack creation).
A large body of archival research presents substantial
evidence that significant amounts of budgetary slack exist in
most business organizations, as estimated by the magnitude
of slack to be as high as 20% - 25% of budgeted operating
expenses [5], as well as by the prevalence of managers
willing to admit that they engage in budgetary slack creation
to be as high as 80% of the managers interviewed [10]. In
Thailand, [2]-[3] perform survey research and also report that,
on average, Thai manufacturing companies have moderate
level (level four of seven-point Likert scale) of budgetary
slack.
B. Earnings Management
In accordance with General Accepted Accounting
Principles (GAAP), financial accounting information is
prepared based on the accrual basis. In the accrual basis, the
effects of transactions and events are reported in the financial
statements of the period to which they occur, rather than
when cash or cash equivalent is received or paid. Accruals
play an important role in financial reporting. There are two
aspects of accruals’ role. In the first aspect, accruals play a
role in producing a reliable and more timely measure of firm
performance, so earnings are able to reflect firm performance
better than cash flows and the discretionary component of
accruals helps improve such ability. By contrast, in the
second aspect, some studies find that earnings play a central
role in measuring the enterprise’s performance while accruals
play an important role in obscuring true underlying firm
performance via an introduction of discretionary accruals,
which is commonly known as earnings management.
Earnings management can be defined as non-neutral
financial reporting in which managers intervene intentionally
in the financial reporting process to produce some private
gains [11]. It occurs when managers use judgment in
financial reporting and in structuring transactions to alter
financial reports either to mislead some stakeholders about
the underlying economic performance of the company or to
influence contractual outcomes that depend on reported
accounting numbers [12]. In other words, earnings
management is a strategy used by company’s management to
deliberately manipulate the company's earnings so that the
figures match a pre-determined target.
Existing literature demonstrates that executives engage in
earnings manipulation both upward and downward
management through accruals for a number of incentives, e.g.,
to maximize their compensation, to avoid debt-covenant
violation, to meet and beat earnings benchmarks, and to
reduce political visibility (e.g., [13]-[16]).
C. Determinants of Budgetary Slack
Prior literature suggests the association of certain factors
with budgetary slack (e.g., [6], [17]-[20]). This study
classifies those key factors into environmental factor
(environmental factor), organizational factors (information
asymmetry, budget emphasis evaluative style, participative
styles, reward systems, and budget-based resource allocation),
and individual factors (ethical concerns, reputation concerns,
and fairness concerns).
III. RESEARCH DESIGN
A. Sample and Data
The sample used in this study consists of the companies
listed on the Stock Exchange of Thailand (SET) and the
Market for Alternative Investment (MAI) as of the year
ended 2009, and all of them use budget for performance
evaluation. The companies in financial industry and
companies under rehabilitation are excluded since their
financial reporting requirements and their characteristics of
business operation are different. Also, this study chooses to
employ the cross-sectional modified Jones (1995) model that
is not applicable to measure discretionary accruals of the
companies in financial industry. Besides, the companies must
have been listed on the SET or MAI for at least 1 year before
the end of 2009 since it is presumed that the listed companies
usually use budget more effectively in planning, control, and
performance evaluation than the non-listed companies. The
population covers 387 firms and there are 38 returned and
usable questionnaires which is 10% response rate. Detail of
population and final sample firm breakdown by industry is
presented in Part I of Appendix A and detail of returned
245
Journal of Economics, Business and Management, Vol. 3, No. 2, February 2015
questionnaires is presented in Part II of Appendix A.
The survey questionnaires (Thai version) are administered
and sent to the firms’ management who held one of the
following titles: Chief Financial Officer, Controller, Vice
President, Managing Director, or Manager. These
respondents have to work with the firms since or prior to
2009, involve extensively in budgeting process, and are
accountable for the firms’ performance. The annual financial
statements are retrieved from the SET Market Analysis and
Reporting Tool (―SETSMART‖).
387 mailed survey questionnaires are distributed during
May–June 2011 and designed to elicit information on budget
figures of the year 2009, respondents’ perceptions of the
achievability of their annual earnings targets, and all
determinants of budgetary slack.
From the initial sample set, the firms with no or invalid
data on actual or budgeted earnings are excluded. The final
sample set comprises 38 firms (equivalent to 10% of total
population). The small sample size is due to the difficulty in
obtaining the firms’ internal and confidential data.
Demographic profile of respondents is presented in Appendix
B.
B. Measures
As budgetary slack is not directly observable, prior survey
studies usually measure budgetary slack subjectively, i.e.,
―the achievability of performance targets as perceived by
managers‖. Although it is a perceptual dependent variable,
prior survey studies usually measure budgetary slack in this
manner.
In this study, the ex post measure of annual firms’ budget
achievability has been introduced to objectively measure
budgetary slack. The rationale behind using the achievability
of annual performance targets (variances between actual and
budget amounts) to proxy for budgetary slack is that the more
the slack build into budget, the higher the propensity to easily
achieve the budget.
When subordinates create slack into budget, they choose
more easily attainable standard. The subordinates engage in
this behavior in the hope that the standard or budget which
their performance is evaluated would be more easily
achieved. In other words, if the subordinates set the easily
attainable budgets, they would generate the favorable
variances. Hence, it could be said that the more favorable the
variances, the more the budgetary slack.
Ref. [8] Measure budget achievability by comparing past
and current-year performances with budget targets. Besides,
[21] use prior year’s performance relative to its target as a
proxy for a prior period’s organizational slack.
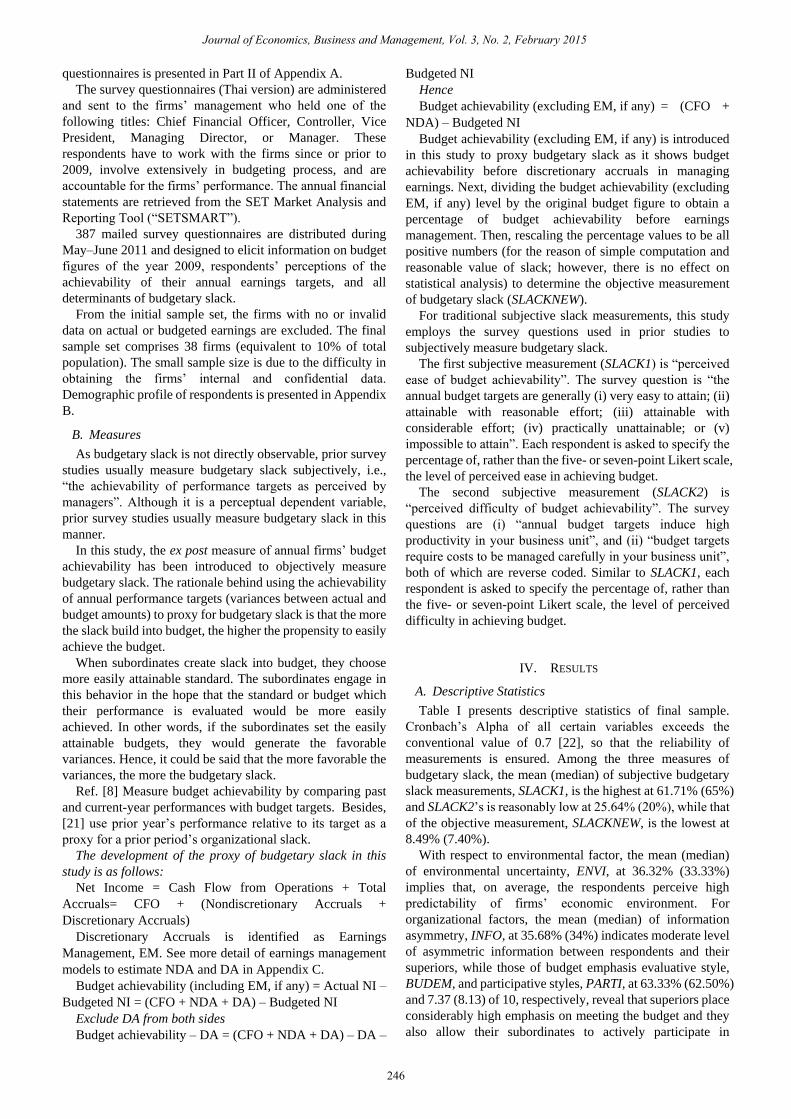
The development of the proxy of budgetary slack in this
study is as follows:
Net Income = Cash Flow from Operations + Total
Accruals= CFO + (Nondiscretionary Accruals +
Discretionary Accruals)
Discretionary Accruals is identified as Earnings
Management, EM. See more detail of earnings management
models to estimate NDA and DA in Appendix C.
Budget achievability (including EM, if any) = Actual NI –
Budgeted NI = (CFO + NDA + DA) – Budgeted NI
Exclude DA from both sides
Budget achievability – DA = (CFO + NDA + DA) – DA –
Budgeted NI
Hence
Budget achievability (excluding EM, if any) = (CFO +
NDA) – Budgeted NI
Budget achievability (excluding EM, if any) is introduced
in this study to proxy budgetary slack as it shows budget
achievability before discretionary accruals in managing
earnings. Next, dividing the budget achievability (excluding
EM, if any) level by the original budget figure to obtain a
percentage of budget achievability before earnings
management. Then, rescaling the percentage values to be all
positive numbers (for the reason of simple computation and
reasonable value of slack; however, there is no effect on
statistical analysis) to determine the objective measurement
of budgetary slack (SLACKNEW).
For traditional subjective slack measurements, this study
employs the survey questions used in prior studies to
subjectively measure budgetary slack.
The first subjective measurement (SLACK1) is ―perceived
ease of budget achievability‖. The survey question is ―the
annual budget targets are generally (i) very easy to attain; (ii)
attainable with reasonable effort; (iii) attainable with
considerable effort; (iv) practically unattainable; or (v)
impossible to attain‖. Each respondent is asked to specify the
percentage of, rather than the five- or seven-point Likert scale,
the level of perceived ease in achieving budget.
The second subjective measurement (SLACK2) is
―perceived difficulty of budget achievability‖. The survey
questions are (i) ―annual budget targets induce high
productivity in your business unit‖, and (ii) ―budget targets
require costs to be managed carefully in your business unit‖,
both of which are reverse coded. Similar to SLACK1, each
respondent is asked to specify the percentage of, rather than
the five- or seven-point Likert scale, the level of perceived
difficulty in achieving budget.
IV. RESULTS
A. Descriptive Statistics
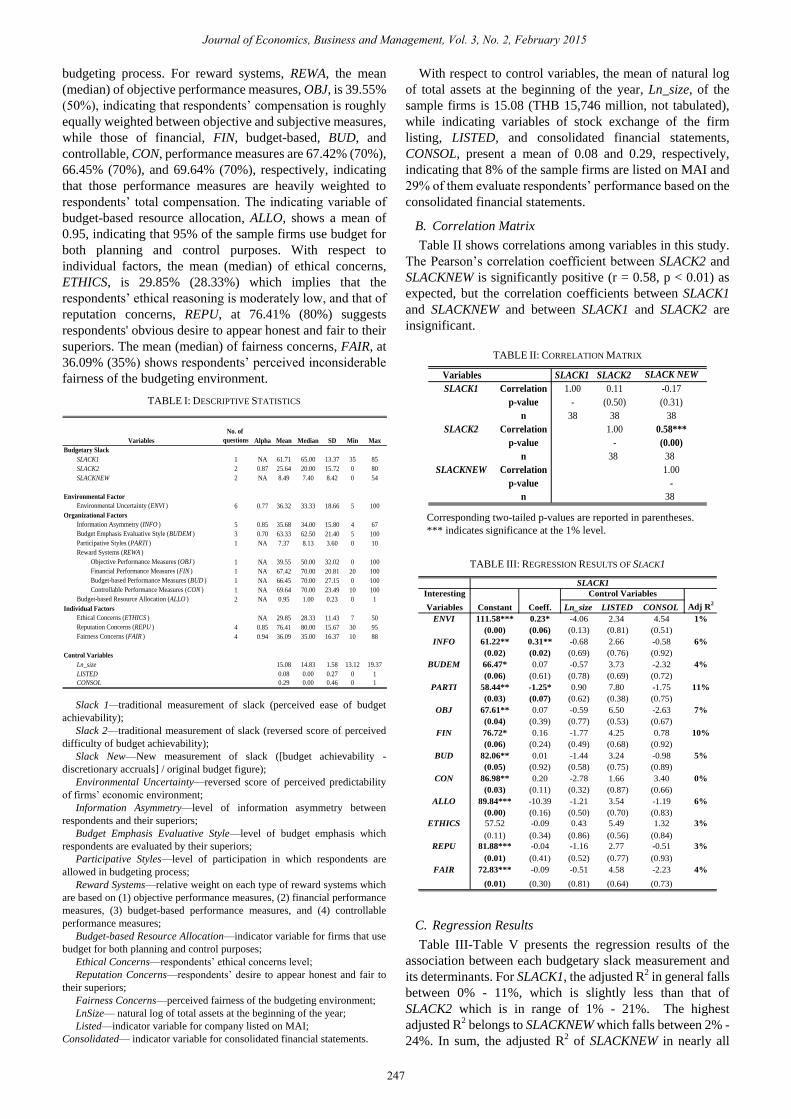
Table I presents descriptive statistics of final sample.
Cronbach’s Alpha of all certain variables exceeds the
conventional value of 0.7 [22], so that the reliability of
measurements is ensured. Among the three measures of
budgetary slack, the mean (median) of subjective budgetary
slack measurements, SLACK1, is the highest at 61.71% (65%)
and SLACK2’s is reasonably low at 25.64% (20%), while that
of the objective measurement, SLACKNEW, is the lowest at
8.49% (7.40%).
With respect to environmental factor, the mean (median)
of environmental uncertainty, ENVI, at 36.32% (33.33%)
implies that, on average, the respondents perceive high
predictability of firms’ economic environment. For
organizational factors, the mean (median) of information
asymmetry, INFO, at 35.68% (34%) indicates moderate level
of asymmetric information between respondents and their
superiors, while those of budget emphasis evaluative style,
BUDEM, and participative styles, PARTI, at 63.33% (62.50%)
and 7.37 (8.13) of 10, respectively, reveal that superiors place
considerably high emphasis on meeting the budget and they
also allow their subordinates to actively participate in
246
Journal of Economics, Business and Management, Vol. 3, No. 2, February 2015
budgeting process. For reward systems, REWA, the mean
(median) of objective performance measures, OBJ, is 39.55%
(50%), indicating that respondents’ compensation is roughly
equally weighted between objective and subjective measures,
while those of financial, FIN, budget-based, BUD, and
controllable, CON, performance measures are 67.42% (70%),
66.45% (70%), and 69.64% (70%), respectively, indicating
that those performance measures are heavily weighted to
respondents’ total compensation. The indicating variable of
budget-based resource allocation, ALLO, shows a mean of
0.95, indicating that 95% of the sample firms use budget for
both planning and control purposes. With respect to
individual factors, the mean (median) of ethical concerns,
ETHICS, is 29.85% (28.33%) which implies that the
respondents’ ethical reasoning is moderately low, and that of
reputation concerns, REPU, at 76.41% (80%) suggests
respondents' obvious desire to appear honest and fair to their
superiors. The mean (median) of fairness concerns, FAIR, at
36.09% (35%) shows respondents’ perceived inconsiderable
fairness of the budgeting environment.
TABLE I: DESCRIPTIVE STATISTICS
No. of
questions Alpha Mean Median SD Min Max
Budgetary Slack
SLACK1 1 NA 61.71 65.00 13.37 35 85
SLACK2 2 0.87 25.64 20.00 15.72 0 80
SLACKNEW 2 NA 8.49 7.40 8.42 0 54
Environmental Factor
Environmental Uncertainty (ENVI ) 6 0.77 36.32 33.33 18.66 5 100
Organizational Factors
Information Asymmetry (INFO ) 5 0.85 35.68 34.00 15.80 4 67
Budget Emphasis Evaluative Style (BUDEM ) 3 0.70 63.33 62.50 21.40 5 100
Participative Styles (PARTI ) 1 NA 7.37 8.13 3.60 0 10
Reward Systems (REWA )
Objective Performance Measures (OBJ ) 1 NA 39.55 50.00 32.02 0 100
Financial Performance Measures (FIN ) 1 NA 67.42 70.00 20.81 20 100
Budget-based Performance Measures (BUD ) 1 NA 66.45 70.00 27.15 0 100
Controllable Performance Measures (CON ) 1 NA 69.64 70.00 23.49 10 100
Budget-based Resource Allocation (ALLO ) 2 NA 0.95 1.00 0.23 0 1
Individual Factors
Ethical Concerns (ETHICS ) NA 29.85 28.33 11.43 7 50
Reputation Concerns (REPU ) 4 0.85 76.41 80.00 15.67 30 95
Fairness Concerns (FAIR ) 4 0.94 36.09 35.00 16.37 10 88
Control Variables
Ln_size 15.08 14.83 1.58 13.12 19.37
LISTED 0.08 0.00 0.27 0 1
CONSOL 0.29 0.00 0.46 0 1
Variables
Slack 1—traditional measurement of slack (perceived ease of budget
achievability);
Slack 2—traditional measurement of slack (reversed score of perceived
difficulty of budget achievability);
Slack New—New measurement of slack ([budget achievability -
discretionary accruals] / original budget figure);
Environmental Uncertainty—reversed score of perceived predictability
of firms’ economic environment;
Information Asymmetry—level of information asymmetry between
respondents and their superiors;
Budget Emphasis Evaluative Style—level of budget emphasis which
respondents are evaluated by their superiors;
Participative Styles—level of participation in which respondents are
allowed in budgeting process;
Reward Systems—relative weight on each type of reward systems which
are based on (1) objective performance measures, (2) financial performance
measures, (3) budget-based performance measures, and (4) controllable
performance measures;
Budget-based Resource Allocation—indicator variable for firms that use
budget for both planning and control purposes;
Ethical Concerns—respondents’ ethical concerns level;
Reputation Concerns—respondents’ desire to appear honest and fair to
their superiors;
Fairness Concerns—perceived fairness of the budgeting environment;
LnSize— natural log of total assets at the beginning of the year;
Listed—indicator variable for company listed on MAI;
Consolidated— indicator variable for consolidated financial statements.
With respect to control variables, the mean of natural log
of total assets at the beginning of the year, Ln_size, of the
sample firms is 15.08 (THB 15,746 million, not tabulated),
while indicating variables of stock exchange of the firm
listing, LISTED, and consolidated financial statements,
CONSOL, present a mean of 0.08 and 0.29, respectively,
indicating that 8% of the sample firms are listed on MAI and
29% of them evaluate respondents’ performance based on the
consolidated financial statements.
B. Correlation Matrix
Table II shows correlations among variables in this study.
The Pearson’s correlation coefficient between SLACK2 and
SLACKNEW is significantly positive (r = 0.58, p < 0.01) as
expected, but the correlation coefficients between SLACK1
and SLACKNEW and between SLACK1 and SLACK2 are
insignificant.
TABLE II: CORRELATION MATRIX
Variables SLACK1 SLACK2 SLACK NEW
SLACK1 Correlation 1.00 0.11 -0.17
p-value - (0.50) (0.31)
n 38 38 38
SLACK2 Correlation 1.00 0.58***
p-value - (0.00)
n 38 38
SLACKNEW Correlation 1.00
p-value -
n 38
Corresponding two-tailed p-values are reported in parentheses.
*** indicates significance at the 1% level.
TABLE III: REGRESSION RESULTS OF SLACK1
Interesting
Variables Constant Coeff. Ln_size LISTED CONSOL Adj R2
ENVI 111.58*** 0.23* -4.06 2.34 4.54 1%
(0.00) (0.06) (0.13) (0.81) (0.51)
INFO 61.22** 0.31** -0.68 2.66 -0.58 6%
(0.02) (0.02) (0.69) (0.76) (0.92)
BUDEM 66.47* 0.07 -0.57 3.73 -2.32 4%
(0.06) (0.61) (0.78) (0.69) (0.72)
PARTI 58.44** -1.25* 0.90 7.80 -1.75 11%
(0.03) (0.07) (0.62) (0.38) (0.75)
OBJ 67.61** 0.07 -0.59 6.50 -2.63 7%
(0.04) (0.39) (0.77) (0.53) (0.67)
FIN 76.72* 0.16 -1.77 4.25 0.78 10%
(0.06) (0.24) (0.49) (0.68) (0.92)
BUD 82.06** 0.01 -1.44 3.24 -0.98 5%
(0.05) (0.92) (0.58) (0.75) (0.89)
CON 86.98** 0.20 -2.78 1.66 3.40 0%
(0.03) (0.11) (0.32) (0.87) (0.66)
ALLO 89.84*** -10.39 -1.21 3.54 -1.19 6%
(0.00) (0.16) (0.50) (0.70) (0.83)
ETHICS 57.52 -0.09 0.43 5.49 1.32 3%
(0.11) (0.34) (0.86) (0.56) (0.84)
REPU 81.88*** -0.04 -1.16 2.77 -0.51 3%
(0.01) (0.41) (0.52) (0.77) (0.93)
FAIR 72.83*** -0.09 -0.51 4.58 -2.23 4%
(0.01) (0.30) (0.81) (0.64) (0.73)
Control Variables
SLACK1
C. Regression Results
Table III-Table V presents the regression results of the
association between each budgetary slack measurement and
its determinants. For SLACK1, the adjusted R2 in general falls
between 0% - 11%, which is slightly less than that of
SLACK2 which is in range of 1% - 21%. The highest
adjusted R2 belongs to SLACKNEW which falls between 2% -
24%. In sum, the adjusted R2 of SLACKNEW in nearly all
247
Journal of Economics, Business and Management, Vol. 3, No. 2, February 2015
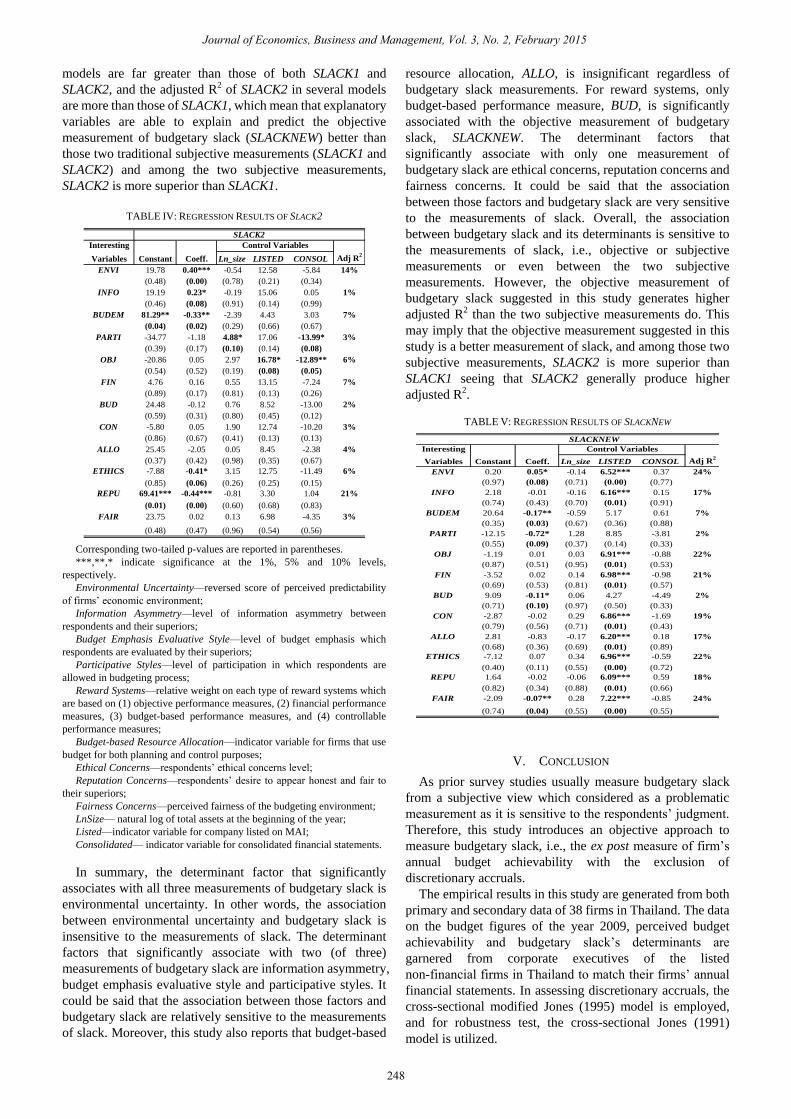
models are far greater than those of both SLACK1 and
SLACK2, and the adjusted R2 of SLACK2 in several models
are more than those of SLACK1, which mean that explanatory
variables are able to explain and predict the objective
measurement of budgetary slack (SLACKNEW) better than
those two traditional subjective measurements (SLACK1 and
SLACK2) and among the two subjective measurements,
SLACK2 is more superior than SLACK1.
TABLE IV: REGRESSION RESULTS OF SLACK2
Interesting
Variables Constant Coeff. Ln_size LISTED CONSOL Adj R2
ENVI 19.78 0.40*** -0.54 12.58 -5.84 14%
(0.48) (0.00) (0.78) (0.21) (0.34)
INFO 19.19 0.23* -0.19 15.06 0.05 1%
(0.46) (0.08) (0.91) (0.14) (0.99)
BUDEM 81.29** -0.33** -2.39 4.43 3.03 7%
(0.04) (0.02) (0.29) (0.66) (0.67)
PARTI -34.77 -1.18 4.88* 17.06 -13.99* 3%
(0.39) (0.17) (0.10) (0.14) (0.08)
OBJ -20.86 0.05 2.97 16.78* -12.89** 6%
(0.54) (0.52) (0.19) (0.08) (0.05)
FIN 4.76 0.16 0.55 13.15 -7.24 7%
(0.89) (0.17) (0.81) (0.13) (0.26)
BUD 24.48 -0.12 0.76 8.52 -13.00 2%
(0.59) (0.31) (0.80) (0.45) (0.12)
CON -5.80 0.05 1.90 12.74 -10.20 3%
(0.86) (0.67) (0.41) (0.13) (0.13)
ALLO 25.45 -2.05 0.05 8.45 -2.38 4%
(0.37) (0.42) (0.98) (0.35) (0.67)
ETHICS -7.88 -0.41* 3.15 12.75 -11.49 6%
(0.85) (0.06) (0.26) (0.25) (0.15)
REPU 69.41*** -0.44*** -0.81 3.30 1.04 21%
(0.01) (0.00) (0.60) (0.68) (0.83)
FAIR 23.75 0.02 0.13 6.98 -4.35 3%
(0.48) (0.47) (0.96) (0.54) (0.56)
Control Variables
SLACK2
Corresponding two-tailed p-values are reported in parentheses.
***,**,* indicate significance at the 1%, 5% and 10% levels,
respectively.
Environmental Uncertainty—reversed score of perceived predictability
of firms’ economic environment;
Information Asymmetry—level of information asymmetry between
respondents and their superiors;
Budget Emphasis Evaluative Style—level of budget emphasis which
respondents are evaluated by their superiors;
Participative Styles—level of participation in which respondents are
allowed in budgeting process;
Reward Systems—relative weight on each type of reward systems which
are based on (1) objective performance measures, (2) financial performance
measures, (3) budget-based performance measures, and (4) controllable
performance measures;
Budget-based Resource Allocation—indicator variable for firms that use
budget for both planning and control purposes;
Ethical Concerns—respondents’ ethical concerns level;
Reputation Concerns—respondents’ desire to appear honest and fair to
their superiors;
Fairness Concerns—perceived fairness of the budgeting environment;
LnSize— natural log of total assets at the beginning of the year;
Listed—indicator variable for company listed on MAI;
Consolidated— indicator variable for consolidated financial statements.
In summary, the determinant factor that significantly
associates with all three measurements of budgetary slack is
environmental uncertainty. In other words, the association
between environmental uncertainty and budgetary slack is
insensitive to the measurements of slack. The determinant
factors that significantly associate with two (of three)
measurements of budgetary slack are information asymmetry,
budget emphasis evaluative style and participative styles. It
could be said that the association between those factors and
budgetary slack are relatively sensitive to the measurements
of slack. Moreover, this study also reports that budget-based
resource allocation, ALLO, is insignificant regardless of
budgetary slack measurements. For reward systems, only
budget-based performance measure, BUD, is significantly
associated with the objective measurement of budgetary
slack, SLACKNEW. The determinant factors that
significantly associate with only one measurement of
budgetary slack are ethical concerns, reputation concerns and
fairness concerns. It could be said that the association
between those factors and budgetary slack are very sensitive
to the measurements of slack. Overall, the association
between budgetary slack and its determinants is sensitive to
the measurements of slack, i.e., objective or subjective
measurements or even between the two subjective
measurements. However, the objective measurement of
budgetary slack suggested in this study generates higher
adjusted R2 than the two subjective measurements do. This
may imply that the objective measurement suggested in this
study is a better measurement of slack, and among those two
subjective measurements, SLACK2 is more superior than
SLACK1 seeing that SLACK2 generally produce higher
adjusted R2.
TABLE V: REGRESSION RESULTS OF SLACKNEW
Interesting
Variables Constant Coeff. Ln_size LISTED CONSOL Adj R2
ENVI 0.20 0.05* -0.14 6.52*** 0.37 24%
(0.97) (0.08) (0.71) (0.00) (0.77)
INFO 2.18 -0.01 -0.16 6.16*** 0.15 17%
(0.74) (0.43) (0.70) (0.01) (0.91)
BUDEM 20.64 -0.17** -0.59 5.17 0.61 7%
(0.35) (0.03) (0.67) (0.36) (0.88)
PARTI -12.15 -0.72* 1.28 8.85 -3.81 2%
(0.55) (0.09) (0.37) (0.14) (0.33)
OBJ -1.19 0.01 0.03 6.91*** -0.88 22%
(0.87) (0.51) (0.95) (0.01) (0.53)
FIN -3.52 0.02 0.14 6.98*** -0.98 21%
(0.69) (0.53) (0.81) (0.01) (0.57)
BUD 9.09 -0.11* 0.06 4.27 -4.49 2%
(0.71) (0.10) (0.97) (0.50) (0.33)
CON -2.87 -0.02 0.29 6.86*** -1.69 19%
(0.79) (0.56) (0.71) (0.01) (0.43)
ALLO 2.81 -0.83 -0.17 6.20*** 0.18 17%
(0.68) (0.36) (0.69) (0.01) (0.89)
ETHICS -7.12 0.07 0.34 6.96*** -0.59 22%
(0.40) (0.11) (0.55) (0.00) (0.72)
REPU 1.64 -0.02 -0.06 6.09*** 0.59 18%
(0.82) (0.34) (0.88) (0.01) (0.66)
FAIR -2.09 -0.07** 0.28 7.22*** -0.85 24%
(0.74) (0.04) (0.55) (0.00) (0.55)
Control Variables
SLACKNEW
V. CONCLUSION
As prior survey studies usually measure budgetary slack
from a subjective view which considered as a problematic
measurement as it is sensitive to the respondents’ judgment.
Therefore, this study introduces an objective approach to
measure budgetary slack, i.e., the ex post measure of firm’s
annual budget achievability with the exclusion of
discretionary accruals.
The empirical results in this study are generated from both
primary and secondary data of 38 firms in Thailand. The data
on the budget figures of the year 2009, perceived budget
achievability and budgetary slack’s determinants are
garnered from corporate executives of the listed
non-financial firms in Thailand to match their firms’ annual
financial statements. In assessing discretionary accruals, the
cross-sectional modified Jones (1995) model is employed,
and for robustness test, the cross-sectional Jones (1991)
model is utilized.
248
Journal of Economics, Business and Management, Vol. 3, No. 2, February 2015
The results show that the objective measurement and the
subjective measurement (reversed score of perceived
difficulty of budget achievability) of budgetary slack are
statistically positively correlated (r = 0.58, p < 0.01). Even
though the objective and the subjective measurement of
budgetary slack are significantly and positively correlated,
we still consider that the suggested objective approach of
budgetary slack measurement proposed in this study makes
available another objective measurement of slack. However,
the other subjective measurement (perceived ease of budget
achievability) is insignificantly correlated. The differences in
measurements of budgetary slack might be the cause of
inconclusive results of the association between budgetary
slack and its determinants in prior research. This study;
therefore, empirically investigates the association between
budgetary slack and its determinants by comparing the
objective and the subjective slack measurements. The results
advocate that the association between budgetary slack and its
determinants is sensitive to the measurements of slack, i.e.,
objective or subjective measurements or even between the
two subjective measurements. However, the objective
measurement of budgetary slack suggested in this study
generates higher adjusted R2, in nearly all models, than the
two subjective measurements do. These results indicate that
the explanatory variables could explain and predict the
objective measurement of budgetary slack better than the two
subjective measurements. The results imply that the objective
measurement, i.e., the ex post measure of firm’s annual
budget achievability with the exclusion of discretionary
accruals, suggested in this study is a better measurement of
budgetary slack than the traditional subjective measurements
utilize in prior studies. Among the two subjective
measurements of budgetary slack, SLACK2 (reversed score
of the two questions about perceived difficulty of budget
achievability) produces higher adjusted R2 than SLACK1
(simple question about perceived ease of budget
achievability), these empirical results not only again reveal
that the results are sensitive to the measurements of slack but
also point out that number or attribute of the questions
(simple or reverse questions) might be the cause of sensitivity
and inconclusiveness.
Nevertheless, this empirical study is subject to a number of
limitations. First, this study covers only the non-financial
institutions listed in Thailand and the final set of samples is
merely 38 firms due to the difficulty in obtaining the firms’
internal and confidential data; hence, limiting
generalizability of the results. Second, implicit assumptions
in this study are that the ex post measure of annual firms’
budget achievability with the exclusion of discretionary
accruals is a good proxy for budgetary slack as the more the
slack build into budget, the higher the propensity to easily
achieve the budget, and the cross-sectional Modified Jones
(1995) model accurately partitions accruals into its
discretionary and nondiscretionary components. Third,
measurement errors, model misspecifications and omitted
variables may limit the reliability of results. Fourth, by the
very nature of the survey data, this study relies primarily on
self-reported responses to the survey questions in which the
respondents are asked to recall their perceptions on budget
achievability from the past to measure budgetary slack.
Despite the limitations, we still believe that this study adds
prior literature an objective measurement of budgetary slack.
Future research should endeavor to increase the sample size
to improve generalizability of the results. Rather than a
subjective measurement of budgetary slack, an objective
measurement should be employed for further investigation in
future studies. For robustness test, other earnings
management categories and approaches, i.e., real earnings
management and other accruals models, should be employed
in estimating discretionary accruals.
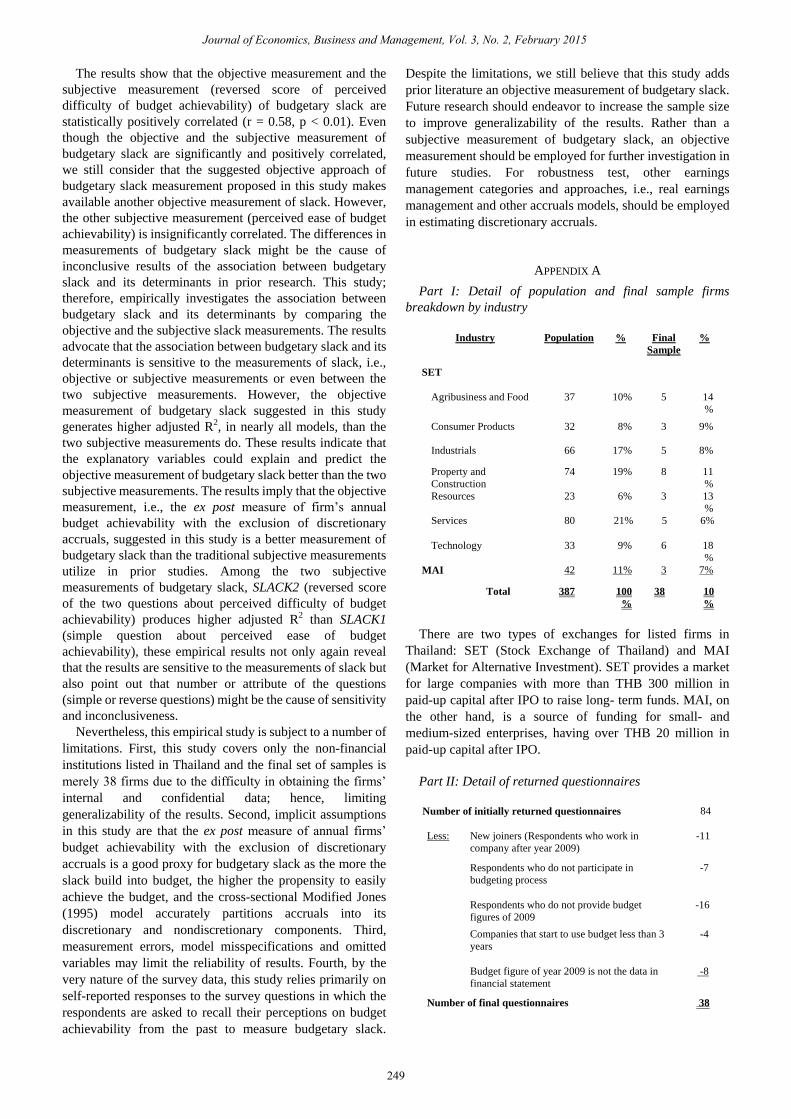
APPENDIX A
Part I: Detail of population and final sample firms
breakdown by industry
Industry Population % Final
Sample
%
SET
Agribusiness and Food 37 10% 5 14
%
Consumer Products 32 8% 3 9%
Industrials 66 17% 5 8%
Property and
Construction
74 19% 8 11
%
Resources 23 6% 3 13
%
Services 80 21% 5 6%
Technology 33 9% 6 18
%
MAI 42 11% 3 7%
Total 387 100
%
38 10
%
There are two types of exchanges for listed firms in
Thailand: SET (Stock Exchange of Thailand) and MAI
(Market for Alternative Investment). SET provides a market
for large companies with more than THB 300 million in
paid-up capital after IPO to raise long- term funds. MAI, on
the other hand, is a source of funding for small- and
medium-sized enterprises, having over THB 20 million in
paid-up capital after IPO.
Part II: Detail of returned questionnaires
Number of initially returned questionnaires 84
Less: New joiners (Respondents who work in
company after year 2009)
-11
Respondents who do not participate in
budgeting process
-7
Respondents who do not provide budget
figures of 2009
-16
Companies that start to use budget less than 3
years
-4
Budget figure of year 2009 is not the data in
financial statement
-8
Number of final questionnaires 38
249
Journal of Economics, Business and Management, Vol. 3, No. 2, February 2015
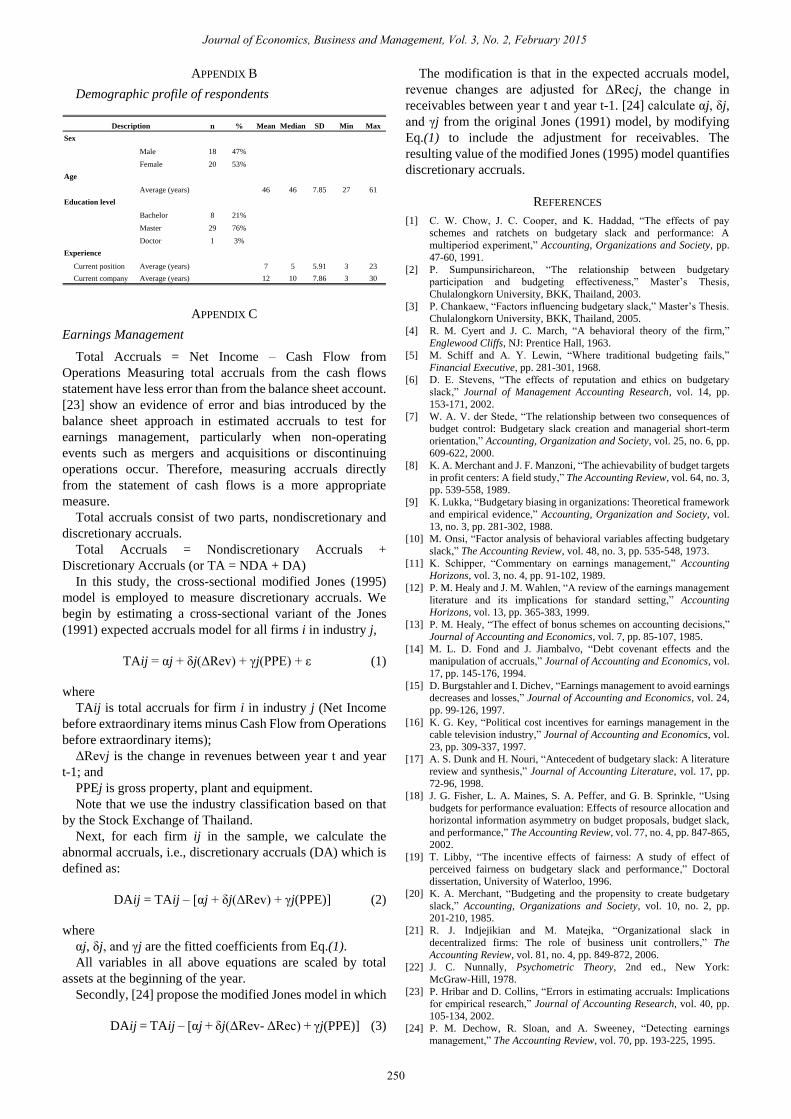
APPENDIX B
Demographic profile of respondents
n % Mean Median SD Min Max
Sex
Male 18 47%
Female 20 53%
Age
Average (years) 46 46 7.85 27 61
Education level
Bachelor 8 21%
Master 29 76%
Doctor 1 3%
Experience
Current position Average (years) 7 5 5.91 3 23
Current company Average (years) 12 10 7.86 3 30
Description
APPENDIX C
Earnings Management
Total Accruals = Net Income – Cash Flow from
Operations Measuring total accruals from the cash flows
statement have less error than from the balance sheet account.
[23] show an evidence of error and bias introduced by the
balance sheet approach in estimated accruals to test for
earnings management, particularly when non-operating
events such as mergers and acquisitions or discontinuing
operations occur. Therefore, measuring accruals directly
from the statement of cash flows is a more appropriate
measure.
Total accruals consist of two parts, nondiscretionary and
discretionary accruals.
Total Accruals = Nondiscretionary Accruals +
Discretionary Accruals (or TA = NDA + DA)
In this study, the cross-sectional modified Jones (1995)
model is employed to measure discretionary accruals. We
begin by estimating a cross-sectional variant of the Jones
(1991) expected accruals model for all firms i in industry j,
TAij = αj + δj(ΔRev) + γj(PPE) + ε (1)
where
TAij is total accruals for firm i in industry j (Net Income
before extraordinary items minus Cash Flow from Operations
before extraordinary items);
ΔRevj is the change in revenues between year t and year
t-1; and
PPEj is gross property, plant and equipment.
Note that we use the industry classification based on that
by the Stock Exchange of Thailand.
Next, for each firm ij in the sample, we calculate the
abnormal accruals, i.e., discretionary accruals (DA) which is
defined as:
DAij = TAij – [αj + δj(ΔRev) + γj(PPE)] (2)
where
αj, δj, and γj are the fitted coefficients from Eq.(1).
All variables in all above equations are scaled by total
assets at the beginning of the year.
Secondly, [24] propose the modified Jones model in which
DAij = TAij – [αj + δj(ΔRev- ΔRec) + γj(PPE)] (3)
The modification is that in the expected accruals model,
revenue changes are adjusted for ΔRecj, the change in
receivables between year t and year t-1. [24] calculate αj, δj,
and γj from the original Jones (1991) model, by modifying
Eq.(1) to include the adjustment for receivables. The
resulting value of the modified Jones (1995) model quantifies
discretionary accruals.
REFERENCES
[1] C. W. Chow, J. C. Cooper, and K. Haddad, ―The effects of pay
schemes and ratchets on budgetary slack and performance: A
multiperiod experiment,‖ Accounting, Organizations and Society, pp.
47-60, 1991.
[2] P. Sumpunsirichareon, ―The relationship between budgetary
participation and budgeting effectiveness,‖ Master’s Thesis,
Chulalongkorn University, BKK, Thailand, 2003.
[3] P. Chankaew, ―Factors influencing budgetary slack,‖ Master’s Thesis.
Chulalongkorn University, BKK, Thailand, 2005.
[4] R. M. Cyert and J. C. March, ―A behavioral theory of the firm,‖
Englewood Cliffs, NJ: Prentice Hall, 1963.
[5] M. Schiff and A. Y. Lewin, ―Where traditional budgeting fails,‖
Financial Executive, pp. 281-301, 1968.
[6] D. E. Stevens, ―The effects of reputation and ethics on budgetary
slack,‖ Journal of Management Accounting Research, vol. 14, pp.
153-171, 2002.
[7] W. A. V. der Stede, ―The relationship between two consequences of
budget control: Budgetary slack creation and managerial short-term
orientation,‖ Accounting, Organization and Society, vol. 25, no. 6, pp.
609-622, 2000.
[8] K. A. Merchant and J. F. Manzoni, ―The achievability of budget targets
in profit centers: A field study,‖ The Accounting Review, vol. 64, no. 3,
pp. 539-558, 1989.
[9] K. Lukka, ―Budgetary biasing in organizations: Theoretical framework
and empirical evidence,‖ Accounting, Organization and Society, vol.
13, no. 3, pp. 281-302, 1988.
[10] M. Onsi, ―Factor analysis of behavioral variables affecting budgetary
slack,‖ The Accounting Review, vol. 48, no. 3, pp. 535-548, 1973.
[11] K. Schipper, ―Commentary on earnings management,‖ Accounting
Horizons, vol. 3, no. 4, pp. 91-102, 1989.
[12] P. M. Healy and J. M. Wahlen, ―A review of the earnings management
literature and its implications for standard setting,‖ Accounting
Horizons, vol. 13, pp. 365-383, 1999.
[13] P. M. Healy, ―The effect of bonus schemes on accounting decisions,‖
Journal of Accounting and Economics, vol. 7, pp. 85-107, 1985.
[14] M. L. D. Fond and J. Jiambalvo, ―Debt covenant effects and the
manipulation of accruals,‖ Journal of Accounting and Economics, vol.
17, pp. 145-176, 1994.
[15] D. Burgstahler and I. Dichev, ―Earnings management to avoid earnings
decreases and losses,‖ Journal of Accounting and Economics, vol. 24,
pp. 99-126, 1997.
[16] K. G. Key, ―Political cost incentives for earnings management in the
cable television industry,‖ Journal of Accounting and Economics, vol.
23, pp. 309-337, 1997.
[17] A. S. Dunk and H. Nouri, ―Antecedent of budgetary slack: A literature
review and synthesis,‖ Journal of Accounting Literature, vol. 17, pp.
72-96, 1998.
[18] J. G. Fisher, L. A. Maines, S. A. Peffer, and G. B. Sprinkle, ―Using
budgets for performance evaluation: Effects of resource allocation and
horizontal information asymmetry on budget proposals, budget slack,
and performance,‖ The Accounting Review, vol. 77, no. 4, pp. 847-865,
2002.
[19] T. Libby, ―The incentive effects of fairness: A study of effect of
perceived fairness on budgetary slack and performance,‖ Doctoral
dissertation, University of Waterloo, 1996.
[20] K. A. Merchant, ―Budgeting and the propensity to create budgetary
slack,‖ Accounting, Organizations and Society, vol. 10, no. 2, pp.
201-210, 1985.
[21] R. J. Indjejikian and M. Matejka, ―Organizational slack in
decentralized firms: The role of business unit controllers,‖ The
Accounting Review, vol. 81, no. 4, pp. 849-872, 2006.
[22] J. C. Nunnally, Psychometric Theory, 2nd ed., New York:
McGraw-Hill, 1978.
[23] P. Hribar and D. Collins, ―Errors in estimating accruals: Implications
for empirical research,‖ Journal of Accounting Research, vol. 40, pp.
105-134, 2002.
[24] P. M. Dechow, R. Sloan, and A. Sweeney, ―Detecting earnings
management,‖ The Accounting Review, vol. 70, pp. 193-225, 1995.
250
Journal of Economics, Business and Management, Vol. 3, No. 2, February 2015
Pornpan Damrongsukniwat was born in
Udonthani, Thailand, on December 17, 1978. She
spent two and a half years to receive her bachelor’s
degree in business administration majoring in
accounting (Second-Class Honors) from
Ramkhamhaeng University, Bangkok, Thailand, in
1998. After completing her master’s degree in
accounting from Chulalongkorn University,
Bangkok, Thailand, in 2002, she received the
Certified Public Accountant (CPA) license from the
Institute of Certified Accountants and Auditors of Thailand (ICAAT) in
2004. And she also received her bachelor’s degree in laws from Sukhothai
Thammathirat University, Bangkok, Thailand, in 2005. She received her
doctoral degree in accounting from Chulalongkorn University, Bangkok,
Thailand in 2012.
She had 5 years’ experience with Pricewaterhouse Coopers ABAS,
Bangkok office, Thailand, in the audit and advisory profession. Currently,
she is a LECTURER at the Department of Accounting, Faculty of Business
Administration, Kasetsart University, Bangkok, Thailand. Her research
interests include financial accounting and managerial accounting research.
Danuja Kunpanitchakit was born in Bangkok,
Thailand, on December 28, 1953. She received her
bachelor’s degree in accounting (First Class Honors,
Gold Medal) from Chulalongkorn University,
Bangkok, Thailand in 1976. She received her master’s
degree in business administration majoring in
accounting from University of Wisconsin-Madison,
U.S.A. in 1979. She received her doctoral degree in
business administration from University of
Wisconsin-Madison, U.S.A. in 1983.
She is an Associate Professor at the Department of Accountancy, Faculty
of Commerce and Accountancy, Chulalongkorn University, Bangkok,
Thailand. Currently, she is a VICE PRESIDENT, Chulalongkorn University,
Bangkok, Thailand. Her research interests include managerial accounting
and cost management research.
Supol Durongwatana was born in Bangkok,
Thailand, on January 22, 1957. He received his
bachelor’s degree in statistics from Chulalongkorn
University, Bangkok, Thailand in 1979. He received
his master’s degree in statistics from Oklahoma State
University, U.S.A. in 1981. He received his doctoral
degree in statistics from Oklahoma State University,
U.S.A. in 1984. Currently, he is an ASSOCIATE
PROFESSOR at the Department of Statistics, Faculty
of Commerce and Accountancy, Chulalongkorn University, Bangkok,
Thailand. His research interests include statistical linear and non-linear
models.
251
Journal of Economics, Business and Management, Vol. 3, No. 2, February 2015