Embed Size (px)
Citation preview
The measurement of neuroticism using MMQ, MPI, EPIand EPQ items:
a psychometric analysis based on item response theory
Pere J. Ferrando
Universidad `Rovira i Virgili', Facultad de Psicologia, Carretera de Valls s/n, 43007, Tarragona, Spain
Received 15 April 1999; received in revised form 22 February 2000
Abstract
Even though Eysenck's N scales appear to be psychometrically superior to the E, P and L scales andcompare favourably to similar scales of other questionnaires, they have been criticised for di�erent reasons.The present research uses item response theory (IRT) to assess the psychometric properties of a pool of 47N items drawn from di�erent Eysenck questionnaires, and analyses criticisms based on nonequivalence,lack of unidimensionality, weak structure and social desirability bias. The results indicate that the pool ofitems is essentially unidimensional. The remaining criticisms were found to have some foundation but theydid not invalidate the scales. The results of the IRT calibration provide further information about theproperties of the items as measures of N. # 2001 Elsevier Science Ltd. All rights reserved.
Keywords: Neuroticism measurement; Item response theory and personality measurement; Dimensionality assessment;
Social desirability bias; Nonlinear factor analysis
1. Introduction
According to empirical evidence the neuroticism (N) scales in Eysenck's questionnaires tend tohave better psychometric properties than the other scales (Jensen, 1958; Eysenck & Eysenck,1969; Howarth & Browne, 1972; Howarth, 1976; Loo, 1979; Helmes, 1980; Corulla, 1987).Eysenck's N scales also appear to compare favourably to similar scales from other Anglo-Amer-ican personality questionnaires in terms of internal consistency and parallel scale correlation(Angleitner, John & LoÈ hr, 1986).In spite of their respectable `basic' psychometric properties, however, Eysenck's N scales have
been strongly criticised for several reasons: (a) multidimensionality (Loo, 1979, 1995; Goh, King
0191-8869/01/$ - see front matter # 2001 Elsevier Science Ltd. All rights reserved.
PII : S0191-8869(00)00062-3
Personality and Individual Differences 30 (2001) 641±656www.elsevier.com/locate/paid
E-mail address: [email protected] (P.J. Ferrando).
& King, 1982; Howarth & Browne, 1972; Howarth, 1976; Roger & Morris, 1991; Francis, 1993);(b) weak factor structure characterised for low factor loadings (Goh et al., 1982; Helmes, 1980);(c) possible lack of invariance of scales over the di�erent revisions (Helmes, 1980; Rocklin &Revelle, 1981); and (d) social desirability (SD) bias (Martin & Stanley, 1963; Farley, 1966;Helmes, 1980).The present research analyses the psychometric properties of a set of 47 nonredundant items
which were taken from the N scales of the Maudsley medical questionnaire (MMQ), theMaudsley personality inventory (MPI), the Eysenck personality inventory (EPI) and the Eysenckpersonality questionnaire (EPQ). The psychometric analyses are based on an item response the-ory (IRT) model and on a nonlinear factor analysis (FA) model. Both models address binaryitems and, in theory, are more appropriate than the linear FA that is traditionally used in itemanalysis. These models are expected to provide information about the properties of these itemsand clarify some of the aspects which have been criticised.
1.1. The construct neuroticism, N scales and item selection
The hierarchical system of personality description put forward by Eysenck (1947) is based onfour levels of behaviour organisation: (1) speci®c response level, (2) habitual response patterns,(3) trait level, and (4) type level, and, in this system, N is considered as a general type on thefourth level. According to Eysenck (1978), these four levels correspond to the di�erent kinds offactors that are distinguished in factor analysis (FA): error factors, speci®c factors, group factorsand general factors. Hence, from a FA point of view, N would be a general factor or superfactorwhich emerges mainly from the correlations between primary traits such as anxiety, unhappiness,dependence, guilt, etc. (Eysenck, Barrett, Wilson & Jackson, 1992).The MMQ was the ®rst Eysenck inventory designed to measure N. It succeeded in di�er-
entiating between normal and neurotic soldiers but it was found to be more suitable for neuroticsthan for normals. An important revision resulted in the N scales of the MPI and EPI, which werederived from various analyses of the MMQ items together with items from the C scale of Guil-ford's questionnaires (Eysenck & Eysenck, 1969). Finally, the N scale of the EPQ was a majorrevision of the EPI N scale: however, 13 items of the EPI N still appear in the EPQ N. Detailsabout the origin and construction of the di�erent questionnaires described can be found inEysenck (1952) (MMQ), Eysenck and Eysenck (1969) (MPI and EPI), and Eysenck and Eysenck(1976) (EPQ). Angleitner et al. (1986) analysed the content of the items that measure N in theMPI, EPI and EPQ and found, in agreement with the theory, that they refer to behaviours drawnprimarily from the second and third level (i.e. habitual responses and trait attributions). BecauseN items refer to di�erent primary traits, their content tries to be more heterogeneous than thosethat are habitual in other personality questionnaires, avoiding semantically similar statements ofessentially identical content (Eysenck, 1978).Following this last point, the main criterion for selecting items from the di�erent instruments
described above was to avoid redundancy. As has been said, several N items are used in exactlythe same form in the di�erent versions of the questionnaires. However, the questionnaires werealso found to use certain items which were practically the same with only slightly altered wording.In my opinion, the redundancy in content gives rise to problems in the dimensional analyses (inthe form of correlated measurement error, clusters of redundant items and spurious evidence of
642 P.J. Ferrando / Personality and Individual Di�erences 30 (2001) 641±656

multidimensionality), and tend to put o� those participants who dislike being asked the samequestion in a slightly di�erent guise. When the same item was repeated with practically the samewording in a di�erent questionnaire, it was included only once. The abbreviated contents of the itemsused as well as the questionnaires from which they come are listed in the ®rst column of Table 2.The history of the items used in the selected set goes back almost 40 years and, as one reviewer
pointed out, the meaning of the construct may have changed to some extent over this period. Ifso, the aforementioned criticisms of the lack of invariance of scales over the di�erent revisionswould be somewhat justi®ed. At a theoretical level, however, the position of Eysenck appears tobe that the di�erent revisions of the scales are equivalent measures of the same construct. In moredetail, the joint analyses of the MMQ and MPI items concluded that the di�erences observedwere due only to the greater di�culty of the MMQ items (Eysenck & Eysenck, 1969) and, in themanual of the EPQ, Eysenck & Eysenck (1975) stated that the N scale of the EPQ must be con-sidered equivalent to the older scales. The present paper empirically studies the issue of theinvariance of scales.Another issue raised by the same reviewer is that most of the items included in the present set
have been rejected or set aside by the authors in the evolution of the N scale and so, their inclu-sion in the present study could be considered to be questionable. My opinion is that this is also anissue that must be tested empirically. If indeed the scale has evolved correctly, then the itemswhich belong to the more recent versions are expected to possess better psychometric propertiesthan the older ones (i.e. higher discrimination values and di�culty values more centred aroundthe average level of a normal population). This aspect will be studied in the section on itemcalibration.
1.2. Rationale for the item response model
A review of the literature shows that IRT models are increasingly being used to study thepsychometric characteristics of personality test items (Ozer & Reise, 1994). An IRT model is amathematical function that relates the individual's standing on the dimension measured by thetest (�) to the probability of endorsing a particular item (keyed in the appropriate direction). Therelationship between � and the probability of endorsement is represented by an item characteristiccurve (ICC) which depicts the probability as a function of �.IRT models di�er from one another in the number of parameters needed to de®ne the ICC. Of
the various binary item models, the two-parameter logistic model (2PLM) has been chosen in thepresent research. The 2PLM assumes that the probability that a person will endorse a personalityitem depends solely on: (a) the person's level in �; (b) the threshold or location parameter b, whichindicates the ICC position in �; and (c) the item's discrimination parameter a, which is propor-tional to the maximum slope of the ICC.The mathematical function for the 2PLM is:
P��� � ea��ÿb�
1� ea��ÿb�
The location parameter b is usually referred to as the `item di�culty' in ability measurement. Inthe present case, and for a given item, b is interpreted as the Neuroticism level that is required to
P.J. Ferrando / Personality and Individual Di�erences 30 (2001) 641±656 643
have a probability of 0.50 of endorsing this item. So, the higher b is, the larger the N level must beto endorse the item. For many personality questionnaires item di�culties fall between ÿ2.0 and+2.0.The discrimination parameter a indicates the quality of the item as a measure of the trait (Lord
& Novick, 1968). The higher a is, the more precise the item will be and the more the informationit will provide about the trait which is measured. Typical personality items have discriminationvalues between 0.50 and 1.50 (Reise & Waller, 1990).The choice of the 2PLM can be justi®ed from two points of view Ð pragmatically and theo-
retically (Lord, 1980). In my opinion both are compatible and can be applied to the presentresearch.From the theoretical point of view the choice of the 2PLM can be based on its factor analytic
formulation. First, it is assumed that there is a continuous latent response variable underlyingeach observed item response and that the observed item response (0 or 1) is the result of anarbitrary dichotomization of the latent response at a given threshold. This idea was ®rst devel-oped by Thurstone (1925). Second, it is assumed that the latent item responses are related to thetrait that they measure according to the common linear FA model. If it is also assumed that theconditional distributions of the latent responses for a ®xed trait level are normal and homo-scedastic (as is customary in regression theory), then it can be shown that the observed itemresponses are related to the trait that they measure according to the two-parameter IRT model(see Lord, 1980, and, for a formal demonstration, see Takane & de Leeuw, 1987). Strictlyspeaking the demonstration refers to the two-parameter IRT normal ogive model whereas herewe have described the two-parameter IRT logistic model. However, in practice both modelsproduce results that are virtually indistinguishable (Birnbaum, 1968).The formulation described above may well be appropriate for the N items considered in this
research. Because Eysenck's (1947) hierarchical model of personality was built up from beha-vioural responses, all of the N item questions refer to behaviours, mainly reaction descriptionsand trait attributions, (Angleitner et al., 1986) which can occur to a greater or lesser degree. Infact, when Eysenck analysed the MMQ items, he considered that there was an intensity gradientin the behaviour to which the items referred and that the decision to answer YES or NO meantcategorising this gradient at an arbitrary point (Eysenck, 1956). Therefore, in my opinion, theobserved responses to the N items should be considered as dichotomisations rather than naturaldichotomies.It should also be pointed out that the FA formulation of the two-parameter IRT is the ratio-
nale for the procedure to factor analyse the matrix of inter-item tetrachoric correlations, a pro-cedure that has been reported in the construction of some of the Eysenck questionnaires,although it has not been justi®ed (Eysenck & Eysenck, 1969). In fact, the FA of tetrachorics is aheuristic or approximate method for ®tting the two-parameter IRT model (Bock & Lieberman,1970). On the whole, in my opinion, the factor analytic formulation of the two-parameter IRTmodel, based on the underlying variables approach is consistent with the factor analytic dimen-sional approach on which Eysenck's N scales were based.From a pragmatic point of view, a series of applications have empirically demonstrated that
the 2PLM is appropriate for personality items (Reise & Waller, 1990; Waller, Tellegen, McDo-nald & Lykken, 1996; Finch & West, 1997; Reise, 1999). In particular the 2PLM has already beensuccessfully ®tted to other Eysenck scales (Ferrando, 1994). It should be pointed out that these
644 P.J. Ferrando / Personality and Individual Di�erences 30 (2001) 641±656
studies did not provide any `a priori' justi®cation for the choice of the model. Rather its use wasjusti®ed solely because of the good ®t that was obtained between the model and the test dataset.The possibility of verifying the ®t of the model is a fundamental di�erence between classical
test theory and the IRT models. Once the IRT model has been speci®ed (in this case the 2PLM)its appropriateness to any set of test data can be established using a suitable goodness-of-®tinvestigation. The test of the model ®t is extremely important because the advantages and prop-erties of the IRT models are only realised when the ®t is satisfactory.The discussion above is relevant when alternative models to 2PLM are considered. In parti-
cular, the Rasch (1960) model is simpler than the 2PLM. The Rasch model can be considered as aparticular case of the 2PLM in which all of the items have equal discrimination values, so, onlythe di�culty indices need to be estimated. From the factor analytic perspective described abovethe Rasch model involves a factor pattern in which all of the latent response variables have thesame loading value on the common factor that they measure.The Rasch model has interesting properties both from a statistical and a measurement per-
spective. First, because the model involves fewer parameters it is easier to work with. Second,there are fewer estimation problems with the Rasch model than with the more parameterisedmodels. Finally, the model has the property of speci®c objectivity, which permits the completeseparation of item and trait estimation. Speci®c objectivity, in turn, enables the construction ofadditivity and hence fundamental measurement (see Wright, 1985).In practice, however, the strong conditions of the Rasch model are rarely met. Conventional
wisdom in personality measurement indicates that items do indeed vary in their discriminationvalues and that not all of them are equally good measures of the trait. So, the Rasch model maywell be appropriate only for carefully pretested and selected sets of items (which is the situationoriginally considered by Rasch) but it will not be appropriate in the conditions of the presentstudy. As has been said above, if the Rasch model does not ®t the data, speci®c objectivity andthe other desirable properties are not obtained.
2. Method
2.1. Participants and procedure
The respondents were 706 university students (146 men and 560 women; mean age 21) from thePsychology and Social Sciences faculties of the `Rovira and Virgili' university of Tarragona(Spain). The questionnaires were completed voluntarily in classroom groups of about 60 students.The instructions given before administration were the ones printed in the EPI and EPQ manuals.
2.2. Instruments
This research used 47 items from the Spanish versions of the MMQ, MPI, EPI and EPQNeuroticism scales. The Spanish translation of the Crowne and Marlowe (1960) social desirabilityscale (SDS) was also used in a subsample of 216 participants.A translation of the MMQ was available in the Spanish edition of Eysenck's book `Sense and
nonsense in Psychology' (Eysenck, 1962, chapter 5). Published Spanish adaptations of the EPI
P.J. Ferrando / Personality and Individual Di�erences 30 (2001) 641±656 645

(Eysenck & Eysenck, 1973) and EPQ (Eysenck & Eysenck, 1978) were also available. Finally, theMPI and the SDS were translated by the present writer.
3. Analyses and results
3.1. Assessment of unidimensionality
In IRT unidimensionality is de®ned from the principle of local independence (see Lord &Novick, 1968, chapter 16) which states that, conditional upon any value of the trait, the dis-tributions of the item scores are entirely independent in probability. A weak implication of thisprinciple is the factor analytic de®nition of unidimensionality that for a ®xed trait level the resi-dual interitem covariances become zero (i.e. the item scores are not entirely independent inprobability but only linearly independent). In practice the weak principle of local independence isconsidered to be su�cient for assessment purposes (McDonald, 1981, 1994) and it is the one thatwill be used here.The theoretical justi®cation for the 2PLM model assumes that the regressions of the latent item
responses on the trait that they measure are linear but that the regressions of the observed itemresponses on the trait (i.e. the ICC) are nonlinear. In theory, if the IRT model is correct, linearFA must not be used to assess unidimensionality, as additional factors will be required to ®t thecurvilinear ICC and this will lead to spurious evidence of multidimensionality as well as atte-nuated factor loadings (see McDonald & Ahlawat, 1974).As has been mentioned above, a possible solution to this problem is to factor analyse the
matrix of interitem tetrachoric correlations. The tetrachoric correlations are estimates of thecorrelations between the continuous responses which are supposed to underlie the observeddichotomies, and, for these continuous responses, the linear FA is assumed to be correct. However,this procedure is only approximate and gives rise to practical problems. In more detail, the FA oftetrachorics appears to correct the problem of attenuated loadings but leads to incorrect estima-tions of dimensionality (see Bock & Lieberman, 1970; Collins, Cli�, McCormick & Zatkin, 1986).The option chosen in this study is to use the nonlinear factor analysis of the normal ogive
model as implemented in the NOHARM program (Fraser and McDonald, 1988). NOHARMtests the FA de®nition of unidimensionality that all the residual covariances after FA has beencarried out are zero. However, because NOHARM is designed to account for nonlinear itemfactor regressions it is unlikely to lead to attenuated loadings or to generate spurious factors.Even if the nonlinear FA described above is assumed to be a correct model for the N items,
perfect unidimensionality is not expected to be found in the present case. As has been said above,N is considered as a superfactor that emerges from correlated primary traits and the N itemquestions refer to habitual responses and trait attributions. Therefore, a multiple FA of the Nitems is expected to break the superfactor down into several traits, as occurs in practice (Eysencket al., 1992). From this point of view, what is required is not perfect undimensionality but ratherthat the degree of unidimensionality be large enough to justify the assumption that there is in facta common general dimension underlying the item responses. This condition, which allows for thepresence of minor dimensions, has been named `essential unidimensionality' (Stout, Douglas,Junker & Roussos, 1993) or approximate dimensionality (McDonald, 1994).
646 P.J. Ferrando / Personality and Individual Di�erences 30 (2001) 641±656

The most usual NOHARM index for assessing approximate dimensionality is the meansquared residual covariance after the factor model has been ®tted (RMSR). Recently McDonaldand Mok (1995, formula 14) suggested using also the least squares version of Tanaka and Huba's(1985) gamma goodness of ®t index. The gamma index is de®ned as a generalised coe�cient ofdetermination, and so it can take values between 0 and 1. Its interpretation is analogous to asquared multiple correlation coe�cient, summarising the proportion of variance in the multi-variate system accounted for by the tested factor model.The results of the assessment of ®t were the following: for the one factor model the RMSR and
gamma index were 0.011 and 0.91. For the two-factor model they were 0.010 and 0.93. So, theone factor model ®ts reasonably well and the one-factor solution can not be improved very muchif a two-factor model is used. These results indicate that the data is essentially unidimensionalwhich means that there is a single dominant dimension underlying the 47 item responses.One reviewer pointed out that a comparison between the NOHARM and the conventional FA
solution would be useful to assess whether the theoretical shortcomings of linear FA were ofpractical concern in the present research. Because NOHARM is based on an ordinary leastsquares criterion, I used minimum residual (MINRES) FA (Harman & Jones, 1966) which is alsobased on this criterion. The MINRES solution is equivalent to the widely used iterated principalaxis solution (Harman, 1976). Furthermore, because the residuals in NOHARM are covariances,the covariance matrix and not the more usual correlation matrix was analysed with MINRES inorder to obtain comparable measures of ®t.The MINRES RMSR for the single factor model was 0.012 and for the two-factor model it
was 0.010. These results are virtually identical to those provided by NOHARM, and suggest thatthe linear FA behaves as well as the nonlinear model in the present case. In both cases the resultssuggest that the data is essentially unidimensional.The MINRES and NOHARM solutions for the single factor model are shown in Table 1 in the
usual FA metric (i.e. the loadings can be interpreted as item-factor correlations). To identify theitem content and facilitate further comparisons to the IRT estimates, the items are listed in thesame order as they are in Table 2.It is apparent from Table 1 that the conventional FA loadings are attenuated with respect to the
NOHARM loadings. However, the attenuation e�ect appears to be rather constant, and the Burt±Tucker congruence coe�cient has a value of 0.99 indicating that the pro®le of both solutions is quitesimilar. A more appropriate index in this case would be one that indicates if the order of the itemsis the same with respect to the magnitude of the loadings. The value of the Kendall-tau coe�cientin this case was 0.88 which shows that if we were to select the items according to the magnitude of theloadings, we would get a similar result with both conventional FA and nonlinear FA. Therefore,in the present case, linear FA is just as suitable as the nonlinear model and it leads to very similarsolutions. Finally, in both solutions it is noted that all the loadings are positive and that most ofthem are rather high. This supports the idea that most items seem to form a single dimension.
3.2. Item calibration and model ®t
The 2PLM was ®tted using the BILOG 3 program (Mislevy & Bock, 1990). Item parameterswere estimated by using the marginal maximum a posteriori method and specifying a standardnormal prior latent distribution.
P.J. Ferrando / Personality and Individual Di�erences 30 (2001) 641±656 647

Table 1Linear (MINRES) and nonlinear (NOHARM) solutions for the single
factor model
MINRES NOHARM
0.599 0.7760.582 0.7350.561 0.7140.484 0.6750.512 0.6490.485 0.6000.498 0.6360.457 0.6210.493 0.6120.458 0.5970.433 0.6210.458 0.5970.432 0.5740.463 0.5970.412 0.5560.410 0.5490.354 0.5110.309 0.5060.396 0.5070.402 0.4930.283 0.4470.219 0.3850.376 0.4850.263 0.4100.332 0.4370.332 0.4330.348 0.4560.257 0.3960.272 0.3700.299 0.3970.302 0.3760.289 0.3580.225 0.3180.284 0.3680.262 0.3540.234 0.3230.265 0.3300.258 0.3280.201 0.2910.202 0.2860.151 0.2170.229 0.2800.115 0.1650.182 0.2540.162 0.2190.051 0.0610.038 0.047
648 P.J. Ferrando / Personality and Individual Di�erences 30 (2001) 641±656

Table 2Results of the analyses of the 47 neuroticism items ordered by their discrimination indexa
Abbreviated item content and instruments �2; df a; rank of a b; rank of b rb SDS
Feel `just miserable' for no reason. MPI EPI EPQ 5.8 5 1.336 47 0.768 26 ÿ0.073Often feel fed-up. EPI 6.7 6 1.222 46 0.616 24 ÿ0.096Feel troubled with feelings of inferiority. MMQ EPI 7.9 7 1.054 45 0.359 20 ÿ0.120Often feel life is very dull. EPQ 1.4 7 1.011 44 1.171 34 0.016Often experience periods of loneliness. MPI EPQ 5.5 8 0.918 43 0.658 25 ÿ0.210bOften felt listless and tired for no reason. MPI EPQ 6.2 8 0.853 42 0.582 22 ÿ0.048Lack self-con®dence. MMQ 1.8 8 0.847 41 ÿ0.121 17 ÿ0.104Feelings are easily hurt. MMQ MPI EPI EPQ 5.3 7 0.819 40 ÿ0.6 10 ÿ0.087Mood often goes up and down. EPQ 6.7 8 0.816 39 ÿ0.124 16 ÿ0.161A worrier. EPQ 9.0 8 0.794 38 0.793 27 ÿ0.062Easily hurt when people ®nd fault with you or the work you do. EPI EPQ 2.9 7 0.787 37 ÿ0.77 6 ÿ0.271bOften worry about things you should not have done or said. EPI EPQ 9.1 8 0.767 36 ÿ0.208 15 ÿ0.047Often feel disgruntled. MPI EPQ 13.7 8 0.764 35 1.163 33 0.004Often troubled about feelings of guilt. MPI EPI EPQ 10.1 9 0.762 34 0.611 23 ÿ0.035Seem to have less life about you than others. MMQ 13.7 8 0.725 33 1.066 31 ÿ0.134Worry too long after an embarrassing experience. MMQ EPQ 6.6 8 0.675 32 ÿ0.464 11 ÿ0.208bRate as a tense or `highly-strung' individual. MPI EPQ 14.3 8 0.666 31 1.755 38 ÿ0.087Have frequent ups and downs in mood, either with or without apparentcause. MPI EPI
2.4 6 0.660 30 ÿ1.829 4 ÿ0.323b
Su�er from `nerves'. MMQ EPQ 17.0 8 0.645 29 1.155 32 ÿ0.115Ideas run through your head so that you cannot sleep. MMQ MPI EPI 2.1 9 0.621 28 0.846 28 0.008Get attacks of shaking or trembling. EPI 9.4 7 0.616 27 2.411 42 0.100
Get short of breath without having done heavy work. MMQ 4.4 7 0.565 26 3.096 45 0.159Inclined to ponder over your past. MPI 6.1 8 0.561 25 ÿ0.214 14 ÿ0.018Su�er from sleeplessness. EPI EPQ 2.3 7 0.554 24 2.562 44 ÿ0.081Troubled by aches and pains. MMQ EPI 15.4 9 0.551 23 1.513 37 ÿ0.035An irritable person. MMQ EPI EPQ 2.6 9 0.542 22 1.285 36 ÿ0.185Worry about awful things that might happen. EPQ 13.6 9 0.523 21 0.979 30 ÿ0.109Sometimes bubble over with energy and sometimes very sluggish. MPI EPI EPQ 4.5 7 0.503 20 ÿ1.908 3 ÿ0.263bHave dizzy turns. MMQ 9.0 9 0.480 19 2.028 39 ÿ0.100Often feel self-conscious in the presence of superiors. MMQ 5.3 9 0.446 18 ÿ0.305 13 ÿ0.052
(continued on next page)
P.J.Ferra
ndo/Perso
nality
andIndivid
ualDi�eren
ces30(2001)641±656
649
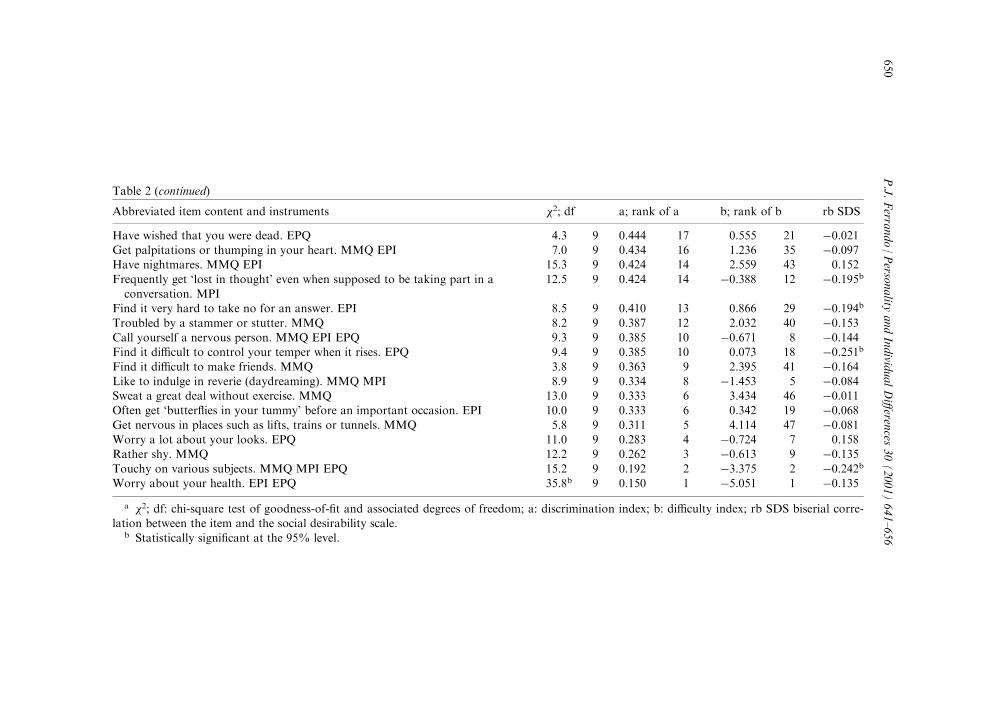
Table 2 (continued)
Abbreviated item content and instruments �2; df a; rank of a b; rank of b rb SDS
Have wished that you were dead. EPQ 4.3 9 0.444 17 0.555 21 ÿ0.021Get palpitations or thumping in your heart. MMQ EPI 7.0 9 0.434 16 1.236 35 ÿ0.097Have nightmares. MMQ EPI 15.3 9 0.424 14 2.559 43 0.152
Frequently get `lost in thought' even when supposed to be taking part in aconversation. MPI
12.5 9 0.424 14 ÿ0.388 12 ÿ0.195b
Find it very hard to take no for an answer. EPI 8.5 9 0.410 13 0.866 29 ÿ0.194bTroubled by a stammer or stutter. MMQ 8.2 9 0.387 12 2.032 40 ÿ0.153Call yourself a nervous person. MMQ EPI EPQ 9.3 9 0.385 10 ÿ0.671 8 ÿ0.144Find it di�cult to control your temper when it rises. EPQ 9.4 9 0.385 10 0.073 18 ÿ0.251bFind it di�cult to make friends. MMQ 3.8 9 0.363 9 2.395 41 ÿ0.164Like to indulge in reverie (daydreaming). MMQ MPI 8.9 9 0.334 8 ÿ1.453 5 ÿ0.084Sweat a great deal without exercise. MMQ 13.0 9 0.333 6 3.434 46 ÿ0.011Often get `butter¯ies in your tummy' before an important occasion. EPI 10.0 9 0.333 6 0.342 19 ÿ0.068Get nervous in places such as lifts, trains or tunnels. MMQ 5.8 9 0.311 5 4.114 47 ÿ0.081Worry a lot about your looks. EPQ 11.0 9 0.283 4 ÿ0.724 7 0.158Rather shy. MMQ 12.2 9 0.262 3 ÿ0.613 9 ÿ0.135Touchy on various subjects. MMQ MPI EPQ 15.2 9 0.192 2 ÿ3.375 2 ÿ0.242bWorry about your health. EPI EPQ 35.8b 9 0.150 1 ÿ5.051 1 ÿ0.135
a �2; df: chi-square test of goodness-of-®t and associated degrees of freedom; a: discrimination index; b: di�culty index; rb SDS biserial corre-lation between the item and the social desirability scale.
b Statistically signi®cant at the 95% level.
650
P.J.Ferra
ndo/Perso
nality
andIndivid
ualDi�eren
ces30(2001)641±656
The ®rst step in the calibration of the items was to assess the goodness-of-®t of the proposedmodel to the data. The procedure for testing the ®t of the model depends upon the number ofitems in the test. For short tests (fewer than 20 items) the ®t must be tested for the test as a whole.For long tests (more than 20 items), which is the present case, the ®t must be tested item by item(seeMislevy & Bock, 1990). It should be stressed that only if the model ®ts can it be considered to beappropriate, and the item parameters estimates be taken seriously and interpreted meaningfully.The procedure used to assess the ®t item by item consists of assigning the respondents to
intervals based on their estimated trait level, and then comparing the observed frequencies of itemendorsement to the frequencies expected from the ®tted model (in this case the 2PLM) in theintervals by means of a chi-square statistic. For each item, the chi-square test of ®t statistic andthe associated degrees of freedom are shown in columns 2 and 3 of Table 2. It should be pointedout that only one item shows a poor ®t (Do you worry about your health?) whereas the modelprovides a reasonably good ®t to the remaining 46 item responses. Overall, it is concluded thatthe 2PLM is appropriate for the present data.Columns 4±5 and 6±7 of Table 2 show the discrimination a and di�culty b estimates together
with their rank. To facilitate interpretation, the items have been ordered by their discriminationvalue, from the `best' to the `worst' measures of the dimension. It should be pointed out that the avalues range from 0.15 to 1.336 (average 0.592), so they tend to be lower than the estimates foundin other personality questionnaires.According to the itemmetric analysis carried out by Angleitner et al. (1986), the N items in
Eysenck's questionnaires may be mainly categorised as `covert reactions' (i.e. internal sensations,feelings and cognitions) and `physical symptoms' (i.e. physical reactions). The a values in Table 2suggest that the `covert reactions' are the best measures of N; in fact, the seven best items are allof them descriptions of internal feelings, whereas the `physical symptoms' begin to appear inmidtable. At the other extreme, in my opinion, the common characteristic of the four `worst'items (those with a values below 0.30) is ambiguity. This is particularly true for the `worst' item,which is also the only item that shows a poor ®t to the 2PLM. In Spanish, this item can beunderstood either as `Do you worry about your health?' or as `Do you care about your health?. Itshould be pointed out that the extreme `facility' of this item (b � ÿ5:051) indicates that practi-cally the whole sample had answered yes.In IRT the di�culty indices are in the same scale in which the trait is measured, so, to interpret
these values it should be remembered that the distribution of the trait was speci®ed to be standardnormal (i.e. mean 0 and standard deviation 1). The values of the di�culty indices range fromÿ5.05 to 4.11, which is a much broader range than the one usually found in personality ques-tionnaires. For instruments designed for the general population, a wide range of item di�cultiesis a desirable property because it indicates that precise measurement can be made across a widerange of test scores. It is clear that the most `di�cult' items (those with large b values) tend torefer to physical symptoms that are not usual in a `normal' population of university students(sweat or get short of breath without making e�ort, sleeplessness, nightmares, etc.). This makestheoretical sense, because it indicates that these items can only be endorsed if the level of Neu-roticism is high. It should be pointed out that most of the extremely di�cult items stem from theMMQ. At the other extreme, the `easier' items are mostly `covert reactions' and refer to beha-viours that most normal subjects may agree with (worry/care about health, touchy on varioussubjects).
P.J. Ferrando / Personality and Individual Di�erences 30 (2001) 641±656 651
A basic principle of IRT is that the respondent's trait level is invariant with respect to the itemsused to measure it. This principle rests upon the following conditions: (a) the total set of itemsmeasure the same trait; (b) the chosen IRT model is appropriate; and (c) all of the item para-meters are in a common metric. In the present research, the assessment of unidimensionality andmodel ®t indicates that the ®rst two conditions are reasonably met and, as far as condition (c) isconcerned, all of the items in Table 2 are calibrated in a common metric. Therefore, if di�erentsets of items taken from the total set in Table 2 (for example items belonging mainly to the MMQor to the MPI etc.) were administered to a given subject, the di�erent sets should yield the sametrait estimate, within the variability of the estimate, for this subject. In this respect then, itemsbelonging to di�erent scales could be considered as equivalent measures of the same trait asEysenck and Eysenck (1975) suggest.In the 2PLM the variability of the trait estimate or, in other words, the precision of the mea-
surement depends on three factors: (a) the number of items; (b) the quality of the items (given bytheir discrimination indices); and (c) the match between the item di�culties and the trait level.The estimate has smaller variability or greater precision when the test is long, when the dis-crimination indices are high and when item di�culties cluster around the subject's trait level. So,in IRT it is clear that, for a given test, the precision of the measurement varies with the trait level.In more detail, the MMQ items, for example, will not be precise enough to measure N in a nor-mal population because the average trait level in this population would be quite a long way fromthe di�culty levels of most of the MMQ items. However, the MMQ items would provide moreprecise measurement in a population with high levels of N, and the reverse would be true for the`easy' items, which would provide best measurement in groups with low N levels.
3.3. Study of social desirability bias
The literature consistently shows that the behaviours which the Neuroticism items refer to areregarded as socially undesirable (see Francis, 1993, for a review), and negative correlationsbetween N scales and SD measures are usually obtained (Martin & Stanley, 1963; Farley, 1966;Helmes, 1980). Farley (1966) noted that correlations were larger in the case of SD scales withpsychopathological item content and considered this to be a result of the shared psychopatholo-gical item content of both the N and the SD measures. Using Crowne and Marlowe's SDS, whichis free of psychopathological item content, Farley obtained a correlation of ÿ0.299 between theEPI-N scale and the SDS.In the present study the SDS was administered to a subsample of 216 participants. However,
instead of studying solely the correlation at a total score level, the analysis was done at the itemlevel, and the correlation between each of the 47 items and the SDS scores was studied. To pre-vent attenuation e�ects due to the di�erent proportions of item endorsement, the biserial coe�-cient was used instead of the more usual point biserial coe�cient (Lord & Novick, 1968). Thestandard error of the biserial coe�cient was also obtained, which enabled the signi®cance of eachcorrelation to be tested. It should be noted that the use of the biserial coe�cient is consistent withthe theoretical rationale for the 2PLM explained above. According to this rationale, the biserialcoe�cient can be interpreted as an estimate of the product-moment correlation between the SDSscores and the continuous latent item response which is assumed to underlie the observed itemresponse.
652 P.J. Ferrando / Personality and Individual Di�erences 30 (2001) 641±656
The results of the SD analysis are shown in the last two columns of Table 2. Most of the cor-relations are negative, which supports the idea that the behaviours re¯ected in the content of theN items tend to be considered as socially undesirable. However, only nine of the 47 correlationswere statistically signi®cant. As Table 2 shows, the content of the items with signi®cant correla-tions is mainly changes in mood, being touchy, irritability, or distractions in situations involvingsocial contact. All of these behaviours are, of course, not very desirable socially.At a total score level, the correlation between the sum of the 47 item responses and the total
scores of the SDS was ÿ0.213. Given that a far larger pool of items was used, this value can beconsidered to be a more accurate estimate of the relation between the N measures and non-pathological SD than the result reported by Farley (1966). There is clearly a negative relationbetween both measures, but the correlation is quite low and does not invalidate the scales asmeasures of N.
4. Discussion
The results of the present research considerably add to existing knowledge about the psycho-metric properties of N items, mainly because an IRT framework has been used. The ®rst resultthat should be mentioned is that the two-parameter IRT model ®ts the data quite well and can beconsidered as an appropriate model for these items. This good ®t, which has been reported inprevious analyses of other Eysenck scales, is an important result because it indicates that IRTmodels, which were designed initially for ability items, can also be appropriate for personalitymeasurement.The criticisms of the N scales had some foundation but they do not invalidate them as mea-
sures of N as has been suggested (Helmes, 1980). According to the present analyses, the N itemsare essentially unidimensional, in the sense that there is a clear and strong single dimensionunderlying all the responses. This result does not directly contradict the multidimensionalityfound in other studies: it all depends on the de®nition of unidimensionality adopted. However, itclearly indicates that the data is su�ciently unidimensional to justify the use of a single scalescore.The criticisms about `weak' structure, non-equivalence of the di�erent scales, and social desir-
ability bias must also be quali®ed. Of the 47 items, 19 have discrimination values below 0.50,which indicates that they are not very accurate measures of N. This is a drawback because whenthe discrimination of items is low, longer scales have to be used to get a more precise measure-ment. However, a low a value does not invalidate `per se' the use of an item as a measure. As fornon-equivalence, the only consistent result which has been found is that the MMQ scale tends toinclude the most di�cult of the items. So, the MMQ may be less versatile than the other scalesand may only work well in populations with high levels of N. Finally, it seems clear that neuroticbehaviours tend to be socially undesirable; however, only nine of the 47 items had signi®cantcorrelations with the SDS, and, at the total scores level, the overall correlation was too low toinvalidate the use of the N scales.The IRT analysis gives interesting information about the properties of items as measures of N.
On the one hand, it was found that items concerned with `covert reactions' (particularly internalfeelings) were better measures than items referring to physical reactions. On the other hand it was
P.J. Ferrando / Personality and Individual Di�erences 30 (2001) 641±656 653

found that the most `di�cult' items were those concerned with certain `physical symptoms' whichare not habitual in a normal population.The results of the present research were obtained in a Spanish sample, and so they could be
criticised for being culture speci®c. There is no doubt that IRT-based cross-cultural studies wouldbe of interest. However, cross-cultural studies based on standard FA using translated versions ofEysenck's questionnaires tend to show a high degree of similarity between the solutions obtainedin a large number of di�erent countries, including Spain (Eysenck & Eysenck, 1985; Barrett,Petrides, Eysenck & Eysenck, 1998). This suggests that the present results are generalizable.Some of the previous empirical studies related to the present research were carried out sepa-
rately for males and females. This was not done here for two reasons. First, IRT-based analysisrequires large samples to achieve stable estimates and, in the present case, it was thought wiser toanalyse a large sample than to explore possible sex di�erences using samples of marginal size.Second, although women systematically tend to score higher on N than men (see Francis, 1993),the di�erences between sexes in the structure of N items appear not to be major (Eysenck &Eysenck, 1976; Howarth, 1976). This is an expected result because Eysenck's questionnaires wereprecisely designed to be equally suitable for administration to either sex. However, some recentempirical research suggests that there might be di�erential item functioning (DIF) of some Nitems in both sexes (Francis, 1993; Loo, 1995). If su�ciently large samples could be found, itwould be interesting to search for DIF between the sexes with an IRT framework
References
Angleitner, A., John, O. P., & LoÈ hr, F. J. (1986). It's What you ask and how you ask it: An itemmetric analysis of
personality questionnaires. In A. Angleitner, & J. S. Wiggins, Personality assessment via questionnaires (pp. 61±107).Berlin: Springer-Verlag.
Barrett, P. T., Petrides, K. V., Eysenck, S. B. G., & Eysenck, H. J. (1998). The Eysenck Personality Questionnaire: An
examination of the factorial similarity of P,E,N and L across 34 countries. Personality and Individual Di�erences, 25,805±819.
Birnbaum, A. (1968). Some latent trait models and their use in inferring an examinee's ability. In F. M. Lord, & M. R.
Novick, Statistical theories of mental tests scores. Massachusetts: Addison-Wesley.Bock, R. D., & Lieberman, M. (1970). Fitting a response model for n dichotomously scored items. Psychometrika, 35,179±197.
Collins, L. M., Cli�, N., McCormick, D. J., & Zatkin, J. L. (1986). Factor recovery in binary data sets: A simulation.Multivariate Behavioral Research, 21, 377±391.
Corulla, W. J. (1987). A psychometric investigation of the Eysenck personality questionnaire (revised) and its rela-tionship to the 1.7 impulsiveness questionnaire. Personality and Individual Di�erences, 8, 651±658.
Crowne, D. P., & Marlowe, D. (1960). A new scale of social desirability independent of psychopathology. Journal ofConsulting Psychology, 24, 349±354.
Eysenck, H. J. (1947). Dimensions of personality. London: Routledge and Kegan Paul.
Eysenck, H. J. (1952). The scienti®c study of personality. London: Routledge.Eysenck, H. J. (1956). Sense and nonsense in psychology. London: Penguin Books.Eysenck, H. J. (1962). Enigmas de la PsicologõÂa. Madrid: Morata.
Eysenck, H. J. (1978). Superfactors P, E, and N in a comprehensive factor space. Multivariate Behavioral Research, 13,475±481.
Eysenck, H. J., Barrett, P., Wilson, G., & Jackson, C. (1992). Primary trait measurement of the 21 components of the
P-E-N system. European Journal of Psychological Assessment, 8, 109±117.Eysenck, H. J., & Eysenck, S. B. G. (1969). Personality structure and measurement. London: Routledge.
654 P.J. Ferrando / Personality and Individual Di�erences 30 (2001) 641±656
Eysenck, H. J., & Eysenck, S. B. G. (1973). EPI cuestionario de personalidad. Madrid: TEA.
Eysenck, H. J., & Eysenck, S. B. G. (1975). Manual of the Eysenck personality questionnaire. London: Hodder andStoughton.
Eysenck, H. J., & Eysenck, S. B. G. (1976). Psychoticism as a dimension of personality. New York: Crane, Russak &
Company.Eysenck, H. J., & Eysenck, S. B. G. (1978). EPQ cuestionario de personalidad. Madrid: TEA.Eysenck, H. J., & Eysenck, M. W. (1985). Personality and individual di�erences: A natural science approach. New York:
Plenum Press.Farley, F. H. (1966). Social desirability, extraversion and neuroticism: A learning analysis. The Journal of Psychology,64, 113±118.
Ferrando, P. J. (1994). Fitting item response models to the EPI-A impulsivity subscale. Educational and Psychological
Measurement, 54, 118±127.Finch, J. F., & West, S. G. (1997). The investigation of personality structure: Statistical models. Journal of Research inPersonality, 31, 439±485.
Francis, L. J. (1993). The dual nature of the Eysenckian Neuroticism scales: A question of sex di�erences? Personalityand Individual Di�erences, 15, 43±59.
Fraser, C., & McDonald, R. P. (1988). NOHARM: Least squares item factor analysis. Multivariate Behavioral
Research, 23, 267±269.Goh, D. S., King, D. W., & King, L. A. (1982). Psychometric evaluation of the Eysenck personality questionnaire.Educational and Psychological Measurement, 42, 297±309.
Harman, H. H. (1976). Modern factor analysis. Chicago: Univ. of Chicago Press.Harman, H. H., & Jones, W. H. (1966). Factor analysis by minimizing residuals (Minres). Psychometrika, 31, 351±368.
Helmes, E. (1980). A psychometric investigation of the Eysenck personality questionnaire. Applied Psychological
Measurement, 4, 43±55.Howarth, E. (1976). A psychometric investigation of Eysenck's personality inventory. Journal of Personality Assess-ment, 40(2), 173±185.
Howarth, E., & Browne, J. A. (1972). An item factor analysis of the Eysenck personality inventory. British Journal ofSocial and Clinical Psychology, 2, 162±174.
Jensen, A. R. (1958). The Maudsley personality inventory. Acta Psychologica, 14, 314±325.
Loo, R. (1979). A psychometric investigation of the Eysenck personality questionnaire. Journal of Personality Assess-ment, 43(1), 54±58.
Loo, R. (1995). Validation of the EPQ Neuroticism subscales using a Japanese sample. Social Behavior and Personality,
23, 131±136.Lord, F. M. (1980). Applications of item response theory to practical testing problems. Hillsdale: LEA.Lord, F. M., & Novick, M. R. (1968). Statistical theories of mental test scores. Reading, MA: Addison-Wesley.Martin, J., & Stanley, G. (1963). Social desirability and the Maudsley personality inventory. Acta Psychologica, 21,
260±264.McDonald, R. P. (1981). Dimensionality of tests and items. British Journal of Mathematical and Statistical Psychology,34, 100±107.
McDonald, R. P. (1994). Testing for approximate dimensionality. In D. Laveault, B. Zumbo, M. E. Gessaroli, & M. W.Boss, Modern theories of measurement: Problems and issues (pp. 63±86). Ottawa: Edumetrics.
McDonald, R. P., & Ahlawat, K. S. (1974). Di�culty factors in binary data. British Journal of Mathematical and Sta-
tistical Psychology, 27, 82±99.McDonald, R. P., & Mok, M. C. (1995). Goodness of ®t in item response models. Multivariate Behavioral Research,30, 23±40.
Mislevy, R. J., & Bock, R. D. (1990). BILOG 3. Item analysis and test scoring with binary logistic models. Mooresville:
Scienti®c Software.Ozer, D. J., & Reise, S. P. (1994). Personality assessment. Annual Review of Psychology, 45, 357±388.Rasch, G. (1960). Probabilistic models for some intelligence and attainment tests. Copenhagen: Danmarks Paedagogiske
Institut.
P.J. Ferrando / Personality and Individual Di�erences 30 (2001) 641±656 655
Reise, S. P. (1999). Personality measurement issues viewed through the eyes of IRT. In S. E. Embretson, & S. L.
Hershberger, The new rules of measurement (pp. 219±241). Hillsdale: LEA.Reise, S. P., & Waller, N. G. (1990). Fitting the two-parameter model to personality data. Applied PsychologicalMeasurement, 14, 45±58.
Rocklin, T., & Revelle, W. (1981). The measurement of extraversion: A comparison of the Eysenck personality inven-tory and the Eysenck personality questionnaire. British Journal of Social Psychology, 20, 279±284.
Roger, D., & Morris, J. (1991). The internal structure of the EPQ scales. Personality and Individual Di�erences, 12,
759±764.Stout, W., Douglas, J., Junker, B., & Roussos, L. (1993). DIMTEST manual. Urbana: University of Illinois.Takane, Y., & de Leeuw, J. (1987). On the relationship between Item Response Theory and factor analysis of dis-cretized variables. Psychometrika, 52(3), 393±408.
Tanaka, J. S., & Huba, G. J. (1985). A ®t index for covariance structure models under arbitrary GLS estimation.British Journal of Mathematical and Statistical Psychology, 38, 197±201.
Thurstone, L. L. (1925). A method of scaling psychological and educational tests. Journal of Educational Psychology,
16, 433±449.Waller, N. G., Tellegen, A., McDonald, R. P., & Lykken, D. T. (1996). Exploring nonlinear models in personalityassessment: Development and validation of a negative emotionality scale. Journal of Personality, 64, 545±576.
Wright, B. D. (1985). Additivity in psychological measurement. In E. E. Roskam, Measurement and personalityassessment (pp. 101±111). Amsterdam: North Holland.
656 P.J. Ferrando / Personality and Individual Di�erences 30 (2001) 641±656