Embed Size (px)
Citation preview
The Measurement and Evolution of Health Inequality: Evidence from the U.S. Medicare Population
Jonathan Skinner Dartmouth College, Dartmouth Medical School,
and NBER [email protected]
Weiping Zhou Dartmouth Medical School [email protected]
Draft: June 2004
PRELIMINARY: Not for Quotation
Prepared for the Symposium in honor of Eugene Smolensky, Berkeley CA, December 12-13 2003. We are grateful to Alan Auerbach, David Card, Victor Fuchs, Julian LeGrand, John Quigley, and seminar participants for helpful comments. Thomas Bubolz generously shared his CMHS data files and Dan Gottlieb provided critical data analysis using the Cooperative Cardiovascular Project. Financial support was provided by the National Institute on Aging.

1
The Measurement and Evolution of Health Inequality: Evidence from the U.S. Medicare Population
Abstract
What has been the evolution of health-related inequality in the United States in
recent years? When inequality is measured by health care expenditures, the evidence from the over-65 population in the United States suggests that Medicare has become more progressive. During 1987-2001, low income households experienced an increase of 78 percent ($2624) in per capita Medicare expenditures, double the increase of 34 percent ($1214) in the highest income group. However, we find the opposite pattern when inequality is measured using life expectancy: expected survival in the lowest income decile grew by 0.2 years during the 1990s, compared to an improvement of 0.8 years in the highest income group. That these two measures deliver such different messages may not be entirely surprising given their shortcomings in reflecting the inequality of health care systems. We suggest a new approach to quantifying income-based health care inequality: the use of effective health care measures where the efficacy is well proven and nearly 100 percent of the relevant population should be receiving it, regardless of health status or preferences. Using Medicare claims data matched to zip code income, we find distinct differences across income groups in the use of mammography screening, diabetic eye exams, and the use of ß blockers and ACE inhibitors following heart attacks, and these differences appear to be stable or growing slowly over time. In sum, the rapid growth in health care expenditures for the elderly, particularly among the lowest income groups, has done little to reduce income-based health inequality.
Jonathan Skinner Weiping Zhou Department of Economics Center for Evaluative Clinical Sciences Dartmouth College Dartmouth Medical School Hanover NH 03755 Hanover NH 03755 [email protected] [email protected]

The technological revolution in health care has brought both great benefits with
respect to survival and general well-being, and substantial increases in costs (e.g., Cutler
et. al., 1998; McClellan and Cutler, 2002; Skinner, Staiger, and Fisher, 2004). Whether
these changes have reduced inequality in health care or in health outcomes is not well
understood. Earlier research suggested that medical care innovations, such as the use of
antibiotics in the treatment of tuberculosis, reduced health care disparities by race
(McDermott, 1978). On the other hand, studies of health care expenditures by income
group found higher income groups accounting for a larger fraction of spending,
particularly after accounting for health status,1 although more recent U.S. data by
educational group suggests a different pattern (Battacharya and Lakdawalla, 2004).
Recent studies also suggest that better educated patients get access to newer drugs
(Lleras-Muney and Lichtenberg, 2002), survive longer following the diagnosis of cancer
(Glied and Lleras-Muney, 2003) and comply better with regimens for the treatment of
AIDS (Goldman and Smith, 2002).
This paper returns to the question of whether technological advances and
increases in health care expenditures have been associated with a widening or a
narrowing of inequality in health or in health care. The group studied is the over-65
population in the United States during the 1990s, which is of particular interest given
people in this age group consume such a large fraction of health care resources relative to
the rest of the population. Initially, two conventional measures of inequality are
considered: health care expenditures and health care outcomes as measured by 10-year
1 See for example LeGrand (1978, 1982), Le Grand et. al. (2001), Wagstaff et. al., (1991), Davis and Reynolds (1975), Link, Long, and Settle (1982), and McClellan and Skinner (2004). Some studies find more nuanced patterns, for example Gittelsohn, Halpern, and Sanchez (1982) and Morris, Sutton, and Gravelle (2003).

2
survival rates. Using detailed Medicare claims data on a panel of several million people
in the over-65 population in the United States stretching back to 1989, we matched each
individual to an income group based on median income in their zip code of residence.
Between 1987 and 2001, we found a dramatic increase in health care expenditures among
the lowest income groups, accounting for an increase of 78 percent ($2624) in real terms
during the period 1987-2001, compared to a 34 percent increase ($1214) for those in the
top income decile. Using expenditures as a marker for health inequality, one would
conclude that inequality has lessened, and if anything the higher (annual) expenditures
for lower income households would help to compensate for earlier years during which
insurance coverage and preventive care was minimal (Card, Dobkin, and Maestas, 2004).
There are a variety of disadvantages to using expenditures for health care as a
measure of access, however. Expenditures may reflect preferences as well as access to
care, nor is it clear how expenditures on health care translate into health outcomes (e.g.,
Fisher et. al., 2003a,b). Indeed, much of the differential increase in expenditures during
this period was accounted for by home health care, a program in which 40 cents of every
dollar was spent “inappropriately” according to one government investigation
(Havemann, 1997).
A different picture emerges in considering the evolution of health care outcomes
as measured by 10-year survival rates. While each income group experienced a survival
gain during the 1990s, those in higher income groups did better: life expectancy rose by
0.2 years in the bottom income decile compares to 0.8 years in the top income decile.
But this measure is not immune from criticism either. Individual decisions regarding
healthy behavior exert an important influence on health outcomes over the life-course,
3
and it is rarely clear whether these choices should be attributed to “preferences,”
education, or economic status per se (Graham, 2002; Contoyannis and Jones, 2004;
Smith, 2003. As well, long and variable lags in outcomes makes it difficult to evaluate
the impact of the current health care system on changes in current health outcomes,
particularly when income itself is endogenous to health status (Case and Deaton, 2003).
That the two measures of health inequality arrive at directly opposite conclusions
is suggestive of the need for a different approach to measuring health inequality. We
focus on a more limited set of effective (or high-quality) utilization measures, procedures
with well-established benefits so that preferences for care should play a secondary role.2
These measures include mammography screening among women age 65-69, eye
examinations for diabetics, and aspirin, ß-blockers, smoking cessation advice, and
reperfusion in the first 12 hours following the heart attack, treatments that accounted for
nearly all of the improvement in survival following heart attacks (Heidenreich and
McClellan, 2001). 3 Nor does one need to adjust for preferences or health status across
income groups, since among ideal or appropriate patients, the target rate approaches 100
percent regardless of income or demographic group.4 These health care quality measures
also avoid the most serious problems inherent in outcomes measures, since they do not
depend on other factors (genetic, lifestyle, etc.) that might exert an independent influence
on outcomes.
2 This terminology follows that in Wennberg et. al. (2002). 3 These measures are used commonly in the clinical literature to measure quality of care, for example see Jencks (2003). 4 Although for screening programs see Walter et. al. (2004).
4
Using the Medicare claims data augmented with the Cooperative Cardiovascular
Project (CCP) data for heart attack patients in 1994/95, we find distinct income gradients
with regard to the use of effective care. For mammography, examination rates for the top
income decile were 16 percentage points higher in 1993, and by 2001 the gap had shrunk
only slightly to 15 percentage points. For the inpatient treatment of heart attacks in
1994/95, where the use of effective care is unlikely to have any incremental impact on
patient costs and where noncompliance is minimal, the income gradients are smaller; 7
percentage points for ß blockers and 5 percentage points for the use of ACE inhibitors,
with no significant differences in aspirin use. Even these income gradients should be
interpreted with caution; for ß Blocker use, half of the income gradient is the
consequence of where low income people live (a larger fraction reside in regions with
lower overall quality rates) rather than their relative income within a region.
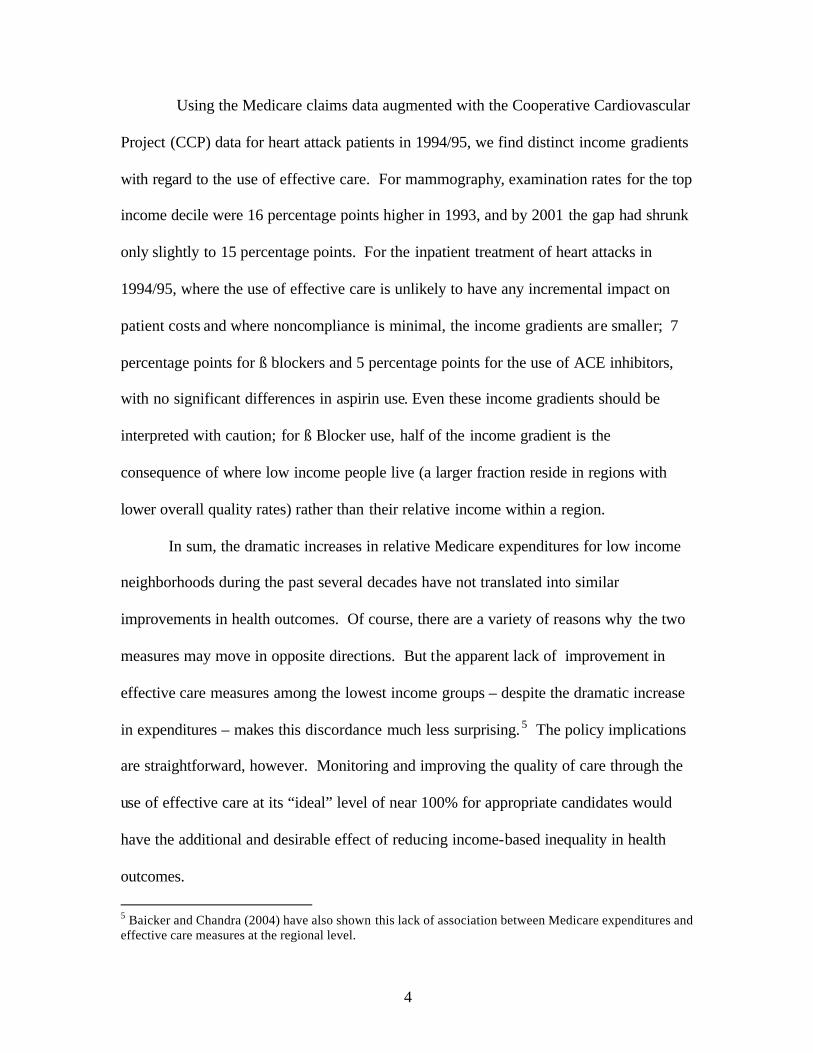
In sum, the dramatic increases in relative Medicare expenditures for low income
neighborhoods during the past several decades have not translated into similar
improvements in health outcomes. Of course, there are a variety of reasons why the two
measures may move in opposite directions. But the apparent lack of improvement in
effective care measures among the lowest income groups – despite the dramatic increase
in expenditures – makes this discordance much less surprising. 5 The policy implications
are straightforward, however. Monitoring and improving the quality of care through the
use of effective care at its “ideal” level of near 100% for appropriate candidates would
have the additional and desirable effect of reducing income-based inequality in health
outcomes.
5 Baicker and Chandra (2004) have also shown this lack of association between Medicare expenditures and effective care measures at the regional level.

5
1. The Measurement of Health and Health Care Inequality
It is important to distinguish between inequality in health care and inequality in
health. There is a long history of measuring inequality in health care by the use of
utilization or expenditures measures.6 Le Grand (1978, 1982) and others found a positive
gradient between expenditures and income after controlling for measures of health status
in the United Kingdom, even after several decades of National Health Insurance. While
there was a lively debate about how best to measure income-based gradients in health
care (e.g., Wagstaff et. al., 1991, Le Grand, 1991), the positive association between
expenditures and income has been found in many countries with just a few exceptions
(Wagstaff et. al., 1991). The earlier evidence from the United States pointed towards the
same positive association between expenditures and income (Davis and Reynolds, 1975;
Link, Long, and Stettle, 1982), although more recent data on Medicare expenditures in
the 1990s suggests that a “twist” may have occurred where lower income households
began to account for higher levels of spending.7 We cons ider this “twist” in more detail
below.
The interest in illness-adjusted expenditures or utilization can be motivated by a
concern about access to care, where the null hypothesis of perfect equality is presumably
one where high income and low income individuals with similar medical ailments would
be treated with the same procedures and with the same degree of intensity. But several
authors have questioned whether equal rates of utilization are really the same as equal
access, for example if people with high incomes experienced different preferences for
care (e.g., Moody et. al., 1991, see Culyer et. al., 1991).
6 Le Grand (1978) includes cites to the earlier literature; also see Gittelsohn et. al (1982). 7 Lee, McClellan and Skinner, 1999; Battacharya and Lakdawalla, 2004; McClellan and Skinner, 2004.

6
While economists are generally comfortable taking preferences as given, the issue
is more nuanced in the health care literature. For example, Irbrahim, et. al. (2001, 2002)
documented more distrust of surgery among black candidates for hip or knee
replacement, and placed greater reliance on alternative (non-surgical) approaches such as
copper bracelets or prayer. Katz (2001) has distinguished between preferences “guided
by informed decisions” and those “limited by truncated opportunities or historical
circumstances.” Distinguishing between these two types of preferences in making
inferences about inequality would be quite difficult.
Another shortcoming of using health expenditures is that higher levels of
expenditures may not translate into better health outcomes. Glover (1938) counseled
against the overuse of tonsillectomies at a time when the risk of surgical complications
was high. He and his colleagues noted that children of anxious high- income parents were
more likely to receive the procedure and hence more likely exposed to the risk of
operative mortality. Schneider et. al. (2001) suggested that part of the explanation for the
black-white differences in cardiac surgery rates was that white patients experienced rates
higher than appropriate. In either case, higher expenditures did not translate into better
health. 8
Health care expend itures have also been used to construct measures of “full
income” that include both money income and government-financed health care
expenditures. This approach was pioneered by Smolensky and his colleagues at
Wisconsin during the 1970s in the study of income distribution (Reynolds and
Smolensky, 1976; Moon, 1976), and extended to valuing health care benefits in a money-
8 More generally, Fisher et. al. (2003a, b) has suggested that regions with greater use of health care were no more likely to experience better outcomes or even improved satisfaction of patients and access to care.

7
metric context (Smolensky, et. al., 1977). More recently, Fuchs (1999, 2001) has used
this approach to document the very large fraction of full income among the elderly in the
U.S. comprising health care expenditures, most of which is paid for by younger
generations. The implicit message in creating full income measures is the opportunity
cost of health care spending, that a modest reduction in health care spending could have a
large impact on money income, particularly among low income groups. In the analysis
below, we follow in the spirit of this approach by comparing the evolution of median
money income with health care expenditures.
In the past decade, there has been an increasing interest in the inequality of health,
whether measured as lifespan, quality-adjusted life years, healthy life years, or self-
reported health. 9 Measuring health outcomes avoids the problem of inferring the
effectiveness of health care expenditures on outcomes. It also has the advantage of
capturing income-based differences in a variety of factors such as health behavior, diet,
and life-course events that have a larger impact on health outcomes than the health care
system alone. The results are if anything quite a bit stronger, exhibiting a uniform and
consistent gradient between income and health care outcomes.
Inequality in health outcomes can be present even in the absence of inequality in
health care. Suppose that the health care system were perfectly fair, and provided instant
access at minimal price to all people in society. Inequality in outcomes could occur for a
variety of reasons. The first is simply luck or genetic differences across the population
(Gakidou, Murray, and Frenk, 2000), conditional on income and other factors. However,
9 Berloffa, Brugiavini, and Rizzi, 2003; Case and Deaton, 2003; Contoyannis and Jones, 2004; Elstad and Krokstad, 2003; Gakidou, Murray, and Frenk, 2000; Glied and Lleras-Muney, 2003; Goldman and Smith, 2002; Preston and Taubman, 1994; Van Doorslaer, et. al., 1997; Wagstaff and van Doorslaer, 2004.
8
most summary measures of income-based health inequality remove this source of
inequality by averaging over large numbers of individuals. For example the
“concentration index” compares the cumulative distribution of income on the horizontal
axis, and the cumulative distribution of healthy life years (however measured) on the
vertical axis, thereby averaging out variation occurring within income categories.10
The second source of inequality could occur because of differences in health
behavior such as diet, smoking, exercise, drinking, and other factors associated with
income and socioeconomic status, so that “... inequalities in health reflect the wider
inequalities in society.” (Le Grand, 1982, p. 45.) For example, Contoyannis and Jones
(2004) report that these measures of “healthy living” in 1984 were strong predictors of
positive good health in 1991. Of course, this raises the very difficult question again of
how one can separate “preferences” for health-related behavior from income per se.
The third reason why income-based inequality may arise is in the context of a
model where income and health outcomes are each determined by early childhood
opportunities. Almond (2003) has shown that the influenza epidemic of 1918 led to a
long-term negative impact on both mortality and earnings for the cohort who were in
utero during the epidemic. This by itself could have generated an income-survival
gradient in the absence of other factors. As well, models in which characteristics of the
individual, perhaps intrinsic or affected by socioeconomic status, class, race, and other
factors, jointly determines both earning capacity and health (and its depreciation, Case
10 The measure of inequality is then calculated much like the Gini coefficient; for a general discussion of health inequality decompositions, see Contoyannis and Forster (1999) and Wagstaff and van Doorslaer (2003).

9
and Deaton, 2003), muddying the causal link between income and health outcomes even
further (Elstad and Krokstad, 2003, Graham, 2002).
Given our focus here on health care rather than on the host of income-related
behaviors determined over the lifecourse, we suggest a more restrictive and “cleaner”
measure of health care utilization that avoids many of the previous shortcomings. As
well, it preserves the rational for measuring inequality on the basis for income rather than
education or some other marker for socioeconomic status. Since income is the best
indicator of how much one pays into the health care system, one can compare it directly
with the quality of services provided through (in this case) the Medicare program.
We measure utilization rates of effective care, treatments for which nearly 100
percent of the population should be receiving the treatment, and its efficacy is well
proven. Examples include mammography screening for women aged 65-69, and ß
blocker, aspirin, reperfusion therapies, and ACE inhibitor use for appropriate heart attack
patients.11 These types of measures have also been used in the development of health
quality “report cards” such as HEDIS measures. As well, measures such as
mammography have been adopted in other studies with implicit recognition of their
effectiveness (Decker and Rapaport, 2002; Card, Dobkin, and Maestas, 2004).
There are several advantages in using these measures. The first is a reliable link
between utilization and health outcomes. Second, there is no need to control (however
imperfectly) for health status, since among appropriate or ideal patients, nearly everyone
should receive the treatment. Finally, preferences should generally not play a strong role
11 Reperfusion therapy (12-hour angioplasty or “clot busting” thrombolytics) is effective at removing the blockage or clots restricting blood flow to the heart. Aspirin is effective at breaking down platelets that are essential components of these clots interfering with blood flow. ACE inhibitors attenuate the body’s natural tendency to constrict vascular walls, while ß blockers reduce the body’s demands on the heart.

10
in the use of such measures, given that the objective benefits are so much larger than the
costs.12 Before considering these new approaches, however, it is useful first to consider
trends in the conventional measures of inequality in the U.S. Medicare population: health
care expenditures and survival rates.
2. The Distribution of Medicare Expenditures by Zip Code Income
The Continuous Medicare History Survey (CMHS), a 5 percent sample of every
Medicare enrollee, is used to consider the secular trends of overall Medicare expenditures
by income decile. Because individual income is not available in the Medicare claims
data, we instead use zip code income. There are advantages and disadvantages of using
zip code income. On the one hand, zip code income may better reflect permanent income
for elderly people, their neighborhood, compared to survey data, since reported income
may not reflect wealth ownership and is infested with measurement error and transitory
income components. On the other hand, zip code income is subject to “ecological bias,”
poor Medicare enrollees in rich neighborhoods could be treated differently from rich
enrollees in poor neighborhoods, so that zip code income also reflects neighborhood
effects. Previous studies have suggested that zip code income provides a reasonable
characterization of income in health-related research (see Geronimus, et. al., 1996).
In quantifying health care expenditures for the over 65 population, we express all
expenditures in 2001 dollars, and estimate age-sex-specific expenditures in 5-year
increments (plus those 85+) for each of 10 income deciles. In presented aggregated data,
we use direct adjustment to normalize the per capital Medicare expenditures to a constant
12 In practice, Walter et. al. (2004) has pointed out that preferences could play a legitimate role for a some patients in the use of screening for new disease. These arguments are harder to make in the case of heart attack treatments; it seems unlikely that anyone should prefer not to take aspirin following a heart attack. Alternatively, one may view the benefits as being sufficiently high to justify paternalistic efforts on the part of the government to encourage such practices.

11
age composition over time by use of the sample frequencies of the 10 age-sex
categories.13 Because of large sample sizes, it is possible to estimate reliably per capita
Medicare expenditures within cell groups despite the presence of outliers. Only fee-for-
service Medicare enrollees are included in the sample, which means that expenditures
made on behalf of enrollees in Medicare managed care will not be included in this
sample.14
We use zip code income information based on the 1990 Census, but the results are
similar if the 2000 Census income data were used. Table 1 and Figure 1 present
expenditures for selected income deciles from 1987-2001. Not surprisingly, real
Medicare expenditures have increased during this period. However, the rates of growth
by income group are quite different; the bottom decile experienced a 78 percent increase
in real expenditures, in contrast to the top decile with just a 34 percent increase.
The advantage of a “full income” measure of income is that these changes in
spending can be compared to changes over the same period of time in median money
income, as measured in the Current Population Survey. The median increase in family
income during the period 1987-2001 was $2551.15 Assuming an average of 1.5 elderly
people per family, this would translate into a per capita increase of $1700. Note that the
increase in expenditures for the lowest income decile was $2624, compared to $1214 for
13 Just the 80+ population is considered in quantifying home health care, and so for this group there are four age-sex categories, males 80-84, males 85+, females 80-84, and females 85+. 14 Until 1997, managed care organizations were reimbursed for their Medicare enrollees by a capitated fee based on 95% of the lagged value of regional fee-for-service expenditures, so that fee-for-service expenditures within a region would have been a reasonable measure of the managed care capitation fee. While the Balanced Budget Act of 1997 severed that close link, it is not expected that the relatively small fraction of Medicare managed care enrollees would bias these results. 15 In 2001$, http://www.census.gov/hhes/income/histinc/f11.html.

12
the highest income group. Thus the size of the “twis t” in Medicare expenditures was
$1410 ($2624 minus $1214) or the amount of money that would have been left “on the
table” had Medicare costs for the lowest income group grown at the same rate as the
highest income group. This number is nearly as large as the total increase in median
household income during 1987-2001. It is also larger than the average level of per capita
benefits from the Earned Income Tax Credit (EITC) program, estimated to be $1287 (in
2001 dollars) among the near-poor (Short and Garner, 2002). Unlike the EITC, the
redistribution occurring in the Medicare program was largely unintended, and the
differential benefits to the lowest income group are still not well understood.16
Why the twist? One reason could have been the growth in the Disproportionate
Share Hospitals (DSH) program that provided higher reimbursements for hospitals in low
income neighborhoods. A larger factor was the rapid expansion of home health care
during the 1990s. Beginning in the late 1980s, when restrictions on the use of home
health care were eased, there were dramatic increases in the use of home health care
particularly in certain regions of the U.S. such as Texas, Florida, and Tennessee
(Wennberg and Cooper, 1999). Because of the rapid growth in expenditures, and an
accompanying increase in scandals, Congress restricted its use sharply in 1997. These
expenditures for home health care were concentrated to a large extent in the poorest zip
16 One shortcoming with these changes in Medicare expenditures is that we do not have similar data on Medicaid expenditures. In theory, a decline in Medicaid expenditures among the low income groups could have been offset by this sharp increase in Medicare expenditures, with no net impact on transfers to lower income neighborhoods. However, Medicaid expenditure data by state and by year for home health care expenditures provides little support for this explanation. While Medicaid programs in Texas were spending more on recipients than in Texas in 1991 ($623 versus $74), by 1997 the spending levels had not changed appreciably ($647 per enrollee in New York, $146 in Texas). Source: http://www.cms.hhs.gov/statistics/nhe/state-estimates-residence/medicaid -per-capita50.asp

13
codes of the U.S.17 Figure 2 tabulates average home health care spending for the 80+
population (the most common users of home health care) by year for the lowest income
Decile 1, and for Deciles 5 and the highest income Decile 10. These are measures of
spending per Medicare enrollee age 80 and older, and not restricted just to users of home
health care. There was rapid growth in home health care expenditures for all income
groups, but the growth for Decile 1 was particularly notable, rising to $1635 per elderly
enrollee before dropping after 1997 when the Balanced Budget Act clamped down on
unrestricted use.
How much of this spending benefited low income patients, either through
improved survival or improved quality of life? In 1997, a report by the General
Accounting Office suggested that 40% of all home health care costs were “inappropriate”
(Havemann, 1997). In this case, inappropriate care included either fraud (e.g., a physician
prescribing tests for sexually transmitted diseases to all of his home health care patients)
or that the patient simply was not eligible for home health care. A recent paper by Robin
McKnight (2004) did not find adverse health consequences caused by the sharp decline in
home health care benefits in 1997, although there was a modest consequent increase in
out-of-pocket medical expenses. In short, one should be cautious about attributing all
dollar increases in Medicare expenditures to the people who nominally “receive” the
benefit. (This is a basic message of fiscal incidence studies; the benefits do not
necessarily flow to the people for whom the checks are written.) Home health care is not
17 See Lee, McClellan, and Skinner (1999).

14
the only service provided during the 1990s that may have also benefited providers’ bank
accounts, but it was certainly the most visible.18
3. The Distribution of Survival Gains by Income
We next consider overall survival gains in the Medicare population. Here the
sample includes not just the fee-for-service population but also the HMO enrollees; this is
to avoid potential selection bias caused by healthier individuals joining managed care
organizations. We consider two different cohorts from the Continuous Medicare History
Survey. The first is the group of people age 65-69 and 75-79 alive in 1982, and the
second is the corresponding group alive at age 1992. Figure 3 shows the percentage of
the groups age 65-69 in the initial year who were still alive ten years later by sex and year
of the cohort by income decile. There is a clear income gradient in both years; people
living in higher zip code incomes were more likely to survive during both the 1980s and
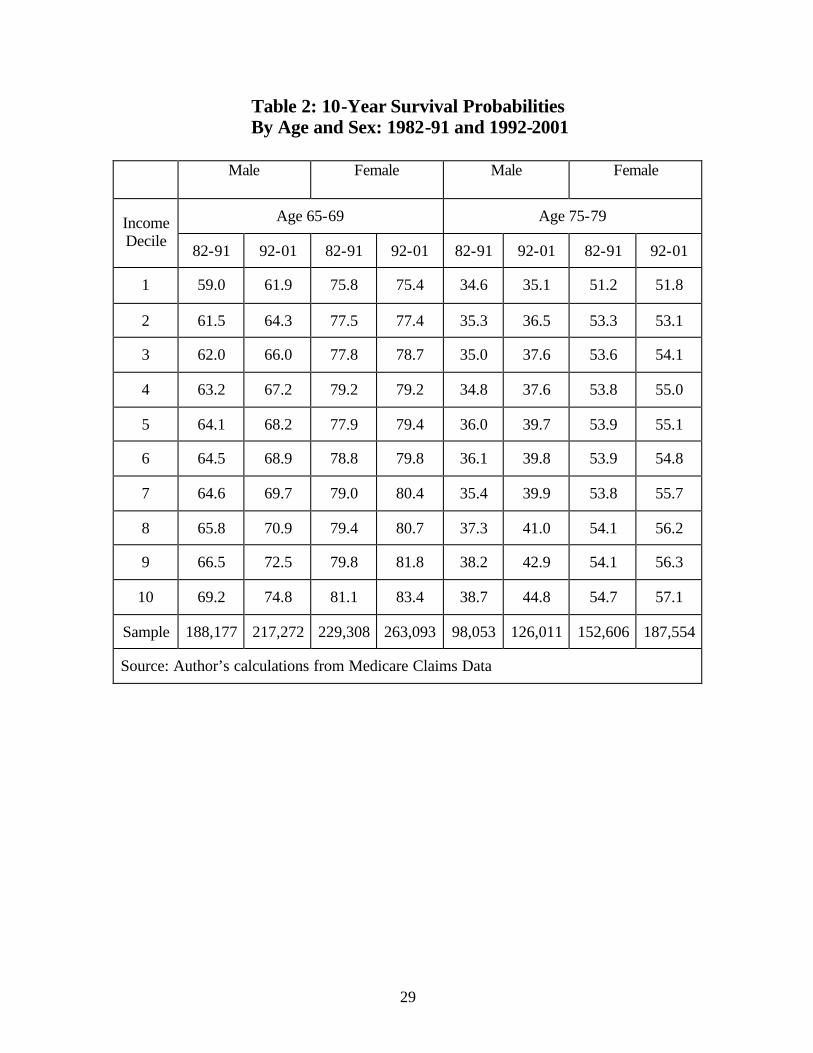
1990s. A similar pattern is shown for those aged 75-79 in 1982 and 1992, detailed in
Table 2, with life expectancy rising by more for men than for women. While all groups
gained in terms of survival probabilities, the highest income groups gained the most, both
in percentage and in absolute terms.
To quantify these changes in terms of the change in expected survival years, we
chain together the two panels of 10 year survival curves for the younger and older
cohorts, and estimate the change in expected survival years for a synthetic cohort over a
20 year period (from 65-69 to 85-89) with fixed weights for men and women based on
18 Another cause for the rapid increase in health care expenditures during the 1990s was upcoding whereby hospitals switched patients from low-reimbursement to high-reimbursement diagnostic related groups (Silverman and Skinner, 2004) and effectively increased the price charged per Diagnostic-Related Group (DRG). Upcoding, which is distinguishable from “bracket creep” by the absence of supporting evidence for the more expensive coding, was curtailed sharply also around 1997 following well-publicized investigations of a large for-profit hospital chain.
15
the fraction of women in the age 65-69 cohort (54.8 percent). There was a 0.2 increase in
expected life years in the bottom income decile, a 0.5 increase in the 5th decile, and a 0.8
increase in the top income decile.19 When these life expectancy increases are “priced” at
$100,000 per life year, the effects are large in magnitude, even after discounting.20
4. Inequality in the Provision of Effective Care
Here we focus on specific measures of effective care, considering first mammography
rates among women age 65-69 in the Medicare population. The advantage of using
mammography rates is that we have a time-series on rates of screening from 1993-2001
and so can measure changes over time in screening rates. A 5% sample of Part B
physician claims data is used from 1993-1997, and a 20% sample from 1998-2001. The
later 20% sample also includes outpatient clinic data as separate from physician data,
these would include women who were screened in a clinic but not under the direct care of
a physician. In theory, not including outpatient records for all years back to 1993 could
bias our results, although as we show including mammography examinations performed
in outpatient clinics has little effect on our results.
Figure 4 shows rates of screening by year for selected income deciles. There is a
pronounced income gradient in screening rates that persists throughout the period. In
1993, the range in screening rates (between Decile 1 and Decile 10) was 16 percentage
points, while in 2001, the range had shrunk slightly to 15 percentage points. A notable
feature of the data is the sharp jump in rates between 1997 and 1998. This was most
19 Another measure to quantify the changes over time is the concentration index, a variant of a Gini coefficient (Contoyannis and Forster, 1999). However, changes in the index were very small since we were just considering inequality in the over 65 population and not over the entire life-course. 20 Recently there have been efforts to integrate changes in the value of health into an optimizing life cycle model, as in Becker, Philipson, and Soares (2003) or Berloffa, Brugiavini, and Rizzi (2003).

16
likely the consequence of removing the $100 coinsurance payment on January 1, 1998. It
is surprising that rates for all income groups appear to have risen by about the same
amount, given that low income households should be most sensitive to the relaxation of
financial barriers to screening.
Similar results for the 1998-2001 period were also found in comparing rates of
screening for eye examinations among patients with diabetics, another effective care
measure to check for advanced damage to the vascular system caused by high blood
glucose levels (available upon request from the authors). While encompassing a shorter
time period, there was no evidence of trends in relative screening rates for diabetic eye
examinations.
Of course, some part of the income-based differential could be the consequence of
noncompliance; that is that lower income patients just don’t show up for their screening
appointment. We therefore consider physician directives or procedures performed in the
first few days following acute myocardial infarction, where the primary goal of the
physician is to keep the patient alive. Thus patient preferences (and even noncompliance)
should play a very small role here. The measures of effective care for heart attack patients
are derived from the Cooperative Cardiovascular Project (CCP) survey of approximately
160,000 AMI patients over age 65 in 1994/95. The survey information includes detailed
clinical data from chart reviews along with treatment protocols. This allowed clinical
researchers to determine from the chart data patients who were “ideal” for the use of the
specific treatment; thus the right rate should be a number near 100 percent, regardless of
health status, income, age, or any other characteristic. For this reason, we do not control
for covariates or health indices, but consider simple averages by income decile.
17
Table 4 presents income-based differences in utilization of effective care along
with the total sample size in the bottom row. Approximate 95% confidence intervals are
presented at the bottom of the table; these apply to each of the means in the column
because the deciles ensure equal sample sizes and the exact binomial confidence intervals
are based on the average ratio. The first characteristic of these data are that in 1994/95,
rates of utilization were remarkably low, hovering around 50 percent of ideal patients
when the target rates should have been near 100 percent. The second characteristic is
that higher income deciles are more likely to use effective treatments; rates rise from 40
percent in the bottom income decile to 47 percent in the top decile. There is a modest but
significant difference in use of this effective care measure by income group.
One additional question is whether high income individuals are more likely to
receive higher quality care because of treatment differences within regions, or because
they are more likely to live in regions where overall effective care rates are higher
(Chandra and Skinner, 2003). In Figure 5 utilization rates for ß Blockers are estimated
with and without categorical regional variables. First, the previous results are replicated
in a logistics regression coefficients converted to percentage screening rates (For
significance levels in the linear context, see Table 4). State dummy variables are then
introduced and the logistics regression is reestimated, again with odds ratios converted to
probabilities, and shown in Figure 5. The adjusted probability of ß Blocker use holding
constant the state of residence shows just a 3.6 percentage point difference by income
group rather than a 7 percentage point difference. (In this latter regression, only the 8th
and 10th decile coefficients were significantly different from zero.) That is, half of the
income gradient here is the consequence of where patients live and not how patients are

18
treated within regions. The result does not generalize, however. A similar analysis for
mammography screening and diabetic eye exams during 1998-2001 did not suggest any
diminution in the effects of income on utilization rates after controlling for region of
residence.21
In theory, we would like to know how the income gradient in ß Blocker use
evolved over time. We have one observation from the survey in 1994/95. Since the use
of ß Blockers for heart attack patients were rare before the early 1980s, we may safely
infer that the observed difference in 1994/95 reflects a somewhat higher growth rate in
the use of ß Blockers among the top income deciles until 1994/95. Since then, the
designation of ß blocker use as a common quality measure has helped to increase
compliance, but in many states they are still used for fewer than 70 percent of ideal
patients even in 2001 (Jencks, 2003). It is possible that rates of compliance have risen
more in low income regions, but Alabama was low in the use of ß Blockers in 1994/95
and it remains very low in 2001.
5. Conclusions and Discussion
While the income gradient in health is well established, the link between
inequality in health care expenditures and inequality in health is not well established.
This paper has considered these issues for the elderly population in the US by measuring
changes over time in inequality in health care, and changes in health inequality, during
the 1990s. There was a sharp divergence in the two trends. While Medicare
expenditures grew by 78 percent among the lowest income neighborhoods during the
period 1987-2001, the growth rate was just 34 percent in the highest income groups. The
21 In this case, because the sample sizes were so much larger, we were able to use the 306 hospital referral regions (Wennberg and Cooper, 1999) as regional controls instead of states as in the analysis of ß blockers.

19
magnitude of the “twist” in Medicare expenditures during this period was $1410 per
capita, which is comparable or larger than the per capita level of expenditures on many
social welfare programs.
A different pattern was observed with regard to outcome measures. Life
expectancy grew by 0.2 years for a typical 65-69 year old in the bottom income decile,
and by 0.8 years in the top income decile. At face value, these results should create doubt
that inequality in health care expenditures (and indeed, in health care more generally)
should have a significant positive association with inequality in health outcomes.
A more careful look at the expenditure data suggests that the lack of association between
the two series is not entirely surprising. One might expect the strongest link between
health outcomes and the utilization of efficacious health care. Because there does not
appear to be an association between efficient or high-quality care, and overall Medicare
expenditures, there is less reason to believe that the rapid increase in health care
expenditures should have resulted in a dramatic reduction of health care inequality (also
see Baicker and Chandra, 2004).
It should be cautioned that the magnitudes of the differences in effective care
observed in the data would not be expected to exert a large impact on overall mortality
rates. The impact on heart attack patients of a 7 percentage point increase in ß blocker
use (i.e., the difference between the top and bottom income decile rate of use) is a 0.21
percentage point shift, or an overall impact on the general population of about 0.01
percent (since roughly 5 percent of the Medicare population experience a heart attack in

20
any year).22 ). If changes over time in health outcomes also result from new technologies
where the presence of income- or education-based inequalities has also been noted (e.g.,
Lleras-Muney and Lichtenberg, 2002; Glied and Lleras-Muney, 2003; Goldman and
Smith, 2002) the magnitude of these effects could be larger.
There are three important limitation of this study. The first is that in using
outcome data, we have focused only on survival and not quality-adjusted or “healthy life
years.” To capture a more full measure of health, it would be necessary to include
income-based differentials in treatments with proven effectiveness but for improving
functioning rather than survival per se. Examples include hip or knee replacements for
the treatment of osteoarthritis or the use of angioplasty for patients with ischemic heart
disease. However, measuring true income-based differences is more difficult, given the
necessity of adjusting for differential health needs (i.e., rates of osteoarthritis of the hip
by income group) and for preferences (however defined) regarding surgical intervention.
Second, the study is limited to just the over-65 population. Focusing just on
income-based differences in mammography rates within the Medicare program ignores
the fact that Medicare itself contributes to a substantial increase in mammography rates at
age 65 among those previously uncovered by insurance or in lower educational groups
(Decker and Rapaport, 2002; Card, Dobkin, and Maestas, 2004). Measuring inequality
within a specific age group ignores potential differences across age groups in overall
inequality (Danziger, Haveman, and Smolensky, 1977).
22 The 0.21 percent shift is derived by multiplying 7 percentage points times the implied 3 percentage point reduction in one-year mortality estimated by using an odds ratio (estimated for 30 day mortality) of 0.88 reported in Heidenrich and McClellan (2001).

21
Finally, we have not considered the financing side of the Medicare program.
During the 1990s payments both rose and became more progressive as general income
taxes became a larger source of revenue (McClellan and Skinner, 2003). The new
prescription drug benefits passed into law in 2003 should also contribute to an increasing
degree of redistribution to the extent the future growth in benefits are financed out of
general tax revenue. Whether increased progressivity in the Medicare program would
justify the increased longevity of higher income households is not entirely clear,
however.
A sure approach to reducing inequality in overall health outcomes would be to
increase utilization rates for effective (or quality) care to near 100 percent, which by
definition would eradicate any income-based inequality in such care. Income-based
inequality in health outcomes would likely persist because of other factors in social
inequality, but such differences would not be exacerbated by inequality in health care.
One could imagine “non-discrimination” rules like those developed for 401(k) pension
plans in which hospitals or health care systems would experience a partial loss in
Medicare funding if effective care measures for their low income patients fell too far
below those for their high income patients.

22
References Almond, Douglas, “"Is the 1918 Influenza Pandemic Over? Long-term Effects of In
Utero Influenza Exposure in the Post-1940 U.S. Population" mimeo, National Bureau of Economic Research, 2003.
Auerbach, Alan, Jagadeesh Gokhale, and Laurence J. Kotlikoff, "Social Security and
Medicare Policy from the Perspective of Generational Accounting," in J.M. Poterba (ed.) Tax Policy and the Economy 6. Cambridge: NBER and MIT Press (1992).
Baicker, Katherine, and Amitabh Chandra, “Medicare Spending, the Physician
Workforce, and Beneficiaries’ Quality of Care” Health Affairs (April 7, 2004). Battacharya, Jay, and Darius Lakdawalla, “Does Medicare Benefit the Poor? New
Answers to an Old Question,” NBER Working Paper No. 9215 (revised, 2004). Becker, Gary S., Thomas J. Philipson, and Rodrigo R. Soares, “The Quantity and Quality
of Life and the Evolution of World Inequality,” NBER Working Paper No. 97645 (June 2003).
Berloffa, Gabriella, Agar Brugiavini, and Dino Rizzi, “Health, Income and Inequality:
Evidence from a Survey of Older Italians,” University of Venice Working Paper (January 2003).
Bommier, A., and G. Stecklov, “Defining Health Inequality: Why Rawls Succeeds Where
Social Welfare Theory Fails,” Journal of Health Economics 21(3) (2002): 497-514.
Card, David, Carlos Dobkin, Nicole Maestas, “The Impact of Nearly Universal Insurance
Coverage on Health Care Utilization and Health: Evidence from Medicare,” NBER Working Paper No. 10365 (March 2004).
Case, Anne, and Angus Deaton, “Broken Down By Work and Sex: How Our Health
Declines,” NBER Working Paper No. 9821 (July 2003). Chandra, Amitabh, and Jonathan Skinner, “Geography and Racial Disparities in Health,”
NBER Working Paper (February 2003). Contoyannis, Paul, and Martin Forster, “The Distribution of Health and Income: A
Theoretical Framework,” Journal of Health Economics 18(5) (1999): 605-622. Contoyannis, Paul, and Andrew M. Jones, “Socio-Economic Status, Health, and
Lifestyle,” Journal of Health Economics (2004, forthcoming).

23
Culyer, A.J., Eddy van Doorslaer, and Adam Wagstaff, "Comment: Utilisation as a measure of equity by Mooney, Hall, Donaldson, and Gerard," Journal of Health Economics 11 (1992): 93-98.
Cutler, David, Mark McClellan, Joseph Newhouse, and Dahlia Remler, “Pricing Heart
Attack Treatments,” Quarterly Journal of Economics 113(4) (November 1998), 991-1024.
Danziger, Sheldon, Robert Haveman, and Eugene Smolensky, “The Measurement and
Trend of Inequality: Comment,” American Economic Review 67(3) (June 1977): 505-512.
Davis, Karen, and Roger Reynolds, "Medicare and the Utilization of Health Care
Services by the Elderly," Journal of Human Resources 10(3): 361-77 (1975). Deaton, Angus, and Christina Paxson, “Mortality, Income, and Income Inequality Over
Time in Britain and the United States,” NBER Working Paper No. 8534 (October 2001).
Decker, Sandra, and Carol Rapaport, “Medicare and Disparities in Women’s Health,”
NBER Working Paper No. 8761 (February 2002). Elstad, Jon Ivar, and Steinar Krokstad, “Social Causation, Health-Selective Mobility, and
the Reproduction of Socioeconomic Health Inequalities Over Time: Panel Study of Adult Men,” Social Science and Medicine 57 (2003): 1475-1489.
Fisher, Elliott S., David Wennberg, Therese Stukel, Daniel Gottlieb, F.L. Lucas, and
Etoile L. Pinder, “The Implications of Regional Variations in Medicare Spending. Part 1: The Content, Quality, and Accessibility of Care,” Annals of Internal Medicine 138(4) (February 18, 2003a): 283-287.
Fisher, Elliott S., David Wennberg, Therese Stukel, Daniel Gottlieb, F.L. Lucas, and
Etoile L. Pinder, “The Implications of Regional Variations in Medicare Spending. Part 2: Health Outcomes and Satisfaction With Care” Annals of Internal Medicine 138(4) (February 18, 2003b): 288-299.
Fuchs, Victor, “The Financial Problems of the Elderly: A Holistic Approach,” NBER
Working Paper No. 8236 (April 2001). Fuchs, Victor, “Provide, Provide: The Economics of Aging” NBER Working Paper No.
6642 (July 1998). Gakidou, E.E., C.J.L. Murray, and J. Frenk, “Defining and Measuring Health Inequality:
An Approach Based on the Distribution of Health Expectancy,” Bulletin of the World Health Organization 78(1) (2000): 42-54.

24
Geronimus, Arline, John Bound, and Lisa Neidert, “On the Validity of Using Census Geocode Characteristics to Proxy Individual Socioeconomic Characteristics,” Journal of the American Statistical Association 91(434): 529-537 (1996).
Gittelsohn, Alan M., Jane Halpern, and Ricardo L. Sanchez, "Income, Race, and Surgery
in Maryland," American Journal of Public Health 81(11) (November 1991): 1435-41.
Glied, Sherry, and Adriana Lleras-Muney, “Health Inequality, Education, and Medical
Innovation,” NBER Working Paper No. 9738 (May 2003). Glover, J. A., “The Incidence of Tonsillectomy in School Children,” Proceedings of the
Royal Society of Medicine 31 (1938): 1219-1236. Goldman, D.P and J.P. Smith. 2002. “Can Patient Self-Management Help Explain the
SES Health Gradient?” Proceeding of the National Academy of Sciences of the United States of America 99(16): 10929-10934.
Gornick, Marian E., Paul Eggers, Thomas Reilly, Renee Mentnech, Leslye Fitterman,
Lawrence Kucken, and Bruce Vladeck, “Effects of Race and Income on Mortality and Use of Services Among Medicare Beneficiaries,” New England Journal of Medicine 335: 791-799 (1996).
Graham, Heather, “Building an Inter-Disciplinary Science of Health Inequalities: The
Example of Lifecourse Research,” Social Science and Medicine 55 (2002): 205-2016.
Havemann, Judith, “Fraud is Rife in Home Care for the Elderly; Medicare Investigators
Find 40% of Services Unjustified,” The Washington Post (July 29, 1997) p. A01. Heidenreich, Paul A., and Mark McClellan, “Trends in Treatment and Outcome for Acute
Myocardial Infarction: 1975-1995,” American Journal of Medicine 110 (2001): 165-74.
Ibrahim, S.A., L.A. Siminoff, C.J. Burant, and C.K. Kwoh, “Variations in Perceptions of
Treatment and Self-care Practices in the Elderly with Osteoarthritis: A Comparison Between African American and white Patients,” Arthritis and Rheumatism 45 (2001): 340-45.
Ibrahim, S.A., L.A. Siminoff, C.J. Burant, and C.K. Kwoh, “Understanding Ethnic
Differences in the Utilization of Joint Replacement for Osteoarthritis,” Medical Care 40 (Suppl 1) (2002): I44 – I55.
Jencks, Stephen F., Edwin D. Huff, and Timothy Cuerdon, “Change in the Quality of
Care Delivered to Medicare Beneficiaries,” JAMA 289(3) (January 15, 2003), 305-312.

25
Katz, Jeffrey N., “Patient Preferences and Health Disparities,” JAMA 286 (2001): 1506-9 Le Grand, Julian, “The Distribution of Public Expenditure: The Case of Health Care,”
Economica 45(178) (May 1978): 125-142. Le Grand, Julian, The Strategy of Equality. London, George Allen & Unwin (1982). Le Grand, Julian, “The Distribution of Health Care Revisited: A Commentary on
Wagstaff, van Doorslaer and Paci, and O’Donnell and Propper,” Journal of Health Economics 10 (1991): 239-245.
Lee, Julie, Mark McClellan, and Jonathan Skinner, “The Distributional Effects of
Medicare Expenditures,” in J. Poterba (ed.) Tax Policy and the Economy 13 (1999)
Link, Charles R., Stephen H. Long, and Russell F. Settle, "Equity and the Utilization of
Health Care Services by the Medicare Elderly," Journal of Human Resources 17(2) (1982): 195-212.
Lleras-Muney, Adriana, and Frank R. Lichtenberg, “The Effect of Education on Medical
Technology Adoption: Are the More Educated More Likely to Use New Drugs?” NBER Working Paper No. 9185 (September 2002).
Lubitz, James, and Gerald Riley, 1993, “Trends in Medicare Payments in the Last Year
of Life,” New England Journal of Medicine 331: 1092-1096. McClellan, Mark, and Jonathan Skinner, “The Incidence of Medicare.” Mimeo,
Dartmouth College (2004). McDermott, W. “The Public Good and One’s Own.” Perspectives in Biology and
Medicine 21 (1978): 167-188. McKnight, Robin, “Home Health Care Reimbursement, Long-Term Care Utilization, and
Health Outcomes,” NBER Working Paper No. 10414 (April 2004). Moon, Marilyn, “The Economic Welfare of the Aged and Income Security Programs,” in
M. Moon and E. Smolensky (eds.) Improving Measures of Economic Well-Being. New York: Academic Press (1977).
Mooney, Gavin, Jane Hall, Cam Donaldson, and Karen Gerard, “Utilisation as a Measure
of Equity: Weighing Heat?” Journal of Health Economics 10 (1991): 475-480. Morris, Stephen, Matthew Sutton, and Hugh Gravelle, “Inequity and Inequality in the
Use of Health Care in England: An Empirical Investigation,” Center for Health Economics Technical Paper No. 27, The University of York (December 2003).

26
Pappas, G., et al., “The Increasing Disparity in Mortality Between Socioeconomic Groups in the United States,” New England Journal of Medicine 329: 103-109 (1993).
Preston, Samuel, and Paul Taubman, “Socioeconomic Differences in Adult Mortality and
Health Status,” in Linda G. Martin and Samuel Preston (eds.) Demography of Aging (Washington DC: National Research Council and the National Academy Press) (1994).
Reynolds, M., and E. Smolensky, Public Expenditures, Taxes, and the Distribution of
Income: The U.S., 1950, 1961, 1970. (New York: Academic Press, 1977). Ross, Christine M., Sheldon Danziger, and Eugene Smolensky, “Interpreting Changes in
the Economic Status of the Elderly, 1949-79,” Contemporary Policy Issues 5 (April 1987): 98-112.
Sassi, F., L. Archard, and J. Le Grand, “Equity and the Economic Evaluation of
Healthcare.” Health Technology Assessments 5(3) (2001): 1-130. Skinner, Jonathan, and Douglas Staiger, “The Diffusion of Health Care Technology,”
Mimeo, Dartmouth College (May 2004). Skinner, Jonathan, Douglas Staiger, and Elliott Fisher, “Is Technological Change in
Health Care Always Worth It? The Case of Acute Myocardial Infarction,” mimeo, Dartmouth Medical School (May 2004).
Short, Kathleen, and Thesia I. Garner, “Experimental Poverty Measures Under
Alternative Treatments of Medical Out-of-Pocket Expenditures: An Application of the Consumer Expenditures Survey.” U.S Census (May 28, 2002).
Silverman, Elaine, and Jonathan Skinner, “Hospital Ownership and Medicare Upcoding,”
Journal of Health Economics (March, 2004). Smith, James, “Unraveling the SES-Health Connection,” mimeo, RAND Corporation
(September 2003). Smolensky, Eugene, Leanna Stiefel, Maria Schmundt, and Robert Plotnick, “In-Kind
Transfers and the Size Distribution of Income,” in M. Moon and E. Smolensky (eds.) Improving Measures of Economic Well-Being. New York: Academic Press (1977).
van Doorslaer, E., et. al., ”Income–Related Inequalities in Health: Some International
Comparisons,” Journal of Health Economics 16 (1997): 92-112.

27
Wagstaff, Adam, Eddy van Doorslaer, and Pierella Paci, “On The Measurement of Horizontal Inequity in the Delivery of Health Care,” Journal of Health Economics 10 (1991): 169-205.
Wagstaff, Adam, and Eddy van Doorslaer, “Overall versus Socioeconomic Health
Inequality: A Measurement Framework and Two Empirical Examples,” Health Economics 13 (2004): 297-301.
Walter, Louise C., Natalie P. Davidowitz, Paul A. Heineken, and Kenneth E. Covinsky,
“Pitfalls of Converting Practice Guidelines into Quality Measures: Lessons Learned From a VA Performance Measure,” JAMA 291 (20) (May 26, 2004): 2466-2470.
Wennberg, John E., and Megan M. Cooper, The Dartmouth Atlas of Health Care.
Chicago: American Hospital Association (1999). Wennberg, John E., Jonathan Skinner, and Elliott Fisher, “Geography and the Debate
Over Medicare Reform,” Health Affairs (February 2002).

28
Table 1: Medicare Expenditures by Year and Zip Code Income Decile
Decile 1 Decile 3 Decile 5 Decile 8 Decile 10
1987 3346 3159 3228 3478 3588
1988 3548 3309 3343 3556 3656
1989 3926 3619 3590 3817 3980
1990 4068 3637 3698 3904 3970
1991 4265 3852 3811 4050 4022
1992 4457 4039 3914 4119 4123
1993 4740 4140 4102 4199 4219
1994 5365 4553 4465 4432 4464
1995 5743 4736 4702 4605 4611
1996 5998 4931 4804 4596 4675
1997 6120 5073 4778 4651 4666
1998 6337 5311 5031 4804 4908
1999 6153 5299 5002 4719 4946
2000 5895 5068 4885 4614 4725
2001 5970 5080 4873 4574 4802
Dollar Change, 1987-2001 2624 1921 1645 1096 1214
Percentage Change, 1987-2001
78.4 60.8 51.0 31.5 33.8
Source: Medicare Continuous History Survey. Controls for age and sex. All expenditures expressed in $2001.
29
Table 2: 10-Year Survival Probabilities By Age and Sex: 1982-91 and 1992-2001
Male
Female
Male
Female
Age 65-69 Age 75-79 Income Decile
82-91 92-01 82-91 92-01 82-91 92-01 82-91 92-01
1 59.0 61.9 75.8 75.4 34.6 35.1 51.2 51.8
2 61.5 64.3 77.5 77.4 35.3 36.5 53.3 53.1
3 62.0 66.0 77.8 78.7 35.0 37.6 53.6 54.1
4 63.2 67.2 79.2 79.2 34.8 37.6 53.8 55.0
5 64.1 68.2 77.9 79.4 36.0 39.7 53.9 55.1
6 64.5 68.9 78.8 79.8 36.1 39.8 53.9 54.8
7 64.6 69.7 79.0 80.4 35.4 39.9 53.8 55.7
8 65.8 70.9 79.4 80.7 37.3 41.0 54.1 56.2
9 66.5 72.5 79.8 81.8 38.2 42.9 54.1 56.3
10 69.2 74.8 81.1 83.4 38.7 44.8 54.7 57.1
Sample 188,177 217,272 229,308 263,093 98,053 126,011 152,606 187,554
Source: Author’s calculations from Medicare Claims Data

30
Table 3: Mammography Rates by Year and Zip Code Income Decile
(Rates Including Outpatient Clinics in Parentheses, 1998-2001)
Decile 1 Decile 3 Decile 5 Decile 8 Decile 10
1993 20.7 25.9 28.2 30.6 34.6
1994 22.8 28.3 30.1 32.2 35.7
1995 24.0 30.1 31.7 33.0 36.8
1996 23.8 29.0 30.0 32.4 36.1
1997 24.7 29.3 31.6 33.3 37.1
1998 32.0 [34.8]
39.5 [42.0]
41.0 [43.9]
43.5 [45.7]
46.7 [48.5]
1999 34.3 [36.8]
41.9 [44.2]
43.6 [45.8]
45.4 [47.5]
48.1 [49.8]
2000 34.6 [36.9]
42.6 [44.8]
44.7 [46.6]
45.9 [47.8]
48.3 [49.9]
2001 36.5 [38.5]
44.0 [45.9]
45.3 [47.0]
47.0 [48.5]
49.4 [50.7]
Change: 1993-2001
15.8 18.1 17.0 16.4 14.8
Change: 1997-2001 11.7 14.7 13.7 13.7 12.3
Source: Medicare Continuous History Survey. Controls for age and sex. All expenditures expressed in $2001. The rates inclusive for outpatient clinics are presented in brackets. For Decile 10 in 1998, the rate is slightly lower inclusive of outpatient clinics because of a slightly different definition of the denominator.

31
Table 4: Rates of Effective Care for Acute Myocardial Infarction 1994/95: by Income Decile
Zip Code Income Decile
Beta Blocker Use at
Discharge*
Ace Inhibitor At Discharge**
Reperfusion within 12
Hours
Smoking advice
given*** 1 40 57 32 33
2 39 57 32 35
3 43 60 33 34
4 45 59 33 35
5 45 59 34 37
6 44 57 35 34
7 45 59 37 34
8 47 59 37 37
9 45 59 36 35
10 47 59 37 35
Approx. 95% Conf.
Interval ±1.4 ±2.2 ±1.7 ±2.3
Sample size 50,156 19,286 32,097 17,151 Source: Cooperative Cardiovascular Project. * Universe: appropriate (beta blocker) or eligible (for reperfusion). ** Universe: ideal patients *** Universe: smokers

32
Figure 1: Medicare Expenditures by Income Decile, 1987-2001
3000
4000
5000
6000
7000
1987
1989
1991
1993
1995
1997
1999
2001
Year
Med
icar
e E
xpen
dit
ure
s $
Decile 1
Decile 5
Decile 10

33
Figure 2: Home Health Care Expenditures by Income Decile, 1987-2001 Age 80+
0
400
800
1200
1600
2000
1987
1989
1991
1993
1995
1997
1999
2001
Year
Hom
e H
ealth
Car
e $
Decile 1
Decile 5
Decile 10

34
Figure 3: 10-Year Survival Rates For Age 65-69 Cohorts
By Sex: 1982-91 and 1992-2001
50%
55%
60%
65%
70%
75%
80%
85%
90%
1 2 3 4 5 6 7 8 9 10
Income Decile
10-Y
ear
Sur
viva
l (%
)
Female 1992-2001
Female 1982-91
Male 1982-91
Male 1992-2001

35
Figure 4: Change in Mammography Rates 1993-2001 By Zip Code
Income Decile
200
250
300
350
400
450
500
1993 1994 1995 1996 1997 1998 1999 2000 2001
Year
Rat
es (
per
1000
Wom
en)
Decile 1
Decile 2
Decile 5
Decile 9
Decile 10
Note: Rates per Females Age 65-69. The 100 dollar coinsurance rate was removed on 1 January 1998.

36
Figure 5: Estimates of the Income Gradient for the Use of ß Blockers for
Ideal Patients: With and Without State-Level Controls, 1994/95
36.0
38.0
40.0
42.0
44.0
46.0
48.0
1 2 3 4 5 6 7 8 9 10
Income Decile
Per
cent
Bet
a B
lock
er U
se
Controlling for State of Residence
Not Controlling for State of Residence