Embed Size (px)
Citation preview

©The McGraw-Hill Companies, Inc. 2008McGraw-Hill/Irwin
Chapter 17
Workforce: Optimizing Human Capital
17-2
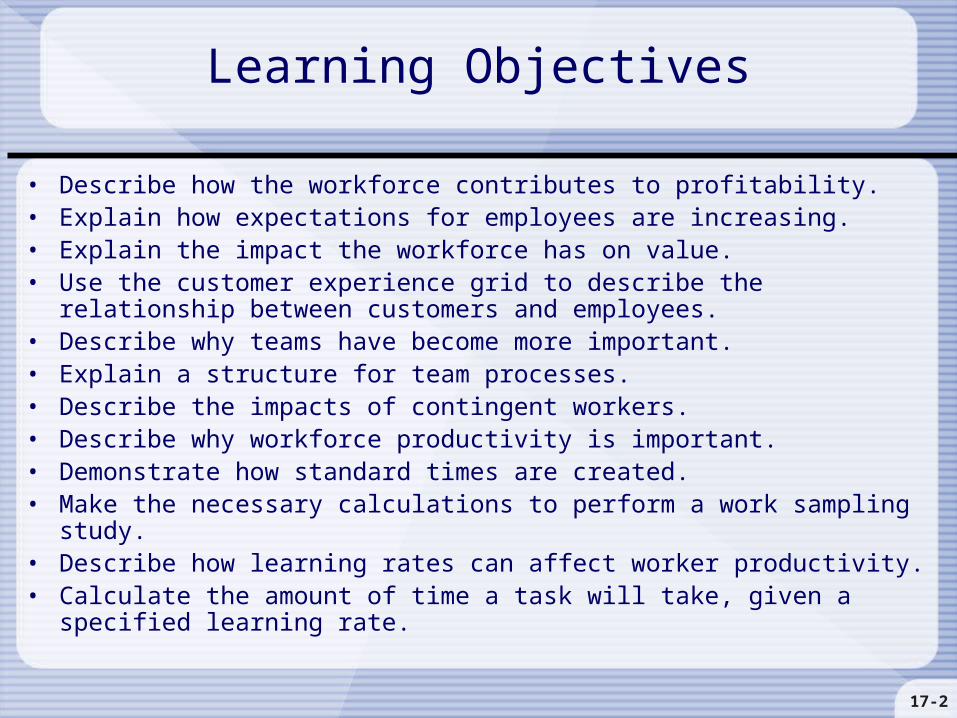
• Describe how the workforce contributes to profitability.• Explain how expectations for employees are increasing.• Explain the impact the workforce has on value.• Use the customer experience grid to describe the relationship between customers
and employees.• Describe why teams have become more important.• Explain a structure for team processes.• Describe the impacts of contingent workers.• Describe why workforce productivity is important.• Demonstrate how standard times are created.• Make the necessary calculations to perform a work sampling study.• Describe how learning rates can affect worker productivity.• Calculate the amount of time a task will take, given a specified learning rate.
Learning Objectives
17-3
• Why is the workforce viewed as the most valuable asset?– Businesses increasingly depend on information and technology
• Competition for workers who have related skills is fierce
– As products and services become more like commodities, competition based on price or quality becomes harder. • Market dominance shifts to the most innovative company, and ideas come
from people
– Competition is, to a great extent, based on service-oriented value attributes. • Employees who can interact effectively with customers are sought after
Introduction: Using the Workforce as a Key to Competitive Success

17-4
• Price and quality differentials disappear when customers have more information and access to more options through the Internet.
• Service-related attributes remain– How fast can I get it?
– How helpful were the people I talked to?
– How pleasant was the interaction?
• Managers are often afraid of letting employees talk to customers... but that’s what customers want.– Knowledgeable, committed employees may be one of the most
important competitive advantages remaining
Employee/Customer Interaction, Value, and Profitability
17-5
The Employee Contributions to Value Attributes
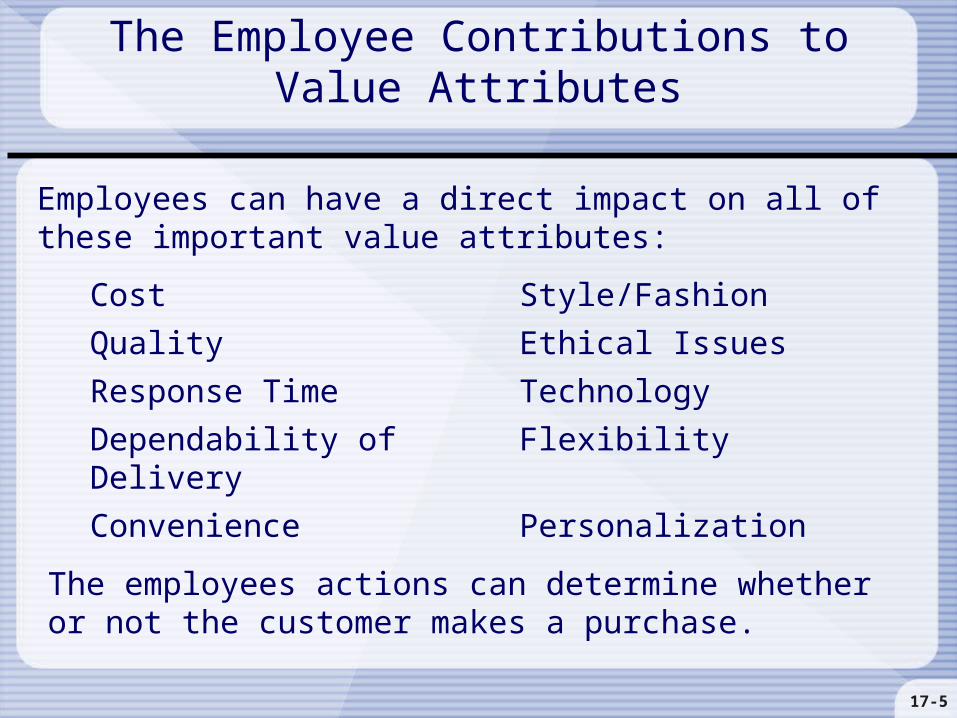
Cost Style/Fashion
Quality Ethical Issues
Response Time Technology
Dependability of Delivery Flexibility
Convenience Personalization
Employees can have a direct impact on all of these important value attributes:
The employees actions can determine whether or not the customer makes a purchase.
17-6
The Employee Contribution to Value Attributes
• Cost– Increased workforce productivity lowers costs per unit
– The best ideas for preventing waste and improving quality are often found at the lowest levels of the workforce
• Quality, response time, and dependability of delivery– Need a ‘quality mentality’ among employees. Quality can’t be achieved
through systems alone, it is cultural
17-7
The Employee Contribution to Value Attributes
• Convenience, style/fashion, and ethical issues– Workforce carries out tasks necessary to provide convenience
– When competing on style/fashion, having a workforce that understands the product and uses the product is helpful
– When competing on ethical issues, the workforce must be committed to those issues and be able to effectively communicate the company’s position
• Technology, flexibility, and personalization– Specific employee skills are required to enhance these attributes
– Flexibility and personalization often achieved through technological applications (created by skilled workers)
17-8
Employee Interaction with Customers:A Prerequisite to Good Service
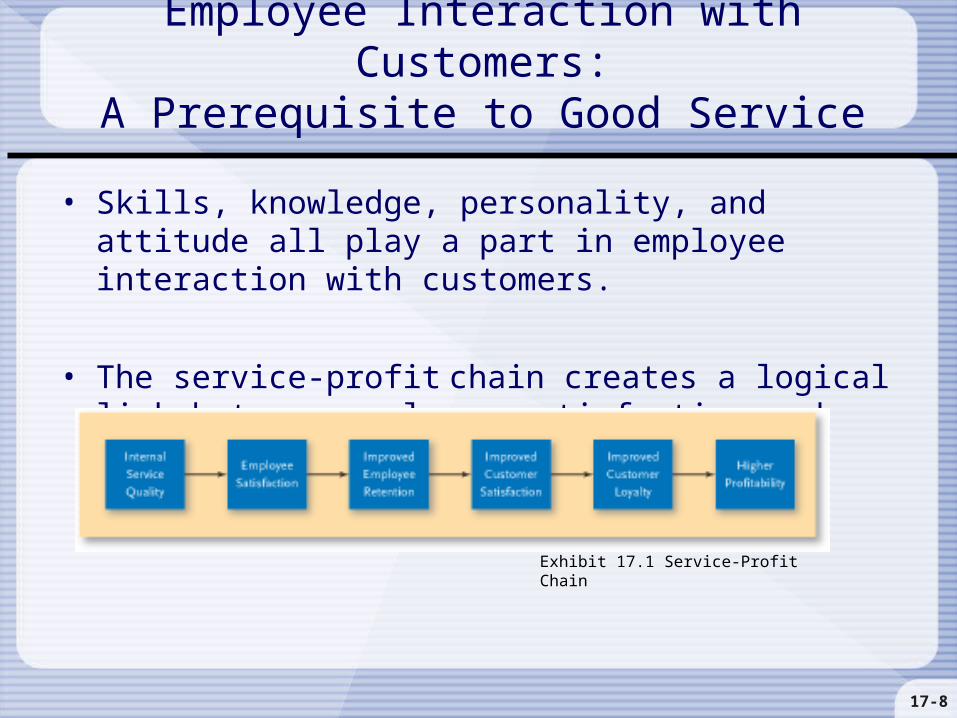
• Skills, knowledge, personality, and attitude all play a part in employee interaction with customers.
• The service-profit chain creates a logical link between employee satisfaction and profitability.
Exhibit 17.1 Service-Profit Chain
17-9
Employee Interaction with Customers: A Prerequisite to Good Service
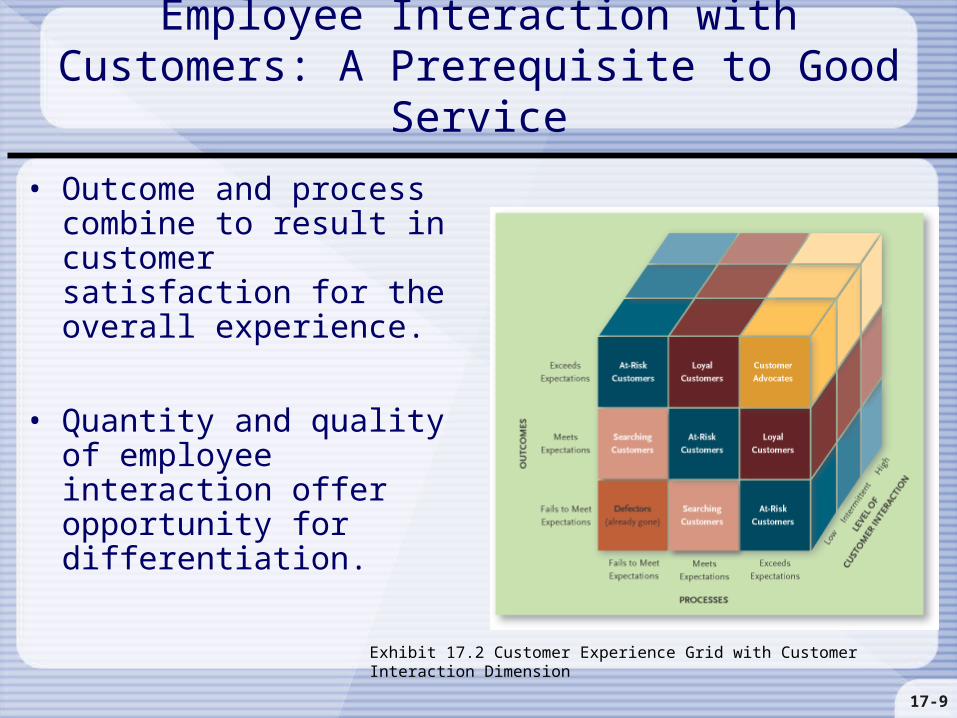
• Outcome and process combine to result in customer satisfaction for the overall experience.
• Quantity and quality of employee interaction offer opportunity for differentiation.
Exhibit 17.2 Customer Experience Grid with Customer Interaction Dimension
17-10
• Give workers at lower levels the authority to make decisions in areas they are familiar with.– Leads to increased interaction with customers
• Employees who work day-to-day with processes are often most qualified to help improve them.
The Most Important Employee Contribution to Value: Sound Decisions

17-11
• Use of project and improvement teams is on the increase.– Reengineering efforts frequently accomplished by project teams
– Total quality management and lean systems both rely heavily on well-trained worker teams
• Developing a team requires more than throwing workers together and giving them a task to do.– Members must know how to make decisions in a team
Exhibit 17.3 Project Team Capabilities
Increasing the Contribution ofEmployees through Teams
17-12
• Teams bring different perspectives and types of knowledge to a project.– Individuals can’t effectively do projects with broad requirements– Teams can be very creative because of the differing perspectives
• The duration of projects is reduced.– Teams split tasks up among members
• Teams promote “buy-in”– When a team has worked on a proposed change, they have a sense of
ownership towards it– Individuals have to sell their proposals and overcome the natural
resistance people have to ideas that aren’t their own
Increasing the Contribution of Employees through Teams: Why Use Teams?

17-13
• Teams are useful for implementing change.
• Innovation– A dramatic change that comes from a new idea.
• Continuous improvement– A process of always seeking ways to improve existing processes and
tasks.
Increasing the Contribution of Employees through Teams: Appropriate Uses for Teams
17-14
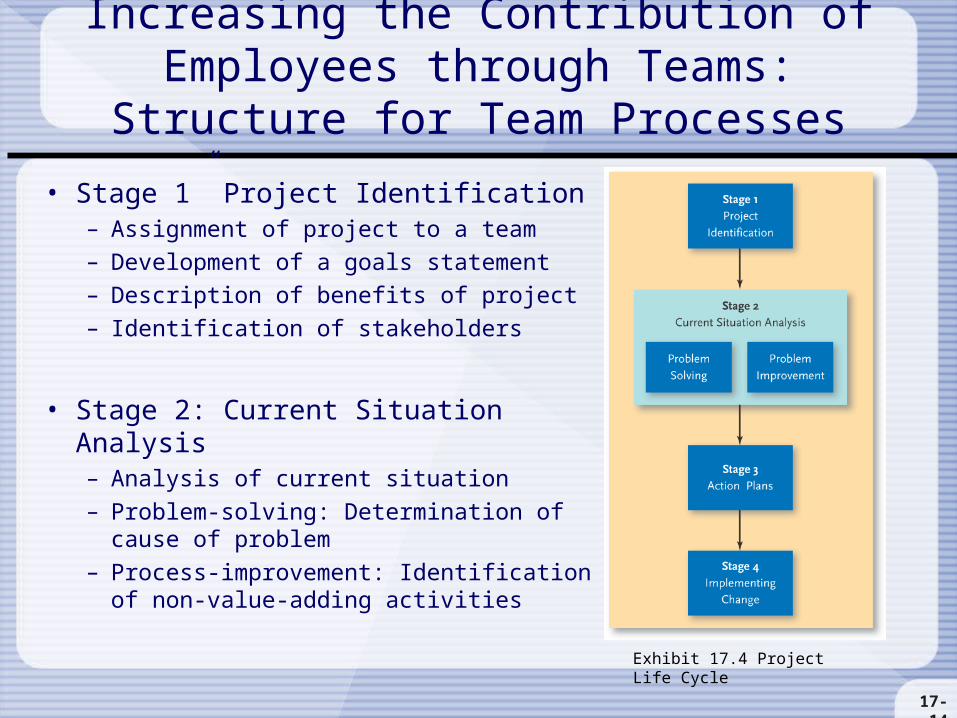
• Stage 1” Project Identification– Assignment of project to a team
– Development of a goals statement
– Description of benefits of project
– Identification of stakeholders
• Stage 2: Current Situation Analysis– Analysis of current situation
– Problem-solving: Determination of cause of problem
– Process-improvement: Identification of non-value-adding activities
Exhibit 17.4 Project Life Cycle
Increasing the Contribution of Employees through Teams: Structure for Team Processes
17-15
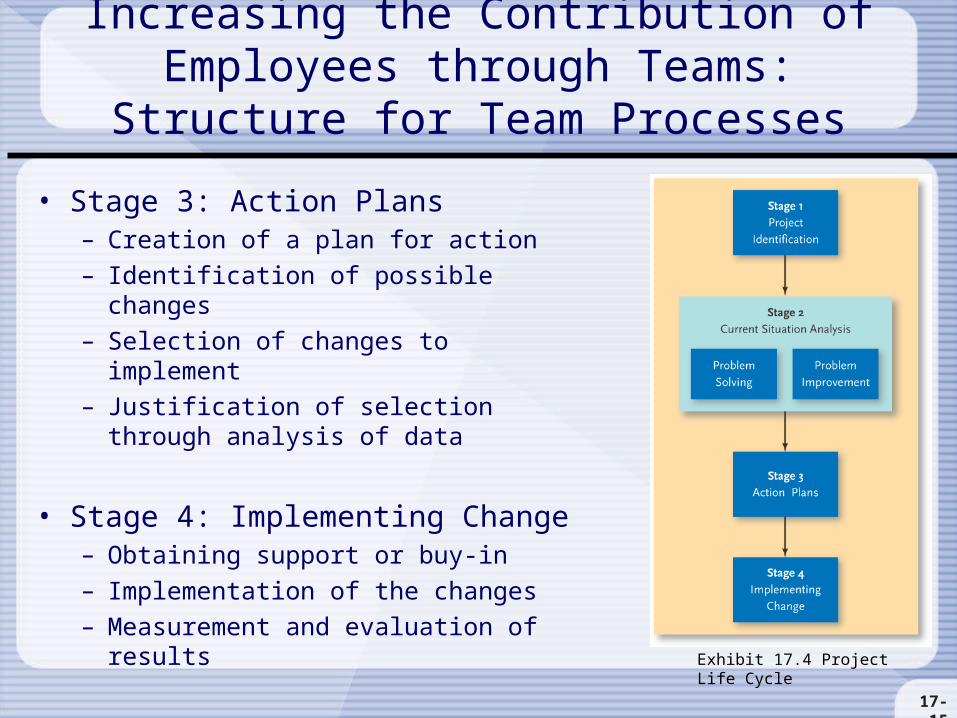
• Stage 3: Action Plans– Creation of a plan for action
– Identification of possible changes
– Selection of changes to implement
– Justification of selection through analysis of data
• Stage 4: Implementing Change– Obtaining support or buy-in
– Implementation of the changes
– Measurement and evaluation of results
Exhibit 17.4 Project Life Cycle
Increasing the Contribution of Employees through Teams: Structure for Team Processes
17-16
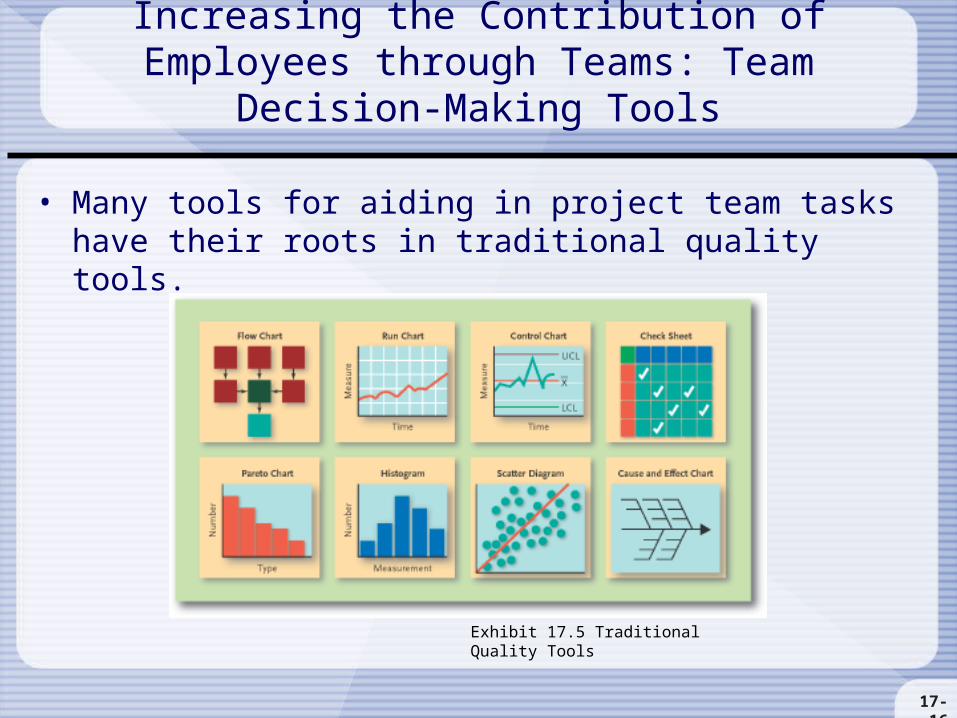
Increasing the Contribution of Employees through Teams: Team Decision-Making Tools
• Many tools for aiding in project team tasks have their roots in traditional quality tools.
Exhibit 17.5 Traditional Quality Tools

17-17
• Some likely uses of decision-making tools:
– Stage 1, identifying exactly what the team is to do:• Pareto charts give a sense of which item to address first
• Control charts might indicate a process being out of control
• Check sheets might indicate too many instances of a particular undesirable event
– Stage 2, understanding the current situation:• Analysis of run charts, Pareto charts, scatter diagrams, and histograms might
lead to suggestions for possible causes
• Cause and effect chart can aid in moving from possible to root causes
Increasing the Contribution of Employees through Teams: Team Decision-Making Tools
17-18
• Some likely uses of decision-making tools:
– Stage 3, the development of a solution:• Selecting the appropriate changes might involve run charts, scatter diagrams,
and flow charts
– Stage 4, development of buy-in and evaluation:• Implementing ongoing use of control charts• The same tools used to identify the problem would be used again to provide a
“before and after” view
• In addition to quality tools, there are techniques for building team consensus.
Increasing the Contribution of Employees through Teams: Team Decision-Making Tools
17-19
• Cross-training – Training employees to do a variety of jobs.– Increase contribution to the organization
– Employees find their work more interesting
– Employees have a larger perspective on the business and a larger sense of contribution to company’s goals
• Contingent workers – Temporary workers employed by an agency and contracted to work for another firm.– Includes employees of all abilities and salary levels
– Adds flexibility, enabling firms to deal with seasonal demand fluctuations or implementation of short-lived projects
– Potential cost to product and service quality
Increased Need for Workforce Flexibility
17-20
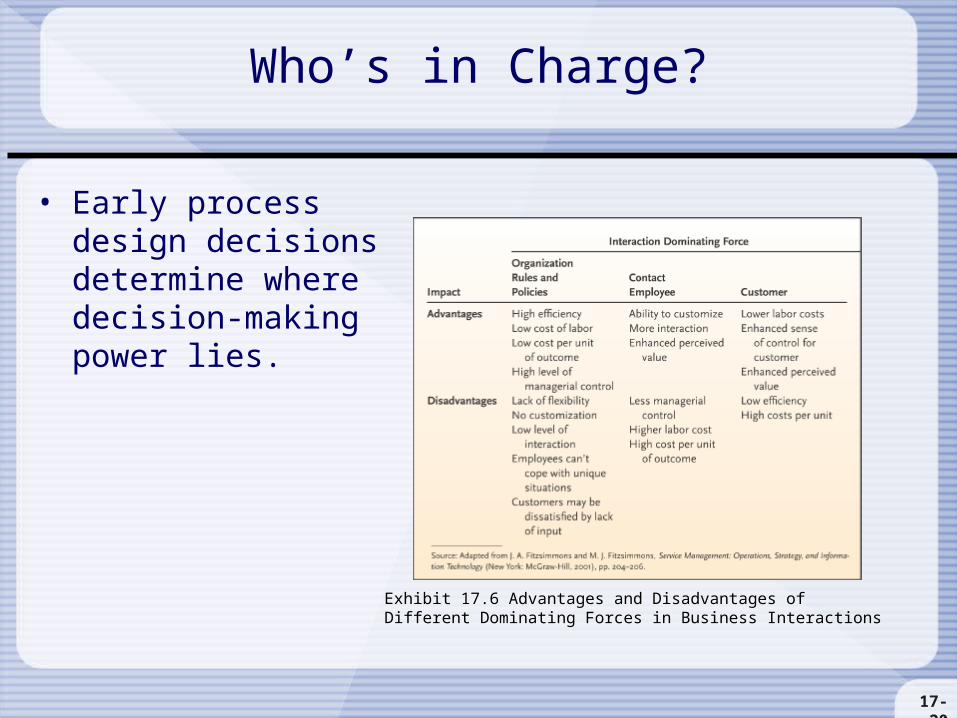
• Early process design decisions determine where decision-making power lies.
Exhibit 17.6 Advantages and Disadvantages of Different Dominating Forces in Business Interactions
Who’s in Charge?

17-21
• Businesses must be more networked– Respond to customer needs
– Use the increasing amount of information available about what customers want.
• Empowering employees is popular…– … but employees must be given the training necessary to make decisions.
• Increasing diversity in customer base, and in workforce.
The New Working Environment

17-22
• Like productivity for any other asset, workforce productivity exists as a ratio of outputs to inputs.
• Improving productivity does not necessarily require forcing employees to work harder. – Lack of productivity is often a result of the systems in which employees
work, not a lack of ambition.
• Productivity measures of individual resources are local. They can conflict with other measures and with the goals of the organization.
Workforce Productivity Improvement
17-23
• For some jobs, a standard is needed to provide a basis for training and evaluation. – A time standard is the expected time needed to complete a task
– Time standards are frequently used in manufacturing environments (Repetitive tasks with little variability)
• Common approaches to creating standards:– Stopwatch time studies
– Predetermined motion times
Workforce Productivity Improvement: Productivity Measurement and Improvement Tools

17-24
• In stopwatch time studies, employees are observed and timed as they do a task. – The average of the times of the observations, for one employee, is the
observed time
– The observed time is adjusted by a performance rating, to take into account whether the worker was faster or slower than normal
– The adjusted time is known as the normal time, which is how long a typical worker would take to complete a task
– Normal time is adjusted to incorporate allowances (restroom breaks, rest periods...) to arrive at the standard time
Workforce Productivity Improvement: Productivity Measurement and Improvement Tools
17-25
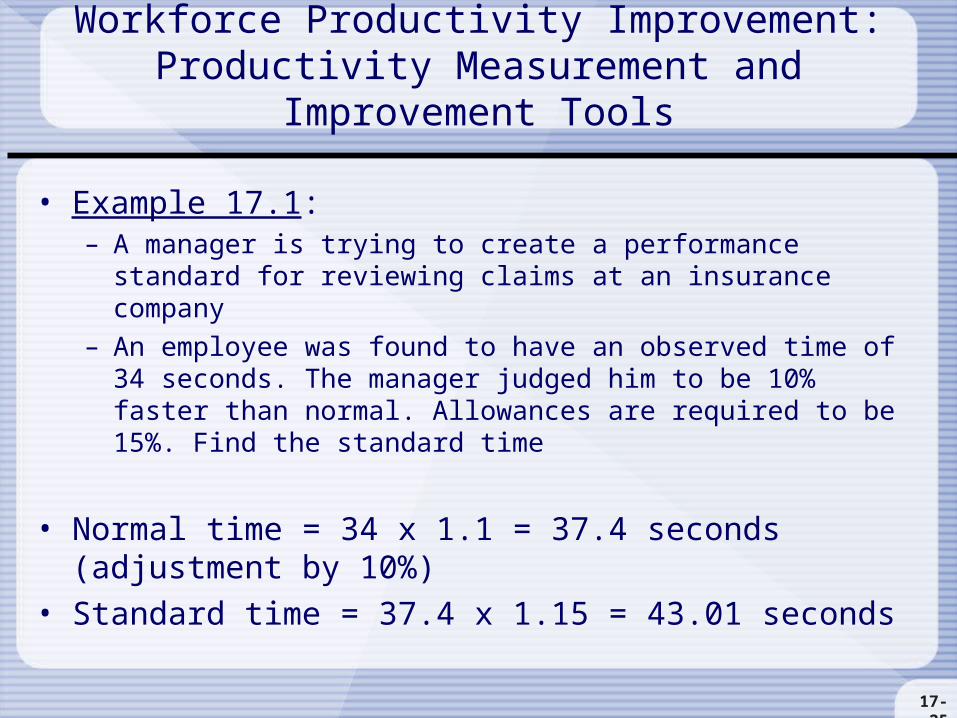
• Example 17.1:– A manager is trying to create a performance standard for reviewing claims
at an insurance company
– An employee was found to have an observed time of 34 seconds. The manager judged him to be 10% faster than normal. Allowances are required to be 15%. Find the standard time
• Normal time = 34 x 1.1 = 37.4 seconds (adjustment by 10%)
• Standard time = 37.4 x 1.15 = 43.01 seconds
Workforce Productivity Improvement: Productivity Measurement and Improvement Tools
17-26
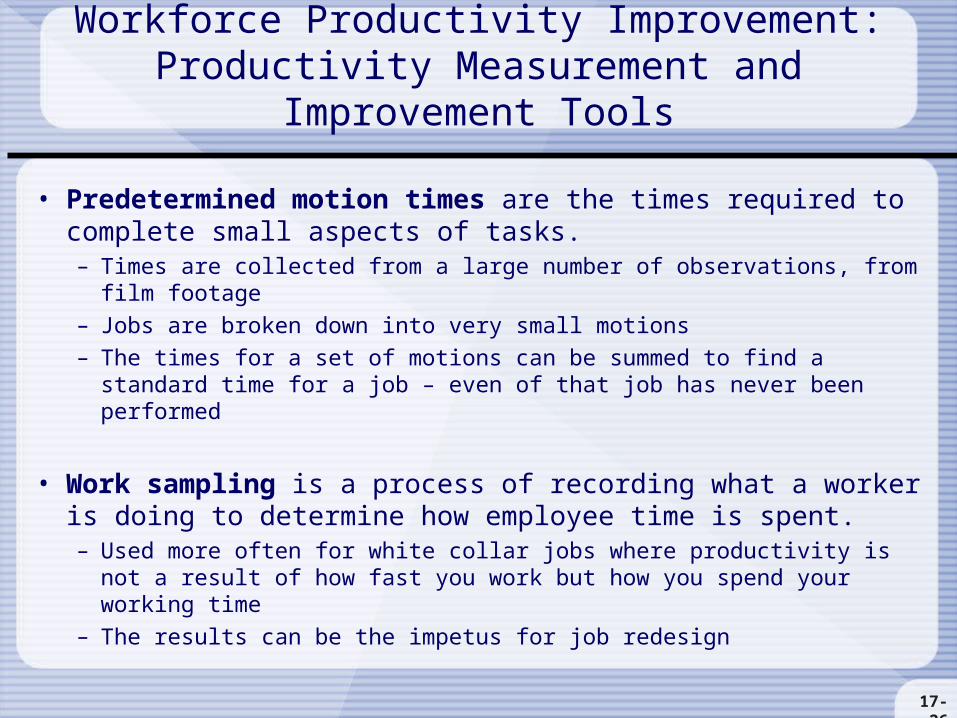
• Predetermined motion times are the times required to complete small aspects of tasks.– Times are collected from a large number of observations, from film footage
– Jobs are broken down into very small motions
– The times for a set of motions can be summed to find a standard time for a job – even of that job has never been performed
• Work sampling is a process of recording what a worker is doing to determine how employee time is spent.– Used more often for white collar jobs where productivity is not a result of
how fast you work but how you spend your working time
– The results can be the impetus for job redesign
Workforce Productivity Improvement: Productivity Measurement and Improvement Tools
17-27
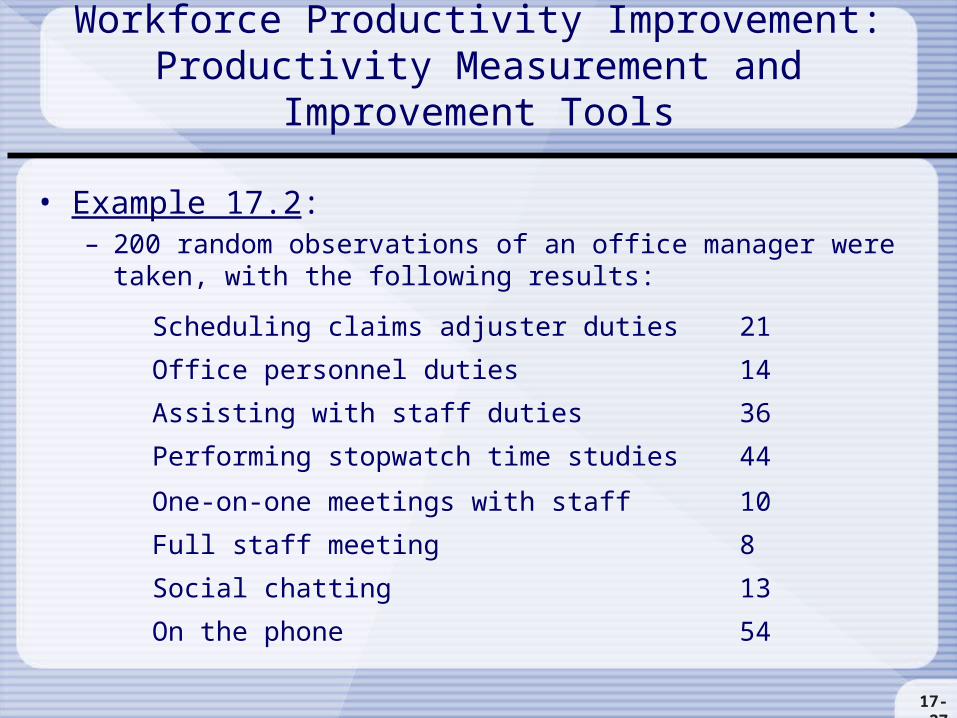
• Example 17.2:– 200 random observations of an office manager were taken, with the
following results:
Scheduling claims adjuster duties 21
Office personnel duties 14
Assisting with staff duties 36
Performing stopwatch time studies 44
One-on-one meetings with staff 10
Full staff meeting 8
Social chatting 13
On the phone 54
Workforce Productivity Improvement: Productivity Measurement and Improvement Tools

17-28
• Example 17.2:– The results are converted to the following percentages:
Scheduling claims adjuster duties 10.5%
Office personnel duties 7%
Assisting with staff duties 18%
Performing stopwatch time studies 22%
One-on-one meetings with staff 5%
Full staff meeting 4%
Social chatting 6.5%
On the phone 27%
Workforce Productivity Improvement: Productivity Measurement and Improvement Tools

17-29
• A learning curve shows the reduction in time it takes to complete a task as the number of times it has been completed increases.– Individuals, groups, and organizations all have learning curves
• The learning rate is the amount of improvement obtained as a task is repeated. – The gain expressed by the learning rate is achieved every time the number
of repetitions doubles.
– The learning rate is almost always a prediction. There are always errors in predictions, and errors in estimating the learning rate can have a tremendous impact on the projected time
Workforce Productivity Improvement: Learning Curves
17-30
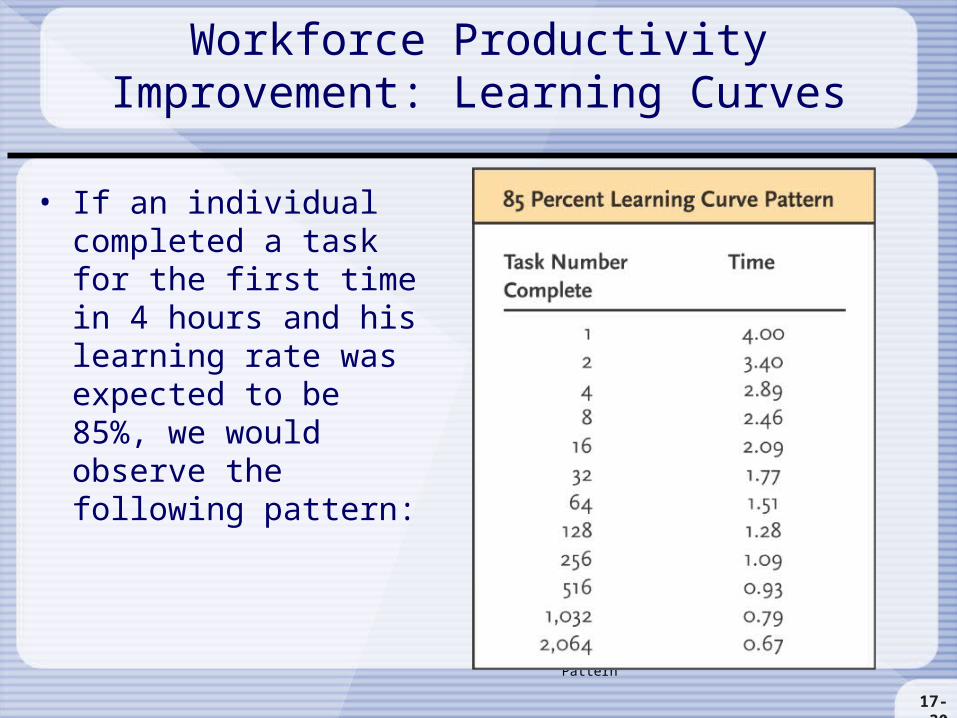
• If an individual completed a task for the first time in 4 hours and his learning rate was expected to be 85%, we would observe the following pattern:
Exhibit 16.7 Learning Curve Pattern
Workforce Productivity Improvement: Learning Curves
17-31
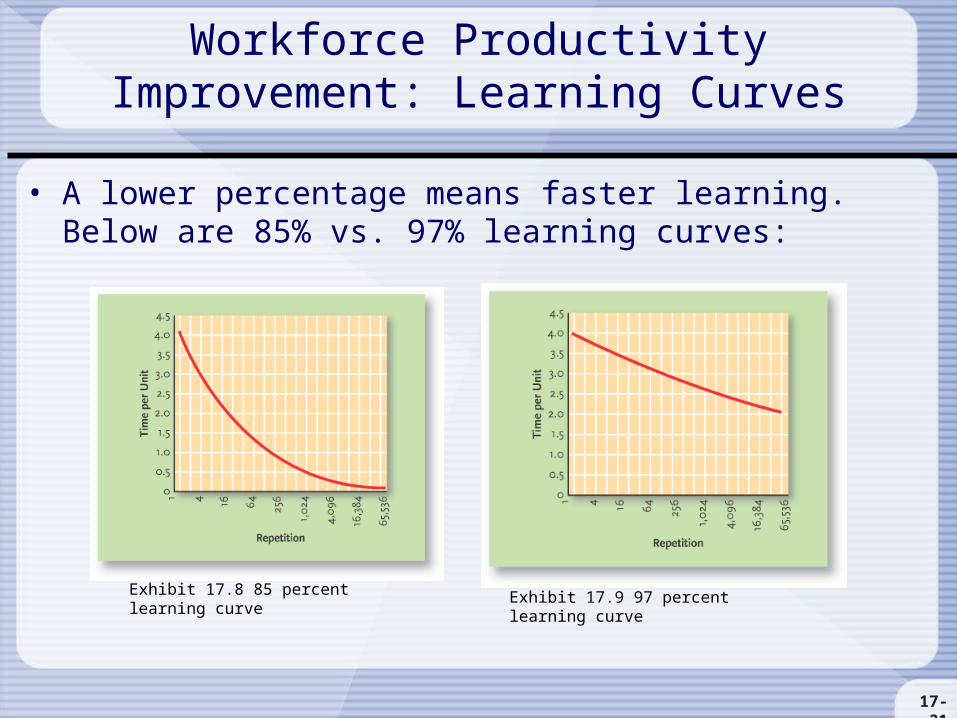
• A lower percentage means faster learning. Below are 85% vs. 97% learning curves:
Exhibit 17.8 85 percent learning curve Exhibit 17.9 97 percent learning curve
Workforce Productivity Improvement: Learning Curves
17-32
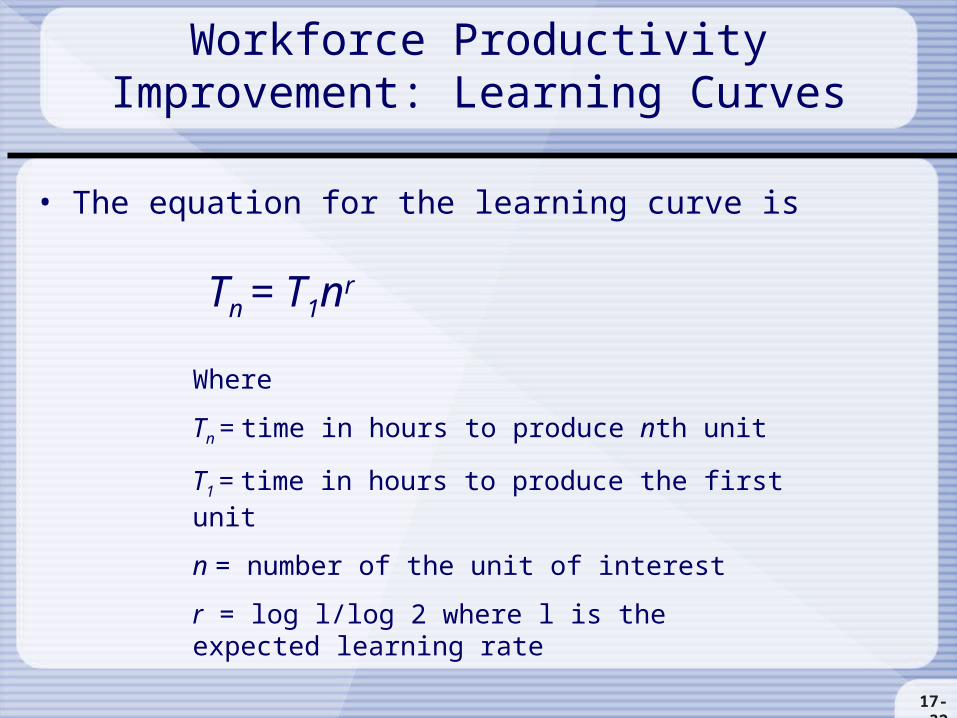
• The equation for the learning curve is
Tn = T1nr
Where
Tn = time in hours to produce nth unit
T1 = time in hours to produce the first unit
n = number of the unit of interest
r = log l/log 2 where l is the expected learning rate
Workforce Productivity Improvement: Learning Curves
17-33
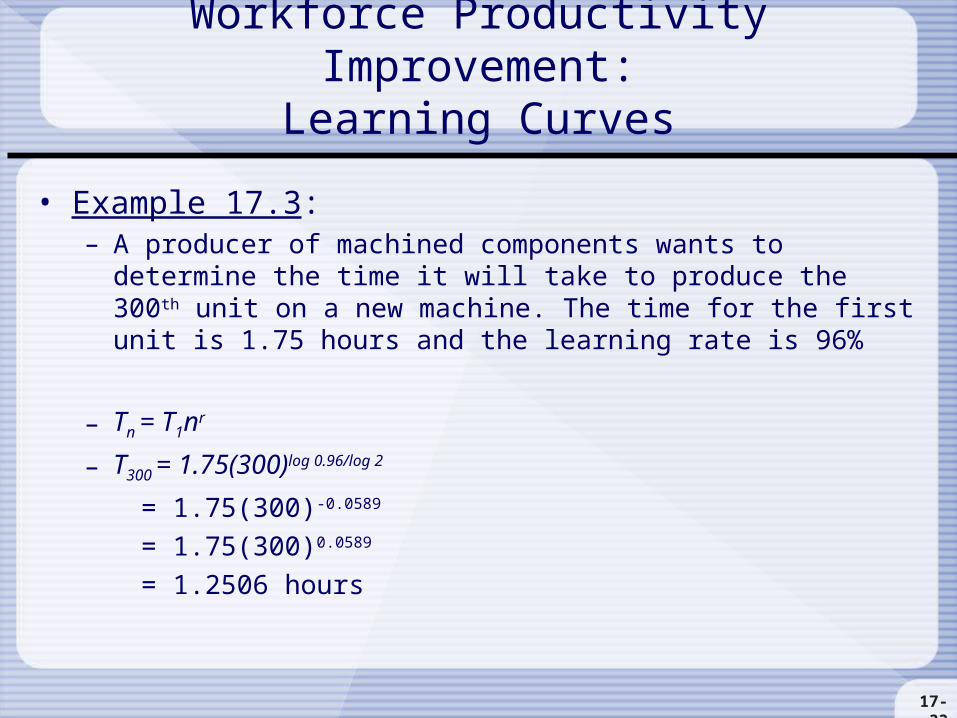
• Example 17.3:– A producer of machined components wants to determine the time it will
take to produce the 300th unit on a new machine. The time for the first unit is 1.75 hours and the learning rate is 96%
– Tn = T1nr
– T300 = 1.75(300)log 0.96/log 2
= 1.75(300)-0.0589
= 1.75(300)0.0589
= 1.2506 hours
Workforce Productivity Improvement:Learning Curves