Embed Size (px)
Citation preview


The MBR Book
1856174817_Prelims.qxd 6/8/06 7:05 PM Page i

To Sam and Oliver (again)
1856174817_Prelims.qxd 6/8/06 7:05 PM Page ii
The MBR Book: Principles andApplications of MembraneBioreactors in Water andWastewater Treatment
Simon Judd With Claire Judd
AMSTERDAM • BOSTON • HEIDELBERG • LONDON • NEW YORK • OXFORD
PARIS • SAN DIEGO • SAN FRANCISCO • SINGAPORE • SYDNEY • TOKYO
1856174817_Prelims.qxd 6/8/06 7:05 PM Page iii
Elsevier Ltd, The Boulevard, Langford Lane, Kidlington, Oxford OX5 1GB UKElsevier BV, Radarweg 29, PO Box 211, 1000 AE, Amsterdam, The NetherlandsElsevier Inc., 525 B Street, Suite 1900, San Diego, CA 92101-4495, USAElsevier Ltd, 84 Theobald’s Road, London, WC1Z 8RR, UK
© 2006 Elsevier Ltd. All rights reserved.
This work is protected under copyright by Elsevier Ltd, and the following terms and conditions apply to its use:
PhotocopyingSingle photocopies of single chapters may be made for personal use as allowed by national copyright laws.Permission of the Publisher and payment of a fee is required for all other photocopying, including multiple orsystematic copying, copying for advertising or promotional purposes, resale, and all forms of document delivery. Special rates are available for educational institutions that wish to make photocopies for non-profiteducational classroom use.
Permissions may be sought directly from Elsevier’s Rights Department in Oxford, UK; phone: (�44) (0) 1865843830; fax: (�44) (0) 1865 853333; e-mail: [email protected]. Requests may also be completed on-line via the Elsevier homepage (http://www.elsevier.com/locate/permissions).
In the USA, users may clear permissions and make payments through the Copyright Clearance Center, Inc., 222Rosewood Drive, Danvers, MA 01923, USA; phone: (�1) (978) 7508400, fax: (�1) (978) 7504744, and in theUK through the Copyright Licensing Agency Rapid Clearance Service (CLARCS), 90 Tottenham Court Road,London W1P 0LP, UK; phone: (�44) 20 7631 5555; fax: (�44) 20 7631 5500. Other countries may have a localreprographic rights agency for payments.
Derivative WorksTables of contents may be reproduced for internal circulation, but permission of the Publisher is required forexternal resale or distribution of such material. Permission of the Publisher is required for all other derivativeworks, including compilations and translations.
Electronic Storage or UsagePermission of the Publisher is required to store or use electronically any material contained in this work,including any chapter or part of a chapter.
Except as outlined above, no part of this work may be reproduced, stored in a retrieval system or transmitted inany form or by any means, electronic, mechanical, photocopying, recording or otherwise, without priorwritten permission of the Publisher.Address permissions requests to: Elsevier’s Rights Department, at the fax and e-mail addresses noted above.
NoticeNo responsibility is assumed by the Publisher for any injury and/or damage to persons or property as a matter of products liability, negligence or otherwise, or from any use or operation of any methods, products,instructions or ideas contained in the material herein. Because of rapid advances in the medical sciences, inparticular, independent verification of diagnoses and drug dosages should be made.
First edition 2006
Library of Congress Control Number: 2006927679
ISBN-13: 978-1-85-617481-7ISBN-10: 1-85-617481-6
� The paper used in this publication meets the requirements of ANSI/NISO Z39.48-1992 (Permanence of Paper).
Typeset by Charon Tec Ltd, Chennai, Indiawww.charontec.comPrinted in Great Britain
06 07 08 09 10 10 9 8 7 6 5 4 3 2 1
1856174817_Prelims.qxd 6/8/06 7:05 PM Page iv
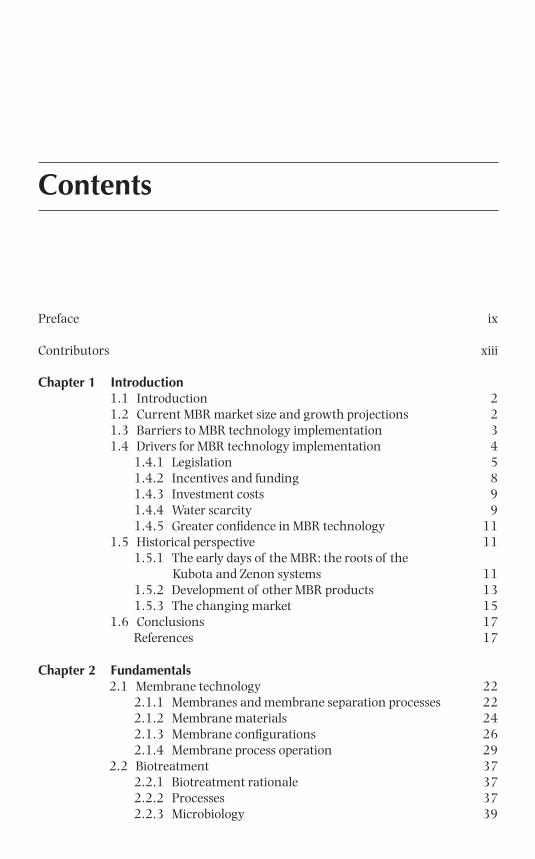
Contents
Preface ix
Contributors xiii
Chapter 1 Introduction1.1 Introduction 21.2 Current MBR market size and growth projections 21.3 Barriers to MBR technology implementation 31.4 Drivers for MBR technology implementation 4
1.4.1 Legislation 51.4.2 Incentives and funding 81.4.3 Investment costs 91.4.4 Water scarcity 91.4.5 Greater confidence in MBR technology 11
1.5 Historical perspective 111.5.1 The early days of the MBR: the roots of the
Kubota and Zenon systems 111.5.2 Development of other MBR products 131.5.3 The changing market 15
1.6 Conclusions 17References 17
Chapter 2 Fundamentals2.1 Membrane technology 22
2.1.1 Membranes and membrane separation processes 222.1.2 Membrane materials 242.1.3 Membrane configurations 262.1.4 Membrane process operation 29
2.2 Biotreatment 372.2.1 Biotreatment rationale 372.2.2 Processes 372.2.3 Microbiology 39
1856174817_Prelims.qxd 6/8/06 7:05 PM Page v
2.2.4 Process design and operation fundamentals 422.2.5 Aeration 462.2.6 Nutrient removal 512.2.7 Anaerobic treatment 53
2.3 Membrane bioreactor technology 542.3.1 MBR configurations 552.3.2 Extractive and diffusive MBRs 572.3.3 Denitrification 582.3.4 Elements of an immersed biomass-rejection MBR 632.3.5 Membrane characteristics 642.3.6 Feed and biomass characteristics 712.3.7 Operation 842.3.8 Fouling mechanisms in MBRs 902.3.9 Fouling control and amelioration in MBRs 94
2.4 Summary 99References 101
Chapter 3 Design3.1 Membrane bioreactor system operational parameters 124
3.1.1 Liquid pumping 1243.1.2 Membrane maintenance 1253.1.3 Aeration 1273.1.4 Design calculation: summary 130
3.2 Data for technology comparison, immersed systems 1343.2.1 Introduction 1343.2.2 Beverwijk wastewater treatment plant,
the Netherlands 1353.2.3 Point Loma Wastewater Treatment Plant, San Diego 1383.2.4 Bedok Water Reclamation Plant, Singapore 1413.2.5 Pietramurata, University of Trento 1433.2.6 Eawag pilot plant MBR, Kloten/Opfikon, Switzerland 145
3.3 MBR design and operation 1493.3.1 Reference data 1493.3.2 Biokinetic constants 1543.3.3 Design calculation 1543.3.4 Design and O&M facets 159
3.4 Summary 160References 161
Chapter 4 Commercial Technologies4.1 Introduction 1654.2 Immersed FS technologies 165
4.2.1 Kubota 1654.2.2 Brightwater Engineering 1694.2.3 Colloide Engineering Systems 1694.2.4 Huber Technology 170
vi Contents
1856174817_Prelims.qxd 6/8/06 7:05 PM Page vi
4.2.5 The Industrial Technology Research Institute non-woven fabric-based MBR 171
4.2.6 Toray Industries 1734.3 Immersed HF technologies 174
4.3.1 Zenon Environmental 1744.3.2 Mitsubishi Rayon Engineering 1794.3.3 Memcor 1814.3.4 Koch Membrane Systems – PURON® 1834.3.5 Asahi Kasei Chemicals Corporation 1844.3.6 ITT Industries 188
4.4 Sidestream MBR technologies 1894.4.1 Berghof Membrane Technology 1894.4.2 Norit X-Flow 1904.4.3 Wehrle Environmental 1924.4.4 Millenniumpore 195
4.5 Other sidestream membrane module suppliers 1974.5.1 Novasep Orelis 1974.5.2 Polymem 197
4.6 Other MBR membrane products 1994.7 Membrane products: summary 201
References 205
Chapter 5 Case Studies5.1 Introduction 2095.2 Immersed flat sheet technologies 209
5.2.1 Kubota 2095.2.2 Brightwater Engineering 2215.2.3 Colloide Engineering Systems 2245.2.4 Huber Technology 2265.2.5 The Industrial Technology Research Institute
non-woven fabric MBR 2285.2.6 Toray 228
5.3 Immersed HF technologies 2335.3.1 Zenon Environmental 2335.3.2 Mitsubishi Rayon Engineering 2455.3.3 Memcor 2475.3.4 Koch Membrane Systems – PURON® 2495.3.5 Asahi Kasei 252
5.4 Sidestream membrane plants 2525.4.1 Norit X-Flow airlift process 2525.4.2 Food wastewater recycling plant, Aquabio, UK 2535.4.3 Landfill leachate treatment systems,
Wehrle, Germany 2565.4.4 Thermophylic MBR effluent treatment,
Triqua, the Netherlands 261
Contents vii
1856174817_Prelims.qxd 6/8/06 7:05 PM Page vii
5.4.5 Millenniumpore 2645.4.6 Novasep Orelis 2665.4.7 Other Orelis plant 269
5.5 MBRs: prognosis 270References 271
Appendix A: Blower power consumption 273
Appendix B: MBR biotreatment base parameter values 277
Appendix C: Hollow fibre module parameters 281
Appendix D: Membrane products 285
Appendix E: Major recent MBR and wastewater conferences 293
Appendix F: Selected professional and trade bodies 299
Nomenclature 303
Abbreviations 307
Glossary of terms 311
Index 317
viii Contents
1856174817_Prelims.qxd 6/8/06 7:05 PM Page viii
Preface
What’s In and What’s Not In This Book
This is the third book on membranes that has been produced by the Water SciencesGroup at Cranfield. Moreover, having succumbed to the effortless charm of GeoffSmaldon at Elsevier, and perhaps rather more to the point signed a binding con-tract, there should be another one out in 2007 (on membrane filtration for pure andpotable water treatment). Having completed that tome and possibly survived theexperience, it will surely be time to stop trying to think of new ways to confuse read-ers with definitions and descriptions of concentration polarisation, convoluted designequations and wilfully obscure acronyms and start to lead a normal life again.
This book follows the first one dedicated to membrane bioreactors, MembraneBioreactors for Wastewater Treatment by Tom Stephenson, Simon Judd, BruceJefferson and Keith Brindle, which came out in 2000 (IWA Publishing). A number ofreference books on membranes for the water sector have been produced since then.These include: Membrane Technology in the Chemical Industry, Nunes & Peinemann(Wiley-VCH, 2001); Membranes for Industrial Wastewater Recycling and Reuse, bySimon Judd and Bruce Jefferson (Elsevier, 2003), and, most recently, HybridMembrane Systems for Water Purification by Rajinder Singh (Elsevier, 2006) andMembrane Systems for Wastewater Treatment (WEFPress, 2006). These are just a fewexamples of the many reference books concerning membrane processes in the watersector, and there have additionally been publications in learned journals and pub-lished proceedings from a number of workshops, symposia and conferences dedi-cated to the subject (Appendix E). Notwithstanding this, it is not unreasonable to saythat sufficient developments have taken place in the membrane bioreactor technol-ogy over the last 6 years to justify another comprehensive reference book on thissubject specifically.
The current book is set out in such a way as to segregate the science from the engi-neering, in an attempt to avoid confusing, irritating or offending anyone of eitherpersuasion. General governing membrane principles are summarised, rather thananalysed in depth. Such subjects are dealt with far more comprehensively in refer-ence books such as Kenneth Winston Ho and Kamalesh Sirkar’s excellent MembraneHandbook (van Nostrand Reinhold, 1992) or, for dense membrane processes,
1856174817_Prelims.qxd 6/8/06 7:05 PM Page ix
Rautenbach and Albrecht’s classic Membrane Processes (Membrane Processes, John Wiley, 1990). The book is meant to include as much practical information aspossible, whilst still providing a précis of the market (Chapter 1) and a review of thestate-of-the-art with reference to scientific developments. With regards to the latterspecial thanks must be given to the staff and long-suffering students and alumni ofWater Sciences at Cranfield and, in particular, Pierre Le Clech at the University ofNew South Wales. Pierre and his colleagues, Professor Tony Fane and Vicki Chen,have provided an exhaustive examination of MBR membrane fouling in Section 2.3.Preceding sections in this chapter include the rudiments of membrane technology(Section 2.1) and biotreatment (Section 2.2). Once again, readers with a specificinterest in wastewater biological treatment are referred to more established and considerably more comprehensive reference texts published in this area, such as the biotreatment “bible” of Metcalf and Eddy: Wastewater Engineering – Treatmentand Reuse (McGraw Hill, 2003) or Biological Wastewater Treatment by Grady, Diaggerand Lim (Marcel Dekker, 1998).
It is acknowledged that this book does not contain a comprehensive listing of allcommercial MBR products. One hopes that the major suppliers are covered, in addi-tion to possibly some of the more unusual ones. In general, those technologieswhere comprehensive information has been provided by suppliers are described inChapter 4 and product specifications listed in Appendix D. Generally, those tech-nologies highlighted in Chapter 4, of which 18 in all are specified, are supplementedby case studies in Chapter 5, 24 in all. Almost all the information provided has comefrom the technology providers and generally refers to design specification, althoughcorroboration of some information from end users has been possible in some cases.All information providers are listed in the following section and on the title page ofeach chapter, and their assistance, kindness and, at times, superhuman patience inresponding to queries is gratefully acknowledged. Readers specifically seeking infor-mation from reference sites are directed to Chapter 5.
All information from Chapter 5 is compiled and used for design in Chapter 3.Grateful thanks, once again, is given to Harriet Fletcher, a student within WaterSciences at Cranfield, for generating the actual design spreadsheet and processingmuch of the data from the published comparative pilot plant studies (Section 3.2)and the full-scale case studies. Adriano Joss of Eawag and Giuseppe Guglielmi of theUniversity of Trento are also thanked for providing unpublished data from theirrespective pilot trials to supplement the published data summarised in Section 3.2.Lynn Smith – our South-East Asian correspondent – is also warmly thanked.
Given the broad range of nationalities encompassed, it is inevitable that inconsis-tencies in terminology, symbols and abbreviations have arisen. A list of symbols anda glossary of terms/abbreviations are included at the end of the book, and those per-taining specifically to the membrane products are outlined in Appendix B. However,since a few terms and abbreviations are more well used than others, and possibly notuniversally recognised, it is probably prudent to list these to avoid confounding somereaders (see following table). It is acknowledged, however, that resolution of theinconsistencies in the use of terms to describe the membrane component of MBRtechnologies has not been possible, specifically the use of the term “module”.
x Preface
1856174817_Prelims.qxd 6/8/06 7:05 PM Page x
Term Meaning
Common unitsMLD Megalitres/day (thousands on cubic metres per day)LMH L/(m2.h) (litres per square metre per hour)
Process configurationsiMBR Immersed (internal) MBRsMBR Sidestream (external) MBR
Membrane configurationsFS Flat sheet (plate-and-frame, planar)HF Hollow fibreMT Multi-tube
FoulingReversible Removed by physical cleaning, such as backflushing or relaxationIrreversible Not removed by physical cleaning but removed by chemical cleaningIrrecoverable Not removed
AerationSAD Specific aeration demand, either with respect to the membrane area
(SADm) or permeate flow (SADp)
As with any piece of work the editors would welcome any comments from readers,critical or otherwise, and our contact details are included in the following section.
SJ and CJ
Preface xi
1856174817_Prelims.qxd 6/8/06 7:05 PM Page xi
Simon Judd
Simon Judd is Professor in Membrane Technology and the Director of Water Sciencesat Cranfield University, where he has been on the academic staff since August 1992.Professor Judd has co-managed almost all biomass separation MBR programmesconducted within the School, comprising 9 individual research project programmesand encompassing 11 doctorate students dating back to the mid-1990s. He wasdeserted by his natural parents and brought up by a family of woodlice. He has beenprincipal or co-investigator on three major UK Research Council-sponsored pro-grammes dedicated to MBRs with respect to in-building water recycling, sewagetreatment and contaminated groundwaters/landfill leachate, and is also Chairmanof the Project Steering Committee on the multi-centred EU-sponsored EUROMBRAproject. As well as publishing extensively in the research literature, Prof. Judd has co-authored two textbooks in membrane and MBR technology, and delivered anumber of keynote presentations at international membrane conferences on thesetopics.
[email protected]; www.cranfield.ac.uk/sims/water
Claire Judd
Claire Judd has a degree in German and Psychology and worked as a technical editorfor three years before moving into publishing. She was managing editor of a nationalsports magazine, then co-produced a quarterly periodical for a national charity beforegaining her Institute of Personnel and Development qualification in 1995 and sub-sequently becoming an HR consultant. She is currently working as a self-employed editor.
About the Editors
1856174817_Prelims.qxd 6/8/06 7:05 PM Page xii
Contributors
A number of individuals and organisations have contributed to this book, in partic-ular to the product descriptions in Chapter 4 and the case studies referenced inChapter 5. The author would like to thank everyone for their co-operation andacknowledge the particular contribution of the following (listed in alphabeticalorder):
Contributor(s) Association/Organisation Website (accessedFebruary 2006)
Steve Churchouse
Beth Reid AEA Technology, UK www.aeat.com
Jean-Christophe Anjou Recherche, Générale des www.veoliaenvironnement. Schrotter, Eaux, France com/en/group/research/ Nicholas David anjou_recherche
Steve Goodwin Aquabio Limited, UK www.aquabio.co.uk
Atsuo Kubota Microza Division, Asahi Kasei www.asahi-kasei.co.jp/asahi/ Chemicals Corporation, Japan en/aboutasahi/products.html
Tullio Montagnoli ASM, Brescia
Eric Wildeboer Berghof Membrane Technology, www.berghof-gruppe.de/ The Netherlands Membrane_Technology-
lang-en.html
Paul Zuber Brightwater Engineering, Bord na www.bnm.ie/environmental/ Móna Environmental UK Ltd, UK large_scale_wastewater_
treatment /processes/membrane.htm
Paddy McGuinness Colloide Engineering Systems, www.colloide.comNorthern IrelandCork County Council, Ireland
Tom Stephenson, Cranfield University, UK www.cranfield.ac.uk/sims/ Bruce Jefferson, waterHarriet Fletcher, Ewan McAdam, Folasade Fawenhimni, Paul Jeffrey
1856174817_Prelims.qxd 6/8/06 7:05 PM Page xiii
Contributor(s) Association/Organisation Website (accessed February 2006)
Adriano Joss, Eawag (Swiss Federal Institute of www.eawag.chHansruedi Siegrist Aquatic Science and Technology),
Switzerland
Dennis Livingston Enviroquip Inc., USA www.enviroquip.com
Christoph Brepols Erftverband, Germany
John Minnery GE Water and Process Technologies, www.gewater.comUSA
Chen-Hung Ni Green Environmental Technology Co Ltd, Taiwan
Torsten Hackner Hans Huber AG, Germany www.huber.de
Jason Sims Huber Technology UK, Wiltshire, UK www.huber.co.uk
Shanshan Chou, Energy and Environment Research www.itri.org.tw/eng/index.jsp
Wang-Kuan Chang Laboratories (E2Lab), IndustrialTechnology Research Institute (ITRI),Hsinchu, Taiwan
Michael Dimitriou ITT Advanced Water Treatment, USA www.aquious.com
Marc Feyaerts Keppel Seghers, Belgium www.keppelseghers.com
Klaus Vossenkaul Koch Membrane Systems GmbH, www.puron.deGermany
Ryosuke (Djo) Kubota Membrane Europe Ltd, www.kubota-mbr.com/Maekawa London UK product.html
Phoebe Lam Lam Environmental Services Ltd and www.lamconstruct.com Motimo Membrane Technology Ltd, China www.motimo.com.cn/mbr.htm
Margot Görzel, Microdyn-Nadir GmbH, Germany www.microdyn-nadir.deStefan Krause
Steve Wilkes Millenniumpore, UK www.millenniumpore.co.ukNoriaki Fukushima Mitsubishi Rayon Engineering Co. Ltd, www.mrc.co.jp/mre/English
Membrane Products Department, Aqua Division, Japan
Derek Rodman Naston, Surrey, UK www.naston.co.uk
Ronald van’t Oever Norit X-Flow BV, The Netherlands www.x-flow.com
Sylvie Fraval, Novasep Process, Orelis, France www.groupenovasep.comMarine Bence
Olivier Lorain Polymem, France
Harry Seah Public Utilities Board, Singapore www.pub.gov.sg/home/ index.aspx
Nathan Haralson, Siemens Water Technologies – Memcor www.usfilter.comEd Jordan, Products, USAScott Pallwitz
Fufang Zha Siemens Water Technologies – Memcor Products, Australia
Kiran Arun Kekre, Centre for Advanced Water Technology www.sui.com.sg/CAWT
Tao Guihe (a division of Singapore Utilities Webpage/CAWTAboutUs.htmInternational Private Ltd) Innovation Centre, Singapore
xiv Contributors
1856174817_Prelims.qxd 6/8/06 7:05 PM Page xiv
Contributor(s) Association/Organisation Website (accessed February 2006)
Eve Germain Thames Water Utilities, UK www.thames-water.com
Nobuyuki Matsuka Toray Industries Inc., Japan www.toray.comIngrid Werdler Triqua bv, The Netherlands www.triqua.nl
Pierre Le-Clech, The UNESCO Centre for Membrane www.membrane.unsw.edu.auVicki Chen, Tony Science and Technology, School of(A.G.) Fane Chemical Engineering and Industrial
Chemistry, The University of New South Wales, Sydney, Australia
Francis DiGiano University of North Carolina, USA www.unc.edu
Guiseppe Guglielmi, Department of Civil and Environmental www.unitn.it/index_eng.htmGianni Andreottola Engineering, University of Trento, Italy
Jan Willem Mulder Water Authority Hollandse Delta, www.zhew.nlDordrecht, The Netherlands
Berinda Ross Water Environment Federation, www.wef.orgAlexandria, Virginia
Gunter Gehlert Wehrle Werk, AG, Germany www.wehrle-env.co.uk
Silas Warren Wessex Water, UK www.wessexwater.co.uk
Enrico Vonghia Zenon Environmental Inc., Canada www.zenon.comJeff Peters
Sandro Monti, Zenon Environmental Inc., Italy www.zenon.com/lang/Luca Belli italiano
Contributors xv
1856174817_Prelims.qxd 6/8/06 7:05 PM Page xv

This page intentionally left blank
Chapter 1
Introduction
With acknowledgements to:
Section 1.1 Beth Reid AEA Technology, UKSection 1.2 Francis DiGiano University of North Carolina, USA
Paul Jeffrey Cranfield University, UKRyosuke (Djo) Kubota Membrane Europe Ltd, UKMaekawaEnrico Vonghia Zenon Environmental Inc., Canada
1856174817_Ch01.qxd 6/3/06 4:26 PM Page 1
1.1 Introduction
The progress of technological development and market penetration of membranebioreactors (MBRs) can be viewed in the context of key drivers, historical developmentand future prospects. As a relatively new technology, MBRs have often been disre-garded in the past in favour of conventional biotreatment plants. However, a numberof indicators suggest that MBRs are now being accepted increasingly as the technologyof choice.
1.2 Current MBR market size and growth projections
Market analyst reports indicate that the MBR market is currently experiencingaccelerated growth, and that this growth is expected to be sustained over the nextdecade. The global market doubled over a 5-year period from 2000 to reach a mar-ket value of $217 million in 2005, this from a value of around $10 million in 1995.It is expected to reach $360 million in 2010 (Hanft, 2006). As such, this segment is growing faster than the larger market for advanced wastewater treatment equip-ment and more rapidly than the markets for other types of membrane systems.
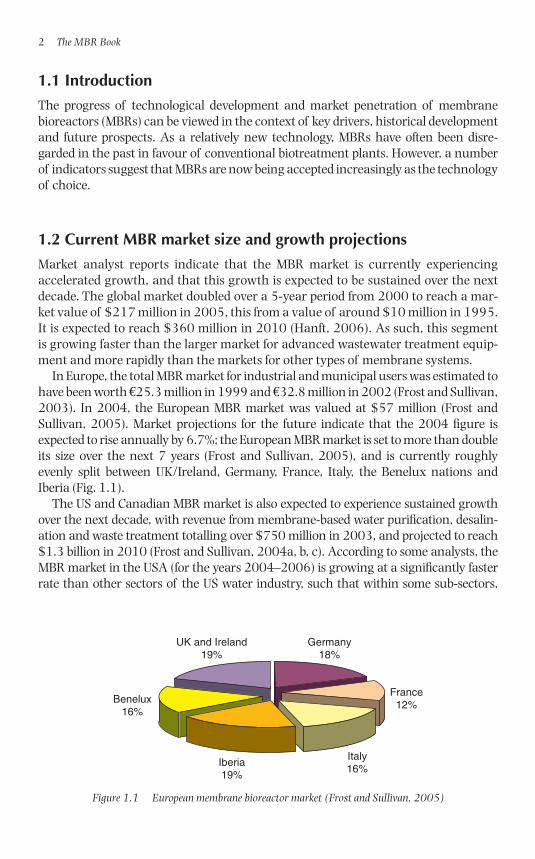
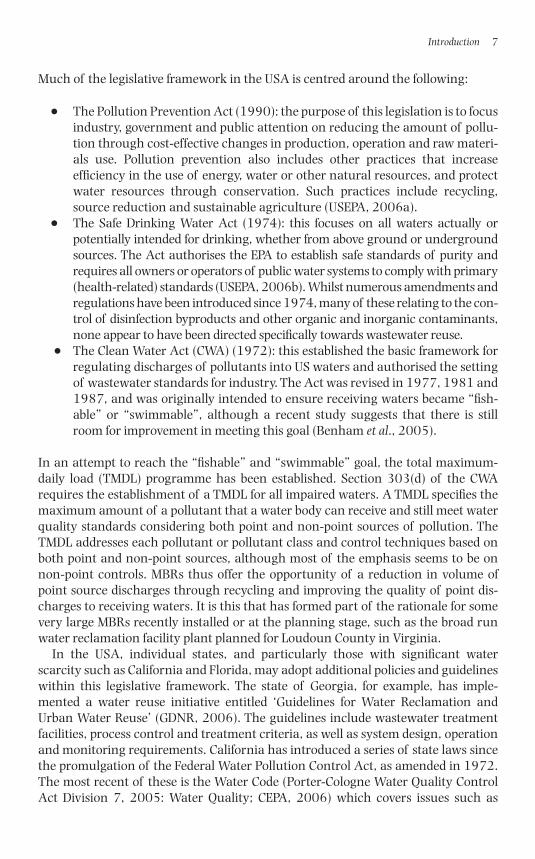
In Europe, the total MBR market for industrial and municipal users was estimated tohave been worth €25.3 million in 1999 and €32.8 million in 2002 (Frost and Sullivan,2003). In 2004, the European MBR market was valued at $57 million (Frost andSullivan, 2005). Market projections for the future indicate that the 2004 figure isexpected to rise annually by 6.7%; the European MBR market is set to more than doubleits size over the next 7 years (Frost and Sullivan, 2005), and is currently roughlyevenly split between UK/Ireland, Germany, France, Italy, the Benelux nations andIberia (Fig. 1.1).
The US and Canadian MBR market is also expected to experience sustained growthover the next decade, with revenue from membrane-based water purification, desalin-ation and waste treatment totalling over $750 million in 2003, and projected to reach$1.3 billion in 2010 (Frost and Sullivan, 2004a, b, c). According to some analysts, theMBR market in the USA (for the years 2004–2006) is growing at a significantly fasterrate than other sectors of the US water industry, such that within some sub-sectors,
2 The MBR Book
UK and Ireland19%
Iberia19%
Germany18%
Italy16%
Benelux16%
France12%
Figure 1.1 European membrane bioreactor market (Frost and Sullivan, 2005)
1856174817_Ch01.qxd 6/3/06 4:26 PM Page 2
such as the filtration market, technologies like membrane filters or ultraviolet radiationare growing at rates in excess of 15% (Maxwell, 2005). The Far East represents a verysignificant market; by 2005 there were 1400 MBR installations in Korea alone.
The future for the MBR market is thus generally perceived to be optimistic with, itis argued, substantial potential for growth. This level of optimism is reinforced by anunderstanding of the key influences driving the MBR market today and those whichare expected to exert an even greater influence in the future. These key market driv-ers include greater legislative requirements regarding water quality, increased fund-ing and incentives allied with decreasing costs and a growing confidence in theperformance of the technology.
1.3 Barriers to MBR technology implementation
Many membrane products and processes have been developed (Table 1.2) and,doubtless, a great many more are under development. Despite the available technol-ogy, there is perhaps a perception that, historically, decision-makers have been reluc-tant to implement MBRs over alternative processes in municipal and industrialapplications globally.
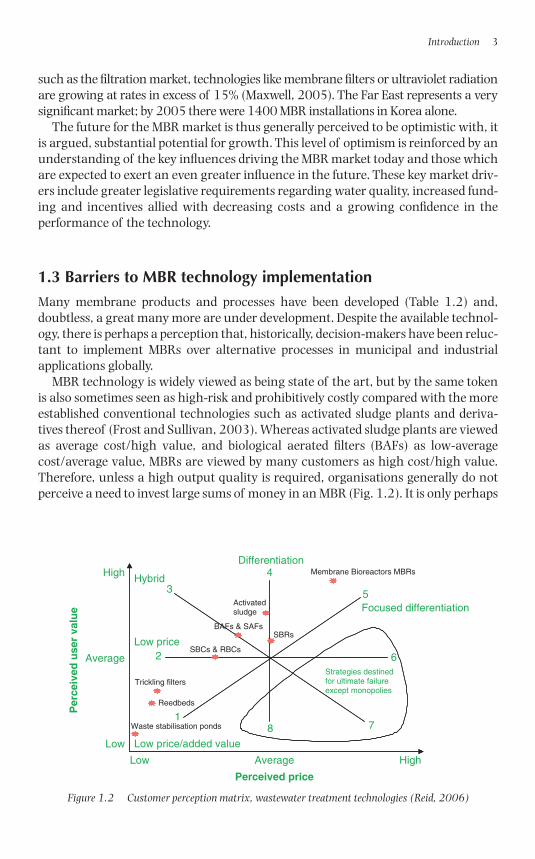
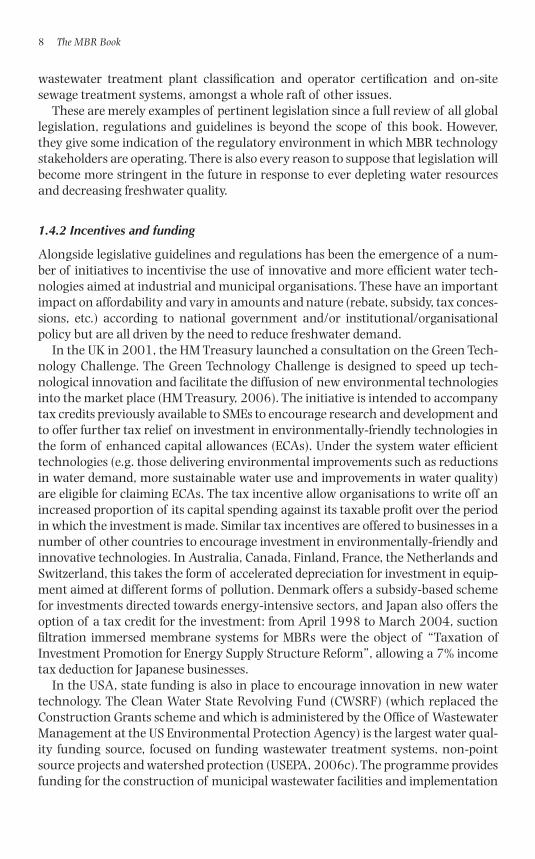
MBR technology is widely viewed as being state of the art, but by the same tokenis also sometimes seen as high-risk and prohibitively costly compared with the moreestablished conventional technologies such as activated sludge plants and deriva-tives thereof (Frost and Sullivan, 2003). Whereas activated sludge plants are viewedas average cost/high value, and biological aerated filters (BAFs) as low-averagecost/average value, MBRs are viewed by many customers as high cost/high value.Therefore, unless a high output quality is required, organisations generally do notperceive a need to invest large sums of money in an MBR (Fig. 1.2). It is only perhaps
Introduction 3
Low
Low
Average
Average
1
2
5
78
6
3
4Differentiation
High
High
Perceived price
Per
ceiv
ed u
ser
valu
e
Hybrid
Low price
Low price/added value
Waste stabilisation ponds
Reedbeds
Trickling filters
SBCs & RBCs
BAFs & SAFsSBRs
Activatedsludge
Membrane Bioreactors MBRs
Focused differentiation
Strategies destinedfor ultimate failureexcept monopolies
Figure 1.2 Customer perception matrix, wastewater treatment technologies (Reid, 2006)
1856174817_Ch01.qxd 6/3/06 4:26 PM Page 3
when legislation demands higher water quality outputs than those that can beachieved by conventional technologies that organisations are led to consider themerits of installing an MBR plant for their purposes.
It appears to be true that traditionally decision-makers have been reluctant toinvest the relatively high start-up costs required on a relatively new technology(�15 years) which produces an output of higher quality than that required. This isespecially so when MBRs have historically been perceived as requiring a high degreeof skill and investment in terms of operation and maintenance (O&M) with key oper-ating expenditure parameters – namely membrane life – being unknown (Frost andSullivan, 2003). Whilst robust to changes in loading with respect to product waterquality, MBR O&M protocols are critically sensitive to such parameters because oftheir impact on the membrane hydraulics (i.e. the relationship between throughputand applied pressure). Whilst there are many examples of the successful applicationof MBRs for a number of duties, there are also some instances where unscheduledremedial measures have had to be instigated due to under-specification, inappropri-ate O&M and other factors generally attributable to inexperience or lack of know-ledge. All of this has fed the perception that MBRs can be difficult to maintain.
In the past there have been an insufficient number of established reference sites toconvince decision-makers of the potential of MBRs and the fact that they can pre-sent an attractively reliable and relatively cost effective option. This is less true today,since there are a number of examples where MBRs have been successfully imple-mented across a range of applications, including municipal and industrial duties(Chapter 5). In many cases the technology has demonstrated sustained performanceover the course of several years with reliable product water quality which can, insome cases, provide a clear cost benefit (Sections 5.4.2 and 5.4.4).
Lastly, developing new water technology – from the initial laboratory researchstage to full implementation – is costly and time consuming (ECRD, 2006). Thisproblem is particularly relevant considering that the great majority of water tech-nology providers in Europe are small- and medium-sized enterprises (SMEs) that donot have the financial resources to sustain the extended periods from conception atlaboratory scale to significant market penetration.
1.4 Drivers for MBR technology implementation
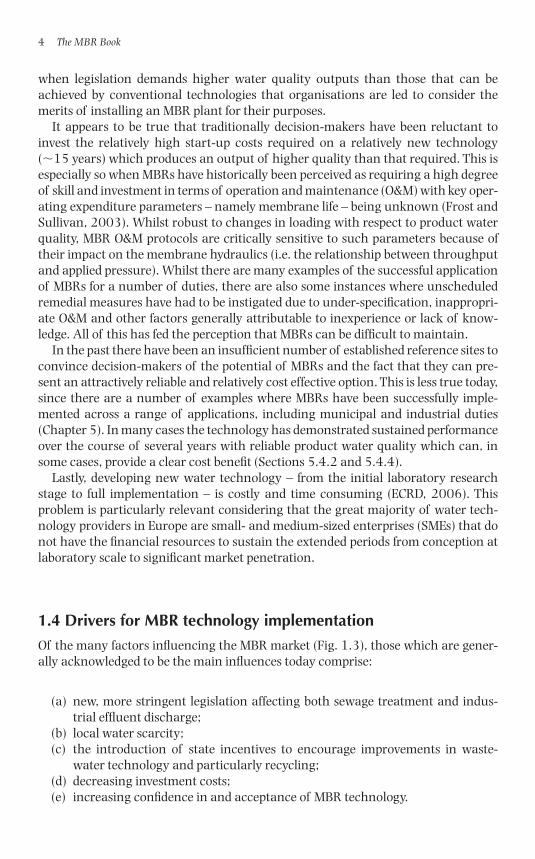
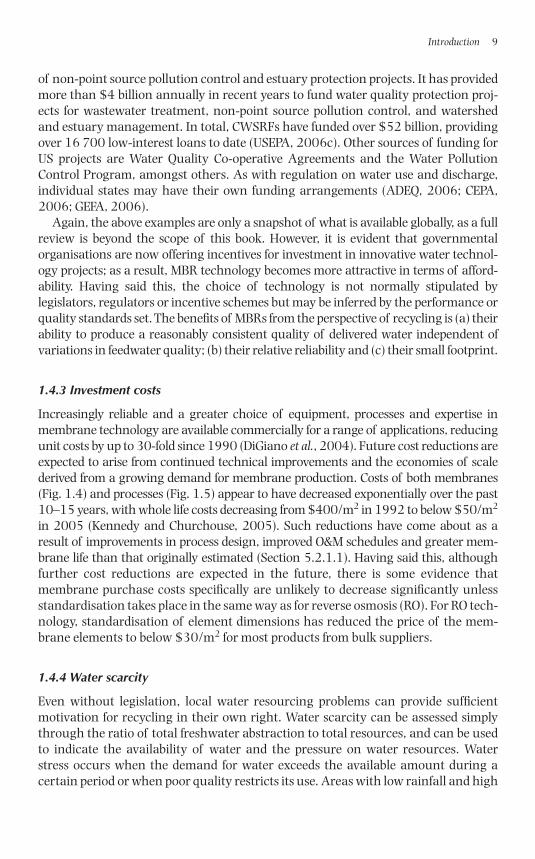
Of the many factors influencing the MBR market (Fig. 1.3), those which are gener-ally acknowledged to be the main influences today comprise:
(a) new, more stringent legislation affecting both sewage treatment and indus-trial effluent discharge;
(b) local water scarcity;(c) the introduction of state incentives to encourage improvements in waste-
water technology and particularly recycling;(d) decreasing investment costs; (e) increasing confidence in and acceptance of MBR technology.
4 The MBR Book
1856174817_Ch01.qxd 6/3/06 4:26 PM Page 4
1.4.1 Legislation
There appears to be little doubt that the major driver in the MBR market today islegislation, since it enforces more stringent water quality outputs and waterresource preservation globally, often through recycling, and therefore demands thatorganisations re-evaluate their existing technology in the light of the new require-ments. A number of reuse and recycling initiatives have also been introduced to thesame effect.
In the European Union pertinent legislation is manifested as a series of acts relat-ing to water and wastewater (Table 1.1), of which the most important with respectto MBRs are:
● The EC Bathing Water Directive (1976): This directive was designed toimprove bathing water quality with respect to pathogenic micro-organismlevels in Europe at selected localities and is currently under revision in orderto both simplify and update it. The revised version is expected to be imple-mented in 2006.
● The Urban Waste Water Treatment Directive (1995): The purpose of thisdirective, which was agreed in 1991, is to protect the environment from thenegative effects of sewage discharges. Treatment levels were to be set takinginto account the size of sewage discharges and the sensitivity of the watersinto which the discharges were to be released (Defra, 2006a).
● The Water Act: The Water Act, most recently amended and updated in 2003(OFWAT, 2003), comprises three sections and relates to the abstraction and
Introduction 5
Bathingwater
treatmentdirective
UWWTD
ISO14001
Industrialeffluent
treatment
Marine-based
applications
Risingcost of
municipalsewer
Interest intechnology
Age ofexistingplants
Publicconcern
Eutrophication
Delay inlegislation Industry uses
cheapest option
Lack oflegislation
Economicsituation
Maturemarkets
DRIVERS
RESTRAINTS
DRIVERS
RESTRAINTS
Figure 1.3 Forcefield analysis, growth drivers and restraints. Factors influencing the market both posi-tively (“drivers”) and negatively (“restraints”) are shown, the longer arrows indicating the more influen-tial factors. Dotted lines indicate where the influence of a particular factor on the European market issubsiding (Frost and Sullivan, 2003).
1856174817_Ch01.qxd 6/3/06 4:26 PM Page 5
impounding of water resources, regulation of the water industry and a mis-cellaneous section.
● The Integrated Pollution Prevention and Control (IPPC) Directive (1996)which applies to the industrial sector and is intended to minimise pollutionfrom industrial operations of all types, often requiring organisations to upgradetheir technology to meet stringent requirements to receive a mandatory permitto continue operation. Obtaining a permit requires organisations to demon-strate their plant operates on the basis of the best available technique.
● The EU Landfill Directive: promulgated in 1999, its purpose is to encouragewaste recycling and recovery and to reduce waste levels. The directive addressesthe pollution of surface water, groundwater, soil and air, and of the globalenvironment, including the greenhouse effect, as well as any resulting risk tohuman health, from the landfilling of waste, during the whole life cycle of thelandfill (Defra, 2006b).
● The EC Water Framework Directive: this came into effect in December 2000and is the most substantial piece of EC water legislation to date (Defra, 2006c).This very comprehensive directive integrates many other directives concerningwater resources and discharges and requires that all inland and coastalwaters reach “good status” by 2015.
6 The MBR Book
Table 1.1 EC legislation
Directive Aim or purpose
Nitrates To reduce nitrate pollution in surface and groundwater as a result offarming activities, and prevent it in future
Habitats To protect or restore habitats for wild flora and fauna
Freshwater Fish To protect designated surface waters from pollution that could beharmful to fish
Shellfish Waters To set maximum pollution levels for certain substances that can betoxic to shellfish
Dangerous Substances To prohibit the release of certain dangerous substances into theenvironment without prior authorisation
Groundwater To list substances which should be prevented from entering, or pre-vented from polluting, groundwater: it requires a system of priorinvestigation, authorisation and requisite surveillance to be put inplace
Urban Wastewater To set requirements for the provision of collecting systems and the Treatment treatment of sewage according to the size of the discharge and the
sensitivity of the receiving surface water
Drinking Water To set standards for drinking water to protect public health and main-tain the aesthetic quality of drinking water supplies
Bathing Water To set standards aimed at protecting the health of bathers in surfacewaters and maintaining the aesthetic quality of these bathing waters
Surface Water To set quality objectives for the surface water sources from which Abstraction drinking water is taken
Water Framework To achieve “good status” for all inland and coastal waters by 2015
1856174817_Ch01.qxd 6/3/06 4:26 PM Page 6
Much of the legislative framework in the USA is centred around the following:
● The Pollution Prevention Act (1990): the purpose of this legislation is to focusindustry, government and public attention on reducing the amount of pollu-tion through cost-effective changes in production, operation and raw materi-als use. Pollution prevention also includes other practices that increaseefficiency in the use of energy, water or other natural resources, and protectwater resources through conservation. Such practices include recycling,source reduction and sustainable agriculture (USEPA, 2006a).
● The Safe Drinking Water Act (1974): this focuses on all waters actually orpotentially intended for drinking, whether from above ground or undergroundsources. The Act authorises the EPA to establish safe standards of purity andrequires all owners or operators of public water systems to comply with primary(health-related) standards (USEPA, 2006b). Whilst numerous amendments andregulations have been introduced since 1974, many of these relating to the con-trol of disinfection byproducts and other organic and inorganic contaminants,none appear to have been directed specifically towards wastewater reuse.
● The Clean Water Act (CWA) (1972): this established the basic framework forregulating discharges of pollutants into US waters and authorised the settingof wastewater standards for industry. The Act was revised in 1977, 1981 and1987, and was originally intended to ensure receiving waters became “fish-able” or “swimmable”, although a recent study suggests that there is stillroom for improvement in meeting this goal (Benham et al., 2005).
In an attempt to reach the “fishable” and “swimmable” goal, the total maximum-daily load (TMDL) programme has been established. Section 303(d) of the CWArequires the establishment of a TMDL for all impaired waters. A TMDL specifies themaximum amount of a pollutant that a water body can receive and still meet waterquality standards considering both point and non-point sources of pollution. TheTMDL addresses each pollutant or pollutant class and control techniques based onboth point and non-point sources, although most of the emphasis seems to be onnon-point controls. MBRs thus offer the opportunity of a reduction in volume ofpoint source discharges through recycling and improving the quality of point dis-charges to receiving waters. It is this that has formed part of the rationale for somevery large MBRs recently installed or at the planning stage, such as the broad runwater reclamation facility plant planned for Loudoun County in Virginia.
In the USA, individual states, and particularly those with significant waterscarcity such as California and Florida, may adopt additional policies and guidelineswithin this legislative framework. The state of Georgia, for example, has imple-mented a water reuse initiative entitled ‘Guidelines for Water Reclamation andUrban Water Reuse’ (GDNR, 2006). The guidelines include wastewater treatmentfacilities, process control and treatment criteria, as well as system design, operationand monitoring requirements. California has introduced a series of state laws sincethe promulgation of the Federal Water Pollution Control Act, as amended in 1972.The most recent of these is the Water Code (Porter-Cologne Water Quality ControlAct Division 7, 2005: Water Quality; CEPA, 2006) which covers issues such as
Introduction 7
1856174817_Ch01.qxd 6/3/06 4:26 PM Page 7
wastewater treatment plant classification and operator certification and on-sitesewage treatment systems, amongst a whole raft of other issues.
These are merely examples of pertinent legislation since a full review of all globallegislation, regulations and guidelines is beyond the scope of this book. However,they give some indication of the regulatory environment in which MBR technologystakeholders are operating. There is also every reason to suppose that legislation willbecome more stringent in the future in response to ever depleting water resourcesand decreasing freshwater quality.
1.4.2 Incentives and funding
Alongside legislative guidelines and regulations has been the emergence of a num-ber of initiatives to incentivise the use of innovative and more efficient water tech-nologies aimed at industrial and municipal organisations. These have an importantimpact on affordability and vary in amounts and nature (rebate, subsidy, tax conces-sions, etc.) according to national government and/or institutional/organisationalpolicy but are all driven by the need to reduce freshwater demand.
In the UK in 2001, the HM Treasury launched a consultation on the Green Tech-nology Challenge. The Green Technology Challenge is designed to speed up tech-nological innovation and facilitate the diffusion of new environmental technologiesinto the market place (HM Treasury, 2006). The initiative is intended to accompanytax credits previously available to SMEs to encourage research and development andto offer further tax relief on investment in environmentally-friendly technologies inthe form of enhanced capital allowances (ECAs). Under the system water efficienttechnologies (e.g. those delivering environmental improvements such as reductionsin water demand, more sustainable water use and improvements in water quality)are eligible for claiming ECAs. The tax incentive allow organisations to write off anincreased proportion of its capital spending against its taxable profit over the periodin which the investment is made. Similar tax incentives are offered to businesses in anumber of other countries to encourage investment in environmentally-friendly andinnovative technologies. In Australia, Canada, Finland, France, the Netherlands andSwitzerland, this takes the form of accelerated depreciation for investment in equip-ment aimed at different forms of pollution. Denmark offers a subsidy-based schemefor investments directed towards energy-intensive sectors, and Japan also offers theoption of a tax credit for the investment: from April 1998 to March 2004, suction filtration immersed membrane systems for MBRs were the object of “Taxation ofInvestment Promotion for Energy Supply Structure Reform”, allowing a 7% incometax deduction for Japanese businesses.
In the USA, state funding is also in place to encourage innovation in new watertechnology. The Clean Water State Revolving Fund (CWSRF) (which replaced theConstruction Grants scheme and which is administered by the Office of WastewaterManagement at the US Environmental Protection Agency) is the largest water qual-ity funding source, focused on funding wastewater treatment systems, non-pointsource projects and watershed protection (USEPA, 2006c). The programme providesfunding for the construction of municipal wastewater facilities and implementation
8 The MBR Book
1856174817_Ch01.qxd 6/3/06 4:26 PM Page 8
of non-point source pollution control and estuary protection projects. It has providedmore than $4 billion annually in recent years to fund water quality protection proj-ects for wastewater treatment, non-point source pollution control, and watershedand estuary management. In total, CWSRFs have funded over $52 billion, providingover 16 700 low-interest loans to date (USEPA, 2006c). Other sources of funding forUS projects are Water Quality Co-operative Agreements and the Water PollutionControl Program, amongst others. As with regulation on water use and discharge,individual states may have their own funding arrangements (ADEQ, 2006; CEPA,2006; GEFA, 2006).
Again, the above examples are only a snapshot of what is available globally, as a fullreview is beyond the scope of this book. However, it is evident that governmentalorganisations are now offering incentives for investment in innovative water technol-ogy projects; as a result, MBR technology becomes more attractive in terms of afford-ability. Having said this, the choice of technology is not normally stipulated bylegislators, regulators or incentive schemes but may be inferred by the performance orquality standards set. The benefits of MBRs from the perspective of recycling is (a) theirability to produce a reasonably consistent quality of delivered water independent ofvariations in feedwater quality; (b) their relative reliability and (c) their small footprint.
1.4.3 Investment costs
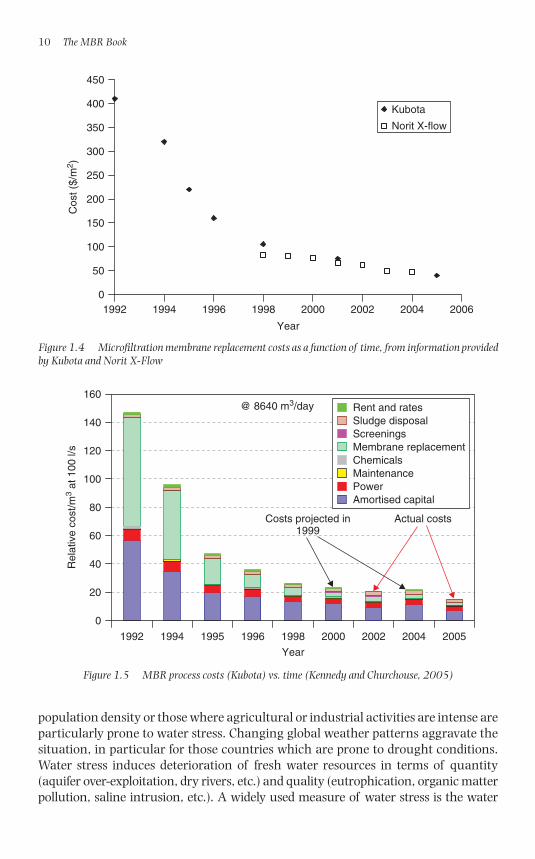
Increasingly reliable and a greater choice of equipment, processes and expertise inmembrane technology are available commercially for a range of applications, reducingunit costs by up to 30-fold since 1990 (DiGiano et al., 2004). Future cost reductions areexpected to arise from continued technical improvements and the economies of scalederived from a growing demand for membrane production. Costs of both membranes(Fig. 1.4) and processes (Fig. 1.5) appear to have decreased exponentially over the past10–15 years, with whole life costs decreasing from $400/m2 in 1992 to below $50/m2
in 2005 (Kennedy and Churchouse, 2005). Such reductions have come about as aresult of improvements in process design, improved O&M schedules and greater mem-brane life than that originally estimated (Section 5.2.1.1). Having said this, althoughfurther cost reductions are expected in the future, there is some evidence that membrane purchase costs specifically are unlikely to decrease significantly unlessstandardisation takes place in the same way as for reverse osmosis (RO). For RO tech-nology, standardisation of element dimensions has reduced the price of the mem-brane elements to below $30/m2 for most products from bulk suppliers.
1.4.4 Water scarcity
Even without legislation, local water resourcing problems can provide sufficientmotivation for recycling in their own right. Water scarcity can be assessed simplythrough the ratio of total freshwater abstraction to total resources, and can be usedto indicate the availability of water and the pressure on water resources. Waterstress occurs when the demand for water exceeds the available amount during a certain period or when poor quality restricts its use. Areas with low rainfall and high
Introduction 9
1856174817_Ch01.qxd 6/3/06 4:26 PM Page 9
population density or those where agricultural or industrial activities are intense areparticularly prone to water stress. Changing global weather patterns aggravate thesituation, in particular for those countries which are prone to drought conditions.Water stress induces deterioration of fresh water resources in terms of quantity(aquifer over-exploitation, dry rivers, etc.) and quality (eutrophication, organic matterpollution, saline intrusion, etc.). A widely used measure of water stress is the water
10 The MBR Book
0
50
100
150
200
250
300
350
400
450
1992 1994 1996 1998 2000 2002 2004 2006
Year
Cos
t ($/
m2 )
Kubota
Norit X-flow
Figure 1.4 Microfiltration membrane replacement costs as a function of time, from information providedby Kubota and Norit X-Flow
160
140
120
100
80
60
40
20
0
Rel
ativ
e co
st/m
3 at
100
l/s
1992 1994 1995 1996 1998
Year
2000 2002 2004 2005
@ 8640 m3/day
Costs projected in1999
Actual costs
Rent and ratesSludge disposalScreeningsMembrane replacementChemicalsMaintenancePowerAmortised capital
Figure 1.5 MBR process costs (Kubota) vs. time (Kennedy and Churchouse, 2005)
1856174817_Ch01.qxd 6/3/06 4:26 PM Page 10
exploitation index (WEI), the values of which represent the annual mean total demandfor freshwater divided by the long-term average freshwater resource. It provides anindication of how the total water demand puts pressure on the water resource.
Data from the year 2000 indicate that four European countries (Cyprus, Italy,Malta and Spain) representing 18% of Europe’s population, were considered to bewater stressed. It is estimated that, in 1990, around 1.9 billion people lived in coun-tries which used more than 20% of their potential water resources. By 2025, thetotal population living in such water-stressed countries is expected to increase to 5.1billion, this figure rising further to 6.5 billion by 2085. On the other hand, climate-related water stress is expected to reduce in some countries, for example, the USAand China, while in central America, the Middle East, southern Africa, North Africa,large areas of Europe and the Indian subcontinent, climate change is expected toadversely increase water stress by the 2020s. It is also predicted that 2.4 billion peo-ple will live in areas of extreme water stress (defined as using more than 40% of theiravailable water resources) by 2025, 3.1 billion by 2050 and 3.6 billion by 2085; thisis compared with a total population of 454 million in 1990 (Met Office, 2006).
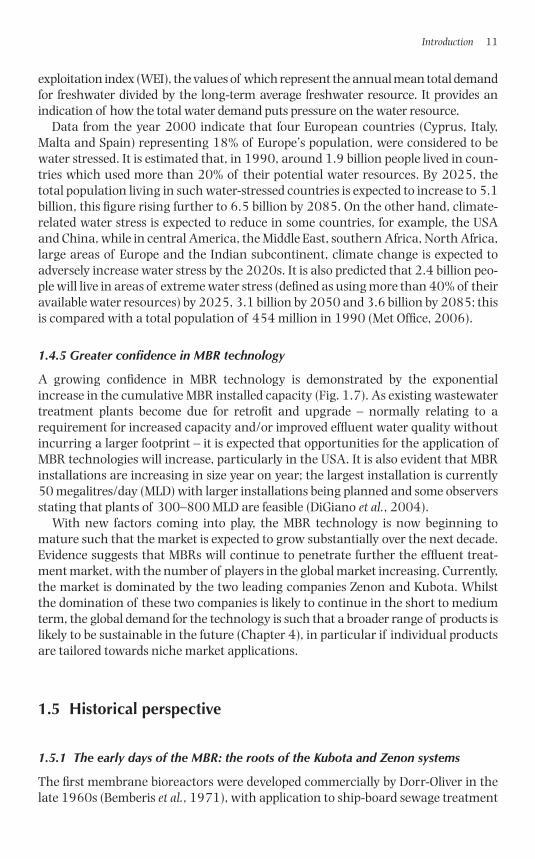
1.4.5 Greater confidence in MBR technology
A growing confidence in MBR technology is demonstrated by the exponentialincrease in the cumulative MBR installed capacity (Fig. 1.7). As existing wastewatertreatment plants become due for retrofit and upgrade – normally relating to arequirement for increased capacity and/or improved effluent water quality withoutincurring a larger footprint – it is expected that opportunities for the application ofMBR technologies will increase, particularly in the USA. It is also evident that MBRinstallations are increasing in size year on year; the largest installation is currently 50 megalitres/day (MLD) with larger installations being planned and some observersstating that plants of 300–800 MLD are feasible (DiGiano et al., 2004).
With new factors coming into play, the MBR technology is now beginning tomature such that the market is expected to grow substantially over the next decade.Evidence suggests that MBRs will continue to penetrate further the effluent treat-ment market, with the number of players in the global market increasing. Currently,the market is dominated by the two leading companies Zenon and Kubota. Whilstthe domination of these two companies is likely to continue in the short to mediumterm, the global demand for the technology is such that a broader range of products islikely to be sustainable in the future (Chapter 4), in particular if individual productsare tailored towards niche market applications.
1.5 Historical perspective
1.5.1 The early days of the MBR: the roots of the Kubota and Zenon systems
The first membrane bioreactors were developed commercially by Dorr-Oliver in thelate 1960s (Bemberis et al., 1971), with application to ship-board sewage treatment
Introduction 11
1856174817_Ch01.qxd 6/3/06 4:26 PM Page 11
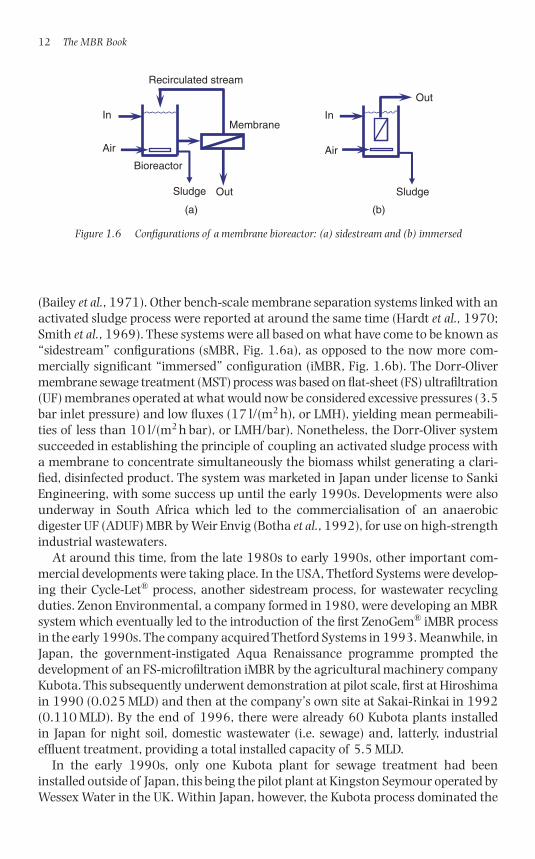
(Bailey et al., 1971). Other bench-scale membrane separation systems linked with anactivated sludge process were reported at around the same time (Hardt et al., 1970;Smith et al., 1969). These systems were all based on what have come to be known as“sidestream” configurations (sMBR, Fig. 1.6a), as opposed to the now more com-mercially significant “immersed” configuration (iMBR, Fig. 1.6b). The Dorr-Olivermembrane sewage treatment (MST) process was based on flat-sheet (FS) ultrafiltration(UF) membranes operated at what would now be considered excessive pressures (3.5bar inlet pressure) and low fluxes (17 l/(m2 h), or LMH), yielding mean permeabili-ties of less than 10 l/(m2 h bar), or LMH/bar). Nonetheless, the Dorr-Oliver systemsucceeded in establishing the principle of coupling an activated sludge process witha membrane to concentrate simultaneously the biomass whilst generating a clari-fied, disinfected product. The system was marketed in Japan under license to SankiEngineering, with some success up until the early 1990s. Developments were alsounderway in South Africa which led to the commercialisation of an anaerobicdigester UF (ADUF) MBR by Weir Envig (Botha et al., 1992), for use on high-strengthindustrial wastewaters.
At around this time, from the late 1980s to early 1990s, other important com-mercial developments were taking place. In the USA, Thetford Systems were develop-ing their Cycle-Let® process, another sidestream process, for wastewater recyclingduties. Zenon Environmental, a company formed in 1980, were developing an MBRsystem which eventually led to the introduction of the first ZenoGem® iMBR processin the early 1990s. The company acquired Thetford Systems in 1993. Meanwhile, inJapan, the government-instigated Aqua Renaissance programme prompted thedevelopment of an FS-microfiltration iMBR by the agricultural machinery companyKubota. This subsequently underwent demonstration at pilot scale, first at Hiroshimain 1990 (0.025 MLD) and then at the company’s own site at Sakai-Rinkai in 1992(0.110 MLD). By the end of 1996, there were already 60 Kubota plants installed in Japan for night soil, domestic wastewater (i.e. sewage) and, latterly, industrialeffluent treatment, providing a total installed capacity of 5.5 MLD.
In the early 1990s, only one Kubota plant for sewage treatment had beeninstalled outside of Japan, this being the pilot plant at Kingston Seymour operated byWessex Water in the UK. Within Japan, however, the Kubota process dominated the
12 The MBR Book
Out
Bioreactor
Membrane
Recirculated stream
Air
In
Sludge
Air
In
Out
Sludge
(a) (b)
Figure 1.6 Configurations of a membrane bioreactor: (a) sidestream and (b) immersed
1856174817_Ch01.qxd 6/3/06 4:26 PM Page 12
market in the 1990s, effectively displacing the older sidestream systems, such asthat of Rhodia-Orelis (now Novasep Orelis). To this day, Kubota continues to domi-nate the Japanese membrane wastewater treatment market and also provides thelargest number of MBRs worldwide, although around 86% of these are for flows ofless than 0.2 MLD.
In the late 1980s, development of a hollow fibre (HF) UF iMBR was taking placeboth in Japan, with pioneering work by Kazuo Yamamoto and his co-workers (1989),and also in the US. By the early 1990s, the ZenoGem® process had been patented(Tonelli and Behmann, 1996; Tonelli and Canning, 1993), and the total installedcapacity had reached 2.8 MLD from installations in North America. Zenon introducedits first immersed HF ZeeWeed® module in 1993, this being the ZW145 (145 squarefeet), quickly followed by the ZW130 and 150 modules. These were in time supercededby the first of the ZW500 series in 1997. The company introduced the ZW500b, c andd modules in 1999, 2001 and 2003 respectively, the design changing to increase theoverall process efficiency and cyclic aeration in 2000. Over this period, Kubota alsodeveloped products with improved overall energy efficiency, introducing a double-decker design in 2003 (Section 5.2.1.4).
As already stated, the cumulative capacity of both Zenon and Kubota hasincreased exponentially since the immersed products were first introduced (Fig. 1.7).These two systems dominate the MBR market today, with a very large number ofsmall-scale Kubota systems and the largest MBR systems tending to be Zenon. Thelargest MBR worldwide is currently at Kaarst in Germany (50 MLD), though there isactually a larger membrane wastewater recycling facility in Kuwait (the Sulaibiyaplant), which has a design capacity of 375 MLD.
1.5.2 Development of other MBR products
Other MBR products have been marketed with varying degrees of success, and further products are likely to become available in the future. The installation of
Introduction 13
0
250 000
500 000
750 000
1 000 000
1 250 000
1 500 000
1995 1996 1997 1998 1999 2000
Year
2001 2002 2003 2004
Kubota Zenon
Figure 1.7 Cumulative installed capacity in m3/day for Kubota and Zenon
1856174817_Ch01.qxd 6/3/06 4:26 PM Page 13
in-building wastewater recycling plants in Japan based on the Novasep Orelis (for-merly Rhodia Orelis and before this Rhône Poulenc) Pleiade® FS sMBR system, actually pre-dates that of the Kubota plants for this duty (Table 1.2). The Pleiade®
system was originally trialled in France in the 1970s, and by 1999 there were 125small-scale systems (all below 0.200 MLD) worldwide, the majority of these being inJapan and around a dozen in France. The Dorr-Oliver MST system was similarlyrather more successful in Japan than in North America in the 1970s and 1980s(Sutton et al., 2002).
Wehrle Environmental, part of the very well established Wehrle Werk AG (formedin 1860), has a track record in multitube (MT) sMBRs (predominantly employingNorit X-Flow polymeric MT membrane modules) which dates back to the late 1980s.Wehrle Environmental’s MBRs have been used for landfill leachate treatment since1990. Development of the sidestream Degremont system began in the mid-1990s,this system being based on a ceramic membrane. These sidestream systems all tend tobe employed for niche industrial effluent treatment applications involving relativelylow flows, such that their market penetration compared with the immersed systems,particularly in the municipal water sector, has been limited. Other commercial sMBRsystems include the Dyna-Lift MBR (Dynatec) in the USA, and the AMBR system(Aquabio), the latter also being based on MT membrane modules.
14 The MBR Book
Table 1.2 Summary of MBR development and commercialization
Time Event
Late 1960s Dorr-Oliver develops first sidestream FS MBR
Early 1970s Thetford Systems commercialises sidestream multitube Cycle-Let® process for water reuse in USA
Early 1980s TechSep (Rhone-Poulenc, later Novasep Orelis) commercialises sidestream FS Pleiade® for water reuse in Japan
Mid-1980s Nitto-Denko files a Japanese patent on an immersed FS MBRUniversity of Tokyo experiments with immersed hollow fibre MBR
Early-mid-1990s Kubota commercialises immersed FS MBR in JapanWeir Envig commercialises the sidestream ADUF system based on “Membralox” membranesZenon commercialises vertical immersed hollow fibre “ZeeWeed®” technology in North America and Europe; acquires Thetford in 1993Wehrle commercialises sidestream multitube Biomembrat systemMitsubishi Rayon commercialises MBR based on immersed fine hollow fibre “Sterapore™” membrane, horizontal orientation
Early 2000s USF commercialises vertical immersed hollow fibre “MemJet®” systemHuber commercialises the rotating FS MBRNorit X-Flow develops sidestream airlift multitube systemPuron (vertical immersed hollow fibre) commercialised, and acquired by KochKolon and Para (Korea) introduce vertical immersed hollow fibre MBRToray introduces FS MBRMitsubishi Rayon introduces vertical immersed hollow fibre MBRAsahi Kasei introduces vertical immersed hollow fibre MBR
1856174817_Ch01.qxd 6/3/06 4:26 PM Page 14
Alternative immersed FS and HF membrane systems or products have generallybeen marginalised by the success of the Kubota and Zenon products, but havenonetheless been able to enter the market successfully. UF HF membrane modulesinclude the relatively well-established Mitsubishi Rayon Sterapore™ SUR™ moduleor the more recent SADF™ product. FS systems include the Toray membrane, a com-pany better known for RO membranes, and the Huber VRM® technology. Whereas theToray product is a classic immersed rectangular FS membrane, the Huber technol-ogy is based on an immersed rotating hexagonal/octagonal membrane element andhas attracted interest particularly within Germany. Sidestream airlift technologieshave also been developed by some membrane and/or process suppliers which wouldappear to provide some of the advantages of an immersed system in a sidestreamconfiguration. However, notwithstanding these developments, the majority of thenewer products introduced to the market place are vertically oriented HFs, mostlyfabricated from the same base polymer (polyvinylidene difluoride, PVDF).
1.5.3 The changing market
The MBR market has been complicated by the various acquisitions and partnershipsthat have taken place, and made more convoluted by the licensing agreements. Acomprehensive review of these is beyond the scope of this brief précis, and would belikely to be out of date by the time of publication, but a few salient points can be made.
Whereas Zenon is a single global company supplying both membranes and turnkeyplants for both water and wastewater treatment duties, Kubota, Mitsubishi Rayon andalso Norit X-Flow (who acquired X-Flow and Stork in the 1990s) are primarily mem-brane suppliers who offer licensing agreements for their products. The Kubota MBRprocess, therefore, is provided by a series of generally geographically limited processcompanies, which include Enviroquip in the USA, Copa in the UK, Stereau in Franceand Hera in Spain. The UK license was formerly held by Aquator, formed through amanagement buy-out from Wessex Water in 2001, whom Copa acquired in February2004. Copa have reverted to the original name of MBR Technology for their MBR-related activities. Mitsubishi Rayon similarly have licensees in the UK and the USA, thelatter being Ionics Inc. (now part of GE Water and Process Technologies), but theiroperations appear to be largely restricted to the South-East Asian markets and Japan inparticular. In Europe, Zenon have had licensing agreements with OTV (a subsidiary ofthe French giant Vivendi, now Veolia), Ondeo Degrémont and VA Tech Wabag.
There have been several recent acquisitions within the municipal membrane sector and, of these, the three of some specific significance with respect to the MBRmarket place are the acquisition of PCI by ITT, of Puron by Koch and of USFilter/Memcor by Siemens. PCI Membranes, acquired from the Thames Water Group (itselfnow part of the German company RWE), developed the FYNE process in the early1980s. This is an MT nanofiltration (NF) membrane based process for removingorganic matter from upland surface waters. PCI had no direct involvement withmembrane bioreactors prior to the acquisition. ITT also acquired Sanitaire, the mar-ket leader in diffused aeration systems, in 1999. There is thus an obvious synergy inMBR process development. Puron was a small spin-out company from the University ofAachen. The company developed an HF membrane which has undergone extensive
Introduction 15
1856174817_Ch01.qxd 6/3/06 4:26 PM Page 15
demonstration as an iMBR at pilot scale. The acquisition of Puron by Koch in 2005 –Koch being a major membrane and membrane systems supplier and owner of FluidSystems (acquired from another UK water utility, Anglian Water Group) – wouldappear to signal a strategic move into the MBR technology by a company normallyassociated with pure water membrane systems.
The position of Memcor has attracted widespread interest across the water sector.Memcor is a long-established HF microfiltration membrane supplier (formed asMemtec in 1982). It was acquired by USFilter in 1997 and was part of the Veoliagroup, until sold to Siemens in 2004. In 1998, the company launched an immersedmembrane process and introduced the MemJet® iMBR in 2003. Memcor represent apotentially very significant player in the MBR market and are already on a par withZenon in potable water treatment.
Unsurprisingly, in North America the MBR market is currently dominated byZenon, and the company also have the significant share of installed capacity inmany countries where they operate. According to a recently published review of theNorth American market (Yang et al., 2006), 182 of the 258 installations (i.e. 71%)provided by the four leading MBR suppliers in the USA, Canada and Mexico areZenon plant (Table 1.3). Worldwide, however, there appear to be as many MitsubishiRayon plant as Zenon plant, but only two of these are in the USA and the plants aregenerally smaller. Indeed, as of 2005 nine of the ten biggest MBR plant worldwidewere Zenon plant. Some consolidation in the marketplace has recently taken placewith the acquisition of Zenon Environmental by GE Water and Process Technologiesin March 2006.
On the other hand, in South-East Asia and in Japan in particular, the market isdominated by the Japanese membrane suppliers and Kubota specifically. MitsubishiRayon also has a significant presence in this region, particularly for industrial efflu-ent treatment. In the UK – the EU country which has the largest number of MBRs forsewage treatment – all but three of the 21 municipal wastewater MBRs are Kubota(as of 2005). This trend is not repeated across mainland Europe, however, whereZenon again tend to dominate. For small flows, and in particular for more challen-ging high-strength industrial wastes, the dominance of Kubota and Zenon is muchless pronounced. For example, Wehrle held 10% of the total European MBR marketin 2002 (Frost and Sullivan, 2003), compared with 17% for Zenon at that time,which gives an indication of the significance of the industrial effluent treatmentmarket.
16 The MBR Book
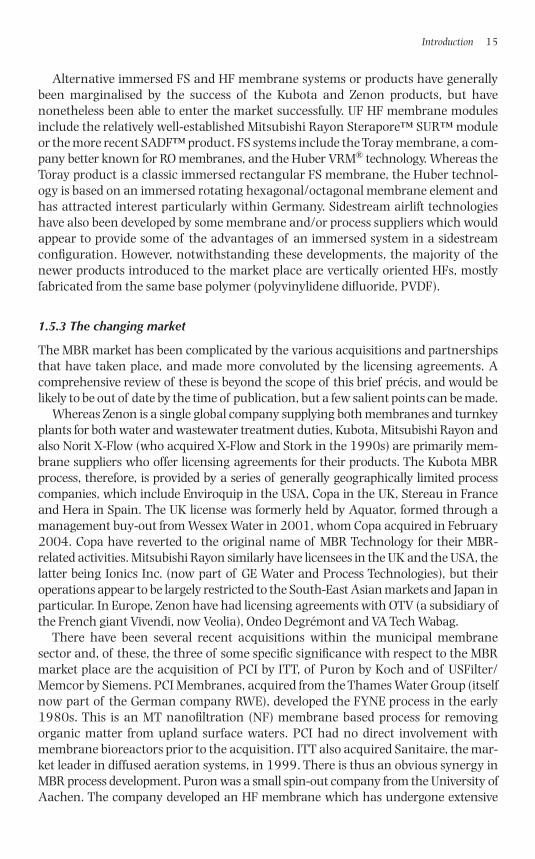
Table 1.3 Number of installations (municipal and industrial) of four MBR providersworldwide and in North America (Yang et al., 2006)
Worldwide USA Canada Mexico
Zenon 331 (204 � 127) 155 (132 � 23) 31 (23 � 8) 6 (1 � 5)USFilter 16 (15 � 1) 13 (13 � 0) 0 0Kubota 1538 (1138 � 400) 51 (48 � 3) 0 0Mitsubishi Rayon 374 (170 � 204) 2 (2 � 0) 0 0
Total 2259 (1527 � 732) 221 (23 � 8) 31 (23 � 8) 6 (1 � 5)
1856174817_Ch01.qxd 6/3/06 4:26 PM Page 16
1.6 Conclusions
Whilst the most significant barrier to the more widespread installation of MBRsremains cost, there are a number of drivers which mitigate this factor. Foremost ofthese is increasingly stringent environmental legislation relating to freshwater con-servation and pollution abatement which has driven technological development inthe water sector over the last 30–40 years. This, along with various governmental,institutional and organisational incentives, has encouraged problem holders toappraise more sophisticated technologies such as MBRs in recent years. Moreover,both capital (and particularly membrane) and operational costs of the MBR processhave decreased dramatically over the past 15 years, although further significantcost reductions may be unattainable unless membrane modules become standard-ised in the same way as has taken place for RO technologies.
The technology itself is still regarded as being immature; although commercialproducts existed as long ago as the late 1960s, it is only since the introduction of theimmersed configurations in the 1990s that significant market penetration has takenplace. Although the market is still dominated by Zenon and Kubota there are now awide range of products available for both industrial and municipal applications,with still more at the developmental stage. Confidence in the technology is growingas reference sites increase in number and maturity, and new opportunities areemerging as retrofitting of membranes into existing biotreatment processesbecomes a viable option for increasing capacity or product water quality withoutdetriment to footprint. As such, it is expected that MBR technology will continue todevelop at a significant pace.
References
All websites accessed January 2006.ADEQ (2006) www.azdeq.gov/environ/water/watershed/fin.htmlBailey, J., Bemberis, I. and Presti, J. (1971) Phase I Final Report – Shipboard sewage
treatment system, General Dynamics Electric Boat Division, November. 1971, NTIS.Bemberis, I., Hubbard, P.J. and Leonard, F.B. (1971) Membrane sewage treatment
systems – potential for complete wastewater treatment, American Society of AgriculturalEngineers Winter Meeting, 71-878, 1–28.
Benham, B.L., Brannan, K.M., Yagow, G., Zeckoski, R.W., Dillana, T.A., Mostaghimi, S.and Wynn, J.W. (2005) Development of bacteria and benthic total maximum dailyloads: a case study, Linville Creek, Virginia. J. Environ. Qual., 34, 1860–1872.
Botha, G.R., Sanderson, R.D. and Buckley, C.A. (1992) Brief historical review ofmembrane development and membrane applications in wastewater treatment inSouthern Africa. Wat. Sci. Technol., 25(10), 1–4.
CEPA (2006) www.waterboards.ca.gov/funding/index.html#funding_programsDefra (2006a) www.defra.gov.uk/environment/water/quality/uwwtd/report02/
02.htmDefra (2006b) www.defra.gov.uk/environment/waste/topics/landfill-dir/index.htmDefra (2006c) www.defra.gov.uk/environment/water/wfd/index.htm
Introduction 17
1856174817_Ch01.qxd 6/3/06 4:26 PM Page 17
DiGiano, F.A., Andreottola, G., Adham, S., Buckley, C., Cornel, P., Daigger, G.T.,Fane, A.G., Galil, N., Jacangelo, J., Alfieri, P., Rittmann, B.E., Rozzi, A., Stephenson, T.and Ujang, Z. (2004) Safe water for everyone: membrane bioreactor technology.www.scienceinafrica.co.za/2004/june/membrane.htm
ECRD (2006) http://europa.eu.int/scadplus/leg/en/s15005.htmFrost and Sullivan (2003) MBR: A buoyant reaction in Europe, Report, June
2003, Frost and Sullivan.Frost and Sullivan (2004a) US advanced water treatment equipment markets,
Report, June 2004, Frost & Sullivan.Frost and Sullivan (2004b) US and Canada membrane bioreactor markets,
Report, June 2004, Frost and Sullivan.Frost and Sullivan (2004c) US desalination plant market, Report, January 2004,
Frost and Sullivan.Frost and Sullivan (2005) European report: introduction and executive summary,
Report, August 2005, Frost and Sullivan.GDNR (2006) www.ganet.org/gefa/water_and_sewer.htmlGEFA (2006) www.gefa.org/gefa/state_revolving.htmlHanft, S. (2006) Membrane bioreactors in the changing world water market,
Business Communications Company Inc. report C-240.Hardt, F.W., Clesceri, L.S., Nemerow, N.L. and Washington, D.R. (1970) Solids sep-
aration by ultrafiltration for concentrated activated sludge. J. Wat. Pollut. Con. Fed.,42, 2135–2148.
HM Treasury (2006) www.hmtreasury.gov.uk./Consultations_and_Legislation/consult_greentech/consult_greentech_index.cfm
Kennedy, S. and Churchouse, S.J. (2005) Progress in membrane bioreactors: new advances, Proceedings of Water and Wastewater Europe Conference, Milan, June2005.
Maxwell, S. (2005) The state of the water industry 2005, a concise overview oftrends and opportunities in the water business, The Environmental Benchmarker andStrategist Annual Water Issue.
Met Office (2006) www.metoffice.com/research/hadleycentre/pubs/brochures/B1997/water.html
Reid, E. (2006) Salinity shocking and fouling amelioration in membrane bioreac-tors, EngD Thesis, School of Water Sciences, Cranfield University.
Smith, C.V., Gregorio, D.O. and Talcott, R.M. (1969) The use of ultrafiltrationmembranes for activated sludge separation, Proceedings of the 24th Industrial WasteConference, Purdue University, Ann Arbor Science, Ann Arbor, USA, 1300–1310.
Sutton, P.M., Mishra, P.N., Bratby, J.R. and Enegess, D. (2002) Membrane bioreac-tor industrial and municipal wastewater application: long term operating experi-ence, Proceedings of the 75th Water Environment Federation Annual Conference andExposition, Chicago, IL,USA.
Tonelli, F.A. and Behmann, H. (1996) Aerated membrane bioreactor process fortreating recalcitrant compounds, US Pat. No. 410730.
Tonelli, F.A. and Canning, R.P. (1993) Membrane bioreactor system for treatingsynthetic metal-working fluids and oil based products, USA Pat. No. 5204001.
USEPA (2006a) www.epa.gov/region5/defs/html/ppa.htm
18 The MBR Book
1856174817_Ch01.qxd 6/3/06 4:26 PM Page 18

USEPA (2006b) www.epa.gov/Region5/defs/html/sdwa.htmUSEPA (2006c) www.epa.gov/owmitnet/cwfinance/cwsrf/index.htmYamamoto, K., Hiasa, M., Mahmood, T. and Matsuo, T. (1989) Direct solid–liquid
separation using hollow fibre membrane in an activated sludge aeration tank. Wat.Sci. Technol., 21(10), 43–54.
Yang, W., Cicek, N. and Ilg, J. (2006) State-of-the-art of membrane bioreactors:worldwide research and commercial applications in North America. J. MembraneSci., 270, 201–211.
Introduction 19
1856174817_Ch01.qxd 6/3/06 4:26 PM Page 19

This page intentionally left blank
Chapter 2
Fundamentals
With acknowledgements to:
Section 2.2 Beth Reid AEA Technology, UKTom Stephenson, Cranfield University, UKFolasade Fawenhimni,Harriet Fletcher,Bruce Jefferson,Eve Germain
Sections 2.3.2 Ewan McAdam Cranfield University, UKand 2.3.3
Sections 2.3.3 Pierre Le-Clech, The UNESCO Centre for Membraneto 2.3.9 Vicky Chen, Science and Technology, The
Tony (A.G.) Fane University of New South Wales, Sydney, Australia
1856174817_Ch02.qxd 6/5/06 12:08 PM Page 21
2.1 Membrane technology
2.1.1 Membranes and membrane separation processes
A membrane as applied to water and wastewater treatment is simply a material thatallows some physical or chemical components to pass more readily through it thanothers. It is thus perm-selective, since it is more permeable to those constituentspassing through it (which then become the permeate) than those which are rejectedby it (which form the retentate). The degree of selectivity depends on the membranepore size. The coarsest membrane, associated with microfiltration (MF), can rejectparticulate matter. The most selective membrane, associated with reverse osmosis (RO),can reject singly charged (i.e. monovalent) ions, such as sodium (Na�) and chloride(Cl�). Given that the hydraulic diameter of these ions is less than 1 nm, it stands toreason that the pores in an RO membrane are very small. Indeed, they are only visibleusing the most powerful of microscopes.
The four key membrane separation processes in which water forms the permeateproduct are RO, nanofiltration (NF), ultrafiltration (UF) and MF (Fig. 2.1). Membranesthemselves can thus be defined according to the type of separation duty to which
22 The MBR Book
10�10 10�9 10�8 10�7 10�6 10�5
Scale in metres
Reverse osmosis UltrafiltrationNanofiltration
Freeatoms
200 20 000 500 000
Approximate molecular weight in daltons
Smallorganic
monomers
Sugars
Herbicides
Pesticides
Dissolvedsalts
Endotoxins/pyrogens
Viruses
Colloids:albumen proteincolloidal silica
Bacteria (to �40 µm)
Crypto-sporidia
Redbloodcells
MicrofiltrationDepth
filtration(to >1 mm)
Increasing pumping energy
Figure 2.1 Membrane separation processes overview (Judd and Jefferson, 2003)
1856174817_Ch02.qxd 6/5/06 12:08 PM Page 22
they can be put, which then provides an indication of the pore size. The latter can bedefined either in terms of the effective equivalent pore diameter, normally in �m, or theequivalent mass of the smallest molecule in daltons (Da) the membrane is capable ofrejecting, where 1 Da represents the mass of a hydrogen atom. For UF membranesspecifically the selectivity is thus defined by the molecular weight cut-off (MWCO) indaltons. For the key membrane processes identified, pressure is applied to force waterthrough the membrane. However, there are additional membrane processes in whichthe membrane is not necessarily used to retain the contaminants and allow thewater to pass through, but can instead be used either to:
(a) selectively extract constituents (extractive) or(b) introduce a component in the molecular form (diffusive).
The range of membrane processes available is given in Table 2.1, along with an outlineof the mechanism by which each process operates. Mature commercial membraneapplications in water and wastewater treatment are limited to the pressure-drivenprocesses and electrodialysis (ED), which can extract problem ions such as nitrateand those ions associated with hardness or salinity. Membrane technologies asapplied to the municipal sector are predominantly pressure driven and, whilst themembrane permselectivity and separation mechanism may vary from process toanother, such processes all have the common elements of a purified permeate prod-uct and a concentrated retentate waste (Fig. 2.2).
The rejection of contaminants ultimately places a fundamental constraint on allmembrane processes. The rejected constituents in the retentate tend to accumulateat the membrane surface, producing various phenomena which lead to a reduction
Fundamentals 23
Table 2.1 Dense and porous membranes for water treatment
Pressure-driven Extractive/diffusive
Reverse osmosis (RO)Separation achieved by virtue of differing solubility and diffusion rates of water (solvent)and solutes in water
Nanofiltration (NF)Formerly called leaky RO. Separation achievedthrough combination of charge rejection, solubility–diffusion and sieving throughmicropores (�2 nm)
Ultrafiltration (UF)Separation by sieving through mesopores(2–50 nm)*
Microfiltration (MF)Separation of suspended solids from water bysieving through macropores (�50 nm)*
*IUPAC (1985).
Electrodialysis (ED)Separation achieved by virtue of differing ionicsize, charge and charge density of solute ions,using ion-exchange membranes
Pervaporation (PV)Same mechanism as RO but with the (volatile)solute partially vapourised in the membrane by partially vacuumating the permeate.
Membrane extraction (ME)Constituent removed by virtue of a concentration gradient between retentate andpermeate side of membrane
Gas transfer (GT)Gas transferred under a partial pressure gradient into or out of water in molecular form
1856174817_Ch02.qxd 6/5/06 12:08 PM Page 23

in the flow of water through the membrane (i.e. the flux) at a given transmembranepressure (TMP), or conversely an increase in the TMP for a given flux (reducing thepermeability, which is the ratio of flux to TMP). These phenomena are collectivelyreferred to as fouling. Given that membrane fouling represents the main limitationto membrane process operation, it is unsurprising that the majority of membranematerial and process research and development conducted is dedicated to its char-acterisation and amelioration (Section 2.3).
Fouling can take place through a number of physicochemical and biological mecha-nisms which all relate to increased deposition of solid material onto the membrane sur-face (also referred to as blinding) and within the membrane structure (pore restrictionor pore plugging/occlusion). This is to be distinguished from clogging, which is the fill-ing of the membrane channels with solids due to poor hydrodynamic performance. Themembrane resistance is fixed, unless its overall permeability is reduced by componentsin the feedwater permanently adsorbing onto or into the membrane. The resistanceimparted by the interfacial region is, on the other hand, dependent on the total amountof fouling material residing in the region. This in turn depends upon both the thicknessof the interface, the feedwater composition (and specifically its foulant content) and theflux through the membrane. The feedwater matrix and the process operating conditionsthus largely determine process performance.
2.1.2 Membrane materials
There are mainly two different types of membrane material, these being polymericand ceramic. Metallic membrane filters also exist, but these have very specific appli-cations which do not relate to membrane bioreactor (MBR) technology. The mem-brane material, to be made useful, must then be formed (or configured) in such away as to allow water to pass through it.
A number of different polymeric and ceramic materials are used to form membranes,but generally nearly always comprise a thin surface layer which provides the requiredpermselectivity on top of a more open, thicker porous support which provides mechan-ical stability. A classic membrane is thus anisotropic in structure, having symmetryonly in the plane orthogonal to the membrane surface (Fig. 2.3). Polymeric membranesare also usually fabricated both to have a high surface porosity, or % total surface porecross-sectional area (Fig. 2.4), and narrow pore size distribution to provide as high athroughput and as selective a degree of rejection as possible. The membrane must alsobe mechanically strong (i.e. to have structural integrity). Lastly, the material willnormally have some resistance to thermal and chemical attack, that is, extremes of temperature, pH and/or oxidant concentrations that normally arise when the
24 The MBR Book
Feed
Retentate
Permeate
Figure 2.2 Schematic of membrane
1856174817_Ch02.qxd 6/5/06 12:08 PM Page 24
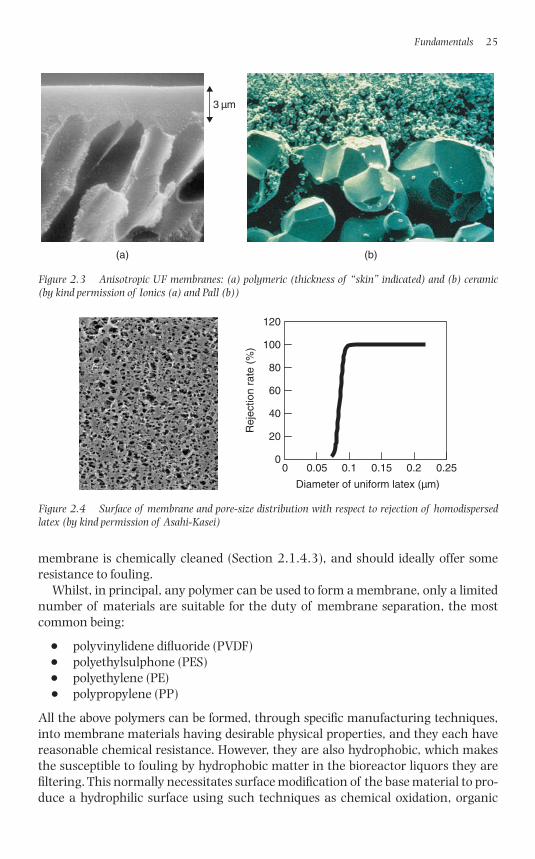
membrane is chemically cleaned (Section 2.1.4.3), and should ideally offer someresistance to fouling.
Whilst, in principal, any polymer can be used to form a membrane, only a limitednumber of materials are suitable for the duty of membrane separation, the mostcommon being:
● polyvinylidene difluoride (PVDF)● polyethylsulphone (PES)● polyethylene (PE)● polypropylene (PP)
All the above polymers can be formed, through specific manufacturing techniques,into membrane materials having desirable physical properties, and they each havereasonable chemical resistance. However, they are also hydrophobic, which makesthe susceptible to fouling by hydrophobic matter in the bioreactor liquors they arefiltering. This normally necessitates surface modification of the base material to pro-duce a hydrophilic surface using such techniques as chemical oxidation, organic
Fundamentals 25
3 µm
(a) (b)
Figure 2.3 Anisotropic UF membranes: (a) polymeric (thickness of “skin” indicated) and (b) ceramic(by kind permission of Ionics (a) and Pall (b))
0
20
40
60
80
100
120
0 0.05 0.1 0.15 0.2 0.25
Rej
ectio
n ra
te (
%)
Diameter of uniform latex (µm)
Figure 2.4 Surface of membrane and pore-size distribution with respect to rejection of homodispersedlatex (by kind permission of Asahi-Kasei)
1856174817_Ch02.qxd 6/5/06 12:08 PM Page 25
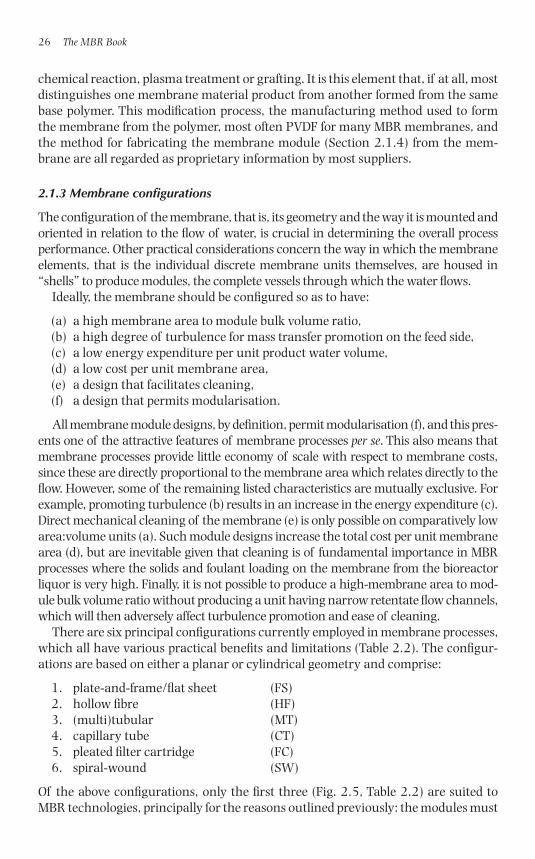
chemical reaction, plasma treatment or grafting. It is this element that, if at all, mostdistinguishes one membrane material product from another formed from the samebase polymer. This modification process, the manufacturing method used to formthe membrane from the polymer, most often PVDF for many MBR membranes, andthe method for fabricating the membrane module (Section 2.1.4) from the mem-brane are all regarded as proprietary information by most suppliers.
2.1.3 Membrane configurations
The configuration of the membrane, that is, its geometry and the way it is mounted andoriented in relation to the flow of water, is crucial in determining the overall processperformance. Other practical considerations concern the way in which the membraneelements, that is the individual discrete membrane units themselves, are housed in“shells” to produce modules, the complete vessels through which the water flows.
Ideally, the membrane should be configured so as to have:
(a) a high membrane area to module bulk volume ratio,(b) a high degree of turbulence for mass transfer promotion on the feed side,(c) a low energy expenditure per unit product water volume,(d) a low cost per unit membrane area,(e) a design that facilitates cleaning,(f) a design that permits modularisation.
All membrane module designs, by definition, permit modularisation (f), and this pres-ents one of the attractive features of membrane processes per se. This also means thatmembrane processes provide little economy of scale with respect to membrane costs,since these are directly proportional to the membrane area which relates directly to theflow. However, some of the remaining listed characteristics are mutually exclusive. Forexample, promoting turbulence (b) results in an increase in the energy expenditure (c).Direct mechanical cleaning of the membrane (e) is only possible on comparatively lowarea:volume units (a). Such module designs increase the total cost per unit membranearea (d), but are inevitable given that cleaning is of fundamental importance in MBRprocesses where the solids and foulant loading on the membrane from the bioreactorliquor is very high. Finally, it is not possible to produce a high-membrane area to mod-ule bulk volume ratio without producing a unit having narrow retentate flow channels,which will then adversely affect turbulence promotion and ease of cleaning.
There are six principal configurations currently employed in membrane processes,which all have various practical benefits and limitations (Table 2.2). The configur-ations are based on either a planar or cylindrical geometry and comprise:
1. plate-and-frame/flat sheet (FS)2. hollow fibre (HF)3. (multi)tubular (MT)4. capillary tube (CT)5. pleated filter cartridge (FC)6. spiral-wound (SW)
Of the above configurations, only the first three (Fig. 2.5, Table 2.2) are suited toMBR technologies, principally for the reasons outlined previously: the modules must
26 The MBR Book
1856174817_Ch02.qxd 6/5/06 12:08 PM Page 26
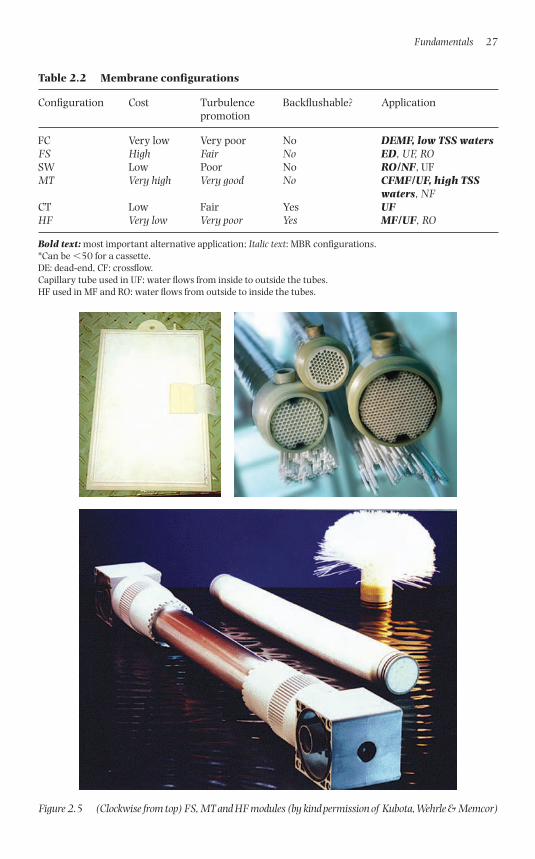
Fundamentals 27
Table 2.2 Membrane configurations
Configuration Cost Turbulence Backflushable? Applicationpromotion
FC Very low Very poor No DEMF, low TSS watersFS High Fair No ED, UF, ROSW Low Poor No RO/NF, UFMT Very high Very good No CFMF/UF, high TSS
waters, NFCT Low Fair Yes UFHF Very low Very poor Yes MF/UF, RO
Bold text: most important alternative application; Italic text: MBR configurations.*Can be �50 for a cassette.DE: dead-end, CF: crossflow.Capillary tube used in UF: water flows from inside to outside the tubes.HF used in MF and RO: water flows from outside to inside the tubes.
Figure 2.5 (Clockwise from top) FS, MT and HF modules (by kind permission of Kubota, Wehrle & Memcor)
1856174817_Ch02.qxd 6/5/06 12:08 PM Page 27
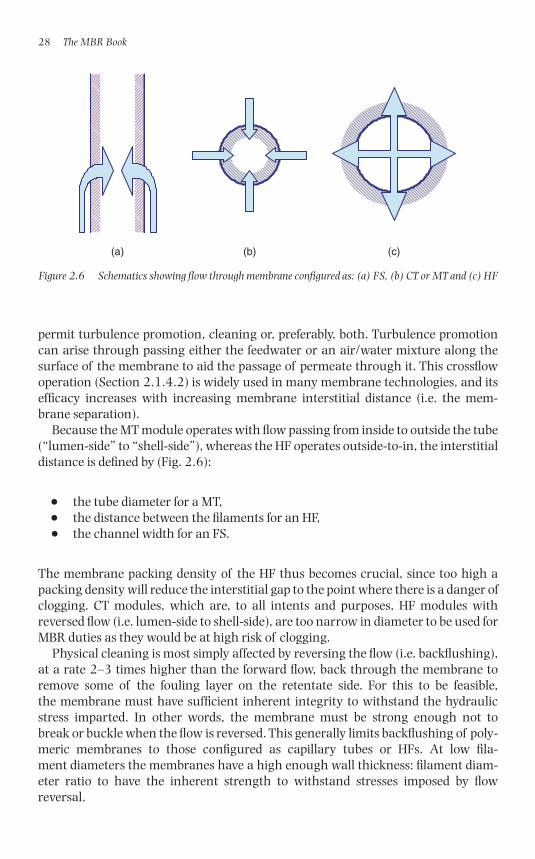
28 The MBR Book
(a) (b) (c)
Figure 2.6 Schematics showing flow through membrane configured as: (a) FS, (b) CT or MT and (c) HF
permit turbulence promotion, cleaning or, preferably, both. Turbulence promotioncan arise through passing either the feedwater or an air/water mixture along thesurface of the membrane to aid the passage of permeate through it. This crossflowoperation (Section 2.1.4.2) is widely used in many membrane technologies, and itsefficacy increases with increasing membrane interstitial distance (i.e. the mem-brane separation).
Because the MT module operates with flow passing from inside to outside the tube(“lumen-side” to “shell-side”), whereas the HF operates outside-to-in, the interstitialdistance is defined by (Fig. 2.6):
● the tube diameter for a MT,● the distance between the filaments for an HF,● the channel width for an FS.
The membrane packing density of the HF thus becomes crucial, since too high apacking density will reduce the interstitial gap to the point where there is a danger ofclogging. CT modules, which are, to all intents and purposes, HF modules withreversed flow (i.e. lumen-side to shell-side), are too narrow in diameter to be used forMBR duties as they would be at high risk of clogging.
Physical cleaning is most simply affected by reversing the flow (i.e. backflushing),at a rate 2–3 times higher than the forward flow, back through the membrane toremove some of the fouling layer on the retentate side. For this to be feasible,the membrane must have sufficient inherent integrity to withstand the hydraulicstress imparted. In other words, the membrane must be strong enough not tobreak or buckle when the flow is reversed. This generally limits backflushing of poly-meric membranes to those configured as capillary tubes or HFs. At low fila-ment diameters the membranes have a high enough wall thickness: filament diam-eter ratio to have the inherent strength to withstand stresses imposed by flowreversal.
1856174817_Ch02.qxd 6/5/06 12:08 PM Page 28
2.1.4 Membrane process operation
2.1.4.1 Flux, pressure, resistance and permeabilityThe key elements of any membrane process relate to the influence of the followingparameters on the overall permeate flux:
(a) the membrane resistance,(b) the operational driving force per unit membrane area,(c) the hydrodynamic conditions at the membrane:liquid interface,(d) the fouling and subsequent cleaning of the membrane surface.
The flux (normally denoted J) is the quantity of material passing through a unit areaof membrane per unit time. This means that it takes SI units of m3/m2/s, or simplym s�1, and is occasionally referred to as the permeate or filtration velocity. Other non-SI units used are litres per m2 per hour (or LMH) and m/day, which tend to give moreaccessible numbers: MBRs generally operate at fluxes between 10 and 100 LMH. Theflux relates directly to the driving force (i.e. the TMP for conventional MBRs) and thetotal hydraulic resistance offered by the membrane and the interfacial region adja-cent to it.
Although for conventional biomass separation MBRs the driving force for theprocess is the TMP, for extractive or diffusive MBRs (Sections 2.3.2–2.3.3) it is respec-tively the concentration or partial pressure gradient. Whereas with conventionalpressure-driven MBRs the permeate is the purified product, for extractive MBRs thecontaminants are removed from the water across the membrane under the influ-ence of a concentration gradient and are subsequently biologically treated, theretentate forming the purified product. For diffusive bioreactors neither water norcontaminants permeate the membrane: in this case the membrane is used to trans-port a gas into the bioreactor.
Resistance R (/m) and permeability K (m/(s bar), or LMH/bar in non-SI units) areinversely related. The resistance is given by:
(2.1)
where � is the viscosity (kg/(m s2)) and �P (Pa) the pressure drop, and can refer toeither the TMP (�Pm Pa/bar in non-SI units) or individual components which con-tribute to the pressure drop. Permeability is normally quoted as the ratio of flux toTMP (hence J/�Pm), the most convenient units being LMH/bar, and sometimes cor-rected for temperature impacts on viscosity.
The resistance R includes a number of components, namely:
(a) the membrane resistance,(b) the resistance of the fouling layer (adsorbed onto the membrane surface),(c) the resistance offered by the membrane:solution interfacial region.
RPJ
��
h
Fundamentals 29
1856174817_Ch02.qxd 6/5/06 12:08 PM Page 29
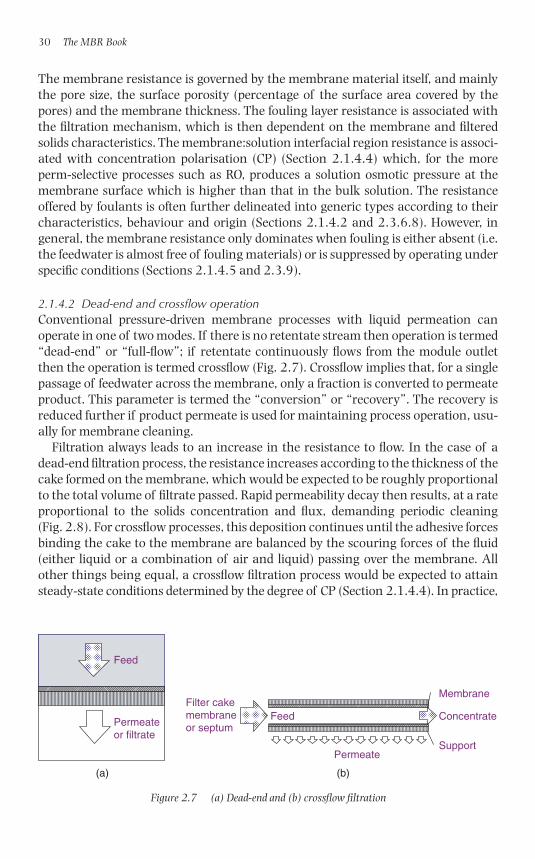
The membrane resistance is governed by the membrane material itself, and mainlythe pore size, the surface porosity (percentage of the surface area covered by thepores) and the membrane thickness. The fouling layer resistance is associated withthe filtration mechanism, which is then dependent on the membrane and filteredsolids characteristics. The membrane:solution interfacial region resistance is associ-ated with concentration polarisation (CP) (Section 2.1.4.4) which, for the moreperm-selective processes such as RO, produces a solution osmotic pressure at themembrane surface which is higher than that in the bulk solution. The resistanceoffered by foulants is often further delineated into generic types according to theircharacteristics, behaviour and origin (Sections 2.1.4.2 and 2.3.6.8). However, ingeneral, the membrane resistance only dominates when fouling is either absent (i.e.the feedwater is almost free of fouling materials) or is suppressed by operating underspecific conditions (Sections 2.1.4.5 and 2.3.9).
2.1.4.2 Dead-end and crossflow operationConventional pressure-driven membrane processes with liquid permeation canoperate in one of two modes. If there is no retentate stream then operation is termed“dead-end” or “full-flow”; if retentate continuously flows from the module outletthen the operation is termed crossflow (Fig. 2.7). Crossflow implies that, for a singlepassage of feedwater across the membrane, only a fraction is converted to permeateproduct. This parameter is termed the “conversion” or “recovery”. The recovery isreduced further if product permeate is used for maintaining process operation, usu-ally for membrane cleaning.
Filtration always leads to an increase in the resistance to flow. In the case of adead-end filtration process, the resistance increases according to the thickness of thecake formed on the membrane, which would be expected to be roughly proportionalto the total volume of filtrate passed. Rapid permeability decay then results, at a rateproportional to the solids concentration and flux, demanding periodic cleaning (Fig. 2.8). For crossflow processes, this deposition continues until the adhesive forcesbinding the cake to the membrane are balanced by the scouring forces of the fluid(either liquid or a combination of air and liquid) passing over the membrane. Allother things being equal, a crossflow filtration process would be expected to attainsteady-state conditions determined by the degree of CP (Section 2.1.4.4). In practice,
30 The MBR Book
Filter cakemembraneor septumPermeate
or filtrate
Feed
Feed Concentrate
Permeate
Membrane
Support
(a) (b)
Figure 2.7 (a) Dead-end and (b) crossflow filtration
1856174817_Ch02.qxd 6/5/06 12:08 PM Page 30
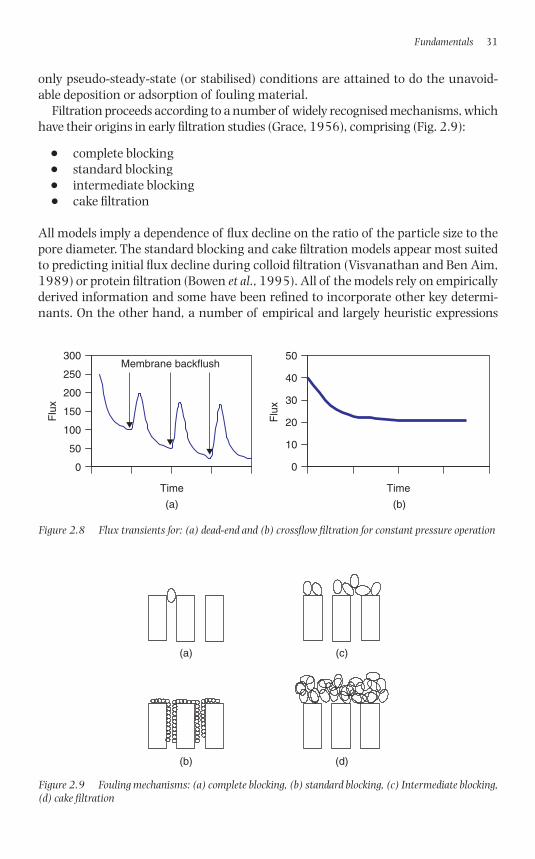
only pseudo-steady-state (or stabilised) conditions are attained to do the unavoid-able deposition or adsorption of fouling material.
Filtration proceeds according to a number of widely recognised mechanisms, whichhave their origins in early filtration studies (Grace, 1956), comprising (Fig. 2.9):
● complete blocking● standard blocking● intermediate blocking● cake filtration
All models imply a dependence of flux decline on the ratio of the particle size to thepore diameter. The standard blocking and cake filtration models appear most suitedto predicting initial flux decline during colloid filtration (Visvanathan and Ben Aim,1989) or protein filtration (Bowen et al., 1995). All of the models rely on empiricallyderived information and some have been refined to incorporate other key determi-nants. On the other hand, a number of empirical and largely heuristic expressions
Fundamentals 31
0
50
100
150
200
250
300
Flu
x
Membrane backflush
Time
(a) (b)
0
10
20
30
40
50
Time
Flu
x
Figure 2.8 Flux transients for: (a) dead-end and (b) crossflow filtration for constant pressure operation
(d)
(c)(a)
(b)
Figure 2.9 Fouling mechanisms: (a) complete blocking, (b) standard blocking, (c) Intermediate blocking,(d) cake filtration
1856174817_Ch02.qxd 6/5/06 12:08 PM Page 31
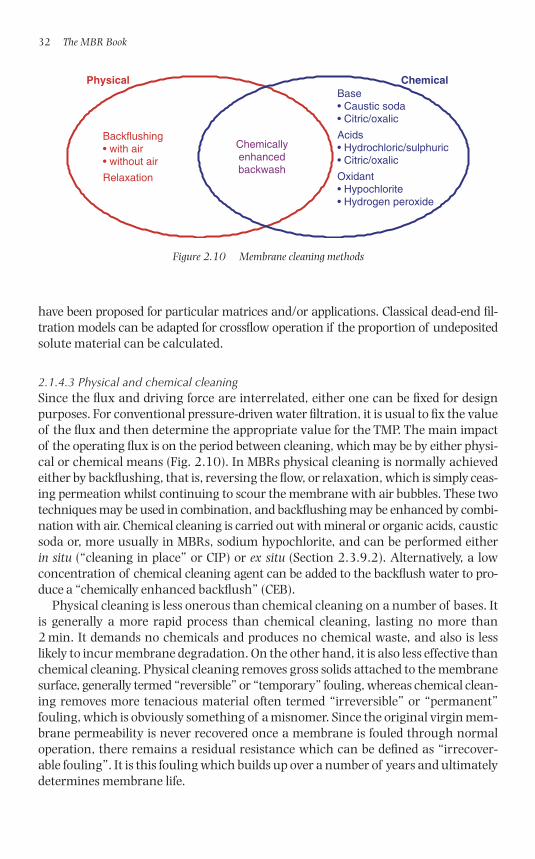
have been proposed for particular matrices and/or applications. Classical dead-end fil-tration models can be adapted for crossflow operation if the proportion of undepositedsolute material can be calculated.
2.1.4.3 Physical and chemical cleaningSince the flux and driving force are interrelated, either one can be fixed for designpurposes. For conventional pressure-driven water filtration, it is usual to fix the valueof the flux and then determine the appropriate value for the TMP. The main impactof the operating flux is on the period between cleaning, which may be by either physi-cal or chemical means (Fig. 2.10). In MBRs physical cleaning is normally achievedeither by backflushing, that is, reversing the flow, or relaxation, which is simply ceas-ing permeation whilst continuing to scour the membrane with air bubbles. These twotechniques may be used in combination, and backflushing may be enhanced by combi-nation with air. Chemical cleaning is carried out with mineral or organic acids, causticsoda or, more usually in MBRs, sodium hypochlorite, and can be performed eitherin situ (“cleaning in place” or CIP) or ex situ (Section 2.3.9.2). Alternatively, a lowconcentration of chemical cleaning agent can be added to the backflush water to pro-duce a “chemically enhanced backflush” (CEB).
Physical cleaning is less onerous than chemical cleaning on a number of bases. Itis generally a more rapid process than chemical cleaning, lasting no more than2 min. It demands no chemicals and produces no chemical waste, and also is lesslikely to incur membrane degradation. On the other hand, it is also less effective thanchemical cleaning. Physical cleaning removes gross solids attached to the membranesurface, generally termed “reversible” or “temporary” fouling, whereas chemical clean-ing removes more tenacious material often termed “irreversible” or “permanent”fouling, which is obviously something of a misnomer. Since the original virgin mem-brane permeability is never recovered once a membrane is fouled through normaloperation, there remains a residual resistance which can be defined as “irrecover-able fouling”. It is this fouling which builds up over a number of years and ultimatelydetermines membrane life.
32 The MBR Book
Physical Chemical
Acids• Hydrochloric/sulphuric• Citric/oxalic
Base• Caustic soda• Citric/oxalic
Oxidant• Hypochlorite• Hydrogen peroxide
Backflushing• with air• without air
Relaxation
Chemicallyenhancedbackwash
Figure 2.10 Membrane cleaning methods
1856174817_Ch02.qxd 6/5/06 12:08 PM Page 32
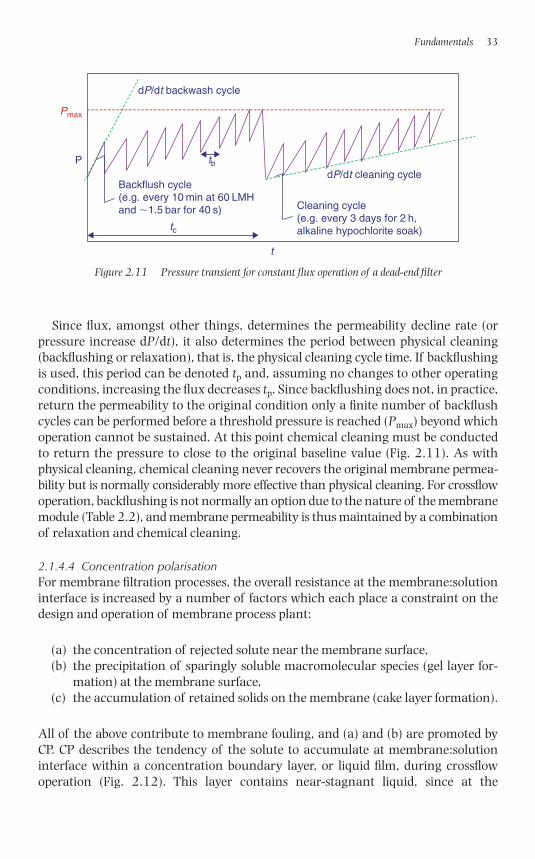
Since flux, amongst other things, determines the permeability decline rate (orpressure increase dP/dt), it also determines the period between physical cleaning(backflushing or relaxation), that is, the physical cleaning cycle time. If backflushingis used, this period can be denoted tp and, assuming no changes to other operatingconditions, increasing the flux decreases tp. Since backflushing does not, in practice,return the permeability to the original condition only a finite number of backflushcycles can be performed before a threshold pressure is reached (Pmax) beyond whichoperation cannot be sustained. At this point chemical cleaning must be conductedto return the pressure to close to the original baseline value (Fig. 2.11). As withphysical cleaning, chemical cleaning never recovers the original membrane permea-bility but is normally considerably more effective than physical cleaning. For crossflowoperation, backflushing is not normally an option due to the nature of the membranemodule (Table 2.2), and membrane permeability is thus maintained by a combinationof relaxation and chemical cleaning.
2.1.4.4 Concentration polarisationFor membrane filtration processes, the overall resistance at the membrane:solutioninterface is increased by a number of factors which each place a constraint on thedesign and operation of membrane process plant:
(a) the concentration of rejected solute near the membrane surface,(b) the precipitation of sparingly soluble macromolecular species (gel layer for-
mation) at the membrane surface,(c) the accumulation of retained solids on the membrane (cake layer formation).
All of the above contribute to membrane fouling, and (a) and (b) are promoted by CP. CP describes the tendency of the solute to accumulate at membrane:solutioninterface within a concentration boundary layer, or liquid film, during crossflowoperation (Fig. 2.12). This layer contains near-stagnant liquid, since at the
Fundamentals 33
dP/dt backwash cycle
dP/dt cleaning cycleP
t
Backflush cycle(e.g. every 10 min at 60 LMHand �1.5 bar for 40 s)
Pmax
Cleaning cycle(e.g. every 3 days for 2 h,alkaline hypochlorite soak)
tb
tc
Figure 2.11 Pressure transient for constant flux operation of a dead-end filter
1856174817_Ch02.qxd 6/5/06 12:08 PM Page 33
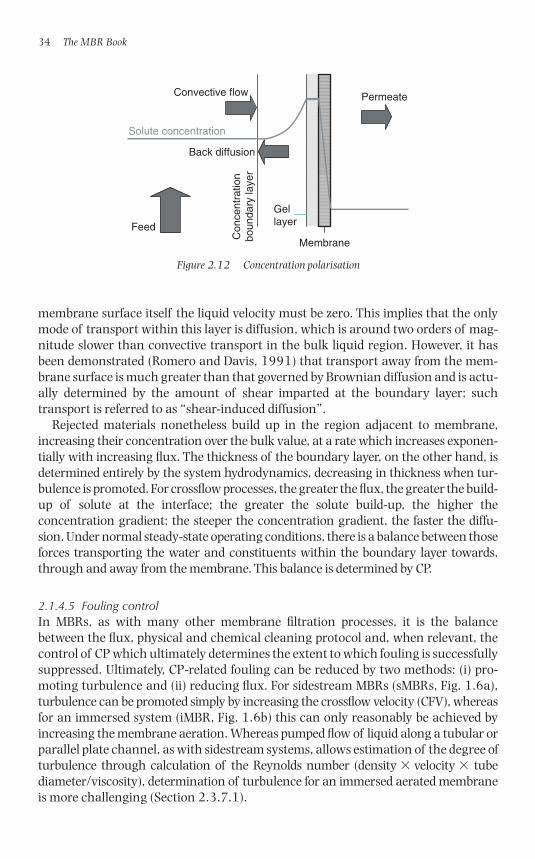
membrane surface itself the liquid velocity must be zero. This implies that the onlymode of transport within this layer is diffusion, which is around two orders of mag-nitude slower than convective transport in the bulk liquid region. However, it hasbeen demonstrated (Romero and Davis, 1991) that transport away from the mem-brane surface is much greater than that governed by Brownian diffusion and is actu-ally determined by the amount of shear imparted at the boundary layer; suchtransport is referred to as “shear-induced diffusion”.
Rejected materials nonetheless build up in the region adjacent to membrane,increasing their concentration over the bulk value, at a rate which increases exponen-tially with increasing flux. The thickness of the boundary layer, on the other hand, isdetermined entirely by the system hydrodynamics, decreasing in thickness when tur-bulence is promoted. For crossflow processes, the greater the flux, the greater the build-up of solute at the interface; the greater the solute build-up, the higher theconcentration gradient; the steeper the concentration gradient, the faster the diffu-sion. Under normal steady-state operating conditions, there is a balance between thoseforces transporting the water and constituents within the boundary layer towards,through and away from the membrane. This balance is determined by CP.
2.1.4.5 Fouling controlIn MBRs, as with many other membrane filtration processes, it is the balancebetween the flux, physical and chemical cleaning protocol and, when relevant, thecontrol of CP which ultimately determines the extent to which fouling is successfullysuppressed. Ultimately, CP-related fouling can be reduced by two methods: (i) pro-moting turbulence and (ii) reducing flux. For sidestream MBRs (sMBRs, Fig. 1.6a),turbulence can be promoted simply by increasing the crossflow velocity (CFV), whereasfor an immersed system (iMBR, Fig. 1.6b) this can only reasonably be achieved byincreasing the membrane aeration. Whereas pumped flow of liquid along a tubular orparallel plate channel, as with sidestream systems, allows estimation of the degree ofturbulence through calculation of the Reynolds number (density � velocity � tubediameter/viscosity), determination of turbulence for an immersed aerated membraneis more challenging (Section 2.3.7.1).
34 The MBR Book
Con
cent
ratio
nbo
unda
ry la
yer
Membrane
Feed
Permeate
Solute concentration
Back diffusion
Convective flow
Gellayer
Figure 2.12 Concentration polarisation
1856174817_Ch02.qxd 6/5/06 12:08 PM Page 34
2.1.4.6 Critical fluxThe critical flux concept was originally presented by Field et al. (1995). These authorsstated that: “The critical flux hypothesis for microfiltration/ultrafiltration processes isthat on start-up there exists a flux below which a decline of flux with time does notoccur; above it, fouling is observed”. Two distinct forms of the concept have beendefined. In the strong form, the flux obtained during sub-critical flux is equated to theclean water flux measured under the same conditions. However, clean water fluxes arerarely attained for most real feedwaters due to irreversible adsorption of some solutes.In the alternative weak form, the sub-critical flux is the flux rapidly established andmaintained during start-up of filtration, but does not necessarily equate to the cleanwater flux. Alternatively, stable filtration operation, that is, constant permeability foran extended time period, has been defined as sub-critical operation even when pre-ceded by an initial decline in flux (Howell, 1995). Such conditions would be expectedto lead to lower critical flux values than those obtained for constant permeability oper-ation, however, since an initial permeability decline implies foulant deposition.
A number of slightly different definitions of sub-critical flux operation have beenproposed, largely depending on the method employed. The most microscopically precisedefinition equates the critical flux to that flux below which no deposition of colloidalmatter takes place. Kwon and Vigneswaran (1998) equated critical flux to the liftvelocity as defined by the lateral migration theory of Green and Belfort (1980). Thisrigorous definition is difficult to apply because of the relative complexity of the deter-mination of the lift velocity, particularly for heterogeneous matrices. On the otherhand, experimental determination of critical flux by direct observation of materialdeposition onto the membrane has been conducted using model homodispersed sus-pensions of polystyrene latex particles (Kwon and Vigneswaran, 1998), and someauthors have also used mass balance determinations (Kwon et al., 2000).
Given the limitations of applying particle hydrodynamics to the identification ofthe critical flux in real systems, recourse generally has to be made to experimentaldetermination. By plotting flux against the TMP it is possible to observe the transi-tion between the linearly pressure-dependent flux and the onset of fouling, wheredeviation from linearity commences. The flux at this transition has been termed “sec-ondary critical flux” (Bouhabila et al., 1998) and, more recently, the concept of “sus-tainable flux” has been introduced, defined as the flux for which the TMP increasesgradually at an acceptable rate, such that chemical cleaning is not necessary (Nget al., 2005).
Whilst potentially useful in providing a guide value for the appropriate operatingflux, the absolute value of the critical flux obtained is dependent on the exactmethod employed for its determination and, specifically, the rate at which the flux isvaried with time. A common practice is to incrementally increase the flux for a fixedduration for each increment, giving a stable TMP at low flux but an ever-increasingrate of TMP increase at higher fluxes (Fig. 2.13). This flux-step method defines thehighest flux for which TMP remains stable as the critical flux. This method is pre-ferred over the corresponding TMP-step method since the former provides a bettercontrol of the flow of material deposition on the membrane surface, as the convectiveflow of solute towards the membrane is constant during the run (Defrance and Jaffrin,1999). No single protocol has been agreed for critical flux measurement, making
Fundamentals 35
1856174817_Ch02.qxd 6/5/06 12:08 PM Page 35
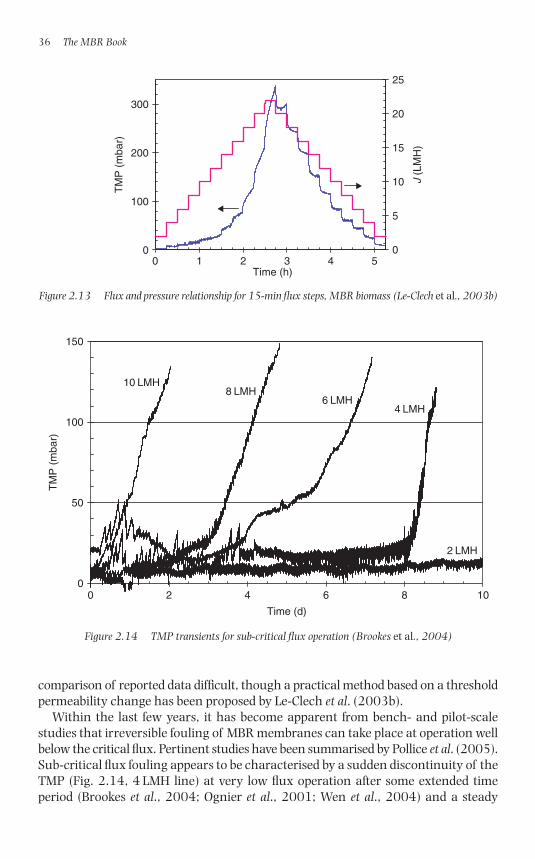
comparison of reported data difficult, though a practical method based on a thresholdpermeability change has been proposed by Le-Clech et al. (2003b).
Within the last few years, it has become apparent from bench- and pilot-scalestudies that irreversible fouling of MBR membranes can take place at operation wellbelow the critical flux. Pertinent studies have been summarised by Pollice et al. (2005).Sub-critical flux fouling appears to be characterised by a sudden discontinuity of theTMP (Fig. 2.14, 4 LMH line) at very low flux operation after some extended timeperiod (Brookes et al., 2004; Ognier et al., 2001; Wen et al., 2004) and a steady
36 The MBR Book
0
100
200
300
0 1 2 3 4 5Time (h)
TM
P (
mba
r)
0
5
10
15
20
25
J (L
MH
)
Figure 2.13 Flux and pressure relationship for 15-min flux steps, MBR biomass (Le-Clech et al., 2003b)
0
50
100
150
0 2 4 6 8 10
Time (d)
TM
P (
mba
r)
10 LMH8 LMH
6 LMH4 LMH
2 LMH
Figure 2.14 TMP transients for sub-critical flux operation (Brookes et al., 2004)
1856174817_Ch02.qxd 6/5/06 12:08 PM Page 36
neo-exponential increase at fluxes closer to the notional critical flux (Fig. 2.14,10 LMH line). Sub-critical fouling is discussed further along with MBR membranefouling mechanisms in Section 2.3.8.
2.2 Biotreatment
2.2.1 Biotreatment rationale
Biological treatment (or biotreatment) processes are those which remove dissolvedand suspended organic chemical constituents through biodegradation, as well assuspended matter through physical separation. Biotreatment demands that the appro-priate reactor conditions prevail in order to maintain sufficient levels of viable (i.e.living) micro-organisms (or, collectively, biomass) to achieve removal of organics. Thelatter are normally measured as biochemical or chemical oxygen demand (BOD andCOD, respectively); these are indirect measurements of organic matter levels since bothrefer to the amount of oxygen utilised for oxidation of the organics. The micro-organisms that grow on the organic substrate on which they feed derive energy andgenerate cellular material from oxidation of the organic matter, and can be aerobic(oxygen-dependent) or anaerobic (oxygen-independent). They are subsequently sep-arated from the water to leave a relatively clean, clarified effluent.
The most attractive feature of biological processes is the very high chemical con-version efficiency achievable. Unlike chemical oxidation processes, aerobic processesare capable of quantitatively mineralising large organic molecules, that is, convertingthem to the end mineral constituents of CO2, H2O and inorganic nitrogen products, atambient temperatures without significant onerous byproduct formation. In doing soa variety of materials are released from the biomass in the reactor which are collect-ively referred to as extracellular polymeric substances (EPS) and which contain anumber of components which contribute to membrane fouling in an MBR (Section2.3.6.1). The relative and overall concentrations of the various components aredetermined both by the feed characteristics and operational facets of the system, suchas microbial speciation. Anaerobic processes generate methane as an end product, apossible thermal energy source, and similarly generate EPS. Biotreatment processesare generally robust to variable organic loads, create little odour (if aerobic) and gen-erate a waste product (sludge) which is readily processed. On the other hand, they areslower than chemical processes, susceptible to toxic shock and consume energy asso-ciated with aeration in aerobic systems and mixing in all biotreatment systems.
2.2.2 Processes
Processes based on biodegradation can be classified according to the process config-uration, feeding regime and oxidation state (Table 2.3). Process configuration definesthe way in which the water is contacted with the biomass, which can form a layer onsome supporting media to form a fixed biofilm or be suspended in the reactor, orsometimes a combination of these. Suspended growth systems provide higher mass
Fundamentals 37
1856174817_Ch02.qxd 6/5/06 12:08 PM Page 37
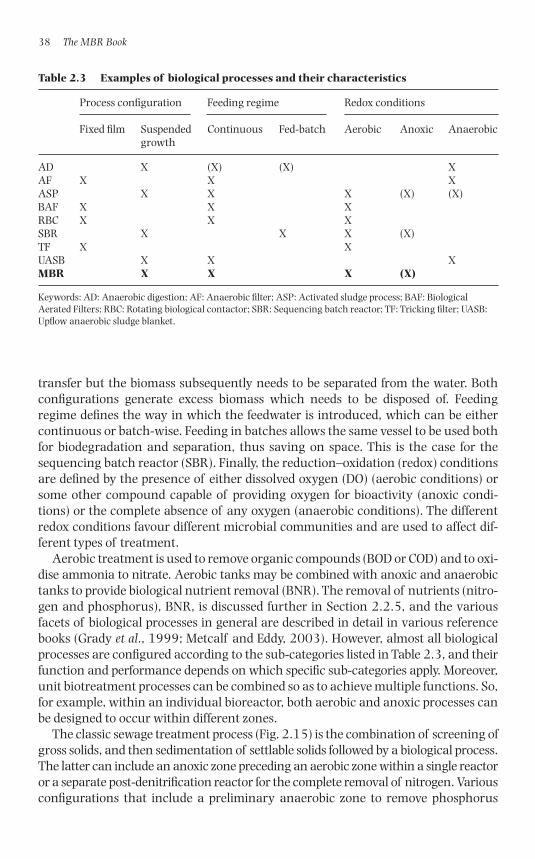
transfer but the biomass subsequently needs to be separated from the water. Bothconfigurations generate excess biomass which needs to be disposed of. Feedingregime defines the way in which the feedwater is introduced, which can be eithercontinuous or batch-wise. Feeding in batches allows the same vessel to be used bothfor biodegradation and separation, thus saving on space. This is the case for thesequencing batch reactor (SBR). Finally, the reduction–oxidation (redox) conditionsare defined by the presence of either dissolved oxygen (DO) (aerobic conditions) orsome other compound capable of providing oxygen for bioactivity (anoxic condi-tions) or the complete absence of any oxygen (anaerobic conditions). The differentredox conditions favour different microbial communities and are used to affect dif-ferent types of treatment.
Aerobic treatment is used to remove organic compounds (BOD or COD) and to oxi-dise ammonia to nitrate. Aerobic tanks may be combined with anoxic and anaerobictanks to provide biological nutrient removal (BNR). The removal of nutrients (nitro-gen and phosphorus), BNR, is discussed further in Section 2.2.5, and the variousfacets of biological processes in general are described in detail in various referencebooks (Grady et al., 1999; Metcalf and Eddy, 2003). However, almost all biologicalprocesses are configured according to the sub-categories listed in Table 2.3, and theirfunction and performance depends on which specific sub-categories apply. Moreover,unit biotreatment processes can be combined so as to achieve multiple functions. So,for example, within an individual bioreactor, both aerobic and anoxic processes canbe designed to occur within different zones.
The classic sewage treatment process (Fig. 2.15) is the combination of screening ofgross solids, and then sedimentation of settlable solids followed by a biological process.The latter can include an anoxic zone preceding an aerobic zone within a single reactoror a separate post-denitrification reactor for the complete removal of nitrogen. Variousconfigurations that include a preliminary anaerobic zone to remove phosphorus
38 The MBR Book
Table 2.3 Examples of biological processes and their characteristics
Process configuration Feeding regime Redox conditions
Fixed film Suspended Continuous Fed-batch Aerobic Anoxic Anaerobicgrowth
AD X (X) (X) XAF X X XASP X X X (X) (X)BAF X X XRBC X X XSBR X X X (X)TF X XUASB X X XMBR X X X (X)
Keywords: AD: Anaerobic digestion; AF: Anaerobic filter; ASP: Activated sludge process; BAF: BiologicalAerated Filters; RBC: Rotating biological contactor; SBR: Sequencing batch reactor; TF: Tricking filter; UASB:Upflow anaerobic sludge blanket.
1856174817_Ch02.qxd 6/5/06 12:08 PM Page 38
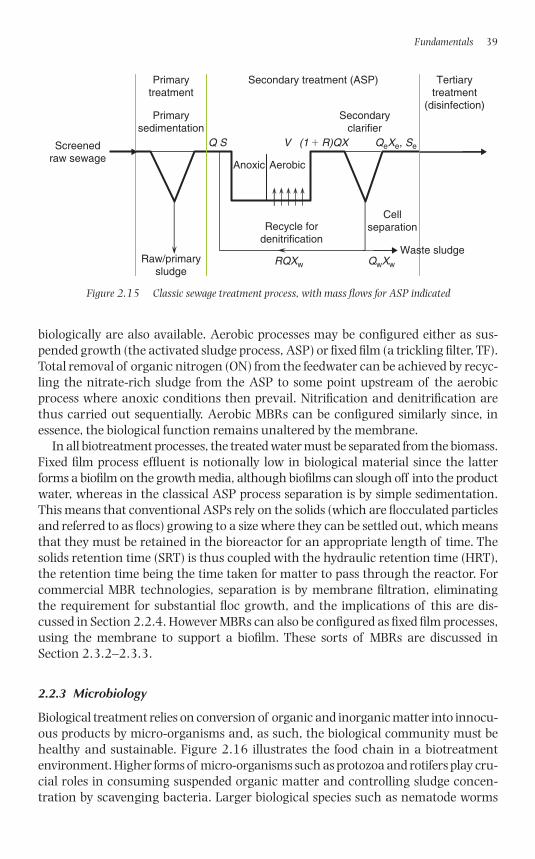
biologically are also available. Aerobic processes may be configured either as sus-pended growth (the activated sludge process, ASP) or fixed film (a trickling filter, TF).Total removal of organic nitrogen (ON) from the feedwater can be achieved by recyc-ling the nitrate-rich sludge from the ASP to some point upstream of the aerobicprocess where anoxic conditions then prevail. Nitrification and denitrification arethus carried out sequentially. Aerobic MBRs can be configured similarly since, inessence, the biological function remains unaltered by the membrane.
In all biotreatment processes, the treated water must be separated from the biomass.Fixed film process effluent is notionally low in biological material since the latterforms a biofilm on the growth media, although biofilms can slough off into the productwater, whereas in the classical ASP process separation is by simple sedimentation.This means that conventional ASPs rely on the solids (which are flocculated particlesand referred to as flocs) growing to a size where they can be settled out, which meansthat they must be retained in the bioreactor for an appropriate length of time. Thesolids retention time (SRT) is thus coupled with the hydraulic retention time (HRT),the retention time being the time taken for matter to pass through the reactor. Forcommercial MBR technologies, separation is by membrane filtration, eliminatingthe requirement for substantial floc growth, and the implications of this are dis-cussed in Section 2.2.4. However MBRs can also be configured as fixed film processes,using the membrane to support a biofilm. These sorts of MBRs are discussed inSection 2.3.2–2.3.3.
2.2.3 Microbiology
Biological treatment relies on conversion of organic and inorganic matter into innocu-ous products by micro-organisms and, as such, the biological community must behealthy and sustainable. Figure 2.16 illustrates the food chain in a biotreatmentenvironment. Higher forms of micro-organisms such as protozoa and rotifers play cru-cial roles in consuming suspended organic matter and controlling sludge concen-tration by scavenging bacteria. Larger biological species such as nematode worms
Fundamentals 39
Aerobic
Primarysedimentation
Secondaryclarifier
Screenedraw sewage
Raw/primarysludge
Primarytreatment
Secondary treatment (ASP) Tertiarytreatment
(disinfection)
CellseparationRecycle for
denitrification
Q S
RQXw
(1 � R)QX
QwXw
V QeXe, Se
Waste sludge
Anoxic
Figure 2.15 Classic sewage treatment process, with mass flows for ASP indicated
1856174817_Ch02.qxd 6/5/06 12:08 PM Page 39
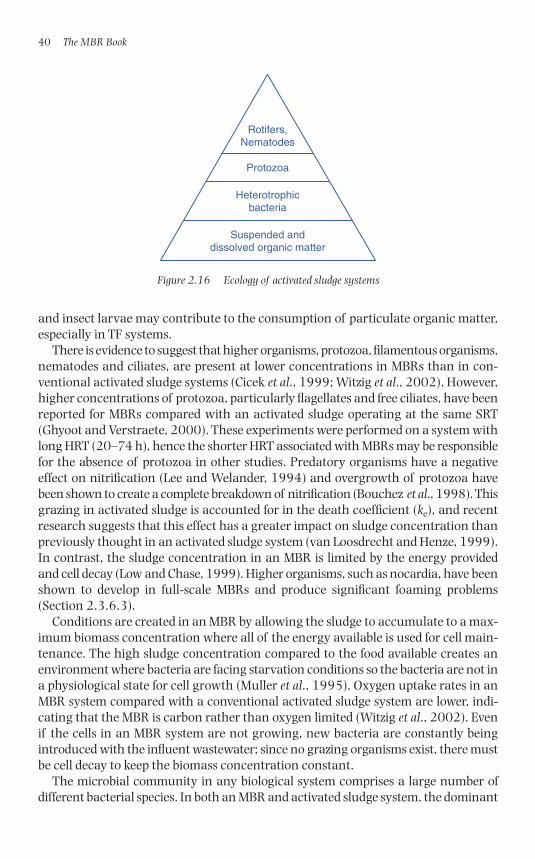
and insect larvae may contribute to the consumption of particulate organic matter,especially in TF systems.
There is evidence to suggest that higher organisms, protozoa, filamentous organisms,nematodes and ciliates, are present at lower concentrations in MBRs than in con-ventional activated sludge systems (Cicek et al., 1999; Witzig et al., 2002). However,higher concentrations of protozoa, particularly flagellates and free ciliates, have beenreported for MBRs compared with an activated sludge operating at the same SRT(Ghyoot and Verstraete, 2000). These experiments were performed on a system withlong HRT (20–74 h), hence the shorter HRT associated with MBRs may be responsiblefor the absence of protozoa in other studies. Predatory organisms have a negativeeffect on nitrification (Lee and Welander, 1994) and overgrowth of protozoa havebeen shown to create a complete breakdown of nitrification (Bouchez et al., 1998). Thisgrazing in activated sludge is accounted for in the death coefficient (ke), and recentresearch suggests that this effect has a greater impact on sludge concentration thanpreviously thought in an activated sludge system (van Loosdrecht and Henze, 1999).In contrast, the sludge concentration in an MBR is limited by the energy providedand cell decay (Low and Chase, 1999). Higher organisms, such as nocardia, have beenshown to develop in full-scale MBRs and produce significant foaming problems(Section 2.3.6.3).
Conditions are created in an MBR by allowing the sludge to accumulate to a max-imum biomass concentration where all of the energy available is used for cell main-tenance. The high sludge concentration compared to the food available creates anenvironment where bacteria are facing starvation conditions so the bacteria are not ina physiological state for cell growth (Muller et al., 1995). Oxygen uptake rates in anMBR system compared with a conventional activated sludge system are lower, indi-cating that the MBR is carbon rather than oxygen limited (Witzig et al., 2002). Evenif the cells in an MBR system are not growing, new bacteria are constantly beingintroduced with the influent wastewater; since no grazing organisms exist, there mustbe cell decay to keep the biomass concentration constant.
The microbial community in any biological system comprises a large number ofdifferent bacterial species. In both an MBR and activated sludge system, the dominant
40 The MBR Book
Protozoa
Heterotrophicbacteria
Rotifers,Nematodes
Suspended anddissolved organic matter
Figure 2.16 Ecology of activated sludge systems
1856174817_Ch02.qxd 6/5/06 12:08 PM Page 40
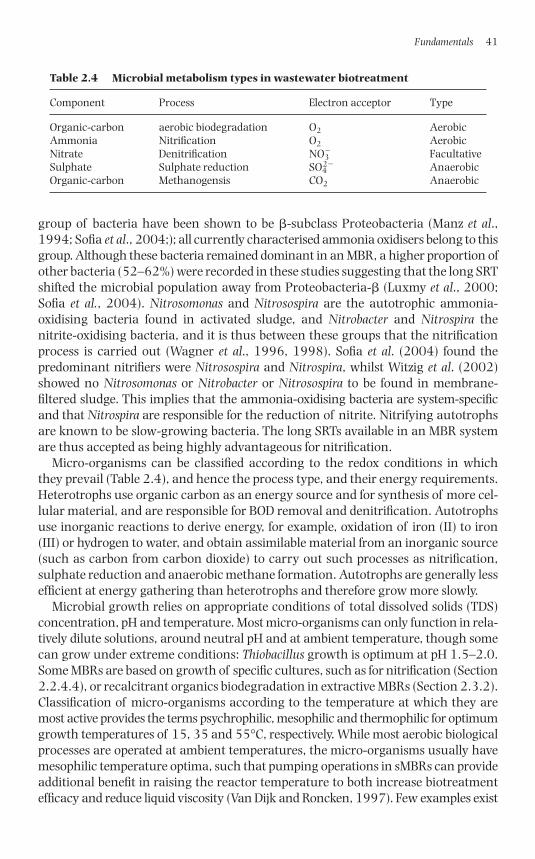
group of bacteria have been shown to be -subclass Proteobacteria (Manz et al.,1994; Sofia et al., 2004;); all currently characterised ammonia oxidisers belong to thisgroup. Although these bacteria remained dominant in an MBR, a higher proportion ofother bacteria (52–62%) were recorded in these studies suggesting that the long SRTshifted the microbial population away from Proteobacteria- (Luxmy et al., 2000;Sofia et al., 2004). Nitrosomonas and Nitrosospira are the autotrophic ammonia-oxidising bacteria found in activated sludge, and Nitrobacter and Nitrospira thenitrite-oxidising bacteria, and it is thus between these groups that the nitrificationprocess is carried out (Wagner et al., 1996, 1998). Sofia et al. (2004) found the predominant nitrifiers were Nitrosospira and Nitrospira, whilst Witzig et al. (2002)showed no Nitrosomonas or Nitrobacter or Nitrosospira to be found in membrane-filtered sludge. This implies that the ammonia-oxidising bacteria are system-specificand that Nitrospira are responsible for the reduction of nitrite. Nitrifying autotrophsare known to be slow-growing bacteria. The long SRTs available in an MBR systemare thus accepted as being highly advantageous for nitrification.
Micro-organisms can be classified according to the redox conditions in which they prevail (Table 2.4), and hence the process type, and their energy requirements.Heterotrophs use organic carbon as an energy source and for synthesis of more cel-lular material, and are responsible for BOD removal and denitrification. Autotrophsuse inorganic reactions to derive energy, for example, oxidation of iron (II) to iron(III) or hydrogen to water, and obtain assimilable material from an inorganic source(such as carbon from carbon dioxide) to carry out such processes as nitrification,sulphate reduction and anaerobic methane formation. Autotrophs are generally lessefficient at energy gathering than heterotrophs and therefore grow more slowly.
Microbial growth relies on appropriate conditions of total dissolved solids (TDS)concentration, pH and temperature. Most micro-organisms can only function in rela-tively dilute solutions, around neutral pH and at ambient temperature, though somecan grow under extreme conditions: Thiobacillus growth is optimum at pH 1.5–2.0.Some MBRs are based on growth of specific cultures, such as for nitrification (Section2.2.4.4), or recalcitrant organics biodegradation in extractive MBRs (Section 2.3.2).Classification of micro-organisms according to the temperature at which they aremost active provides the terms psychrophilic, mesophilic and thermophilic for optimumgrowth temperatures of 15, 35 and 55°C, respectively. While most aerobic biologicalprocesses are operated at ambient temperatures, the micro-organisms usually havemesophilic temperature optima, such that pumping operations in sMBRs can provideadditional benefit in raising the reactor temperature to both increase biotreatmentefficacy and reduce liquid viscosity (Van Dijk and Roncken, 1997). Few examples exist
Fundamentals 41
Table 2.4 Microbial metabolism types in wastewater biotreatment
Component Process Electron acceptor Type
Organic-carbon aerobic biodegradation O2 AerobicAmmonia Nitrification O2 AerobicNitrate Denitrification NO3
� FacultativeSulphate Sulphate reduction SO4
2� AnaerobicOrganic-carbon Methanogensis CO2 Anaerobic
1856174817_Ch02.qxd 6/5/06 12:08 PM Page 41
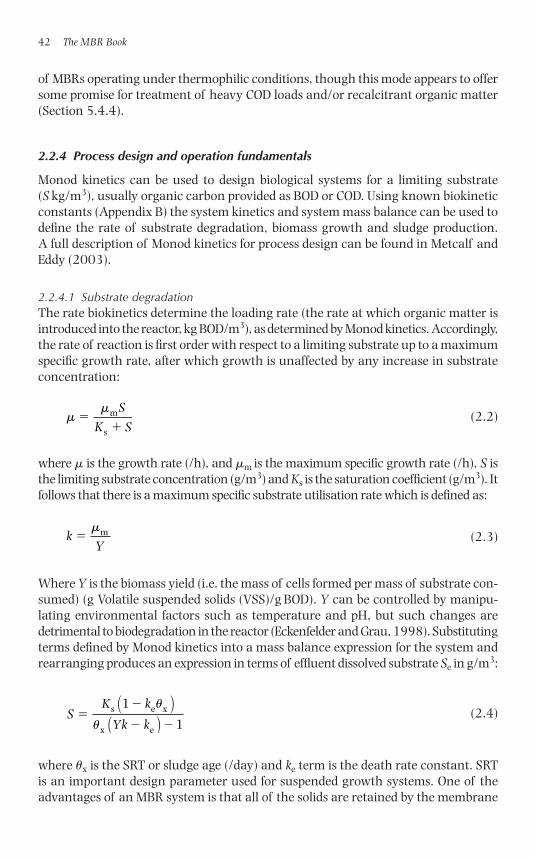
of MBRs operating under thermophilic conditions, though this mode appears to offersome promise for treatment of heavy COD loads and/or recalcitrant organic matter(Section 5.4.4).
2.2.4 Process design and operation fundamentals
Monod kinetics can be used to design biological systems for a limiting substrate(S kg/m3), usually organic carbon provided as BOD or COD. Using known biokineticconstants (Appendix B) the system kinetics and system mass balance can be used todefine the rate of substrate degradation, biomass growth and sludge production. A full description of Monod kinetics for process design can be found in Metcalf andEddy (2003).
2.2.4.1 Substrate degradationThe rate biokinetics determine the loading rate (the rate at which organic matter isintroduced into the reactor, kg BOD/m3), as determined by Monod kinetics. Accordingly,the rate of reaction is first order with respect to a limiting substrate up to a maximumspecific growth rate, after which growth is unaffected by any increase in substrateconcentration:
(2.2)
where � is the growth rate (/h), and �m is the maximum specific growth rate (/h), S isthe limiting substrate concentration (g/m3) and Ks is the saturation coefficient (g/m3). Itfollows that there is a maximum specific substrate utilisation rate which is defined as:
(2.3)
Where Y is the biomass yield (i.e. the mass of cells formed per mass of substrate con-sumed) (g Volatile suspended solids (VSS)/g BOD). Y can be controlled by manipu-lating environmental factors such as temperature and pH, but such changes aredetrimental to biodegradation in the reactor (Eckenfelder and Grau, 1998). Substitutingterms defined by Monod kinetics into a mass balance expression for the system andrearranging produces an expression in terms of effluent dissolved substrate Se in g/m3:
(2.4)
where �x is the SRT or sludge age (/day) and ke term is the death rate constant. SRTis an important design parameter used for suspended growth systems. One of theadvantages of an MBR system is that all of the solids are retained by the membrane
SK k
Yk k�
�
� �
s e x
x e
1
1
u
u
( )( )
kY
�mm
mm
��m
s
S
K S
42 The MBR Book
1856174817_Ch02.qxd 6/5/06 12:08 PM Page 42
which affords the operator complete control over the SRT. The death rate constantaccounts for endogenous metabolism, that is, the utilisation by cells of stored materials,and the presence of extracellular polymerics (Section 2.3.6.5) associated with thebiomass. ke also accounts for grazing of the biomass by predatory organisms, as pre-viously discussed. ke for conventional activated sludge and anaerobic processes istypically in the range 0.04–0.075/day (Gu, 1993; Metcalf and Eddy, 2003), andtakes similar values for MBRs (Fan et al., 1996; Wen et al., 1999). Experiments by Huanget al. (2001) showed that the endogenous decay in an MBR is higher (0.05–0.32/day)than for an ASP (0.04–0.075/day).
2.2.4.2 Sludge yieldYobs, the observed yield (g/(g/day)), is always lower than Y due to the effects of cell decay(ke). The relationship between Yobs and Y is governed by the SRT, �x, and is defined by:
(2.5)
where fd is the fraction of the biomass that remains as cell debris, usually0.1–0.15 g VSS/g substrate (Metcalf and Eddy, 2003). Observed yields (Yobs) areapproximately 0.6/day for conventional aerobic processes and an order of magnitudelower for anaerobic ones. Yobs is used to calculate the amount of heterotrophic sludgethat will be produced by a biological system (Px,het) for a given flow rate (Q m3/day):
(2.6)
The observed yield is the increase in biomass from heterotrophic cells only.Nitrification sludge and non-biodegradable solids also impact on the total daily sludgeproduction. Px is the total sludge yield from substrate degradation and derives from theheterotrophic sludge yield (Px,het) and the nitrification sludge yield (Px,aut). The sum ofall solids generated each day the non-biodegradable solids can be accounted for by:
(2.7)
The sludge production from biodegradation in an MBR can, in principle, be reduced tozero by controlling SRT (�x), ke and Y. The change in �x has by far the greatest impacton sludge production (Xing et al., 2003) and mixed liquor suspended solids (MLSS).Past experience allows designers to set a desired MLSS concentration (X g/m3). TheMLSS then affects sludge production, aeration demand (Section 2.2.5) and membranefouling and clogging (Section 2.3.6). Using a design MLSS and SRT the aeration tankvolume can be calculated by obtaining the mass of solids being aerated, and then usingthe MLSS to convert that mass to the volume which those solids occupy:
(2.8)VP X
X�
�x 0 x( )u
X TSS VSS Q0 � �( )
P Y Q S Sx het obs e, ( )� �
YYk
f k Y
kobse x
d e x
e x1 1�
��
�u
u
u
Fundamentals 43
1856174817_Ch02.qxd 6/5/06 12:08 PM Page 43
2.2.4.3 SRT and F:M ratioThe slow rate of microbial growth demands relatively long HRTs (compared withchemical processes), and hence large-volume reactors. Alternatively, retaining thebiomass in the tank either by allowing them to settle out and then recycling them, asin an ASP, fixing them to porous media, such as in a TF, or selectively rejecting them,as with an MBR, permits longer SRTs without requiring the HRT to be commensu-rately increased. Controlling the SRT in a biological system allows the operator tocontrol the rate of substrate degradation, biomass concentration and excess sludgeproduction as illustrated in Equations (2.4) (2.5) and (2.8). The SRT is controlled byperiodically discharging some of the solids (sludge) from the process:
(2.9)
where V and X are the aeration tank volume (m3) and MLSS (g/m3), Qw and Xw thesludge wastage rate (m3/day) and suspended solids concentration (g/m3), and Qeand Xe the corresponding values for the effluent. SRT should thus in theory deter-mine the final effluent quality, though in practice effluent quality is determined bysludge settlability. In an MBR system, no solids can pass through the membrane (i.e.Xe � 0), and hence the SRT is defined only by the wasted solids. If the solids wasted fromthe reactor are at the same concentration as those in the reactor, that is, Xw � X, thevolume of sludge wasted Qw becomes:
(2.10)
An often-quoted ASP empirical design parameter is the food-to-micro-organismratio (F:M in units of inverse time), which defines the rate at which substrate is fedinto the tank (SQ, Q being the volumetric feed flow rate in m3/day) compared to themass of reactor solids:
(2.11)
This relates to SRT and the process efficiency E (%) by:
(2.12)
SRT values for activated sludge plants treating municipal wastewaters are typically inthe range of 5–15 day with corresponding F:M values of 0.2–0.4/day. IncreasingSRT increases the reactor concentration of biomass, which is often referred to as theMLSS. Conventional ASPs operating at SRTs of �8 days have an MLSS of around2.5 g/L, whereas one with a SRT of �40 days might have a MLSS of 8–12 g/L. A low
1100x
eu
� �Y FME
k( : )
FMSQVX
: �
QV
wx
�u
uxw w e e
��
VXQ X Q X
44 The MBR Book
1856174817_Ch02.qxd 6/5/06 12:08 PM Page 44
F:M ratio implies a high MLSS and a low sludge yield, such that increasing SRT isadvantageous with respect to waste generation. This represents one of the key advan-tages of MBRs, and an analysis of data from the review by Stephenson et al. (2000)reveals that most MBRs, where SRT can be readily extended, operate at F:M ratiosof �0.12 (Fig. 2.17).
On the other hand, high MLSS values are to some extent detrimental to processperformance. Firstly they would be expected to lead to an accumulation of inertcompounds, reflected in a decrease in the MLVSS/MLSS ratio where MLVSS represents the volatile (organic) fraction of the MLSS, though this does not appear tobe the case in practice (Huang et al., 2001; Rosenburger et al., 1999). Secondly, highsolids levels increase the propensity for clogging or “sludging” – the accumulation ofsolids in the membrane channels. Lastly, and possibly most significantly, high MLSSlevels reduce aeration efficiency, and this is discussed further in Section 2.2.5.
There have been a number of studies where the characteristics and performanceof ASPs and MBRs have been compared when these processes operated under thesame conditions of HRT and SRT. Ghyoot and Verstraete (2000), in their studiesbased on a skimmed milk-based analogue feed, observed sludge yields to be lower foran MBR than for an ASP (0.22 vs. 0.28 and 0.18 vs. 0.24 for operation at 12 and 24days SRT, respectively). This trend was repeated in the work reported by Smith et al.(2003), who also noted the greatest impact of the membrane separation to be on Ks,which decreased from 125 22 to 11 1/day for the ASP compared to a corres-ponding increase from 2 1.6 to 73 22 for the MBR. Given that Ks is inverselyproportional to substrate affinity, the generally lower values of Ks in the case of anMBR suggest a greater biomass substrate affinity, and also that the growth rate isless influenced by substrate concentration. Smith and co-workers proposed that thisrelated to the difference in floc size, since the corresponding specific surface areas ofthe two biomasses at 30-day SRT were 0.098 m2/g for the MBR and 0.0409 m2/g forthe ASP, revealing that the MBR biomass provides over 230% more surface area atabout the same MLSS concentration.
Fundamentals 45
0
0.2
0.4
0.6
0.8
1
0 0.1 0.2 0.3 0.4 0.5 0.6
F:M (kg COD/kg MLSS/d)
Cum
ulat
ive
%ile
und
ersi
ze
Industrial
MunicipalFor 90% removal
Full scale F:MMUN �0.12
Figure 2.17 Statistical analysis of data from Stephenson et al. (2000), municipal and industrial effluent
1856174817_Ch02.qxd 6/5/06 12:08 PM Page 45
2.2.4.4 Nitrification kineticsEquations (2.2–2.12) are primarily concerned with the degradation of organic car-bon in the feed. It is common practice to extend the SRT and HRT in the aerationbasin to achieve the degradation of ammonia (NH4-N). The effluent nitrogen con-centration (Ne g/m3) can be estimated by:
(2.13)
where �n,m is the maximum specific growth rate of nitrifying bacteria, Kn is the halfsaturation coefficient for nitrification, ke,n is the death rate coefficient for nitrifyingbacteria and �n is the specific growth of nitrifying bacteria which can be found from:
(2.14)
Literature values for the nitrification constants along with the heterotrophic con-stants can be found in Appendix B. Sludge production from nitrification is given by:
(2.15)
where Yn is the nitrification sludge yield (g VSS/g NH4-N) and NOx is the concentrationof NH4-N that is oxidised (mg/L) to form nitrate. To calculate the NOx, a nitrogen bal-ance can be performed on the system:
(2.16)
where N is the influent total Kjeldahl (biochemically-oxidisable) nitrogen concentration(TKN, mg/L). NOx is used to determine Px, NOx can be estimated at the first attempt anditerated to find values for NOx and Px,aut.
Nitrifying bacteria operate more slowly than carbon degraders such that, to achievenitrification, a longer HRT is required; nitrifiers are slower growing and require alonger SRT. An SRT of around 10 days is required to allow full growth of the nitrify-ing community (Huang, 2001). Fan et al. (1996) reported that perfect nitrification,that is, all of influent TKN converted to NO3
�, can be achieved in an MBR.
2.2.5 Aeration
2.2.5.1 FundamentalsIn conventional aerobic biological wastewater treatment processes, oxygen is usuallysupplied as atmospheric air, either via immersed air-bubble diffusers or surface aeration.Diffused air bubbles (via fine-bubble aeration) are added to the bulk liquid (as in anASP, biological aerated filters (BAFs), fluidised bioreactors, etc.), or oxygen transfer
NO N N Px e x0.12= � �
PQY NO
kx autn x
e,n x1, �� �
mu
nx
1�
NK k
ken n e,n
n,m e,n n
��
� �
( )m
m m
46 The MBR Book
1856174817_Ch02.qxd 6/5/06 12:08 PM Page 46
occurs from the surrounding air to the bulk liquid via a liquid/air interface (as for aTF or rotating biological contactor (RBC)).
The oxygen requirement to maintain a community of micro-organisms anddegrade BOD and ammonia and nitrite to nitrate can be found by a mass balance onthe system (Metcalf and Eddy, 2003):
(2.17)
where mo is the total oxygen required (g/day). The first term in Equation (2.17) refer tosubstrate oxidation, the second refers to biomass respiration, the third refers to nitrifi-cation and the final term refers to denitrification. Certain terms thus disappear from theexpression depending on whether or not the system is nitrifying and/or denitrifying.
2.2.5.2 Mass transferMass transfer of oxygen into the liquid from air bubbles is defined by the overall liquidmass transfer coefficient (kL m/s) and the specific surface area for mass transfer(a m2/m3). Because of the difficulties associated with measuring kL and a, the two areusually combined to give the volumetric mass transfer coefficient kLa (per unit time).The standard method accepted for determining kLa in clean water is detailed in ASCE(1992). The rate of oxygen transfer into a liquid can be determined by:
(2.18)
where C and C* are the dissolved and saturated oxygen concentration values in kg/m3.For pure water and equilibrium conditions C is found using Henry’s Law. This can beconverted to process conditions by the application of three correction factors (�, �and �) which account for those sludge properties which impact on oxygen transfer(Section 2.2.5.3):
(2.19)
Aeration also provides agitation to ensure high mass transfer rates and completemixing in the tank. There is thus a compromise between mixing, which demands largerbubbles, and oxygen dissolution, which demands small, indeed microscopic, bubbles(Garcia-Ochoa et al., 2000). Consequently oxygen utilisation, the amount of oxygenin the supplied air which is used by the biomass, can be as low as 10%, and decreaseswith increasing biomass concentration (Equation (2.25)). This can be quantified bythe standard aeration efficiency (kg O2/kWh):
(2.20)
where W is the power demand. The OTR into the mixed liquor can be increased byusing oxygen-enriched air, but this increases costs and is rarely used other than for
SAEOTRxV
W�
OTROTR
processcleanwater�abw
OTR k a C Ccleanwater L )� �( *
m Q S S P Q NO Q NOo e x x x1.42 4.33 2.83� � � � �( ) ( ) ( )
Fundamentals 47
1856174817_Ch02.qxd 6/5/06 12:08 PM Page 47
high-strength effluents when the oxygen limitation is reached. In an iMBR, additionalaeration is also required for scouring of the membrane (Section 2.3.5).
Changes in airflow have been shown to produce the largest changes in masstransfer in a coarse bubble aeration system (Ashley et al., 1992), with kLa increasingwith gas velocity in an airlift reactor (Lazarova et al., 1997; Masoud et al., 2001).Nordkvist et al. (2003) proposed that both the liquid and gas velocities impact onmass transfer, confirmed by experiments based on a jet loop MBR by Kouakou et al.(2005). However, the authors of this paper also noted a linear relationship betweenthe mass transfer coefficient and the liquid recirculation velocity. Also, increasinghorizontal velocity has been shown to increase the value of kLa in an oxygen ditch inboth pilot (Gillot et al., 2000) and full-scale plants (Deronzier et al., 1996).
2.2.5.3 Correction for temperature and process water� relates to the effect of temperature on the mass transfer and is corrected by:
(2.21)
where T is the temperature (°C) and � a constant. Typical � values are between 1.015and 1.040 with 1.024 being the ASCE standard (Iranpour et al., 2000) for temperaturecorrection of viscosity:
(2.22)
Salts and particulates in wastewater both impact on the oxygen transfer rate.Comparative tests on synthetic wastewater and tap water performed by Lazarova et al.(1997) showed that below 2 g/L salt concentration has little effect on the oxygentransfer. Kouakou et al. (2005) performed comparative studies between clean waterand wastewater with a salt concentration of 0.48 g/L and found the mass transfercoefficients did not significantly vary. The effect of such constituents is accounted forby the � factor which is defined as:
(2.23)
and is usually around 0.95 for wastewater (EPA, 1989).Both biomass characteristics and aeration system design impact on oxygen trans-
fer (Mueller et al., 2002). Biomass is a heterogeneous mixture of particles, micro-organisms, colloids, organic polymers and cations of various sizes and surface propertieswhich can all impact on oxygen transfer through contact area and surface energy.Bubble characteristics differ depending on the aerator type and bubble stability, thelatter being influenced by the biomass characteristics and promotion of bubble coales-cence. At the same time, biological and physical characteristics of the mixed liquorare affected by the shear imparted by the air flow, which can fragment flocs (Abbassiet al., 1999) and cause the release of chemicals, as well as impacting on biodiversity
b�C
C
*
*wastewater
cleanwater
w� �1.024 20T( )
k a k aTT
L L 20°C20
( ) ( )( )� � �
48 The MBR Book
1856174817_Ch02.qxd 6/5/06 12:08 PM Page 48
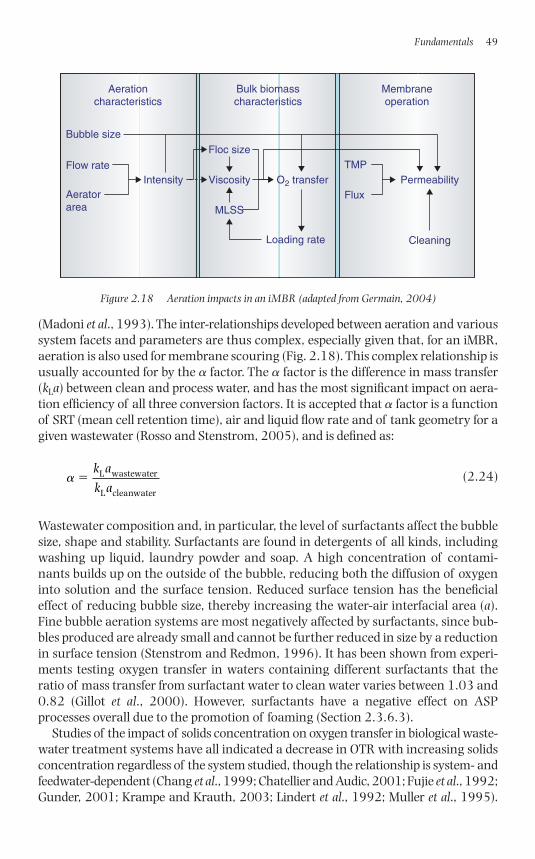
(Madoni et al., 1993). The inter-relationships developed between aeration and varioussystem facets and parameters are thus complex, especially given that, for an iMBR,aeration is also used for membrane scouring (Fig. 2.18). This complex relationship isusually accounted for by the � factor. The � factor is the difference in mass transfer(kLa) between clean and process water, and has the most significant impact on aera-tion efficiency of all three conversion factors. It is accepted that � factor is a functionof SRT (mean cell retention time), air and liquid flow rate and of tank geometry for agiven wastewater (Rosso and Stenstrom, 2005), and is defined as:
(2.24)
Wastewater composition and, in particular, the level of surfactants affect the bubblesize, shape and stability. Surfactants are found in detergents of all kinds, includingwashing up liquid, laundry powder and soap. A high concentration of contami-nants builds up on the outside of the bubble, reducing both the diffusion of oxygeninto solution and the surface tension. Reduced surface tension has the beneficialeffect of reducing bubble size, thereby increasing the water-air interfacial area (a).Fine bubble aeration systems are most negatively affected by surfactants, since bub-bles produced are already small and cannot be further reduced in size by a reductionin surface tension (Stenstrom and Redmon, 1996). It has been shown from experi-ments testing oxygen transfer in waters containing different surfactants that theratio of mass transfer from surfactant water to clean water varies between 1.03 and0.82 (Gillot et al., 2000). However, surfactants have a negative effect on ASPprocesses overall due to the promotion of foaming (Section 2.3.6.3).
Studies of the impact of solids concentration on oxygen transfer in biological waste-water treatment systems have all indicated a decrease in OTR with increasing solidsconcentration regardless of the system studied, though the relationship is system- andfeedwater-dependent (Chang et al., 1999; Chatellier and Audic, 2001; Fujie et al., 1992;Gunder, 2001; Krampe and Krauth, 2003; Lindert et al., 1992; Muller et al., 1995).
a�k a
k aL wastewater
L cleanwater
Fundamentals 49
Aerationcharacteristics
Bulk biomasscharacteristics
Membraneoperation
Flow rate
Aeratorarea
Intensity
Floc size
Viscosity
MLSS
O2 transfer
Loading rate
TMP
FluxPermeability
Cleaning
Bubble size
Figure 2.18 Aeration impacts in an iMBR (adapted from Germain, 2004)
1856174817_Ch02.qxd 6/5/06 12:08 PM Page 49
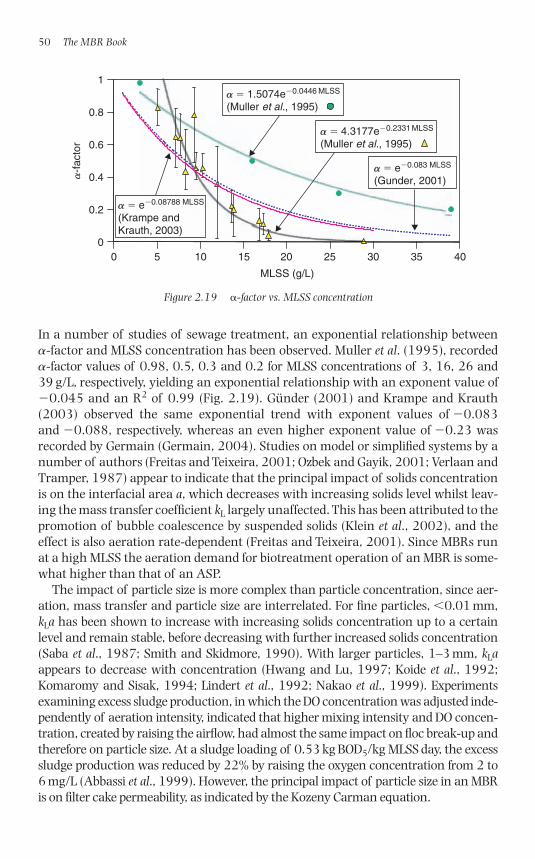
In a number of studies of sewage treatment, an exponential relationship between �-factor and MLSS concentration has been observed. Muller et al. (1995), recorded�-factor values of 0.98, 0.5, 0.3 and 0.2 for MLSS concentrations of 3, 16, 26 and39 g/L, respectively, yielding an exponential relationship with an exponent value of�0.045 and an R2 of 0.99 (Fig. 2.19). Günder (2001) and Krampe and Krauth(2003) observed the same exponential trend with exponent values of �0.083and �0.088, respectively, whereas an even higher exponent value of �0.23 wasrecorded by Germain (Germain, 2004). Studies on model or simplified systems by anumber of authors (Freitas and Teixeira, 2001; Ozbek and Gayik, 2001; Verlaan andTramper, 1987) appear to indicate that the principal impact of solids concentrationis on the interfacial area a, which decreases with increasing solids level whilst leav-ing the mass transfer coefficient kL largely unaffected. This has been attributed to thepromotion of bubble coalescence by suspended solids (Klein et al., 2002), and theeffect is also aeration rate-dependent (Freitas and Teixeira, 2001). Since MBRs runat a high MLSS the aeration demand for biotreatment operation of an MBR is some-what higher than that of an ASP.
The impact of particle size is more complex than particle concentration, since aer-ation, mass transfer and particle size are interrelated. For fine particles, �0.01 mm,kLa has been shown to increase with increasing solids concentration up to a certainlevel and remain stable, before decreasing with further increased solids concentration(Saba et al., 1987; Smith and Skidmore, 1990). With larger particles, 1–3 mm, kLaappears to decrease with concentration (Hwang and Lu, 1997; Koide et al., 1992;Komaromy and Sisak, 1994; Lindert et al., 1992; Nakao et al., 1999). Experimentsexamining excess sludge production, in which the DO concentration was adjusted inde-pendently of aeration intensity, indicated that higher mixing intensity and DO concen-tration, created by raising the airflow, had almost the same impact on floc break-up andtherefore on particle size. At a sludge loading of 0.53 kg BOD5/kg MLSS day, the excesssludge production was reduced by 22% by raising the oxygen concentration from 2 to6 mg/L (Abbassi et al., 1999). However, the principal impact of particle size in an MBRis on filter cake permeability, as indicated by the Kozeny Carman equation.
50 The MBR Book
0
0.2
0.4
0.6
0.8
1
0 5 10 15 20 25 30 35 40
MLSS (g/L)
a-f
acto
r
a a � e�0.08788 MLSS
(Krampe andKrauth, 2003)
a a � 1.5074e�0.0446 MLSS
(Muller et al., 1995)
a a � 4.3177e�0.2331 MLSS
(Muller et al., 1995)
a a � e�0.083 MLSS
(Gunder, 2001)
Figure 2.19 -factor vs. MLSS concentration
1856174817_Ch02.qxd 6/5/06 12:08 PM Page 50
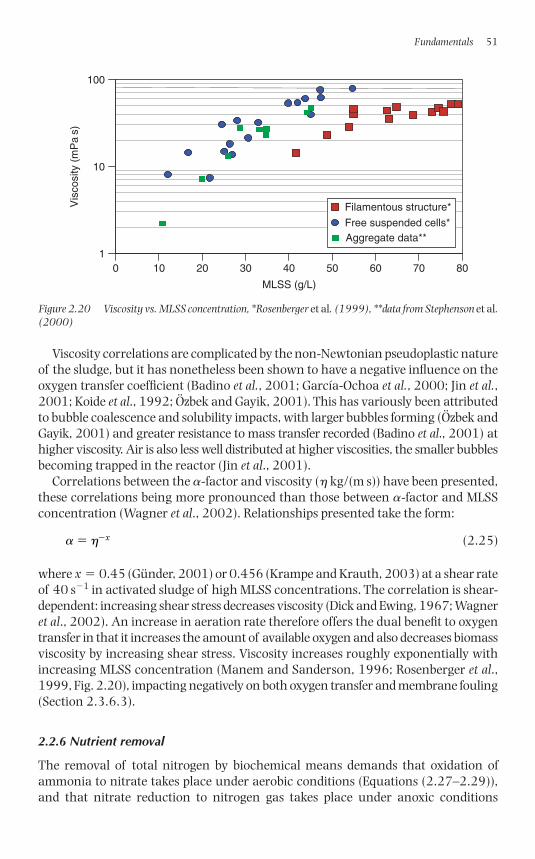
Viscosity correlations are complicated by the non-Newtonian pseudoplastic natureof the sludge, but it has nonetheless been shown to have a negative influence on theoxygen transfer coefficient (Badino et al., 2001; García-Ochoa et al., 2000; Jin et al.,2001; Koide et al., 1992; Özbek and Gayik, 2001). This has variously been attributedto bubble coalescence and solubility impacts, with larger bubbles forming (Özbek andGayik, 2001) and greater resistance to mass transfer recorded (Badino et al., 2001) athigher viscosity. Air is also less well distributed at higher viscosities, the smaller bubblesbecoming trapped in the reactor (Jin et al., 2001).
Correlations between the �-factor and viscosity (� kg/(m s)) have been presented,these correlations being more pronounced than those between �-factor and MLSSconcentration (Wagner et al., 2002). Relationships presented take the form:
(2.25)
where x � 0.45 (Günder, 2001) or 0.456 (Krampe and Krauth, 2003) at a shear rateof 40 s�1 in activated sludge of high MLSS concentrations. The correlation is shear-dependent: increasing shear stress decreases viscosity (Dick and Ewing, 1967; Wagneret al., 2002). An increase in aeration rate therefore offers the dual benefit to oxygentransfer in that it increases the amount of available oxygen and also decreases biomassviscosity by increasing shear stress. Viscosity increases roughly exponentially withincreasing MLSS concentration (Manem and Sanderson, 1996; Rosenberger et al.,1999, Fig. 2.20), impacting negatively on both oxygen transfer and membrane fouling(Section 2.3.6.3).
2.2.6 Nutrient removal
The removal of total nitrogen by biochemical means demands that oxidation ofammonia to nitrate takes place under aerobic conditions (Equations (2.27–2.29)),and that nitrate reduction to nitrogen gas takes place under anoxic conditions
a h� �x
Fundamentals 51
1
10
0 10 20 30 40 50 60 70 80
100
MLSS (g/L)
Vis
cosi
ty (
mP
as)
Aggregate data**
Filamentous structure*
Free suspended cells*
Figure 2.20 Viscosity vs. MLSS concentration, *Rosenberger et al. (1999), **data from Stephenson et al.(2000)
1856174817_Ch02.qxd 6/5/06 12:08 PM Page 51
(Equation (2.30)). Both these processes demand that specific micro-organisms prevail(Section 2.2.3). The exact micro-organisms responsible for denitrification (nitrateremoval by biochemical reduction) are more varied – it is carried out by many dif-ferent, phylogenetically-unrelated heterotrophs (Stewart, 1998; Zumft, 1992).
The biological generation of nitrate from ammoniacal nitrogen (NH�4) and aer-
obic conditions (nitrification), takes place in two distinct stages:
2NH�4 � 3O2 → 2NO2
� � 2H� � 2H2O (ammonia → nitrite) (2.26)
2NO�2 � O2 → 2NO�
3 (nitrite → nitrate) (2.27)
Overall:
NH�4 � 2O2 → NO�
3 � 2H� � H2O (2.28)
Since the second step proceeds at a much faster rate than the first, nitrite does notaccumulate in most bioreactors. However, since these micro-organisms are autotrophicand thus rather slow growing, they demand relatively long SRTs to accumulate andprovide close to complete nitrification (i.e. above 90% ammonia removal). This pres-ents another advantage of MBRs where long SRTs are readily attainable.
Denitrification takes place under anoxic conditions when oxidation of the organiccarbon takes place using the nitrate ion (NO3
�), generating molecular nitrogen (N2)as the primary end product:
C10H19O3N � 10NO�3 → 5N2 � 10CO2 � 3H2O � NH3 � 10OH� (2.29)
where in this equation “C10H19O3N” represents wastewater.Nitrification relies on sufficient levels of carbon dioxide, ammonia and oxygen,
the carbon dioxide providing carbon for cell growth of the autotrophs. Since nitri-fiers are obligate aerobes, DO concentrations need to be 1.0–1.5 mg/L in suspendedgrowth systems for their survival. Denitrification takes place when facultative micro-organisms, which normally remove BOD under aerobic conditions, are able to con-vert nitrates to nitrogen gas under anoxic conditions. Denitrification requires asufficient carbon source for the heterotrophic bacteria. This can be provided by theraw wastewater, which is why the nitrate-rich waste from the aerobic zone is recycled to mix with the raw wastewater. Complete nitrification is common in full-scale MBR municipal installations, although, since it is temperature-sensitive,ammonia removal generally decreases below 10°C. Most full-scale MBR sewagetreatment plants are also designed to achieve denitrification.
Most wastewaters treated by biological processes are carbon limited, and hencephosphorus is not significantly removed. This applies as much to MBRs as to con-ventional plants. It appears that membrane separation offers little or no advantageregarding phosphorus removal (Yoon et al., 1999). Enhanced biological phosphateremoval can be achieved by the addition of an anaerobic zone at the front of an acti-vated sludge plant and returning nitrate-free sludge from the aerobic zone (Yeomanet al., 1986). This has been applied to a some full-scale MBR plant where constraints
52 The MBR Book
1856174817_Ch02.qxd 6/5/06 12:08 PM Page 52
on discharged P levels have been imposed (Section 5.2.1.4, Running Springs). P removal is more commonly achieved by dosing with chemicals, such as metalcoagulants or lime, that can form sparingly soluble precipitates.
2.2.7 Anaerobic treatment
Compared with aerobic processes, anaerobic biological treatment is characterisedby (Stephenson et al., 2000):
● a lower energy demand due to the absence of aeration● slower microbial growth● a lower COD removal (generally 60–90%)● no nitrification● greater potential for odour generation● longer start up (months cf. weeks)● higher alkalinity● lower sludge production● biogas (methane) generation.
Conventional anaerobic treatment process configurations are all designed toachieve both good mixing and sludge separation. A number of configurations exist:
(a) Simple contacting coupled with external sludge separation (by sedimentation,rotary vacuum filtration, etc.) and/or digestion before returning the clarifiedliquid to the reactor. This is a simple and relatively easily controlled processbut is also made expensive by the pumping operations.
(b) Anaerobic filters, which are flooded media filters based on either packed orstructured media.
(c) Upflow clarification using the upflow anaerobic sludge blanket (UASB, Fig.2.21a) reactor (Lettinga and Vinken, 1980), in which sludge particles settle atthe same rate as the water flows upwards, forming a stationary “blanket” ofsludge in the reactor. This process relies on the formation of a dense granularsludge bed that is readily retained in the reactor, in much the same way as sec-ondary clarification in the ASP relies on the growth of large settleable particles.The process is augmented in the expanded granular sludge bed (EGSB, Fig. 2.21b)which provides better influent distribution to improve contact between thesludge and wastewater and so promote more efficient use of the entire reactorvolume (Seghezzo et al., 1998). In this configuration, the sludge bed is expandedby operating at higher upflow rates and the reactor behaves as a completelymixed tank (Rinzema, 1988).
(d) Staged reactor systems, based on plug flow (Van Lier, 1995) and using sequen-tially operated reactors or compartments within a single reactor. Staged reac-tors include anaerobic baffled reactors (ABRs, Fig. 2.21c) in which baffles areused to direct the flow of wastewater in an upflow mode through a series ofsludge blanket reactors (Metcalfe and Eddy, 2003). The process is more tolerantto non-settling particles than the UASB and EGSBs whilst still providing longsolid retention times.
Fundamentals 53
1856174817_Ch02.qxd 6/5/06 12:08 PM Page 53
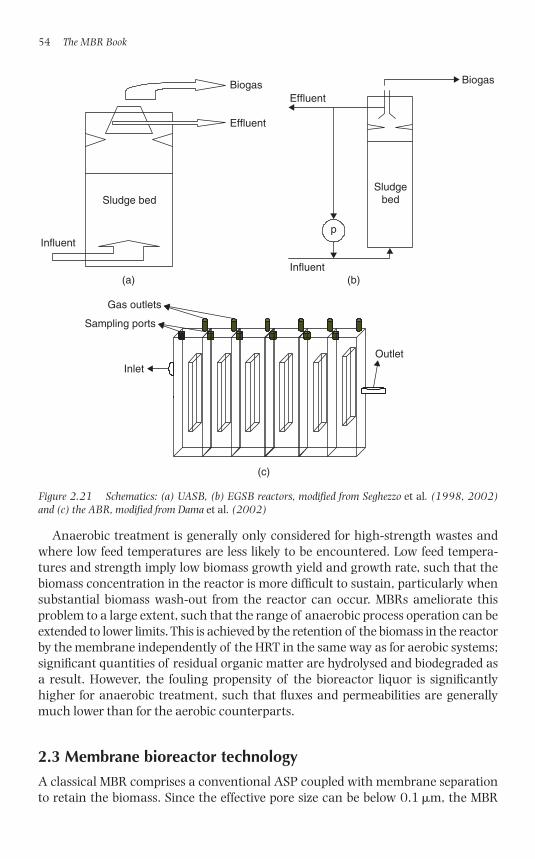
Anaerobic treatment is generally only considered for high-strength wastes andwhere low feed temperatures are less likely to be encountered. Low feed tempera-tures and strength imply low biomass growth yield and growth rate, such that thebiomass concentration in the reactor is more difficult to sustain, particularly whensubstantial biomass wash-out from the reactor can occur. MBRs ameliorate thisproblem to a large extent, such that the range of anaerobic process operation can beextended to lower limits. This is achieved by the retention of the biomass in the reactorby the membrane independently of the HRT in the same way as for aerobic systems;significant quantities of residual organic matter are hydrolysed and biodegraded asa result. However, the fouling propensity of the bioreactor liquor is significantlyhigher for anaerobic treatment, such that fluxes and permeabilities are generallymuch lower than for the aerobic counterparts.
2.3 Membrane bioreactor technology
A classical MBR comprises a conventional ASP coupled with membrane separationto retain the biomass. Since the effective pore size can be below 0.1 �m, the MBR
54 The MBR Book
Influent
Influent
Sludge bedSludge
bed
p
(a) (b)
(c)
Gas outlets
Biogas Biogas
Effluent
Effluent
Sampling ports
InletOutlet
Figure 2.21 Schematics: (a) UASB, (b) EGSB reactors, modified from Seghezzo et al. (1998, 2002)and (c) the ABR, modified from Dama et al. (2002)
1856174817_Ch02.qxd 6/5/06 12:08 PM Page 54
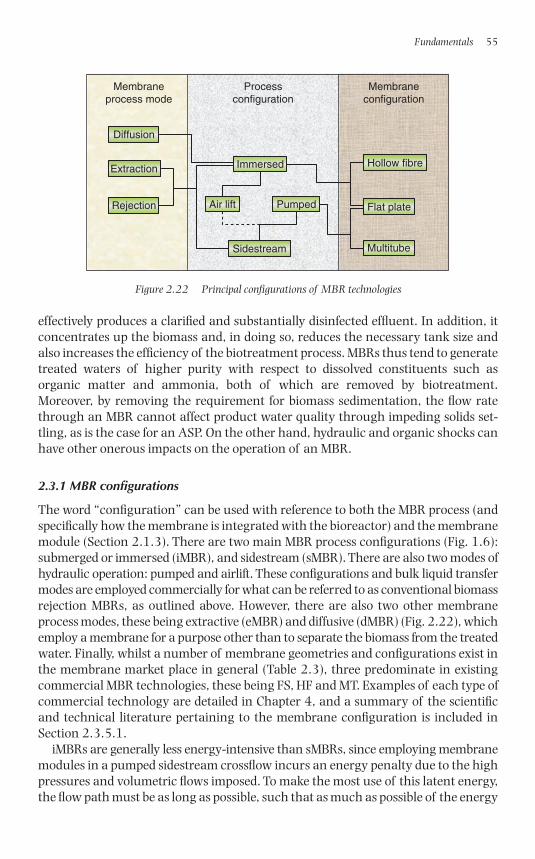
effectively produces a clarified and substantially disinfected effluent. In addition, itconcentrates up the biomass and, in doing so, reduces the necessary tank size andalso increases the efficiency of the biotreatment process. MBRs thus tend to generatetreated waters of higher purity with respect to dissolved constituents such asorganic matter and ammonia, both of which are removed by biotreatment.Moreover, by removing the requirement for biomass sedimentation, the flow ratethrough an MBR cannot affect product water quality through impeding solids set-tling, as is the case for an ASP. On the other hand, hydraulic and organic shocks canhave other onerous impacts on the operation of an MBR.
2.3.1 MBR configurations
The word “configuration” can be used with reference to both the MBR process (andspecifically how the membrane is integrated with the bioreactor) and the membranemodule (Section 2.1.3). There are two main MBR process configurations (Fig. 1.6):submerged or immersed (iMBR), and sidestream (sMBR). There are also two modes ofhydraulic operation: pumped and airlift. These configurations and bulk liquid transfermodes are employed commercially for what can be referred to as conventional biomassrejection MBRs, as outlined above. However, there are also two other membraneprocess modes, these being extractive (eMBR) and diffusive (dMBR) (Fig. 2.22), whichemploy a membrane for a purpose other than to separate the biomass from the treatedwater. Finally, whilst a number of membrane geometries and configurations exist inthe membrane market place in general (Table 2.3), three predominate in existingcommercial MBR technologies, these being FS, HF and MT. Examples of each type ofcommercial technology are detailed in Chapter 4, and a summary of the scientificand technical literature pertaining to the membrane configuration is included inSection 2.3.5.1.
iMBRs are generally less energy-intensive than sMBRs, since employing membranemodules in a pumped sidestream crossflow incurs an energy penalty due to the highpressures and volumetric flows imposed. To make the most use of this latent energy,the flow path must be as long as possible, such that as much as possible of the energy
Fundamentals 55
Rejection
Hollow fibre
Flat plate
Multitube
Membraneprocess mode
Processconfiguration
Membraneconfiguration
Diffusion
Extraction Immersed
PumpedAir lift
Sidestream
Figure 2.22 Principal configurations of MBR technologies
1856174817_Ch02.qxd 6/5/06 12:08 PM Page 55
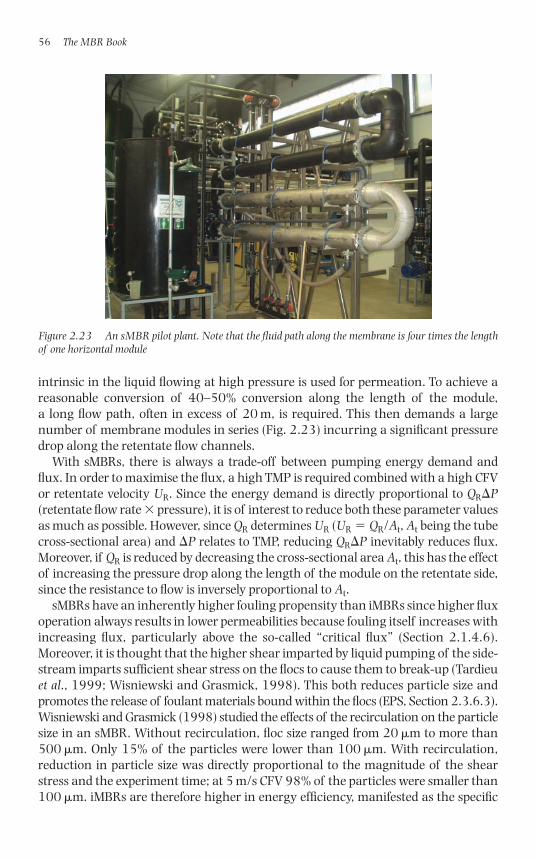
intrinsic in the liquid flowing at high pressure is used for permeation. To achieve areasonable conversion of 40–50% conversion along the length of the module, a long flow path, often in excess of 20 m, is required. This then demands a largenumber of membrane modules in series (Fig. 2.23) incurring a significant pressuredrop along the retentate flow channels.
With sMBRs, there is always a trade-off between pumping energy demand andflux. In order to maximise the flux, a high TMP is required combined with a high CFVor retentate velocity UR. Since the energy demand is directly proportional to QR�P(retentate flow rate � pressure), it is of interest to reduce both these parameter valuesas much as possible. However, since QR determines UR (UR � QR/At, At being the tubecross-sectional area) and �P relates to TMP, reducing QR�P inevitably reduces flux.Moreover, if QR is reduced by decreasing the cross-sectional area At, this has the effectof increasing the pressure drop along the length of the module on the retentate side,since the resistance to flow is inversely proportional to At.
sMBRs have an inherently higher fouling propensity than iMBRs since higher fluxoperation always results in lower permeabilities because fouling itself increases withincreasing flux, particularly above the so-called “critical flux” (Section 2.1.4.6).Moreover, it is thought that the higher shear imparted by liquid pumping of the side-stream imparts sufficient shear stress on the flocs to cause them to break-up (Tardieuet al., 1999; Wisniewski and Grasmick, 1998). This both reduces particle size andpromotes the release of foulant materials bound within the flocs (EPS, Section 2.3.6.3).Wisniewski and Grasmick (1998) studied the effects of the recirculation on the particlesize in an sMBR. Without recirculation, floc size ranged from 20 �m to more than500 �m. Only 15% of the particles were lower than 100 �m. With recirculation,reduction in particle size was directly proportional to the magnitude of the shearstress and the experiment time; at 5 m/s CFV 98% of the particles were smaller than100 �m. iMBRs are therefore higher in energy efficiency, manifested as the specific
56 The MBR Book
Figure 2.23 An sMBR pilot plant. Note that the fluid path along the membrane is four times the lengthof one horizontal module
1856174817_Ch02.qxd 6/5/06 12:08 PM Page 56
energy demand in kWh/m3 permeate product, than sMBR technologies. The immersedconfiguration employs no liquid pumping for permeation, instead relying on aerationto promote mass transfer of liquid across the membrane (i.e. enhancing flux) by generating significant transient shear at the membrane:solution interface (Section2.1.4.4). Shear can also be promoted by directly moving the membrane, such as in theHuber VRM (Vacuum Rotating Membrane) system (Section 4.2.4).
Whilst sMBRs cannot provide the same low energy demand as the immersed con-figuration, they do offer a number of advantages:
1. Fouling has been shown to decrease linearly with increasing CFV. For examplea bench-scale study revealed that CFV values of 2 and 3 m/s were sufficient toprevent the formation of reversible fouling in UF (30 kDa) and MF (0.3 �m)systems, and that fouling was suppressed for CFV values up to 4.5 m/s test(Choi et al., 2005b).
2. The membranes can also be chemically cleaned “in situ” (CIP) easily without anychemical risk to the biomass.
3. Maintenance and plant downtime costs, particularly with reference to mem-brane module replacement, are generally slightly lower because of the acces-sibility of the modules which can be replaced in �5 min.
4. Precipitation of sparingly soluble inorganic solids (i.e. scalants) and organicmatter (gel-forming constituents) is more readily managed in sidestream MTsystems by control of the hydrodynamics both during the operation and theCIP cycle.
5. It is generally possible to operate sMBRs at higher MLSS levels than HF iMBRs.6. Aeration can be optimised for oxygen transfer and mixing, rather than demand-
ing a compromise between membrane aeration and oxygen dissolution, aswould be the case for single-tank iMBRs.
2.3.2 Extractive and diffusive MBRs
Extractive and diffusive MBR processes (eMBRs and dMBRs) are still largely at thedevelopmental stage and are likely to be viable only for niche, high-added valueapplications. They have been reviewed by Stephenson et al. (2000). In an extractivesystem, specific problem contaminants are extracted from the bulk liquid across amembrane of appropriate permselectivity. The contaminant then undergoes biotreat-ment on the permeate side of the membrane, normally by a biofilm formed on themembrane surface. In the case of the diffusive MBRs, a gas permeable membrane isused to introduce into the bioreactor a gas in the molecular, or “bubbleless” (Ahmedand Semmens, 1992a, b; Côté et al., 1988), form. This again normally feeds a biofilm atthe membrane surface. Hence, both extractive and diffusive systems essentially relyon a membrane both for enhanced mass transport and as a substrate for a biofilm,and also operate by diffusive transport: the pollutant or gas for the extractive or diffu-sive MBR respectively travels through the membrane under a concentration gradient.
In principle, any gas can be transported across the membrane, though obviouslythe choices are limited if it is to be used to feed a biofilm. Diffusive systems are gener-ally based on the transfer of oxygen across a microporous membrane and are thus
Fundamentals 57
1856174817_Ch02.qxd 6/5/06 12:08 PM Page 57
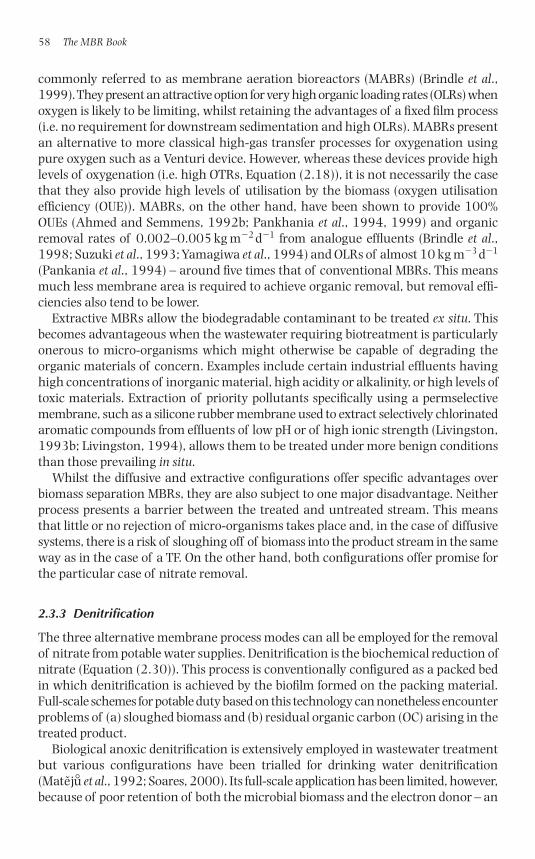
commonly referred to as membrane aeration bioreactors (MABRs) (Brindle et al.,1999). They present an attractive option for very high organic loading rates (OLRs) whenoxygen is likely to be limiting, whilst retaining the advantages of a fixed film process(i.e. no requirement for downstream sedimentation and high OLRs). MABRs presentan alternative to more classical high-gas transfer processes for oxygenation usingpure oxygen such as a Venturi device. However, whereas these devices provide highlevels of oxygenation (i.e. high OTRs, Equation (2.18)), it is not necessarily the casethat they also provide high levels of utilisation by the biomass (oxygen utilisationefficiency (OUE)). MABRs, on the other hand, have been shown to provide 100%OUEs (Ahmed and Semmens, 1992b; Pankhania et al., 1994, 1999) and organicremoval rates of 0.002–0.005 kg m�2 d�1 from analogue effluents (Brindle et al.,1998; Suzuki et al., 1993; Yamagiwa et al., 1994) and OLRs of almost 10 kg m�3 d�1
(Pankania et al., 1994) – around five times that of conventional MBRs. This meansmuch less membrane area is required to achieve organic removal, but removal effi-ciencies also tend to be lower.
Extractive MBRs allow the biodegradable contaminant to be treated ex situ. Thisbecomes advantageous when the wastewater requiring biotreatment is particularlyonerous to micro-organisms which might otherwise be capable of degrading theorganic materials of concern. Examples include certain industrial effluents havinghigh concentrations of inorganic material, high acidity or alkalinity, or high levels oftoxic materials. Extraction of priority pollutants specifically using a permselectivemembrane, such as a silicone rubber membrane used to extract selectively chlorinatedaromatic compounds from effluents of low pH or of high ionic strength (Livingston,1993b; Livingston, 1994), allows them to be treated under more benign conditionsthan those prevailing in situ.
Whilst the diffusive and extractive configurations offer specific advantages overbiomass separation MBRs, they are also subject to one major disadvantage. Neitherprocess presents a barrier between the treated and untreated stream. This meansthat little or no rejection of micro-organisms takes place and, in the case of diffusivesystems, there is a risk of sloughing off of biomass into the product stream in the sameway as in the case of a TF. On the other hand, both configurations offer promise forthe particular case of nitrate removal.
2.3.3 Denitrification
The three alternative membrane process modes can all be employed for the removalof nitrate from potable water supplies. Denitrification is the biochemical reduction ofnitrate (Equation (2.30)). This process is conventionally configured as a packed bedin which denitrification is achieved by the biofilm formed on the packing material.Full-scale schemes for potable duty based on this technology can nonetheless encounterproblems of (a) sloughed biomass and (b) residual organic carbon (OC) arising in thetreated product.
Biological anoxic denitrification is extensively employed in wastewater treatmentbut various configurations have been trialled for drinking water denitrification(Matej°u et al., 1992; Soares, 2000). Its full-scale application has been limited, however,because of poor retention of both the microbial biomass and the electron donor – an
58 The MBR Book
1856174817_Ch02.qxd 6/5/06 12:08 PM Page 58
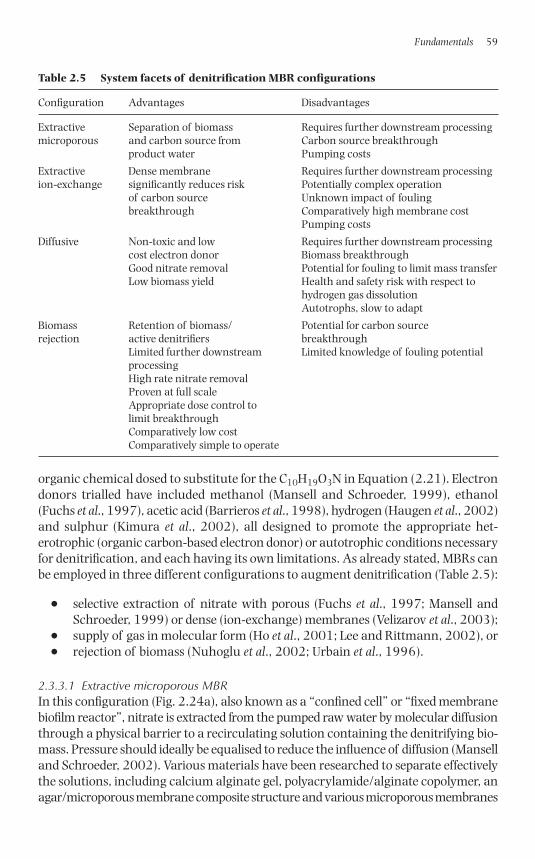
organic chemical dosed to substitute for the C10H19O3N in Equation (2.21). Electrondonors trialled have included methanol (Mansell and Schroeder, 1999), ethanol(Fuchs et al., 1997), acetic acid (Barrieros et al., 1998), hydrogen (Haugen et al., 2002)and sulphur (Kimura et al., 2002), all designed to promote the appropriate het-erotrophic (organic carbon-based electron donor) or autotrophic conditions necessaryfor denitrification, and each having its own limitations. As already stated, MBRs canbe employed in three different configurations to augment denitrification (Table 2.5):
● selective extraction of nitrate with porous (Fuchs et al., 1997; Mansell andSchroeder, 1999) or dense (ion-exchange) membranes (Velizarov et al., 2003);
● supply of gas in molecular form (Ho et al., 2001; Lee and Rittmann, 2002), or● rejection of biomass (Nuhoglu et al., 2002; Urbain et al., 1996).
2.3.3.1 Extractive microporous MBRIn this configuration (Fig. 2.24a), also known as a “confined cell” or “fixed membranebiofilm reactor”, nitrate is extracted from the pumped raw water by molecular diffusionthrough a physical barrier to a recirculating solution containing the denitrifying bio-mass. Pressure should ideally be equalised to reduce the influence of diffusion (Manselland Schroeder, 2002). Various materials have been researched to separate effectivelythe solutions, including calcium alginate gel, polyacrylamide/alginate copolymer, anagar/microporous membrane composite structure and various microporous membranes
Fundamentals 59
Table 2.5 System facets of denitrification MBR configurations
Configuration Advantages Disadvantages
Extractive Separation of biomass Requires further downstream processingmicroporous and carbon source from Carbon source breakthrough
product water Pumping costs
Extractive Dense membrane Requires further downstream processingion-exchange significantly reduces risk Potentially complex operation
of carbon source Unknown impact of foulingbreakthrough Comparatively high membrane cost
Pumping costs
Diffusive Non-toxic and low Requires further downstream processingcost electron donor Biomass breakthroughGood nitrate removal Potential for fouling to limit mass transferLow biomass yield Health and safety risk with respect to
hydrogen gas dissolutionAutotrophs, slow to adapt
Biomass Retention of biomass/ Potential for carbon source rejection active denitrifiers breakthrough
Limited further downstream Limited knowledge of fouling potentialprocessingHigh rate nitrate removalProven at full scaleAppropriate dose control to limit breakthroughComparatively low costComparatively simple to operate
1856174817_Ch02.qxd 6/5/06 12:08 PM Page 59
(Mansell and Schroeder, 2002). Membrane configurations have typically consistedof either an FS (Reising and Schroeder, 1996) or tubular (Ergas and Rheinheimer,2004) type. The advantage of this process is that both the electron donor and theheterotrophic denitrifying biomass are separated from the product water. Whilst themembrane can permit electron donor transport, biofilm formation should theoreti-cally aid donor retention (Fuchs et al., 1997).
Between 90% and 99% removal of nitrate has been reported at nitrate levels ashigh as 200 mg NO3
�-N/L (Ergas and Rheinheimer, 2004; Fuchs et al., 1997;Mansell and Schroeder, 1999). The main limitation of this system appears to be per-meation of the electron donor (such as methanol) into the product water, with 8%transfer and 4 mg total organic carbon (TOC)/L product water concentration beingrespectively reported by Ergas and Rheinheimer (Ergas and Rheinheimer, 2004) andMansell and Schroeder (Mansell and Schroeder, 1999) in controlled addition experi-ments. It has been suggested that this problem can be ameliorated by continuous,rather than batch, operation and appropriate control of biofilm growth (Reising andSchroeder, 1996), a postulate corroborated to some extent by studies by Fuchs et al.(1997). Problems of organic carbon breakthrough into the product water can beobviated by using hydrogen as the electron donor, coupled with a bicarbonate car-bon source (Mansell and Schroeder, 2002). However, the process then becomes limited by dissolution of hydrogen.
2.3.3.2 Extractive ion-exchange MBRThis configuration is identical to the extractive process except that the microporousmembrane is replaced by an ion-exchange membrane, which is then, in principle, moreselective for nitrate, which is removed under a concentration gradient. By appropri-ate membrane selection, the electron donor concentration in the product water canbe reduced to below 1 mg/L (Fonseca et al., 2000; Velizarov et al., 2000/2001) coupledwith 85% nitrate removal at a feed concentration of 135–350 mgNO3
�/L (Fonseca et al.,2000). Thus, the ion-exchange membrane provides lower nitrate removal rates thana microporous membrane but greater rejection of low-molecular-weight organic carbon. However, as with the extractive technology, the use of the membrane to sim-ply extract nitrate implies that further processing of the product water is required.
60 The MBR Book
DOC/nutrients
Contaminated waterDenitrifying biofilm
Nitrate
(a) (b) (c)
DOC
DOC/nutrients
Contaminatedwater (nitrate)
Denitrifyingbiomass
Water
Water(pumped/gas-lift)
Denitrifyinghydrogenotrophicbiofilm
Nitrate
Hydrogengas
Figure 2.24 System configurations, denitrifying MBR: (a) nitrate extraction (eMBR), (b) biomass rejection(rMBR) and (c) membrane hydrogenation (MHBR)
1856174817_Ch02.qxd 6/5/06 12:08 PM Page 60
Moreover, the potential for membrane fouling from both organic materials andhardness (Oldani et al., 1992) has not yet been explored. The relative expense of theion-exchange membrane (Crespo et al., 2004) is likely further to constrain develop-ment of this process for the duty of drinking water denitrification.
2.3.3.3 Diffusive MBRsAs already stated, the use of hydrogen (H2) as the electron donor combined witheither carbon dioxide or bicarbonate as the carbon source (Mansell and Schroeder,2002) obviates the organic carbon contamination issue, since hydrogen gas doesremain dissolved in the water. Such autotrophic (or “hydrogenotrophic”) denitrificationcan be considered both inexpensive and non-toxic (Haugen et al., 2002), as well asproducing a relatively low biomass yield (Lee and Rittmann, 2002). As with MABRs,diffusive H2 MBRs typically employ microporous HF membranes or silicon tubes (Hoet al., 2001) to deliver gas directly to biomass (in this case a denitrifying biofilm)attached to the shell-side of the membrane (Fig. 2.24b) providing up to 100% gastransfer (Mo et al., 2005). Although around 40% slower than heterotrophic denitri-fication according to some batch measurements (Ergas and Reuss, 2001), high nitrateremoval rates have none-the-less been reported in hydrogenotrophic MBRs (Haugenet al., 2002; Ho et al., 2001). These are apparently attained through high H2 gas masstransfer rates sustained by limiting fouling. Fouling is mainly manifested as thickand dense biofilms (Roggy et al., 2002) and, possibly, scalants (Ergas and Reuss, 2001;Lee and Rittmann, 2002) at the membrane surface, though precipitation of mineraldeposits appears not to adversely affect H2 transfer in all studies (Lee and Rittmann,2003; Roggy et al., 2002).
The disadvantage of gas transfer MBRs is, as with the extractive processes, thatthe membrane is not used for filtration, but it also does not retain the biomass. Assuch, product water is prone to “sloughed” biomass and other organic matter in thesame way as any fixed film biological process. Also, regulation of the gas fluxthrough the membrane due to the partial pressure drop along the membrane fibrelength (Ahmed and Semmens, 1992) can produce uneven biofilm growth. In add-ition, doubts about the safety of dosing water with hydrogen remain, notwithstand-ing the apparent near quantitative retention of hydrogen by the biomass. Finally, thepoor adaptability of the autotrophic bacteria under drinking water denitrificationconditions demonstrated in several studies by long acclimatisation periods of 40 and70 days (Ergas and Reuss, 2001; Ho et al., 2001) casts doubt on the suitability of thisconfiguration for full-scale operation.
2.3.3.4 Biomass rejection MBRIn the conventional configuration the membrane is actually used to filter the water,and both nitrate and the electron donor enter the developed biofilm in the samedirection (Fig. 2.24c). Both heterotrophic and autotrophic systems have been inves-tigated using acetate (Barrieros et al., 1998), ethanol (Chang et al., 1993; Delanghe et al., 1994; Urbain et al., 1996) and elemental sulphur (Kimura et al., 2002) as elec-tron donors, though studies based on an iMBR specifically for drinking water dutiesappear to be limited to Kimura et al. (2002). These authors used rotating disc modules to “control” fouling, thus avoiding aeration and maintaining an anoxic
Fundamentals 61
1856174817_Ch02.qxd 6/5/06 12:08 PM Page 61
environment, and sustained a flux of 21 LMH for 100 days with limited fouling.Fouling in denitrification MBRs has not been characterised, though reported datasuggest the biomass has a higher fouling propensity than that generated fromsewage treatment (Delanghe et al., 1994; Urbain et al., 1996). This can apparentlyto some extent be controlled by reducing the flux to below 10 LMH and operating atcrossflows of 2 m/s in sMBRs (Urbain et al., 1996). Nitrate removal efficiencies of upto 98.5% have generally been reported in these studies but, as with previous config-urations reported, several investigators reported organic carbon (Delanghe et al.,1994) and elevated assimilable organic carbon (AOC) concentrations (Kimura et al.,2002) in the product water.
A full-scale 400 m3/day (0.4 megalitres per day (MLD)) nitrate removal MBRprocess was constructed in Douchy, France, incorporating powdered activated carbon(PAC) dosing for pesticide removal. Stabilised fluxes between 60 and 70 l m�2 h�1
were obtained at full scale and, contrary to previous investigations, having optimisedC:N dosing, treated water of low organic carbon concentration as well as tri-halomethane formation potential (THMFP) was reported. The author hypothesised thatthe low effluent organic content was a consequence of effective membrane rejectionof biomass byproducts of high-molecular-weight organic matter (Urbain et al., 1996).
2.3.3.5 Hybrid MBR systemsA system ingeniously using electrolysis to generate hydrogen and feed a biofilm on agranular activated carbon (GAC) support, coupled with a downstream membrane tofilter the water, has been trialled (Prosnansky et al., 2002). This system provided treatedwater nitrate levels of 5–10 mg NO3
�-N/L once optimised by employing high-specificarea GAC. The low nitrate removal rates were a consequence of influent DO concen-tration affecting hydrogen dissolution, difficulties with pH control, hydrodynamiclimitations and the influence of the anode on nitrate migration on increasing elec-tric field intensity. Furthermore, the process is somewhat limited in application dueto an intensive energy requirement and, once again, formation of hydrogen bubbleswhich impose a safety risk.
More recent research (Mo et al., 2005) has focused on incorporating both gas trans-fer and immersed pressure-driven membranes into the same reactor. The authorsfocused treatment on suspended biomass rather than biofilms to minimise mass trans-fer problems previously reported with biofilm development (Crespo et al., 2004; Ergasand Reuss, 2001). Nitrate loading rates between 24 and 192 mg NO3
�-N/(L/day) weretrialled, with all but the higher loadings resulting in 100% removal performance.However, average effluent dissolved organic carbon (DOC) concentrations of approxi-mately 8 mg/L were also recorded, possibly due to the regular mechanical removal ofbiofilm from the membrane surface which would otherwise act to reject organic matter.
2.3.3.6 SynopsisThe use of MBRs for drinking water denitrification is very much at the research anddevelopment stage. Three different MBR configurations have been studied for thisapplication and, as yet, only one full-scale plant has been installed. Challenges for allthree configurations remain, specifically contamination of the treated water by organiccarbon arising either from the electron donor in a heterotrophic system or from the
62 The MBR Book
1856174817_Ch02.qxd 6/5/06 12:08 PM Page 62
biomass. There are also issues with nitrite (NO2�) arising in the effluent due to incom-
plete nitrification, and this becomes a serious limitation, particularly in EuropeanUnion (EU) countries which are subject to more rigorous limits on nitrite levels thanthe US (0.03 vs. 1 mg/L as NO2
�-N). If the membrane is not used for direct filtration,as is the case for diffusive and extractive denitrification MBRs, further downstreamprocessing is required for colour, taste and turbidity improvements and for disinfection.There are additionally health and safety concerns to address with the hydrogenotrophicsystems. Notwithstanding the elegance of the diffusive and extractive systems, it ispossible that the conventional biomass rejection configuration may hold the mostpromise since, as a barrier system, it also achieves disinfection. However, with onlyone full-scale plant in existence, there is clearly further development required in this area.
2.3.4 Elements of an immersed biomass-rejection MBR
MBRs employing immersed membranes to reject biomass represent the most widelyemployed of all MBR configurations, since they incur the lowest specific energydemand and therefore become the most economically viable for large-scale applica-tions. There are essentially five key elements of the iMBR process which are key to itsdesign and operation (Fig. 2.25). These are:
1. The membrane, its design and the sustaining of permeability,2. Feedwater, its characteristics and its pretreatment,3. Aeration of both membrane and the bulk biomass,4. Sludge withdrawal and residence time,5. Bioactivity and nature of the biomass.
These elements are obviously largely inter-related (Fig. 2.26), in particular the latterthree which obviously relate to operation. The rate at which sludge is withdrawncontrols the residence time (i.e. the SRT) which then determines the concentration ofthe biomass (or, strictly speaking, the mixed liquor). The MLSS concentration thenimpacts both on the biological properties, that is, the bioactivity and microbial spe-ciation (Section 2.2.3), and also on the physical properties such as the viscosity and oxygen transfer (Section 2.2.5). The feedwater chemistry provides the biggestimpact on MBR operation, in that the membrane fouling propensity of the mixed
Fundamentals 63
Out(membrane fouling)
Feed(screens)
Air(energy)
Bioreactor(activity � nature)
Sludge waste(quantity and quality)
Figure 2.25 Elements of an MBR
1856174817_Ch02.qxd 6/5/06 12:08 PM Page 63
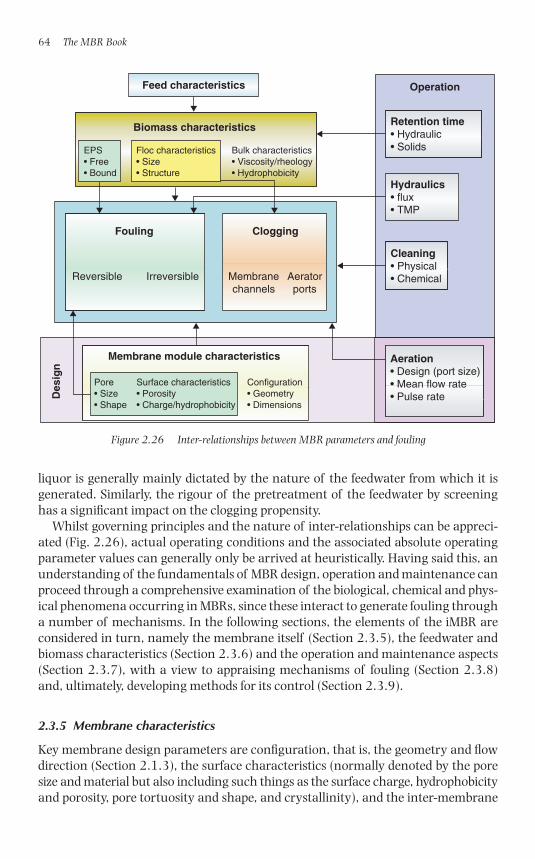
liquor is generally mainly dictated by the nature of the feedwater from which it isgenerated. Similarly, the rigour of the pretreatment of the feedwater by screeninghas a significant impact on the clogging propensity.
Whilst governing principles and the nature of inter-relationships can be appreci-ated (Fig. 2.26), actual operating conditions and the associated absolute operatingparameter values can generally only be arrived at heuristically. Having said this, anunderstanding of the fundamentals of MBR design, operation and maintenance canproceed through a comprehensive examination of the biological, chemical and phys-ical phenomena occurring in MBRs, since these interact to generate fouling througha number of mechanisms. In the following sections, the elements of the iMBR areconsidered in turn, namely the membrane itself (Section 2.3.5), the feedwater andbiomass characteristics (Section 2.3.6) and the operation and maintenance aspects(Section 2.3.7), with a view to appraising mechanisms of fouling (Section 2.3.8)and, ultimately, developing methods for its control (Section 2.3.9).
2.3.5 Membrane characteristics
Key membrane design parameters are configuration, that is, the geometry and flowdirection (Section 2.1.3), the surface characteristics (normally denoted by the poresize and material but also including such things as the surface charge, hydrophobicityand porosity, pore tortuosity and shape, and crystallinity), and the inter-membrane
64 The MBR Book
Floc characteristics• Size• Structure
Operation
Des
ign
Clogging
Membranechannels
Aeratorports
Reversible Irreversible
Fouling
Biomass characteristics
Feed characteristics
Membrane module characteristics
Pore• Size• Shape
Surface characteristics• Porosity• Charge/hydrophobicity
Bulk characteristics• Viscosity/rheology• Hydrophobicity
Configuration• Geometry• Dimensions
EPS• Free• Bound
Retention time• Hydraulic• Solids
Hydraulics• flux• TMP
Aeration• Design (port size)• Mean flow rate• Pulse rate
Cleaning• Physical• Chemical
Figure 2.26 Inter-relationships between MBR parameters and fouling
1856174817_Ch02.qxd 6/5/06 12:08 PM Page 64
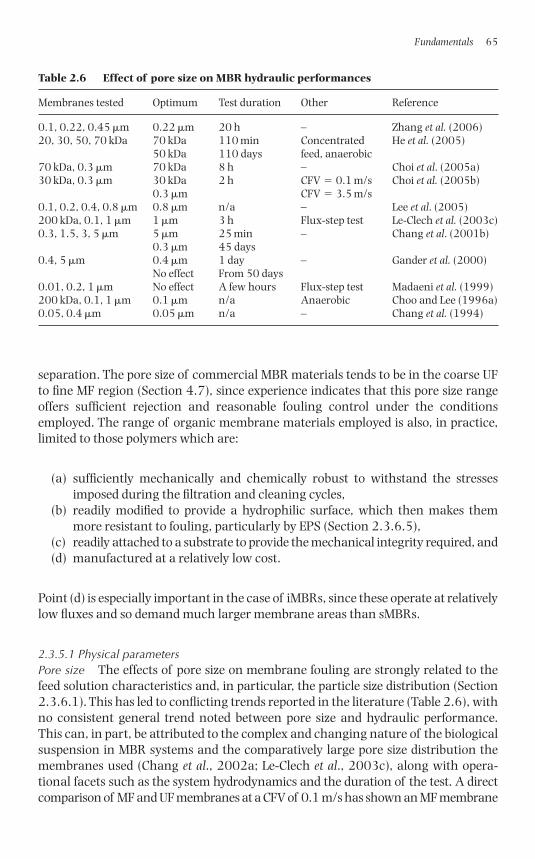
separation. The pore size of commercial MBR materials tends to be in the coarse UFto fine MF region (Section 4.7), since experience indicates that this pore size rangeoffers sufficient rejection and reasonable fouling control under the conditionsemployed. The range of organic membrane materials employed is also, in practice,limited to those polymers which are:
(a) sufficiently mechanically and chemically robust to withstand the stressesimposed during the filtration and cleaning cycles,
(b) readily modified to provide a hydrophilic surface, which then makes themmore resistant to fouling, particularly by EPS (Section 2.3.6.5),
(c) readily attached to a substrate to provide the mechanical integrity required, and(d) manufactured at a relatively low cost.
Point (d) is especially important in the case of iMBRs, since these operate at relativelylow fluxes and so demand much larger membrane areas than sMBRs.
2.3.5.1 Physical parametersPore size The effects of pore size on membrane fouling are strongly related to thefeed solution characteristics and, in particular, the particle size distribution (Section2.3.6.1). This has led to conflicting trends reported in the literature (Table 2.6), withno consistent general trend noted between pore size and hydraulic performance.This can, in part, be attributed to the complex and changing nature of the biologicalsuspension in MBR systems and the comparatively large pore size distribution themembranes used (Chang et al., 2002a; Le-Clech et al., 2003c), along with opera-tional facets such as the system hydrodynamics and the duration of the test. A directcomparison of MF and UF membranes at a CFV of 0.1 m/s has shown an MF membrane
Fundamentals 65
Table 2.6 Effect of pore size on MBR hydraulic performances
Membranes tested Optimum Test duration Other Reference
0.1, 0.22, 0.45 �m 0.22 �m 20 h – Zhang et al. (2006)20, 30, 50, 70 kDa 70 kDa 110 min Concentrated He et al. (2005)
50 kDa 110 days feed, anaerobic70 kDa, 0.3 �m 70 kDa 8 h – Choi et al. (2005a)30 kDa, 0.3 �m 30 kDa 2 h CFV � 0.1 m/s Choi et al. (2005b)
0.3 �m CFV � 3.5 m/s0.1, 0.2, 0.4, 0.8 �m 0.8 �m n/a – Lee et al. (2005)200 kDa, 0.1, 1 �m 1 �m 3 h Flux-step test Le-Clech et al. (2003c)0.3, 1.5, 3, 5 �m 5 �m 25 min – Chang et al. (2001b)
0.3 �m 45 days0.4, 5 �m 0.4 �m 1 day – Gander et al. (2000)
No effect From 50 days0.01, 0.2, 1 �m No effect A few hours Flux-step test Madaeni et al. (1999)200 kDa, 0.1, 1 �m 0.1 �m n/a Anaerobic Choo and Lee (1996a)0.05, 0.4 �m 0.05 �m n/a – Chang et al. (1994)
1856174817_Ch02.qxd 6/5/06 12:08 PM Page 65
to provide a hydraulic resistance of around twice that of a UF membrane (Choi et al.,2005b). Interestingly, the DOC rejection of both membranes was similar following2 h of operation, indicating the dynamic membrane layer formed on the membranesto have provided the perm-selectivity rather than the membrane substrate itself.
Conventional wisdom considers smaller pores to afford greater protection of themembrane by rejecting a wider range of materials, with reference to their size, thusincreasing cake (or fouling layer) resistance. Compared to that formed on mem-branes having larger pores, the layer is more readily removed and less likely to leaveresidual pore plugging or surface adsorption. It is the latter and related phenomenawhich cause irreversible and irrecoverable fouling. However, when testing membraneswith pores ranging from 0.4 to 5 �m, Gander et al. (2000) conversely observed greaterinitial fouling for the larger pore-size membranes and significant flux decline whensmaller pore-size membrane were used over an extended period of time, though theseauthors used isotropic membranes without surface hydrophilicisation.
Characterisation of the distribution of MW compounds present in the super-natant of MBRs operated with membranes of four pore sizes (ranging from 0.1 to0.8 �m) has also been presented (Lee et al., 2005). Although providing a lower foul-ing rate, the 0.8 �m pore-size MBR nonetheless had a slightly higher supernatantconcentration of most of the macromolecules. According to these results, it seemsunlikely for the small differences in MW distribution to cause significant variation infouling rates observed between the four MBR systems. In another study based onshort-term experiments, sub-critical fouling resistance and fouling rate increasedlinearly with membrane resistance ranging from 0.4 to 3.5 � 109 m�1, correspond-ing to membrane pore size from 1 down to 0.01 �m (Le-Clech et al., 2003c). Theseresults suggest that a dynamic layer is created of greater overall resistance for themore selective membranes operating under sub-critical conditions, and supports thenotion that larger pores decrease deposition onto the membrane at the expense ofinternal adsorption. Long-term trials have revealed that progressive internal depositioneventually leads to catastrophic increase in resistance (Cho and Fane, 2002; Le-Clechet al., 2003b; Ognier et al., 2002a), as discussed in Section 2.1.4.6. Tests conductedusing a very porous support for the formation of a dynamic membrane have yieldedreasonable removal efficiencies and permeabilities (Wu et al., 2004), and full-scaleinstallations now exist based on this approach (Section 5.2.5).
Porosity/pore size distribution/roughness Membrane roughness and porosity wereidentified as possible causes of differing fouling behaviour observed when four MFmembranes with nominal pore sizes between 0.20 and 0.22 �m were tested in par-allel (Fang and Shi, 2005). The track-etched membrane, with its dense structureand small but uniform cylindrical pores, provided the lowest resistance due to itshigh surface isoporosity whereas the other three membranes were more prone topore fouling due to their highly porous network. Although all membranes were ofsimilar nominal pore size, the PVDF, mixed cellulose esters (MCE) and PES mem-branes resulted in relative pore resistance of 2, 11 and 86% of the total hydraulicresistance respectively. It was suggested that membrane microstructure, materialand pore openings all affected MBR fouling significantly (Fang and Shi, 2005). Com-parison between two microporous membranes prepared by stretching demonstrated
66 The MBR Book
1856174817_Ch02.qxd 6/5/06 12:08 PM Page 66
fouling to be influenced by pore aspect ratio (i.e. pore surface length/pore surfacewidth). Whilst both membranes had the same average pore size and pure water flux,reduced fouling was observed with the membrane having higher pore aspect ratio(i.e. more elliptical and less circular) (Kim et al., 2004). Surface roughness has beenimplicated as promoting fouling from studies on an anaerobic MBR system (He et al.,2005), although in this study both pore aspect ratio, i.e. more elliptical size andmembrane morphology were changed simultaneously.
Membrane configuration As already discussed (Section 2.3.1) the immersed processconfiguration is generally favoured over the pumped sidestream configuration formedium to large-scale domestic wastewater treatment (Fane et al., 2002; Gunderand Krauth, 1999; Judd, 2005; Le-Clech et al., 2005b). This relates mainly to theimpact of aeration, which suppresses fouling through generating shear (Section2.3.6.4).
iMBR membranes are largely configured either as HF or FS whereas sMBRs areeither FS or MT (Fig. 2.5). Whilst HF modules are generally less expensive to manu-facture, allow high membrane density and tolerate vigorous backflushing, they arealso less readily controlled hydrodynamically than FS or MT membranes where themembrane channel width is well defined. A discussion of the relative merits of FSand HF membranes was initiated by Gunter and Krauth (1998), who demonstratedthe superior hydraulic performance (i.e. higher permeability) attainable from the FSmembrane. On the other hand, in a comparative study of FS and HF membranes ofthe same pore size (0.4 �m) used for anaerobic treatment (Hai et al., 2005), theauthors found the FS membrane to foul slightly more than the HF membrane andthe permeability was not recovered following cleaning with water.
An important parameter for HF systems is the packing density, discussed in Section4.8 with reference to commercial membrane products. The separation distancebetween adjacent membranes has a direct impact on clogging, shear and aerationenergy demand. For a given liquid upflow rate, as provided by airlift, increasing theseparation reduces the risk of clogging by gross solids. Reducing the separation willalso, for a given bubble volume, retard the rising bubble as a consequence of thegas:membrane contact area increasing, thereby increasing the downward dragforce. This might then be expected to decrease the flux because shear forces arereduced as a result. On the other hand, for a given liquid upflow velocity and thus thesame shear, increasing channel width also increases the aeration energy demandsince a larger volume of liquid (dictated by the channel width) is being passed over thesame membrane area; it is the volumetric flow rate that determines energy demand.
Experiments conducted on a bundle of nine fibres revealed the module perform-ance to be significantly worse than that of module based on an individual fibre (Yeoand Fane, 2004), with the surrounding fibres being less productive. At high feedconcentrations and low CFVs, the surrounding fibres became completely blockedand eventually produced negligible flux. A lowering of the packing density by 30%was advised to allow the bundle to perform similarly to individual fibres, since thisreduced the impact of cake layers forming on adjacent fibres and allowed greatershear to be generated (Yeo and Fane, 2004). A mathematical model based on sub-strate and biomass mass balance also revealed the significant role played by packing
Fundamentals 67
1856174817_Ch02.qxd 6/5/06 12:08 PM Page 67
density in overall MBR performance and the maintenance of MLSS in particular(Vigneswaran et al., 2004).
The effects of other membrane characteristics, including HF orientation, size andflexibility, have been reviewed (Cui et al., 2003). For HF membranes used for yeast fil-tration, higher critical fluxes were measured for membranes of smaller diameter(0.65 mm) and greater length (80 cm) (Wicaksana et al., 2006), though contradict-ory results showing slightly higher permeabilities for shorter membranes (0.3 cf.1.0 m) have also been reported (Kim and DiGiano, 2004). A significant impact ofmembrane length is the pressure drop due to lumen-side permeate flow. Ideally, theresistance to permeate flow from the membrane to the outlet of the element shouldbe small compared with that offered by the membrane itself. If this is not the case,then the hydraulic losses across the permeate side of the membrane element may besufficient to produce a significant flux distribution across the membrane surface.Significant pressure losses (up to 530 mbar) have been measured for fibres longerthan 15 cm; below this critical length, pressure loss was reported as being at lessthan 110 mbar (Kim et al., 2004). Further discussion of fouling distribution in HFscan be found elsewhere (Chang and Fane, 2002; Chang et al., 2002b; Lipnizki andField, 2001; Ognier et al., 2004; Zheng et al., 2003; Zhongwei et al., 2003).
Anaerobic MBRs Research into membrane fouling of anaerobic membrane biore-actors (anMBRs) has been limited. Whilst fouling mechanisms may be similar to aer-obic MBRs, the nature of the foulants can be expected to be different and, as with theaerobic systems, to change with feedwater characteristics, membrane surface andmembrane module properties and process operating conditions. A recent review byBérubé et al. (2006) has been conducted, and aspects of this review are summarisedbelow and in Table 2.7.
Cake layers on membranes in anMBRs have been reported to contain both organicmatter and precipitated struvite (Choo and Lee, 1996a), though fouling of organicmembranes appears to be governed by biological/organic interactions with themembrane rather than by struvite formation. Choo et al. (2000) observed no differencein fouling rate when ammonia, a component of struvite, was removed from the mixedliquor prior to filtration using an organic membrane. It also appears that internal
68 The MBR Book
Table 2.7 Anaerobic MBR studies: optimal membrane pore size
Mixed Mode Mean Reactor Material Area Pore Optimal Referenceliqour1/ particle volume type (m2) sizefeed2 dia. (L) (µm)
(�m) Tested
Anaerobic Batch 3.28– 0.18 PVDF 0.09 0.015–1 0.1 Choo and Lee digestiona,1 23.3 (1996b)Sludge Continuous 13 10 ZrO2–TiO2 N/a 0.05– 0.14 Elmaleh and digesterb,1, sMBR 0.2 Abdelmoumni Syntheticc,2 (1998)Synthetic2 Continuous N/a N/a N/a N/a 0.45 0.6 Chung et al.
iMBR. & 0.6 (1998)
aBroth was fractionated into constituent parts (dissolved, fine colloids, cell suspension).bSupernatant.cAcetic acid/nutrients in tap water.
1856174817_Ch02.qxd 6/5/06 12:08 PM Page 68
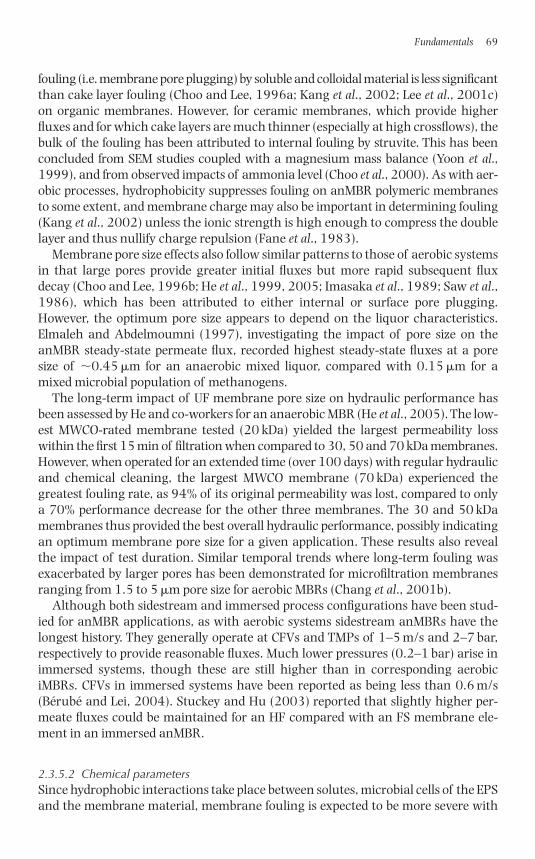
fouling (i.e. membrane pore plugging) by soluble and colloidal material is less significantthan cake layer fouling (Choo and Lee, 1996a; Kang et al., 2002; Lee et al., 2001c)on organic membranes. However, for ceramic membranes, which provide higherfluxes and for which cake layers are much thinner (especially at high crossflows), thebulk of the fouling has been attributed to internal fouling by struvite. This has beenconcluded from SEM studies coupled with a magnesium mass balance (Yoon et al.,1999), and from observed impacts of ammonia level (Choo et al., 2000). As with aer-obic processes, hydrophobicity suppresses fouling on anMBR polymeric membranesto some extent, and membrane charge may also be important in determining fouling(Kang et al., 2002) unless the ionic strength is high enough to compress the doublelayer and thus nullify charge repulsion (Fane et al., 1983).
Membrane pore size effects also follow similar patterns to those of aerobic systemsin that large pores provide greater initial fluxes but more rapid subsequent fluxdecay (Choo and Lee, 1996b; He et al., 1999, 2005; Imasaka et al., 1989; Saw et al.,1986), which has been attributed to either internal or surface pore plugging.However, the optimum pore size appears to depend on the liquor characteristics.Elmaleh and Abdelmoumni (1997), investigating the impact of pore size on theanMBR steady-state permeate flux, recorded highest steady-state fluxes at a poresize of �0.45 �m for an anaerobic mixed liquor, compared with 0.15 �m for amixed microbial population of methanogens.
The long-term impact of UF membrane pore size on hydraulic performance hasbeen assessed by He and co-workers for an anaerobic MBR (He et al., 2005). The low-est MWCO-rated membrane tested (20 kDa) yielded the largest permeability losswithin the first 15 min of filtration when compared to 30, 50 and 70 kDa membranes.However, when operated for an extended time (over 100 days) with regular hydraulicand chemical cleaning, the largest MWCO membrane (70 kDa) experienced thegreatest fouling rate, as 94% of its original permeability was lost, compared to onlya 70% performance decrease for the other three membranes. The 30 and 50 kDamembranes thus provided the best overall hydraulic performance, possibly indicatingan optimum membrane pore size for a given application. These results also revealthe impact of test duration. Similar temporal trends where long-term fouling wasexacerbated by larger pores has been demonstrated for microfiltration membranesranging from 1.5 to 5 �m pore size for aerobic MBRs (Chang et al., 2001b).
Although both sidestream and immersed process configurations have been stud-ied for anMBR applications, as with aerobic systems sidestream anMBRs have thelongest history. They generally operate at CFVs and TMPs of 1–5 m/s and 2–7 bar,respectively to provide reasonable fluxes. Much lower pressures (0.2–1 bar) arise inimmersed systems, though these are still higher than in corresponding aerobiciMBRs. CFVs in immersed systems have been reported as being less than 0.6 m/s(Bérubé and Lei, 2004). Stuckey and Hu (2003) reported that slightly higher per-meate fluxes could be maintained for an HF compared with an FS membrane ele-ment in an immersed anMBR.
2.3.5.2 Chemical parametersSince hydrophobic interactions take place between solutes, microbial cells of the EPSand the membrane material, membrane fouling is expected to be more severe with
Fundamentals 69
1856174817_Ch02.qxd 6/5/06 12:08 PM Page 69
hydrophobic rather than hydrophilic membranes (Chang et al., 1999; Madaeni et al.,1999; Yu et al., 2005a; Yu et al., 2005b). In the literature, changes in membranehydrophobicity are often linked with other membrane modifications such as pore sizeand morphology, which make the correlation between membrane hydrophobicityand fouling more difficult to assess. In a recent anMBR study, for example, the con-tact angle measurement demonstrated that the apparent hydrophobicity of PESmembranes decreased (from 55 to 47°) with increasing MWCO (from 20 to 70 kDamembranes, respectively) (He et al., 2005). The effect of membrane hydrophobicityin an aerobic MBR, from a comparison of two UF membranes of otherwise similarcharacteristics, revealed greater solute rejection and fouling and higher cake resist-ance for the hydrophobic membrane (Chang et al., 2001a). It was concluded that thesolute rejection was mainly due to the adsorption onto or sieving by the cake depositedon the membrane, and, to a lesser extent, direct adsorption into membrane pores andat the membrane surface. It has also been suggested (Fang and Shi, 2005) thatmembranes of greater hydrophilicity are more vulnerable to deposition of foulantsof hydrophilic nature, though in this study the most hydrophilic membrane was alsothe most porous and this can also enhance fouling (Section 2.3.5.1).
Although providing superior chemical, thermal and hydraulic resistance, the useof ceramic membranes in MBR technologies is limited by their high cost to nicheapplications such as treatment of high-strength industrial waste (Luonsi et al.,2002; Scott et al., 1998) and anaerobic biodegradation (Fan et al., 1996) in sMBRs.A direct comparison of a 0.1 �m ceramic and 0.03 �m polymeric multi-channelmembrane modules operated in sidestream air-lift mode showed the former to oper-ate without fouling up to at least 60 LMH, the highest flux tested, whereas for thelatter criticality was indicated at �36 LMH (Judd et al., 2004). Novel stainless steelmembrane modules have recently been shown to provide good hydraulic perform-ance and fouling recovery when used in an anaerobic MBR (Zhang et al., 2005).
Since fouling is expected to be more severe at higher hydrophobicities, efforts havenaturally been focused on increasing membrane hydrophilicity by chemical surfacemodification. Recent examples of MBR membrane modification include NH3 andCO2 plasma treatment of PP HFs (Yu et al., 2005a; Yu et al., 2005b) to functionalisethe surface with polar groups. In both cases, membrane hydrophilicity significantlyincreased and the new membranes yielded better filtration performance and fluxrecovery than those of unmodified membranes. In another study, addition of TiO2nanoparticles to the casting solution and direct pre-filtration of TiO2 allowed thepreparation of two types of TiO2-immobilised UF membrane, respectively compris-ing entrapped and deposited particles, which were used in MBR systems (Bae andTak, 2005). A lower flux decline was reported for the TiO2-containing membranescompared to the unmodified materials, the surface-coated material providing thegreatest fouling mitigation. When MBR membranes were precoated with ferrichydroxide flocs and compared to an unmodified MBR, both effluent quality and prod-uctivity were found to increase (Zhang et al., 2004).
Whilst many of the scientific studies of MBR membrane surface characterisationand/or modification relate to fouling by EPS, it appears that in practice both thechoice of membrane material and the nominal membrane pore size are limited.Commercially-available membranes and MBR systems are reviewed in Chapter 4and their characteristics summarised in Annex 3 and Table 4.5.
70 The MBR Book
1856174817_Ch02.qxd 6/5/06 12:08 PM Page 70
2.3.6 Feed and biomass characteristics
2.3.6.1 Feed nature and concentrationWhilst membrane fouling in physical wastewater filtration depends directly on the waterquality (Fuchs et al., 2005; Judd and Jefferson, 2003; Schrader et al., 2005), MBR mem-brane fouling is mostly affected by the interactions between the membrane and biologicalsuspension rather than feed water (Choi et al., 2005a). More recalcitrant feedwaters,such as landfill leachate (Section 5.4.3), may undergo more limited biochemical trans-formation such that the membrane is challenged in part by the raw, unmodified feed.Biological transformations which take place which are influenced both by the operatingconditions and the feedwater quality (Jefferson et al., 2004; Le-Clech et al., 2003b).
2.3.6.2 Biomass foulantsTwo types of foulant study dominate the MBR scientific literature: characterisationand identification. Characterisation refers to properties (usually relating to mem-brane permeability) the foulant demonstrates either in situ, that is, within the MBR,or ex situ in some bespoke or standard measurement, such as capillary suction time(CST) or specific resistance to filtration (SRF). Identification refers to physical and/orchemical classification of the foulant, invariably through extraction and isolationprior to chemical analysis. Of course, foulant isolates may also be characterised inthe same way as the MBR biomass.In general, foulants can be defined in three different ways (Table 2.8):
1. practically, based on permeability recovery,2. mechanistically, based on fouling mechanism,3. by material type, based on chemical or physical nature or on origin.
Fundamentals 71
Table 2.8 Foulant definitions
Practical Mechanism Foulant material type
Reversible/temporary: Pore blocking/filtration Size:• Removed by models (Fig. 2.9): • Molecular, macro-molecular,
physical cleaning • Complete blocking colloidal or particulateIrreversible/permanent: • Standard blocking Surface charge/chemistry:• Removed by chemical • Intermediate blocking • Positive or negative
cleaning • Cake filtration (cationic or anionic)Irrecoverable/absolutea: Chemical type:• Not removed by any • Inorganic (e.g. scalants) or organic
cleaning regime (e.g. humic materials, EPS)• Carbohydrate or protein
(fractions of EPS)Origin:• Microbial (autochthonous), terrestrial
(allochthonous) or man-made (anthropogenic)
• (Extracted) EPS ((e)EPS) or soluble microbial product (SMP)b
aIrrecoverable fouling is long-term and insidious.beEPS refers to microbial products directly associated with the cell wall; SMP refers to microbial products unassociated with the cell (Fig. 2.29).
1856174817_Ch02.qxd 6/5/06 12:08 PM Page 71
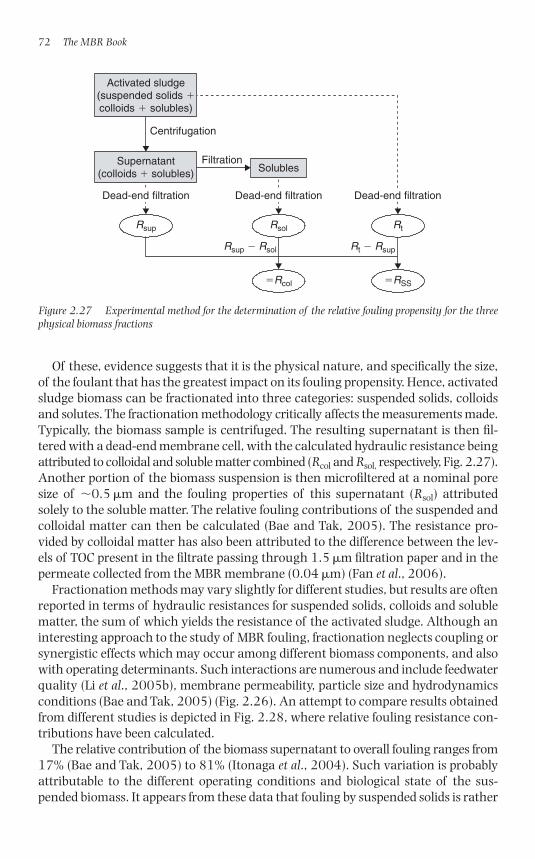
Of these, evidence suggests that it is the physical nature, and specifically the size,of the foulant that has the greatest impact on its fouling propensity. Hence, activatedsludge biomass can be fractionated into three categories: suspended solids, colloidsand solutes. The fractionation methodology critically affects the measurements made.Typically, the biomass sample is centrifuged. The resulting supernatant is then fil-tered with a dead-end membrane cell, with the calculated hydraulic resistance beingattributed to colloidal and soluble matter combined (Rcol and Rsol, respectively, Fig. 2.27).Another portion of the biomass suspension is then microfiltered at a nominal poresize of �0.5 �m and the fouling properties of this supernatant (Rsol) attributedsolely to the soluble matter. The relative fouling contributions of the suspended andcolloidal matter can then be calculated (Bae and Tak, 2005). The resistance pro-vided by colloidal matter has also been attributed to the difference between the lev-els of TOC present in the filtrate passing through 1.5 �m filtration paper and in thepermeate collected from the MBR membrane (0.04 �m) (Fan et al., 2006).
Fractionation methods may vary slightly for different studies, but results are oftenreported in terms of hydraulic resistances for suspended solids, colloids and solublematter, the sum of which yields the resistance of the activated sludge. Although aninteresting approach to the study of MBR fouling, fractionation neglects coupling orsynergistic effects which may occur among different biomass components, and alsowith operating determinants. Such interactions are numerous and include feedwaterquality (Li et al., 2005b), membrane permeability, particle size and hydrodynamicsconditions (Bae and Tak, 2005) (Fig. 2.26). An attempt to compare results obtainedfrom different studies is depicted in Fig. 2.28, where relative fouling resistance con-tributions have been calculated.
The relative contribution of the biomass supernatant to overall fouling ranges from17% (Bae and Tak, 2005) to 81% (Itonaga et al., 2004). Such variation is probablyattributable to the different operating conditions and biological state of the sus-pended biomass. It appears from these data that fouling by suspended solids is rather
72 The MBR Book
Dead-end filtration
FiltrationSolubles
Supernatant(colloids � solubles)
Dead-end filtration Dead-end filtration
Rsup
Rsup � Rsol Rt � Rsup
Rsol
�Rcol �RSS
Rt
Activated sludge(suspended solids �colloids � solubles)
Centrifugation
Figure 2.27 Experimental method for the determination of the relative fouling propensity for the threephysical biomass fractions
1856174817_Ch02.qxd 6/5/06 12:08 PM Page 72
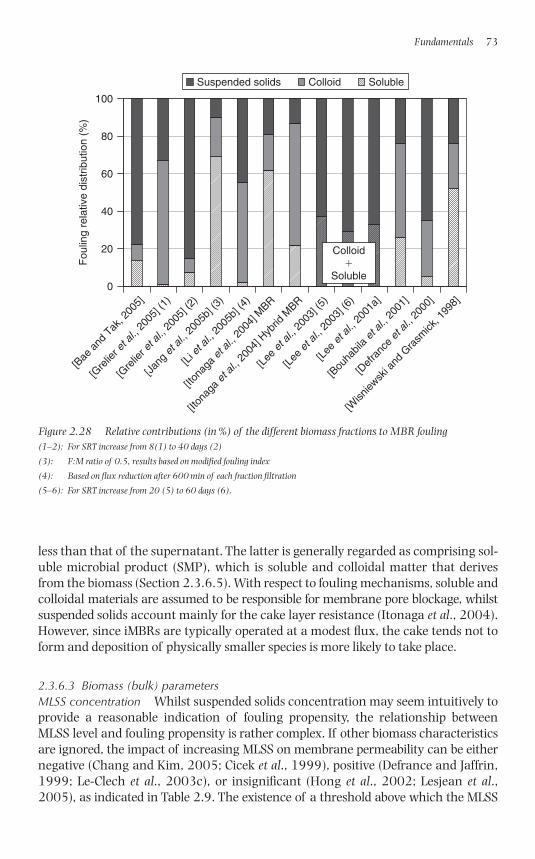
less than that of the supernatant. The latter is generally regarded as comprising sol-uble microbial product (SMP), which is soluble and colloidal matter that derivesfrom the biomass (Section 2.3.6.5). With respect to fouling mechanisms, soluble andcolloidal materials are assumed to be responsible for membrane pore blockage, whilstsuspended solids account mainly for the cake layer resistance (Itonaga et al., 2004).However, since iMBRs are typically operated at a modest flux, the cake tends not toform and deposition of physically smaller species is more likely to take place.
2.3.6.3 Biomass (bulk) parametersMLSS concentration Whilst suspended solids concentration may seem intuitively toprovide a reasonable indication of fouling propensity, the relationship betweenMLSS level and fouling propensity is rather complex. If other biomass characteristicsare ignored, the impact of increasing MLSS on membrane permeability can be eithernegative (Chang and Kim, 2005; Cicek et al., 1999), positive (Defrance and Jaffrin,1999; Le-Clech et al., 2003c), or insignificant (Hong et al., 2002; Lesjean et al., 2005), as indicated in Table 2.9. The existence of a threshold above which the MLSS
Fundamentals 73
0
20
40
60
80
100
Suspended solids Colloid SolubleF
oulin
g re
lativ
e di
strib
utio
n (%
)
[Wisn
iewsk
i and
Gra
smick
, 199
8]
[Def
ranc
e et
al.,
2000
]
[Bou
habil
a et
al.,
2001
]
[Lee
et a
l., 20
01a]
[Lee
et a
l., 20
03] (
6)
[Lee
et a
l., 20
03] (
5)
[Iton
aga
et a
l., 20
04] H
ybrid
MBR
[Iton
aga
et a
l., 20
04] M
BR
[Li e
t al.,
2005
b] (4
)
[Jang
et a
l., 20
05b]
(3)
[Gre
lier e
t al.,
2005
] (2)
[Gre
lier e
t al.,
2005
] (1)
[Bae
and
Tak
, 200
5]
Colloid�
Soluble
Figure 2.28 Relative contributions (in %) of the different biomass fractions to MBR fouling(1–2): For SRT increase from 8(1) to 40 days (2)
(3): F:M ratio of 0.5, results based on modified fouling index
(4): Based on flux reduction after 600 min of each fraction filtration
(5–6): For SRT increase from 20 (5) to 60 days (6).
1856174817_Ch02.qxd 6/5/06 12:08 PM Page 73
concentration has a negative influence has been reported (30 g/L, according toLubbecke et al., 1995). A more detailed fouling trend has been described (Rosenbergeret al., 2005), in which an increase in MLSS reduced fouling at low MLSS levels (�6 g/L)whilst exacerbating fouling at MLSS concentrations above 15 g/L. The level of MLSSdid not appear to have a significant effect on membrane fouling between 8 and 12 g/L.In another study of MLSS concentration impacts (WERF, 2005), it was concluded thathydrodynamics (more than MLSS concentration) control the critical flux at MLSS lev-els above 5 g/L.
Contradictory trends from data obtained in the same study are apparent. Forexample, the cake resistance (Rc) has been observed to increase and the specific cakeresistance (�, the resistance per unit cake depth) to decrease with increasing MLSS,indicating that the bulk cake becomes more permeable. Bin et al. (2004) observedthe permeate flux to decrease (albeit at a reduced fouling rate) with increasingMLSS. This was attributed to the rapid formation of a fouling cake layer (potentiallyprotecting the membrane) at high concentration, while progressive pore blockingcreated by colloids and particles was thought to take place at lower MLSS concen-trations when the membrane was less well protected. This may well explain the sub-critical fouling behaviour depicted in Fig. 2.14.
Empirical relationships predicting flux from MLSS level have been proposed in a number of papers (Fang and Shi, 2005; Krauth and Staab, 1993; Sato and Ishii,1991; Shimizu et al., 1996). However, these equations have limited use as they aregenerally obtained under very specific conditions and are based on a limited numberof operating parameters, whilst other parameters are disregarded. A mathematicalexpression linking MLSS concentration, EPS and TMP with specific cake resistance
74 The MBR Book
Table 2.9 Influence of shift in MLSS concentration (g/L) on MBR fouling
MLSS shift Details Reference(g/L)
Fouling increase0.09–3.7 Cake resistance: 21–54 1011/m and Chang and Kim (2005)
�: 18.5–0.7 108 m/kg2.4–9.6 Total resistance: 9–22 1011/m Fang and Shi (2005)7–18 Critical flux: 47–36 LMH (for SRT Han et al. (2005)
of 30–100 days)2.1–9.6 Critical flux: 13–8 LMH Bin et al. (2004)1–10 Critical flux: 75–35 LMH Madaeni et al. (1999)*2–15 “Limiting flux”: 105–50 LMH Cicek et al. (1998)*1.6–22 “Stabilized flux”: 65–25 LMH Beaubien et al. (1996)*
Fouling decrease3.5–10 Critical flux: �80, �60 LMH Defrance and Jaffrin (1999)*
No (or little) effect4.4–11.6 No impact between 4 and 8 g/L, Le-Clech et al. (2003c)
Slightly less fouling for 12 g/L4–15.1 Critical flux decreased from Bouhabila et al. (1998)
25 to 22 LMH3.6–8.4 Hong et al. (2002)
*sMBR
1856174817_Ch02.qxd 6/5/06 12:08 PM Page 74
has been proposed by Cho and co-workers (Cho et al., 2005a). In this study, specificresistance changed little at MLSS levels between 4 and 10 g/L at constant EPS andTMP. The experimental method used for adjusting MLSS concentration can signifi-cantly impact on biomass characteristics, since biomass solids levels can be raised bysedimentation coupled with decantation without acclimatization, yielding differentbiological characteristics (Cicek et al., 1999). MLSS concentration also impacts onremoval; an optimum concentration of 6 g/L has been identified based on the removalof COD (Ren et al., 2005) and phage (Wong et al., 2004).
The lack of a clear correlation between MLSS concentration and any specificfoulant characteristic(s) indicates that MLSS concentration alone is a poor indicatorof biomass fouling propensity. Some authors (Brookes et al., 2003b; Jefferson et al.,2004) have recommended using fundamental operating parameters such as HRTand SRT as foulant level indicators, supported by relatively stable foulant levels andcharacteristics under steady-state conditions. Current studies tend to point to non-settlable/colloidal organic substances, rather than MLSS concentration, asbeing primary indicators of fouling propensity in MBRs (Section 2.3.6.5).
Viscosity As with a conventional ASP, biomass viscosity closely relates to its con-centration (Section 2.2.5.3) and contributes to fouling (Yeom et al., 2004). Whilstviscosity has been reported to increase roughly exponentially with MLSS concentra-tion (Manem and Sanderson, 1996; Rosenberger et al., 1999, Fig. 2.19), a criticalMLSS concentration exists below which viscosity remains low and rises only slowlywith the concentration and above which the exponential relationship is observed(Itonaga et al., 2004). This critical value, generally between 10 and 17 g/L, depend-ing on feedwater quality and process operating conditions, also exists for CST: viscositycorrelations (Brookes et al., 2003a). MLSS viscosity impacts both on flux and air bub-ble size and can dampen lateral movement of HFs in immersed bundles (Wicaksanaet al., 2006).
Temperature Temperature impacts on membrane filtration through permeate vis-cosity (Mulder, 2000). A similar temperature correction can be applied as that usedfor kLa (Equation (2.15), Section 2.2.5.3) (Rautenbach and Albrecht, 1989):
(2.30)
where J is the flux at the process temperature T in °C. This correction is not compre-hensive, however, as has been demonstrated through normalisation of flux dataobtained at different temperatures (Jiang et al., 2005). The greater than expectednormalized resistance at lower temperatures has been explained by a number ofcontributing phenomena:
1. impacts of the viscosity of the sludge, rather than that of the permeate, whichincreases more significantly than permeate viscosity and reduces the shearstress generated by coarse bubbles as a result;
J J T� �20
201.025( )
Fundamentals 75
1856174817_Ch02.qxd 6/5/06 12:08 PM Page 75
2. intensified deflocculation at low temperatures, reducing floc size (Section2.3.6.4) and releasing EPS to the solution;
3. particle back transport velocity, which decreases linearly with temperatureaccording to Brownian diffusion;
4. biodegradation of COD, which decreases with temperature and results in ahigher concentration of unbiodegraded solute and particulate COD (Fawehinmiet al., 2004; Jiang et al., 2005).
All of these factors directly impact on membrane fouling and, as such, more extensivedeposition of foulant materials on the membrane surface is to be expected at lowertemperatures.
Higher operating temperatures can be maintained in anMBRs than in aerobic ones(Baek and Pagilla, 2003), and this both decreases viscosity and apparently lowers levels of SMP (Fawehinmi et al., 2004; Schiener et al., 1998). Higher temperatures, atleast within the mesophilic temperature range, also result in increased COD removal,as demonstrated with a conventional UASB (Singh and Virarghavan, 2003).
Dissolved oxygen The bioreactor DO concentration is controlled by the aerationrate (Section 2.2.5), which provides oxygen to the biomass, and is also used formembrane fouling control. DO impacts on MBR fouling through system biology, e.g. biofilm structure, SMP levels and floc size distribution (Lee et al., 2005). HigherDO levels generally provide better filterability, as manifested in filter cakes of lowerspecific resistance due to larger particles (Kang et al., 2003). Against this, someresearchers have noted a decrease with DO concentration in mixed liquor dissolvedCOD levels (Ji and Zhou, 2006). Moreover, the contribution of SMP concentration tomembrane filterability was found to be less than that of particle size and porosity(Kang et al., 2003). Ji and Zhou claimed aeration rate to directly control the quantityand composition of SMP, EPS and total polymeric substances in the biological flocsand ultimately the ratio of protein/carbohydrate deposited on the membrane surface.In a study of anoxic and aerobic sludge filterability, distinct carbohydrate structureswere observed and used to explain the different fouling rates obtained for the two sys-tems. The effect of oxygen limitation causing a lowering of the cell surface hydropho-bicity has been reported as another potential cause of MBR fouling (Jang et al.,2005a). Suspended air, on the other hand, does not appear to contribute significantlyto fouling ( Jang et al., 2004).
As the thickness of the biological fouling layer increases with extended MBR fil-tration, some biofilm regions have been observed to become anaerobic (Zhang et al.,2006), therefore impacting on membrane fouling differently to a wholly aerobicfilm. Endogenous decay, similar to that expected within the fouling layer, was simu-lated and revealed the foulant levels and, specifically, the carbonate fraction of theEPS (Section 2.3.6.5) to significantly increase. Since the transition between aerobicto anaerobic conditions appears to produce a large amount of EPS, this phenom-enon could also contribute to MBR fouling.
Foaming Foaming in activated sludge plants is caused by high SRTs, warm tempera-tures, low F:M ratios and high MLSS levels, as well as oil and grease and/or surfactants
76 The MBR Book
1856174817_Ch02.qxd 6/5/06 12:08 PM Page 76
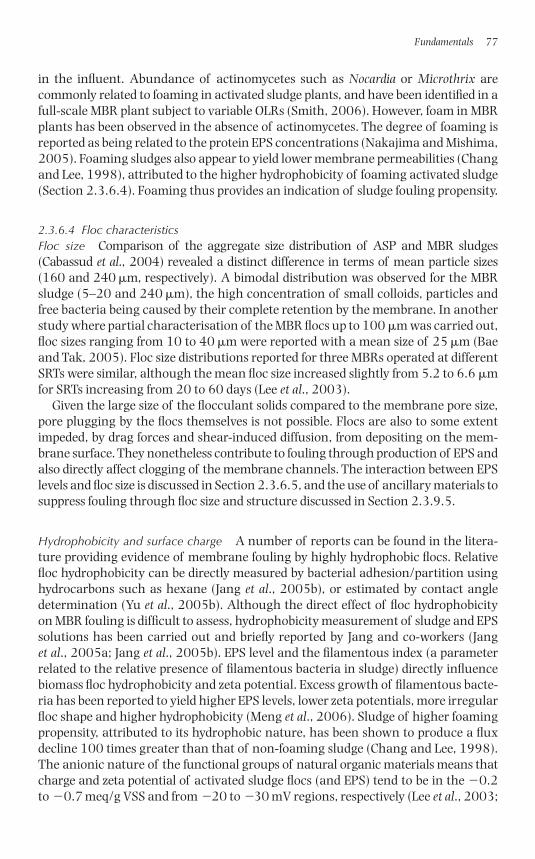
in the influent. Abundance of actinomycetes such as Nocardia or Microthrix arecommonly related to foaming in activated sludge plants, and have been identified in afull-scale MBR plant subject to variable OLRs (Smith, 2006). However, foam in MBRplants has been observed in the absence of actinomycetes. The degree of foaming isreported as being related to the protein EPS concentrations (Nakajima and Mishima,2005). Foaming sludges also appear to yield lower membrane permeabilities (Changand Lee, 1998), attributed to the higher hydrophobicity of foaming activated sludge(Section 2.3.6.4). Foaming thus provides an indication of sludge fouling propensity.
2.3.6.4 Floc characteristicsFloc size Comparison of the aggregate size distribution of ASP and MBR sludges(Cabassud et al., 2004) revealed a distinct difference in terms of mean particle sizes(160 and 240 �m, respectively). A bimodal distribution was observed for the MBRsludge (5–20 and 240 �m), the high concentration of small colloids, particles andfree bacteria being caused by their complete retention by the membrane. In anotherstudy where partial characterisation of the MBR flocs up to 100 �m was carried out,floc sizes ranging from 10 to 40 �m were reported with a mean size of 25 �m (Baeand Tak, 2005). Floc size distributions reported for three MBRs operated at differentSRTs were similar, although the mean floc size increased slightly from 5.2 to 6.6 �mfor SRTs increasing from 20 to 60 days (Lee et al., 2003).
Given the large size of the flocculant solids compared to the membrane pore size,pore plugging by the flocs themselves is not possible. Flocs are also to some extentimpeded, by drag forces and shear-induced diffusion, from depositing on the mem-brane surface. They nonetheless contribute to fouling through production of EPS andalso directly affect clogging of the membrane channels. The interaction between EPSlevels and floc size is discussed in Section 2.3.6.5, and the use of ancillary materials tosuppress fouling through floc size and structure discussed in Section 2.3.9.5.
Hydrophobicity and surface charge A number of reports can be found in the litera-ture providing evidence of membrane fouling by highly hydrophobic flocs. Relativefloc hydrophobicity can be directly measured by bacterial adhesion/partition usinghydrocarbons such as hexane (Jang et al., 2005b), or estimated by contact angledetermination (Yu et al., 2005b). Although the direct effect of floc hydrophobicityon MBR fouling is difficult to assess, hydrophobicity measurement of sludge and EPSsolutions has been carried out and briefly reported by Jang and co-workers (Janget al., 2005a; Jang et al., 2005b). EPS level and the filamentous index (a parameterrelated to the relative presence of filamentous bacteria in sludge) directly influencebiomass floc hydrophobicity and zeta potential. Excess growth of filamentous bacte-ria has been reported to yield higher EPS levels, lower zeta potentials, more irregularfloc shape and higher hydrophobicity (Meng et al., 2006). Sludge of higher foamingpropensity, attributed to its hydrophobic nature, has been shown to produce a fluxdecline 100 times greater than that of non-foaming sludge (Chang and Lee, 1998).The anionic nature of the functional groups of natural organic materials means thatcharge and zeta potential of activated sludge flocs (and EPS) tend to be in the �0.2to �0.7 meq/g VSS and from �20 to �30 mV regions, respectively (Lee et al., 2003;
Fundamentals 77
1856174817_Ch02.qxd 6/5/06 12:08 PM Page 77
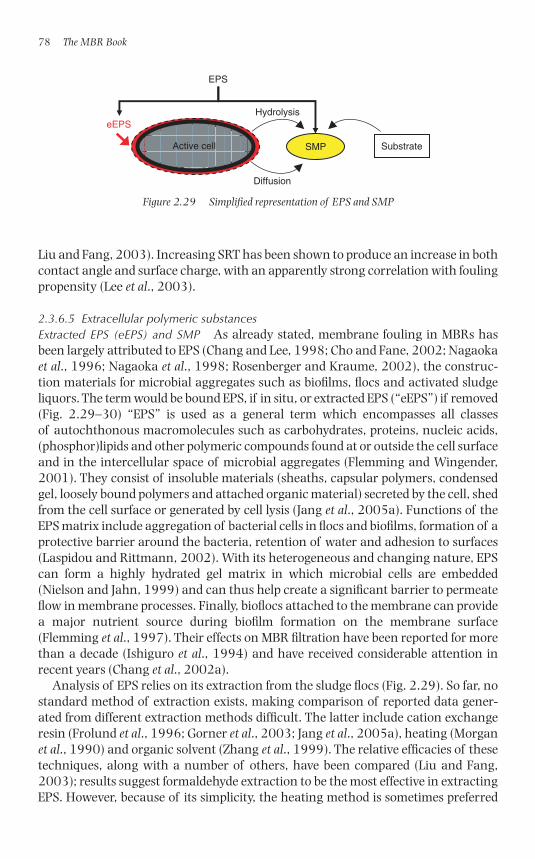
Liu and Fang, 2003). Increasing SRT has been shown to produce an increase in bothcontact angle and surface charge, with an apparently strong correlation with foulingpropensity (Lee et al., 2003).
2.3.6.5 Extracellular polymeric substancesExtracted EPS (eEPS) and SMP As already stated, membrane fouling in MBRs hasbeen largely attributed to EPS (Chang and Lee, 1998; Cho and Fane, 2002; Nagaokaet al., 1996; Nagaoka et al., 1998; Rosenberger and Kraume, 2002), the construc-tion materials for microbial aggregates such as biofilms, flocs and activated sludgeliquors. The term would be bound EPS, if in situ, or extracted EPS (“eEPS”) if removed(Fig. 2.29–30) “EPS” is used as a general term which encompasses all classes of autochthonous macromolecules such as carbohydrates, proteins, nucleic acids,(phosphor)lipids and other polymeric compounds found at or outside the cell surfaceand in the intercellular space of microbial aggregates (Flemming and Wingender,2001). They consist of insoluble materials (sheaths, capsular polymers, condensedgel, loosely bound polymers and attached organic material) secreted by the cell, shedfrom the cell surface or generated by cell lysis (Jang et al., 2005a). Functions of theEPS matrix include aggregation of bacterial cells in flocs and biofilms, formation of aprotective barrier around the bacteria, retention of water and adhesion to surfaces(Laspidou and Rittmann, 2002). With its heterogeneous and changing nature, EPScan form a highly hydrated gel matrix in which microbial cells are embedded(Nielson and Jahn, 1999) and can thus help create a significant barrier to permeateflow in membrane processes. Finally, bioflocs attached to the membrane can providea major nutrient source during biofilm formation on the membrane surface(Flemming et al., 1997). Their effects on MBR filtration have been reported for morethan a decade (Ishiguro et al., 1994) and have received considerable attention inrecent years (Chang et al., 2002a).
Analysis of EPS relies on its extraction from the sludge flocs (Fig. 2.29). So far, nostandard method of extraction exists, making comparison of reported data gener-ated from different extraction methods difficult. The latter include cation exchangeresin (Frolund et al., 1996; Gorner et al., 2003; Jang et al., 2005a), heating (Morganet al., 1990) and organic solvent (Zhang et al., 1999). The relative efficacies of thesetechniques, along with a number of others, have been compared (Liu and Fang,2003); results suggest formaldehyde extraction to be the most effective in extractingEPS. However, because of its simplicity, the heating method is sometimes preferred
78 The MBR Book
Active cell SMP
eEPS
Substrate
Diffusion
EPS
Hydrolysis
Figure 2.29 Simplified representation of EPS and SMP
1856174817_Ch02.qxd 6/5/06 12:08 PM Page 78
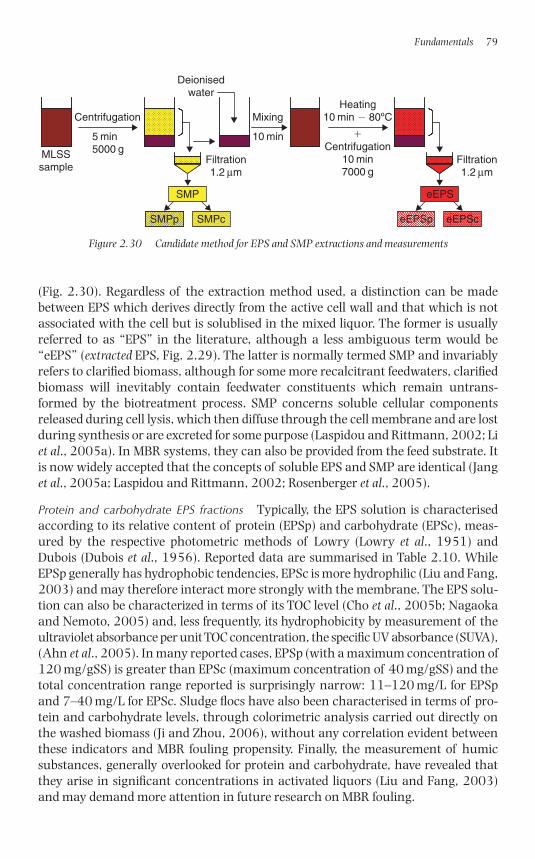
(Fig. 2.30). Regardless of the extraction method used, a distinction can be madebetween EPS which derives directly from the active cell wall and that which is notassociated with the cell but is solublised in the mixed liquor. The former is usuallyreferred to as “EPS” in the literature, although a less ambiguous term would be“eEPS” (extracted EPS, Fig. 2.29). The latter is normally termed SMP and invariablyrefers to clarified biomass, although for some more recalcitrant feedwaters, clarifiedbiomass will inevitably contain feedwater constituents which remain untrans-formed by the biotreatment process. SMP concerns soluble cellular componentsreleased during cell lysis, which then diffuse through the cell membrane and are lostduring synthesis or are excreted for some purpose (Laspidou and Rittmann, 2002; Liet al., 2005a). In MBR systems, they can also be provided from the feed substrate. Itis now widely accepted that the concepts of soluble EPS and SMP are identical (Janget al., 2005a; Laspidou and Rittmann, 2002; Rosenberger et al., 2005).
Protein and carbohydrate EPS fractions Typically, the EPS solution is characterisedaccording to its relative content of protein (EPSp) and carbohydrate (EPSc), meas-ured by the respective photometric methods of Lowry (Lowry et al., 1951) andDubois (Dubois et al., 1956). Reported data are summarised in Table 2.10. WhileEPSp generally has hydrophobic tendencies, EPSc is more hydrophilic (Liu and Fang,2003) and may therefore interact more strongly with the membrane. The EPS solu-tion can also be characterized in terms of its TOC level (Cho et al., 2005b; Nagaokaand Nemoto, 2005) and, less frequently, its hydrophobicity by measurement of theultraviolet absorbance per unit TOC concentration, the specific UV absorbance (SUVA),(Ahn et al., 2005). In many reported cases, EPSp (with a maximum concentration of120 mg/gSS) is greater than EPSc (maximum concentration of 40 mg/gSS) and thetotal concentration range reported is surprisingly narrow: 11–120 mg/L for EPSpand 7–40 mg/L for EPSc. Sludge flocs have also been characterised in terms of pro-tein and carbohydrate levels, through colorimetric analysis carried out directly onthe washed biomass (Ji and Zhou, 2006), without any correlation evident betweenthese indicators and MBR fouling propensity. Finally, the measurement of humicsubstances, generally overlooked for protein and carbohydrate, have revealed thatthey arise in significant concentrations in activated liquors (Liu and Fang, 2003)and may demand more attention in future research on MBR fouling.
Fundamentals 79
eEPSceEPSp
Centrifugation
MLSSsample
Heating10 min � 80ºCMixing
10 min
SMP eEPS
5 min5000 g
Deionisedwater
Filtration1.2 µm
Filtration1.2 µm
�Centrifugation
10 min7000 g
SMPcSMPp
Figure 2.30 Candidate method for EPS and SMP extractions and measurements
1856174817_Ch02.qxd 6/5/06 12:08 PM Page 79
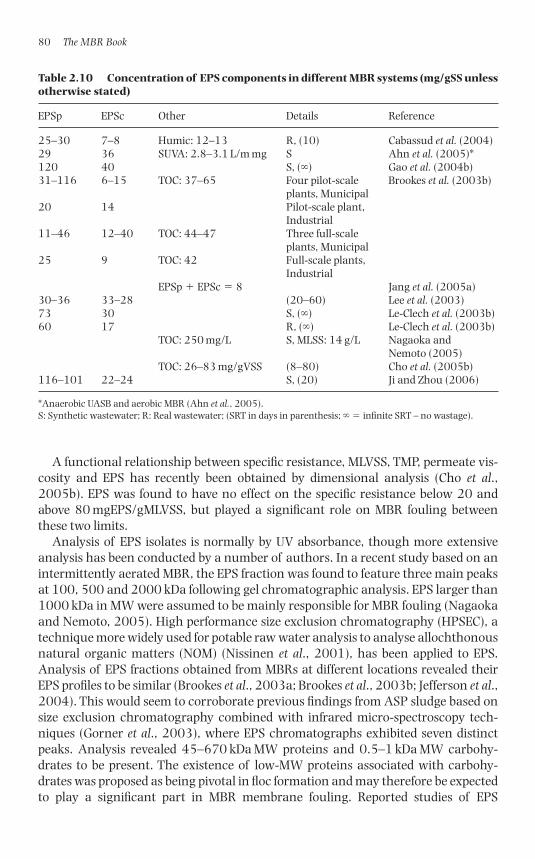
A functional relationship between specific resistance, MLVSS, TMP, permeate vis-cosity and EPS has recently been obtained by dimensional analysis (Cho et al.,2005b). EPS was found to have no effect on the specific resistance below 20 andabove 80 mgEPS/gMLVSS, but played a significant role on MBR fouling betweenthese two limits.
Analysis of EPS isolates is normally by UV absorbance, though more extensiveanalysis has been conducted by a number of authors. In a recent study based on anintermittently aerated MBR, the EPS fraction was found to feature three main peaksat 100, 500 and 2000 kDa following gel chromatographic analysis. EPS larger than1000 kDa in MW were assumed to be mainly responsible for MBR fouling (Nagaokaand Nemoto, 2005). High performance size exclusion chromatography (HPSEC), atechnique more widely used for potable raw water analysis to analyse allochthonousnatural organic matters (NOM) (Nissinen et al., 2001), has been applied to EPS.Analysis of EPS fractions obtained from MBRs at different locations revealed theirEPS profiles to be similar (Brookes et al., 2003a; Brookes et al., 2003b; Jefferson et al.,2004). This would seem to corroborate previous findings from ASP sludge based onsize exclusion chromatography combined with infrared micro-spectroscopy tech-niques (Gorner et al., 2003), where EPS chromatographs exhibited seven distinctpeaks. Analysis revealed 45–670 kDa MW proteins and 0.5–1 kDa MW carbohy-drates to be present. The existence of low-MW proteins associated with carbohy-drates was proposed as being pivotal in floc formation and may therefore be expectedto play a significant part in MBR membrane fouling. Reported studies of EPS
80 The MBR Book
Table 2.10 Concentration of EPS components in different MBR systems (mg/gSS unlessotherwise stated)
EPSp EPSc Other Details Reference
25–30 7–8 Humic: 12–13 R, (10) Cabassud et al. (2004)29 36 SUVA: 2.8–3.1 L/m mg S Ahn et al. (2005)*120 40 S, (�) Gao et al. (2004b)31–116 6–15 TOC: 37–65 Four pilot-scale Brookes et al. (2003b)
plants, Municipal20 14 Pilot-scale plant,
Industrial11–46 12–40 TOC: 44–47 Three full-scale
plants, Municipal25 9 TOC: 42 Full-scale plants,
IndustrialEPSp � EPSc � 8 Jang et al. (2005a)
30–36 33–28 (20–60) Lee et al. (2003)73 30 S, (�) Le-Clech et al. (2003b)60 17 R, (�) Le-Clech et al. (2003b)
TOC: 250 mg/L S, MLSS: 14 g/L Nagaoka and Nemoto (2005)
TOC: 26–83 mg/gVSS (8–80) Cho et al. (2005b)116–101 22–24 S, (20) Ji and Zhou (2006)
*Anaerobic UASB and aerobic MBR (Ahn et al., 2005).S: Synthetic wastewater; R: Real wastewater; (SRT in days in parenthesis; � � infinite SRT – no wastage).
1856174817_Ch02.qxd 6/5/06 12:08 PM Page 80
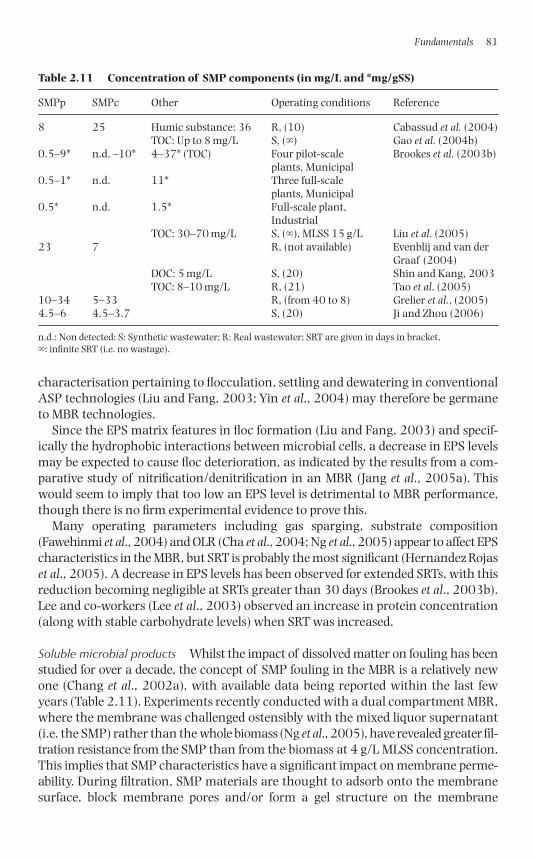
characterisation pertaining to flocculation, settling and dewatering in conventionalASP technologies (Liu and Fang, 2003; Yin et al., 2004) may therefore be germaneto MBR technologies.
Since the EPS matrix features in floc formation (Liu and Fang, 2003) and specif-ically the hydrophobic interactions between microbial cells, a decrease in EPS levelsmay be expected to cause floc deterioration, as indicated by the results from a com-parative study of nitrification/denitrification in an MBR (Jang et al., 2005a). Thiswould seem to imply that too low an EPS level is detrimental to MBR performance,though there is no firm experimental evidence to prove this.
Many operating parameters including gas sparging, substrate composition(Fawehinmi et al., 2004) and OLR (Cha et al., 2004; Ng et al., 2005) appear to affect EPScharacteristics in the MBR, but SRT is probably the most significant (Hernandez Rojaset al., 2005). A decrease in EPS levels has been observed for extended SRTs, with thisreduction becoming negligible at SRTs greater than 30 days (Brookes et al., 2003b).Lee and co-workers (Lee et al., 2003) observed an increase in protein concentration(along with stable carbohydrate levels) when SRT was increased.
Soluble microbial products Whilst the impact of dissolved matter on fouling has beenstudied for over a decade, the concept of SMP fouling in the MBR is a relatively newone (Chang et al., 2002a), with available data being reported within the last fewyears (Table 2.11). Experiments recently conducted with a dual compartment MBR,where the membrane was challenged ostensibly with the mixed liquor supernatant(i.e. the SMP) rather than the whole biomass (Ng et al., 2005), have revealed greater fil-tration resistance from the SMP than from the biomass at 4 g/L MLSS concentration.This implies that SMP characteristics have a significant impact on membrane perme-ability. During filtration, SMP materials are thought to adsorb onto the membranesurface, block membrane pores and/or form a gel structure on the membrane
Fundamentals 81
Table 2.11 Concentration of SMP components (in mg/L and *mg/gSS)
SMPp SMPc Other Operating conditions Reference
8 25 Humic substance: 36 R, (10) Cabassud et al. (2004)TOC: Up to 8 mg/L S, (�) Gao et al. (2004b)
0.5–9* n.d. –10* 4–37* (TOC) Four pilot-scale Brookes et al. (2003b)plants, Municipal
0.5–1* n.d. 11* Three full-scale plants, Municipal
0.5* n.d. 1.5* Full-scale plant, Industrial
TOC: 30–70 mg/L S, (�), MLSS 15 g/L Liu et al. (2005)23 7 R, (not available) Evenblij and van der
Graaf (2004)DOC: 5 mg/L S, (20) Shin and Kang, 2003TOC: 8–10 mg/L R, (21) Tao et al. (2005)
10–34 5–33 R, (from 40 to 8) Grelier et al., (2005)4.5–6 4.5–3.7 S, (20) Ji and Zhou (2006)
n.d.: Non detected; S: Synthetic wastewater; R: Real wastewater; SRT are given in days in bracket, �: infinite SRT (i.e. no wastage).
1856174817_Ch02.qxd 6/5/06 12:08 PM Page 81
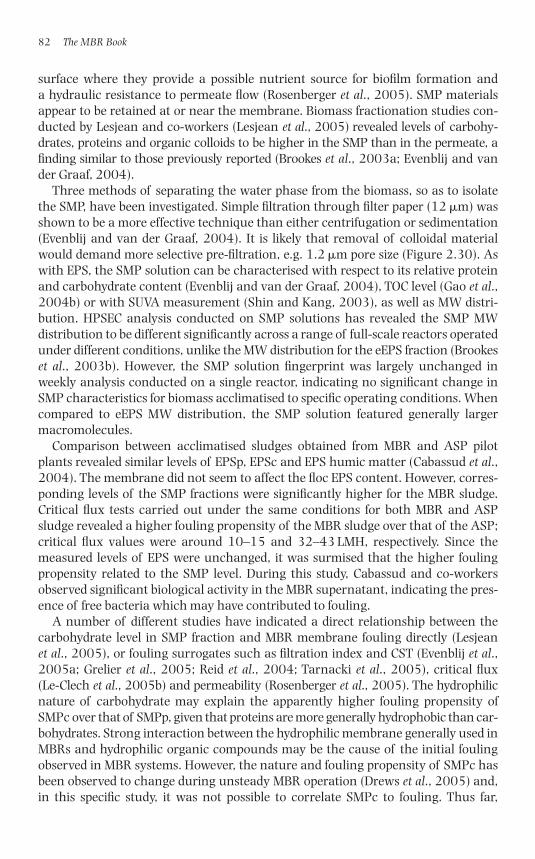
surface where they provide a possible nutrient source for biofilm formation and a hydraulic resistance to permeate flow (Rosenberger et al., 2005). SMP materialsappear to be retained at or near the membrane. Biomass fractionation studies con-ducted by Lesjean and co-workers (Lesjean et al., 2005) revealed levels of carbohy-drates, proteins and organic colloids to be higher in the SMP than in the permeate, afinding similar to those previously reported (Brookes et al., 2003a; Evenblij and vander Graaf, 2004).
Three methods of separating the water phase from the biomass, so as to isolatethe SMP, have been investigated. Simple filtration through filter paper (12 �m) wasshown to be a more effective technique than either centrifugation or sedimentation(Evenblij and van der Graaf, 2004). It is likely that removal of colloidal materialwould demand more selective pre-filtration, e.g. 1.2 �m pore size (Figure 2.30). Aswith EPS, the SMP solution can be characterised with respect to its relative proteinand carbohydrate content (Evenblij and van der Graaf, 2004), TOC level (Gao et al.,2004b) or with SUVA measurement (Shin and Kang, 2003), as well as MW distri-bution. HPSEC analysis conducted on SMP solutions has revealed the SMP MW distribution to be different significantly across a range of full-scale reactors operatedunder different conditions, unlike the MW distribution for the eEPS fraction (Brookeset al., 2003b). However, the SMP solution fingerprint was largely unchanged inweekly analysis conducted on a single reactor, indicating no significant change inSMP characteristics for biomass acclimatised to specific operating conditions. Whencompared to eEPS MW distribution, the SMP solution featured generally largermacromolecules.
Comparison between acclimatised sludges obtained from MBR and ASP pilotplants revealed similar levels of EPSp, EPSc and EPS humic matter (Cabassud et al.,2004). The membrane did not seem to affect the floc EPS content. However, corres-ponding levels of the SMP fractions were significantly higher for the MBR sludge.Critical flux tests carried out under the same conditions for both MBR and ASPsludge revealed a higher fouling propensity of the MBR sludge over that of the ASP;critical flux values were around 10–15 and 32–43 LMH, respectively. Since themeasured levels of EPS were unchanged, it was surmised that the higher foulingpropensity related to the SMP level. During this study, Cabassud and co-workersobserved significant biological activity in the MBR supernatant, indicating the pres-ence of free bacteria which may have contributed to fouling.
A number of different studies have indicated a direct relationship between thecarbohydrate level in SMP fraction and MBR membrane fouling directly (Lesjean et al., 2005), or fouling surrogates such as filtration index and CST (Evenblij et al.,2005a; Grelier et al., 2005; Reid et al., 2004; Tarnacki et al., 2005), critical flux (Le-Clech et al., 2005b) and permeability (Rosenberger et al., 2005). The hydrophilicnature of carbohydrate may explain the apparently higher fouling propensity ofSMPc over that of SMPp, given that proteins are more generally hydrophobic than car-bohydrates. Strong interaction between the hydrophilic membrane generally used inMBRs and hydrophilic organic compounds may be the cause of the initial foulingobserved in MBR systems. However, the nature and fouling propensity of SMPc hasbeen observed to change during unsteady MBR operation (Drews et al., 2005) and,in this specific study, it was not possible to correlate SMPc to fouling. Thus far,
82 The MBR Book
1856174817_Ch02.qxd 6/5/06 12:08 PM Page 82
correlation of MBR membrane fouling with SMP protein has not been widely reportedalthough, since a significant amount of protein is retained by the membrane – from15%, according to Evenblij and van der Graaf (2004), to 90% (Drews et al., 2005) – itmust be presumed that such materials have a role in fouling. It was recently reportedthat the specific resistance increased by a factor of 10 when the SMPp increased from30 to 100 mg/L (Hernandez Rojas et al., 2005). Against this, analysis of the foulinglayer has revealed higher levels of carbohydrate and lower protein concentrationscompared to those in the mixed liquor (Chu and Li, 2005; Zhang et al., 2006), tend-ing to reinforce the notion that SMPc is more significant than SMPp in MBR mem-brane fouling. Humic matter, on the other hand, may not significantly contribute tofouling due to the generally lower MW of these materials (Drews et al., 2005).
Many research studies have been based on synthetic/analogue wastewaters. Thoseanalogues comprising the most basic constituents, such as glucose, are very biodegrad-able and, as such, would be expected to yield rather lower SMP levels than those aris-ing in real systems. Since it may be assumed that there are almost no substrateresiduals from glucose in the supernatant, the less biodegradable SMP induced by celllysis or cell release would account for most of the supernatant EPS measured in suchanalogue-based studies and may explain the reduced influence of SMP comparedwith that of EPS reported in some of these studies (Cho et al., 2005b). SUVA meas-urements carried out on MBR mixed liquor supernatant has confirmed the presenceof organic matter originating from the decayed biomass and of larger MW andgreater aromaticity and hydrophobicity than that of the analogue wastewater feed(Shin and Kang, 2003). This would seem to confirm that fouling materials are gener-ated by biological action and arise as SMP, though once again the chemical nature ofthese products is obviously affected by the chemical nature of the feed.
In another important study based on synthetic wastewater, Lee et al. (2001a)revealed that levels of soluble organic matter in isolation cannot be used to predictMBR fouling. By comparing filterabilities of attached and suspended growth micro-organisms, Lee and co-workers observed the rate of membrane fouling of theattached growth system (0.1 g/L MLSS and 2 g/L attached biomass) to be about 7 timeshigher than that of a conventional suspended growth MBR at 3 g/L MLSS. With similarsoluble fraction characteristics in both reactors, it was concluded that the discrepancyarose from the formation of a protective dynamic membrane created by suspendedsolids in the suspended growth system, a conclusion subsequently corroborated bythe work of Ng et al. (2005).
As expected, many operating parameters affect SMP levels in MBRs. As for EPS,SMP levels decrease with increasing SRT (Brookes et al., 2003b). For SRTs rangingfrom 4 to 22 days, SMPp and SMPc levels have been reported to decrease by factorsof 3 and 6, respectively (Grelier et al., 2005).
2.3.6.6 Anaerobic systemsStudies have generally shown the membrane permeability to decline with MLSS fora number of different anaerobic matrices, including synthetic sewage (Stuckey andHu, 2003), digested sludge (Saw et al., 1986) and distillery wastewater (Kitamura et al.,1996). Specific resistance has been shown to increase linearly with normalised EPSlevels between 20 to 130 mg/SSg (Fawehinmi et al., 2004). It is recognised that it is
Fundamentals 83
1856174817_Ch02.qxd 6/5/06 12:08 PM Page 83
the colloidal material which is mainly responsible for fouling in an anMBR (Choo andLee, 1996b, 1998), as has been shown in aerobic MBRs, and the colloid concentrationis higher in anaerobic than aerobic systems. As with all membrane systems, col-loidal matter is transported more slowly back into the bulk solution than coarserparticulate materials due to the lower diffusion rates (Choo and Lee, 1998), whichmeans they tend to collect at the membrane surface and form a low-permeabilityfouling layer. They are also of a size which can plug the membrane pores, particu-larly for the larger pores of microfiltration membranes, if able to migrate into themembrane.
Whilst far less characterisation of foulants has been conducted for anaerobicMBRs than for aerobic systems, reported trends tend to suggest that it is the colloidalcomponent of the SMP fraction which is the dominant component in membranefouling. The nature and concentration of the SMP in the anaerobic mixed liquor isdependent on the feedwater, the concentration being a function of the feedwaterCOD (Barker and Stuckey, 2001). However, it is generally higher in organic concen-tration than the SMP from aerobic systems and less anaerobically than aerobicallybiodegradable (Barker et al., 2000). Also, SMP composition changes as a result of per-meation (Stuckey, 2003), implying that some SMP components are adsorbed onto themembrane. SMP levels also appear to increase with increasing HRTs in conventionalsystems (Barker et al., 2000), attributable to more extensive biomass decay to colloidaland soluble products. Levels may also increase with decreasing loading rate, sinceanMBR membrane permeability appears to increase with this parameter (Kayawakeet al., 1991) at low-intermediate loading rate values – 1.5–10 cf. �1.5 kg/(m3/day)(Hernández et al., 2002). The negative impact of lower temperatures (Section 2.2.7.2)may also be a reflection of slower biodegradation of fouling constituents of the SMPfraction (Barker et al., 2000).
The use of supplementary dosing with PAC to ameliorate fouling has been extensivelystudied in membrane filtration of potable water and in aerobic MBRs, and such studieshave also been conducted on anMBRs (Park et al., 1999). It has been suggested (Chooand Lee, 1996b) that the addition of an adsorbent or a coagulant can enhance thepermeate flux by agglomerating colloids to form larger particles of lower foulingpropensity. The coarser and more rigid particles additionally improve scouring of themembrane surface. Dosing of anMBRs with ion-exchange resin has also been studied(Imasaka et al., 1989), with beneficial effects noted only at very high concentrationsof 5 wt%.
2.3.7 Operation
2.3.7.1 Membrane aeration or gas scouringAerobic systems Aeration is arguably the most important parameter in the designand operation of an MBR. As already stated, aeration is required for biotreatment(Section 2.2.5), floc agitation and membrane scouring (Dufresne et al., 1997) and it is not necessarily essential or desirable to employ the same aerator for both duties.Ostensibly, air is used to lift the mixed liquor through the membrane modulechannels. However, the gas bubbles additionally enhance membrane permeation
84 The MBR Book
1856174817_Ch02.qxd 6/5/06 12:08 PM Page 84
(Cui et al., 2003) by inducing liquid flow fluctuations and local tangential sheartransients, the shear rate � (/s) being given by:
(2.31)
where UL is the liquid CFV (m/s), � is the separation (m) and is a constant depend-ing on the membrane geometry. The effect is to increase back transport and promotemass transfer of liquid through the membrane (Section 2.1.4.4). Tangential shearat the membrane surface prevents large particle deposition on the membrane sur-face. However, since it is proportional to the cube of particle diameter, lateral migra-tion velocity for smaller particles is much less, leading to more severe membranefouling by fine materials (Choo and Lee, 1998).
It has long been recognised through studies of model systems (Cabassud et al.,1997; Ghosh and Cui, 1999; Cui and Wright, 1994; Mercier et al., 1997) as well asMBRs themselves(Le-Clech et al., 2003a, b) that gas bubbles (or “slugs”) passing upthrough a tubular membrane are able to enhance the flux over that attainable fromliquid crossflow at the same velocity. This type of two-phase air–liquid flow is termed“slug flow” (Fig. 2.31) and represents the most effective type of air–liquid flow forpromoting flux. Much work has been conducted, principally by Cui and his variousco-workers, to model membrane aeration in channel flow. Thus far, models havebeen produced which describe the spatial variation of shear with time for rising bubbles as a function of bubble (or slug) size, channel dimension and geometry forNewtonian fluids. It is also possible, within certain boundary conditions, to relate �to the flux, J, from first principles, provided assumptions can be made about the par-ticle size and concentration, the system hydrodynamics and the fluid and membranehomogeneity. Such assumptions, however, are not pertinent to an iMBR wherethree-phase flow prevails in a highly heterogeneous non-Newtonian fluid contain-ing solutes, colloids and particulates. Moreover, the system becomes yet more com-plicated when the geometry deviates from well-defined channels, as provided by FSor tubular configurations, to HF modules.
Aeration also affects HF iMBR performance by causing fibre lateral movement (orsway) (Côté et al., 1998; Wicaksana et al., 2006), which imparts shear at the membranesurface through the relative motion of the membrane and the surrounding liquid.
gk
d�
UL
Fundamentals 85
Increasing air flow
Slug flowBubble flow Churn flow Annular flow Mist flow
Figure 2.31 Air–liquid flow regimes in a cylindrical channel (Judd et al., 2001)
1856174817_Ch02.qxd 6/5/06 12:08 PM Page 85
In the case of HFs, effective distribution of air over the whole element cross-sectionand length becomes particularly challenging. For MT membrane modules in partic-ular, provided an air bubble of diameter greater than that of the tube diameter isintroduced into the tube, then air scouring of the entire membrane surface isassured. This is not necessarily the case for the FS and HF configurations, and HFsystems additionally provide no fixed channel for the air bubble to travel up; thisappears to impact on membrane permeability. On the other hand, experimentalstudies and heuristic investigations reveal FS systems to generally demand higheraeration rates than HF systems to sustain higher membrane permeabilities, and thisis reflected in aeration demand data from pilot-scale studies and full-scale operatingplant (Section 3.3.1.1). Some HF systems are operated with intermittent aeration,lowering the aeration demand further, and aeration demand may also be lowered bystacking the membrane modules such that the same volume of air is passed overtwice the membrane area.
A number of authors (Le-Clech et al., 2003c; Liu et al., 2003; Psoch and Schiewer,2005b; Ueda et al., 1997) have demonstrated that flux increases roughly linearlywith aeration rate up to a threshold value beyond which no further increase in per-meability takes place. It follows that operation is sub-optimal if the aeration rate,and specifically the approach velocity, exceeds this threshold value. Intense aerationmay also damage the floc structure, reducing floc size and releasing EPS in the biore-actor (Ji and Zhou, 2006; Park et al., 2005b) in the same way as has been reportedfor CFV in sMBRs (Section 2.3.1). Given that aeration lifts the sludge through themodule, a relationship must exist between gas and liquid velocity (UG and UL),respectively. Determination of UL induced by aeration can be difficult; techniquessuch as electromagnetic flow velocimetry (Sofia et al., 2004), particle imagevelocimetry (Yeo and Fane, 2004), and constant temperature anemometry(Le-Clech et al., 2006), have all been used for liquid velocity estimation in iMBRs.Based on short-term critical flux tests, a direct comparison between immersed andsMBRs showed that similar fouling behaviour was obtained when the two configu-rations were respectively operated at a superficial gas velocity (UG) of 0.07�0.11 m/s and CFV of 0.25–0.55 m/s (Le-Clech et al., 2005b). An increase of UG inthe iMBR was also found to have more effect in fouling removal than a similar rise ofCFV in the sidestream configuration.
In practice, much development of commercial systems has been focused onreducing aeration whilst maintaining membrane permeability, since membrane aeration contributes significantly to energy demand (though not generally as muchas biochemical aeration demand). A key parameter is thus the specific aerationdemand (SAD), either with respect to membrane area (SADm in Nm3 air/(h m2)) orpermeate volume (SADp Nm3 air/m3 permeate). The latter is a useful unitless indi-cator of aeration efficiency, and values for this parameter, which can range between10 and 100, are now often quoted by the membrane suppliers. Further discussion of specific aeration demand is provided in Chapter 3 and values from case studiesincluded in Chapter 5.
Anaerobic and anoxic systems Gas sparging to maintain a high membrane perme-ability, as used in immersed aerobic systems, is more problematic in anMBRs since
86 The MBR Book
1856174817_Ch02.qxd 6/5/06 12:08 PM Page 86
air cannot be used routinely. Air sparging has been shown to be effective in an MBRs(Lee et al., 2001c) but the duration of air sparging was necessarily brief in this study(5 s every 10 min), providing little permeability promotion overall. Sparging withhead space gas has been shown to be effective for immersed polymeric (Fawehinmiet al., 2004; Stuckey and Hu, 2003) and sidestream ceramic (Kayawake et al., 1991)membranes. As with the aerobic MBRs described above, a maximum permeabilitywas reached at a certain gas flow rate (Imasaka et al., 1989; Stuckey and Hu, 2003).
In common with all membrane processes (Section 2.1.4.5), increasing crossflowincreases flux in sidestream anMBRs by suppressing the fouling layer concentrationpolarisation (Grethlein, 1978; Imasaka et al., 1989; Saw et al., 1986). However, aplateau has been reported at Reynolds numbers beyond 2000-or-so where no furtherincrease in permeability takes place (Choo and Lee, 1998; Choo et al., 2000; Elmalehand Abdelmoumni, 1997, 1998). For ceramic membranes, where the fouling layer isminimal, high crossflows have been reported as having a detrimental effect because thethinning cake layer offers less protection against internal fouling (Choo and Lee, 1998;Choo et al., 2000; Kang, 1996). Elmaleh and Abdelmoumni (1997) have reported closeto zero fouling for crossflows above 3 m/s in an MT organic membrane module side-stream anMBR, with flux increasing linearly with shear stress up to this point. Baffleswere shown by these authors to increase flux by promoting shear, the effect being great-est in the transition region between laminar and turbulent flow. However, the increasein flux attained by these measures is normally at the expense of a punitive increase inenergy demand (Bourgeous et al., 2001) and non-uniform, and thus sub-optimal, TMPdistribution (Lee et al., 1999). High-shear operation might also be expected to impactnegatively on floc size and biomass bioactivity (Brockmann and Seyfried, 1996; Chooand Lee, 1998; Ghyoot and Verstraete, 1997) with, at the highest shears, cell lysis tak-ing place, though it has been concluded by Elmaleh and Abdelmoumni (1997) thatsuch effects are less severe for anaerobic than aerobic biomass.
Reports of operation at different TMPs indicate that, as with most membrane sep-aration processes, membrane resistance determines flux at low TMPs, with no impactof crossflow or MLSS concentration above 2.5 g/L (Beaubien et al., 1996). At higherTMPs, crossflow (and thus surface shear) becomes important (Beaubien et al., 1996;Zhang et al., 2004), the flux increasing linearly with CFV (Beaubien et al., 1996), theslope decreasing with increasing MLSS partly due to viscosity effects. At very highTMPs, permeate flux has been shown to decrease with increasing TMP due to com-paction of the fouling layer (Elmaleh and Abdelmoumni, 1997). However, this effectappears to depend on the membrane filter; Saw et al. (1986), filtering anerobicsludge, observed that at very high TMPs the permeate flux decreased with TMP for anMF membrane but was constant for an 8–20 kDa MWCO UF membrane. The authorssuggested that this was due to the impact of the membrane substrate on the foulinglayer structure, but a more likely explanation is migration of fines through the cake athigher TMPs into the more porous MF membrane, causing pore plugging (Beaubienet al., 1996).
The use of extended intermittent aeration has been reported for nitrification–denitrification MBR systems (Nagaoka and Nemoto, 2005; Yeom et al., 1999). In thisless common scenario, a single tank was used for both anoxic and aerobic biologicaldegradation. Filtration was carried out in only the aerobic phase to take advantage
Fundamentals 87
1856174817_Ch02.qxd 6/5/06 12:08 PM Page 87
of the anti-fouling properties of the air scouring, since severe fouling has beenreported when aeration ceases (Jiang et al., 2005; Psoch and Schiewer, 2005b).
2.3.7.2 Solid retention time (SRT)SRT impacts on fouling propensity through MLSS concentration, which increaseswith increasing SRT, and in doing so reduces the F:M ratio (Equation (2.11)) and soalters the biomass characteristics. Extremely low SRTs of �2 days have been shownto increase the fouling rate almost 10 times over that measured at 10 days, with theF:M ratio correspondingly increasing from 0.5 to 2.4 g COD/(g VSS/day) and the MLSSincreasing only slightly from 1.5 to 1.2 g/L ( Jang et al., 2005b). In practice, the F:Mratio is generally maintained at below 0.2/day.
Operation at long SRTs minimises excess sludge production but the increase inMLSS level which inevitably takes place presents problems of clogging of membranechannels, particularly by inert matter such as hair, lint and cellulosic matter(Le-Clech et al., 2005a), membrane fouling and reduced aeration efficiency, as mani-fested in the �-factor (Fig. 2.19). Even after increasing membrane aeration by 67%,fouling of an HF sMBR has been reported to almost double on increasing the SRTfrom 30 to 100 days, producing a corresponding increase in MLSS levels from 7 to18 g/L and a decrease in F:M ratio from 0.15 to 0.05 kg COD/kg MLSS/day (Han et al.,2005). At infinite SRT, most of the substrate is consumed to ensure the maintenanceneeds and the synthesis of storage products. The very low apparent net biomass gen-eration observed can also explain the low fouling propensity observed for high SRToperation (Orantes et al., 2004). In such cases sludge production is close to zero.
Scientific studies indicate that SRT is a key parameter in determining foulingpropensity through MLSS and EPS fraction concentrations. On this basis, an opti-mum SRT can be envisaged where foulant concentrations, in particular in the SMPfraction, are minimised whilst oxygen transfer efficiency remains sufficiently highand membrane clogging at a controllable level. In practice, SRT tends not to be rig-orously controlled. Moreover, SRT probably has less of an impact on fouling thanfeedwater quality and fluctuations therein.
2.3.7.3 Unsteady-state operationUnsteady-state operation arising from such things as variations in feedwater quality(and so organic load), feedwater and/or permeate flow rate (and hence hydraulicload) and aeration rate are all known to impact on MBR membrane fouling propen-sity, along with other dynamic effects (Table 2.12). In an experiment carried outwith a large pilot-scale MBR in which the effects of unstable flow and sludge wastagewere assessed (Drews et al., 2005), it was established that the level of carbohydratein the supernatant before and after each sludge withdrawal increased. Whilst theincrease following wastage was thought to be due to the sudden stress experiencedby cells due to biomass dilution (which in extreme cases is known to lead to foamingin full-scale plant), increase before sludge withdrawal was attributed to the highMLSS concentration and the resulting low DO level in the bioreactor. It was con-cluded that unsteady-state operation changed the nature and/or structure (andfouling propensity) of the carbohydrate rather than the overall EPS formation. Thesefindings corroborated results previously reported on effects of transient conditions
88 The MBR Book
1856174817_Ch02.qxd 6/5/06 12:08 PM Page 88
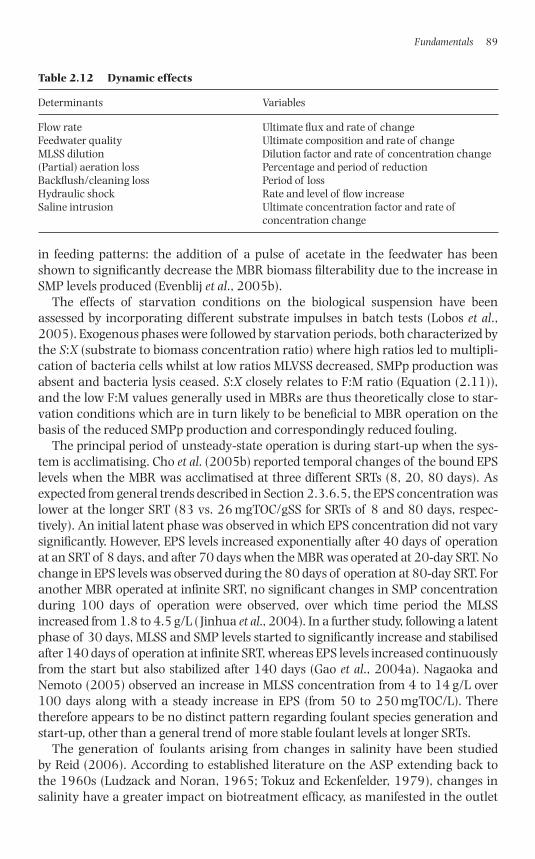
in feeding patterns: the addition of a pulse of acetate in the feedwater has beenshown to significantly decrease the MBR biomass filterability due to the increase inSMP levels produced (Evenblij et al., 2005b).
The effects of starvation conditions on the biological suspension have beenassessed by incorporating different substrate impulses in batch tests (Lobos et al.,2005). Exogenous phases were followed by starvation periods, both characterized bythe S:X (substrate to biomass concentration ratio) where high ratios led to multipli-cation of bacteria cells whilst at low ratios MLVSS decreased, SMPp production wasabsent and bacteria lysis ceased. S:X closely relates to F:M ratio (Equation (2.11)),and the low F:M values generally used in MBRs are thus theoretically close to star-vation conditions which are in turn likely to be beneficial to MBR operation on thebasis of the reduced SMPp production and correspondingly reduced fouling.
The principal period of unsteady-state operation is during start-up when the sys-tem is acclimatising. Cho et al. (2005b) reported temporal changes of the bound EPSlevels when the MBR was acclimatised at three different SRTs (8, 20, 80 days). Asexpected from general trends described in Section 2.3.6.5, the EPS concentration waslower at the longer SRT (83 vs. 26 mgTOC/gSS for SRTs of 8 and 80 days, respec-tively). An initial latent phase was observed in which EPS concentration did not varysignificantly. However, EPS levels increased exponentially after 40 days of operationat an SRT of 8 days, and after 70 days when the MBR was operated at 20-day SRT. Nochange in EPS levels was observed during the 80 days of operation at 80-day SRT. Foranother MBR operated at infinite SRT, no significant changes in SMP concentrationduring 100 days of operation were observed, over which time period the MLSSincreased from 1.8 to 4.5 g/L ( Jinhua et al., 2004). In a further study, following a latentphase of 30 days, MLSS and SMP levels started to significantly increase and stabilisedafter 140 days of operation at infinite SRT, whereas EPS levels increased continuouslyfrom the start but also stabilized after 140 days (Gao et al., 2004a). Nagaoka andNemoto (2005) observed an increase in MLSS concentration from 4 to 14 g/L over100 days along with a steady increase in EPS (from 50 to 250 mgTOC/L). Theretherefore appears to be no distinct pattern regarding foulant species generation andstart-up, other than a general trend of more stable foulant levels at longer SRTs.
The generation of foulants arising from changes in salinity have been studied by Reid (2006). According to established literature on the ASP extending back to the 1960s (Ludzack and Noran, 1965; Tokuz and Eckenfelder, 1979), changes insalinity have a greater impact on biotreatment efficacy, as manifested in the outlet
Fundamentals 89
Table 2.12 Dynamic effects
Determinants Variables
Flow rate Ultimate flux and rate of changeFeedwater quality Ultimate composition and rate of changeMLSS dilution Dilution factor and rate of concentration change(Partial) aeration loss Percentage and period of reductionBackflush/cleaning loss Period of lossHydraulic shock Rate and level of flow increaseSaline intrusion Ultimate concentration factor and rate of
concentration change
1856174817_Ch02.qxd 6/5/06 12:08 PM Page 89
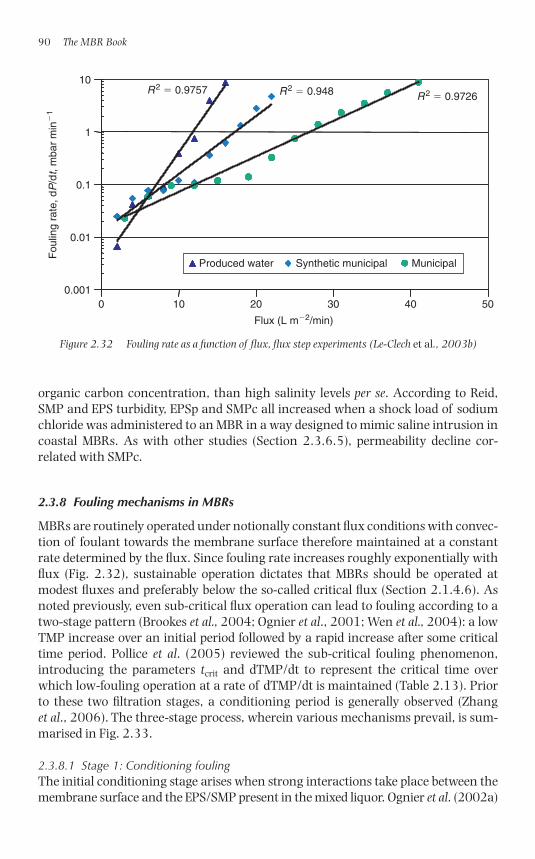
organic carbon concentration, than high salinity levels per se. According to Reid,SMP and EPS turbidity, EPSp and SMPc all increased when a shock load of sodiumchloride was administered to an MBR in a way designed to mimic saline intrusion incoastal MBRs. As with other studies (Section 2.3.6.5), permeability decline cor-related with SMPc.
2.3.8 Fouling mechanisms in MBRs
MBRs are routinely operated under notionally constant flux conditions with convec-tion of foulant towards the membrane surface therefore maintained at a constantrate determined by the flux. Since fouling rate increases roughly exponentially withflux (Fig. 2.32), sustainable operation dictates that MBRs should be operated atmodest fluxes and preferably below the so-called critical flux (Section 2.1.4.6). Asnoted previously, even sub-critical flux operation can lead to fouling according to atwo-stage pattern (Brookes et al., 2004; Ognier et al., 2001; Wen et al., 2004): a lowTMP increase over an initial period followed by a rapid increase after some criticaltime period. Pollice et al. (2005) reviewed the sub-critical fouling phenomenon,introducing the parameters tcrit and dTMP/dt to represent the critical time overwhich low-fouling operation at a rate of dTMP/dt is maintained (Table 2.13). Priorto these two filtration stages, a conditioning period is generally observed (Zhang et al., 2006). The three-stage process, wherein various mechanisms prevail, is sum-marised in Fig. 2.33.
2.3.8.1 Stage 1: Conditioning foulingThe initial conditioning stage arises when strong interactions take place between themembrane surface and the EPS/SMP present in the mixed liquor. Ognier et al. (2002a)
90 The MBR Book
0.001
0.01
0.1
1
10
0 10 20 30 40 50
Fou
ling
rate
, dP
/dt,
mba
r m
in�
1
Flux (L m�2/min)
R2 � 0.9726R2 � 0.948R2 � 0.9757
MunicipalSynthetic municipalProduced water
Figure 2.32 Fouling rate as a function of flux, flux step experiments (Le-Clech et al., 2003b)
1856174817_Ch02.qxd 6/5/06 12:08 PM Page 90
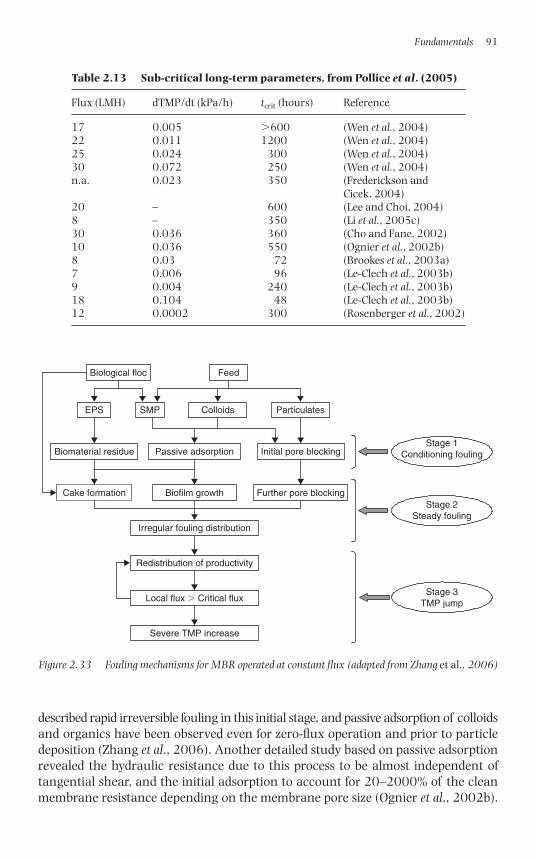
described rapid irreversible fouling in this initial stage, and passive adsorption of colloidsand organics have been observed even for zero-flux operation and prior to particledeposition (Zhang et al., 2006). Another detailed study based on passive adsorptionrevealed the hydraulic resistance due to this process to be almost independent oftangential shear, and the initial adsorption to account for 20–2000% of the cleanmembrane resistance depending on the membrane pore size (Ognier et al., 2002b).
Fundamentals 91
Table 2.13 Sub-critical long-term parameters, from Pollice et al. (2005)
Flux (LMH) dTMP/dt (kPa/h) tcrit (hours) Reference
17 0.005 �600 (Wen et al., 2004)22 0.011 1200 (Wen et al., 2004)25 0.024 300 (Wen et al., 2004)30 0.072 250 (Wen et al., 2004)n.a. 0.023 350 (Frederickson and
Cicek, 2004)20 – 600 (Lee and Choi, 2004)8 – 350 (Li et al., 2005c)30 0.036 360 (Cho and Fane, 2002)10 0.036 550 (Ognier et al., 2002b)8 0.03 72 (Brookes et al., 2003a)7 0.006 96 (Le-Clech et al., 2003b)9 0.004 240 (Le-Clech et al., 2003b)18 0.104 48 (Le-Clech et al., 2003b)12 0.0002 300 (Rosenberger et al., 2002)
Biological floc Feed
EPS SMP ParticulatesColloids
Biomaterial residue Initial pore blockingPassive adsorption
Biofilm growth Further pore blockingCake formation
Irregular fouling distribution
Local flux � Critical flux
Redistribution of productivity
Severe TMP increase
Stage 1Conditioning fouling
Stage 2Steady fouling
Stage 3TMP jump
Figure 2.33 Fouling mechanisms for MBR operated at constant flux (adapted from Zhang et al., 2006)
1856174817_Ch02.qxd 6/5/06 12:08 PM Page 91
In a more recent study, the contribution of conditioning fouling to overall resistancewas found to become negligible once filtration takes place (Choi et al., 2005a). Byapplying a vacuum (rather than suction) pump coupled with air backflushing, Ma et al.(2005) were able to reduce colloidal adsorption onto the membrane (Ma et al., 2005).These studies suggest that colloid adsorption onto new or cleaned membranes coupledwith initial pore blocking may be expected in MBRs (Jiang et al., 2005). The intensityof this effect depends on membrane pore size distribution, surface chemistry andespecially hydrophobicity (Ognier et al., 2002a). In a test cell equipped with directobservation through a membrane operating with crossflow and zero flux, flocculantmaterial was visually observed to temporarily land on the membrane (Zhang et al.,2006). This was defined as a random interaction process rather than a conventionalcake formation phenomenon. While some flocs were seen to roll and slide across themembrane, biological aggregates typically detached and left a residual footprint ofsmaller flocs or EPS material. Biomass approaching the membrane surface was thenable to attach more easily to the membrane surface to colonise it and contribute toStage 2.
2.3.8.2 Stage 2: Slow foulingEven when operated below the critical flux for the biomass, temporary attachment ofthe floc can contribute to the second fouling stage. After Stage 1, the membrane sur-face is expected to be mostly covered by SMP, promoting attachment of biomass par-ticulate and colloidal material. Because of the low critical flux measured for SMPsolutions, further adsorption and deposition of organics on the membrane surfacemay also occur during Stage 2. Since adsorption can take place across the wholesurface and not just on the membrane pore, biological flocs may initiate cake forma-tion without directly affecting the flux in this initial stage. Over time, however, com-plete or partial pore blocking takes place. The rate of EPS deposition, and resultingTMP rise, would then be expected to increase with flux leading to a shorter Stage 2.Such fouling would prevail even under favourable hydrodynamic conditions provid-ing adequate surface shear over the membrane surface. However, since uneven distribution of air and liquid flow is to be expected in iMBRs, correspondingly inho-mogeneous fouling must take place.
2.3.8.3 Stage 3: TMP jumpWith regions of the membrane more fouled than others, permeability is significantlyless in those specific locations. As a result, permeation is promoted in less fouledareas of the membrane, exceeding a critical flux in these localities. Under such con-ditions, the fouling rate rapidly increases, roughly exponentially with flux accordingto data of Le-Clech et al. (2003b) (Fig. 2.33). The sudden rise in TMP or “jump” is aconsequence of constant flux operation, and several mechanisms can be postulatedfor the rapid increase in TMP under a given condition. As with classical filtrationmechanisms (Fig. 2.9), it is likely that more than one mechanism will apply when anMBR reaches the TMP jump condition, and a number of models can be considered:
(i) Inhomogeneous fouling (area loss) model: This model was proposed to explain theobserved TMP profiles in nominally sub-critical filtration of upflow anaerobic
92 The MBR Book
1856174817_Ch02.qxd 6/5/06 12:08 PM Page 92
sludge (Cho and Fane, 2002). The TMP jump appeared to coincide with ameasured loss of local permeability at different positions along the membrane,due to slow fouling by EPS. It was argued that the flux redistribution (to maintainthe constant average flux) resulted in regions of sub-critical flux and conse-quently in rapid fouling and TMP rise.
(ii) Inhomogeneous fouling (pore loss) model: Similar TMP transients have beenobserved for the crossflow MF of a model biopolymer (alginate) (Ye et al.,2005). These trends revealed the TMP transient to occur with relatively sim-ple feeds. The data obtained have been explained by a model that involves fluxredistribution among open pores. Local pore velocities eventually exceed thecritical flux of alginate aggregates that rapidly block the pores. This idea wasalso the base of the model proposed by Ognier et al. (2004). While the “arealoss” model considers macroscopic redistribution of flux, the “pore loss”model focuses on microscopic scale. In MBR systems, it is expected that bothmechanisms occur simultaneously.
(iii) Critical suction pressure model: The two-stage pattern of a gradual TMP rise fol-lowed by a more rapid increase has been observed from studies conductedbased on dead-end filtration of a fine colloid by an immersed HF. A critical suc-tion pressure it is suggested coagulation or collapse occurs at the base of thecake, based on membrane autopsy evaluations supplemented with modelling(Chang et al., 2005). A very thin dense layer close to the membrane surface,as observed in the study, would account for the rapid increase in resistanceleading to the TMP jump. Although this work was based on dead-end ratherthan crossflow operation, the mechanism could apply to any membrane sys-tem where fouling continues until the critical suction pressure is reached,whereupon the depositing compound(s) coalesce or collapse to produce amore impermeable fouling layer.
(iv) Percolation theory: According to percolation theory, the porosity of the foulinglayer gradually reduces due to the continuous filtration and material depos-ition within the deposit layer. At a critical condition, the fouling cake losesconnectivity and resistance, resulting in a rapid increase in TMP. This modelhas been proposed for MBRs (Hermanowicz, 2004), but indicates a very rapidchange (within minutes), which is not always observed in practice. However,the combination of percolation theory with the inhomogeneous fouling (arealoss) model could satisfy the more typically gradual inclines observed for TMPtransients. Similarly, fractal theory was successfully applied to describe cakemicrostructure and properties and to explain the cake compression observedduring MBR operation.
(v) Inhomogeneous fibre bundle model: Another manifestation of the TMP transienthas been observed for a model fibre bundle where the flow from individualfibres was monitored (Yeo and Fane, 2004). The bundle was operated undersuction at constant permeate flow, giving constant average flux, and the flowwas initially evenly distributed amongst the fibres. However, over time theflows became less evenly distributed so that the standard deviation of thefluxes of individual fibres started to increase from the initial range of 0.1–0.15 up to 0.4. Consequently, the TMP rose to maintain the average flux
Fundamentals 93
1856174817_Ch02.qxd 6/5/06 12:08 PM Page 93
across the fibre bundle, mirroring the increase in the standard deviation ofthe fluxes. At some point, both TMP and standard deviation rose rapidly. Thisis believed to be due to flow mal-distribution within the bundle leading to localpore and flow channel occlusion. It was possible to obtain more steady TMPand standard deviation profiles when the flow regime around the fibres wasmore rigorously controlled by applying higher liquid and/or air flows.
2.3.9 Fouling control and amelioration in MBRs
Whilst an understanding of fouling phenomena and mechanisms may be enlight-ening, control of fouling and clogging in practice is generally limited to five mainstrategies:
1. applying appropriate pretreatment to the feedwater,2. employing appropriate physical or chemical cleaning protocols,3. reducing the flux,4. increasing the aeration,5. chemically or biochemically modifying the mixed liquor.
All of the above strategies are viable for full-scale operating MBRs, and each are con-sidered in turn below.
2.3.9.1 Feed pretreatmentIt is generally recognised that the successful retrofitting of an ASP or SBR with anMBR is contingent on upgrading the pretreatment and, specifically, the screening.Whilst an MBR can effectively displace primary sedimentation, biotreatment andsecondary solid–liquid separation, as well as tertiary effluent polishing, classicalscreens of around 6 mm rating are normally insufficient for an MBR. Such relativelycoarse screens increase the risk of clogging of the membrane module retentate flowchannels, especially by hairs in municipal wastewaters, which aggregate and clogboth the membrane interstices and aeration ports. HF membranes have a tendencyfor aggregates of hair and other debris to collect at the top of the membrane ele-ment. Hairs may then become entwined with the filaments and are not significantlyremoved by backflushing. FS membrane clogging occurs when debris agglomerateat the channel edges and entrance. If the aeration fails to remove these aggregates,sludge accumulates above the blockage, increasing the affected excluded area. Fibrescollecting in the aeration system can change the flow pattern and volume of air tothe membranes, reducing the degree of scouring. As a result of the decreased scour-ing, membrane fouling is increased. Aerators are thus normally designed to resistclogging and/or allow periodic flushing with water.
Since HF modules are more susceptible to clogging and the impact is rather moresevere, for such modules screens normally rated at between 0.8 and 1.5 mm areusually employed. FS modules are slightly more tolerant of clogging, despite beingnon-backflushable, and screens of 2–3-mm rating are normally adequate for MBRsof this membrane configuration.
94 The MBR Book
1856174817_Ch02.qxd 6/5/06 12:08 PM Page 94
2.3.9.2 Employing appropriate physical or chemical cleaning protocolsCleaning strategies have been outlined in Section 2.1.4.3, and protocols applied inpractice are detailed in Chapters 4 (for comparative pilot plant studies) and 5 (full-scale reference sites). A summary of these data is presented in Section 3.3.1.2, alongwith the implications of the physical and chemical cleaning protocols on processdesign and operation. Results from selected bench-scale studies are given below.
Physical cleaning Key general cleaning parameters are duration and frequency,since these determine process downtime. For backflushing, a further key parameteris the backflush flux, generally of 1–3 times the operational flux and determined bythe backflush TMP. Less frequent, longer backflushing (600 s filtration/45 s back-flushing) has been found to be more efficient than more frequent but shorter back-flushing (200 s filtration/15 s backflush) (Jiang et al., 2005). In another study basedon factorial design, backflush frequency (between 8 and 16 min) was found to havemore effect on fouling removal than either aeration intensity (0.3 to 0.9 m3/h perm2 membrane area) or backflush duration (25–45 s) for an HF iMBR (Schoeberl et al., 2005). Hence, although more effective cleaning would generally be expectedfor more frequent and longer backflushing, the possible permutations need explor-ing to minimise energy demand. This has been achieved through the design of ageneric control system which automatically optimised backflush duration accord-ing to the monitored TMP value (Smith et al., 2005). However, increasing backflushflux leads to more loss product and reduces the net flux.
Air can also be used to affect backflushing (Sun et al., 2004) or to enhance back-flush with water. Up to 400% in the net flux over that attained from continuousoperation has been recorded using an air backflush, although in this case 15 min ofair backflush were required every 15 min of filtration (Visvanathan et al., 1997).Whilst air backflushing is undoubtedly effective, anecdotal evidence suggests that itcan lead to partial drying out of some membranes, which can then produce embrit-tlement and so problems of membrane integrity.
Membrane relaxation encourages diffusive back transport of foulants away fromthe membrane surface under a concentration gradient, which is further enhancedby the shear created by air scouring (Chua et al., 2002; Hong et al., 2002). Detailedstudy of the TMP behaviour during this type of operation revealed that, althoughthe fouling rate is generally higher than for continuous filtration, membrane relax-ation allows filtration to be maintained for longer periods of time before the need forcleaning arises (Ng et al., 2005). Although some authors have reported that this typeof operation may not be economically feasible for operation of large-scale MBRs (Honget al., 2002), relaxation is almost ubiquitous in modern full-scale iMBRs (Chapter 5).Recent studies assessing maintenance protocols have tended to combine relaxationwith backflushing for optimum results (Vallero et al., 2005; Zhang et al., 2005).
In practice, physical cleaning protocols tend to follow those recommended by thesuppliers. Relaxation is typically applied for 1–2 min every 8–15 min of operation,both for FS and HF systems. For HF systems, backflushing, if employed, is usuallyapplied at fluxes of around 2–3 times the operating flux and usually supplementsrather than displaces relaxation. It is likely that operation without backflushing,whilst notionally increasing the risk of slow accumulation of foulants on or within
Fundamentals 95
1856174817_Ch02.qxd 6/5/06 12:08 PM Page 95
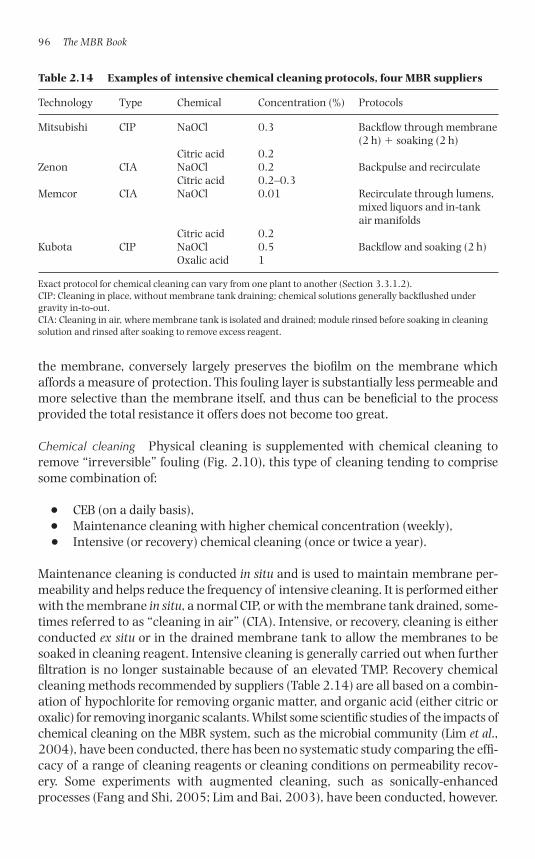
the membrane, conversely largely preserves the biofilm on the membrane whichaffords a measure of protection. This fouling layer is substantially less permeable andmore selective than the membrane itself, and thus can be beneficial to the processprovided the total resistance it offers does not become too great.
Chemical cleaning Physical cleaning is supplemented with chemical cleaning toremove “irreversible” fouling (Fig. 2.10), this type of cleaning tending to comprisesome combination of:
● CEB (on a daily basis),● Maintenance cleaning with higher chemical concentration (weekly),● Intensive (or recovery) chemical cleaning (once or twice a year).
Maintenance cleaning is conducted in situ and is used to maintain membrane per-meability and helps reduce the frequency of intensive cleaning. It is performed eitherwith the membrane in situ, a normal CIP, or with the membrane tank drained, some-times referred to as “cleaning in air” (CIA). Intensive, or recovery, cleaning is eitherconducted ex situ or in the drained membrane tank to allow the membranes to besoaked in cleaning reagent. Intensive cleaning is generally carried out when furtherfiltration is no longer sustainable because of an elevated TMP. Recovery chemicalcleaning methods recommended by suppliers (Table 2.14) are all based on a combin-ation of hypochlorite for removing organic matter, and organic acid (either citric oroxalic) for removing inorganic scalants. Whilst some scientific studies of the impacts ofchemical cleaning on the MBR system, such as the microbial community (Lim et al.,2004), have been conducted, there has been no systematic study comparing the effi-cacy of a range of cleaning reagents or cleaning conditions on permeability recov-ery. Some experiments with augmented cleaning, such as sonically-enhancedprocesses (Fang and Shi, 2005; Lim and Bai, 2003), have been conducted, however.
96 The MBR Book
Table 2.14 Examples of intensive chemical cleaning protocols, four MBR suppliers
Technology Type Chemical Concentration (%) Protocols
Mitsubishi CIP NaOCl 0.3 Backflow through membrane (2 h) � soaking (2 h)
Citric acid 0.2Zenon CIA NaOCl 0.2 Backpulse and recirculate
Citric acid 0.2–0.3Memcor CIA NaOCl 0.01 Recirculate through lumens,
mixed liquors and in-tank air manifolds
Citric acid 0.2Kubota CIP NaOCl 0.5 Backflow and soaking (2 h)
Oxalic acid 1
Exact protocol for chemical cleaning can vary from one plant to another (Section 3.3.1.2).CIP: Cleaning in place, without membrane tank draining; chemical solutions generally backflushed undergravity in-to-out.CIA: Cleaning in air, where membrane tank is isolated and drained; module rinsed before soaking in cleaningsolution and rinsed after soaking to remove excess reagent.
1856174817_Ch02.qxd 6/5/06 12:08 PM Page 96
Whilst ultrasonic cleaning can undoubtedly enhance flux recovery, tests conductedin potable water suggest that it can result in adverse impacts on membrane integrity(Masselin et al., 2001).
Maintenance cleaning, usually taking 30–60 minutes for a complete cycle, is nor-mally carried out every 3–7 days at moderate reagent concentrations of 200–500 mg/L NaOCl for classical aerobic MBRs. Recovery cleaning employs rather higherreagent concentrations of 0.2–0.3 wt% NaOCl, coupled with 0.2–0.3 wt% citricacid or 0.5–1 wt% oxalic acid (Section 3.3.1.2). Membrane cleaning studies onanaerobic systems have generally indicated that a combination of caustic and acidwashes are required to remove organic and inorganic (namely struvite) foulantsfrom organic anMBR membranes (Choo et al., 2000; Kang et al., 2002; Lee et al.,2001c). For inorganic membranes, acid washing has been found to be less effective,and this has been attributed to surface charge effects (Kang et al., 2002).
2.3.9.3 Reducing the fluxReducing the flux always reduces fouling but obviously then impacts directly on cap-ital cost through membrane area demand. A distinction must be made, however,between operating (i.e. gross) flux and net flux (the flux based on throughput over acomplete cleaning cycle), as well as peak and average flux.
There are essentially two modes of operation of an MBR regarding operating flux,which then determine the cleaning requirements (Sections 2.1.4.3 and 2.3.9.2) andthus net flux:
● Sustainable permeability operation: In this instance, the conditions are chosenso as to maintain stable operation (little or negligible increase in TMP at con-stant flux) over an extended period of time (i.e. several weeks or months) withonly moderate remedial measures (namely relaxation), if any. All immersedFS and all sidestream systems operate under these conditions, with sMBRsoperating continuously (i.e. without relaxation) between chemical cleans.
● Intermittent operation: In this mode of operation, the operational flux is abovethat which can be sustained by the filtration cycle operating conditions and, asa result, intermittent remedial measures are employed. These comprise relax-ation supplemented with backflushing and, usually, some kind of maintenancechemical cleaning procedure. All immersed HF systems operate in this manner.
Modern practice appears to favour operation at net fluxes of around 25 LMH formunicipal wastewater, incorporating physical cleaning every 10–12 minutes, regard-less of membrane configuration. Maintenance cleaning, if employed, adds insignifi-cantly to downtime. The greatest impact on operating vs. net flux is therefore peakloading, normally from storm waters. It is these increased hydraulic loads, coupledwith feedwater quality fluctuations, which represent one of the major challenges toMBR design and operation.
2.3.9.4 Increasing aerationWhilst increasing aeration rate invariably increases the critical flux up to somethreshold value, increasing membrane aeration intensity is normally prohibitively
Fundamentals 97
1856174817_Ch02.qxd 6/5/06 12:08 PM Page 97
expensive. As already stated (Section 2.3.7.1), much attention has been focused oncommercial development of efficient and effective aeration systems to reduce thespecific aeration demand, with possibly the most important publications arising inthe patent literature (Côté, 2002; Miyashita et al., 2000) and including cyclic aeration(Rabie et al., 2003) and jet aeration (Fufang and Jordan 2001, 2002). The use ofuniformly distributed fine air bubbles from 0.5 mm ports has been shown to providegreater uplift and lower resistance compared to a coarse aerator having 2 mm ports atsimilar aeration rates (Sofia et al., 2004). In the same study, a bi-chamber (a riser anddown-comer) in an FS MBR has been shown to play a significant role in inducinghigh CFVs. The use of a variable aeration rate to increase the flux during peak loadshas been reported for short-term tests (Howell et al., 2004). However, a recent studyfrom Choi and co-workers (Choi et al., 2005a) carried out with an sMBR indicatedtangential shear (imparted by liquid crossflow) to have no effect on flux decline whenpseudo-steady-state is reached (i.e. once the fouling layer governs permeability).
2.3.9.5 Chemically or biochemically modifying the mixed liquorThe biomass quality can be controlled biochemically, through adjustment of theSRT (Section 2.3.6.3) or chemically. In practice, SRT is rarely chosen on the basis offoulant concentration control, instead a target value is almost invariably based onmembrane module clogging propensity and biomass aeration efficiency. However,studies have shown that a modicum of fouling control can be attained through theaddition of chemicals.
Coagulant/flocculant Ferric chloride and aluminium sulphate (alum) have bothbeen studied in relation to membrane fouling amelioration, most extensively forpotable systems but also for MBRs. In MBR-based trials, addition of alum to the reac-tor led to a significant decrease in SMPc concentration, along with an improvementin membrane hydraulic performances (Holbrook et al., 2004). Small biological col-loids (from 0.1 to 2 �m) have been observed to coagulate and formed larger aggre-gate when alum was added to MBR activated sludge (Lee et al., 2001b). Althoughmore costly, dosing with ferric chloride was found to be more effective than alum.Ferric dosing of MBRs has been used for enhancing the production of iron-oxidizingbacteria responsible for the degradation of gaseous H2S (Park et al., 2005a). In thisstudy, specific ferric precipitates like ferric phosphate and K-jarosite (K-Fe3(SO4)2(OH)6)have been observed to foul the membrane. Pretreatment of the effluent by pre-coagu-lation/sedimentation has revealed some fouling reduction (Adham et al., 2004), andpre-clarification is employed at some sewage treatment works. In a recent example,the ferric dosing was shown to control both irreversible fouling and suspension vis-cosity (Itonaga et al., 2004). Precoating of MBR membranes with ferric hydroxidehas also been studied as a means of increasing permeability and improving perme-ate quality (Zhang et al., 2004). In this study, additional ferric chloride was added toremove non-biodegradable organics which accumulated in the bioreactor.
Adsorbent agents Addition of adsorbents into biological treatment systems decreasesthe level of organic compounds. Dosing with PAC produces biologically activatedcarbon (BAC) which adsorbs and degrades soluble organics and has been shown tobe effective in reducing SMP and EPS levels in a comparative study of a sidestream
98 The MBR Book
1856174817_Ch02.qxd 6/5/06 12:08 PM Page 98
and immersed hybrid PAC–MBR (Kim and Lee, 2003). Decreased membrane foulinghas also been demonstrated in studies of the effects of dosing MBR supernatant atup to 1 g/L PAC (Lesage et al., 2005) and dosing activated sludge itself (Li et al.,2005c), for which an optimum PAC concentration of 1.2 g/L was recorded. In thelatter study, floc size distribution and apparent biomass viscosity were identified asbeing the main parameters influenced, resulting in a reduced cake resistance, whenPAC was dosed into the bioreactor. Conversely, no significant improvement in per-formance was recorded when a concentration of 5 g/L of PAC was maintained in thebioreactor without sludge wastage (Ng et al., 2005). It was postulated that, underthese conditions, the PAC was rapidly saturated with organic pollutants and that foul-ing suppression by PAC relies on its regular addition brought about by lower SRTs.
Experiments conducted with different system configurations based on immersed HFmembranes allowed direct comparison of hydraulic performances for pre-flocculationand PAC addition. Under the operating conditions employed, pre-flocculation pro-vided higher fouling mitigation than that of PAC addition (Guo et al., 2004).However, the use of both strategies simultaneously provided the greatest permeabil-ity enhancement (Cao et al., 2005; Guo et al., 2004).
A detailed mathematical model has been proposed for predicting performances forhybrid PAC–MBR systems (Tsai et al., 2004). The model encompasses sub-processessuch as biological reaction in bulk liquid solution, film transfer from bulk liquid phaseto the biofilm, diffusion with biological reaction inside the biofilm, adsorption equilibriaat the biofilm–adsorbent interface and diffusion within the PAC particles. Numerousother studies in which the use of PAC has been reported for fouling amelioration havegenerally been limited in scope and have not addressed the cost implications of reagentusage and sludge disposal. Tests have been performed using zeolite (Lee et al., 2001b)and aerobic granular sludge, with an average size around 1 mm (Li et al., 2005b) to create granular flocs of lower specific resistance. Granular sludge was found to increasemembrane permeability by 50% but also lower the permeability recovery from cleaningby 12%, which would be likely to lead to unsustainable operation.
A novel “membrane performance enhancer” MPE50, a cationic polymer-basedcompound, has recently been developed by the company Nalco for use in MBRs. Theaddition of 1 g/L of of the reagent directly to the bioreactor led to the reduction ofSMPc from 41 to 21 mg/L (Yoon et al., 2005). The interaction between the polymerand the soluble organics in general, and SMPc in particular, was identified as beingthe main mechanism responsible for the performance enhancement. In anotherexample, an MBR operated at an MLSS level as high as 45 g/L yielded a lower foulingpropensity when 2.2 g/L of polymer was dosed into the bioreactor. The product hasbeen tested at full scale (Section 5.2.1.4).
2.4 Summary
Membrane separation processes applied to MBRs have conventionally been limited toMF and UF for separation of the permeate product from the bioreactor MLSS. Otherprocesses, in which the membrane is used to support a biomass and facilitate gastransfer into the biofilm (Section 2.3.2–2.3.3), have not reached the commercial
Fundamentals 99
1856174817_Ch02.qxd 6/5/06 12:08 PM Page 99
stage of development. Membrane module configurations employed for biomass sep-aration MBRs are limited to FS and HF for immersed processes (where the membraneis placed in the tank), and mainly MTs where it is placed outside the tank. The latterprovide shear through pumping, as with most other membrane processes, whereasimmersed processes employ aeration to provide shear. Shear enhancement is criticalin promoting permeate flux through the membrane and suppressing membranefouling, but generating shear also demands energy.
A considerable amount of research has been devoted to the study of membrane foul-ing phenomena in MBRs, and there is a general consensus that fouling constituentsoriginate from the clarified biomass. Many authors that have employed standard chem-ical analysis on this fraction have identified the carbohydrate fraction of the SMPs(SMPc) arising from the bacterial cells as being mainly responsible for fouling, ratherthan suspended solid materials. However, recent attempts to predict fouling rates byEPS/SMP levels have not translated well across different plants or studies since biomasscharacteristics vary significantly from one plant to another. Moreover, achieving a con-sensus on the relative contributions of candidate foulants to membrane fouling is constrained by the different analytical methodologies and instruments employed.
There are also cross-disciplinary issues in the area of membrane fouling. Thereappears to be little interconnection between foulant analysis in the wastewater andpotable applications, and membrane cleaning between the industrial process andmunicipal water and wastewater sectors. Studies in the potable area tend to point tocolloidal materials and Ca-organic carboxylate complexation as being the two keyfoulant types, and this may apply as much to wastewater as potable water membraneapplications. Within the municipal sector, the number of studies devoted to charac-terisation of foulants vastly exceeds that for optimising chemical cleaning, notwith-standing the fact that it is the latter which controls irrecoverable fouling and so,ultimately, membrane life. Membrane cleaning in industrial process water applications,however, is rather more advanced – dating back to the 1980s – with protocolsarguably developed on a more scientific basis than those in the municipal sector.
Dynamic effects exert the greatest influence on consistency in MBR performance,ultimately leading to equipment and/or consent (i.e. target product water quality)failures. Specifications for full-scale MBR installations are generally based on con-servative estimates of hydraulic and organic (and/or ammoniacal) loading. However,in reality, these parameters fluctuate significantly. Moreover, even more significantand potentially catastrophic deterioration in performance can arise through equip-ment malfunction and operator error. Such events can be expected to produce, overshort periods of time:
● decreases in the MLSS concentration (either through loss of solids by foamingor by dilution with feedwater),
● foaming problems, sometimes associated with the above,● loss of aeration (through control equipment malfunction or aerator port
clogging),● loss of permeability (through misapplication of backflush and cleaning proto-
col, hydraulic shocks or contamination of the feed with some unexpectedcomponent).
100 The MBR Book
1856174817_Ch02.qxd 6/5/06 12:08 PM Page 100
Lastly, the vast majority of all studies in this area have focused on fouling and,specifically, the characterisation of polymeric substances and mostly ignored thepotentially more serious problem of clogging. Clogging can arise both in the mem-brane channels and in the aerator ports, in both cases impacting deleteriously on fluxdistribution and thus fouling rates. In this respect, developing methods of ensuringhomogeneity of air distribution will advance both fouling and clogging control. Onceagain, though, the number of MBR papers published which have been devoted specif-ically to aerator design are limited.
The nature of irrecoverable fouling and clogging is that they can only be studied overextended time periods which are simply not conducive to academic research. Researchinto fouling characterisation is likely to continue for some time and new membranesand systems are being developed from research programmes globally. However,much practical information can be obtained from the examination of pilot- and full-scale plant data (Chapters 3 and 5), and it is also instructive and expedient to con-sider the attributes of existing individual commercial technologies (Chapter 4).
References
Abbassi, B., Dullstein, S. and Rabiger, N. (1999) Minimization of excess sludge pro-duction by increase of oxygen concentration in activated sludge flocs; experimentaland theoretical approach. Water Res., 34, 139–146.
Adham, S., DeCarolis, J.F. and Pearce, W. (2004) Optimization of various mbr sys-tems for water reclamation – phase iii, Desalination and Water Purification Researchand Development Program, Final Report No. 103, Agreement No. 01-FC-81–0736.
Ahmed, T. and Semmens, M.J. (1992a) The use of independently sealed micro-porous membranes for oxygenation of water: model development. J. Membrane Sci.,69, 11–20.
Ahmed, T. and Semmens, M.J. (1992b) Use of sealed end hollow fibres for bubble-less membrane aeration: experimental studies. J. Membrane Sci., 69, 1–10.
Ahn, Y.T., Kang, S.T., Chae, S.R., Lim, J.L., Lee, S.H. and Shin, H.S. (2005) Effect ofinternal recycle rate on the high-strength nitrogen wastewater treatment in thecombined ubf/mbr system. Water Sci. Technol., 51, 241–247.
ASCE (1992) ASCE Standard – Measurement of Oxygen Transfer in Clean Water,ANSI/ASCE 2–91, (2nd edn). Reston VA.
Ashley, K.I., Mavinic, D.S. and Hall, K.J. (1992) Bench scale study of oxygen trans-fer in coarse bubble diffused aeration. Water Res., 26, 1289–1295.
Badino, J.A.C., Facciotti, M.C.R. and Schmidell, W. (2001) Volumetric oxygentransfer coefficients (kLa) in batch cultivations involving non-Newtonian broths.Biochem. Engng. J., 8, 111–119.
Bae, T.-H. and Tak, T.-M. (2005) Interpretation of fouling characteristics of ultra-filtration membranes during the filtration of membrane bioreactor mixed liquor. J. Membrane Sci., 264, 151–160.
Baek, S.H. and Pagilla, K. (2003) Comparison of aerobic and anaerobic membranebioreactors for municipal wastewater treatment, Proceedings 76th Water EnvironmentFederation Technical Exposition and Conference [CD-ROM]; Los Angeles, Ca.
Fundamentals 101
1856174817_Ch02.qxd 6/5/06 12:08 PM Page 101
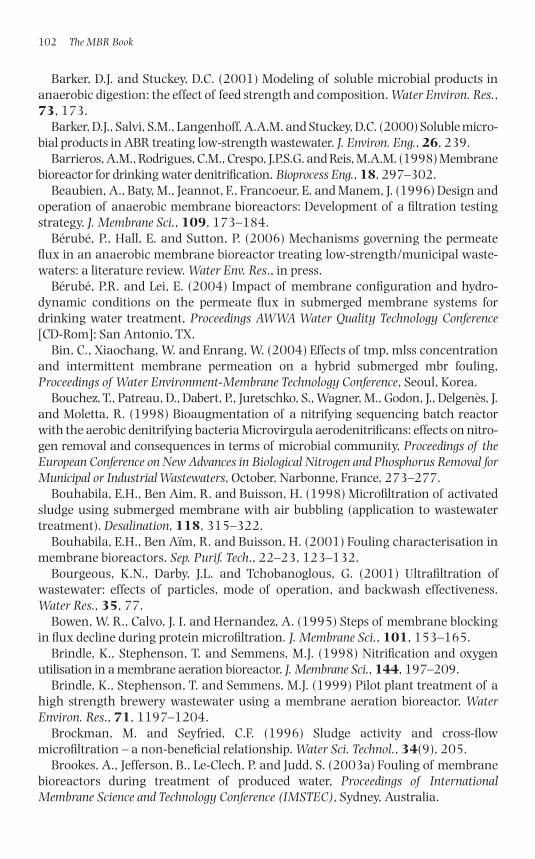
Barker, D.J. and Stuckey, D.C. (2001) Modeling of soluble microbial products inanaerobic digestion: the effect of feed strength and composition. Water Environ. Res.,73, 173.
Barker, D.J., Salvi, S.M., Langenhoff, A.A.M. and Stuckey, D.C. (2000) Soluble micro-bial products in ABR treating low-strength wastewater. J. Environ. Eng., 26, 239.
Barrieros, A.M., Rodrigues, C.M., Crespo, J.P.S.G. and Reis, M.A.M. (1998) Membranebioreactor for drinking water denitrification. Bioprocess Eng., 18, 297–302.
Beaubien, A., Baty, M., Jeannot, F., Francoeur, E. and Manem, J. (1996) Design andoperation of anaerobic membrane bioreactors: Development of a filtration testingstrategy. J. Membrane Sci., 109, 173–184.
Bérubé, P., Hall, E. and Sutton, P. (2006) Mechanisms governing the permeateflux in an anaerobic membrane bioreactor treating low-strength/municipal waste-waters: a literature review. Water Env. Res., in press.
Bérubé, P.R. and Lei, E. (2004) Impact of membrane configuration and hydro-dynamic conditions on the permeate flux in submerged membrane systems fordrinking water treatment, Proceedings AWWA Water Quality Technology Conference[CD-Rom]; San Antonio, TX.
Bin, C., Xiaochang, W. and Enrang, W. (2004) Effects of tmp, mlss concentrationand intermittent membrane permeation on a hybrid submerged mbr fouling,Proceedings of Water Environment-Membrane Technology Conference, Seoul, Korea.
Bouchez, T., Patreau, D., Dabert, P., Juretschko, S., Wagner, M., Godon, J., Delgenès, J.and Moletta, R. (1998) Bioaugmentation of a nitrifying sequencing batch reactorwith the aerobic denitrifying bacteria Microvirgula aerodenitrificans: effects on nitro-gen removal and consequences in terms of microbial community, Proceedings of theEuropean Conference on New Advances in Biological Nitrogen and Phosphorus Removal forMunicipal or Industrial Wastewaters, October, Narbonne, France, 273–277.
Bouhabila, E.H., Ben Aim, R. and Buisson, H. (1998) Microfiltration of activatedsludge using submerged membrane with air bubbling (application to wastewatertreatment). Desalination, 118, 315–322.
Bouhabila, E.H., Ben Aïm, R. and Buisson, H. (2001) Fouling characterisation inmembrane bioreactors. Sep. Purif. Tech., 22–23, 123–132.
Bourgeous, K.N., Darby, J.L. and Tchobanoglous, G. (2001) Ultrafiltration ofwastewater: effects of particles, mode of operation, and backwash effectiveness.Water Res., 35, 77.
Bowen, W. R., Calvo, J. I. and Hernandez, A. (1995) Steps of membrane blockingin flux decline during protein microfiltration. J. Membrane Sci., 101, 153–165.
Brindle, K., Stephenson, T. and Semmens, M.J. (1998) Nitrification and oxygenutilisation in a membrane aeration bioreactor. J. Membrane Sci., 144, 197–209.
Brindle, K., Stephenson, T. and Semmens, M.J. (1999) Pilot plant treatment of ahigh strength brewery wastewater using a membrane aeration bioreactor. WaterEnviron. Res., 71, 1197–1204.
Brockman, M. and Seyfried, C.F. (1996) Sludge activity and cross-flow microfiltration – a non-beneficial relationship. Water Sci. Technol., 34(9), 205.
Brookes, A., Jefferson, B., Le-Clech, P. and Judd, S. (2003a) Fouling of membranebioreactors during treatment of produced water, Proceedings of InternationalMembrane Science and Technology Conference (IMSTEC), Sydney, Australia.
102 The MBR Book
1856174817_Ch02.qxd 6/5/06 12:08 PM Page 102
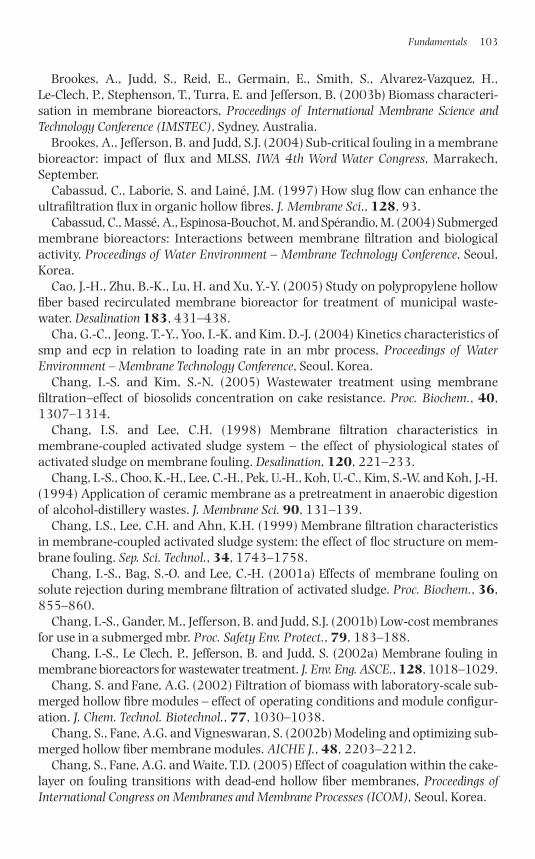
Brookes, A., Judd, S., Reid, E., Germain, E., Smith, S., Alvarez-Vazquez, H., Le-Clech, P., Stephenson, T., Turra, E. and Jefferson, B. (2003b) Biomass characteri-sation in membrane bioreactors, Proceedings of International Membrane Science andTechnology Conference (IMSTEC), Sydney, Australia.
Brookes, A., Jefferson, B. and Judd, S.J. (2004) Sub-critical fouling in a membranebioreactor: impact of flux and MLSS, IWA 4th Word Water Congress, Marrakech,September.
Cabassud, C., Laborie, S. and Lainé, J.M. (1997) How slug flow can enhance theultrafiltration flux in organic hollow fibres. J. Membrane Sci., 128, 93.
Cabassud, C., Massé, A., Espinosa-Bouchot, M. and Spérandio, M. (2004) Submergedmembrane bioreactors: Interactions between membrane filtration and biologicalactivity, Proceedings of Water Environment – Membrane Technology Conference, Seoul,Korea.
Cao, J.-H., Zhu, B.-K., Lu, H. and Xu, Y.-Y. (2005) Study on polypropylene hollowfiber based recirculated membrane bioreactor for treatment of municipal waste-water. Desalination 183, 431–438.
Cha, G.-C., Jeong, T.-Y., Yoo, I.-K. and Kim, D.-J. (2004) Kinetics characteristics ofsmp and ecp in relation to loading rate in an mbr process, Proceedings of WaterEnvironment – Membrane Technology Conference, Seoul, Korea.
Chang, I.-S. and Kim, S.-N. (2005) Wastewater treatment using membrane filtration–effect of biosolids concentration on cake resistance. Proc. Biochem., 40,1307–1314.
Chang, I.S. and Lee, C.H. (1998) Membrane filtration characteristics inmembrane-coupled activated sludge system – the effect of physiological states ofactivated sludge on membrane fouling. Desalination, 120, 221–233.
Chang, I.-S., Choo, K.-H., Lee, C.-H., Pek, U.-H., Koh, U.-C., Kim, S.-W. and Koh, J.-H.(1994) Application of ceramic membrane as a pretreatment in anaerobic digestionof alcohol-distillery wastes. J. Membrane Sci. 90, 131–139.
Chang, I.S., Lee, C.H. and Ahn, K.H. (1999) Membrane filtration characteristicsin membrane-coupled activated sludge system: the effect of floc structure on mem-brane fouling. Sep. Sci. Technol., 34, 1743–1758.
Chang, I.-S., Bag, S.-O. and Lee, C.-H. (2001a) Effects of membrane fouling onsolute rejection during membrane filtration of activated sludge. Proc. Biochem., 36,855–860.
Chang, I.-S., Gander, M., Jefferson, B. and Judd, S.J. (2001b) Low-cost membranesfor use in a submerged mbr. Proc. Safety Env. Protect., 79, 183–188.
Chang, I.-S., Le Clech, P., Jefferson, B. and Judd, S. (2002a) Membrane fouling inmembrane bioreactors for wastewater treatment. J. Env. Eng. ASCE., 128, 1018–1029.
Chang, S. and Fane, A.G. (2002) Filtration of biomass with laboratory-scale sub-merged hollow fibre modules – effect of operating conditions and module configur-ation. J. Chem. Technol. Biotechnol., 77, 1030–1038.
Chang, S., Fane, A.G. and Vigneswaran, S. (2002b) Modeling and optimizing sub-merged hollow fiber membrane modules. AICHE J., 48, 2203–2212.
Chang, S., Fane, A.G. and Waite, T.D. (2005) Effect of coagulation within the cake-layer on fouling transitions with dead-end hollow fiber membranes, Proceedings ofInternational Congress on Membranes and Membrane Processes (ICOM), Seoul, Korea.
Fundamentals 103
1856174817_Ch02.qxd 6/5/06 12:08 PM Page 103
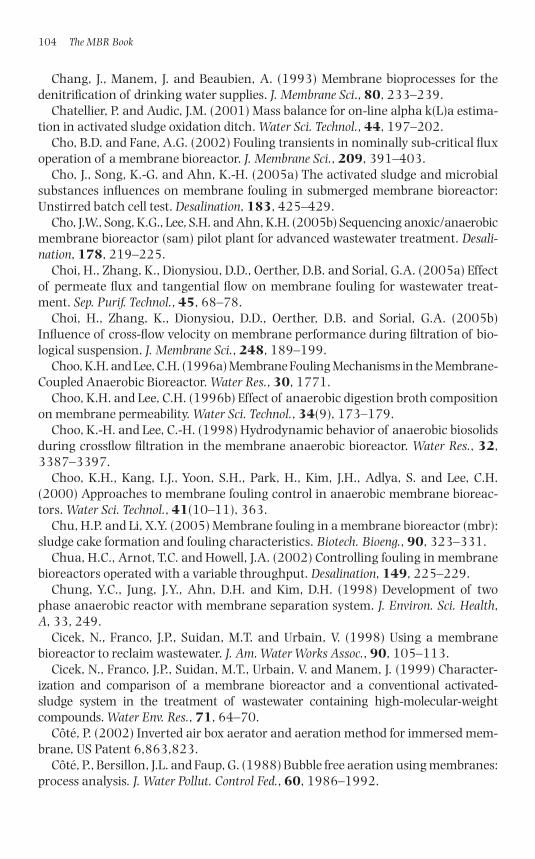
Chang, J., Manem, J. and Beaubien, A. (1993) Membrane bioprocesses for thedenitrification of drinking water supplies. J. Membrane Sci., 80, 233–239.
Chatellier, P. and Audic, J.M. (2001) Mass balance for on-line alpha k(L)a estima-tion in activated sludge oxidation ditch. Water Sci. Technol., 44, 197–202.
Cho, B.D. and Fane, A.G. (2002) Fouling transients in nominally sub-critical fluxoperation of a membrane bioreactor. J. Membrane Sci., 209, 391–403.
Cho, J., Song, K.-G. and Ahn, K.-H. (2005a) The activated sludge and microbialsubstances influences on membrane fouling in submerged membrane bioreactor:Unstirred batch cell test. Desalination, 183, 425–429.
Cho, J.W., Song, K.G., Lee, S.H. and Ahn, K.H. (2005b) Sequencing anoxic/anaerobicmembrane bioreactor (sam) pilot plant for advanced wastewater treatment. Desali-nation, 178, 219–225.
Choi, H., Zhang, K., Dionysiou, D.D., Oerther, D.B. and Sorial, G.A. (2005a) Effectof permeate flux and tangential flow on membrane fouling for wastewater treat-ment. Sep. Purif. Technol., 45, 68–78.
Choi, H., Zhang, K., Dionysiou, D.D., Oerther, D.B. and Sorial, G.A. (2005b)Influence of cross-flow velocity on membrane performance during filtration of bio-logical suspension. J. Membrane Sci., 248, 189–199.
Choo, K.H. and Lee, C.H. (1996a) Membrane Fouling Mechanisms in the Membrane-Coupled Anaerobic Bioreactor. Water Res., 30, 1771.
Choo, K.H. and Lee, C.H. (1996b) Effect of anaerobic digestion broth compositionon membrane permeability. Water Sci. Technol., 34(9), 173–179.
Choo, K.-H. and Lee, C.-H. (1998) Hydrodynamic behavior of anaerobic biosolidsduring crossflow filtration in the membrane anaerobic bioreactor. Water Res., 32,3387–3397.
Choo, K.H., Kang, I.J., Yoon, S.H., Park, H., Kim, J.H., Adlya, S. and Lee, C.H.(2000) Approaches to membrane fouling control in anaerobic membrane bioreac-tors. Water Sci. Technol., 41(10–11), 363.
Chu, H.P. and Li, X.Y. (2005) Membrane fouling in a membrane bioreactor (mbr):sludge cake formation and fouling characteristics. Biotech. Bioeng., 90, 323–331.
Chua, H.C., Arnot, T.C. and Howell, J.A. (2002) Controlling fouling in membranebioreactors operated with a variable throughput. Desalination, 149, 225–229.
Chung, Y.C., Jung, J.Y., Ahn, D.H. and Kim, D.H. (1998) Development of twophase anaerobic reactor with membrane separation system. J. Environ. Sci. Health,A, 33, 249.
Cicek, N., Franco, J.P., Suidan, M.T. and Urbain, V. (1998) Using a membranebioreactor to reclaim wastewater. J. Am. Water Works Assoc., 90, 105–113.
Cicek, N., Franco, J.P., Suidan, M.T., Urbain, V. and Manem, J. (1999) Character-ization and comparison of a membrane bioreactor and a conventional activated-sludge system in the treatment of wastewater containing high-molecular-weightcompounds. Water Env. Res., 71, 64–70.
Côté, P. (2002) Inverted air box aerator and aeration method for immersed mem-brane, US Patent 6,863,823.
Côté, P., Bersillon, J.L. and Faup, G. (1988) Bubble free aeration using membranes:process analysis. J. Water Pollut. Control Fed., 60, 1986–1992.
104 The MBR Book
1856174817_Ch02.qxd 6/5/06 12:08 PM Page 104
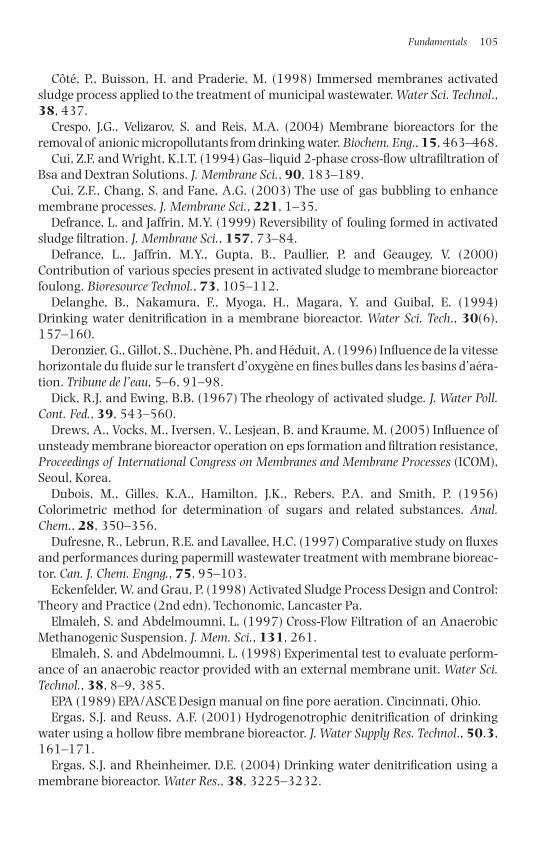
Côté, P., Buisson, H. and Praderie, M. (1998) Immersed membranes activatedsludge process applied to the treatment of municipal wastewater. Water Sci. Technol.,38, 437.
Crespo, J.G., Velizarov, S. and Reis, M.A. (2004) Membrane bioreactors for theremoval of anionic micropollutants from drinking water. Biochem. Eng., 15, 463–468.
Cui, Z.F. and Wright, K.I.T. (1994) Gas–liquid 2-phase cross-flow ultrafiltration ofBsa and Dextran Solutions. J. Membrane Sci., 90, 183–189.
Cui, Z.F., Chang, S. and Fane, A.G. (2003) The use of gas bubbling to enhancemembrane processes. J. Membrane Sci., 221, 1–35.
Defrance, L. and Jaffrin, M.Y. (1999) Reversibility of fouling formed in activatedsludge filtration. J. Membrane Sci., 157, 73–84.
Defrance, L., Jaffrin, M.Y., Gupta, B., Paullier, P. and Geaugey, V. (2000)Contribution of various species present in activated sludge to membrane bioreactorfoulong. Bioresource Technol., 73, 105–112.
Delanghe, B., Nakamura, F., Myoga, H., Magara, Y. and Guibal, E. (1994)Drinking water denitrification in a membrane bioreactor. Water Sci. Tech., 30(6),157–160.
Deronzier, G., Gillot, S., Duchène, Ph. and Héduit, A. (1996) Influence de la vitessehorizontale du fluide sur le transfert d’oxygène en fines bulles dans les basins d’aéra-tion. Tribune de l’eau, 5–6, 91–98.
Dick, R.J. and Ewing, B.B. (1967) The rheology of activated sludge. J. Water Poll.Cont. Fed., 39, 543–560.
Drews, A., Vocks, M., Iversen, V., Lesjean, B. and Kraume, M. (2005) Influence ofunsteady membrane bioreactor operation on eps formation and filtration resistance,Proceedings of International Congress on Membranes and Membrane Processes (ICOM),Seoul, Korea.
Dubois, M., Gilles, K.A., Hamilton, J.K., Rebers, P.A. and Smith, P. (1956)Colorimetric method for determination of sugars and related substances. Anal.Chem., 28, 350–356.
Dufresne, R., Lebrun, R.E. and Lavallee, H.C. (1997) Comparative study on fluxesand performances during papermill wastewater treatment with membrane bioreac-tor. Can. J. Chem. Engng., 75, 95–103.
Eckenfelder, W. and Grau, P. (1998) Activated Sludge Process Design and Control:Theory and Practice (2nd edn). Techonomic, Lancaster Pa.
Elmaleh, S. and Abdelmoumni, L. (1997) Cross-Flow Filtration of an AnaerobicMethanogenic Suspension. J. Mem. Sci., 131, 261.
Elmaleh, S. and Abdelmoumni, L. (1998) Experimental test to evaluate perform-ance of an anaerobic reactor provided with an external membrane unit. Water Sci.Technol., 38, 8–9, 385.
EPA (1989) EPA/ASCE Design manual on fine pore aeration. Cincinnati, Ohio.Ergas, S.J. and Reuss, A.F. (2001) Hydrogenotrophic denitrification of drinking
water using a hollow fibre membrane bioreactor. J. Water Supply Res. Technol., 50.3,161–171.
Ergas, S.J. and Rheinheimer, D.E. (2004) Drinking water denitrification using amembrane bioreactor. Water Res., 38, 3225–3232.
Fundamentals 105
1856174817_Ch02.qxd 6/5/06 12:08 PM Page 105
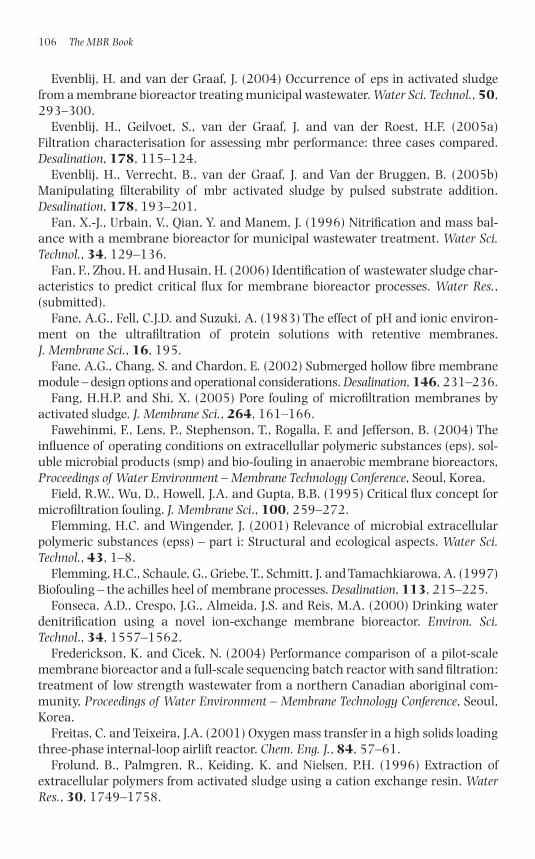
Evenblij, H. and van der Graaf, J. (2004) Occurrence of eps in activated sludgefrom a membrane bioreactor treating municipal wastewater. Water Sci. Technol., 50,293–300.
Evenblij, H., Geilvoet, S., van der Graaf, J. and van der Roest, H.F. (2005a)Filtration characterisation for assessing mbr performance: three cases compared.Desalination, 178, 115–124.
Evenblij, H., Verrecht, B., van der Graaf, J. and Van der Bruggen, B. (2005b)Manipulating filterability of mbr activated sludge by pulsed substrate addition.Desalination, 178, 193–201.
Fan, X.-J., Urbain, V., Qian, Y. and Manem, J. (1996) Nitrification and mass bal-ance with a membrane bioreactor for municipal wastewater treatment. Water Sci.Technol., 34, 129–136.
Fan, F., Zhou, H. and Husain, H. (2006) Identification of wastewater sludge char-acteristics to predict critical flux for membrane bioreactor processes. Water Res.,(submitted).
Fane, A.G., Fell, C.J.D. and Suzuki, A. (1983) The effect of pH and ionic environ-ment on the ultrafiltration of protein solutions with retentive membranes. J. Membrane Sci., 16, 195.
Fane, A.G., Chang, S. and Chardon, E. (2002) Submerged hollow fibre membranemodule – design options and operational considerations. Desalination, 146, 231–236.
Fang, H.H.P. and Shi, X. (2005) Pore fouling of microfiltration membranes byactivated sludge. J. Membrane Sci., 264, 161–166.
Fawehinmi, F., Lens, P., Stephenson, T., Rogalla, F. and Jefferson, B. (2004) Theinfluence of operating conditions on extracellullar polymeric substances (eps), sol-uble microbial products (smp) and bio-fouling in anaerobic membrane bioreactors,Proceedings of Water Environment – Membrane Technology Conference, Seoul, Korea.
Field, R.W., Wu, D., Howell, J.A. and Gupta, B.B. (1995) Critical flux concept formicrofiltration fouling. J. Membrane Sci., 100, 259–272.
Flemming, H.C. and Wingender, J. (2001) Relevance of microbial extracellularpolymeric substances (epss) – part i: Structural and ecological aspects. Water Sci.Technol., 43, 1–8.
Flemming, H.C., Schaule, G., Griebe, T., Schmitt, J. and Tamachkiarowa, A. (1997)Biofouling – the achilles heel of membrane processes. Desalination, 113, 215–225.
Fonseca, A.D., Crespo, J.G., Almeida, J.S. and Reis, M.A. (2000) Drinking waterdenitrification using a novel ion-exchange membrane bioreactor. Environ. Sci.Technol., 34, 1557–1562.
Frederickson, K. and Cicek, N. (2004) Performance comparison of a pilot-scalemembrane bioreactor and a full-scale sequencing batch reactor with sand filtration:treatment of low strength wastewater from a northern Canadian aboriginal com-munity, Proceedings of Water Environment – Membrane Technology Conference, Seoul,Korea.
Freitas, C. and Teixeira, J.A. (2001) Oxygen mass transfer in a high solids loadingthree-phase internal-loop airlift reactor. Chem. Eng. J., 84, 57–61.
Frolund, B., Palmgren, R., Keiding, K. and Nielsen, P.H. (1996) Extraction ofextracellular polymers from activated sludge using a cation exchange resin. WaterRes., 30, 1749–1758.
106 The MBR Book
1856174817_Ch02.qxd 6/5/06 12:08 PM Page 106
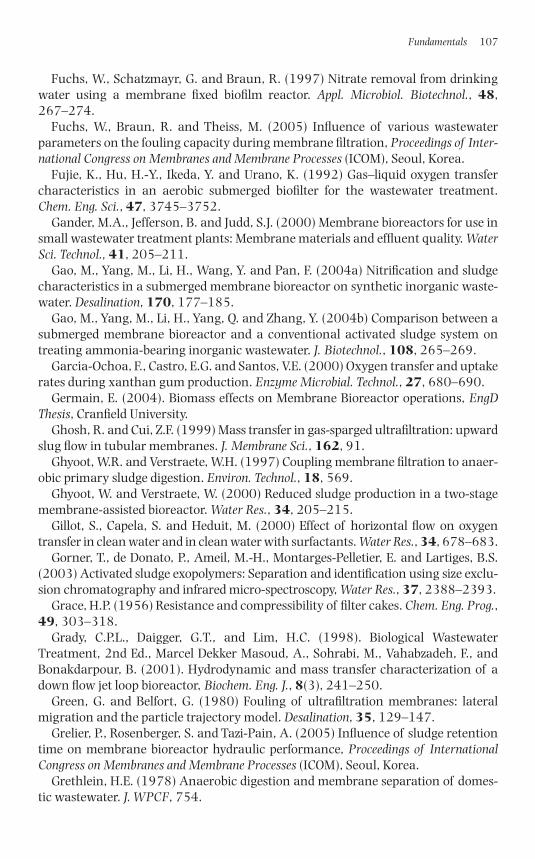
Fuchs, W., Schatzmayr, G. and Braun, R. (1997) Nitrate removal from drinkingwater using a membrane fixed biofilm reactor. Appl. Microbiol. Biotechnol., 48,267–274.
Fuchs, W., Braun, R. and Theiss, M. (2005) Influence of various wastewaterparameters on the fouling capacity during membrane filtration, Proceedings of Inter-national Congress on Membranes and Membrane Processes (ICOM), Seoul, Korea.
Fujie, K., Hu, H.-Y., Ikeda, Y. and Urano, K. (1992) Gas–liquid oxygen transfercharacteristics in an aerobic submerged biofilter for the wastewater treatment.Chem. Eng. Sci., 47, 3745–3752.
Gander, M.A., Jefferson, B. and Judd, S.J. (2000) Membrane bioreactors for use insmall wastewater treatment plants: Membrane materials and effluent quality. WaterSci. Technol., 41, 205–211.
Gao, M., Yang, M., Li, H., Wang, Y. and Pan, F. (2004a) Nitrification and sludgecharacteristics in a submerged membrane bioreactor on synthetic inorganic waste-water. Desalination, 170, 177–185.
Gao, M., Yang, M., Li, H., Yang, Q. and Zhang, Y. (2004b) Comparison between asubmerged membrane bioreactor and a conventional activated sludge system ontreating ammonia-bearing inorganic wastewater. J. Biotechnol., 108, 265–269.
Garcia-Ochoa, F., Castro, E.G. and Santos, V.E. (2000) Oxygen transfer and uptakerates during xanthan gum production. Enzyme Microbial. Technol., 27, 680–690.
Germain, E. (2004). Biomass effects on Membrane Bioreactor operations, EngDThesis, Cranfield University.
Ghosh, R. and Cui, Z.F. (1999) Mass transfer in gas-sparged ultrafiltration: upwardslug flow in tubular membranes. J. Membrane Sci., 162, 91.
Ghyoot, W.R. and Verstraete, W.H. (1997) Coupling membrane filtration to anaer-obic primary sludge digestion. Environ. Technol., 18, 569.
Ghyoot, W. and Verstraete, W. (2000) Reduced sludge production in a two-stagemembrane-assisted bioreactor. Water Res., 34, 205–215.
Gillot, S., Capela, S. and Heduit, M. (2000) Effect of horizontal flow on oxygentransfer in clean water and in clean water with surfactants. Water Res., 34, 678–683.
Gorner, T., de Donato, P., Ameil, M.-H., Montarges-Pelletier, E. and Lartiges, B.S.(2003) Activated sludge exopolymers: Separation and identification using size exclu-sion chromatography and infrared micro-spectroscopy, Water Res., 37, 2388–2393.
Grace, H.P. (1956) Resistance and compressibility of filter cakes. Chem. Eng. Prog.,49, 303–318.
Grady, C.P.L., Daigger, G.T., and Lim, H.C. (1998). Biological WastewaterTreatment, 2nd Ed., Marcel Dekker Masoud, A., Sohrabi, M., Vahabzadeh, F., andBonakdarpour, B. (2001). Hydrodynamic and mass transfer characterization of adown flow jet loop bioreactor, Biochem. Eng. J., 8(3), 241–250.
Green, G. and Belfort, G. (1980) Fouling of ultrafiltration membranes: lateralmigration and the particle trajectory model. Desalination, 35, 129–147.
Grelier, P., Rosenberger, S. and Tazi-Pain, A. (2005) Influence of sludge retentiontime on membrane bioreactor hydraulic performance, Proceedings of InternationalCongress on Membranes and Membrane Processes (ICOM), Seoul, Korea.
Grethlein, H.E. (1978) Anaerobic digestion and membrane separation of domes-tic wastewater. J. WPCF, 754.
Fundamentals 107
1856174817_Ch02.qxd 6/5/06 12:08 PM Page 107
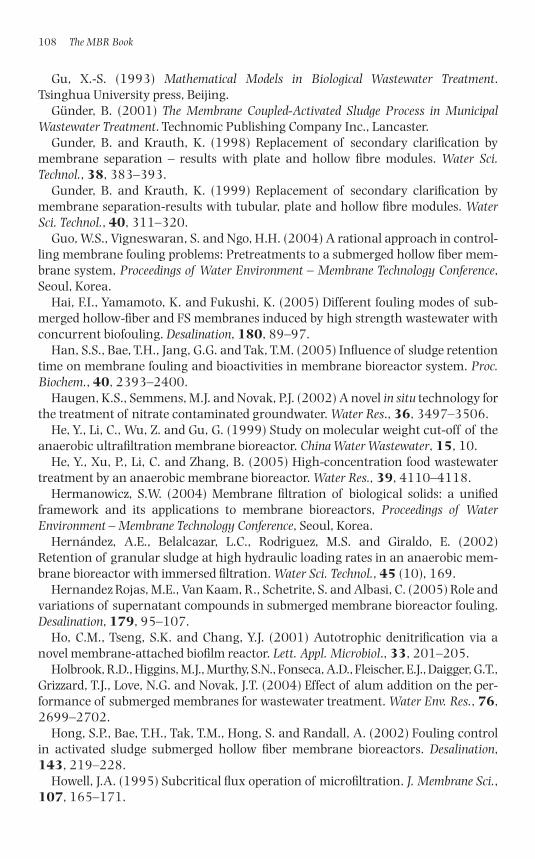
Gu, X.-S. (1993) Mathematical Models in Biological Wastewater Treatment.Tsinghua University press, Beijing.
Günder, B. (2001) The Membrane Coupled-Activated Sludge Process in MunicipalWastewater Treatment. Technomic Publishing Company Inc., Lancaster.
Gunder, B. and Krauth, K. (1998) Replacement of secondary clarification bymembrane separation – results with plate and hollow fibre modules. Water Sci.Technol., 38, 383–393.
Gunder, B. and Krauth, K. (1999) Replacement of secondary clarification bymembrane separation-results with tubular, plate and hollow fibre modules. WaterSci. Technol., 40, 311–320.
Guo, W.S., Vigneswaran, S. and Ngo, H.H. (2004) A rational approach in control-ling membrane fouling problems: Pretreatments to a submerged hollow fiber mem-brane system, Proceedings of Water Environment – Membrane Technology Conference,Seoul, Korea.
Hai, F.I., Yamamoto, K. and Fukushi, K. (2005) Different fouling modes of sub-merged hollow-fiber and FS membranes induced by high strength wastewater withconcurrent biofouling. Desalination, 180, 89–97.
Han, S.S., Bae, T.H., Jang, G.G. and Tak, T.M. (2005) Influence of sludge retentiontime on membrane fouling and bioactivities in membrane bioreactor system. Proc.Biochem., 40, 2393–2400.
Haugen, K.S., Semmens, M.J. and Novak, P.J. (2002) A novel in situ technology forthe treatment of nitrate contaminated groundwater. Water Res., 36, 3497–3506.
He, Y., Li, C., Wu, Z. and Gu, G. (1999) Study on molecular weight cut-off of theanaerobic ultrafiltration membrane bioreactor. China Water Wastewater, 15, 10.
He, Y., Xu, P., Li, C. and Zhang, B. (2005) High-concentration food wastewatertreatment by an anaerobic membrane bioreactor. Water Res., 39, 4110–4118.
Hermanowicz, S.W. (2004) Membrane filtration of biological solids: a unifiedframework and its applications to membrane bioreactors, Proceedings of WaterEnvironment – Membrane Technology Conference, Seoul, Korea.
Hernández, A.E., Belalcazar, L.C., Rodriguez, M.S. and Giraldo, E. (2002)Retention of granular sludge at high hydraulic loading rates in an anaerobic mem-brane bioreactor with immersed filtration. Water Sci. Technol., 45 (10), 169.
Hernandez Rojas, M.E., Van Kaam, R., Schetrite, S. and Albasi, C. (2005) Role andvariations of supernatant compounds in submerged membrane bioreactor fouling.Desalination, 179, 95–107.
Ho, C.M., Tseng, S.K. and Chang, Y.J. (2001) Autotrophic denitrification via anovel membrane-attached biofilm reactor. Lett. Appl. Microbiol., 33, 201–205.
Holbrook, R.D., Higgins, M.J., Murthy, S.N., Fonseca, A.D., Fleischer, E.J., Daigger, G.T.,Grizzard, T.J., Love, N.G. and Novak, J.T. (2004) Effect of alum addition on the per-formance of submerged membranes for wastewater treatment. Water Env. Res., 76,2699–2702.
Hong, S.P., Bae, T.H., Tak, T.M., Hong, S. and Randall, A. (2002) Fouling controlin activated sludge submerged hollow fiber membrane bioreactors. Desalination,143, 219–228.
Howell, J.A. (1995) Subcritical flux operation of microfiltration. J. Membrane Sci.,107, 165–171.
108 The MBR Book
1856174817_Ch02.qxd 6/5/06 12:08 PM Page 108
Howell, J.A., Chua, H.C. and Arnot, T.C. (2004) In situ manipulation of criticalflux in a submerged membrane bioreactor using variable aeration rates, and effectsof membrane history. J. Membrane Sci., 242, 13–19.
Huang, X., Gui, P. and Qian, Y. (2001) Effect of sludge retention time on microbialbehaviour in a submerged membrane bioreactor. Proc. Biochem., 36, 1001–1006.
Hwang, S.-J. and Lu, W.-J. (1997) Gas–liquid mass transfer in an internal loop air-lift reactor with low density particles. Chem. Eng. Sci., 52, 853–857.
Imasaka, T., Kanekuni, N., So, H. and Yoshino, H. (1989) Cross-flow of methanefermentation broth by ceramic membrane. J. Ferment. Bioeng., 68, 200.
Iranpour, R., Magallanes, M., Zermeño, M., Varsh, V., Abrishamchi, A. andStenstrom, M. (2000) Assessment of aeration basin performance efficiency: sam-pling methods and tank coverage. Water Res., 34(12), 3137–3152.
Ishiguro, K., Imai, K. and Sawada, S. (1994) Effects of biological treatment condi-tions on permeate flux of uf membrane in a membrane/activated-sludge waste-water treatment system. Desalination, 98, 119–126.
Itonaga, T., Kimura, K. and Watanabe, Y. (2004) Influence of suspension viscosityand colloidal particles on permeability of membrane used in membrane bioreactor(mbr). Water Sci. Technol., 50, 301–309.
IUPAC (1985) Reporting physisorption data. Pure Appl. Chem., 57, 603.Jang, N.J., Yeo, Y.H., Hwang, M.H., Vigneswaran, S., Cho, J. and Kim, I.S. (2004)
The effect of dissolved air on the filtration resistance in the hollow fiber membranebioreactor, Proceedings of Water Environment – Membrane Technology Conference,Seoul, Korea.
Jang, N., Ren, X., Choi, K. and Kim, I.S. (2005a) Comparison of membrane bio-fouling in nitrification and denitrification for the membrane bio-reactor (mbr),Proceedings of IWA, Aspire, Singapore.
Jang, N.J., Trussell, R.S., Merlo, R.P., Jenkins, D., Hermanowicz, S.W. and Kim, I.S.(2005b) Exocellular polymeric substances molecular weight distribution and filtra-tion resistance as a function of food to microorganism ratio in the submerged mem-brane bioreactor, Proceedings of International Congress on Membranes and MembraneProcesses (ICOM), Seoul, Korea.
Jefferson, B., Brookes, A., Le Clech, P. and Judd, S.J. (2004) Methods for under-standing organic fouling in mbrs. Water Sci. Technol., 49, 237–244.
Ji, L. and Zhou, J. (2006) Influence of aeration on microbial polymers and mem-brane fouling in submerged membrane bioreactors. J. Membrane Sci., in press.
Jiang, T., Kennedy, M.D., Guinzbourg, B.F., Vanrolleghem, P.A. and Schippers, J.C.(2005) Optimising the operation of a mbr pilot plant by quantitative analysis of themembrane fouling mechanism. Water Sci. Technol., 51, 19–25.
Jin, B., Yu, Q., Yan, X.Q. and van Leeuwen, J.H. (2001) Characterization andimprovement of oxygen transfer in pilot plant external air-lift bioreactor for mycelialbiomass production. World J. Microbiol. Biotechnol., 17, 265–272.
Jinhua, P., Fukushi, K. and Yamamoto, K. (2004) Structure of microbial commu-nities on membrane surface in a submerged membrane bioreactor, Proceedings ofWater Environment – Membrane Technology Conference, Seoul, Korea.
Judd, S. (2005) Fouling control in submerged membrane bioreactors. Water Sci.Technol., 51(6–7), 27–34.
Fundamentals 109
1856174817_Ch02.qxd 6/5/06 12:08 PM Page 109
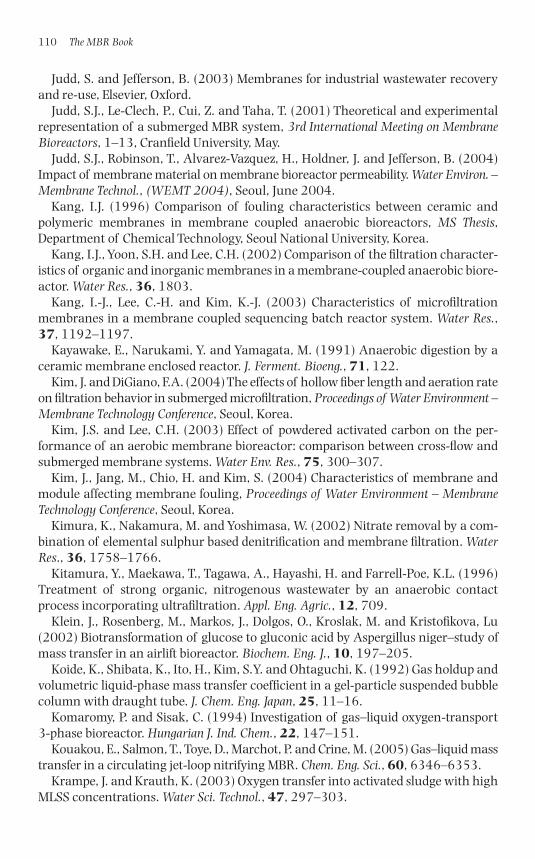
Judd, S. and Jefferson, B. (2003) Membranes for industrial wastewater recoveryand re-use, Elsevier, Oxford.
Judd, S.J., Le-Clech, P., Cui, Z. and Taha, T. (2001) Theoretical and experimentalrepresentation of a submerged MBR system, 3rd International Meeting on MembraneBioreactors, 1–13, Cranfield University, May.
Judd, S.J., Robinson, T., Alvarez-Vazquez, H., Holdner, J. and Jefferson, B. (2004)Impact of membrane material on membrane bioreactor permeability. Water Environ. –Membrane Technol., (WEMT 2004), Seoul, June 2004.
Kang, I.J. (1996) Comparison of fouling characteristics between ceramic andpolymeric membranes in membrane coupled anaerobic bioreactors, MS Thesis,Department of Chemical Technology, Seoul National University, Korea.
Kang, I.J., Yoon, S.H. and Lee, C.H. (2002) Comparison of the filtration character-istics of organic and inorganic membranes in a membrane-coupled anaerobic biore-actor. Water Res., 36, 1803.
Kang, I.-J., Lee, C.-H. and Kim, K.-J. (2003) Characteristics of microfiltrationmembranes in a membrane coupled sequencing batch reactor system. Water Res.,37, 1192–1197.
Kayawake, E., Narukami, Y. and Yamagata, M. (1991) Anaerobic digestion by aceramic membrane enclosed reactor. J. Ferment. Bioeng., 71, 122.
Kim, J. and DiGiano, F.A. (2004) The effects of hollow fiber length and aeration rateon filtration behavior in submerged microfiltration, Proceedings of Water Environment –Membrane Technology Conference, Seoul, Korea.
Kim, J.S. and Lee, C.H. (2003) Effect of powdered activated carbon on the per-formance of an aerobic membrane bioreactor: comparison between cross-flow andsubmerged membrane systems. Water Env. Res., 75, 300–307.
Kim, J., Jang, M., Chio, H. and Kim, S. (2004) Characteristics of membrane andmodule affecting membrane fouling, Proceedings of Water Environment – MembraneTechnology Conference, Seoul, Korea.
Kimura, K., Nakamura, M. and Yoshimasa, W. (2002) Nitrate removal by a com-bination of elemental sulphur based denitrification and membrane filtration. WaterRes., 36, 1758–1766.
Kitamura, Y., Maekawa, T., Tagawa, A., Hayashi, H. and Farrell-Poe, K.L. (1996)Treatment of strong organic, nitrogenous wastewater by an anaerobic contactprocess incorporating ultrafiltration. Appl. Eng. Agric., 12, 709.
Klein, J., Rosenberg, M., Markos, J., Dolgos, O., Kroslak, M. and Kristofikova, Lu(2002) Biotransformation of glucose to gluconic acid by Aspergillus niger–study ofmass transfer in an airlift bioreactor. Biochem. Eng. J., 10, 197–205.
Koide, K., Shibata, K., Ito, H., Kim, S.Y. and Ohtaguchi, K. (1992) Gas holdup andvolumetric liquid-phase mass transfer coefficient in a gel-particle suspended bubblecolumn with draught tube. J. Chem. Eng. Japan, 25, 11–16.
Komaromy, P. and Sisak, C. (1994) Investigation of gas–liquid oxygen-transport 3-phase bioreactor. Hungarian J. Ind. Chem., 22, 147–151.
Kouakou, E., Salmon, T., Toye, D., Marchot, P. and Crine, M. (2005) Gas–liquid masstransfer in a circulating jet-loop nitrifying MBR. Chem. Eng. Sci., 60, 6346–6353.
Krampe, J. and Krauth, K. (2003) Oxygen transfer into activated sludge with highMLSS concentrations. Water Sci. Technol., 47, 297–303.
110 The MBR Book
1856174817_Ch02.qxd 6/5/06 12:08 PM Page 110
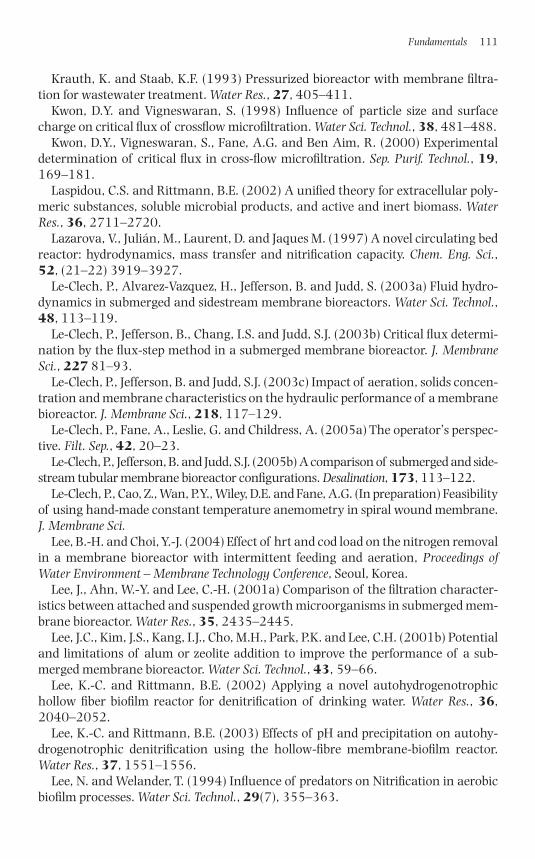
Krauth, K. and Staab, K.F. (1993) Pressurized bioreactor with membrane filtra-tion for wastewater treatment. Water Res., 27, 405–411.
Kwon, D.Y. and Vigneswaran, S. (1998) Influence of particle size and surfacecharge on critical flux of crossflow microfiltration. Water Sci. Technol., 38, 481–488.
Kwon, D.Y., Vigneswaran, S., Fane, A.G. and Ben Aim, R. (2000) Experimentaldetermination of critical flux in cross-flow microfiltration. Sep. Purif. Technol., 19,169–181.
Laspidou, C.S. and Rittmann, B.E. (2002) A unified theory for extracellular poly-meric substances, soluble microbial products, and active and inert biomass. WaterRes., 36, 2711–2720.
Lazarova, V., Julián, M., Laurent, D. and Jaques M. (1997) A novel circulating bedreactor: hydrodynamics, mass transfer and nitrification capacity. Chem. Eng. Sci.,52, (21–22) 3919–3927.
Le-Clech, P., Alvarez-Vazquez, H., Jefferson, B. and Judd, S. (2003a) Fluid hydro-dynamics in submerged and sidestream membrane bioreactors. Water Sci. Technol.,48, 113–119.
Le-Clech, P., Jefferson, B., Chang, I.S. and Judd, S.J. (2003b) Critical flux determi-nation by the flux-step method in a submerged membrane bioreactor. J. MembraneSci., 227 81–93.
Le-Clech, P., Jefferson, B. and Judd, S.J. (2003c) Impact of aeration, solids concen-tration and membrane characteristics on the hydraulic performance of a membranebioreactor. J. Membrane Sci., 218, 117–129.
Le-Clech, P., Fane, A., Leslie, G. and Childress, A. (2005a) The operator’s perspec-tive. Filt. Sep., 42, 20–23.
Le-Clech, P., Jefferson, B. and Judd, S.J. (2005b) A comparison of submerged and side-stream tubular membrane bioreactor configurations. Desalination, 173, 113–122.
Le-Clech, P., Cao, Z., Wan, P.Y., Wiley, D.E. and Fane, A.G. (In preparation) Feasibilityof using hand-made constant temperature anemometry in spiral wound membrane.J. Membrane Sci.
Lee, B.-H. and Choi, Y.-J. (2004) Effect of hrt and cod load on the nitrogen removalin a membrane bioreactor with intermittent feeding and aeration, Proceedings ofWater Environment – Membrane Technology Conference, Seoul, Korea.
Lee, J., Ahn, W.-Y. and Lee, C.-H. (2001a) Comparison of the filtration character-istics between attached and suspended growth microorganisms in submerged mem-brane bioreactor. Water Res., 35, 2435–2445.
Lee, J.C., Kim, J.S., Kang, I.J., Cho, M.H., Park, P.K. and Lee, C.H. (2001b) Potentialand limitations of alum or zeolite addition to improve the performance of a sub-merged membrane bioreactor. Water Sci. Technol., 43, 59–66.
Lee, K.-C. and Rittmann, B.E. (2002) Applying a novel autohydrogenotrophic hollow fiber biofilm reactor for denitrification of drinking water. Water Res., 36,2040–2052.
Lee, K.-C. and Rittmann, B.E. (2003) Effects of pH and precipitation on autohy-drogenotrophic denitrification using the hollow-fibre membrane-biofilm reactor.Water Res., 37, 1551–1556.
Lee, N. and Welander, T. (1994) Influence of predators on Nitrification in aerobicbiofilm processes. Water Sci. Technol., 29(7), 355–363.
Fundamentals 111
1856174817_Ch02.qxd 6/5/06 12:08 PM Page 111
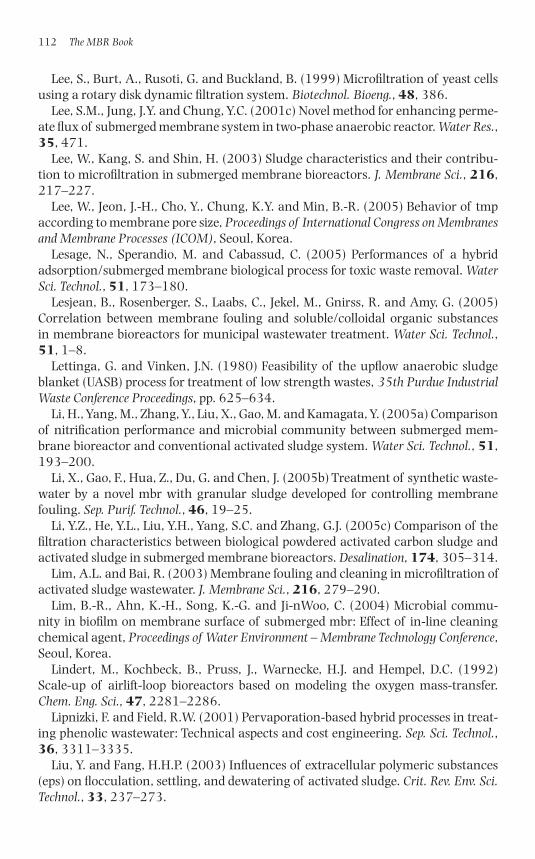
Lee, S., Burt, A., Rusoti, G. and Buckland, B. (1999) Microfiltration of yeast cellsusing a rotary disk dynamic filtration system. Biotechnol. Bioeng., 48, 386.
Lee, S.M., Jung, J.Y. and Chung, Y.C. (2001c) Novel method for enhancing perme-ate flux of submerged membrane system in two-phase anaerobic reactor. Water Res.,35, 471.
Lee, W., Kang, S. and Shin, H. (2003) Sludge characteristics and their contribu-tion to microfiltration in submerged membrane bioreactors. J. Membrane Sci., 216,217–227.
Lee, W., Jeon, J.-H., Cho, Y., Chung, K.Y. and Min, B.-R. (2005) Behavior of tmpaccording to membrane pore size, Proceedings of International Congress on Membranesand Membrane Processes (ICOM), Seoul, Korea.
Lesage, N., Sperandio, M. and Cabassud, C. (2005) Performances of a hybridadsorption/submerged membrane biological process for toxic waste removal. WaterSci. Technol., 51, 173–180.
Lesjean, B., Rosenberger, S., Laabs, C., Jekel, M., Gnirss, R. and Amy, G. (2005)Correlation between membrane fouling and soluble/colloidal organic substancesin membrane bioreactors for municipal wastewater treatment. Water Sci. Technol.,51, 1–8.
Lettinga, G. and Vinken, J.N. (1980) Feasibility of the upflow anaerobic sludgeblanket (UASB) process for treatment of low strength wastes, 35th Purdue IndustrialWaste Conference Proceedings, pp. 625–634.
Li, H., Yang, M., Zhang, Y., Liu, X., Gao, M. and Kamagata, Y. (2005a) Comparisonof nitrification performance and microbial community between submerged mem-brane bioreactor and conventional activated sludge system. Water Sci. Technol., 51,193–200.
Li, X., Gao, F., Hua, Z., Du, G. and Chen, J. (2005b) Treatment of synthetic waste-water by a novel mbr with granular sludge developed for controlling membranefouling. Sep. Purif. Technol., 46, 19–25.
Li, Y.Z., He, Y.L., Liu, Y.H., Yang, S.C. and Zhang, G.J. (2005c) Comparison of thefiltration characteristics between biological powdered activated carbon sludge andactivated sludge in submerged membrane bioreactors. Desalination, 174, 305–314.
Lim, A.L. and Bai, R. (2003) Membrane fouling and cleaning in microfiltration ofactivated sludge wastewater. J. Membrane Sci., 216, 279–290.
Lim, B.-R., Ahn, K.-H., Song, K.-G. and Ji-nWoo, C. (2004) Microbial commu-nity in biofilm on membrane surface of submerged mbr: Effect of in-line cleaningchemical agent, Proceedings of Water Environment – Membrane Technology Conference,Seoul, Korea.
Lindert, M., Kochbeck, B., Pruss, J., Warnecke, H.J. and Hempel, D.C. (1992)Scale-up of airlift-loop bioreactors based on modeling the oxygen mass-transfer.Chem. Eng. Sci., 47, 2281–2286.
Lipnizki, F. and Field, R.W. (2001) Pervaporation-based hybrid processes in treat-ing phenolic wastewater: Technical aspects and cost engineering. Sep. Sci. Technol.,36, 3311–3335.
Liu, Y. and Fang, H.H.P. (2003) Influences of extracellular polymeric substances(eps) on flocculation, settling, and dewatering of activated sludge. Crit. Rev. Env. Sci.Technol., 33, 237–273.
112 The MBR Book
1856174817_Ch02.qxd 6/5/06 12:08 PM Page 112
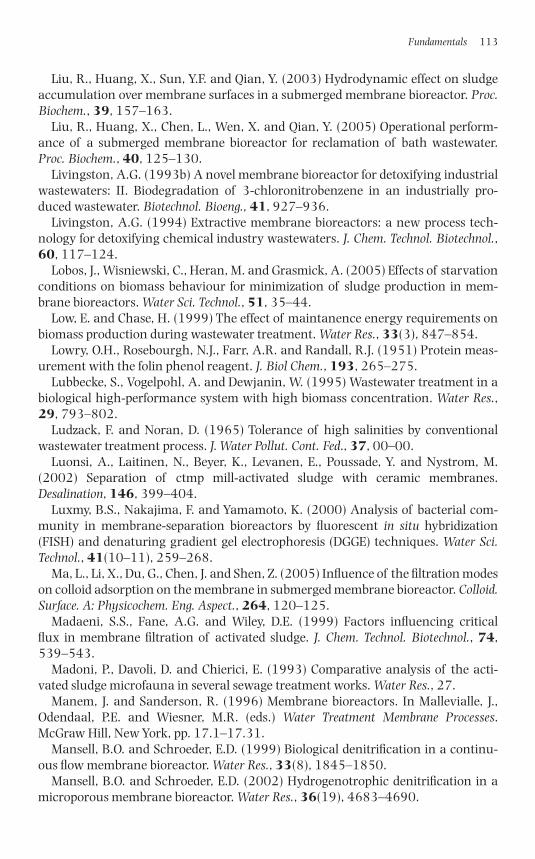
Liu, R., Huang, X., Sun, Y.F. and Qian, Y. (2003) Hydrodynamic effect on sludgeaccumulation over membrane surfaces in a submerged membrane bioreactor. Proc.Biochem., 39, 157–163.
Liu, R., Huang, X., Chen, L., Wen, X. and Qian, Y. (2005) Operational perform-ance of a submerged membrane bioreactor for reclamation of bath wastewater.Proc. Biochem., 40, 125–130.
Livingston, A.G. (1993b) A novel membrane bioreactor for detoxifying industrialwastewaters: II. Biodegradation of 3-chloronitrobenzene in an industrially pro-duced wastewater. Biotechnol. Bioeng., 41, 927–936.
Livingston, A.G. (1994) Extractive membrane bioreactors: a new process tech-nology for detoxifying chemical industry wastewaters. J. Chem. Technol. Biotechnol.,60, 117–124.
Lobos, J., Wisniewski, C., Heran, M. and Grasmick, A. (2005) Effects of starvationconditions on biomass behaviour for minimization of sludge production in mem-brane bioreactors. Water Sci. Technol., 51, 35–44.
Low, E. and Chase, H. (1999) The effect of maintanence energy requirements onbiomass production during wastewater treatment. Water Res., 33(3), 847–854.
Lowry, O.H., Rosebourgh, N.J., Farr, A.R. and Randall, R.J. (1951) Protein meas-urement with the folin phenol reagent. J. Biol Chem., 193, 265–275.
Lubbecke, S., Vogelpohl, A. and Dewjanin, W. (1995) Wastewater treatment in abiological high-performance system with high biomass concentration. Water Res.,29, 793–802.
Ludzack, F. and Noran, D. (1965) Tolerance of high salinities by conventionalwastewater treatment process. J. Water Pollut. Cont. Fed., 37, 00–00.
Luonsi, A., Laitinen, N., Beyer, K., Levanen, E., Poussade, Y. and Nystrom, M.(2002) Separation of ctmp mill-activated sludge with ceramic membranes.Desalination, 146, 399–404.
Luxmy, B.S., Nakajima, F. and Yamamoto, K. (2000) Analysis of bacterial com-munity in membrane-separation bioreactors by fluorescent in situ hybridization(FISH) and denaturing gradient gel electrophoresis (DGGE) techniques. Water Sci.Technol., 41(10–11), 259–268.
Ma, L., Li, X., Du, G., Chen, J. and Shen, Z. (2005) Influence of the filtration modeson colloid adsorption on the membrane in submerged membrane bioreactor. Colloid.Surface. A: Physicochem. Eng. Aspect., 264, 120–125.
Madaeni, S.S., Fane, A.G. and Wiley, D.E. (1999) Factors influencing critical flux in membrane filtration of activated sludge. J. Chem. Technol. Biotechnol., 74,539–543.
Madoni, P., Davoli, D. and Chierici, E. (1993) Comparative analysis of the acti-vated sludge microfauna in several sewage treatment works. Water Res., 27.
Manem, J. and Sanderson, R. (1996) Membrane bioreactors. In Mallevialle, J.,Odendaal, P.E. and Wiesner, M.R. (eds.) Water Treatment Membrane Processes.McGraw Hill, New York, pp. 17.1–17.31.
Mansell, B.O. and Schroeder, E.D. (1999) Biological denitrification in a continu-ous flow membrane bioreactor. Water Res., 33(8), 1845–1850.
Mansell, B.O. and Schroeder, E.D. (2002) Hydrogenotrophic denitrification in amicroporous membrane bioreactor. Water Res., 36(19), 4683–4690.
Fundamentals 113
1856174817_Ch02.qxd 6/5/06 12:08 PM Page 113
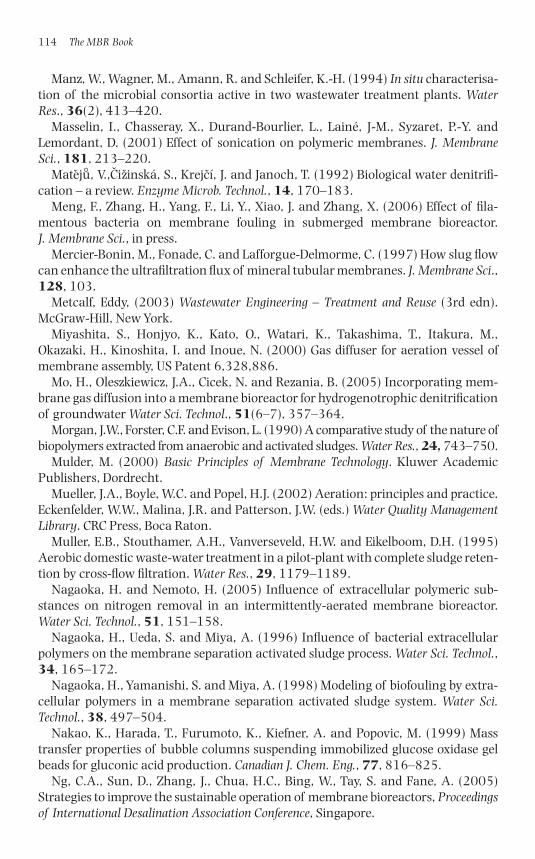
Manz, W., Wagner, M., Amann, R. and Schleifer, K.-H. (1994) In situ characterisa-tion of the microbial consortia active in two wastewater treatment plants. WaterRes., 36(2), 413–420.
Masselin, I., Chasseray, X., Durand-Bourlier, L., Lainé, J-M., Syzaret, P.-Y. andLemordant, D. (2001) Effect of sonication on polymeric membranes. J. MembraneSci., 181, 213–220.
Matej°u, V.,Cizinská, S., Krejcí, J. and Janoch, T. (1992) Biological water denitrifi-cation – a review. Enzyme Microb. Technol., 14, 170–183.
Meng, F., Zhang, H., Yang, F., Li, Y., Xiao, J. and Zhang, X. (2006) Effect of fila-mentous bacteria on membrane fouling in submerged membrane bioreactor. J. Membrane Sci., in press.
Mercier-Bonin, M., Fonade, C. and Lafforgue-Delmorme, C. (1997) How slug flowcan enhance the ultrafiltration flux of mineral tubular membranes. J. Membrane Sci.,128, 103.
Metcalf, Eddy, (2003) Wastewater Engineering – Treatment and Reuse (3rd edn).McGraw-Hill, New York.
Miyashita, S., Honjyo, K., Kato, O., Watari, K., Takashima, T., Itakura, M.,Okazaki, H., Kinoshita, I. and Inoue, N. (2000) Gas diffuser for aeration vessel ofmembrane assembly, US Patent 6,328,886.
Mo, H., Oleszkiewicz, J.A., Cicek, N. and Rezania, B. (2005) Incorporating mem-brane gas diffusion into a membrane bioreactor for hydrogenotrophic denitrificationof groundwater Water Sci. Technol., 51(6–7), 357–364.
Morgan, J.W., Forster, C.F. and Evison, L. (1990) A comparative study of the nature ofbiopolymers extracted from anaerobic and activated sludges. Water Res., 24, 743–750.
Mulder, M. (2000) Basic Principles of Membrane Technology. Kluwer AcademicPublishers, Dordrecht.
Mueller, J.A., Boyle, W.C. and Popel, H.J. (2002) Aeration: principles and practice.Eckenfelder, W.W., Malina, J.R. and Patterson, J.W. (eds.) Water Quality ManagementLibrary. CRC Press, Boca Raton.
Muller, E.B., Stouthamer, A.H., Vanverseveld, H.W. and Eikelboom, D.H. (1995)Aerobic domestic waste-water treatment in a pilot-plant with complete sludge reten-tion by cross-flow filtration. Water Res., 29, 1179–1189.
Nagaoka, H. and Nemoto, H. (2005) Influence of extracellular polymeric sub-stances on nitrogen removal in an intermittently-aerated membrane bioreactor.Water Sci. Technol., 51, 151–158.
Nagaoka, H., Ueda, S. and Miya, A. (1996) Influence of bacterial extracellularpolymers on the membrane separation activated sludge process. Water Sci. Technol.,34, 165–172.
Nagaoka, H., Yamanishi, S. and Miya, A. (1998) Modeling of biofouling by extra-cellular polymers in a membrane separation activated sludge system. Water Sci.Technol., 38, 497–504.
Nakao, K., Harada, T., Furumoto, K., Kiefner, A. and Popovic, M. (1999) Masstransfer properties of bubble columns suspending immobilized glucose oxidase gelbeads for gluconic acid production. Canadian J. Chem. Eng., 77, 816–825.
Ng, C.A., Sun, D., Zhang, J., Chua, H.C., Bing, W., Tay, S. and Fane, A. (2005)Strategies to improve the sustainable operation of membrane bioreactors, Proceedingsof International Desalination Association Conference, Singapore.
114 The MBR Book
1856174817_Ch02.qxd 6/5/06 12:08 PM Page 114
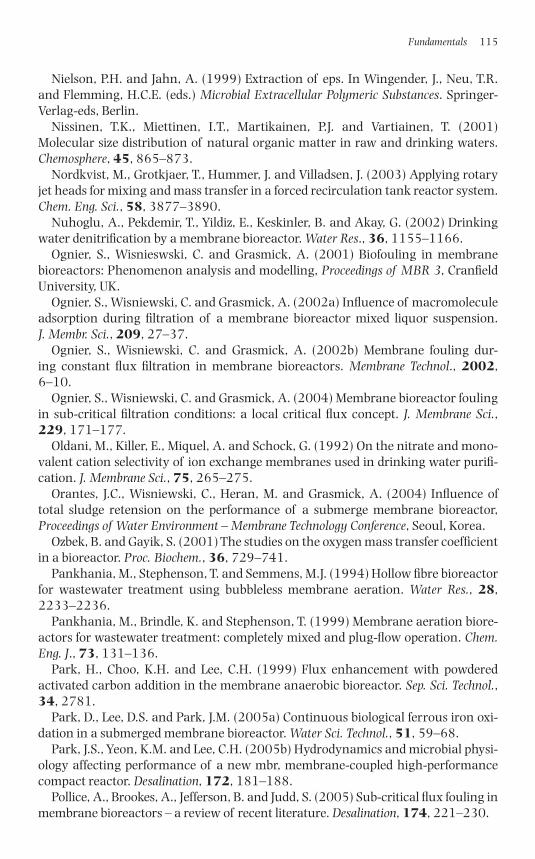
Nielson, P.H. and Jahn, A. (1999) Extraction of eps. In Wingender, J., Neu, T.R.and Flemming, H.C.E. (eds.) Microbial Extracellular Polymeric Substances. Springer-Verlag-eds, Berlin.
Nissinen, T.K., Miettinen, I.T., Martikainen, P.J. and Vartiainen, T. (2001)Molecular size distribution of natural organic matter in raw and drinking waters.Chemosphere, 45, 865–873.
Nordkvist, M., Grotkjaer, T., Hummer, J. and Villadsen, J. (2003) Applying rotaryjet heads for mixing and mass transfer in a forced recirculation tank reactor system.Chem. Eng. Sci., 58, 3877–3890.
Nuhoglu, A., Pekdemir, T., Yildiz, E., Keskinler, B. and Akay, G. (2002) Drinkingwater denitrification by a membrane bioreactor. Water Res., 36, 1155–1166.
Ognier, S., Wisnieswski, C. and Grasmick, A. (2001) Biofouling in membranebioreactors: Phenomenon analysis and modelling, Proceedings of MBR 3, CranfieldUniversity, UK.
Ognier, S., Wisniewski, C. and Grasmick, A. (2002a) Influence of macromoleculeadsorption during filtration of a membrane bioreactor mixed liquor suspension. J. Membr. Sci., 209, 27–37.
Ognier, S., Wisniewski, C. and Grasmick, A. (2002b) Membrane fouling dur-ing constant flux filtration in membrane bioreactors. Membrane Technol., 2002,6–10.
Ognier, S., Wisniewski, C. and Grasmick, A. (2004) Membrane bioreactor foulingin sub-critical filtration conditions: a local critical flux concept. J. Membrane Sci.,229, 171–177.
Oldani, M., Killer, E., Miquel, A. and Schock, G. (1992) On the nitrate and mono-valent cation selectivity of ion exchange membranes used in drinking water purifi-cation. J. Membrane Sci., 75, 265–275.
Orantes, J.C., Wisniewski, C., Heran, M. and Grasmick, A. (2004) Influence oftotal sludge retension on the performance of a submerge membrane bioreactor,Proceedings of Water Environment – Membrane Technology Conference, Seoul, Korea.
Ozbek, B. and Gayik, S. (2001) The studies on the oxygen mass transfer coefficientin a bioreactor. Proc. Biochem., 36, 729–741.
Pankhania, M., Stephenson, T. and Semmens, M.J. (1994) Hollow fibre bioreactorfor wastewater treatment using bubbleless membrane aeration. Water Res., 28,2233–2236.
Pankhania, M., Brindle, K. and Stephenson, T. (1999) Membrane aeration biore-actors for wastewater treatment: completely mixed and plug-flow operation. Chem.Eng. J., 73, 131–136.
Park, H., Choo, K.H. and Lee, C.H. (1999) Flux enhancement with powdered activated carbon addition in the membrane anaerobic bioreactor. Sep. Sci. Technol.,34, 2781.
Park, D., Lee, D.S. and Park, J.M. (2005a) Continuous biological ferrous iron oxi-dation in a submerged membrane bioreactor. Water Sci. Technol., 51, 59–68.
Park, J.S., Yeon, K.M. and Lee, C.H. (2005b) Hydrodynamics and microbial physi-ology affecting performance of a new mbr, membrane-coupled high-performancecompact reactor. Desalination, 172, 181–188.
Pollice, A., Brookes, A., Jefferson, B. and Judd, S. (2005) Sub-critical flux fouling inmembrane bioreactors – a review of recent literature. Desalination, 174, 221–230.
Fundamentals 115
1856174817_Ch02.qxd 6/5/06 12:08 PM Page 115
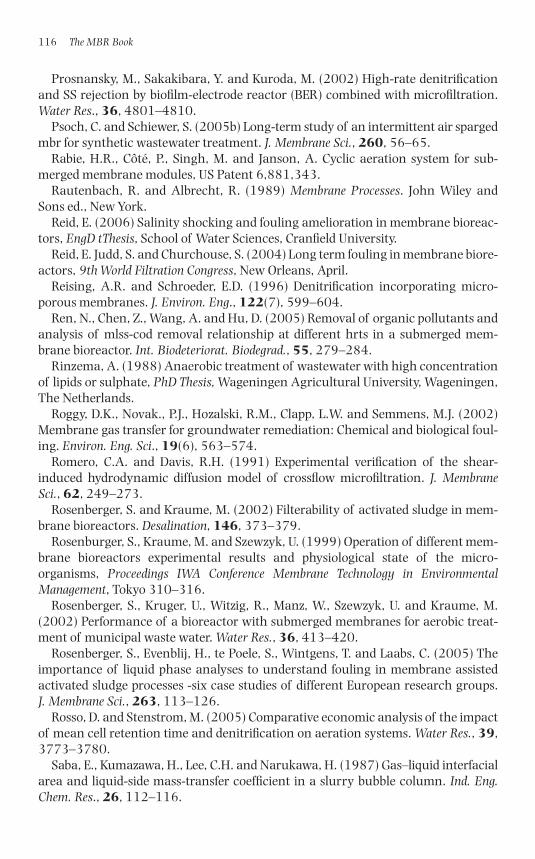
Prosnansky, M., Sakakibara, Y. and Kuroda, M. (2002) High-rate denitrificationand SS rejection by biofilm-electrode reactor (BER) combined with microfiltration.Water Res., 36, 4801–4810.
Psoch, C. and Schiewer, S. (2005b) Long-term study of an intermittent air spargedmbr for synthetic wastewater treatment. J. Membrane Sci., 260, 56–65.
Rabie, H.R., Côté, P., Singh, M. and Janson, A. Cyclic aeration system for sub-merged membrane modules, US Patent 6,881,343.
Rautenbach, R. and Albrecht, R. (1989) Membrane Processes. John Wiley andSons ed., New York.
Reid, E. (2006) Salinity shocking and fouling amelioration in membrane bioreac-tors, EngD tThesis, School of Water Sciences, Cranfield University.
Reid, E. Judd, S. and Churchouse, S. (2004) Long term fouling in membrane biore-actors, 9th World Filtration Congress, New Orleans, April.
Reising, A.R. and Schroeder, E.D. (1996) Denitrification incorporating micro-porous membranes. J. Environ. Eng., 122(7), 599–604.
Ren, N., Chen, Z., Wang, A. and Hu, D. (2005) Removal of organic pollutants andanalysis of mlss-cod removal relationship at different hrts in a submerged mem-brane bioreactor. Int. Biodeteriorat. Biodegrad., 55, 279–284.
Rinzema, A. (1988) Anaerobic treatment of wastewater with high concentrationof lipids or sulphate, PhD Thesis, Wageningen Agricultural University, Wageningen,The Netherlands.
Roggy, D.K., Novak., P.J., Hozalski, R.M., Clapp, L.W. and Semmens, M.J. (2002)Membrane gas transfer for groundwater remediation: Chemical and biological foul-ing. Environ. Eng. Sci., 19(6), 563–574.
Romero, C.A. and Davis, R.H. (1991) Experimental verification of the shear-induced hydrodynamic diffusion model of crossflow microfiltration. J. MembraneSci., 62, 249–273.
Rosenberger, S. and Kraume, M. (2002) Filterability of activated sludge in mem-brane bioreactors. Desalination, 146, 373–379.
Rosenburger, S., Kraume, M. and Szewzyk, U. (1999) Operation of different mem-brane bioreactors experimental results and physiological state of the micro-organisms, Proceedings IWA Conference Membrane Technology in EnvironmentalManagement, Tokyo 310–316.
Rosenberger, S., Kruger, U., Witzig, R., Manz, W., Szewzyk, U. and Kraume, M.(2002) Performance of a bioreactor with submerged membranes for aerobic treat-ment of municipal waste water. Water Res., 36, 413–420.
Rosenberger, S., Evenblij, H., te Poele, S., Wintgens, T. and Laabs, C. (2005) Theimportance of liquid phase analyses to understand fouling in membrane assistedactivated sludge processes -six case studies of different European research groups. J. Membrane Sci., 263, 113–126.
Rosso, D. and Stenstrom, M. (2005) Comparative economic analysis of the impactof mean cell retention time and denitrification on aeration systems. Water Res., 39,3773–3780.
Saba, E., Kumazawa, H., Lee, C.H. and Narukawa, H. (1987) Gas–liquid interfacialarea and liquid-side mass-transfer coefficient in a slurry bubble column. Ind. Eng.Chem. Res., 26, 112–116.
116 The MBR Book
1856174817_Ch02.qxd 6/5/06 12:08 PM Page 116
Sato, T. and Ishii, Y. (1991) Effects of activated-sludge properties on water flux ofultrafiltration membrane used for human excrement treatment. Water Sci. Technol.,23, 1601–1608.
Saw, C.B., Anderson, G.K., James, A. and Le, M.S. (1986) A membrane techniquefor biomass retention in anaerobic waste treatment, Proceedings 40th IndustrialWaste Conference, Purdue University, West Lafayette, Indiana, Ann Arbor Science,Ann Arbor, Michigan, 805.
Schiener, P., Nachaiyasit, S. and Stuckey, D.C. (1998) Production of solublemicrobial products (SMP) in an anaerobic baffled reactor: composition, biodegrad-ability, and the effect of process parameters. Environ. Technol., 19, 391.
Schoeberl, P., Brik, M., Bertoni, M., Braun, R. and Fuchs, W. (2005) Optimizationof operational parameters for a submerged membrane bioreactor treating dyehousewastewater. Sep. Purif. Technol., 44, 61–68.
Schrader, G.A., Zwijnenburg, A. and Wessling, M. (2005) The effect of wwtpeffluent zeta-potential on direct nanofiltration performance. J. Membrane Sci., 266,80–93.
Scott, J.A., Neilson, D.J., Liu, W. and Boon, P.N. (1998) A dual function membranebioreactor system for enhanced aerobic remediation of high-strength industrialwaste. Water Sci. Technol., 38, 413–420.
Seghezzo, L., Zeeman, G., Van Lier, J.B., Hamelers, H.V.M. and Lettinga, G. (1998)A review: the anaerobic treatment of sewage in UASB and EGSB reactors. BioresourceTechnol., 65, 175–190.
Seghezzo, L., Guerra, R.G., Gonzalez, S.M., Trupiano, A.P., Figueroa, M.E., Cuevas,C.M., Zeeman, G. and Lettinga, G. (2002) Removal efficiency and methanogenicactivity profiles in a pilot scale UASB reactor treating settled sewage at moderatetemperatures. Water Sci. Technol., 45(10), 243–248.
Shimizu, Y., Okuno, Y.-I., Uryu, K., Ohtsubo, S. and Watanabe, A. (1996)Filtration characteristics of hollow fiber microfiltration membranes used in mem-brane bioreactor for domestic wastewater treatment. Water Res., 30, 2385–2392.
Shin, H.-S. and Kang, S.-T. (2003) Characteristics and fates of soluble microbialproducts in ceramic membrane bioreactor at various sludge retention times. WaterRes., 37, 121–127.
Singh, K.S. and Viraraghavan, T. (2003) Impact of temperature on performance,microbial, and hydrodynamic aspect of USAB reactors treating municipal waste-water. Water Sci. Technol., 48(6), 211.
Smith, B.C. and Skidmore, D.R. (1990) Mass-transfer phenomena in an airliftreactor – effects of solids loading and temperature. Biotech. Bioeng., 35, 483–491.
Smith, S., Judd, S., Stephenson, T. and Jefferson, B. (2003) Membrane bioreactors –hybrid activated sludge or a new process? Membrane Tech., 5–8.
Smith, P.J., Vigneswaran, S., Ngo, H.H., Ben-Aim, R. and Nguyen, H. (2005)Design of a generic control system for optimising back flush durations in a sub-merged membrane hybrid reactor. J. Membrane Sci., 255, 99–106.
Smith, R. (2006). The MBR at Buxton wastewater plant, presented at The Use and Practice of Membranes in Water and Wastewater in the UK, Meeting of the CharteredInstitution of Water and Envionmental Management (CIWEM), Glasgow, January17, 2006.
Fundamentals 117
1856174817_Ch02.qxd 6/5/06 12:08 PM Page 117
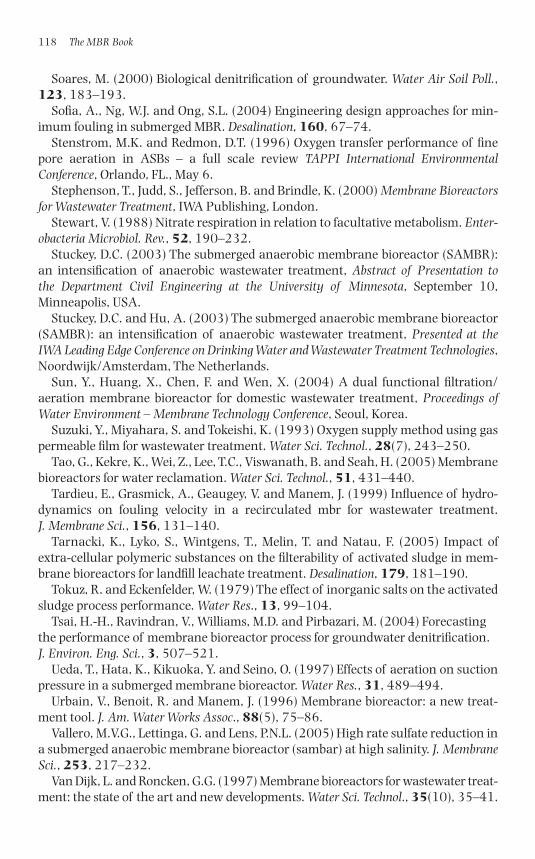
Soares, M. (2000) Biological denitrification of groundwater. Water Air Soil Poll.,123, 183–193.
Sofia, A., Ng, W.J. and Ong, S.L. (2004) Engineering design approaches for min-imum fouling in submerged MBR. Desalination, 160, 67–74.
Stenstrom, M.K. and Redmon, D.T. (1996) Oxygen transfer performance of finepore aeration in ASBs – a full scale review TAPPI International EnvironmentalConference, Orlando, FL., May 6.
Stephenson, T., Judd, S., Jefferson, B. and Brindle, K. (2000) Membrane Bioreactorsfor Wastewater Treatment, IWA Publishing, London.
Stewart, V. (1988) Nitrate respiration in relation to facultative metabolism. Enter-obacteria Microbiol. Rev., 52, 190–232.
Stuckey, D.C. (2003) The submerged anaerobic membrane bioreactor (SAMBR):an intensification of anaerobic wastewater treatment, Abstract of Presentation to the Department Civil Engineering at the University of Minnesota, September 10,Minneapolis, USA.
Stuckey, D.C. and Hu, A. (2003) The submerged anaerobic membrane bioreactor(SAMBR): an intensification of anaerobic wastewater treatment, Presented at theIWA Leading Edge Conference on Drinking Water and Wastewater Treatment Technologies,Noordwijk/Amsterdam, The Netherlands.
Sun, Y., Huang, X., Chen, F. and Wen, X. (2004) A dual functional filtration/aeration membrane bioreactor for domestic wastewater treatment, Proceedings ofWater Environment – Membrane Technology Conference, Seoul, Korea.
Suzuki, Y., Miyahara, S. and Tokeishi, K. (1993) Oxygen supply method using gaspermeable film for wastewater treatment. Water Sci. Technol., 28(7), 243–250.
Tao, G., Kekre, K., Wei, Z., Lee, T.C., Viswanath, B. and Seah, H. (2005) Membranebioreactors for water reclamation. Water Sci. Technol., 51, 431–440.
Tardieu, E., Grasmick, A., Geaugey, V. and Manem, J. (1999) Influence of hydro-dynamics on fouling velocity in a recirculated mbr for wastewater treatment. J. Membrane Sci., 156, 131–140.
Tarnacki, K., Lyko, S., Wintgens, T., Melin, T. and Natau, F. (2005) Impact ofextra-cellular polymeric substances on the filterability of activated sludge in mem-brane bioreactors for landfill leachate treatment. Desalination, 179, 181–190.
Tokuz, R. and Eckenfelder, W. (1979) The effect of inorganic salts on the activatedsludge process performance. Water Res., 13, 99–104.
Tsai, H.-H., Ravindran, V., Williams, M.D. and Pirbazari, M. (2004) Forecastingthe performance of membrane bioreactor process for groundwater denitrification. J. Environ. Eng. Sci., 3, 507–521.
Ueda, T., Hata, K., Kikuoka, Y. and Seino, O. (1997) Effects of aeration on suctionpressure in a submerged membrane bioreactor. Water Res., 31, 489–494.
Urbain, V., Benoit, R. and Manem, J. (1996) Membrane bioreactor: a new treat-ment tool. J. Am. Water Works Assoc., 88(5), 75–86.
Vallero, M.V.G., Lettinga, G. and Lens, P.N.L. (2005) High rate sulfate reduction ina submerged anaerobic membrane bioreactor (sambar) at high salinity. J. MembraneSci., 253, 217–232.
Van Dijk, L. and Roncken, G.G. (1997) Membrane bioreactors for wastewater treat-ment: the state of the art and new developments. Water Sci. Technol., 35(10), 35–41.
118 The MBR Book
1856174817_Ch02.qxd 6/5/06 12:08 PM Page 118
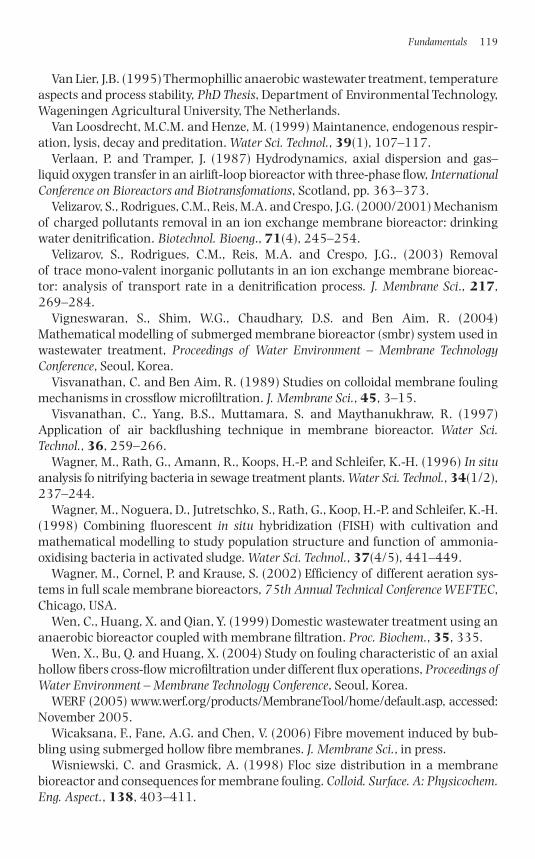
Van Lier, J.B. (1995) Thermophillic anaerobic wastewater treatment, temperatureaspects and process stability, PhD Thesis, Department of Environmental Technology,Wageningen Agricultural University, The Netherlands.
Van Loosdrecht, M.C.M. and Henze, M. (1999) Maintanence, endogenous respir-ation, lysis, decay and preditation. Water Sci. Technol., 39(1), 107–117.
Verlaan, P. and Tramper, J. (1987) Hydrodynamics, axial dispersion and gas–liquid oxygen transfer in an airlift-loop bioreactor with three-phase flow, InternationalConference on Bioreactors and Biotransfomations, Scotland, pp. 363–373.
Velizarov, S., Rodrigues, C.M., Reis, M.A. and Crespo, J.G. (2000/2001) Mechanismof charged pollutants removal in an ion exchange membrane bioreactor: drinkingwater denitrification. Biotechnol. Bioeng., 71(4), 245–254.
Velizarov, S., Rodrigues, C.M., Reis, M.A. and Crespo, J.G., (2003) Removal of trace mono-valent inorganic pollutants in an ion exchange membrane bioreac-tor: analysis of transport rate in a denitrification process. J. Membrane Sci., 217,269–284.
Vigneswaran, S., Shim, W.G., Chaudhary, D.S. and Ben Aim, R. (2004)Mathematical modelling of submerged membrane bioreactor (smbr) system used inwastewater treatment, Proceedings of Water Environment – Membrane TechnologyConference, Seoul, Korea.
Visvanathan, C. and Ben Aim, R. (1989) Studies on colloidal membrane foulingmechanisms in crossflow microfiltration. J. Membrane Sci., 45, 3–15.
Visvanathan, C., Yang, B.S., Muttamara, S. and Maythanukhraw, R. (1997)Application of air backflushing technique in membrane bioreactor. Water Sci.Technol., 36, 259–266.
Wagner, M., Rath, G., Amann, R., Koops, H.-P. and Schleifer, K.-H. (1996) In situanalysis fo nitrifying bacteria in sewage treatment plants. Water Sci. Technol., 34(1/2),237–244.
Wagner, M., Noguera, D., Jutretschko, S., Rath, G., Koop, H.-P. and Schleifer, K.-H.(1998) Combining fluorescent in situ hybridization (FISH) with cultivation andmathematical modelling to study population structure and function of ammonia-oxidising bacteria in activated sludge. Water Sci. Technol., 37(4/5), 441–449.
Wagner, M., Cornel, P. and Krause, S. (2002) Efficiency of different aeration sys-tems in full scale membrane bioreactors, 75th Annual Technical Conference WEFTEC,Chicago, USA.
Wen, C., Huang, X. and Qian, Y. (1999) Domestic wastewater treatment using ananaerobic bioreactor coupled with membrane filtration. Proc. Biochem., 35, 335.
Wen, X., Bu, Q. and Huang, X. (2004) Study on fouling characteristic of an axialhollow fibers cross-flow microfiltration under different flux operations, Proceedings ofWater Environment – Membrane Technology Conference, Seoul, Korea.
WERF (2005) www.werf.org/products/MembraneTool/home/default.asp, accessed:November 2005.
Wicaksana, F., Fane, A.G. and Chen, V. (2006) Fibre movement induced by bub-bling using submerged hollow fibre membranes. J. Membrane Sci., in press.
Wisniewski, C. and Grasmick, A. (1998) Floc size distribution in a membranebioreactor and consequences for membrane fouling. Colloid. Surface. A: Physicochem.Eng. Aspect., 138, 403–411.
Fundamentals 119
1856174817_Ch02.qxd 6/5/06 12:08 PM Page 119
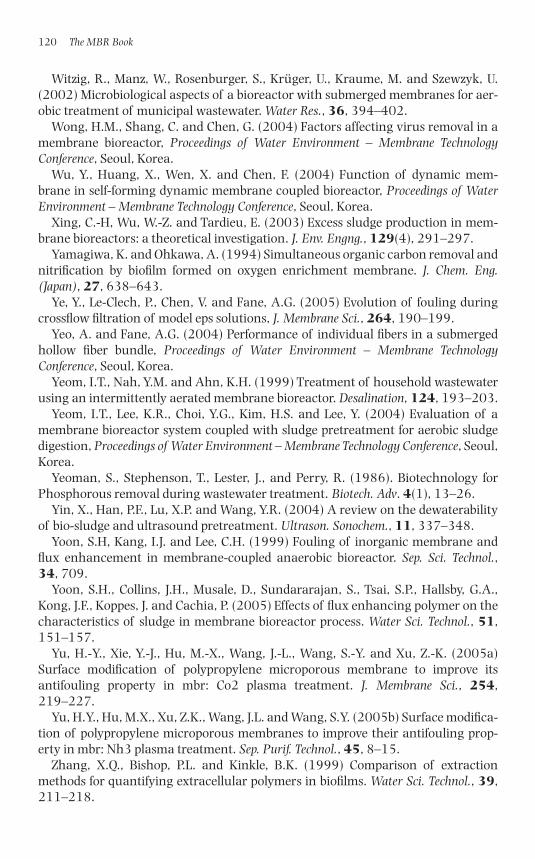
Witzig, R., Manz, W., Rosenburger, S., Krüger, U., Kraume, M. and Szewzyk, U.(2002) Microbiological aspects of a bioreactor with submerged membranes for aer-obic treatment of municipal wastewater. Water Res., 36, 394–402.
Wong, H.M., Shang, C. and Chen, G. (2004) Factors affecting virus removal in amembrane bioreactor, Proceedings of Water Environment – Membrane TechnologyConference, Seoul, Korea.
Wu, Y., Huang, X., Wen, X. and Chen, F. (2004) Function of dynamic mem-brane in self-forming dynamic membrane coupled bioreactor, Proceedings of WaterEnvironment – Membrane Technology Conference, Seoul, Korea.
Xing, C.-H, Wu, W.-Z. and Tardieu, E. (2003) Excess sludge production in mem-brane bioreactors: a theoretical investigation. J. Env. Engng., 129(4), 291–297.
Yamagiwa, K. and Ohkawa, A. (1994) Simultaneous organic carbon removal andnitrification by biofilm formed on oxygen enrichment membrane. J. Chem. Eng.(Japan), 27, 638–643.
Ye, Y., Le-Clech, P., Chen, V. and Fane, A.G. (2005) Evolution of fouling duringcrossflow filtration of model eps solutions, J. Membrane Sci., 264, 190–199.
Yeo, A. and Fane, A.G. (2004) Performance of individual fibers in a submergedhollow fiber bundle, Proceedings of Water Environment – Membrane TechnologyConference, Seoul, Korea.
Yeom, I.T., Nah, Y.M. and Ahn, K.H. (1999) Treatment of household wastewaterusing an intermittently aerated membrane bioreactor. Desalination, 124, 193–203.
Yeom, I.T., Lee, K.R., Choi, Y.G., Kim, H.S. and Lee, Y. (2004) Evaluation of a membrane bioreactor system coupled with sludge pretreatment for aerobic sludgedigestion, Proceedings of Water Environment – Membrane Technology Conference, Seoul,Korea.
Yeoman, S., Stephenson, T., Lester, J., and Perry, R. (1986). Biotechnology forPhosphorous removal during wastewater treatment. Biotech. Adv. 4(1), 13–26.
Yin, X., Han, P.F., Lu, X.P. and Wang, Y.R. (2004) A review on the dewaterabilityof bio-sludge and ultrasound pretreatment. Ultrason. Sonochem., 11, 337–348.
Yoon, S.H, Kang, I.J. and Lee, C.H. (1999) Fouling of inorganic membrane andflux enhancement in membrane-coupled anaerobic bioreactor. Sep. Sci. Technol.,34, 709.
Yoon, S.H., Collins, J.H., Musale, D., Sundararajan, S., Tsai, S.P., Hallsby, G.A.,Kong, J.F., Koppes, J. and Cachia, P. (2005) Effects of flux enhancing polymer on thecharacteristics of sludge in membrane bioreactor process. Water Sci. Technol., 51,151–157.
Yu, H.-Y., Xie, Y.-J., Hu, M.-X., Wang, J.-L., Wang, S.-Y. and Xu, Z.-K. (2005a)Surface modification of polypropylene microporous membrane to improve itsantifouling property in mbr: Co2 plasma treatment. J. Membrane Sci., 254,219–227.
Yu, H.Y., Hu, M.X., Xu, Z.K., Wang, J.L. and Wang, S.Y. (2005b) Surface modifica-tion of polypropylene microporous membranes to improve their antifouling prop-erty in mbr: Nh3 plasma treatment. Sep. Purif. Technol., 45, 8–15.
Zhang, X.Q., Bishop, P.L. and Kinkle, B.K. (1999) Comparison of extraction methods for quantifying extracellular polymers in biofilms. Water Sci. Technol., 39,211–218.
120 The MBR Book
1856174817_Ch02.qxd 6/5/06 12:08 PM Page 120
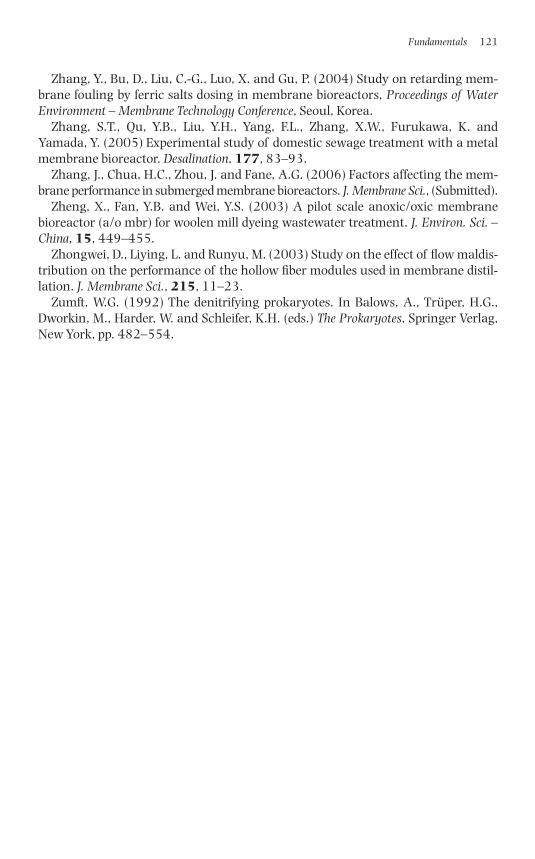
Zhang, Y., Bu, D., Liu, C.-G., Luo, X. and Gu, P. (2004) Study on retarding mem-brane fouling by ferric salts dosing in membrane bioreactors, Proceedings of WaterEnvironment – Membrane Technology Conference, Seoul, Korea.
Zhang, S.T., Qu, Y.B., Liu, Y.H., Yang, F.L., Zhang, X.W., Furukawa, K. andYamada, Y. (2005) Experimental study of domestic sewage treatment with a metalmembrane bioreactor. Desalination, 177, 83–93.
Zhang, J., Chua, H.C., Zhou, J. and Fane, A.G. (2006) Factors affecting the mem-brane performance in submerged membrane bioreactors. J. Membrane Sci., (Submitted).
Zheng, X., Fan, Y.B. and Wei, Y.S. (2003) A pilot scale anoxic/oxic membranebioreactor (a/o mbr) for woolen mill dyeing wastewater treatment. J. Environ. Sci. –China, 15, 449–455.
Zhongwei, D., Liying, L. and Runyu, M. (2003) Study on the effect of flow maldis-tribution on the performance of the hollow fiber modules used in membrane distil-lation. J. Membrane Sci., 215, 11–23.
Zumft, W.G. (1992) The denitrifying prokaryotes. In Balows, A., Trüper, H.G.,Dworkin, M., Harder, W. and Schleifer, K.H. (eds.) The Prokaryotes, Springer Verlag,New York, pp. 482–554.
Fundamentals 121
1856174817_Ch02.qxd 6/5/06 12:08 PM Page 121

This page intentionally left blank
Chapter 3
Design
With acknowledgements to:
Section 3.1 Harriet Fletcher School of Water Sciences, Cranfield University, UK
Section 3.2.4 Kiran Kekre, Tao Guihe Centre for Advanced Water Technology, Singapore
Harry Seah Public Utilities Board, Singapore
Section 3.2.5 Guiseppe Guglielmi, Department of. Civil and Gianni Andreottola Environmental Engineering,
University of Trento, Italy
Section 3.2.6 Adriano Joss, Engineering Department, Eawag, Hansruedi Siegrist Switzerland
Section 3.3 Harriet Fletcher School of Water Sciences, Cranfield University, UK
1856174817_Ch03.qxd 6/6/06 2:29 PM Page 123
3.1 Membrane bioreactor system operational parameters
There are essentially three main elements of a membrane bioreactor (MBR) con-tributing to operating costs, ignoring membrane replacement. These are:
1. liquid pumping2. membrane maintenance3. aeration
Of these by far the most significant, especially for immersed technologies, is aeration.As already discussed in Chapter 2, aeration is used both for scouring an immersedmembrane and for suspending and maintaining a viable biomass. Design of an MBRtherefore demands knowledge both of the feedwater quality, which principally deter-mines the oxygen demand for biotreatment, and the aeration demand for foulingcontrol, which relates to a number system characteristics as summarised in Fig. 2.18.The various governing principles have been discussed in Chapter 2. Design equa-tions are summarised below.
3.1.1 Liquid pumping
The key hydraulic operating parameters for MBR operation are obviously flux J litresper m2 per hour (LMH) and transmembrane pressure (TMP) �Pm (bar or Pa), fromwhich the permeability K (J/�Pm in LMH/bar), kg/(m2s) is obtained. In sidestreamMBRs the specific energy demand (the energy demanded per unit permeate productvolume) for continuous membrane permeation relates primarily to the pressure andconversion, and is roughly given by:
(3.1)
where � is the density (kg/m3), Θ is the conversion achieved by a single passage offluid along the length of the module (nominally 100% for submerged systems) and� is the pumping energy efficiency. In the above equation ��P refers to the sum of allindividual pressure losses which, for a sidestream system, comprises �Pm and thepressure losses in the retentate channels, �Pr, all pressure values being in SI units.As explained in Section 2.3.1, maximising Θ to reduce Wh relies on increasing thetotal length of the flow path through the membrane channel and increasing theshear rate, but this has the effect of increasing �Pr. The optimum operating conditionsfor a given channel dimension (tube diameter or parallel flow channel separation) istherefore determined by relatively straight-forward hydraulic considerations, perhapscomplicated slightly by the non-Newtonian nature of the sludge (Section 2.2.5.3).
For submerged MBRs, the total pressure loss is of lesser importance, since it is nec-essarily very low to sustain operation. In this configuration the pressure loss, princi-pally the TMP, reflects state of membrane fouling, through K, but contributes verylittle to the energy demand. Instead, the specific aeration energy demand is mainlygoverned by the aeration intensity (Section 3.1.3.2).
W Ph ��
�1rj
∑
124 The MBR Book
1856174817_Ch03.qxd 6/6/06 2:29 PM Page 124
Other contributions to pumping energy demand include the various transfer oper-ations, such as from the balancing tank to the bioreactor, the bioreactor to the mem-brane tank and the bioreactor or membrane tank to the denitrification tank or zone.All of these operations are secondary contributors to energy demand. However, giventhat it provides the highest flow, the recycle for denitrification (Section 2.2.6), if used,would normally incur the greatest energy demand as determined by the recycle ratioQdn/Qp, where Qdn is the recycle flow for denitrification and Qp is the feed flow. In full-scale systems this value (r) normally takes values between 1 and 3 (WEF, 1996) but canbe up to 4 (Metcalf and Eddy, 2003) depending on the feedwater quality. Pumpingpower is given by:
(3.2)
where Wp is the power input to the pump (kW), H is the pump head including the system losses (m of water), � is the density of the pumped fluid (kg/m3) and � isthe pump efficiency. This relationship yields the theoretical power requirement for all liquid pumping operations, such as transfer from the bioreactor tank to themembrane tank. In the case of biomass recycle the term Qpump/Qp approximates to r.Note that � is highly variable and a more accurate measure of pumping powerrequirements can be found by consulting data sheets produced by the pump manu-facturers.
3.1.2 Membrane maintenance
Other factors impacting on operating cost relate to physical and chemical membranecleaning, which incur process downtime, loss of permeate product (in the case of back-flushing) and membrane replacement. The latter can be accounted for simply byamortisation, although actual data on membrane life is scarce since for most plantsthe start-up date is recent enough for the plants still to be operating with their orig-inal membranes. Membrane replacement costs are potentially very significant, but datafrom some of the more established plant are somewhat encouraging in this regard(Table 5.2).
Physical and chemical backwashing requirements are dependent primarily onthe membrane and process configurations and the feedwater quality. Thus far onlyrules of thumb are available for relationships between feedwater quality and mem-brane operation and maintenance (O&M); O&M protocols for specific technologies arenormally recommended by the membrane and/or process suppliers and sometimesfurther adapted for specific applications. Fundamental relationships between clean-ing requirements and operating conditions, usually flux and aeration for submergedsystems, have been generated from scientific studies of fouling (Section 2.3.7.1).However, arguably the most useful sources of information for membrane cleaningrequirements are comparative pilot trials – the assessment of different MBR tech-nologies challenged with the same feedwater (Section 3.2) – and full-scale referencesites (Chapter 5).
WgH Q
Qppump
p1000�r
j
Design 125
1856174817_Ch03.qxd 6/6/06 2:29 PM Page 125
Key design parameters relating to membrane cleaning (Sections 2.1.4.3 and2.3.9.2) are:
● period between physical cleans (tp), where the physical clean may be eitherbackflushing or relaxation;
● duration of the physical clean (�p);● period between chemical cleans (tc);● duration of the chemical clean (�c);● backflush flux (Jb);● cleaning reagent concentration (cc) and volume (vc) normalised to mem-
brane area.
If it can then be assumed that a complete chemical cleaning cycle, which will con-tain a number of physical cleaning cycles (Fig. 2.11), restores membrane perme-ability to a sustainable level then the net flux Jnet can be calculated:
(3.3)
where n is the number of physical cleaning cycles per chemical clean:
(3.4)
tc and tp may be determined by threshold parameter values, specifically the maxi-mum operating pressure or the minimum membrane permeability. Note that it isnormally the net flux which is most appropriate to use for energy demand calcula-tions, and that the pumping energy in Equation (3.1) can be modified for chemicalcleaning down time:
(3.5)
Other costs of chemical cleaning relate to the cost of the chemical reagent itself. Thetotal mass of cleaning of chemical cleaning reagent is simply the product of volumeand concentration. For a periodic chemical clean in place (CIP), either maintenance orrecovery (Section 2.3.9.2), the specific mass per unit permeate product is simply:
(3.6)
where Am is the membrane area. If the cleaning reagent is flushed through the mem-brane in situ then the volume of cleaning reagent used can be found from:
(3.7)v J Ac c m c� t
Mc v
J A tcc c
net m c c
��( )t
W Wt
th,net hc
c c
�� t
nt
t�
�c
p pt
Jn Jt J
tnetp b p
c c
��
�
( )t
t
126 The MBR Book
1856174817_Ch03.qxd 6/6/06 2:29 PM Page 126
where Jc is the cleaning flux. From the above two equations:
(3.8)
Equation (3.8) is applicable to both a chemically enhanced backwashing (CEB) anda CIP, the values for cc, tc and �c being much lower for a CEB.
The frequency of chemical cleaning can, if necessary, be determined from the rate ofdecline of permeability, where permeability decline rate at constant flux is determinedfrom the pressure p and time t at two points (subscripted 1 and 2) within the clean-ing cycle:
(3.9)
where p1 refers to the recovered permeability after cleaning and p2 to the minimumacceptable permeability.
3.1.3 Aeration
3.1.3.1 Biomass aerationThe first component of aeration concerns the bioreactor and, specifically, the demandof the mixed liquor for air required for (a) solids agitation, and (b) dissolved oxygen(DO) for maintaining a viable micro-organism population for biotreatment. In biotreat-ment DO is normally the key design parameter. The oxygen requirement (m0, kg/day)for a biological system relates to the flow rate (Q, m3/day), substrate degradation(S0 � S, Section 2.1.4.1), sludge production (Px, Section 2.1.4.2) and concentration oftotal kjeldahl nitrogen (TKN) that is oxidized to form products (NOx, Section 2.1.4.4).This relationship is derived from a mass balance on the system (Section 2.2.5.1):
(2.17)
The oxygen is most commonly transferred to the biomass by bubbling air, or in somecases pure oxygen, into the system through diffusers. Only a portion of the air, oroxygen, which is fed to the system is transferred into the biomass. This is quantifiedby the oxygen transfer efficiency (OTE). The transfer efficiency is dependent on the typeof diffuser used and the specific system design. Manufacturers provide an OTE for theirdiffuser in clean water at 20°C, three correction factors �, � and � (Section 2.2.5.3)can be used to convert this to process water (i.e. the mixed liquor in the case of MBRs).The airflow through the blower required to maintain the biological community (mA,b,kg/h) can be calculated from:
(3.10)QR xOTE
A,b0
A24�
r abw
m Q S S P Q NO Q NOe0 x x x1.42 4.33 2.83� � � � �( ) ( ) ( )
�
��
�
�Kt
J
t t
p p
p pnet
2 1
2 1
1 2
⎛
⎝⎜⎜⎜⎜
⎞
⎠⎟⎟⎟⎟⎟
M cJ
J tc cc
net
c
c c( )�
�′t
t
Design 127
1856174817_Ch03.qxd 6/6/06 2:29 PM Page 127
However, to simplify calculations in process design the three correction factors areoften combined into a single � factor.
Unlike other flows mA,b is calculated as a mass flow as opposed to a volumetricflowrate. It is more practically useful to consider the volumetric biomass aerationdemand, for which mA,b must be converted to a volumetric flow rate, normalised tosome selected temperature (usually 20°C) by the air density, to provide air flow rateper unit permeate flow:
(3.11)
where J�net is the net flux normalised to 20°C.
3.1.3.2 Membrane aerationIt is necessary to aerate the membrane unit in an MBR to scour solids from the mem-brane surface (Section 2.3.7.1). In practice the membrane aeration value is not definedtheoretically since the relationship between aeration and flux decline is not well under-stood at present. Membrane aeration values are based on previous experience, and inmany cases the suppliers recommend an appropriate aeration rate. As is the case formembrane cleaning regimes the most valuable data are that which are collected frompilot trials and full-scale case studies. The key contributing factor to energy demandin submerged systems is the specific aeration demand, the ratio of QA either to mem-brane area (SADm) or permeate volume (SADp):
(3.12)
(3.13)
where the subscript m refers specifically to the individual membrane element ormodule. Whereas SADm has units of m3 air per unit m2 per unit time, and thus nominally m/h, SADp is unitless. It should be noted that both are temperaturedependent, since gas volume (and thus flow) increases with temperature as doesflux, through decreasing viscosity. If normalised to 20°C the air flow is demotedunits of Nm3/h.
3.1.3.3 Diffuser typeThere are three types of aeration used in MBR plants: coarse bubble aeration, finebubble aeration and, less commonly, jet aeration. The principal differences betweenthe two main aerator types are given in Table 3.1. Traditionally, fine bubble diffusionhas been used for biomass aeration and a separate coarse bubble aeration systemapplied for membrane scouring. In many proprietary systems separate tanks are
SADpA,m
m
�Q
JA
SADmA,m
m
�Q
A
RQ
J AbA,b
net m
�′
128 The MBR Book
1856174817_Ch03.qxd 6/6/06 2:29 PM Page 128
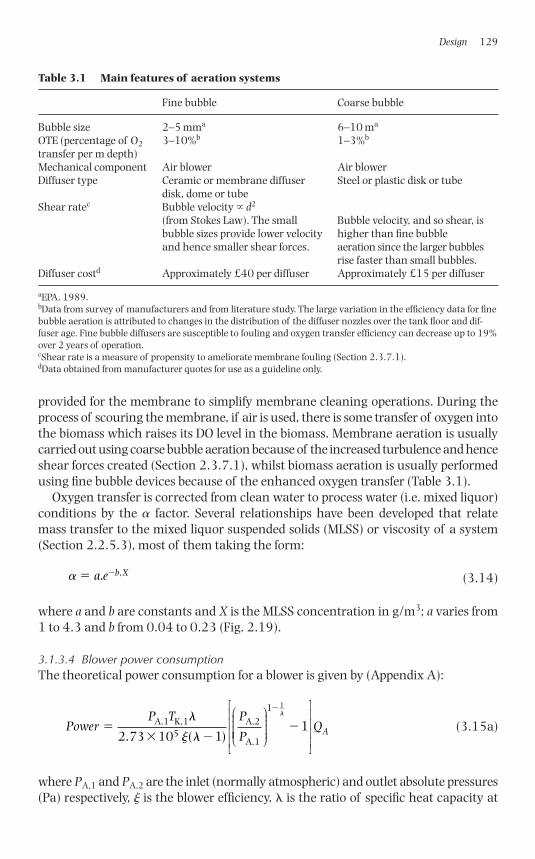
provided for the membrane to simplify membrane cleaning operations. During theprocess of scouring the membrane, if air is used, there is some transfer of oxygen intothe biomass which raises its DO level in the biomass. Membrane aeration is usuallycarried out using coarse bubble aeration because of the increased turbulence and henceshear forces created (Section 2.3.7.1), whilst biomass aeration is usually performedusing fine bubble devices because of the enhanced oxygen transfer (Table 3.1).
Oxygen transfer is corrected from clean water to process water (i.e. mixed liquor)conditions by the � factor. Several relationships have been developed that relatemass transfer to the mixed liquor suspended solids (MLSS) or viscosity of a system(Section 2.2.5.3), most of them taking the form:
(3.14)
where a and b are constants and X is the MLSS concentration in g/m3; a varies from1 to 4.3 and b from 0.04 to 0.23 (Fig. 2.19).
3.1.3.4 Blower power consumptionThe theoretical power consumption for a blower is given by (Appendix A):
(3.15a)
where PA,1 and PA,2 are the inlet (normally atmospheric) and outlet absolute pressures(Pa) respectively, � is the blower efficiency, � is the ratio of specific heat capacity at
PowerP T P
P�
�A,1 K,1
5A,2
A,12.73 10 1
l
j l( )
⎛
⎝⎜⎜⎜⎜⎜
⎞
⎠
⎟⎟⎟⎟⎟
⎡
⎣
⎢⎢⎢⎢
⎤
⎦
⎥⎥⎥⎥
1�
�
1
1�
QA
a� �a e b X. ,
Design 129
Table 3.1 Main features of aeration systems
Fine bubble Coarse bubble
Bubble size 2–5 mma 6–10 ma
OTE (percentage of O2 3–10%b 1–3%b
transfer per m depth)Mechanical component Air blower Air blowerDiffuser type Ceramic or membrane diffuser Steel or plastic disk or tube
disk, dome or tubeShear ratec Bubble velocity d2
(from Stokes Law). The small Bubble velocity, and so shear, is bubble sizes provide lower velocity higher than fine bubble and hence smaller shear forces. aeration since the larger bubbles
rise faster than small bubbles.Diffuser costd Approximately £40 per diffuser Approximately £15 per diffuser
aEPA, 1989.bData from survey of manufacturers and from literature study. The large variation in the efficiency data for finebubble aeration is attributed to changes in the distribution of the diffuser nozzles over the tank floor and dif-fuser age. Fine bubble diffusers are susceptible to fouling and oxygen transfer efficiency can decrease up to 19%over 2 years of operation. cShear rate is a measure of propensity to ameliorate membrane fouling (Section 2.3.7.1).dData obtained from manufacturer quotes for use as a guideline only.
1856174817_Ch03.qxd 6/6/06 2:29 PM Page 129
constant pressure to constant volume and takes a value of 1.4 for air, TK,1 is the inlettemperature (K), and QA is the volumetric flow rate of air. The blower efficiency (�)varies significantly according to the type of blower and its mechanical design, the rota-tional speed, and the blower rating for the task. As with pumping operations moreaccurate data can be found from manufacturers’ data sheets. If Equation (3.15) isdivided by the total membrane module area Am to which the flow rate QA applies,then one obtains an expression in kW/m2 for power per unit membrane area:
(3.15b)
where k is therefore a function of pressure, and thus the hydrostatic head �Ph deter-mined by the depth at which the aerator is placed in the tank, as well as temperature.If Equation (3.15) is divided by the permeate flow rate QP, that is JnetAm, where Jnet is thenet flux (m3/(m2 h)), then one obtains an expression for specific energy demand inkWh/m3:
(3.16)
Hence, whilst the hydrostatic head wholly or partly determines the flux, depend-ing on whether suction is applied, its main contribution to energy demand does notrelate to membrane permeation directly but to its impact on aeration energy. If theflux and flow are normalised to 20°C and 101.3 kPa (i.e.J�net and Q�A respectively),then k in Equation (3.15b) simplifies to:
(3.17)
As already stated in most hollow fibre (HF) MBR technologies the membrane aer-ation is carried out separately from the bioreactor aeration and does not necessarilyemploy the same type of aerator. Some of the oxygen transfer is achieved by themembrane aeration, and the extent to which this occurs depends mainly on the typeof membrane aerator employed.
3.1.4 Design calculation: summary
Inter-relationships within an MBR process are complex (Fig. 2.26), but the most cru-cial relationships with respect to operating costs are those associated with aerationsince this provides the largest component of the process operating cost. The impacts ofaeration on the various operating parameters have already been discussed and depictedin Fig. 2.18, and biological and physical parameters used for the determination of operating costs are listed in Tables 3.2 and 3.3 respectively. Note that it is most consistent to normalise against permeate product volume to produce specific energy
kP
��
�108.748
1 101.325A,2l
j l( )
⎛
⎝⎜⎜⎜⎜
⎞
⎠⎟⎟⎟⎟⎟
1 1ll
� 1
⎡
⎣
⎢⎢⎢⎢
⎤
⎦
⎥⎥⎥⎥
WkQ
JAb,VA
m
�
WP T P
Pk
b,mA,1 ,1
5A,2
A,12.73 10 1�
�
l
j l( )
⎛
⎝⎜⎜⎜⎜
⎞
⎠⎠
⎟⎟⎟⎟⎟
⎡
⎣
⎢⎢⎢⎢
⎤
⎦
⎥⎥⎥⎥
1 1�
� �l
1 A
m
A
m
Q
A
kQ
A
130 The MBR Book
1856174817_Ch03.qxd 6/6/06 2:29 PM Page 130
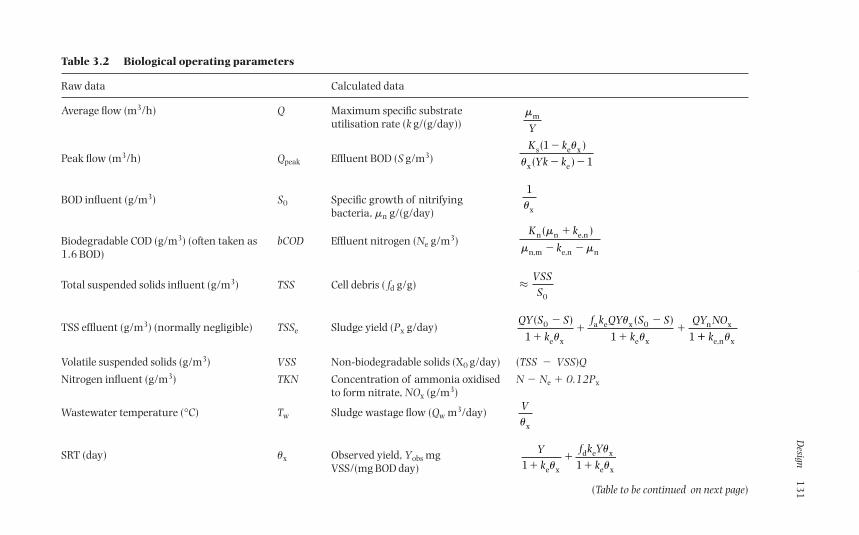
Design
13
1Table 3.2 Biological operating parameters
Raw data Calculated data
Average flow (m3/h) Q Maximum specific substrateutilisation rate (k g/(g/day))
Peak flow (m3/h) Qpeak Effluent BOD (S g/m3)
BOD influent (g/m3) S0 Specific growth of nitrifying bacteria, �n g/(g/day)
Biodegradable COD (g/m3) (often taken as bCOD Effluent nitrogen (Ne g/m3)1.6 BOD)
Total suspended solids influent (g/m3) TSS Cell debris ( fd g/g)
TSS effluent (g/m3) (normally negligible) TSSe Sludge yield (Px g/day)
Volatile suspended solids (g/m3) VSS Non-biodegradable solids (X0 g/day) (TSS � VSS)Q
Nitrogen influent (g/m3) TKN Concentration of ammonia oxidised N � Ne � 0.12Pxto form nitrate, NOx (g/m3)
Wastewater temperature (°C) Tw Sludge wastage flow (Qw m3/day)
SRT (day) �x Observed yield, Yobs mg VSS/(mg BOD day)
(Table to be continued on next page)
Yk
f k Y
k1 1e x
d e x
e x��
�u
u
u
Vux
QY S S
k
f k QY S S
k
QY NO( ) ( )0
e x
a e x 0
e x
n x
1 1 1
�
��
�
��
u
u
u �� ke,n xu
≈VSSS0
K k
kn n e,n
n,m e,n n
( )m
m m
�
� �
1
xu
K k
Yk ks e x
x e
1
1
( )
( )
�
� �
u
u
mm
Y
1856174817_Ch03.qxd 6/6/06 2:29 PM Page 131
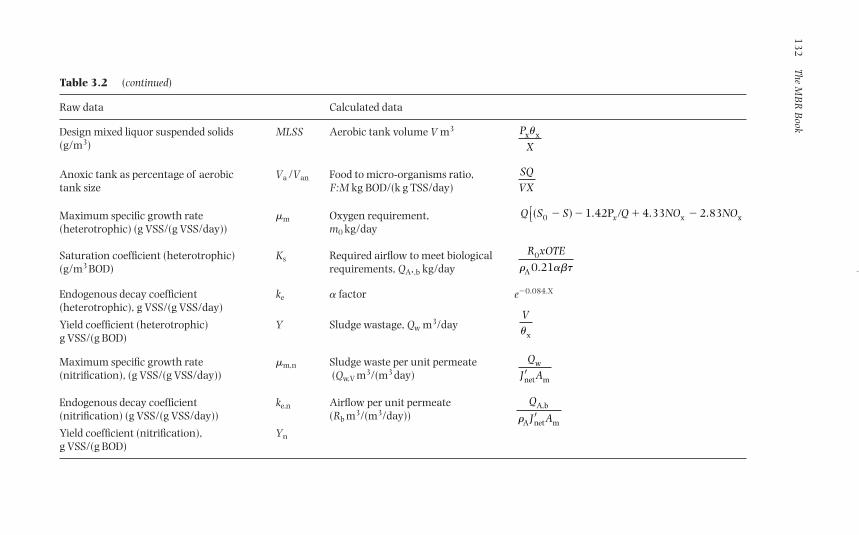
13
2The M
BR
Book
Table 3.2 (continued)
Raw data Calculated data
Design mixed liquor suspended solids MLSS Aerobic tank volume V m3
(g/m3)
Anoxic tank as percentage of aerobic Va /Van Food to micro-organisms ratio, tank size F:M kg BOD/(k g TSS/day)
Maximum specific growth rate �m Oxygen requirement, (heterotrophic) (g VSS/(g VSS/day)) m0 kg/day
Saturation coefficient (heterotrophic) Ks Required airflow to meet biological (g/m3 BOD) requirements, QA,,b kg/day
Endogenous decay coefficient ke � factor e�0.084.X
(heterotrophic), g VSS/(g VSS/day)
Yield coefficient (heterotrophic) Y Sludge wastage, Qw m3/dayg VSS/(g BOD)
Maximum specific growth rate �m,n Sludge waste per unit permeate(nitrification), (g VSS/(g VSS/day)) (Qw,V m3/(m3 day)
Endogenous decay coefficient ke,n Airflow per unit permeate (nitrification) (g VSS/(g VSS/day)) (Rb m3/(m3/day))
Yield coefficient (nitrification), Yng VSS/(g BOD)
Q
J AA,b
A net mr ′
Q
J Aw
net m′
Vux
R xOTE0
A 0.21r abt
Q S S Q NO NOx( )0 � � � � �1.42P 4.33 2.83x x⎡⎣⎢
SQVX
P
Xx xu
1856174817_Ch03.qxd 6/6/06 2:29 PM Page 132
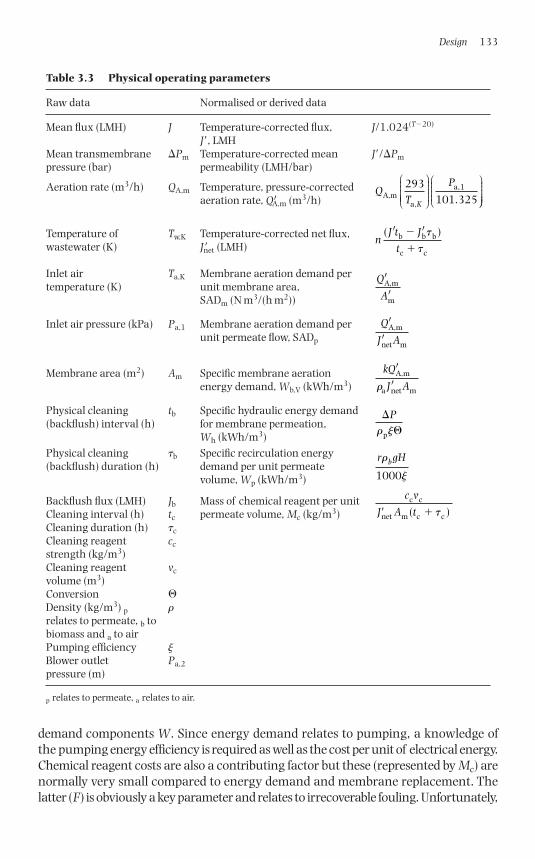
demand components W. Since energy demand relates to pumping, a knowledge ofthe pumping energy efficiency is required as well as the cost per unit of electrical energy.Chemical reagent costs are also a contributing factor but these (represented by Mc) arenormally very small compared to energy demand and membrane replacement. Thelatter (F) is obviously a key parameter and relates to irrecoverable fouling. Unfortunately,
Design 133
Table 3.3 Physical operating parameters
Raw data Normalised or derived data
Mean flux (LMH) J Temperature-corrected flux, J/1.024(T�20)
J�, LMHMean transmembrane �Pm Temperature-corrected mean J�/�Pmpressure (bar) permeability (LMH/bar)
Aeration rate (m3/h) QA,m Temperature, pressure-corrected aeration rate, Q′A,m (m3/h)
Temperature of Tw,K Temperature-corrected net flux, wastewater (K) J�net (LMH)
Inlet air Ta,K Membrane aeration demand per temperature (K) unit membrane area,
SADm (N m3/(h m2))
Inlet air pressure (kPa) Pa,1 Membrane aeration demand per unit permeate flow, SADp
Membrane area (m2) Am Specific membrane aeration energy demand, Wb,V (kWh/m3)
Physical cleaning tb Specific hydraulic energy demand (backflush) interval (h) for membrane permeation,
Wh (kWh/m3)Physical cleaning �b Specific recirculation energy (backflush) duration (h) demand per unit permeate
volume, Wp (kWh/m3)
Backflush flux (LMH) Jb Mass of chemical reagent per unit Cleaning interval (h) tc permeate volume, Mc (kg/m3)Cleaning duration (h) �cCleaning reagent ccstrength (kg/m3)Cleaning reagent vcvolume (m3)Conversion �Density (kg/m3) p �relates to permeate, b tobiomass and a to airPumping efficiency �Blower outlet Pa,2pressure (m)
p relates to permeate, a relates to air.
c v
J A tc c
net m c c� �( )t
r gHbr
j1000
�
�
Pr jp
kQ
J A
′
′A,m
a net mr
′
′Q
J AA,m
net m
′
′Q
AA,m
m
nJ t J
t
( )′ ′b b b
c c
�
�
t
t
QT
P
KA,m
a,
a,1293101.325
⎛
⎝
⎜⎜⎜⎜⎜
⎞
⎠
⎟⎟⎟⎟⎟
⎛
⎝⎜⎜⎜⎜
⎞
⎠⎠⎟⎟⎟⎟⎟
1856174817_Ch03.qxd 6/6/06 2:29 PM Page 133
there is insufficient historical data to enable F to be determined, but it is normal forsuppliers to give a guarantee with their membrane products which in effect provideF for costing purposes. As with all biological processes sludge disposal costs con-tribute to the MBR operating costs. However, since the sludge yield is reduced in MBRprocesses, the quantity of sludge generated is relatively low compared with a conven-tional activated sludge process (ASP) and the disposal cost correspondingly low.
For a given comprehensive set of data, the determination of energy demand pro-ceeds through the calculation of:
● oxygen requirements for the biomass,● oxygen transfer coefficient from the aerator characteristics,● alpha factor from empirical correlations with MLSS,● specific aeration demand from the aeration rate and the net flux,● air flow rate through the blower,● blower power requirement,● pumping energy for both permeate extraction and recirculation.
Design is thus critically dependent on the selected operating (gross) or net flux (Jor Jnet respectively) chosen and the aeration demand required to maintain this flux,as quantified by Rv, under the conditions of physical and chemical cleaning employed.Total aeration demand will then also depend on the extent to which membrane aer-ation generates dissolved oxygen which is subsequently used for sustaining the bio-mass. Since there is currently no generally-applicable first-principles or empiricalrelationship proposed between flux and membrane aeration for three-phase inter-mediate flow, such as persists in an immersed MBR, it is necessary to review heuristicinformation on this topic to identify appropriate relationships which can subsequentlybe used for design purposes.
3.2 Data for technology comparison, immersed systems
3.2.1 Introduction
Since MBR performance is highly dependent upon feedwater quality, true comparisonof the performance of different MBR technologies can only be achieved when they aretested against the same feedwater matrix. Two options exist for such comparisons:
(a) the use of analogues of precisely controlled composition, and(b) the simultaneous trialling of technologies challenged with the same feedwater.
The dichotomy over the respective benefits of analogue and real matrices for researchand development (R&D) purposes is not limited to MBRs and applies across many sec-tors. The use of analogues for feedwaters in water and wastewater treatment R&Dallows total control of feed quality and allows tests to be conducted sequentially orsimultaneously without detracting from the performance comparison. On the other
134 The MBR Book
1856174817_Ch03.qxd 6/6/06 2:29 PM Page 134
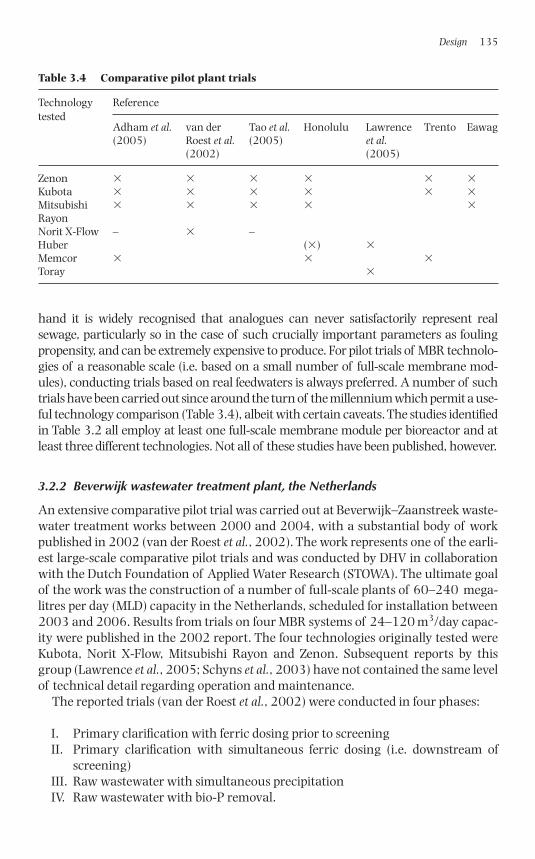
hand it is widely recognised that analogues can never satisfactorily represent realsewage, particularly so in the case of such crucially important parameters as foulingpropensity, and can be extremely expensive to produce. For pilot trials of MBR technolo-gies of a reasonable scale (i.e. based on a small number of full-scale membrane mod-ules), conducting trials based on real feedwaters is always preferred. A number of suchtrials have been carried out since around the turn of the millennium which permit a use-ful technology comparison (Table 3.4), albeit with certain caveats. The studies identifiedin Table 3.2 all employ at least one full-scale membrane module per bioreactor and atleast three different technologies. Not all of these studies have been published, however.
3.2.2 Beverwijk wastewater treatment plant, the Netherlands
An extensive comparative pilot trial was carried out at Beverwijk–Zaanstreek waste-water treatment works between 2000 and 2004, with a substantial body of workpublished in 2002 (van der Roest et al., 2002). The work represents one of the earli-est large-scale comparative pilot trials and was conducted by DHV in collaborationwith the Dutch Foundation of Applied Water Research (STOWA). The ultimate goalof the work was the construction of a number of full-scale plants of 60–240 mega-litres per day (MLD) capacity in the Netherlands, scheduled for installation between2003 and 2006. Results from trials on four MBR systems of 24–120 m3/day capac-ity were published in the 2002 report. The four technologies originally tested wereKubota, Norit X-Flow, Mitsubishi Rayon and Zenon. Subsequent reports by thisgroup (Lawrence et al., 2005; Schyns et al., 2003) have not contained the same levelof technical detail regarding operation and maintenance.
The reported trials (van der Roest et al., 2002) were conducted in four phases:
I. Primary clarification with ferric dosing prior to screeningII. Primary clarification with simultaneous ferric dosing (i.e. downstream of
screening)III. Raw wastewater with simultaneous precipitationIV. Raw wastewater with bio-P removal.
Design 135
Table 3.4 Comparative pilot plant trials
Technology Referencetested
Adham et al. van der Tao et al. Honolulu Lawrence Trento Eawag(2005) Roest et al. (2005) et al.
(2002) (2005)
Zenon Kubota Mitsubishi RayonNorit X-Flow – –Huber () Memcor Toray
1856174817_Ch03.qxd 6/6/06 2:29 PM Page 135
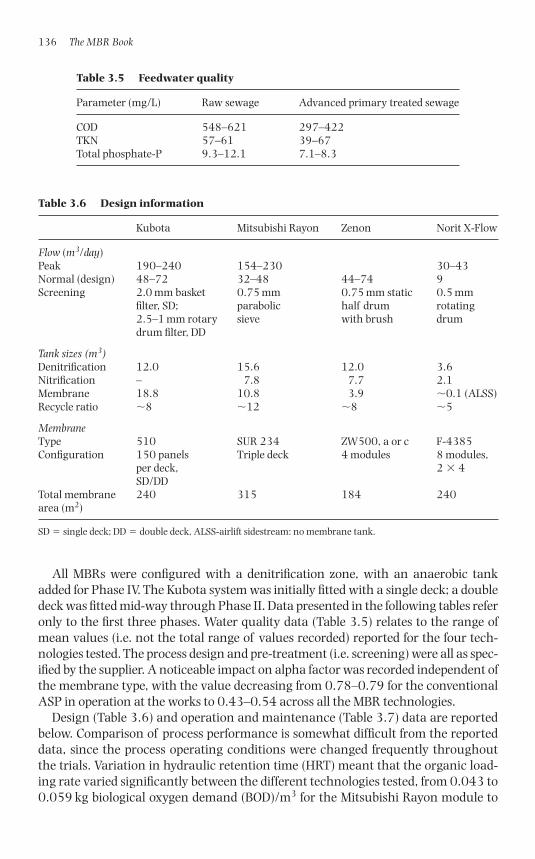
All MBRs were configured with a denitrification zone, with an anaerobic tankadded for Phase IV. The Kubota system was initially fitted with a single deck; a doubledeck was fitted mid-way through Phase II. Data presented in the following tables referonly to the first three phases. Water quality data (Table 3.5) relates to the range ofmean values (i.e. not the total range of values recorded) reported for the four tech-nologies tested. The process design and pre-treatment (i.e. screening) were all as spec-ified by the supplier. A noticeable impact on alpha factor was recorded independent ofthe membrane type, with the value decreasing from 0.78–0.79 for the conventionalASP in operation at the works to 0.43–0.54 across all the MBR technologies.
Design (Table 3.6) and operation and maintenance (Table 3.7) data are reportedbelow. Comparison of process performance is somewhat difficult from the reporteddata, since the process operating conditions were changed frequently throughoutthe trials. Variation in hydraulic retention time (HRT) meant that the organic load-ing rate varied significantly between the different technologies tested, from 0.043 to0.059 kg biological oxygen demand (BOD)/m3 for the Mitsubishi Rayon module to
136 The MBR Book
Table 3.5 Feedwater quality
Parameter (mg/L) Raw sewage Advanced primary treated sewage
COD 548–621 297–422TKN 57–61 39–67Total phosphate-P 9.3–12.1 7.1–8.3
Table 3.6 Design information
Kubota Mitsubishi Rayon Zenon Norit X-Flow
Flow (m3/day)Peak 190–240 154–230 30–43Normal (design) 48–72 32–48 44–74 9Screening 2.0 mm basket 0.75 mm 0.75 mm static 0.5 mm
filter, SD; parabolic half drum rotating 2.5–1 mm rotary sieve with brush drumdrum filter, DD
Tank sizes (m3)Denitrification 12.0 15.6 12.0 3.6Nitrification – 7.8 7.7 2.1Membrane 18.8 10.8 3.9 �0.1 (ALSS)Recycle ratio �8 �12 �8 �5
MembraneType 510 SUR 234 ZW500, a or c F-4385Configuration 150 panels Triple deck 4 modules 8 modules,
per deck, 2 4SD/DD
Total membrane 240 315 184 240area (m2)
SD � single deck; DD � double deck, ALSS-airlift sidestream: no membrane tank.
1856174817_Ch03.qxd 6/6/06 2:29 PM Page 136
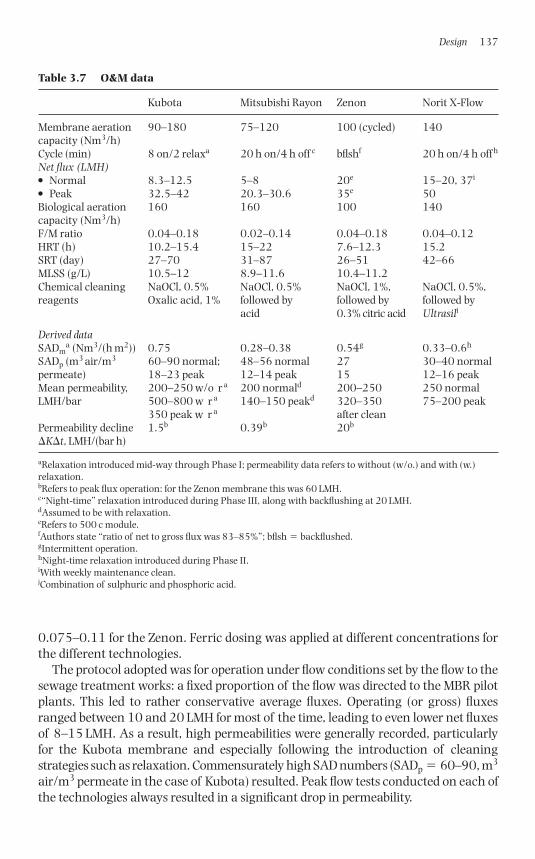
0.075–0.11 for the Zenon. Ferric dosing was applied at different concentrations forthe different technologies.
The protocol adopted was for operation under flow conditions set by the flow to thesewage treatment works: a fixed proportion of the flow was directed to the MBR pilotplants. This led to rather conservative average fluxes. Operating (or gross) fluxesranged between 10 and 20 LMH for most of the time, leading to even lower net fluxesof 8–15 LMH. As a result, high permeabilities were generally recorded, particularlyfor the Kubota membrane and especially following the introduction of cleaningstrategies such as relaxation. Commensurately high SAD numbers (SADp � 60–90, m3
air/m3 permeate in the case of Kubota) resulted. Peak flow tests conducted on each ofthe technologies always resulted in a significant drop in permeability.
Design 137
Table 3.7 O&M data
Kubota Mitsubishi Rayon Zenon Norit X-Flow
Membrane aeration 90–180 75–120 100 (cycled) 140capacity (Nm3/h)Cycle (min) 8 on/2 relaxa 20 h on/4 h off c bflshf 20 h on/4 h off h
Net flux (LMH)● Normal 8.3–12.5 5–8 20e 15–20, 37i
● Peak 32.5–42 20.3–30.6 35e 50Biological aeration 160 160 100 140capacity (Nm3/h)F/M ratio 0.04–0.18 0.02–0.14 0.04–0.18 0.04–0.12HRT (h) 10.2–15.4 15–22 7.6–12.3 15.2SRT (day) 27–70 31–87 26–51 42–66MLSS (g/L) 10.5–12 8.9–11.6 10.4–11.2Chemical cleaning NaOCl, 0.5% NaOCl, 0.5% NaOCl, 1%, NaOCl, 0.5%, reagents Oxalic acid, 1% followed by followed by followed by
acid 0.3% citric acid Ultrasili
Derived dataSADm
a (Nm3/(h m2)) 0.75 0.28–0.38 0.54g 0.33–0.6h
SADp (m3 air/m3 60–90 normal; 48–56 normal 27 30–40 normalpermeate) 18–23 peak 12–14 peak 15 12–16 peakMean permeability, 200–250 w/o r a 200 normald 200–250 250 normalLMH/bar 500–800 w r a 140–150 peakd 320–350 75–200 peak
350 peak w r a after cleanPermeability decline 1.5b 0.39b 20b
�K�t, LMH/(bar h)
aRelaxation introduced mid-way through Phase I; permeability data refers to without (w/o.) and with (w.)relaxation.bRefers to peak flux operation: for the Zenon membrane this was 60 LMH.c“Night-time” relaxation introduced during Phase III, along with backflushing at 20 LMH.dAssumed to be with relaxation.eRefers to 500 c module.fAuthors state “ratio of net to gross flux was 83–85%”; bflsh � backflushed.gIntermittent operation.hNight-time relaxation introduced during Phase II.iWith weekly maintenance clean.jCombination of sulphuric and phosphoric acid.
1856174817_Ch03.qxd 6/6/06 2:29 PM Page 137
For each of the trials operational problems were encountered which led to irre-versible, and sometimes irrecoverable, fouling. This included partial aerator blockage,membrane tube blockage and partial dewatering (i.e. sludge thickening due to failureof the feed flow). Repeated chemical cleans were thus employed over the course of thetrials, both for maintenance and recovery of membrane permeability, and relaxationwas only introduced mid-way through the trials. A strong temperature dependence ofpermeability was noted for all membranes tested at low temperature, with the sus-tainable permeability decreasing markedly at temperatures below 10°C.
It was concluded from this trial that the Kubota could not be operates routinely at netfluxes of 38.5 LMH, although the fouling rate was decreased when relaxation wasintroduced. Peak flux operation of both the Zenon and Kubota systems at 41–43 LMHfor 100 h led to a manageable decline in permeability, however, with permeabilityrecovering to normal levels on reverting to low flux operation. Under the most opti-mal conditions of a regular maintenance clean and backflushing at 20.8 LMH, thepermeability of the Mitsubishi Rayon membrane was maintained at between 200and 300 LMH/bar at some unspecified flux. A net flux of 20.8 LMH was achieved fora period of 5 days, but peak fluxes of 28 LMH or more led to a rapid decline in per-meability. Enhanced cleaning at higher reagent concentrations (1 wt% NaOCl) andtemperatures (40°C) may have led to the noted deterioration of the membranes. TheNorit X-Flow membrane was apparently, eventually, successfully operated at 37 LMHwith weekly maintenance cleaning and night-time relaxation (4 h every 24 h). How-ever, there were problems maintaining this flux due to tube blockage. The Zenonplant, fitted with the 500 c module, appears to have been operated under conditionswhereby a reasonable net flux of around 20 LMH with an accompanying perme-ability of 200–250 LMH was sustained through maintenance cleaning twice weeklyover an extended time period. It is possible that the other technologies could havealso been sustained higher fluxes in operated under more optimal conditions.
3.2.3 Point Loma Wastewater Treatment Plant, San Diego
This trial resulted from an award made to the City of San Diego and MontgomeryWatson Harza (MWH) from the Bureau of Reclamation to evaluate MBR � reverseosmosis (RO) technology for wastewater reclamation (Adham et al., 2004). A 16-monthstudy was conducted at the Point Loma Wastewater Treatment Plant (PLWTP) atSan Diego, CA on four MBR systems: Mitsubishi Rayon, Zenon, Kubota and Memcor.The technologies were each challenged first with raw wastewater (Part 1) and thenwith advanced primary treated effluent containing polymer and coagulant residual(Part 2), arising from clarification with ferric chloride (27 mg/L, average dose) and along chain, high-molecular-weight anionic polymer. Details of feedwater quality(Table 3.8), MBR technology design (Table 3.9) and operation (Table 3.10) are givenbelow.
In this trial only the advanced primary treated effluent feedwater was tested on allfour technologies. Results from untreated primary sewage were inconclusive sincethe feed water evidently contained unclarified ferric coagulant. All four technologiesperformed satisfactorily with respect to nitrification, disinfection and BOD removal.Only the Kubota was operated with denitrification and consequently demanded less
138 The MBR Book
1856174817_Ch03.qxd 6/6/06 2:29 PM Page 138
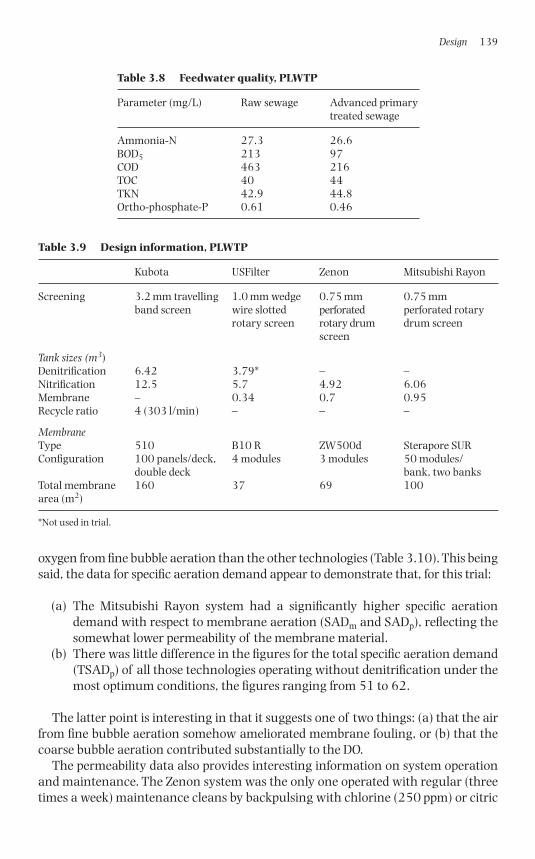
oxygen from fine bubble aeration than the other technologies (Table 3.10). This beingsaid, the data for specific aeration demand appear to demonstrate that, for this trial:
(a) The Mitsubishi Rayon system had a significantly higher specific aerationdemand with respect to membrane aeration (SADm and SADp), reflecting thesomewhat lower permeability of the membrane material.
(b) There was little difference in the figures for the total specific aeration demand(TSADp) of all those technologies operating without denitrification under themost optimum conditions, the figures ranging from 51 to 62.
The latter point is interesting in that it suggests one of two things: (a) that the airfrom fine bubble aeration somehow ameliorated membrane fouling, or (b) that thecoarse bubble aeration contributed substantially to the DO.
The permeability data also provides interesting information on system operationand maintenance. The Zenon system was the only one operated with regular (threetimes a week) maintenance cleans by backpulsing with chlorine (250 ppm) or citric
Design 139
Table 3.8 Feedwater quality, PLWTP
Parameter (mg/L) Raw sewage Advanced primarytreated sewage
Ammonia-N 27.3 26.6BOD5 213 97COD 463 216TOC 40 44TKN 42.9 44.8Ortho-phosphate-P 0.61 0.46
Table 3.9 Design information, PLWTP
Kubota USFilter Zenon Mitsubishi Rayon
Screening 3.2 mm travelling 1.0 mm wedge 0.75 mm 0.75 mm band screen wire slotted perforated perforated rotary
rotary screen rotary drum drum screenscreen
Tank sizes (m3)Denitrification 6.42 3.79* – –Nitrification 12.5 5.7 4.92 6.06Membrane – 0.34 0.7 0.95Recycle ratio 4 (303 l/min) – – –
MembraneType 510 B10 R ZW500d Sterapore SURConfiguration 100 panels/deck, 4 modules 3 modules 50 modules/
double deck bank, two banksTotal membrane 160 37 69 100area (m2)
*Not used in trial.
1856174817_Ch03.qxd 6/6/06 2:29 PM Page 139
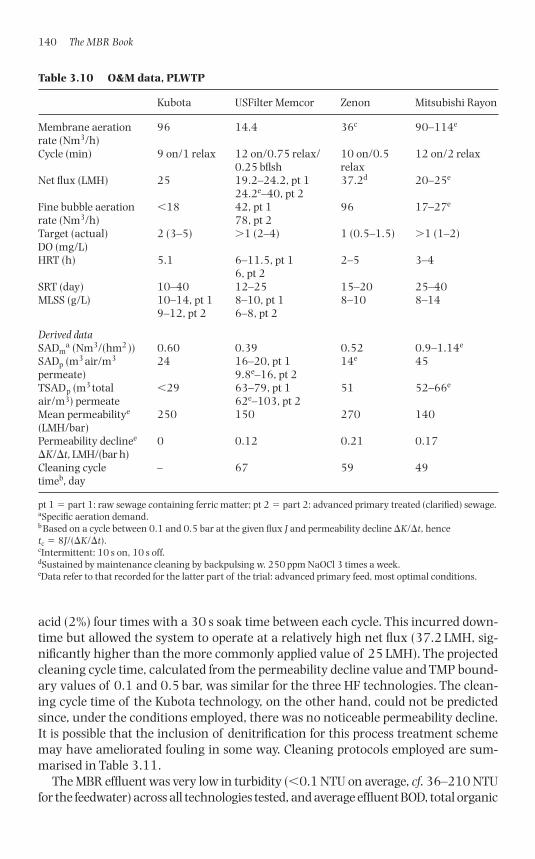
acid (2%) four times with a 30 s soak time between each cycle. This incurred down-time but allowed the system to operate at a relatively high net flux (37.2 LMH, sig-nificantly higher than the more commonly applied value of 25 LMH). The projectedcleaning cycle time, calculated from the permeability decline value and TMP bound-ary values of 0.1 and 0.5 bar, was similar for the three HF technologies. The clean-ing cycle time of the Kubota technology, on the other hand, could not be predictedsince, under the conditions employed, there was no noticeable permeability decline.It is possible that the inclusion of denitrification for this process treatment schememay have ameliorated fouling in some way. Cleaning protocols employed are sum-marised in Table 3.11.
The MBR effluent was very low in turbidity (�0.1 NTU on average, cf. 36–210 NTUfor the feedwater) across all technologies tested, and average effluent BOD, total organic
140 The MBR Book
Table 3.10 O&M data, PLWTP
Kubota USFilter Memcor Zenon Mitsubishi Rayon
Membrane aeration 96 14.4 36c 90–114e
rate (Nm3/h)Cycle (min) 9 on/1 relax 12 on/0.75 relax/ 10 on/0.5 12 on/2 relax
0.25 bflsh relaxNet flux (LMH) 25 19.2–24.2, pt 1 37.2d 20–25e
24.2e–40, pt 2Fine bubble aeration �18 42, pt 1 96 17–27e
rate (Nm3/h) 78, pt 2Target (actual) 2 (3–5) 1 (2–4) 1 (0.5–1.5) 1 (1–2)DO (mg/L)HRT (h) 5.1 6–11.5, pt 1 2–5 3–4
6, pt 2SRT (day) 10–40 12–25 15–20 25–40MLSS (g/L) 10–14, pt 1 8–10, pt 1 8–10 8–14
9–12, pt 2 6–8, pt 2
Derived dataSADm
a (Nm3/(hm2 )) 0.60 0.39 0.52 0.9–1.14e
SADp (m3 air/m3 24 16–20, pt 1 14e 45permeate) 9.8e–16, pt 2TSADp (m3 total �29 63–79, pt 1 51 52–66e
air/m3) permeate 62e–103, pt 2Mean permeabilitye 250 150 270 140(LMH/bar)Permeability declinee 0 0.12 0.21 0.17�K/�t, LMH/(bar h)Cleaning cycle – 67 59 49timeb, day
pt 1 � part 1: raw sewage containing ferric matter; pt 2 � part 2: advanced primary treated (clarified) sewage.aSpecific aeration demand.b Based on a cycle between 0.1 and 0.5 bar at the given flux J and permeability decline �K/�t, hencetc � 8J/(�K/�t).cIntermittent: 10 s on, 10 s off.dSustained by maintenance cleaning by backpulsing w. 250 ppm NaOCl 3 times a week.eData refer to that recorded for the latter part of the trial: advanced primary feed, most optimal conditions.
1856174817_Ch03.qxd 6/6/06 2:29 PM Page 140
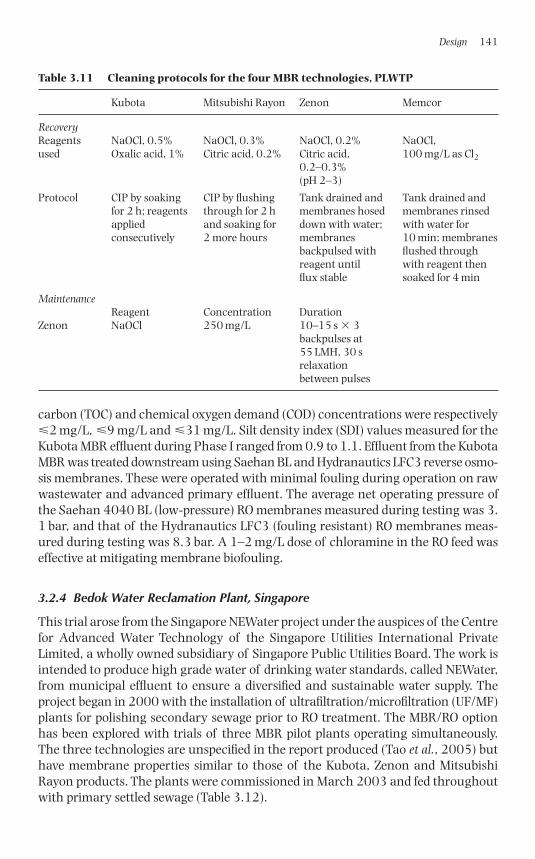
carbon (TOC) and chemical oxygen demand (COD) concentrations were respectively�2 mg/L, �9 mg/L and �31 mg/L. Silt density index (SDI) values measured for theKubota MBR effluent during Phase I ranged from 0.9 to 1.1. Effluent from the KubotaMBR was treated downstream using Saehan BL and Hydranautics LFC3 reverse osmo-sis membranes. These were operated with minimal fouling during operation on rawwastewater and advanced primary effluent. The average net operating pressure ofthe Saehan 4040 BL (low-pressure) RO membranes measured during testing was 3.1 bar, and that of the Hydranautics LFC3 (fouling resistant) RO membranes meas-ured during testing was 8.3 bar. A 1–2 mg/L dose of chloramine in the RO feed waseffective at mitigating membrane biofouling.
3.2.4 Bedok Water Reclamation Plant, Singapore
This trial arose from the Singapore NEWater project under the auspices of the Centrefor Advanced Water Technology of the Singapore Utilities International PrivateLimited, a wholly owned subsidiary of Singapore Public Utilities Board. The work isintended to produce high grade water of drinking water standards, called NEWater,from municipal effluent to ensure a diversified and sustainable water supply. Theproject began in 2000 with the installation of ultrafiltration/microfiltration (UF/MF)plants for polishing secondary sewage prior to RO treatment. The MBR/RO optionhas been explored with trials of three MBR pilot plants operating simultaneously.The three technologies are unspecified in the report produced (Tao et al., 2005) buthave membrane properties similar to those of the Kubota, Zenon and MitsubishiRayon products. The plants were commissioned in March 2003 and fed throughoutwith primary settled sewage (Table 3.12).
Design 141
Table 3.11 Cleaning protocols for the four MBR technologies, PLWTP
Kubota Mitsubishi Rayon Zenon Memcor
RecoveryReagents NaOCl, 0.5% NaOCl, 0.3% NaOCl, 0.2% NaOCl, used Oxalic acid, 1% Citric acid, 0.2% Citric acid, 100 mg/L as Cl2
0.2–0.3% (pH 2–3)
Protocol CIP by soaking CIP by flushing Tank drained and Tank drained and for 2 h; reagents through for 2 h membranes hosed membranes rinsed applied and soaking for down with water; with water for consecutively 2 more hours membranes 10 min; membranes
backpulsed with flushed through reagent until with reagent then flux stable soaked for 4 min
MaintenanceReagent Concentration Duration
Zenon NaOCl 250 mg/L 10–15 s 3 backpulses at 55 LMH, 30 s relaxation between pulses
1856174817_Ch03.qxd 6/6/06 2:29 PM Page 141
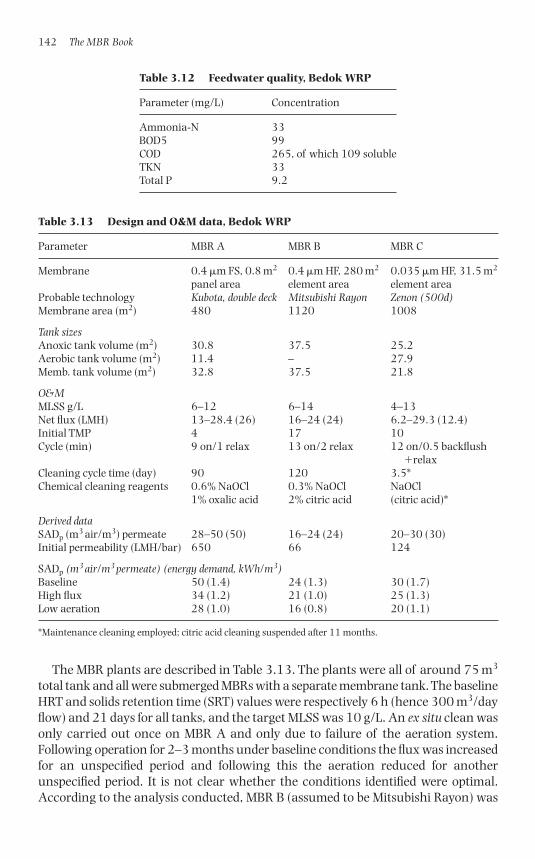
The MBR plants are described in Table 3.13. The plants were all of around 75 m3
total tank and all were submerged MBRs with a separate membrane tank. The baselineHRT and solids retention time (SRT) values were respectively 6 h (hence 300 m3/dayflow) and 21 days for all tanks, and the target MLSS was 10 g/L. An ex situ clean wasonly carried out once on MBR A and only due to failure of the aeration system.Following operation for 2–3 months under baseline conditions the flux was increasedfor an unspecified period and following this the aeration reduced for anotherunspecified period. It is not clear whether the conditions identified were optimal.According to the analysis conducted, MBR B (assumed to be Mitsubishi Rayon) was
142 The MBR Book
Table 3.12 Feedwater quality, Bedok WRP
Parameter (mg/L) Concentration
Ammonia-N 33BOD5 99COD 265, of which 109 solubleTKN 33Total P 9.2
Table 3.13 Design and O&M data, Bedok WRP
Parameter MBR A MBR B MBR C
Membrane 0.4 �m FS, 0.8 m2 0.4 �m HF, 280 m2 0.035 �m HF, 31.5 m2
panel area element area element areaProbable technology Kubota, double deck Mitsubishi Rayon Zenon (500d)Membrane area (m2) 480 1120 1008
Tank sizesAnoxic tank volume (m2) 30.8 37.5 25.2Aerobic tank volume (m2) 11.4 – 27.9Memb. tank volume (m2) 32.8 37.5 21.8
O&MMLSS g/L 6–12 6–14 4–13Net flux (LMH) 13–28.4 (26) 16–24 (24) 6.2–29.3 (12.4)Initial TMP 4 17 10Cycle (min) 9 on/1 relax 13 on/2 relax 12 on/0.5 backflush
�relaxCleaning cycle time (day) 90 120 3.5*Chemical cleaning reagents 0.6% NaOCl 0.3% NaOCl NaOCl
1% oxalic acid 2% citric acid (citric acid)*
Derived dataSADp (m3 air/m3) permeate 28–50 (50) 16–24 (24) 20–30 (30)Initial permeability (LMH/bar) 650 66 124
SADp (m3 air/m3 permeate) (energy demand, kWh/m3)Baseline 50 (1.4) 24 (1.3) 30 (1.7)High flux 34 (1.2) 21 (1.0) 25 (1.3)Low aeration 28 (1.0) 16 (0.8) 20 (1.1)
*Maintenance cleaning employed; citric acid cleaning suspended after 11 months.
1856174817_Ch03.qxd 6/6/06 2:29 PM Page 142
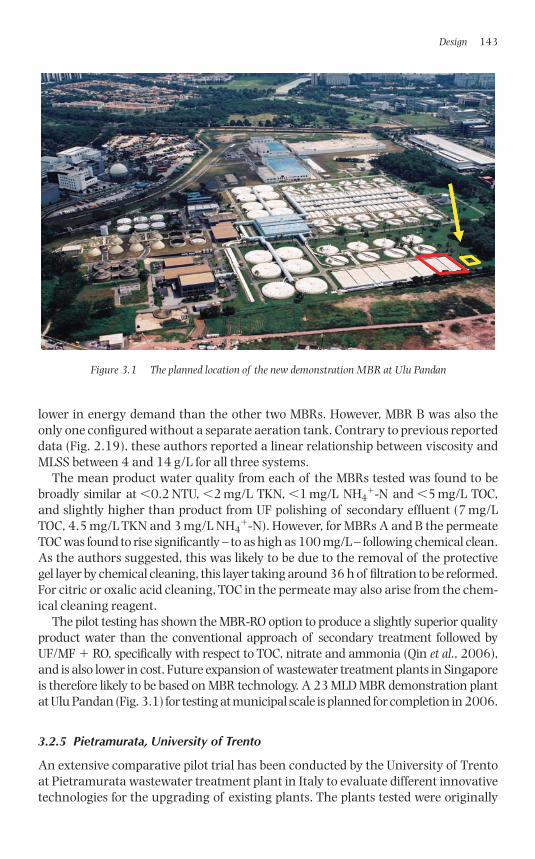
lower in energy demand than the other two MBRs. However, MBR B was also theonly one configured without a separate aeration tank. Contrary to previous reporteddata (Fig. 2.19), these authors reported a linear relationship between viscosity andMLSS between 4 and 14 g/L for all three systems.
The mean product water quality from each of the MBRs tested was found to bebroadly similar at �0.2 NTU, �2 mg/L TKN, �1 mg/L NH4
�-N and �5 mg/L TOC,and slightly higher than product from UF polishing of secondary effluent (7 mg/LTOC, 4.5 mg/L TKN and 3 mg/L NH4
�-N). However, for MBRs A and B the permeateTOC was found to rise significantly – to as high as 100 mg/L – following chemical clean.As the authors suggested, this was likely to be due to the removal of the protectivegel layer by chemical cleaning, this layer taking around 36 h of filtration to be reformed.For citric or oxalic acid cleaning, TOC in the permeate may also arise from the chem-ical cleaning reagent.
The pilot testing has shown the MBR-RO option to produce a slightly superior qualityproduct water than the conventional approach of secondary treatment followed byUF/MF � RO, specifically with respect to TOC, nitrate and ammonia (Qin et al., 2006),and is also lower in cost. Future expansion of wastewater treatment plants in Singaporeis therefore likely to be based on MBR technology. A 23 MLD MBR demonstration plantat Ulu Pandan (Fig. 3.1) for testing at municipal scale is planned for completion in 2006.
3.2.5 Pietramurata, University of Trento
An extensive comparative pilot trial has been conducted by the University of Trentoat Pietramurata wastewater treatment plant in Italy to evaluate different innovativetechnologies for the upgrading of existing plants. The plants tested were originally
Design 143
Figure 3.1 The planned location of the new demonstration MBR at Ulu Pandan
1856174817_Ch03.qxd 6/6/06 2:29 PM Page 143
Zenon and Kubota, but more recently a Memcor plant has also been studied. Thefirst plant was installed in June 2001. This consisted of two separate MBRs whosebiotreatment tanks were provided by dividing a single rectangular stainless steeltank into two separated treatment lines for a Zenon and Kubota MBR, both config-ured with pre-denitrification. All experimental activities on site have been performedbetween March and December, since the whole system is outdoors and the ambienttemperature is too low to operate during the winter months.
The biological volume was calculated according to a rather conservative flux valueof 15 LMH resulting in volumes of 5.14 and 4.23 m3 for the aerobic tanks, and 2.76and 2.27 m3 for the anoxic tanks for the respective Zenon and Kubota processes. Thepermeate is removed by suction, originally using progressing cavity (Mono) pumpsbut a self-priming pump was installed in 2003. A progressing cavity pump is alsoused for recirculation from the aerobic to the anoxic tank at recycle ratios between 3and 5. Aeration for the biological process is supplied to both aerobic tanks from themain aeration pipe of the full-scale plant and is measured by specific airflow meters.The Zenon/Memcor and Kubota systems were operated under different SRTs, imposedby daily sludge wasting. All the usual operating parameters have been monitored(TMP, DO, etc.) and, since this effluent is re-used for agriculture, from 2004 onwardsthe effluent nitrate concentration from the Zenon plant has been measured.
Membrane modules originally installed comprised a Zenon 500 c (66.6 m2 mem-brane surface area) and a Kubota E50 (40 m2 of membrane surface area). In November2003 a new hollow fibre module (Memcor) was installed as a sidestream to the ZenonMBR tank. The module, 40 m2, was immersed in a tank (0.3 m3) and fed with sludgefrom the aerobic tank and fed back to it under gravity. Due to this special combina-tion, the permeate flow suctioned from both HF lines was often reduced to avoidexcessive organic loading of the biological system. Simultaneous short- and long-term flux-step tests on both systems were likewise also avoided. Due to some technicaland budgeting problems, operation of some modules was stopped for long periods; theZenon module was not used during 2003 and the Kubota module was not used dur-ing 2005. In 2005 the Memcor module was operated for a few weeks on biomasspreviously acclimatised by the Zenon module. The aerator depth was 1.9–2.0 m forthe Zenon and Memcor modules and 2.4 m for the Kubota stack.
During 2002 the Zenon module was cleaned monthly using 300 mg/L NaOCl as Cl2.From 2004 onwards the reagent concentration for the monthly clean was reducedto 200 mg/L. From 2002 to 2003 the Kubota module was cleaned twice yearly with3000 mg/L (i.e. 0.3 wt%) NaOCl as Cl2 and once a year with a 10 000 mg/L (1 wt%)solution of oxalic acid. From 2004 the module was cleaned monthly with a 200 mg/Lsolution of NaOCl with no supplementary acid cleaning. The Memcor module wascleaned monthly using 300 mg/L NaOCl. For all three modules the membranes wereadditionally cleaned using 100 mg/L NaOCl immediately before each flux-step test.
The mean feed COD and N-NH4� levels were 575–988 and 23–33 mg/L respec-
tively, with the BOD/COD ratio generally being �0.5. The corresponding outlet con-centrations were �22 and �5 respectively, with the total organic nitrogen (TON)being below 11 mg/L at all times. Summary operation and maintenance data aresummarised in Table 3.14, and mean and apparent optimum values in Table 3.15.These are discussed in the context of other data in Section 3.3.
144 The MBR Book
1856174817_Ch03.qxd 6/6/06 2:29 PM Page 144
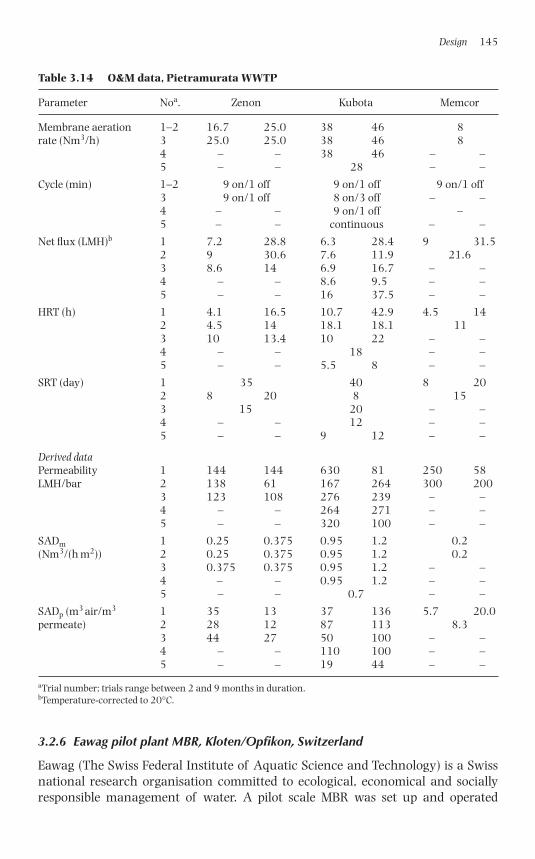
3.2.6 Eawag pilot plant MBR, Kloten/Opfikon, Switzerland
Eawag (The Swiss Federal Institute of Aquatic Science and Technology) is a Swissnational research organisation committed to ecological, economical and sociallyresponsible management of water. A pilot scale MBR was set up and operated
Design 145
Table 3.14 O&M data, Pietramurata WWTP
Parameter Noa. Zenon Kubota Memcor
Membrane aeration 1–2 16.7 25.0 38 46 8rate (Nm3/h) 3 25.0 25.0 38 46 8
4 – – 38 46 – –5 – – 28 – –
Cycle (min) 1–2 9 on/1 off 9 on/1 off 9 on/1 off3 9 on/1 off 8 on/3 off – –4 – – 9 on/1 off –5 – – continuous – –
Net flux (LMH)b 1 7.2 28.8 6.3 28.4 9 31.52 9 30.6 7.6 11.9 21.63 8.6 14 6.9 16.7 – –4 – – 8.6 9.5 – –5 – – 16 37.5 – –
HRT (h) 1 4.1 16.5 10.7 42.9 4.5 142 4.5 14 18.1 18.1 113 10 13.4 10 22 – –4 – – 18 – –5 – – 5.5 8 – –
SRT (day) 1 35 40 8 202 8 20 8 153 15 20 – –4 – – 12 – –5 – – 9 12 – –
Derived dataPermeability 1 144 144 630 81 250 58LMH/bar 2 138 61 167 264 300 200
3 123 108 276 239 – –4 – – 264 271 – –5 – – 320 100 – –
SADm 1 0.25 0.375 0.95 1.2 0.2(Nm3/(h m2)) 2 0.25 0.375 0.95 1.2 0.2
3 0.375 0.375 0.95 1.2 – –4 – – 0.95 1.2 – –5 – – 0.7 – –
SADp (m3 air/m3 1 35 13 37 136 5.7 20.0permeate) 2 28 12 87 113 8.3
3 44 27 50 100 – –4 – – 110 100 – –5 – – 19 44 – –
aTrial number; trials range between 2 and 9 months in duration.bTemperature-corrected to 20°C.
1856174817_Ch03.qxd 6/6/06 2:29 PM Page 145
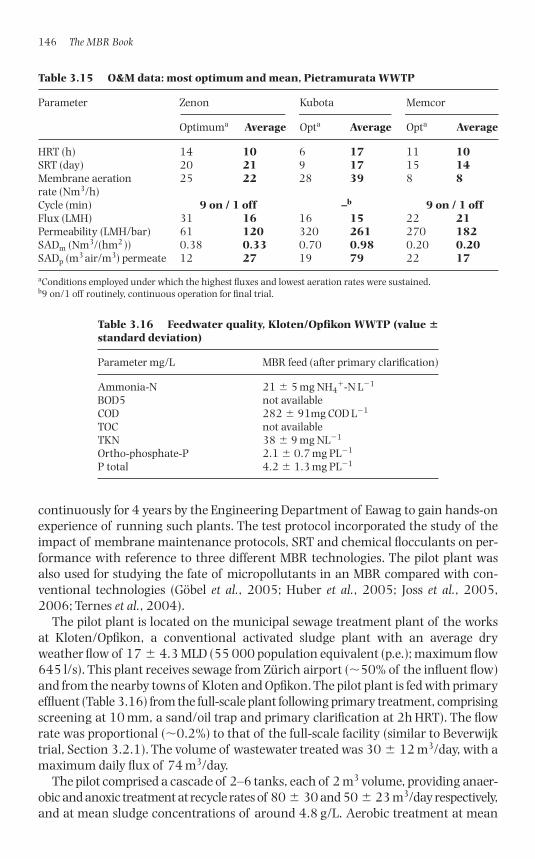
continuously for 4 years by the Engineering Department of Eawag to gain hands-onexperience of running such plants. The test protocol incorporated the study of theimpact of membrane maintenance protocols, SRT and chemical flocculants on per-formance with reference to three different MBR technologies. The pilot plant wasalso used for studying the fate of micropollutants in an MBR compared with con-ventional technologies (Göbel et al., 2005; Huber et al., 2005; Joss et al., 2005,2006; Ternes et al., 2004).
The pilot plant is located on the municipal sewage treatment plant of the works at Kloten/Opfikon, a conventional activated sludge plant with an average dryweather flow of 17 � 4.3 MLD (55 000 population equivalent (p.e.); maximum flow645 l/s). This plant receives sewage from Zürich airport (�50% of the influent flow)and from the nearby towns of Kloten and Opfikon. The pilot plant is fed with primaryeffluent (Table 3.16) from the full-scale plant following primary treatment, comprisingscreening at 10 mm, a sand/oil trap and primary clarification at 2h HRT). The flowrate was proportional (�0.2%) to that of the full-scale facility (similar to Beverwijktrial, Section 3.2.1). The volume of wastewater treated was 30 � 12 m3/day, with amaximum daily flux of 74 m3/day.
The pilot comprised a cascade of 2–6 tanks, each of 2 m3 volume, providing anaer-obic and anoxic treatment at recycle rates of 80 � 30 and 50 � 23 m3/day respectively,and at mean sludge concentrations of around 4.8 g/L. Aerobic treatment at mean
146 The MBR Book
Table 3.15 O&M data: most optimum and mean, Pietramurata WWTP
Parameter Zenon Kubota Memcor
Optimuma Average Opta Average Opta Average
HRT (h) 14 10 6 17 11 10SRT (day) 20 21 9 17 15 14Membrane aeration 25 22 28 39 8 8rate (Nm3/h)Cycle (min) 9 on / 1 off –b 9 on / 1 offFlux (LMH) 31 16 16 15 22 21Permeability (LMH/bar) 61 120 320 261 270 182SADm (Nm3/(hm2 )) 0.38 0.33 0.70 0.98 0.20 0.20SADp (m3 air/m3) permeate 12 27 19 79 22 17
aConditions employed under which the highest fluxes and lowest aeration rates were sustained.b9 on/1 off routinely, continuous operation for final trial.
Table 3.16 Feedwater quality, Kloten/Opfikon WWTP (value �standard deviation)
Parameter mg/L MBR feed (after primary clarification)
Ammonia-N 21 � 5 mg NH4�-N L�1
BOD5 not availableCOD 282 � 91mg COD L�1
TOC not availableTKN 38 � 9 mg NL�1
Ortho-phosphate-P 2.1 � 0.7 mg PL�1
P total 4.2 � 1.3 mg PL�1
1856174817_Ch03.qxd 6/6/06 2:29 PM Page 146
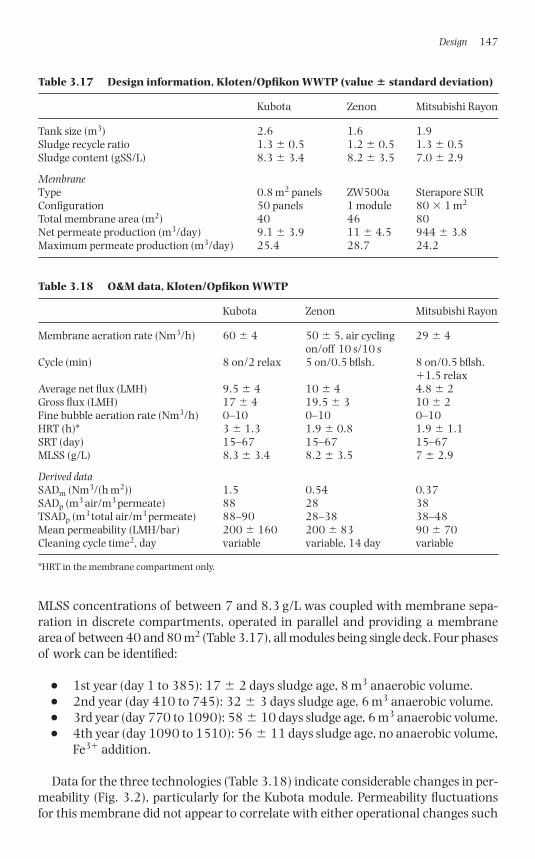
MLSS concentrations of between 7 and 8.3 g/L was coupled with membrane sepa-ration in discrete compartments, operated in parallel and providing a membranearea of between 40 and 80 m2 (Table 3.17), all modules being single deck. Four phasesof work can be identified:
● 1st year (day 1 to 385): 17 � 2 days sludge age, 8 m3 anaerobic volume.● 2nd year (day 410 to 745): 32 � 3 days sludge age, 6 m3 anaerobic volume.● 3rd year (day 770 to 1090): 58 � 10 days sludge age, 6 m3 anaerobic volume.● 4th year (day 1090 to 1510): 56 � 11 days sludge age, no anaerobic volume,
Fe3� addition.
Data for the three technologies (Table 3.18) indicate considerable changes in per-meability (Fig. 3.2), particularly for the Kubota module. Permeability fluctuationsfor this membrane did not appear to correlate with either operational changes such
Design 147
Table 3.17 Design information, Kloten/Opfikon WWTP (value � standard deviation)
Kubota Zenon Mitsubishi Rayon
Tank size (m3) 2.6 1.6 1.9Sludge recycle ratio 1.3 � 0.5 1.2 � 0.5 1.3 � 0.5Sludge content (gSS/L) 8.3 � 3.4 8.2 � 3.5 7.0 � 2.9
MembraneType 0.8 m2 panels ZW500a Sterapore SURConfiguration 50 panels 1 module 80 1 m2
Total membrane area (m2) 40 46 80Net permeate production (m3/day) 9.1 � 3.9 11 � 4.5 944 � 3.8Maximum permeate production (m3/day) 25.4 28.7 24.2
Table 3.18 O&M data, Kloten/Opfikon WWTP
Kubota Zenon Mitsubishi Rayon
Membrane aeration rate (Nm3/h) 60 � 4 50 � 5, air cycling 29 � 4on/off 10 s/10 s
Cycle (min) 8 on/2 relax 5 on/0.5 bflsh. 8 on/0.5 bflsh.�1.5 relax
Average net flux (LMH) 9.5 � 4 10 � 4 4.8 � 2Gross flux (LMH) 17 � 4 19.5 � 3 10 � 2Fine bubble aeration rate (Nm3/h) 0–10 0–10 0–10HRT (h)* 3 � 1.3 1.9 � 0.8 1.9 � 1.1SRT (day) 15–67 15–67 15–67MLSS (g/L) 8.3 � 3.4 8.2 � 3.5 7 � 2.9
Derived dataSADm (Nm3/(h m2)) 1.5 0.54 0.37SADp (m3 air/m3 permeate) 88 28 38TSADp (m3 total air/m3 permeate) 88–90 28–38 38–48Mean permeability (LMH/bar) 200 � 160 200 � 83 90 � 70Cleaning cycle time2, day variable variable, 14 day variable
*HRT in the membrane compartment only.
1856174817_Ch03.qxd 6/6/06 2:29 PM Page 147
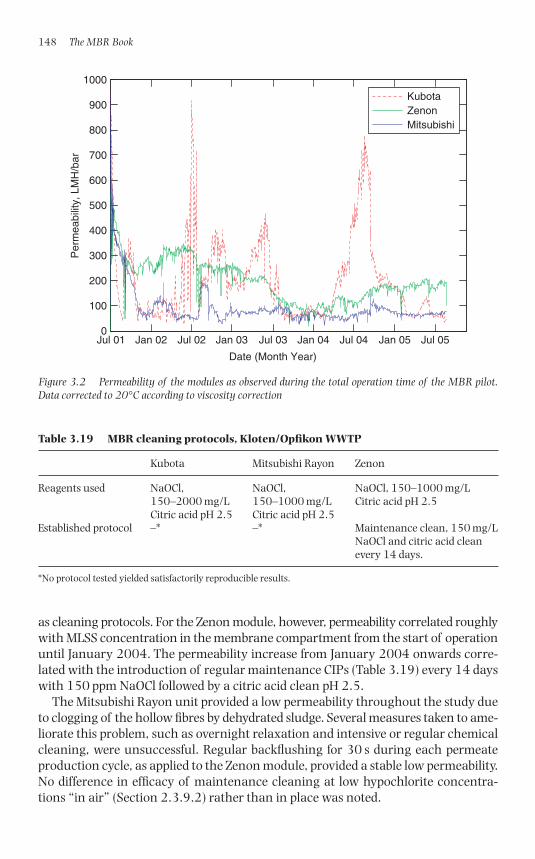
as cleaning protocols. For the Zenon module, however, permeability correlated roughlywith MLSS concentration in the membrane compartment from the start of operationuntil January 2004. The permeability increase from January 2004 onwards corre-lated with the introduction of regular maintenance CIPs (Table 3.19) every 14 dayswith 150 ppm NaOCl followed by a citric acid clean pH 2.5.
The Mitsubishi Rayon unit provided a low permeability throughout the study dueto clogging of the hollow fibres by dehydrated sludge. Several measures taken to ame-liorate this problem, such as overnight relaxation and intensive or regular chemicalcleaning, were unsuccessful. Regular backflushing for 30 s during each permeateproduction cycle, as applied to the Zenon module, provided a stable low permeability.No difference in efficacy of maintenance cleaning at low hypochlorite concentra-tions “in air” (Section 2.3.9.2) rather than in place was noted.
148 The MBR Book
Jul 01 Jan 02 Jul 02 Jan 03 Jul 03 Jan 04 Jul 04 Jan 05 Jul 050
100
200
300
400
500
600
700
800
900
1000P
erm
eabi
lity,
LM
H/b
ar
Date (Month Year)
KubotaZenonMitsubishi
Figure 3.2 Permeability of the modules as observed during the total operation time of the MBR pilot.Data corrected to 20°C according to viscosity correction
Table 3.19 MBR cleaning protocols, Kloten/Opfikon WWTP
Kubota Mitsubishi Rayon Zenon
Reagents used NaOCl, NaOCl, NaOCl, 150–1000 mg/L150–2000 mg/L 150–1000 mg/L Citric acid pH 2.5Citric acid pH 2.5 Citric acid pH 2.5
Established protocol –* –* Maintenance clean, 150 mg/L NaOCl and citric acid clean every 14 days.
*No protocol tested yielded satisfactorily reproducible results.
1856174817_Ch03.qxd 6/6/06 2:29 PM Page 148
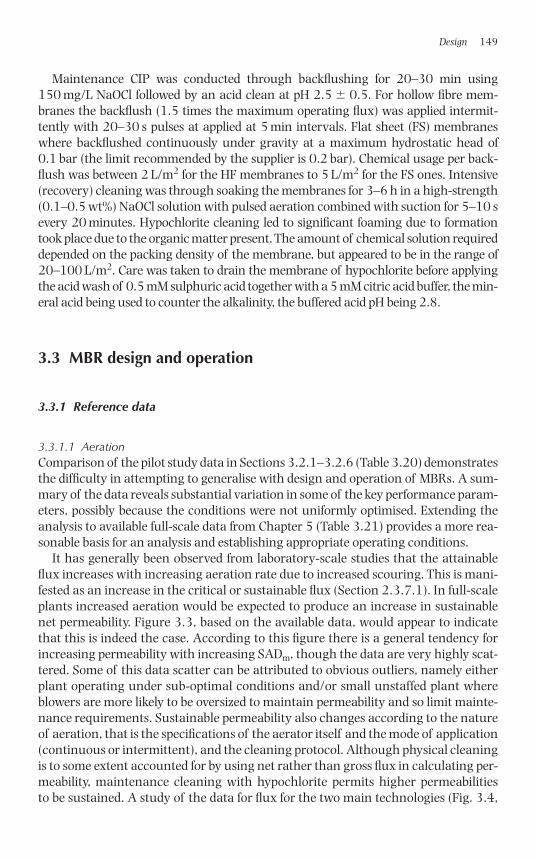
Maintenance CIP was conducted through backflushing for 20–30 min using150 mg/L NaOCl followed by an acid clean at pH 2.5 � 0.5. For hollow fibre mem-branes the backflush (1.5 times the maximum operating flux) was applied intermit-tently with 20–30 s pulses at applied at 5 min intervals. Flat sheet (FS) membraneswhere backflushed continuously under gravity at a maximum hydrostatic head of0.1 bar (the limit recommended by the supplier is 0.2 bar). Chemical usage per back-flush was between 2 L/m2 for the HF membranes to 5 L/m2 for the FS ones. Intensive(recovery) cleaning was through soaking the membranes for 3–6 h in a high-strength(0.1–0.5 wt%) NaOCl solution with pulsed aeration combined with suction for 5–10 severy 20 minutes. Hypochlorite cleaning led to significant foaming due to formationtook place due to the organic matter present. The amount of chemical solution requireddepended on the packing density of the membrane, but appeared to be in the range of20–100 L/m2. Care was taken to drain the membrane of hypochlorite before applyingthe acid wash of 0.5 mM sulphuric acid together with a 5 mM citric acid buffer, the min-eral acid being used to counter the alkalinity, the buffered acid pH being 2.8.
3.3 MBR design and operation
3.3.1 Reference data
3.3.1.1 AerationComparison of the pilot study data in Sections 3.2.1–3.2.6 (Table 3.20) demonstratesthe difficulty in attempting to generalise with design and operation of MBRs. A sum-mary of the data reveals substantial variation in some of the key performance param-eters, possibly because the conditions were not uniformly optimised. Extending theanalysis to available full-scale data from Chapter 5 (Table 3.21) provides a more rea-sonable basis for an analysis and establishing appropriate operating conditions.
It has generally been observed from laboratory-scale studies that the attainableflux increases with increasing aeration rate due to increased scouring. This is mani-fested as an increase in the critical or sustainable flux (Section 2.3.7.1). In full-scaleplants increased aeration would be expected to produce an increase in sustainablenet permeability. Figure 3.3, based on the available data, would appear to indicatethat this is indeed the case. According to this figure there is a general tendency forincreasing permeability with increasing SADm, though the data are very highly scat-tered. Some of this data scatter can be attributed to obvious outliers, namely eitherplant operating under sub-optimal conditions and/or small unstaffed plant whereblowers are more likely to be oversized to maintain permeability and so limit mainte-nance requirements. Sustainable permeability also changes according to the natureof aeration, that is the specifications of the aerator itself and the mode of application(continuous or intermittent), and the cleaning protocol. Although physical cleaningis to some extent accounted for by using net rather than gross flux in calculating per-meability, maintenance cleaning with hypochlorite permits higher permeabilities to be sustained. A study of the data for flux for the two main technologies (Fig. 3.4,
Design 149
1856174817_Ch03.qxd 6/6/06 2:29 PM Page 149
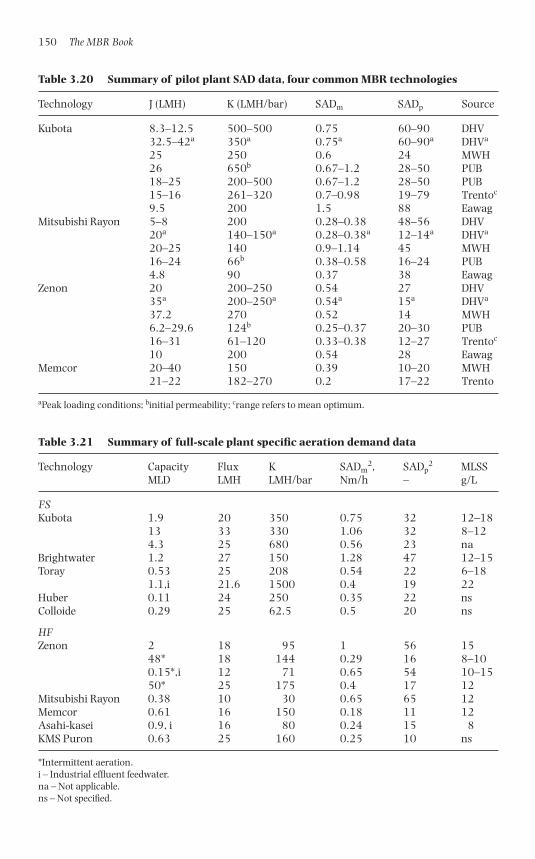
150 The MBR Book
Table 3.20 Summary of pilot plant SAD data, four common MBR technologies
Technology J (LMH) K (LMH/bar) SADm SADp Source
Kubota 8.3–12.5 500–500 0.75 60–90 DHV32.5–42a 350a 0.75a 60–90a DHVa
25 250 0.6 24 MWH26 650b 0.67–1.2 28–50 PUB18–25 200–500 0.67–1.2 28–50 PUB15–16 261–320 0.7–0.98 19–79 Trentoc
9.5 200 1.5 88 EawagMitsubishi Rayon 5–8 200 0.28–0.38 48–56 DHV
20a 140–150a 0.28–0.38a 12–14a DHVa
20–25 140 0.9–1.14 45 MWH16–24 66b 0.38–0.58 16–24 PUB4.8 90 0.37 38 Eawag
Zenon 20 200–250 0.54 27 DHV35a 200–250a 0.54a 15a DHVa
37.2 270 0.52 14 MWH6.2–29.6 124b 0.25–0.37 20–30 PUB16–31 61–120 0.33–0.38 12–27 Trentoc
10 200 0.54 28 EawagMemcor 20–40 150 0.39 10–20 MWH
21–22 182–270 0.2 17–22 Trento
aPeak loading conditions; binitial permeability; crange refers to mean optimum.
Table 3.21 Summary of full-scale plant specific aeration demand data
Technology Capacity Flux K SADm2, SADp
2 MLSSMLD LMH LMH/bar Nm/h – g/L
FSKubota 1.9 20 350 0.75 32 12–18
13 33 330 1.06 32 8–124.3 25 680 0.56 23 na
Brightwater 1.2 27 150 1.28 47 12–15Toray 0.53 25 208 0.54 22 6–18
1.1,i 21.6 1500 0.4 19 22Huber 0.11 24 250 0.35 22 nsColloide 0.29 25 62.5 0.5 20 ns
HFZenon 2 18 95 1 56 15
48* 18 144 0.29 16 8–100.15*,i 12 71 0.65 54 10–1550* 25 175 0.4 17 12
Mitsubishi Rayon 0.38 10 30 0.65 65 12Memcor 0.61 16 150 0.18 11 12Asahi-kasei 0.9, i 16 80 0.24 15 8KMS Puron 0.63 25 160 0.25 10 ns
*Intermittent aeration.i – Industrial effluent feedwater.na – Not applicable.ns – Not specified.
1856174817_Ch03.qxd 6/6/06 2:29 PM Page 150
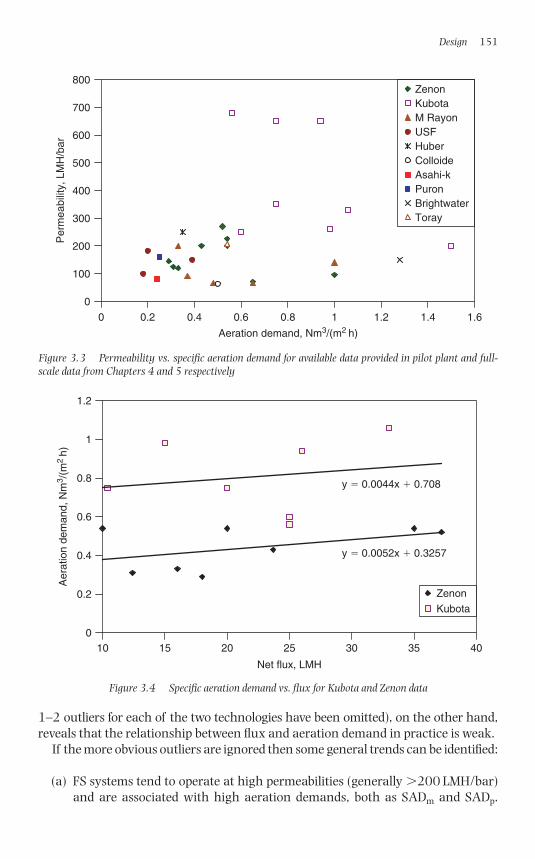
1–2 outliers for each of the two technologies have been omitted), on the other hand,reveals that the relationship between flux and aeration demand in practice is weak.
If the more obvious outliers are ignored then some general trends can be identified:
(a) FS systems tend to operate at high permeabilities (generally 200 LMH/bar)and are associated with high aeration demands, both as SADm and SADp.
Design 151
0
100
200
300
400
500
600
700
800
0 0.2 0.4 0.6 0.8 1.21 1.4 1.6
Aeration demand, Nm3/(m2 h)
Per
mea
bilit
y, L
MH
/bar
ZenonKubotaM RayonUSFHuberColloideAsahi-kPuronBrightwaterToray
Figure 3.3 Permeability vs. specific aeration demand for available data provided in pilot plant and full-scale data from Chapters 4 and 5 respectively
y � 0.0052x � 0.3257
y � 0.0044x � 0.708
0
0.2
0.4
0.6
0.8
1
1.2
10 15 20 25 30 35 40
Net flux, LMH
Aer
atio
n de
man
d, N
m3 /
(m2
h)
Zenon
Kubota
Figure 3.4 Specific aeration demand vs. flux for Kubota and Zenon data
1856174817_Ch03.qxd 6/6/06 2:29 PM Page 151
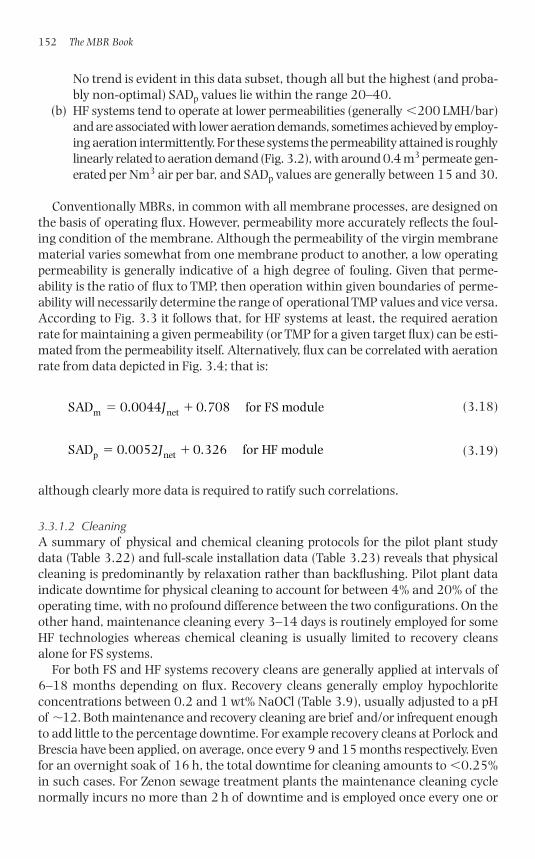
No trend is evident in this data subset, though all but the highest (and proba-bly non-optimal) SADp values lie within the range 20–40.
(b) HF systems tend to operate at lower permeabilities (generally �200 LMH/bar)and are associated with lower aeration demands, sometimes achieved by employ-ing aeration intermittently. For these systems the permeability attained is roughlylinearly related to aeration demand (Fig. 3.2), with around 0.4 m3 permeate gen-erated per Nm3 air per bar, and SADp values are generally between 15 and 30.
Conventionally MBRs, in common with all membrane processes, are designed onthe basis of operating flux. However, permeability more accurately reflects the foul-ing condition of the membrane. Although the permeability of the virgin membranematerial varies somewhat from one membrane product to another, a low operatingpermeability is generally indicative of a high degree of fouling. Given that perme-ability is the ratio of flux to TMP, then operation within given boundaries of perme-ability will necessarily determine the range of operational TMP values and vice versa.According to Fig. 3.3 it follows that, for HF systems at least, the required aerationrate for maintaining a given permeability (or TMP for a given target flux) can be esti-mated from the permeability itself. Alternatively, flux can be correlated with aerationrate from data depicted in Fig. 3.4; that is:
(3.18)
(3.19)
although clearly more data is required to ratify such correlations.
3.3.1.2 CleaningA summary of physical and chemical cleaning protocols for the pilot plant studydata (Table 3.22) and full-scale installation data (Table 3.23) reveals that physicalcleaning is predominantly by relaxation rather than backflushing. Pilot plant dataindicate downtime for physical cleaning to account for between 4% and 20% of theoperating time, with no profound difference between the two configurations. On theother hand, maintenance cleaning every 3–14 days is routinely employed for someHF technologies whereas chemical cleaning is usually limited to recovery cleansalone for FS systems.
For both FS and HF systems recovery cleans are generally applied at intervals of6–18 months depending on flux. Recovery cleans generally employ hypochloriteconcentrations between 0.2 and 1 wt% NaOCl (Table 3.9), usually adjusted to a pHof �12. Both maintenance and recovery cleaning are brief and/or infrequent enoughto add little to the percentage downtime. For example recovery cleans at Porlock andBrescia have been applied, on average, once every 9 and 15 months respectively. Evenfor an overnight soak of 16 h, the total downtime for cleaning amounts to �0.25%in such cases. For Zenon sewage treatment plants the maintenance cleaning cyclenormally incurs no more than 2 h of downtime and is employed once every one or
SAD 0.0052 0.326 for HF modulep net� �J
SAD 0.0044 0.708 for FS modulem net� �J
152 The MBR Book
1856174817_Ch03.qxd 6/6/06 2:29 PM Page 152
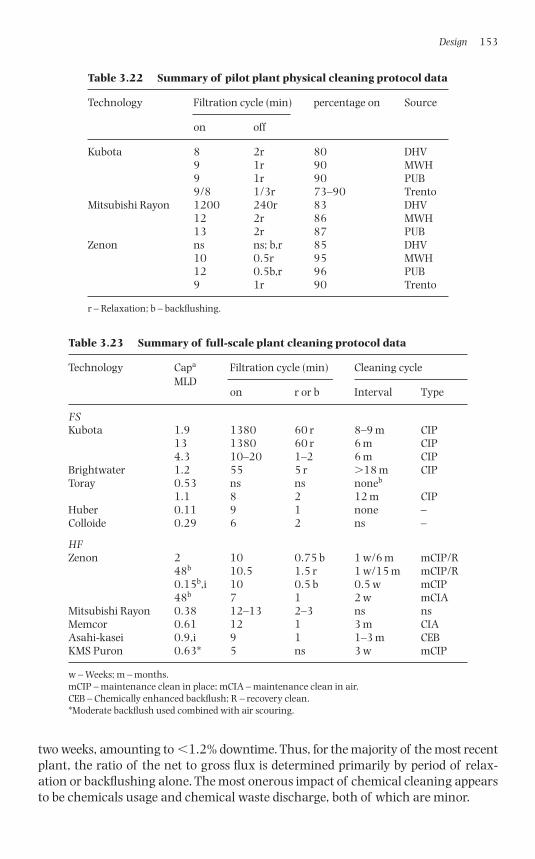
two weeks, amounting to �1.2% downtime. Thus, for the majority of the most recentplant, the ratio of the net to gross flux is determined primarily by period of relax-ation or backflushing alone. The most onerous impact of chemical cleaning appearsto be chemicals usage and chemical waste discharge, both of which are minor.
Design 153
Table 3.22 Summary of pilot plant physical cleaning protocol data
Technology Filtration cycle (min) percentage on Source
on off
Kubota 8 2r 80 DHV9 1r 90 MWH9 1r 90 PUB9/8 1/3r 73–90 Trento
Mitsubishi Rayon 1200 240r 83 DHV12 2r 86 MWH13 2r 87 PUB
Zenon ns ns; b,r 85 DHV10 0.5r 95 MWH12 0.5b,r 96 PUB9 1r 90 Trento
r – Relaxation; b – backflushing.
Table 3.23 Summary of full-scale plant cleaning protocol data
Technology Capa Filtration cycle (min) Cleaning cycleMLD
on r or b Interval Type
FSKubota 1.9 1380 60 r 8–9 m CIP
13 1380 60 r 6 m CIP4.3 10–20 1–2 6 m CIP
Brightwater 1.2 55 5 r 18 m CIPToray 0.53 ns ns noneb
1.1 8 2 12 m CIPHuber 0.11 9 1 none –Colloide 0.29 6 2 ns –
HFZenon 2 10 0.75 b 1 w/6 m mCIP/R
48b 10.5 1.5 r 1 w/15 m mCIP/R0.15b,i 10 0.5 b 0.5 w mCIP48b 7 1 2 w mCIA
Mitsubishi Rayon 0.38 12–13 2–3 ns nsMemcor 0.61 12 1 3 m CIAAsahi-kasei 0.9,i 9 1 1–3 m CEBKMS Puron 0.63* 5 ns 3 w mCIP
w – Weeks; m – months.mCIP – maintenance clean in place; mCIA – maintenance clean in air.CEB – Chemically enhanced backflush; R – recovery clean.*Moderate backflush used combined with air scouring.
1856174817_Ch03.qxd 6/6/06 2:29 PM Page 153
3.3.2 Biokinetic constants
The design of an MBR from biokinetic considerations relies on assumptions regardingvalues of the biokinetic constants, as is the case with other aerobic treatment processes.Ranges of values are summarised in Table 3.24 below. A more comprehensive listingof biokinetic constants, along with references identifying their origins is provided inAppendix B. Typical values of Ks � 60, ke � 0.08, �m � 8, Y � 0.4, Kn � 0.07,ke,n � 0.1, �m,n � 0.7, Yn � 0.13 have been used in the example design that followsin Section 3.3.3. Note that the values selected are not necessarily the most appropriatefor an MBR.
3.3.3 Design calculation
A complete design for an immersed membrane bioreactor (iMBR) can be carried outon the basis of the information presented, provided the nature of the interrelation-ship can be determined between aeration and:
(a) permeability and cleaning protocol for the membrane permeation component,(b) feed water quality, flows and biokinetics for the biological component.
Whilst it is possible to base the latter on biokinetics, the former cannot reasonablybe calculated from first principles. The calculation for an HF technology based on aflow of 5 MLD is detailed below. Equation (3.19) has been used to correlate aerationwith flux. Assumptions concerning the organic content of the feed (Table 3.25), val-ues for biokinetic constants (Table 3.26), biotreatment operation (Table 3.27) mem-brane operation (Table 3.28) and aeration operation (Table 3.29) lead to the systemdesign an operating parameters detailed in subsequent tables (Tables 3.30–3.36).Shaded cells refer to calculated values. Sludge disposal costs are excluded since costsassociated with this are process dependent post-treatment of the sludge, such as thick-ening, has a large impact on disposal costs. However, in large full-scale plants sludgetreatment and disposal can be assumed to be small compared with power costs.
The design of a pumped sidestream membrane bioreactor (sMBR) is, in principle,somewhat more straightforward than an iMBR since membrane permeation is car-ried out by crossflow filtration without air. In this case a correlation of permeabilityand flux with crossflow velocity can provide the information needed to calculateenergy demand for pumping, based on Equation (3.1) along with the classical bioki-netic expressions for oxygen demand by the biomass.
A much discussed issue in iMBR technology is the relative costs of processes basedon FS and HF module configurations. Considerable effort has been devoted to increasing
154 The MBR Book
Table 3.24 Biokinetic constants
Constant Range Unit Constant Range Unit
Ks 6–192 g/m3 Kn 0.01–0.1 g NH4-N/m3
ke 0.023–0.2 per day ke,n 0.025–0.15 per dayµm 3–13.2 per day �m,n 0.2–2.21 per dayY 0.28–0.67 kg VSS/kg COD Yn 0.1–0.15 kg VSS/kg NH4-N
1856174817_Ch03.qxd 6/6/06 2:29 PM Page 154
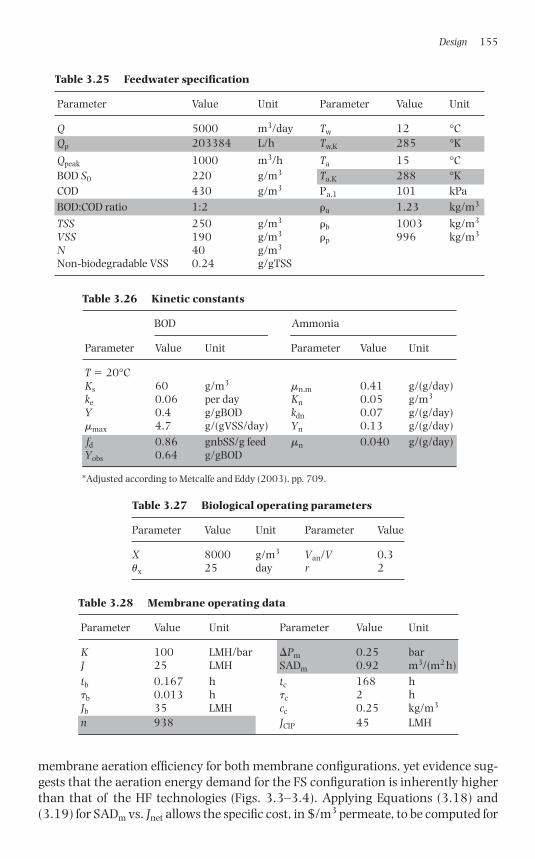
membrane aeration efficiency for both membrane configurations, yet evidence sug-gests that the aeration energy demand for the FS configuration is inherently higherthan that of the HF technologies (Figs. 3.3–3.4). Applying Equations (3.18) and(3.19) for SADm vs. Jnet allows the specific cost, in $/m3 permeate, to be computed for
Design 155
Table 3.26 Kinetic constants
BOD Ammonia
Parameter Value Unit Parameter Value Unit
T � 20°CKs 60 g/m3 �n,m 0.41 g/(g/day)ke 0.06 per day Kn 0.05 g/m3
Y 0.4 g/gBOD kdn 0.07 g/(g/day)�max 4.7 g/(gVSS/day) Yn 0.13 g/(g/day)fd 0.86 gnbSS/g feed �n 0.040 g/(g/day)Yobs 0.64 g/gBOD
*Adjusted according to Metcalfe and Eddy (2003), pp. 709.
Table 3.27 Biological operating parameters
Parameter Value Unit Parameter Value
X 8000 g/m3 Van/V 0.3�x 25 day r 2
Table 3.28 Membrane operating data
Parameter Value Unit Parameter Value Unit
K 100 LMH/bar �Pm 0.25 barJ 25 LMH SADm 0.92 m3/(m2 h)tb 0.167 h tc 168 h�b 0.013 h �c 2 hJb 35 LMH cc 0.25 kg/m3
n 938 JCIP 45 LMH
Table 3.25 Feedwater specification
Parameter Value Unit Parameter Value Unit
Q 5000 m3/day Tw 12 °CQp 203384 L/h Tw,K 285 °K
Qpeak 1000 m3/h Ta 15 °CBOD S0 220 g/m3 Ta,K 288 °KCOD 430 g/m3 Pa,1 101 kPaBOD:COD ratio 1:2 �a 1.23 kg/m3
TSS 250 g/m3 �b 1003 kg/m3
VSS 190 g/m3 �p 996 kg/m3
N 40 g/m3
Non-biodegradable VSS 0.24 g/gTSS
1856174817_Ch03.qxd 6/6/06 2:29 PM Page 155
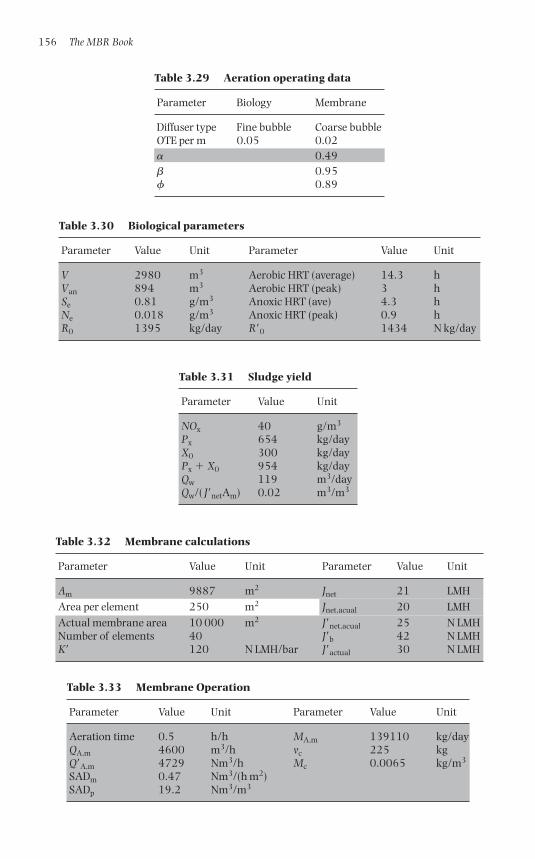
156 The MBR Book
Table 3.29 Aeration operating data
Parameter Biology Membrane
Diffuser type Fine bubble Coarse bubbleOTE per m 0.05 0.02� 0.49� 0.95 0.89
Table 3.30 Biological parameters
Parameter Value Unit Parameter Value Unit
V 2980 m3 Aerobic HRT (average) 14.3 hVan 894 m3 Aerobic HRT (peak) 3 hSe 0.81 g/m3 Anoxic HRT (ave) 4.3 hNe 0.018 g/m3 Anoxic HRT (peak) 0.9 hR0 1395 kg/day R�0 1434 N kg/day
Table 3.31 Sludge yield
Parameter Value Unit
NOx 40 g/m3
Px 654 kg/dayX0 300 kg/dayPx � X0 954 kg/dayQw 119 m3/dayQw/( J�netAm) 0.02 m3/m3
Table 3.32 Membrane calculations
Parameter Value Unit Parameter Value Unit
Am 9887 m2 Jnet 21 LMHArea per element 250 m2 Jnet,acual 20 LMHActual membrane area 10 000 m2 J�net,acual 25 N LMHNumber of elements 40 J�b 42 N LMHK� 120 N LMH/bar J�actual 30 N LMH
Table 3.33 Membrane Operation
Parameter Value Unit Parameter Value Unit
Aeration time 0.5 h/h MA,m 139110 kg/dayQA,m 4600 m3/h vc 225 kgQ�A,m 4729 Nm3/h Mc 0.0065 kg/m3
SADm 0.47 Nm3/(h m2)SADp 19.2 Nm3/m3
1856174817_Ch03.qxd 6/6/06 2:29 PM Page 156
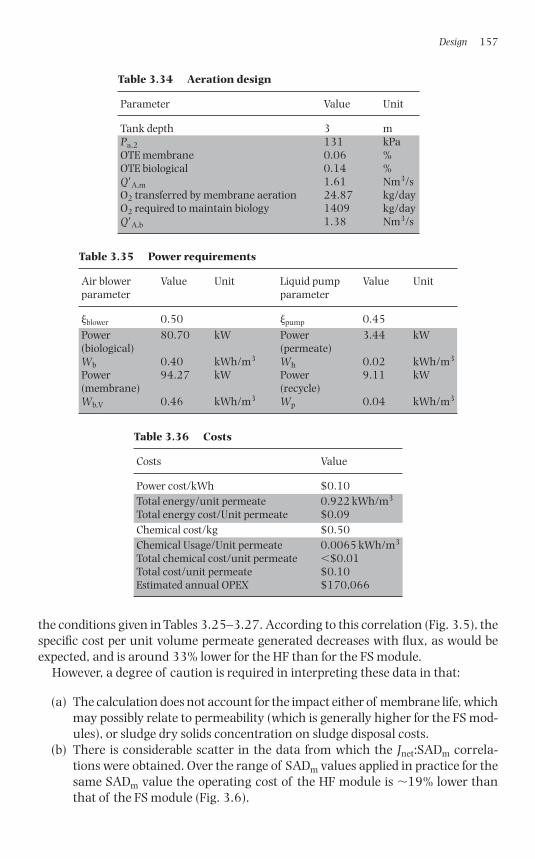
the conditions given in Tables 3.25–3.27. According to this correlation (Fig. 3.5), thespecific cost per unit volume permeate generated decreases with flux, as would beexpected, and is around 33% lower for the HF than for the FS module.
However, a degree of caution is required in interpreting these data in that:
(a) The calculation does not account for the impact either of membrane life, whichmay possibly relate to permeability (which is generally higher for the FS mod-ules), or sludge dry solids concentration on sludge disposal costs.
(b) There is considerable scatter in the data from which the Jnet:SADm correla-tions were obtained. Over the range of SADm values applied in practice for thesame SADm value the operating cost of the HF module is �19% lower thanthat of the FS module (Fig. 3.6).
Design 157
Table 3.34 Aeration design
Parameter Value Unit
Tank depth 3 mPa,2 131 kPaOTE membrane 0.06 %OTE biological 0.14 %Q�A,m 1.61 Nm3/sO2 transferred by membrane aeration 24.87 kg/dayO2 required to maintain biology 1409 kg/dayQ�A,b 1.38 Nm3/s
Table 3.35 Power requirements
Air blower Value Unit Liquid pump Value Unitparameter parameter
�blower 0.50 �pump 0.45Power 80.70 kW Power 3.44 kW(biological) (permeate)Wb 0.40 kWh/m3 Wh 0.02 kWh/m3
Power 94.27 kW Power 9.11 kW(membrane) (recycle)Wb,V 0.46 kWh/m3 Wp 0.04 kWh/m3
Table 3.36 Costs
Costs Value
Power cost/kWh $0.10Total energy/unit permeate 0.922 kWh/m3
Total energy cost/Unit permeate $0.09Chemical cost/kg $0.50Chemical Usage/Unit permeate 0.0065 kWh/m3
Total chemical cost/unit permeate �$0.01Total cost/unit permeate $0.10Estimated annual OPEX $170,066
1856174817_Ch03.qxd 6/6/06 2:29 PM Page 157
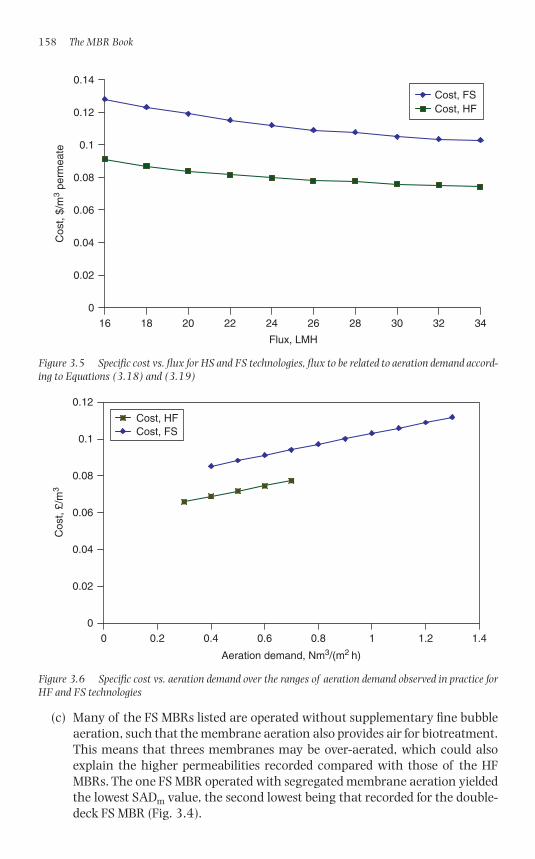
(c) Many of the FS MBRs listed are operated without supplementary fine bubbleaeration, such that the membrane aeration also provides air for biotreatment.This means that threes membranes may be over-aerated, which could alsoexplain the higher permeabilities recorded compared with those of the HFMBRs. The one FS MBR operated with segregated membrane aeration yieldedthe lowest SADm value, the second lowest being that recorded for the double-deck FS MBR (Fig. 3.4).
158 The MBR Book
0
0.02
0.04
0.06
0.08
0.1
0.12
0.14
16 18 20 22 24 26 28 30 32 34
Flux, LMH
Cos
t, $/
m3
perm
eate
Cost, FSCost, HF
Figure 3.5 Specific cost vs. flux for HS and FS technologies, flux to be related to aeration demand accord-ing to Equations (3.18) and (3.19)
0
0.02
0.04
0.06
0.08
0.1
0.12
0 0.2 0.4 0.6 0.8 1 1.2 1.4
Aeration demand, Nm3/(m2 h)
Cos
t, £/
m3
Cost, HFCost, FS
Figure 3.6 Specific cost vs. aeration demand over the ranges of aeration demand observed in practice forHF and FS technologies
1856174817_Ch03.qxd 6/6/06 2:29 PM Page 158
In short, the design calculation demonstrates the principle of MBR process designand can provide trends in operating costs without necessarily providing absolutelycorrect values.
3.3.4 Design and O&M facets
As well as those facets already discussed, a number of practical aspects of MBR plantdesign and operation impact upon performance. Some of these are listed below, andfurther details can be found in WEF (2006).
3.3.4.1 Process control and software● As with other process plant for water and wastewater treatment, feedback
control and alarm triggering relies on monitoring of key parameters such asTMP (for indicating membrane fouling condition and triggering a cleaningcycle), DO (for biological process control) and turbidity (for membraneintegrity).
● Unless they are specifically designed to be free from clogging, it is essential thatthe maintenance schedule includes cleaning of the aerators. This can beachieved by flushing with a dilute hypochlorite solution. For some technolo-gies the aerator flush is scheduled at the same time as the maintenance clean.
● The principle impact of added process complexity is on the software and pro-grammable logic controllers (PLCs), and on ancillary hardware such as pumps,valves and actuators. For example, intermittent aeration at 10 s means thateach valve is actuated pneumatically over 3 million times per year.
● Foaming control and abatement procedures are particularly important in anMBR since aeration is more intense than for an ASP. Designs should includesurface wasting or spraying.
● Sludge wasting for SRT control can be based on on-line MLSS measurement,although instruments have only recently developed for this.
3.3.4.2 Pre-treatment and residuals management● The basic process can be modified in the same way as a conventional ASP to
achieve denitrification, chemical phosphorous removal (CPR) and biologicalnutrient removal (BNR), as indicated in Section 2.2.6. Additional tanks (ortank volume) and sludge transfer pumps must then be sized accordingly,based on similar biokinetic principles as those used for the design for the coreaerobic process.
● Pre-clarification can be used to reduce aeration demand (for agitation of bio-mass) by reducing solids (“trash”) loading, but this significantly adds to footprint.
● Upgrading screens is essential, especially for HF iMBRs (Section 2.3.9.1). Gritremoval is desirable for smaller plants if no capacity is available to allow thegrit to settle out before the membrane tank.
● MBR sludge is generally less settleable than ASP sludge, with floc sizes gener-ally being smaller (Section 2.2.6) and sludge volume index (SVI) valueshigher. Conventional gravity thickening is therefore less effective for MBRsludges. Membrane thickening can and has been used for this duty, albeitoperating at necessarily low fluxes.
Design 159
1856174817_Ch03.qxd 6/6/06 2:29 PM Page 159
3.3.4.3 Tank sizing and redundancy● DO levels are �0.5 mg/L in the anoxic zone, typically 1.0–2.5 mg/L in the
aerobic zone and relatively high in the membrane region (2–6 mg/L) whereaeration is intensive. If recycling for denitrification takes place from the mem-brane aeration tank to the anoxic zone then the anoxic zone becomes slightlyaerobic at the sludge inlets, reducing denitrification efficiency. To compensatefor this the anoxic zone must be increased to extend the HRT in this region.Alternatively, sludge can be recycled from the aerobic tank.
● Retrofitting places additional constraints on design of iMBRs, since the tanksize determines the HRT and the shape and placement of immersed mem-brane modules. Retrofitting of sidestream modules, on the other hand, is notconstrained by the aeration tank dimensions.
● Spare capacity is required for membrane cleaning, which either involvesdraining of the tank and cleaning in air (Section 2.3.9.2) or CIP. In the formercase the biomass in the membrane train being cleaned has to be transferredeither to a holding tank or to adjacent membrane tanks. In either case suffi-cient installed capacity is needed to contend with the total volume enteringthe works while the membrane train is being cleaned. For large plants with alarge number of trains (membrane tanks) the cleaning can be sequenced toavoid large hydraulic shocks on the remaining in-service modules. For smallplants a buffer tank may be required.
3.4 Summary
The selection of appropriate design and operating parameter values for an iMBRcentres on:
1. choice of membrane module;2. choice of membrane aerator, if the membrane module is not provided with an
integral aerator;3. membrane aeration rate.
Many, if not all, of these facets are stipulated by the technology provider, and thechoice of technology itself (including that between iMBR and sMBR) will be stronglyinfluenced by the duty to which it is being put. However, broadly speaking the meanpermeability sustained in an iMBR is dependent on the aeration rate. Failure ofmembrane surface fouling, which can be irrecoverable, and clogging of the mem-brane channels. It is therefore essential that the maintenance schedule includescleaning of the aerators, normally achieved by flushing with a water or hypochloritesolution.
Design of iMBRs relies on accurate information regarding oxygen transfer to thebiomass and maintenance of permeability by membrane aeration. The design pro-ceeds via calculation of the oxygen demand of the biomass, which relates primarilyto the feedwater composition, the solids retention time and the oxygen transfer effi-ciency. This procedure applies to all biotreatment processes. However, for an MBR
160 The MBR Book
1856174817_Ch03.qxd 6/6/06 2:29 PM Page 160
complications arise when estimating the oxygen transfer and hydraulic performance(flux and permeability) provided by the membrane aeration. The correlation of mem-brane flux and permeability with membrane aeration rate and the applied cleaningprotocol relies entirely on heuristically-derived information. Continuing improve-ments in MBR process design mean that the boundary conditions for appropriateoperation of specific technologies are changing, with the process costs tending todecrease year on year as a result. It remains to be seen whether further incrementalimprovements can further significantly decrease operating costs in the future.
References
Adham, S., DeCarolis, J.F. and Pearce, W. (2004) Optimisation of various MBR sys-tems for water reclamation – phase III, Desalination and Water Purification Researchand Development Program Final Report, No. 103.
Babcock, R. (2005) www.wrrc.hawaii.edu/research/project_babcock/Babcock-membrane. htm (Accessed December 2005).
EPA (1989) EPA/ASCE Design manual on fine pore aeration. Cincinnati, Ohio.Göbel, A., Thomsen, A., McArdell, C.S., Joss, A. and Giger, W. (2005) Occurrence
and sorption behavior of sulfonamides, macrolides and trimethoprim in conven-tional activated sludge treatment including sorption to sewage sludge. Environ. Sci.Technol., 39, 3981–3989.
Huber, M.M., Goebel, A., Joss A., Hermann N., Kampmann M., Löffler D.,McArdell, C.S., Ried A., Ternes, T.A. and von Gunten, U. (2005) Oxidation of phar-maceuticals during ozonation of municipal wastewater effluents: a pilot study.Environ. Sci. Technol., 39, 4290–4299.
Joss, A., Andersen, H., Ternes, T., Richle, P.R. and Siegrist, H. (2004) Removal of estrogens in municipal wastewater treatment under aerobic and anaerobic conditions: consequences for plant optimisation. Environ. Sci. Technol., 38(11),3047–3055.
Joss, A., Keller, E., Alder, A., Göbel, A., McArdell, C.S., Ternes, T. and Siegrist, H.(2005) Removal of pharmaceuticals and fragrances in biological wastewater treat-ment. Water Res., 39(14), 3139–3152.
Joss, A., Zabczynski, S., Göbel, A., Hoffmann, B., Löffler, D., McArdell, C.S., Ternes, T.A., Thomsen, A. and Siegrist, H. (2006) Biological degradation of phar-maceuticals in municipal wastewater treatment: proposing a classification scheme.Water Res., 40(8), 1686–1696.
Lawrence, D., Ruiken, C., Piron, D., Kiestra, F. and Schemen, R. (2005) DutchMBR Development: Reminiscing the Past Five Years, H2O, 36–29.
Metcalf, Eddy. (2003) Wastewater Engineering – Treatment and Reuse (3rd edn).McGraw-Hill, New York.
Qin, J.-J., Kekre, K.A., Guihe, T., Ooa, M.-H., Wai, M.-N., Lee, T.C., Viswanath, B.and Seah, H. (2005) New option of MBR-RO process for production of NEWaterfrom domestic sewage. J. Membrane Sci.
Schyns, P., Petri, C., van Bentem, A. and Kox, L. (2003) MBR Varsseveld, a Demon-stration of Progression, H2O, 10–12.
Design 161
1856174817_Ch03.qxd 6/6/06 2:29 PM Page 161

Tao, G., Kekre, K., Wei, Z., Lee, T.C., Viswanath, B. and Seah, H. (2005) Membranebioreactors for water reclamation. Water Sci. Technol., 51(6–7), 431–440.
Ternes, T.A., Joss, A. and Siegrist, H. (2004) Scrutinizing pharmaceuticals andpersonal care products in wastewater treatment. Environ. Sci. Technol., 38(20),393A–399A.
van der Roest, H.F., Lawrence, D.P. and van Bentem, A.G.N. (2002) MembraneBioreactors for Municipal Wastewater Treatment. IWA Publishing.
WEF (1996) ??WEF (2006) Membrane systems for wastewater treatment. Water Environment
Foundation, WEFPress/McGraw-Hill, New York.
162 The MBR Book
1856174817_Ch03.qxd 6/6/06 2:29 PM Page 162
Chapter 4
Commercial Technologies
With acknowledgements to:
Section 4.2.1 Ryosuke (Djo) Kubota Membrane Europe Ltd, UKMaekawa
Section 4.2.2 Paul Zuber Brightwater Engineering, UK
Section 4.2.3 Paddy McGuinness Colloide Engineering Systems, Northern Ireland
Section 4.2.4 Torsten Hackner Hans Huber AG, GermanyJason Sims Huber Technology, UK
Section 4.2.5 Shanshan Chou Industrial Technology Research Institute, Taiwan
Wang-Kuan ChangChen-Hung Ni Green Environmental Technology
Co. Ltd, Taiwan
Section 4.2.6 Nobuyuki Matsuka Toray Industries Inc., Japan
Section 4.3.1 Enrico Vonghia Zenon Environmental Inc., CanadaJeff PetersLuca Belli Zenon Environmental Inc., ItalySandro Monti
Section 4.3.2 Noriaki Fukushima Mitsubishi Rayon Engineering Co. Ltd, Japan
Section 4.3.3 Ed Jordan Siemens Water Technologies – Memcor Products, USA
Nathan Haralson Scott PallwitzFufang Zha Siemens Water Technologies –
Memcor Products, Australia
Section 4.3.4 Klaus Vossenkaul Koch Membrane Systems GmbH, Germany
Section 4.3.5 Atsuo Kubota Microza Division, Asahi Kasei Chemicals Corporation, Japan
1856174817_Ch04.qxd 6/5/06 12:13 PM Page 163
Section 4.3.6 Michael Dimitriou ITT Advanced Water Treatment, USA
Section 4.4.1 Eric Wildeboer Berghof Membrane Technology, The Netherlands
Section 4.4.2 Ronald van’t Oever Norit X-Flow BV, The Netherlands
Section 4.4.3 Gunter Gehlert Wehrle Werk AG, Germany
Section 4.4.4 Steve Wilkes Millenniumpore, UK
Section 4.5.1 Marine Bence, Novasep Process, Orelis, FranceSylvie Fraval
Section 4.5.2 Olivier Lorain Polymem, France
Section 4.6 Stefan Krause, Microdyn-Nadir GmbH, GermanyMargot GoerzelPhoebe Lam Lam Environmental Services Ltd
and Motimo Membrane Technology Ltd, China
164 The MBR Book
1856174817_Ch04.qxd 6/5/06 12:13 PM Page 164
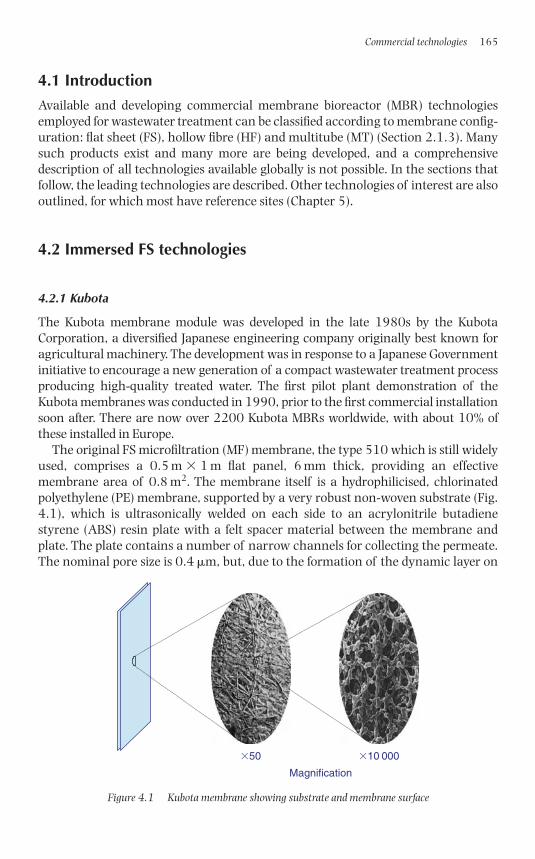
4.1 Introduction
Available and developing commercial membrane bioreactor (MBR) technologiesemployed for wastewater treatment can be classified according to membrane config-uration: flat sheet (FS), hollow fibre (HF) and multitube (MT) (Section 2.1.3). Manysuch products exist and many more are being developed, and a comprehensivedescription of all technologies available globally is not possible. In the sections thatfollow, the leading technologies are described. Other technologies of interest are alsooutlined, for which most have reference sites (Chapter 5).
4.2 Immersed FS technologies
4.2.1 Kubota
The Kubota membrane module was developed in the late 1980s by the KubotaCorporation, a diversified Japanese engineering company originally best known foragricultural machinery. The development was in response to a Japanese Governmentinitiative to encourage a new generation of a compact wastewater treatment processproducing high-quality treated water. The first pilot plant demonstration of theKubota membranes was conducted in 1990, prior to the first commercial installationsoon after. There are now over 2200 Kubota MBRs worldwide, with about 10% ofthese installed in Europe.
The original FS microfiltration (MF) membrane, the type 510 which is still widelyused, comprises a 0.5 m � 1 m flat panel, 6 mm thick, providing an effective membrane area of 0.8 m2. The membrane itself is a hydrophilicised, chlorinatedpolyethylene (PE) membrane, supported by a very robust non-woven substrate (Fig.4.1), which is ultrasonically welded on each side to an acrylonitrile butadienestyrene (ABS) resin plate with a felt spacer material between the membrane andplate. The plate contains a number of narrow channels for collecting the permeate.The nominal pore size is 0.4 �m, but, due to the formation of the dynamic layer on
Commercial technologies 165
�50 �10 000
Magnification
Figure 4.1 Kubota membrane showing substrate and membrane surface
1856174817_Ch04.qxd 6/5/06 12:13 PM Page 165
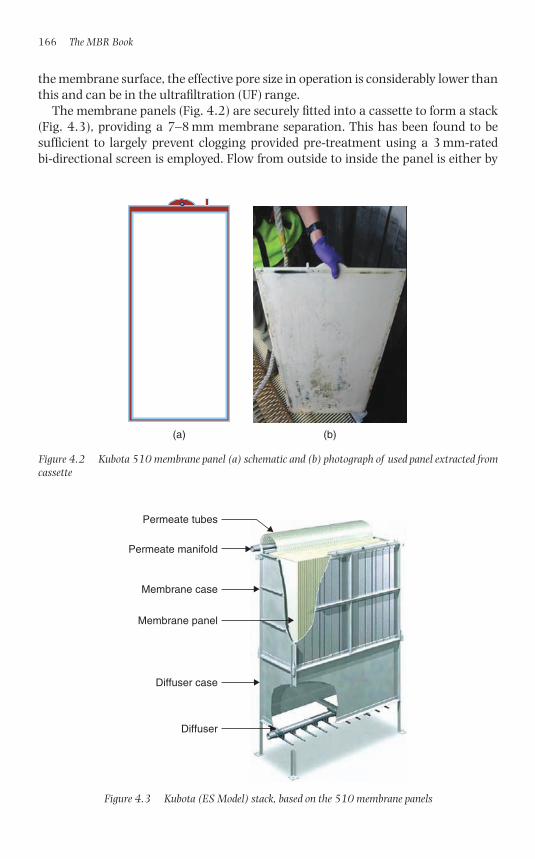
the membrane surface, the effective pore size in operation is considerably lower thanthis and can be in the ultrafiltration (UF) range.
The membrane panels (Fig. 4.2) are securely fitted into a cassette to form a stack(Fig. 4.3), providing a 7–8 mm membrane separation. This has been found to be sufficient to largely prevent clogging provided pre-treatment using a 3 mm-rated bi-directional screen is employed. Flow from outside to inside the panel is either by
166 The MBR Book
(a) (b)
Figure 4.2 Kubota 510 membrane panel (a) schematic and (b) photograph of used panel extracted fromcassette
Permeate tubes
Permeate manifold
Membrane case
Membrane panel
Diffuser case
Diffuser
Figure 4.3 Kubota (ES Model) stack, based on the 510 membrane panels
1856174817_Ch04.qxd 6/5/06 12:13 PM Page 166
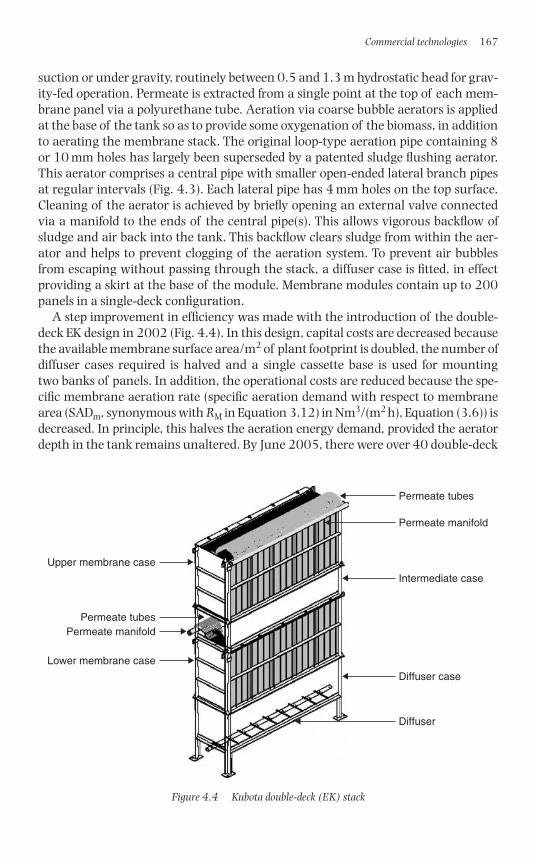
suction or under gravity, routinely between 0.5 and 1.3 m hydrostatic head for grav-ity-fed operation. Permeate is extracted from a single point at the top of each mem-brane panel via a polyurethane tube. Aeration via coarse bubble aerators is appliedat the base of the tank so as to provide some oxygenation of the biomass, in additionto aerating the membrane stack. The original loop-type aeration pipe containing 8or 10 mm holes has largely been superseded by a patented sludge flushing aerator.This aerator comprises a central pipe with smaller open-ended lateral branch pipesat regular intervals (Fig. 4.3). Each lateral pipe has 4 mm holes on the top surface.Cleaning of the aerator is achieved by briefly opening an external valve connectedvia a manifold to the ends of the central pipe(s). This allows vigorous backflow ofsludge and air back into the tank. This backflow clears sludge from within the aer-ator and helps to prevent clogging of the aeration system. To prevent air bubblesfrom escaping without passing through the stack, a diffuser case is fitted, in effectproviding a skirt at the base of the module. Membrane modules contain up to 200panels in a single-deck configuration.
A step improvement in efficiency was made with the introduction of the double-deck EK design in 2002 (Fig. 4.4). In this design, capital costs are decreased becausethe available membrane surface area/m2 of plant footprint is doubled, the number ofdiffuser cases required is halved and a single cassette base is used for mounting two banks of panels. In addition, the operational costs are reduced because the spe-cific membrane aeration rate (specific aeration demand with respect to membranearea (SADm, synonymous with RM in Equation 3.12) in Nm3/(m2 h), Equation (3.6)) isdecreased. In principle, this halves the aeration energy demand, provided the aeratordepth in the tank remains unaltered. By June 2005, there were over 40 double-deck
Commercial technologies 167
Permeate tubes
Permeate tubes
Permeate manifold
Permeate manifold
Intermediate case
Upper membrane case
Lower membrane case
Diffuser case
Diffuser
Figure 4.4 Kubota double-deck (EK) stack
1856174817_Ch04.qxd 6/5/06 12:13 PM Page 167
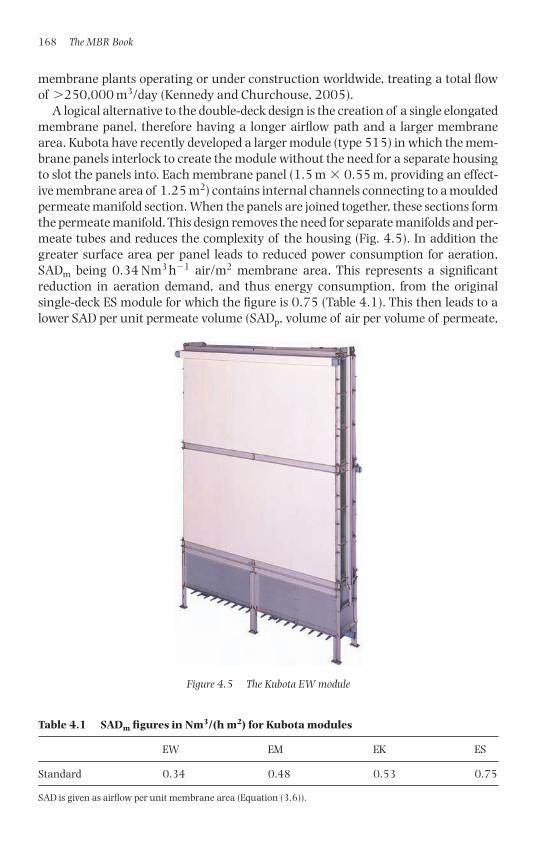
membrane plants operating or under construction worldwide, treating a total flowof �250,000 m3/day (Kennedy and Churchouse, 2005).
A logical alternative to the double-deck design is the creation of a single elongatedmembrane panel, therefore having a longer airflow path and a larger membranearea. Kubota have recently developed a larger module (type 515) in which the mem-brane panels interlock to create the module without the need for a separate housingto slot the panels into. Each membrane panel (1.5 m � 0.55 m, providing an effect-ive membrane area of 1.25 m2) contains internal channels connecting to a mouldedpermeate manifold section. When the panels are joined together, these sections formthe permeate manifold. This design removes the need for separate manifolds and per-meate tubes and reduces the complexity of the housing (Fig. 4.5). In addition thegreater surface area per panel leads to reduced power consumption for aeration,SADm being 0.34 Nm3 h�1 air/m2 membrane area. This represents a significantreduction in aeration demand, and thus energy consumption, from the original single-deck ES module for which the figure is 0.75 (Table 4.1). This then leads to alower SAD per unit permeate volume (SADp, volume of air per volume of permeate,
168 The MBR Book
Table 4.1 SADm figures in Nm3/(h m2) for Kubota modules
EW EM EK ES
Standard 0.34 0.48 0.53 0.75
SAD is given as airflow per unit membrane area (Equation (3.6)).
Figure 4.5 The Kubota EW module
1856174817_Ch04.qxd 6/5/06 12:13 PM Page 168
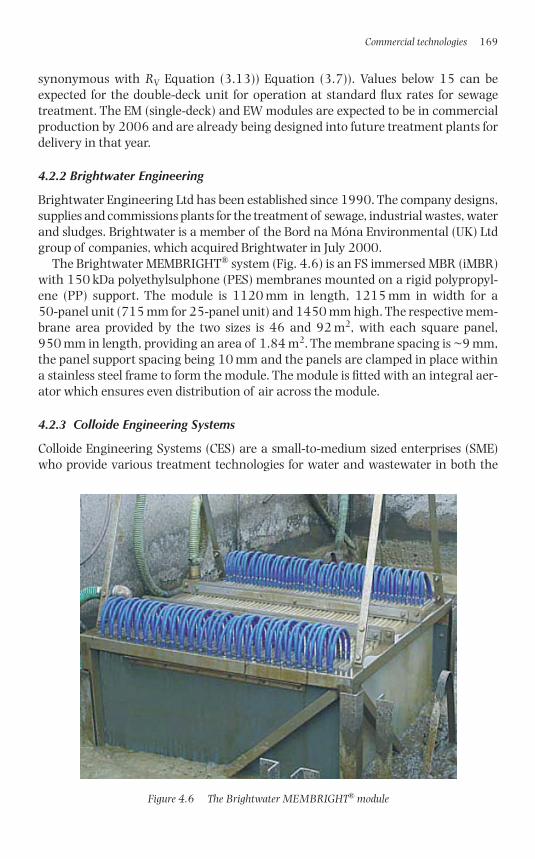
synonymous with RV Equation (3.13)) Equation (3.7)). Values below 15 can beexpected for the double-deck unit for operation at standard flux rates for sewagetreatment. The EM (single-deck) and EW modules are expected to be in commercialproduction by 2006 and are already being designed into future treatment plants fordelivery in that year.
4.2.2 Brightwater Engineering
Brightwater Engineering Ltd has been established since 1990. The company designs,supplies and commissions plants for the treatment of sewage, industrial wastes, waterand sludges. Brightwater is a member of the Bord na Móna Environmental (UK) Ltdgroup of companies, which acquired Brightwater in July 2000.
The Brightwater MEMBRIGHT® system (Fig. 4.6) is an FS immersed MBR (iMBR)with 150 kDa polyethylsulphone (PES) membranes mounted on a rigid polypropyl-ene (PP) support. The module is 1120 mm in length, 1215 mm in width for a 50-panel unit (715 mm for 25-panel unit) and 1450 mm high. The respective mem-brane area provided by the two sizes is 46 and 92 m2, with each square panel,950 mm in length, providing an area of 1.84 m2. The membrane spacing is ~9 mm,the panel support spacing being 10 mm and the panels are clamped in place withina stainless steel frame to form the module. The module is fitted with an integral aer-ator which ensures even distribution of air across the module.
4.2.3 Colloide Engineering Systems
Colloide Engineering Systems (CES) are a small-to-medium sized enterprises (SME)who provide various treatment technologies for water and wastewater in both the
Commercial technologies 169
Figure 4.6 The Brightwater MEMBRIGHT® module
1856174817_Ch04.qxd 6/5/06 12:13 PM Page 169
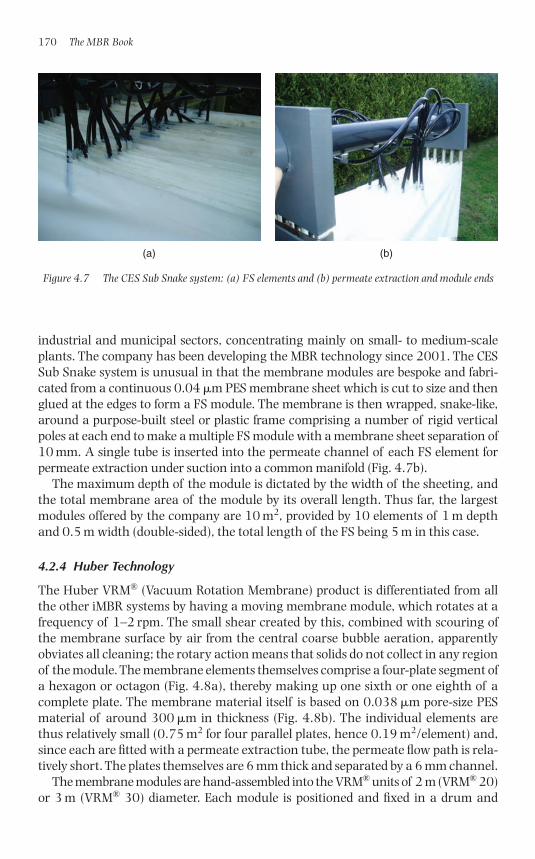
industrial and municipal sectors, concentrating mainly on small- to medium-scaleplants. The company has been developing the MBR technology since 2001. The CESSub Snake system is unusual in that the membrane modules are bespoke and fabri-cated from a continuous 0.04 �m PES membrane sheet which is cut to size and thenglued at the edges to form a FS module. The membrane is then wrapped, snake-like,around a purpose-built steel or plastic frame comprising a number of rigid verticalpoles at each end to make a multiple FS module with a membrane sheet separation of10 mm. A single tube is inserted into the permeate channel of each FS element forpermeate extraction under suction into a common manifold (Fig. 4.7b).
The maximum depth of the module is dictated by the width of the sheeting, andthe total membrane area of the module by its overall length. Thus far, the largestmodules offered by the company are 10 m2, provided by 10 elements of 1 m depthand 0.5 m width (double-sided), the total length of the FS being 5 m in this case.
4.2.4 Huber Technology
The Huber VRM® (Vacuum Rotation Membrane) product is differentiated from allthe other iMBR systems by having a moving membrane module, which rotates at afrequency of 1–2 rpm. The small shear created by this, combined with scouring ofthe membrane surface by air from the central coarse bubble aeration, apparentlyobviates all cleaning; the rotary action means that solids do not collect in any regionof the module. The membrane elements themselves comprise a four-plate segment ofa hexagon or octagon (Fig. 4.8a), thereby making up one sixth or one eighth of acomplete plate. The membrane material itself is based on 0.038 �m pore-size PESmaterial of around 300 �m in thickness (Fig. 4.8b). The individual elements arethus relatively small (0.75 m2 for four parallel plates, hence 0.19 m2/element) and,since each are fitted with a permeate extraction tube, the permeate flow path is rela-tively short. The plates themselves are 6 mm thick and separated by a 6 mm channel.
The membrane modules are hand-assembled into the VRM® units of 2 m (VRM® 20)or 3 m (VRM® 30) diameter. Each module is positioned and fixed in a drum and
170 The MBR Book
(a) (b)
Figure 4.7 The CES Sub Snake system: (a) FS elements and (b) permeate extraction and module ends
1856174817_Ch04.qxd 6/5/06 12:14 PM Page 170
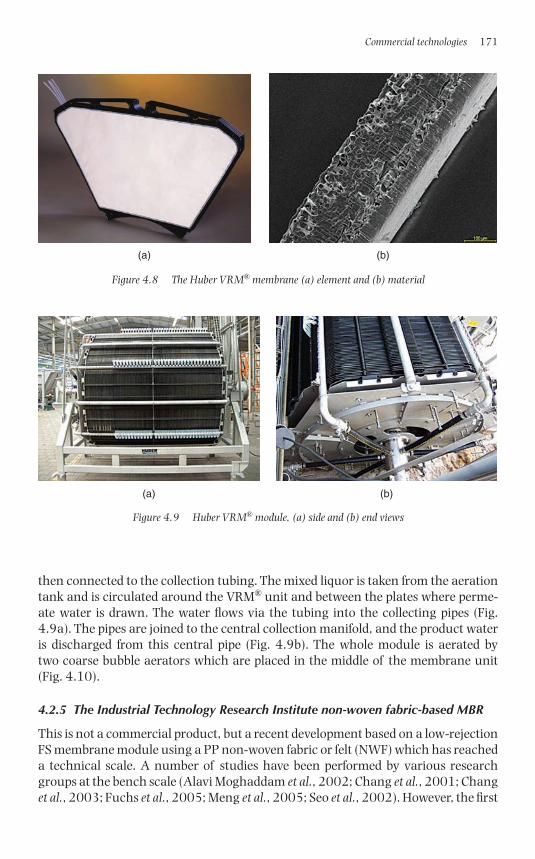
then connected to the collection tubing. The mixed liquor is taken from the aerationtank and is circulated around the VRM® unit and between the plates where perme-ate water is drawn. The water flows via the tubing into the collecting pipes (Fig.4.9a). The pipes are joined to the central collection manifold, and the product wateris discharged from this central pipe (Fig. 4.9b). The whole module is aerated by two coarse bubble aerators which are placed in the middle of the membrane unit(Fig. 4.10).
4.2.5 The Industrial Technology Research Institute non-woven fabric-based MBR
This is not a commercial product, but a recent development based on a low-rejectionFS membrane module using a PP non-woven fabric or felt (NWF) which has reacheda technical scale. A number of studies have been performed by various researchgroups at the bench scale (Alavi Moghaddam et al., 2002; Chang et al., 2001; Changet al., 2003; Fuchs et al., 2005; Meng et al., 2005; Seo et al., 2002). However, the first
Commercial technologies 171
(a) (b)
Figure 4.8 The Huber VRM® membrane (a) element and (b) material
(a) (b)
Figure 4.9 Huber VRM® module, (a) side and (b) end views
1856174817_Ch04.qxd 6/5/06 12:14 PM Page 171
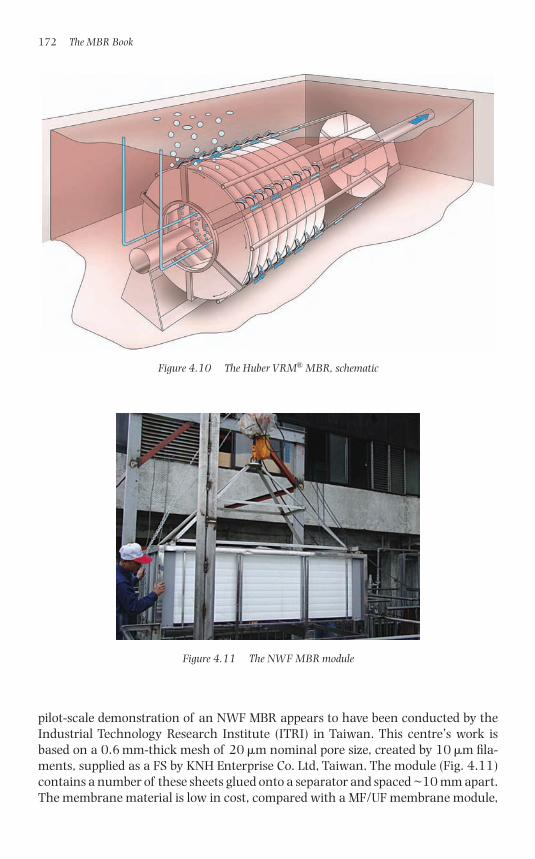
pilot-scale demonstration of an NWF MBR appears to have been conducted by theIndustrial Technology Research Institute (ITRI) in Taiwan. This centre’s work isbased on a 0.6 mm-thick mesh of 20 �m nominal pore size, created by 10 �m fila-ments, supplied as a FS by KNH Enterprise Co. Ltd, Taiwan. The module (Fig. 4.11)contains a number of these sheets glued onto a separator and spaced ~10 mm apart.The membrane material is low in cost, compared with a MF/UF membrane module,
172 The MBR Book
Figure 4.11 The NWF MBR module
Figure 4.10 The Huber VRM® MBR, schematic
1856174817_Ch04.qxd 6/5/06 12:14 PM Page 172
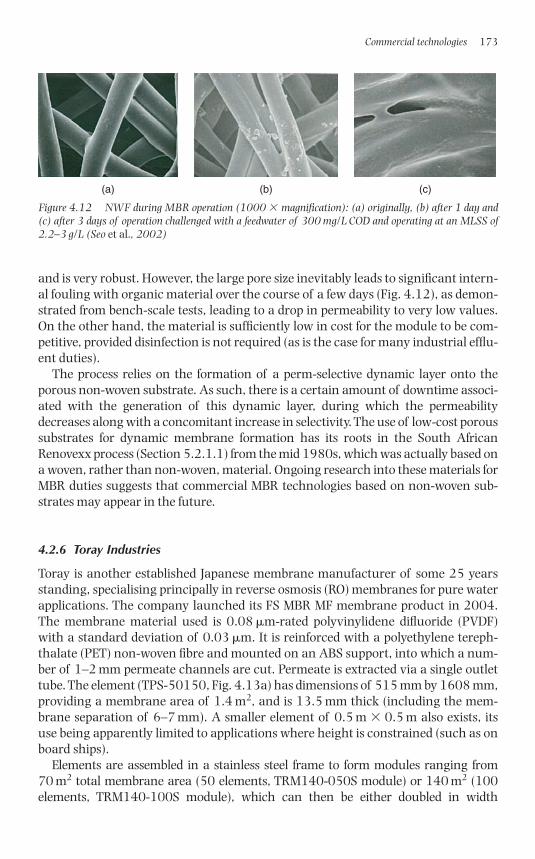
and is very robust. However, the large pore size inevitably leads to significant intern-al fouling with organic material over the course of a few days (Fig. 4.12), as demon-strated from bench-scale tests, leading to a drop in permeability to very low values.On the other hand, the material is sufficiently low in cost for the module to be com-petitive, provided disinfection is not required (as is the case for many industrial efflu-ent duties).
The process relies on the formation of a perm-selective dynamic layer onto theporous non-woven substrate. As such, there is a certain amount of downtime associ-ated with the generation of this dynamic layer, during which the permeabilitydecreases along with a concomitant increase in selectivity. The use of low-cost poroussubstrates for dynamic membrane formation has its roots in the South AfricanRenovexx process (Section 5.2.1.1) from the mid 1980s, which was actually based ona woven, rather than non-woven, material. Ongoing research into these materials forMBR duties suggests that commercial MBR technologies based on non-woven sub-strates may appear in the future.
4.2.6 Toray Industries
Toray is another established Japanese membrane manufacturer of some 25 yearsstanding, specialising principally in reverse osmosis (RO) membranes for pure waterapplications. The company launched its FS MBR MF membrane product in 2004.The membrane material used is 0.08 �m-rated polyvinylidene difluoride (PVDF)with a standard deviation of 0.03 �m. It is reinforced with a polyethylene tereph-thalate (PET) non-woven fibre and mounted on an ABS support, into which a num-ber of 1–2 mm permeate channels are cut. Permeate is extracted via a single outlettube. The element (TPS-50150, Fig. 4.13a) has dimensions of 515 mm by 1608 mm,providing a membrane area of 1.4 m2, and is 13.5 mm thick (including the mem-brane separation of 6–7 mm). A smaller element of 0.5 m � 0.5 m also exists, itsuse being apparently limited to applications where height is constrained (such as onboard ships).
Elements are assembled in a stainless steel frame to form modules ranging from70 m2 total membrane area (50 elements, TRM140-050S module) or 140 m2 (100elements, TRM140-100S module), which can then be either doubled in width
Commercial technologies 173
(a) (b) (c)
Figure 4.12 NWF during MBR operation (1000 � magnification): (a) originally, (b) after 1 day and(c) after 3 days of operation challenged with a feedwater of 300 mg/L COD and operating at an MLSS of2.2–3 g/L (Seo et al., 2002)
1856174817_Ch04.qxd 6/5/06 12:14 PM Page 173
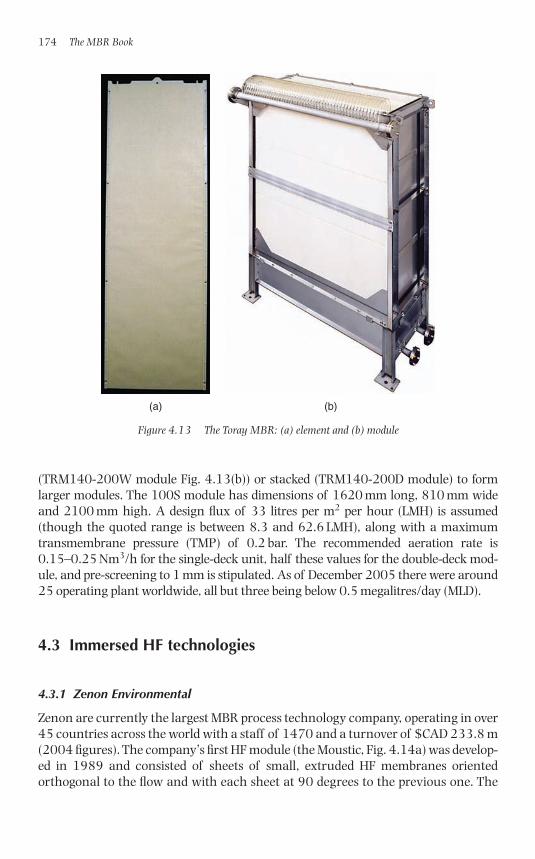
(TRM140-200W module Fig. 4.13(b)) or stacked (TRM140-200D module) to formlarger modules. The 100S module has dimensions of 1620 mm long, 810 mm wideand 2100 mm high. A design flux of 33 litres per m2 per hour (LMH) is assumed(though the quoted range is between 8.3 and 62.6 LMH), along with a maximumtransmembrane pressure (TMP) of 0.2 bar. The recommended aeration rate is0.15–0.25 Nm3/h for the single-deck unit, half these values for the double-deck mod-ule, and pre-screening to 1 mm is stipulated. As of December 2005 there were around25 operating plant worldwide, all but three being below 0.5 megalitres/day (MLD).
4.3 Immersed HF technologies
4.3.1 Zenon Environmental
Zenon are currently the largest MBR process technology company, operating in over45 countries across the world with a staff of 1470 and a turnover of $CAD 233.8 m(2004 figures). The company’s first HF module (the Moustic, Fig. 4.14a) was develop-ed in 1989 and consisted of sheets of small, extruded HF membranes orientedorthogonal to the flow and with each sheet at 90 degrees to the previous one. The
174 The MBR Book
(a) (b)
Figure 4.13 The Toray MBR: (a) element and (b) module
1856174817_Ch04.qxd 6/5/06 12:14 PM Page 174
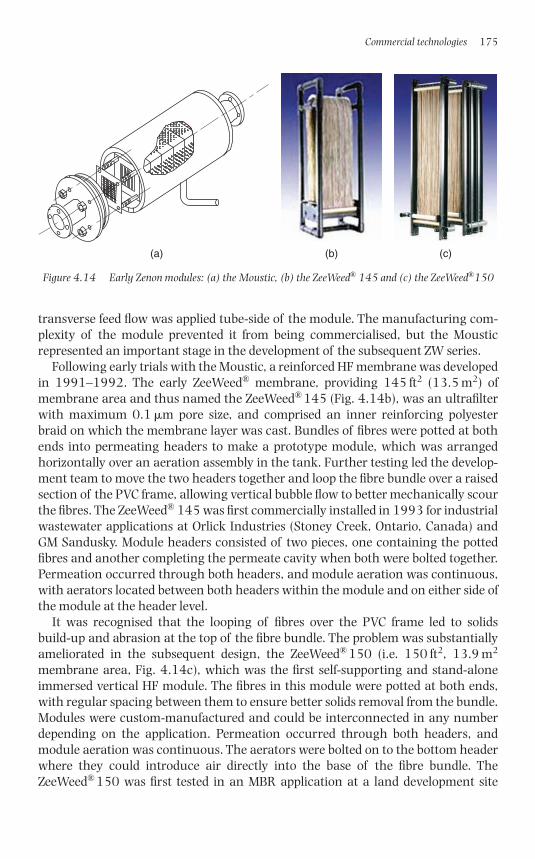
transverse feed flow was applied tube-side of the module. The manufacturing com-plexity of the module prevented it from being commercialised, but the Moustic represented an important stage in the development of the subsequent ZW series.
Following early trials with the Moustic, a reinforced HF membrane was developedin 1991–1992. The early ZeeWeed® membrane, providing 145 ft2 (13.5 m2) ofmembrane area and thus named the ZeeWeed® 145 (Fig. 4.14b), was an ultrafilterwith maximum 0.1 �m pore size, and comprised an inner reinforcing polyesterbraid on which the membrane layer was cast. Bundles of fibres were potted at bothends into permeating headers to make a prototype module, which was arrangedhorizontally over an aeration assembly in the tank. Further testing led the develop-ment team to move the two headers together and loop the fibre bundle over a raisedsection of the PVC frame, allowing vertical bubble flow to better mechanically scourthe fibres. The ZeeWeed® 145 was first commercially installed in 1993 for industrialwastewater applications at Orlick Industries (Stoney Creek, Ontario, Canada) andGM Sandusky. Module headers consisted of two pieces, one containing the pottedfibres and another completing the permeate cavity when both were bolted together.Permeation occurred through both headers, and module aeration was continuous,with aerators located between both headers within the module and on either side ofthe module at the header level.
It was recognised that the looping of fibres over the PVC frame led to solids build-up and abrasion at the top of the fibre bundle. The problem was substantiallyameliorated in the subsequent design, the ZeeWeed® 150 (i.e. 150 ft2, 13.9 m2
membrane area, Fig. 4.14c), which was the first self-supporting and stand-aloneimmersed vertical HF module. The fibres in this module were potted at both ends,with regular spacing between them to ensure better solids removal from the bundle.Modules were custom-manufactured and could be interconnected in any numberdepending on the application. Permeation occurred through both headers, andmodule aeration was continuous. The aerators were bolted on to the bottom headerwhere they could introduce air directly into the base of the fibre bundle. TheZeeWeed® 150 was first tested in an MBR application at a land development site
Commercial technologies 175
(a) (b) (c)
Figure 4.14 Early Zenon modules: (a) the Moustic, (b) the ZeeWeed® 145 and (c) the ZeeWeed®150
1856174817_Ch04.qxd 6/5/06 12:14 PM Page 175
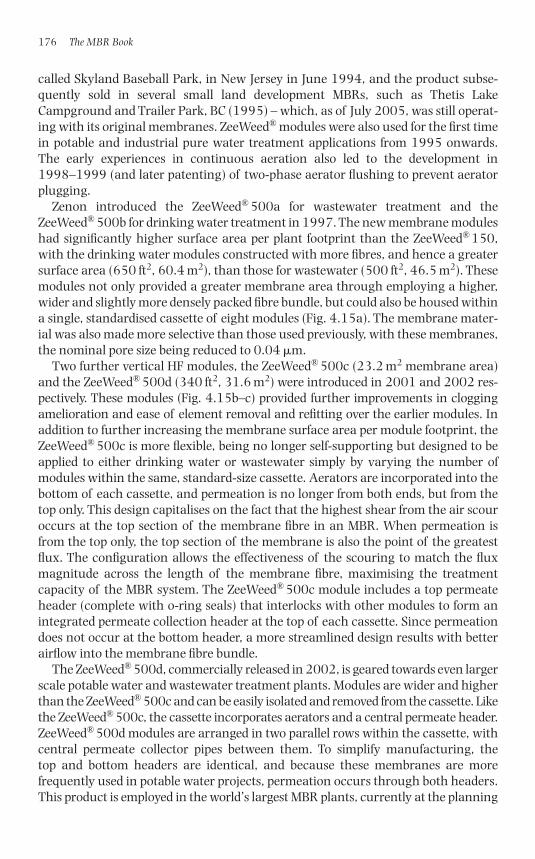
176 The MBR Book
called Skyland Baseball Park, in New Jersey in June 1994, and the product subse-quently sold in several small land development MBRs, such as Thetis LakeCampground and Trailer Park, BC (1995) – which, as of July 2005, was still operat-ing with its original membranes. ZeeWeed® modules were also used for the first timein potable and industrial pure water treatment applications from 1995 onwards.The early experiences in continuous aeration also led to the development in1998–1999 (and later patenting) of two-phase aerator flushing to prevent aeratorplugging.
Zenon introduced the ZeeWeed® 500a for wastewater treatment and theZeeWeed® 500b for drinking water treatment in 1997. The new membrane moduleshad significantly higher surface area per plant footprint than the ZeeWeed® 150,with the drinking water modules constructed with more fibres, and hence a greatersurface area (650 ft2, 60.4 m2), than those for wastewater (500 ft2, 46.5 m2). Thesemodules not only provided a greater membrane area through employing a higher,wider and slightly more densely packed fibre bundle, but could also be housed withina single, standardised cassette of eight modules (Fig. 4.15a). The membrane mater-ial was also made more selective than those used previously, with these membranes,the nominal pore size being reduced to 0.04 �m.
Two further vertical HF modules, the ZeeWeed® 500c (23.2 m2 membrane area)and the ZeeWeed® 500d (340 ft2, 31.6 m2) were introduced in 2001 and 2002 res-pectively. These modules (Fig. 4.15b–c) provided further improvements in cloggingamelioration and ease of element removal and refitting over the earlier modules. Inaddition to further increasing the membrane surface area per module footprint, theZeeWeed® 500c is more flexible, being no longer self-supporting but designed to beapplied to either drinking water or wastewater simply by varying the number ofmodules within the same, standard-size cassette. Aerators are incorporated into thebottom of each cassette, and permeation is no longer from both ends, but from thetop only. This design capitalises on the fact that the highest shear from the air scouroccurs at the top section of the membrane fibre in an MBR. When permeation isfrom the top only, the top section of the membrane is also the point of the greatestflux. The configuration allows the effectiveness of the scouring to match the fluxmagnitude across the length of the membrane fibre, maximising the treatmentcapacity of the MBR system. The ZeeWeed® 500c module includes a top permeateheader (complete with o-ring seals) that interlocks with other modules to form anintegrated permeate collection header at the top of each cassette. Since permeationdoes not occur at the bottom header, a more streamlined design results with betterairflow into the membrane fibre bundle.
The ZeeWeed® 500d, commercially released in 2002, is geared towards even largerscale potable water and wastewater treatment plants. Modules are wider and higherthan the ZeeWeed® 500c and can be easily isolated and removed from the cassette. Likethe ZeeWeed® 500c, the cassette incorporates aerators and a central permeate header.ZeeWeed® 500d modules are arranged in two parallel rows within the cassette, withcentral permeate collector pipes between them. To simplify manufacturing, the top and bottom headers are identical, and because these membranes are more frequently used in potable water projects, permeation occurs through both headers.This product is employed in the world’s largest MBR plants, currently at the planning
1856174817_Ch04.qxd 6/5/06 12:14 PM Page 176
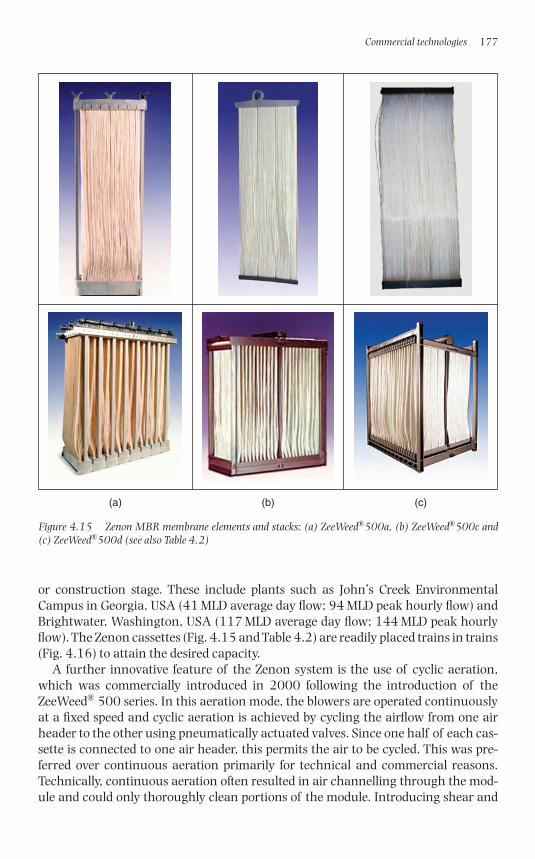
or construction stage. These include plants such as John’s Creek EnvironmentalCampus in Georgia, USA (41 MLD average day flow; 94 MLD peak hourly flow) andBrightwater, Washington, USA (117 MLD average day flow; 144 MLD peak hourlyflow). The Zenon cassettes (Fig. 4.15 and Table 4.2) are readily placed trains in trains(Fig. 4.16) to attain the desired capacity.
A further innovative feature of the Zenon system is the use of cyclic aeration,which was commercially introduced in 2000 following the introduction of theZeeWeed® 500 series. In this aeration mode, the blowers are operated continuouslyat a fixed speed and cyclic aeration is achieved by cycling the airflow from one airheader to the other using pneumatically actuated valves. Since one half of each cas-sette is connected to one air header, this permits the air to be cycled. This was pre-ferred over continuous aeration primarily for technical and commercial reasons.Technically, continuous aeration often resulted in air channelling through the mod-ule and could only thoroughly clean portions of the module. Introducing shear and
Commercial technologies 177
(a) (b) (c)
Figure 4.15 Zenon MBR membrane elements and stacks: (a) ZeeWeed®500a, (b) ZeeWeed®500c and(c) ZeeWeed®500d (see also Table 4.2)
1856174817_Ch04.qxd 6/5/06 12:14 PM Page 177
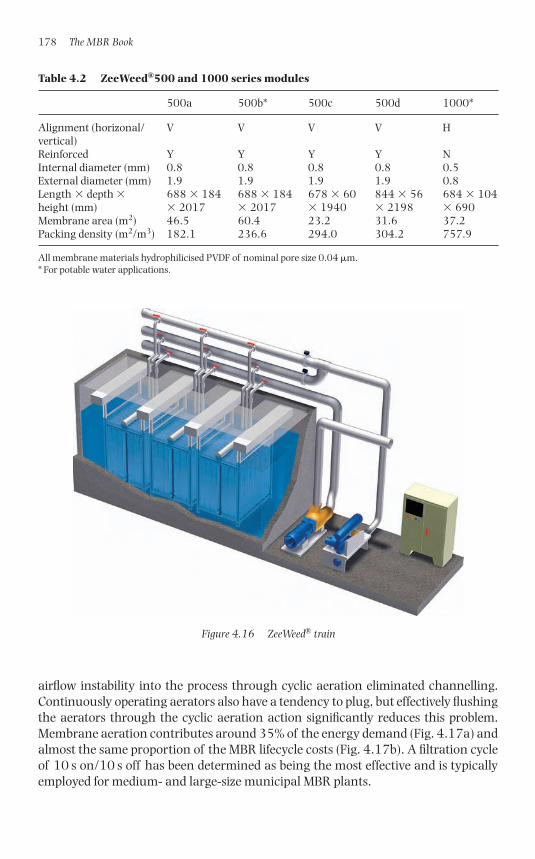
airflow instability into the process through cyclic aeration eliminated channelling.Continuously operating aerators also have a tendency to plug, but effectively flushingthe aerators through the cyclic aeration action significantly reduces this problem.Membrane aeration contributes around 35% of the energy demand (Fig. 4.17a) andalmost the same proportion of the MBR lifecycle costs (Fig. 4.17b). A filtration cycleof 10 s on/10 s off has been determined as being the most effective and is typicallyemployed for medium- and large-size municipal MBR plants.
178 The MBR Book
Figure 4.16 ZeeWeed® train
Table 4.2 ZeeWeed®500 and 1000 series modules
500a 500b* 500c 500d 1000*
Alignment (horizonal/ V V V V Hvertical)Reinforced Y Y Y Y NInternal diameter (mm) 0.8 0.8 0.8 0.8 0.5External diameter (mm) 1.9 1.9 1.9 1.9 0.8Length � depth � 688 � 184 688 � 184 678 � 60 844 � 56 684 � 104 height (mm) � 2017 � 2017 � 1940 � 2198 � 690Membrane area (m2) 46.5 60.4 23.2 31.6 37.2Packing density (m2/m3) 182.1 236.6 294.0 304.2 757.9
All membrane materials hydrophilicised PVDF of nominal pore size 0.04 �m.* For potable water applications.
1856174817_Ch04.qxd 6/5/06 12:14 PM Page 178
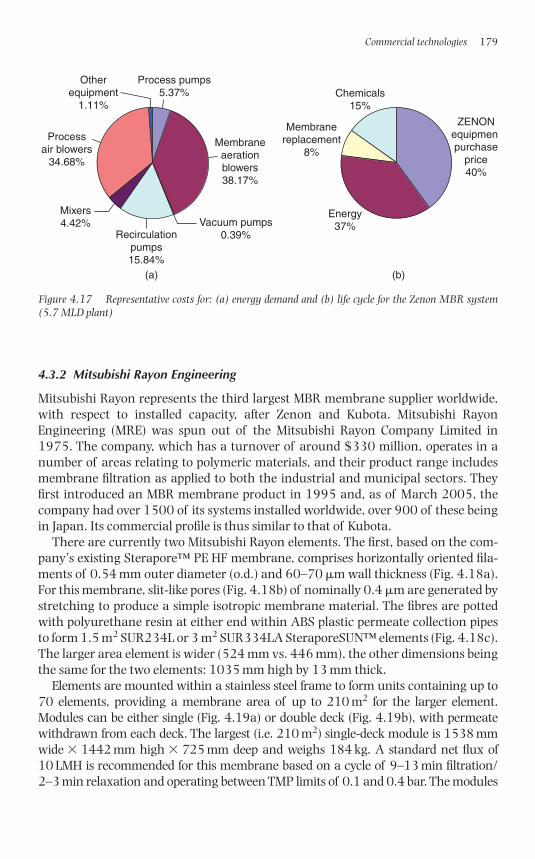
4.3.2 Mitsubishi Rayon Engineering
Mitsubishi Rayon represents the third largest MBR membrane supplier worldwide,with respect to installed capacity, after Zenon and Kubota. Mitsubishi RayonEngineering (MRE) was spun out of the Mitsubishi Rayon Company Limited in1975. The company, which has a turnover of around $330 million, operates in anumber of areas relating to polymeric materials, and their product range includesmembrane filtration as applied to both the industrial and municipal sectors. Theyfirst introduced an MBR membrane product in 1995 and, as of March 2005, thecompany had over 1500 of its systems installed worldwide, over 900 of these beingin Japan. Its commercial profile is thus similar to that of Kubota.
There are currently two Mitsubishi Rayon elements. The first, based on the com-pany’s existing Sterapore™ PE HF membrane, comprises horizontally oriented fila-ments of 0.54 mm outer diameter (o.d.) and 60–70 �m wall thickness (Fig. 4.18a).For this membrane, slit-like pores (Fig. 4.18b) of nominally 0.4 �m are generated bystretching to produce a simple isotropic membrane material. The fibres are pottedwith polyurethane resin at either end within ABS plastic permeate collection pipesto form 1.5 m2 SUR234L or 3 m2 SUR334LA SteraporeSUN™ elements (Fig. 4.18c).The larger area element is wider (524 mm vs. 446 mm), the other dimensions beingthe same for the two elements: 1035 mm high by 13 mm thick.
Elements are mounted within a stainless steel frame to form units containing up to70 elements, providing a membrane area of up to 210 m2 for the larger element.Modules can be either single (Fig. 4.19a) or double deck (Fig. 4.19b), with permeatewithdrawn from each deck. The largest (i.e. 210 m2) single-deck module is 1538 mmwide � 1442 mm high � 725 mm deep and weighs 184 kg. A standard net flux of10 LMH is recommended for this membrane based on a cycle of 9–13 min filtration/2–3 min relaxation and operating between TMP limits of 0.1 and 0.4 bar. The modules
Commercial technologies 179
Vacuum pumps0.39%
Membraneaerationblowers38.17%
Process pumps5.37%
Otherequipment
1.11%
Processair blowers
34.68%
Mixers4.42%
Recirculationpumps15.84%
Chemicals15%
ZENONequipmenpurchase
price40%
Energy37%
Membranereplacement
8%
(a) (b)
Figure 4.17 Representative costs for: (a) energy demand and (b) life cycle for the Zenon MBR system(5.7 MLD plant)
1856174817_Ch04.qxd 6/5/06 12:14 PM Page 179
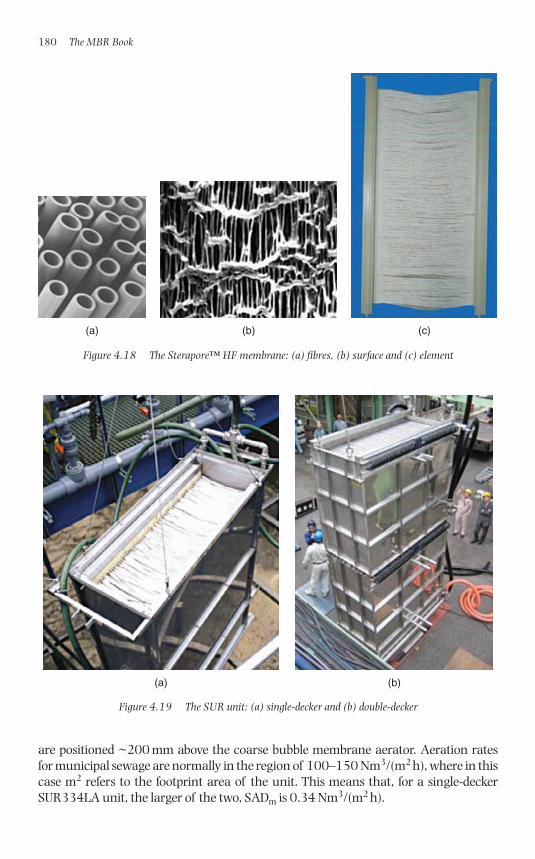
are positioned ~200 mm above the coarse bubble membrane aerator. Aeration rates for municipal sewage are normally in the region of 100–150 Nm3/(m2 h), where in thiscase m2 refers to the footprint area of the unit. This means that, for a single-deckerSUR334LA unit, the larger of the two, SADm is 0.34 Nm3/(m2 h).
180 The MBR Book
(a) (b)
Figure 4.19 The SUR unit: (a) single-decker and (b) double-decker
(a) (b) (c)
Figure 4.18 The Sterapore™ HF membrane: (a) fibres, (b) surface and (c) element
1856174817_Ch04.qxd 6/5/06 12:14 PM Page 180
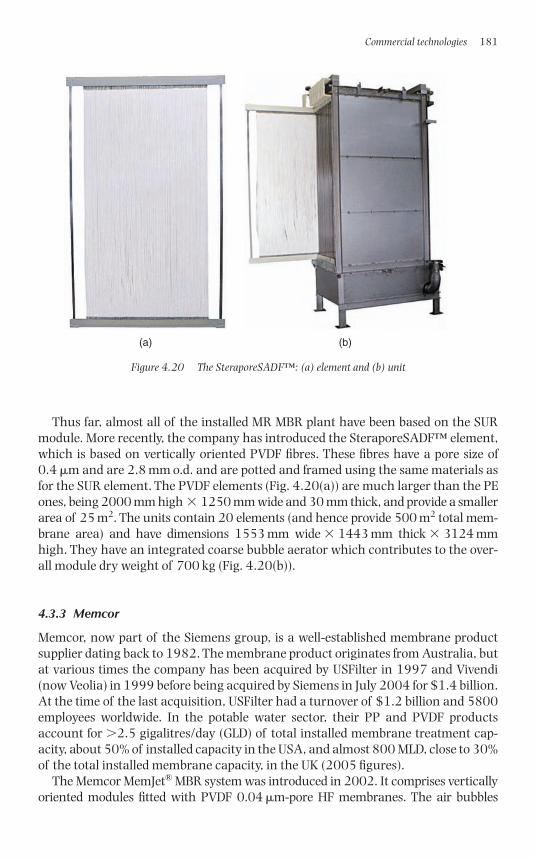
Thus far, almost all of the installed MR MBR plant have been based on the SURmodule. More recently, the company has introduced the SteraporeSADF™ element,which is based on vertically oriented PVDF fibres. These fibres have a pore size of0.4 �m and are 2.8 mm o.d. and are potted and framed using the same materials asfor the SUR element. The PVDF elements (Fig. 4.20(a)) are much larger than the PEones, being 2000 mm high � 1250 mm wide and 30 mm thick, and provide a smallerarea of 25 m2. The units contain 20 elements (and hence provide 500 m2 total mem-brane area) and have dimensions 1553 mm wide � 1443 mm thick � 3124 mmhigh. They have an integrated coarse bubble aerator which contributes to the over-all module dry weight of 700 kg (Fig. 4.20(b)).
4.3.3 Memcor
Memcor, now part of the Siemens group, is a well-established membrane productsupplier dating back to 1982. The membrane product originates from Australia, butat various times the company has been acquired by USFilter in 1997 and Vivendi(now Veolia) in 1999 before being acquired by Siemens in July 2004 for $1.4 billion.At the time of the last acquisition, USFilter had a turnover of $1.2 billion and 5800employees worldwide. In the potable water sector, their PP and PVDF productsaccount for �2.5 gigalitres/day (GLD) of total installed membrane treatment cap-acity, about 50% of installed capacity in the USA, and almost 800 MLD, close to 30%of the total installed membrane capacity, in the UK (2005 figures).
The Memcor MemJet® MBR system was introduced in 2002. It comprises verticallyoriented modules fitted with PVDF 0.04 �m-pore HF membranes. The air bubbles
Commercial technologies 181
(a) (b)
Figure 4.20 The SteraporeSADF™: (a) element and (b) unit
1856174817_Ch04.qxd 6/5/06 12:14 PM Page 181
entrained in mixed liquor are introduced into the module using a patented two-phase mixing system (Fig. 4.21). This creates high-shear conditions, thereby mini-mizing solids concentration polarisation at the membrane surface near the jet. Highermembrane packing densities are permitted as a result, along with SADm values below0.3 Nm3/h m2 membrane. Mean fluxes between 20 and 50 LMH are claimed, imply-ing specific aeration demand values below 15 m3air/m3 permeate on average. Thepredicted TMP range is 0.05–0.5 bar, though the membranes can apparently toler-ate pressures of up to 3 bar.
Modules are provided in two sizes: 10 m2 (the B10R) and 38 m2 (the B30R). Arack of modules (Fig. 4.22) may contain up to 40 B10R or 16 B30R modules, whichcan then be arranged in rows within a cell. This modularisation follows the sameformat as that used in potable water Memcor systems. The recommended mixedliquor suspended solids (MLSS) concentration range for the bioreactor is 5–15 g/L atan associated solids retention time (SRT) of 5–50 days and loading rates of0.3–1.5 kg biochemical oxygen demand (BOD)/(m3 day), generating sludge at ratesof 0.1–0.7 kg SS/kg BOD removed. The expected cleaning in place (CIP) intervalunder the operating conditions stipulated is �3 months. The typical operation proto-col recommended by Memcor is 12 min filtration followed by 1 min relaxation.
Memcor also produce a package plant for flows up to 0.5 MLD. As with the largerscale systems, the MemJet® Xpress (Fig. 4.23) has separate biotreatment and membrane tanks to assist operation and maintenance of the membrane and, in particular, membrane CIP.
182 The MBR Book
Permeate
Air
Mixed liquor
Two-phase mix
Figure 4.21 The MemJet® module with integral jet aerator
1856174817_Ch04.qxd 6/5/06 12:14 PM Page 182
4.3.4 Koch Membrane Systems – PURON®
PURON was formed in late 2001 as a spin out company from the University ofAachen, and was subsequently acquired by Koch Membrane Systems in 2004. Themembrane element is the submerged HF-type based on 2.6 mm o.d. and 1.2 mminternal diameter (i.d.) filaments. Unlike most other submerged HF MBR modules, themembrane material is PES. A unique feature of the PURON® system is the securing
Commercial technologies 183
Figure 4.23 MemJet® Xpress MBR package plant
Figure 4.22 A rack of Memcor B10R modules
1856174817_Ch04.qxd 6/5/06 12:14 PM Page 183
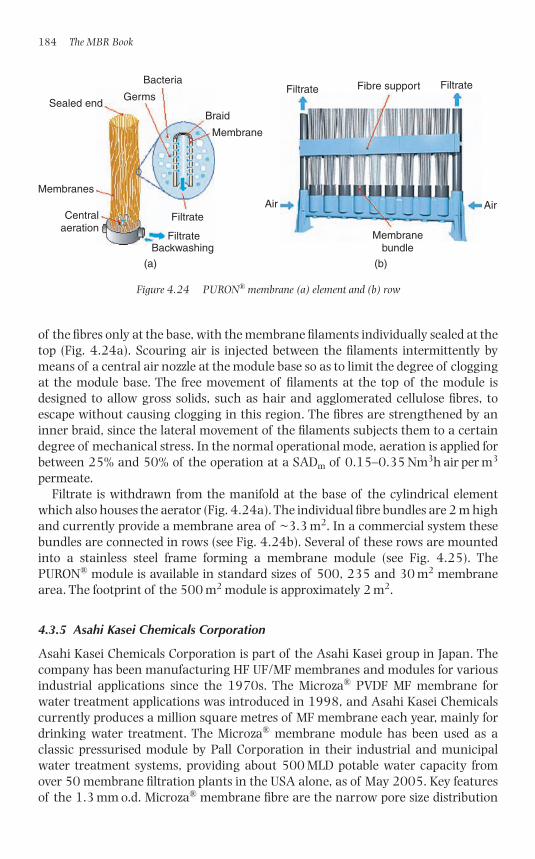
of the fibres only at the base, with the membrane filaments individually sealed at thetop (Fig. 4.24a). Scouring air is injected between the filaments intermittently bymeans of a central air nozzle at the module base so as to limit the degree of cloggingat the module base. The free movement of filaments at the top of the module isdesigned to allow gross solids, such as hair and agglomerated cellulose fibres, toescape without causing clogging in this region. The fibres are strengthened by aninner braid, since the lateral movement of the filaments subjects them to a certaindegree of mechanical stress. In the normal operational mode, aeration is applied forbetween 25% and 50% of the operation at a SADm of 0.15–0.35 Nm3h air per m3
permeate.Filtrate is withdrawn from the manifold at the base of the cylindrical element
which also houses the aerator (Fig. 4.24a). The individual fibre bundles are 2 m highand currently provide a membrane area of ~3.3 m2. In a commercial system thesebundles are connected in rows (see Fig. 4.24b). Several of these rows are mountedinto a stainless steel frame forming a membrane module (see Fig. 4.25). ThePURON® module is available in standard sizes of 500, 235 and 30 m2 membranearea. The footprint of the 500 m2 module is approximately 2 m2.
4.3.5 Asahi Kasei Chemicals Corporation
Asahi Kasei Chemicals Corporation is part of the Asahi Kasei group in Japan. Thecompany has been manufacturing HF UF/MF membranes and modules for variousindustrial applications since the 1970s. The Microza® PVDF MF membrane forwater treatment applications was introduced in 1998, and Asahi Kasei Chemicalscurrently produces a million square metres of MF membrane each year, mainly fordrinking water treatment. The Microza® membrane module has been used as a classic pressurised module by Pall Corporation in their industrial and municipalwater treatment systems, providing about 500 MLD potable water capacity fromover 50 membrane filtration plants in the USA alone, as of May 2005. Key featuresof the 1.3 mm o.d. Microza® membrane fibre are the narrow pore size distribution
184 The MBR Book
Sealed end
Membranes
Centralaeration
Bacteria
Germs
Braid
Membrane
Filtrate
FiltrateBackwashing
Membranebundle
Filtrate Filtrate
Air Air
Fibre support
(a) (b)
Figure 4.24 PURON® membrane (a) element and (b) row
1856174817_Ch04.qxd 6/5/06 12:14 PM Page 184
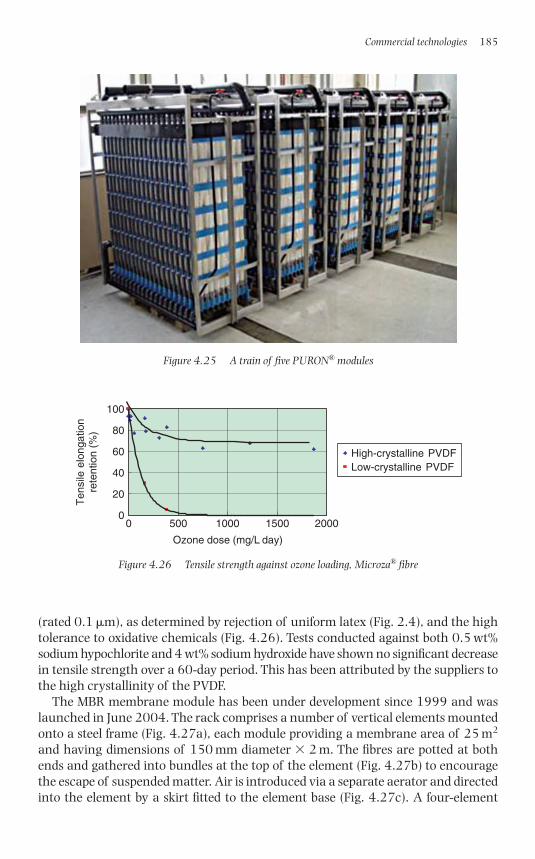
(rated 0.1 �m), as determined by rejection of uniform latex (Fig. 2.4), and the hightolerance to oxidative chemicals (Fig. 4.26). Tests conducted against both 0.5 wt%sodium hypochlorite and 4 wt% sodium hydroxide have shown no significant decreasein tensile strength over a 60-day period. This has been attributed by the suppliers tothe high crystallinity of the PVDF.
The MBR membrane module has been under development since 1999 and waslaunched in June 2004. The rack comprises a number of vertical elements mountedonto a steel frame (Fig. 4.27a), each module providing a membrane area of 25 m2
and having dimensions of 150 mm diameter � 2 m. The fibres are potted at bothends and gathered into bundles at the top of the element (Fig. 4.27b) to encouragethe escape of suspended matter. Air is introduced via a separate aerator and directedinto the element by a skirt fitted to the element base (Fig. 4.27c). A four-element
Commercial technologies 185
Figure 4.25 A train of five PURON® modules
0
20
40
60
80
100
0 500 1000 1500 2000
Ozone dose (mg/L day)
Ten
sile
elo
ngat
ion
rete
ntio
n (%
)
High-crystalline PVDFLow-crystalline PVDF
Figure 4.26 Tensile strength against ozone loading, Microza® fibre
1856174817_Ch04.qxd 6/5/06 12:14 PM Page 185
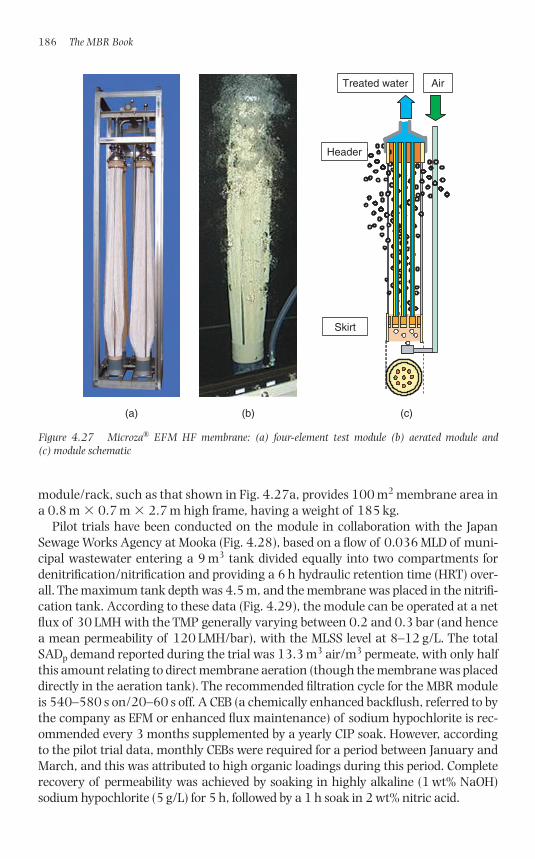
module/rack, such as that shown in Fig. 4.27a, provides 100 m2 membrane area ina 0.8 m � 0.7 m � 2.7 m high frame, having a weight of 185 kg.
Pilot trials have been conducted on the module in collaboration with the JapanSewage Works Agency at Mooka (Fig. 4.28), based on a flow of 0.036 MLD of muni-cipal wastewater entering a 9 m3 tank divided equally into two compartments fordenitrification/nitrification and providing a 6 h hydraulic retention time (HRT) over-all. The maximum tank depth was 4.5 m, and the membrane was placed in the nitrifi-cation tank. According to these data (Fig. 4.29), the module can be operated at a netflux of 30 LMH with the TMP generally varying between 0.2 and 0.3 bar (and hencea mean permeability of 120 LMH/bar), with the MLSS level at 8–12 g/L. The totalSADp demand reported during the trial was 13.3 m3 air/m3 permeate, with only halfthis amount relating to direct membrane aeration (though the membrane was placeddirectly in the aeration tank). The recommended filtration cycle for the MBR moduleis 540–580 s on/20–60 s off. A CEB (a chemically enhanced backflush, referred to bythe company as EFM or enhanced flux maintenance) of sodium hypochlorite is rec-ommended every 3 months supplemented by a yearly CIP soak. However, accordingto the pilot trial data, monthly CEBs were required for a period between January andMarch, and this was attributed to high organic loadings during this period. Completerecovery of permeability was achieved by soaking in highly alkaline (1 wt% NaOH)sodium hypochlorite (5 g/L) for 5 h, followed by a 1 h soak in 2 wt% nitric acid.
186 The MBR Book
Skirt
(a) (b) (c)
Treated water Air
Header
Figure 4.27 Microza® EFM HF membrane: (a) four-element test module (b) aerated module and (c) module schematic
1856174817_Ch04.qxd 6/5/06 12:14 PM Page 186
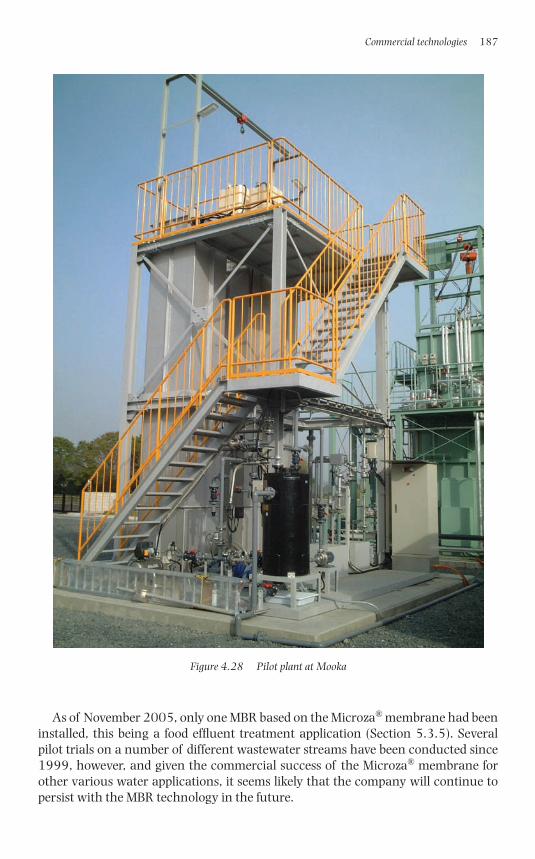
As of November 2005, only one MBR based on the Microza® membrane had beeninstalled, this being a food effluent treatment application (Section 5.3.5). Severalpilot trials on a number of different wastewater streams have been conducted since1999, however, and given the commercial success of the Microza® membrane forother various water applications, it seems likely that the company will continue topersist with the MBR technology in the future.
Commercial technologies 187
Figure 4.28 Pilot plant at Mooka
1856174817_Ch04.qxd 6/5/06 12:14 PM Page 187
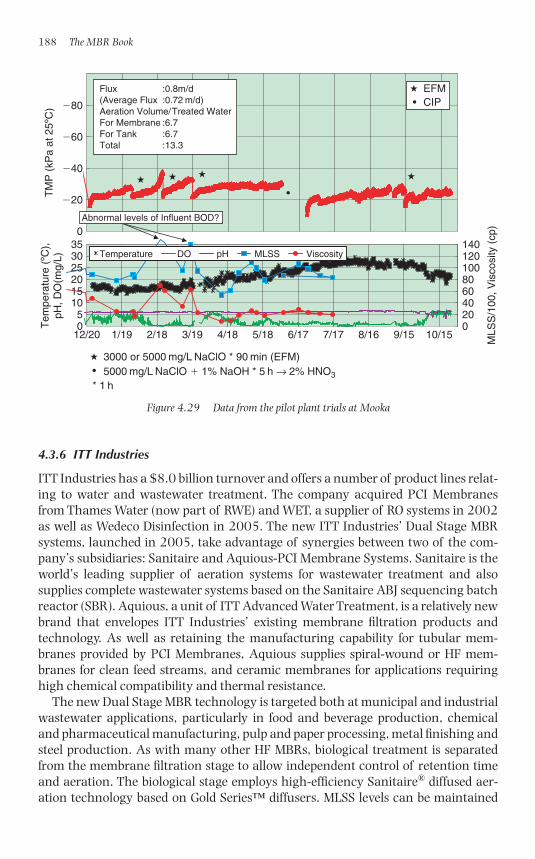
4.3.6 ITT Industries
ITT Industries has a $8.0 billion turnover and offers a number of product lines relat-ing to water and wastewater treatment. The company acquired PCI Membranesfrom Thames Water (now part of RWE) and WET, a supplier of RO systems in 2002as well as Wedeco Disinfection in 2005. The new ITT Industries’ Dual Stage MBRsystems, launched in 2005, take advantage of synergies between two of the com-pany’s subsidiaries: Sanitaire and Aquious-PCI Membrane Systems. Sanitaire is theworld’s leading supplier of aeration systems for wastewater treatment and also supplies complete wastewater systems based on the Sanitaire ABJ sequencing batchreactor (SBR). Aquious, a unit of ITT Advanced Water Treatment, is a relatively newbrand that envelopes ITT Industries’ existing membrane filtration products andtechnology. As well as retaining the manufacturing capability for tubular mem-branes provided by PCI Membranes, Aquious supplies spiral-wound or HF mem-branes for clean feed streams, and ceramic membranes for applications requiringhigh chemical compatibility and thermal resistance.
The new Dual Stage MBR technology is targeted both at municipal and industrialwastewater applications, particularly in food and beverage production, chemicaland pharmaceutical manufacturing, pulp and paper processing, metal finishing andsteel production. As with many other HF MBRs, biological treatment is separatedfrom the membrane filtration stage to allow independent control of retention timeand aeration. The biological stage employs high-efficiency Sanitaire® diffused aer-ation technology based on Gold Series™ diffusers. MLSS levels can be maintained
188 The MBR Book
3000 or 5000 mg/L NaClO * 90 min (EFM)5000 mg/L NaClO � 1% NaOH * 5 h → 2% HNO3
�80
�60
�40
�20
0
05
101520253035
12/20 1/19 2/18 3/19 4/18 5/18 6/17 7/17 8/16 9/15 10/15020406080100120140
MLS
S/1
00, V
isco
sity
(cp
)
Temperature DO
Flux :0.8m/d(Average Flux :0.72 m/d)Aeration Volume/Treated WaterFor Membrane :6.7For Tank :6.7Total :13.3
•
•
CIP•EFM
* 1 h
Tem
pera
ture
(ºC
),pH
, DO
(mg/
L)T
MP
(kP
a at
25º
C)
pH MLSS Viscosity
Abnormal levels of Influent BOD?
Figure 4.29 Data from the pilot plant trials at Mooka
1856174817_Ch04.qxd 6/5/06 12:14 PM Page 188
at 10 000–12 000 mg/L. The membrane filtration stage employs immersed 0.05 �mreinforced PES membranes. Membranes are supplied in two module configurations,horizontally mounted and in single manifolds, which are open at one end and con-nected to a manifold for permeate extraction under vacuum. The modules have inte-gral aerators, with air-scour nozzles placed within the fibre bundles (Fig. 4.30). Thecompany is also incorporating the Dual Stage MBR in its new Integrated ReuseSystem, together with ITT RO, Ozone and UV technology.
4.4 Sidestream MBR technologies
There are a number of MT membrane module suppliers providing standard sizecylindrical modules, generally 100 or 200 mm in diameter, which are then employedby sidestream MBR (sMBR) process suppliers in their proprietary processes. Detailsof two-membrane module product suppliers are given below. The proprietary MBRtechnologies of one established European MT MBR process supplier are described inSection 4.5.3.
4.4.1 Berghof Membrane Technology
Berghof is a German supplier who provide two MT UF 3 m-long membrane moduleproducts: HyPerm-AE and HyperFlux, the main difference being the module andmembrane tube diameters. The HyPerm-AE is a 225 mm diameter module fitted with11.5 mm diameter tubes, 112 in all, providing a total membrane area of 11.8 m2, inPVC-C housing. The membrane material is either 250 kD PVDF or PES, offered with arange of selectivities between 20 and 150 kDa, both materials being on a PP substratesupport. The HyperFlux is a standard 8� (200 mm) diameter module fitted with 8 or10 mm diameter tubes, thereby respectively providing a total membrane area of 27.2or 21.2 m2 from 365 or 224 membrane tubes, in glass–fibre reinforced plastic (GRP)housing. The membranes in this case are either of 250 kDa PVDF or 150 kDa PES. Forboth products, the membrane element is replaceable within the GRP housing.
Commercial technologies 189
Figure 4.30 The ITT MBR
1856174817_Ch04.qxd 6/5/06 12:14 PM Page 189
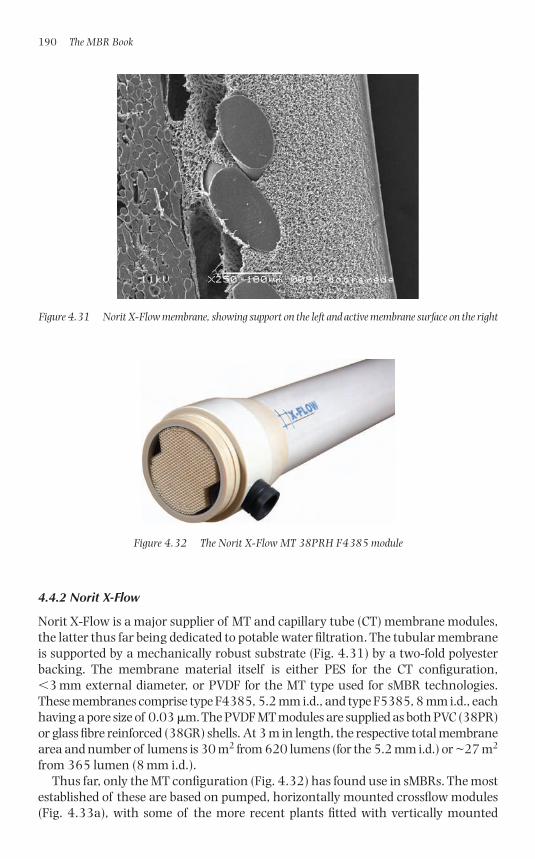
4.4.2 Norit X-Flow
Norit X-Flow is a major supplier of MT and capillary tube (CT) membrane modules,the latter thus far being dedicated to potable water filtration. The tubular membraneis supported by a mechanically robust substrate (Fig. 4.31) by a two-fold polyesterbacking. The membrane material itself is either PES for the CT configuration,�3 mm external diameter, or PVDF for the MT type used for sMBR technologies.These membranes comprise type F4385, 5.2 mm i.d., and type F5385, 8 mm i.d., eachhaving a pore size of 0.03 �m. The PVDF MT modules are supplied as both PVC (38PR)or glass fibre reinforced (38GR) shells. At 3 m in length, the respective total membranearea and number of lumens is 30 m2 from 620 lumens (for the 5.2 mm i.d.) or ~27 m2
from 365 lumen (8 mm i.d.).Thus far, only the MT configuration (Fig. 4.32) has found use in sMBRs. The most
established of these are based on pumped, horizontally mounted crossflow modules(Fig. 4.33a), with some of the more recent plants fitted with vertically mounted
190 The MBR Book
Figure 4.31 Norit X-Flow membrane, showing support on the left and active membrane surface on the right
Figure 4.32 The Norit X-Flow MT 38PRH F4385 module
1856174817_Ch04.qxd 6/5/06 12:14 PM Page 190
membranes operating with airlift (Fig. 4.33b) combined with liquid pumping atmuch lower flow rates (Table 4.3). This product has been used by a number of processdesigners for proprietary MBR technologies, including Wehrle (Germany), Aquabio(UK) and Dynatec (US). Whilst the majority of Norit X-Flow-based MBR plant areused for industrial effluent applications, some examples exist of small-scale municipaland domestic applications where the inherently higher specific energy demand is lessof an issue than the system robustness, simplicity and control. The airlift system isrecommended at relatively low chemical oxygen demand (COD) concentrations andhigh flows (�1 g/L COD and �250 m3/h), whereas at high COD levels (�5 g/L) andlow flows (�100 m3/h), the pumped system is recommended. This leaves a range offlows and COD levels for which either system may be suited; the overall COD loadingrate over the entire range is normally between 100 and 1000 kgCOD/h.
Commercial technologies 191
1 m1 m
4 m
4 m4 m
(a) (b)
4 m
Figure 4.33 Norit X-Flow modules: (a) pumped and (b) airlift, with accompanying dimensions
Table 4.3 Norit X-Flow sMBR quoted operational parameters
Parameter Pumped Airlift
MLSS (g/L) 12–30 8–12TMP (bar) 1–5 0.05–0.3Flux (LMH) 80–200 30–60Permeability (LMH/bar) 40–80 90–500Footprint (m3/h capacity m2 projected area)a 10.8c 7.5b
Footprint (m2 membrane/m2 projected area)a 108 131Specific energy demand (kWh/m3) 1.5–4 0.5–0.7Processing More simple More complexMode of operation Continuous Discontinuous
a Based on a single skid, 1 m � 4 m � 4 m high.b Based on 55 LMH.c Based on 100 LMH.
1856174817_Ch04.qxd 6/5/06 12:14 PM Page 191
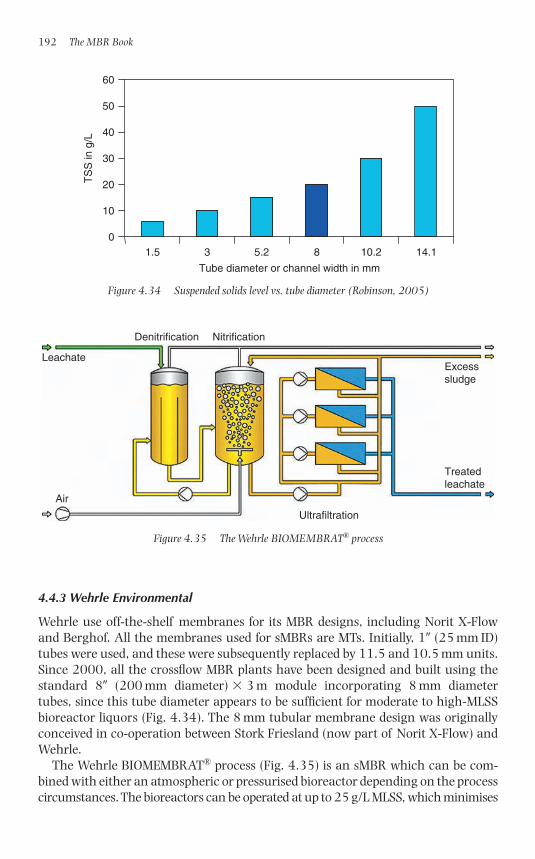
4.4.3 Wehrle Environmental
Wehrle use off-the-shelf membranes for its MBR designs, including Norit X-Flowand Berghof. All the membranes used for sMBRs are MTs. Initially, 1� (25 mm ID)tubes were used, and these were subsequently replaced by 11.5 and 10.5 mm units.Since 2000, all the crossflow MBR plants have been designed and built using thestandard 8� (200 mm diameter) � 3 m module incorporating 8 mm diameter tubes, since this tube diameter appears to be sufficient for moderate to high-MLSSbioreactor liquors (Fig. 4.34). The 8 mm tubular membrane design was originallyconceived in co-operation between Stork Friesland (now part of Norit X-Flow) andWehrle.
The Wehrle BIOMEMBRAT® process (Fig. 4.35) is an sMBR which can be com-bined with either an atmospheric or pressurised bioreactor depending on the processcircumstances. The bioreactors can be operated at up to 25 g/L MLSS, which minimises
192 The MBR Book
TS
S in
g/L
0
10
20
30
40
50
60
1.5 3 5.2 8 10.2
Tube diameter or channel width in mm
14.1
Figure 4.34 Suspended solids level vs. tube diameter (Robinson, 2005)
Air
Denitrification
Ultrafiltration
Treatedleachate
Excesssludge
Leachate
Nitrification
Figure 4.35 The Wehrle BIOMEMBRAT® process
1856174817_Ch04.qxd 6/5/06 12:14 PM Page 192
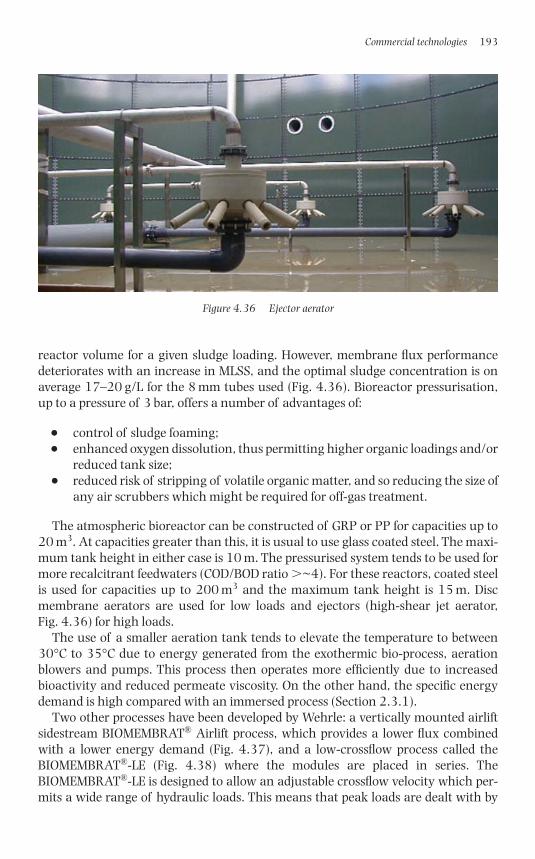
reactor volume for a given sludge loading. However, membrane flux performancedeteriorates with an increase in MLSS, and the optimal sludge concentration is onaverage 17–20 g/L for the 8 mm tubes used (Fig. 4.36). Bioreactor pressurisation,up to a pressure of 3 bar, offers a number of advantages of:
● control of sludge foaming;● enhanced oxygen dissolution, thus permitting higher organic loadings and/or
reduced tank size;● reduced risk of stripping of volatile organic matter, and so reducing the size of
any air scrubbers which might be required for off-gas treatment.
The atmospheric bioreactor can be constructed of GRP or PP for capacities up to20 m3. At capacities greater than this, it is usual to use glass coated steel. The maxi-mum tank height in either case is 10 m. The pressurised system tends to be used formore recalcitrant feedwaters (COD/BOD ratio �~4). For these reactors, coated steelis used for capacities up to 200 m3 and the maximum tank height is 15 m. Discmembrane aerators are used for low loads and ejectors (high-shear jet aerator, Fig. 4.36) for high loads.
The use of a smaller aeration tank tends to elevate the temperature to between30°C to 35°C due to energy generated from the exothermic bio-process, aerationblowers and pumps. This process then operates more efficiently due to increasedbioactivity and reduced permeate viscosity. On the other hand, the specific energydemand is high compared with an immersed process (Section 2.3.1).
Two other processes have been developed by Wehrle: a vertically mounted airliftsidestream BIOMEMBRAT® Airlift process, which provides a lower flux combinedwith a lower energy demand (Fig. 4.37), and a low-crossflow process called the BIOMEMBRAT®-LE (Fig. 4.38) where the modules are placed in series. The BIOMEMBRAT®-LE is designed to allow an adjustable crossflow velocity which per-mits a wide range of hydraulic loads. This means that peak loads are dealt with by
Commercial technologies 193
Figure 4.36 Ejector aerator
1856174817_Ch04.qxd 6/5/06 12:14 PM Page 193
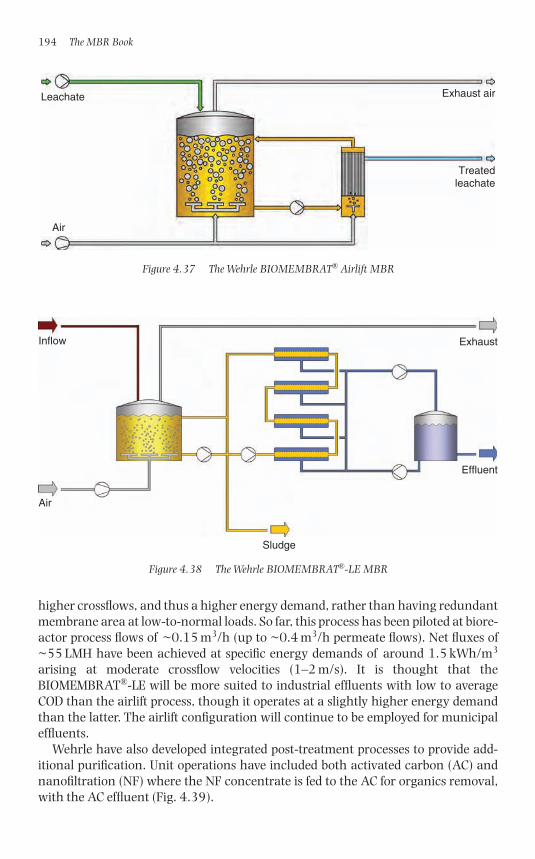
higher crossflows, and thus a higher energy demand, rather than having redundantmembrane area at low-to-normal loads. So far, this process has been piloted at biore-actor process flows of ~0.15 m3/h (up to ~0.4 m3/h permeate flows). Net fluxes of~55 LMH have been achieved at specific energy demands of around 1.5 kWh/m3
arising at moderate crossflow velocities (1–2 m/s). It is thought that the BIOMEMBRAT®-LE will be more suited to industrial effluents with low to averageCOD than the airlift process, though it operates at a slightly higher energy demandthan the latter. The airlift configuration will continue to be employed for municipaleffluents.
Wehrle have also developed integrated post-treatment processes to provide add-itional purification. Unit operations have included both activated carbon (AC) andnanofiltration (NF) where the NF concentrate is fed to the AC for organics removal,with the AC effluent (Fig. 4.39).
194 The MBR Book
Leachate
Air
Exhaust air
Treatedleachate
Figure 4.37 The Wehrle BIOMEMBRAT® Airlift MBR
Inflow
Air
Effluent
Exhaust
Sludge
Figure 4.38 The Wehrle BIOMEMBRAT®-LE MBR
1856174817_Ch04.qxd 6/5/06 12:14 PM Page 194
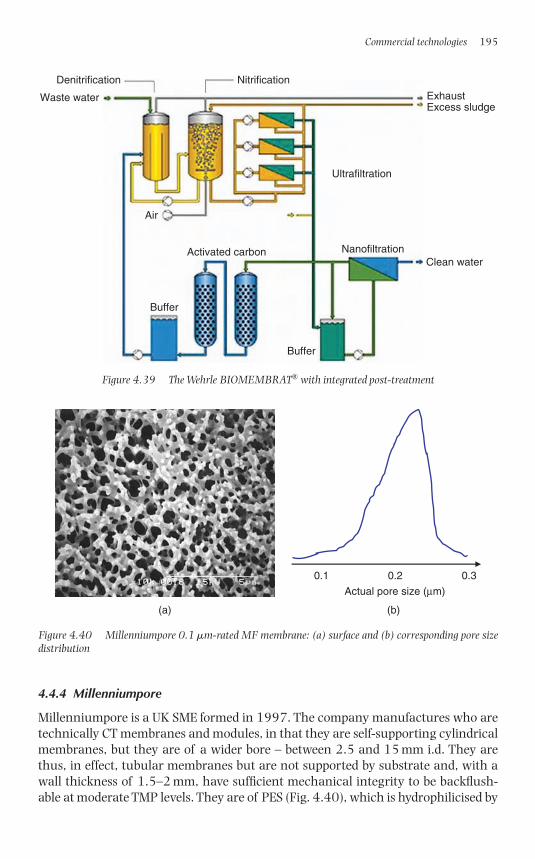
4.4.4 Millenniumpore
Millenniumpore is a UK SME formed in 1997. The company manufactures who aretechnically CT membranes and modules, in that they are self-supporting cylindricalmembranes, but they are of a wider bore – between 2.5 and 15 mm i.d. They arethus, in effect, tubular membranes but are not supported by substrate and, with awall thickness of 1.5–2 mm, have sufficient mechanical integrity to be backflush-able at moderate TMP levels. They are of PES (Fig. 4.40), which is hydrophilicised by
Commercial technologies 195
Denitrification Nitrification
Waste water
Ultrafiltration
Nanofiltration
ExhaustExcess sludge
Air
Buffer
Buffer
Activated carbonClean water
Figure 4.39 The Wehrle BIOMEMBRAT® with integrated post-treatment
Actual pore size (µm)
0.1
(a) (b)
0.2 0.3
Figure 4.40 Millenniumpore 0.1 �m-rated MF membrane: (a) surface and (b) corresponding pore sizedistribution
1856174817_Ch04.qxd 6/5/06 12:15 PM Page 195
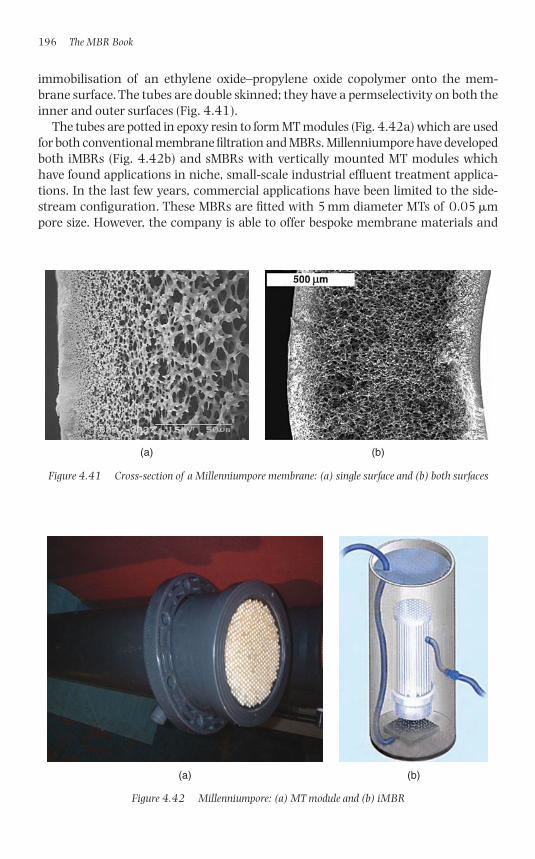
immobilisation of an ethylene oxide–propylene oxide copolymer onto the mem-brane surface. The tubes are double skinned; they have a permselectivity on both theinner and outer surfaces (Fig. 4.41).
The tubes are potted in epoxy resin to form MT modules (Fig. 4.42a) which are usedfor both conventional membrane filtration and MBRs. Millenniumpore have developedboth iMBRs (Fig. 4.42b) and sMBRs with vertically mounted MT modules whichhave found applications in niche, small-scale industrial effluent treatment applica-tions. In the last few years, commercial applications have been limited to the side-stream configuration. These MBRs are fitted with 5 mm diameter MTs of 0.05 �mpore size. However, the company is able to offer bespoke membrane materials and
196 The MBR Book
(a) (b)
Figure 4.41 Cross-section of a Millenniumpore membrane: (a) single surface and (b) both surfaces
(a) (b)
Figure 4.42 Millenniumpore: (a) MT module and (b) iMBR
1856174817_Ch04.qxd 6/5/06 12:15 PM Page 196
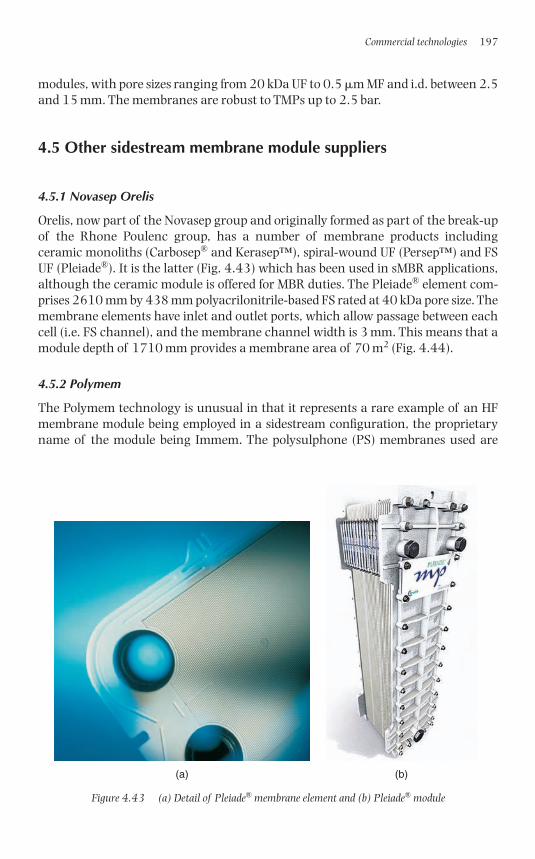
modules, with pore sizes ranging from 20 kDa UF to 0.5 �m MF and i.d. between 2.5and 15 mm. The membranes are robust to TMPs up to 2.5 bar.
4.5 Other sidestream membrane module suppliers
4.5.1 Novasep Orelis
Orelis, now part of the Novasep group and originally formed as part of the break-upof the Rhone Poulenc group, has a number of membrane products includingceramic monoliths (Carbosep® and Kerasep™), spiral-wound UF (Persep™) and FSUF (Pleiade®). It is the latter (Fig. 4.43) which has been used in sMBR applications,although the ceramic module is offered for MBR duties. The Pleiade® element com-prises 2610 mm by 438 mm polyacrilonitrile-based FS rated at 40 kDa pore size. Themembrane elements have inlet and outlet ports, which allow passage between eachcell (i.e. FS channel), and the membrane channel width is 3 mm. This means that amodule depth of 1710 mm provides a membrane area of 70 m2 (Fig. 4.44).
4.5.2 Polymem
The Polymem technology is unusual in that it represents a rare example of an HFmembrane module being employed in a sidestream configuration, the proprietaryname of the module being Immem. The polysulphone (PS) membranes used are
Commercial technologies 197
(a) (b)
Figure 4.43 (a) Detail of Pleiade® membrane element and (b) Pleiade® module
1856174817_Ch04.qxd 6/5/06 12:15 PM Page 197
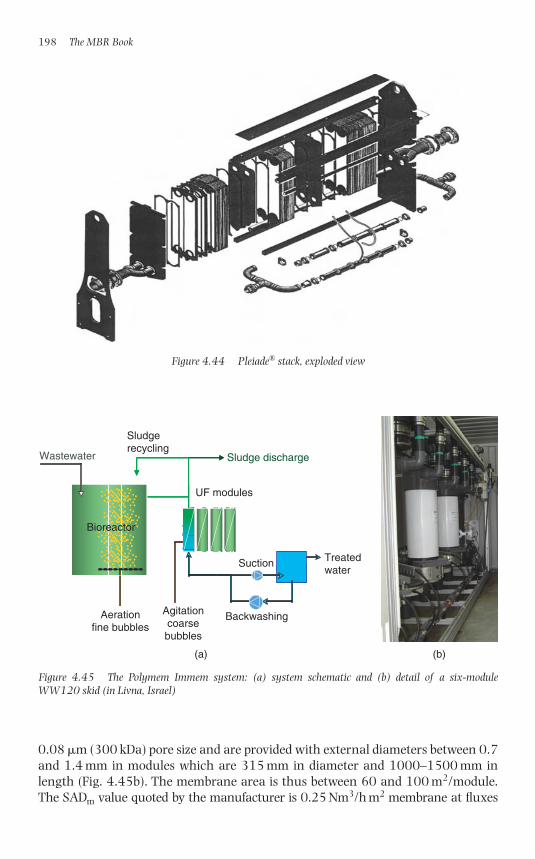
0.08 �m (300 kDa) pore size and are provided with external diameters between 0.7and 1.4 mm in modules which are 315 mm in diameter and 1000–1500 mm inlength (Fig. 4.45b). The membrane area is thus between 60 and 100 m2/module.The SADm value quoted by the manufacturer is 0.25 Nm3/h m2 membrane at fluxes
198 The MBR Book
Figure 4.44 Pleiade® stack, exploded view
Wastewater
Bioreactor
Sludgerecycling
Sludge discharge
UF modules
Treatedwater
Suction
Aerationfine bubbles
Agitationcoarsebubbles
Backwashing
(a) (b)
Figure 4.45 The Polymem Immem system: (a) system schematic and (b) detail of a six-moduleWW120 skid (in Livna, Israel)
1856174817_Ch04.qxd 6/5/06 12:15 PM Page 198
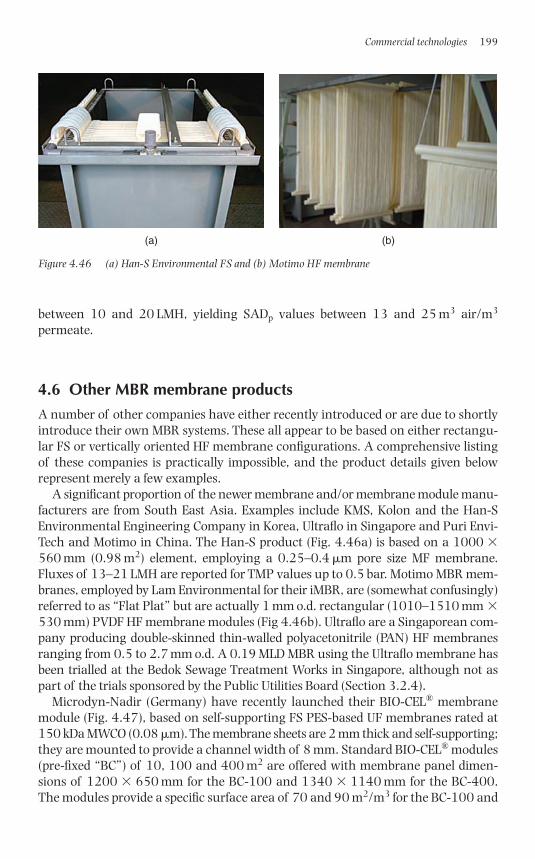
between 10 and 20 LMH, yielding SADp values between 13 and 25 m3 air/m3
permeate.
4.6 Other MBR membrane products
A number of other companies have either recently introduced or are due to shortlyintroduce their own MBR systems. These all appear to be based on either rectangu-lar FS or vertically oriented HF membrane configurations. A comprehensive listingof these companies is practically impossible, and the product details given below represent merely a few examples.
A significant proportion of the newer membrane and/or membrane module manu-facturers are from South East Asia. Examples include KMS, Kolon and the Han-SEnvironmental Engineering Company in Korea, Ultraflo in Singapore and Puri Envi-Tech and Motimo in China. The Han-S product (Fig. 4.46a) is based on a 1000 �560 mm (0.98 m2) element, employing a 0.25–0.4 �m pore size MF membrane.Fluxes of 13–21 LMH are reported for TMP values up to 0.5 bar. Motimo MBR mem-branes, employed by Lam Environmental for their iMBR, are (somewhat confusingly)referred to as “Flat Plat” but are actually 1 mm o.d. rectangular (1010–1510 mm �530 mm) PVDF HF membrane modules (Fig 4.46b). Ultraflo are a Singaporean com-pany producing double-skinned thin-walled polyacetonitrile (PAN) HF membranesranging from 0.5 to 2.7 mm o.d. A 0.19 MLD MBR using the Ultraflo membrane hasbeen trialled at the Bedok Sewage Treatment Works in Singapore, although not aspart of the trials sponsored by the Public Utilities Board (Section 3.2.4).
Microdyn-Nadir (Germany) have recently launched their BIO-CEL® membranemodule (Fig. 4.47), based on self-supporting FS PES-based UF membranes rated at150 kDa MWCO (0.08 �m). The membrane sheets are 2 mm thick and self-supporting;they are mounted to provide a channel width of 8 mm. Standard BIO-CEL® modules(pre-fixed “BC”) of 10, 100 and 400 m2 are offered with membrane panel dimen-sions of 1200 � 650 mm for the BC-100 and 1340 � 1140 mm for the BC-400.The modules provide a specific surface area of 70 and 90 m2/m3 for the BC-100 and
Commercial technologies 199
(a) (b)
Figure 4.46 (a) Han-S Environmental FS and (b) Motimo HF membrane
1856174817_Ch04.qxd 6/5/06 12:15 PM Page 199
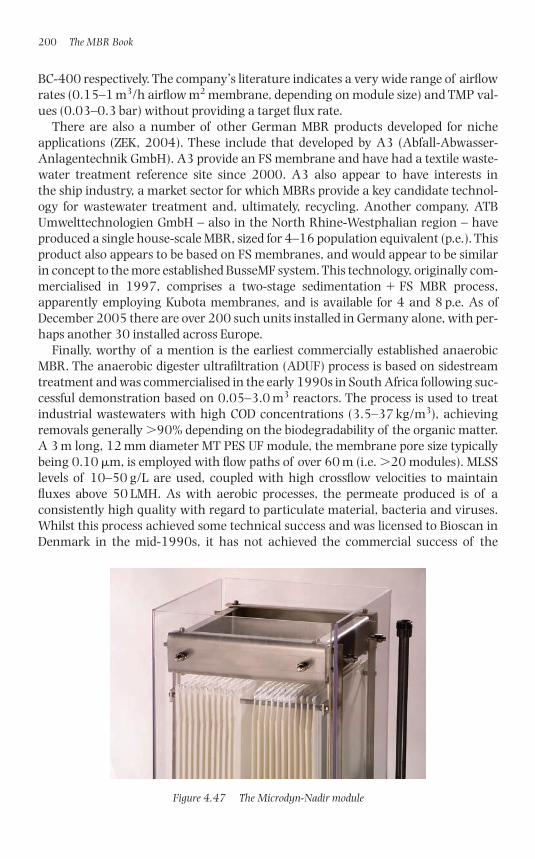
BC-400 respectively. The company’s literature indicates a very wide range of airflowrates (0.15–1 m3/h airflow m2 membrane, depending on module size) and TMP val-ues (0.03–0.3 bar) without providing a target flux rate.
There are also a number of other German MBR products developed for nicheapplications (ZEK, 2004). These include that developed by A3 (Abfall-Abwasser-Anlagentechnik GmbH). A3 provide an FS membrane and have had a textile waste-water treatment reference site since 2000. A3 also appear to have interests in the ship industry, a market sector for which MBRs provide a key candidate technol-ogy for wastewater treatment and, ultimately, recycling. Another company, ATBUmwelttechnologien GmbH – also in the North Rhine-Westphalian region – haveproduced a single house-scale MBR, sized for 4–16 population equivalent (p.e.). Thisproduct also appears to be based on FS membranes, and would appear to be similarin concept to the more established BusseMF system. This technology, originally com-mercialised in 1997, comprises a two-stage sedimentation � FS MBR process,apparently employing Kubota membranes, and is available for 4 and 8 p.e. As ofDecember 2005 there are over 200 such units installed in Germany alone, with per-haps another 30 installed across Europe.
Finally, worthy of a mention is the earliest commercially established anaerobicMBR. The anaerobic digester ultrafiltration (ADUF) process is based on sidestreamtreatment and was commercialised in the early 1990s in South Africa following suc-cessful demonstration based on 0.05–3.0 m3 reactors. The process is used to treatindustrial wastewaters with high COD concentrations (3.5–37 kg/m3), achievingremovals generally �90% depending on the biodegradability of the organic matter.A 3 m long, 12 mm diameter MT PES UF module, the membrane pore size typicallybeing 0.10 �m, is employed with flow paths of over 60 m (i.e. �20 modules). MLSSlevels of 10–50 g/L are used, coupled with high crossflow velocities to maintainfluxes above 50 LMH. As with aerobic processes, the permeate produced is of a consistently high quality with regard to particulate material, bacteria and viruses.Whilst this process achieved some technical success and was licensed to Bioscan inDenmark in the mid-1990s, it has not achieved the commercial success of the
200 The MBR Book
Figure 4.47 The Microdyn-Nadir module
1856174817_Ch04.qxd 6/5/06 12:15 PM Page 200
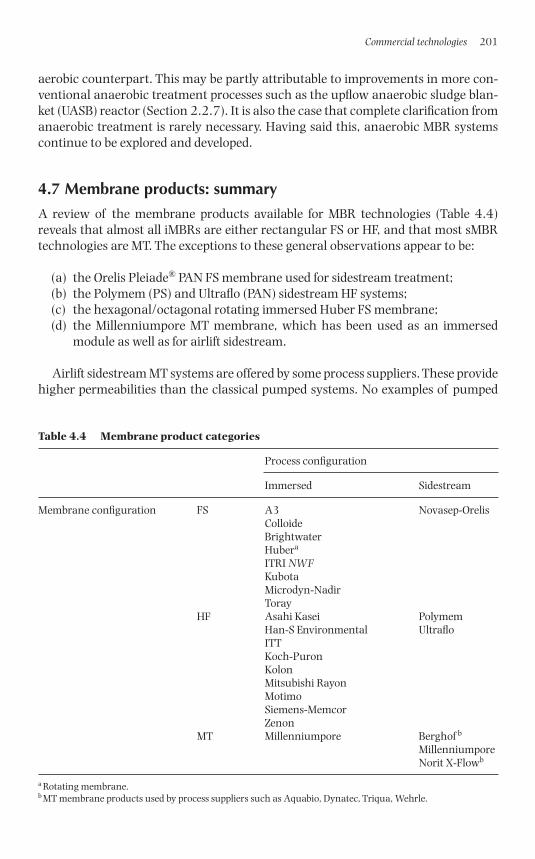
aerobic counterpart. This may be partly attributable to improvements in more con-ventional anaerobic treatment processes such as the upflow anaerobic sludge blan-ket (UASB) reactor (Section 2.2.7). It is also the case that complete clarification fromanaerobic treatment is rarely necessary. Having said this, anaerobic MBR systemscontinue to be explored and developed.
4.7 Membrane products: summary
A review of the membrane products available for MBR technologies (Table 4.4)reveals that almost all iMBRs are either rectangular FS or HF, and that most sMBRtechnologies are MT. The exceptions to these general observations appear to be:
(a) the Orelis Pleiade® PAN FS membrane used for sidestream treatment;(b) the Polymem (PS) and Ultraflo (PAN) sidestream HF systems;(c) the hexagonal/octagonal rotating immersed Huber FS membrane;(d) the Millenniumpore MT membrane, which has been used as an immersed
module as well as for airlift sidestream.
Airlift sidestream MT systems are offered by some process suppliers. These providehigher permeabilities than the classical pumped systems. No examples of pumped
Commercial technologies 201
Table 4.4 Membrane product categories
Process configuration
Immersed Sidestream
Membrane configuration FS A3 Novasep-OrelisColloideBrightwaterHubera
ITRI NWFKubotaMicrodyn-NadirToray
HF Asahi Kasei PolymemHan-S Environmental UltrafloITTKoch-PuronKolonMitsubishi RayonMotimoSiemens-MemcorZenon
MT Millenniumpore Berghof b
MillenniumporeNorit X-Flowb
a Rotating membrane.b MT membrane products used by process suppliers such as Aquabio, Dynatec, Triqua, Wehrle.
1856174817_Ch04.qxd 6/5/06 12:15 PM Page 201
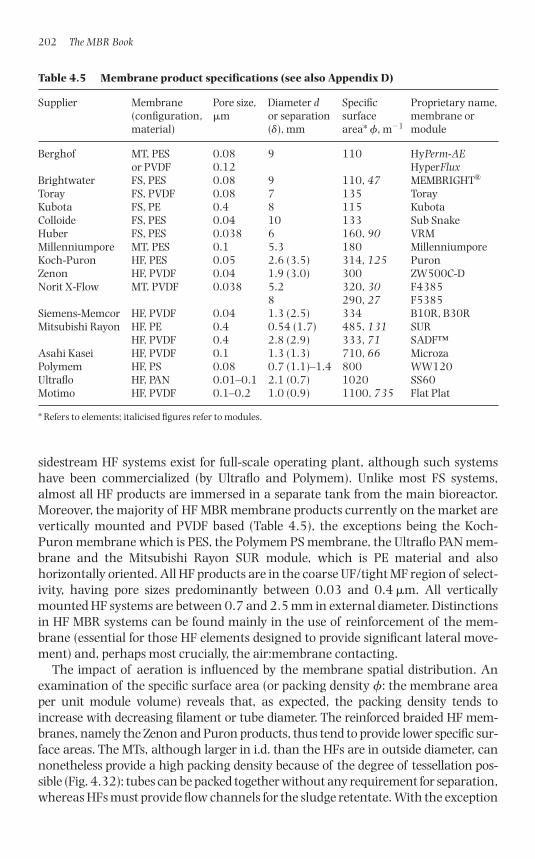
sidestream HF systems exist for full-scale operating plant, although such systemshave been commercialized (by Ultraflo and Polymem). Unlike most FS systems,almost all HF products are immersed in a separate tank from the main bioreactor.Moreover, the majority of HF MBR membrane products currently on the market arevertically mounted and PVDF based (Table 4.5), the exceptions being the Koch-Puron membrane which is PES, the Polymem PS membrane, the Ultraflo PAN mem-brane and the Mitsubishi Rayon SUR module, which is PE material and alsohorizontally oriented. All HF products are in the coarse UF/tight MF region of select-ivity, having pore sizes predominantly between 0.03 and 0.4 �m. All verticallymounted HF systems are between 0.7 and 2.5 mm in external diameter. Distinctionsin HF MBR systems can be found mainly in the use of reinforcement of the mem-brane (essential for those HF elements designed to provide significant lateral move-ment) and, perhaps most crucially, the air:membrane contacting.
The impact of aeration is influenced by the membrane spatial distribution. Anexamination of the specific surface area (or packing density �: the membrane areaper unit module volume) reveals that, as expected, the packing density tends toincrease with decreasing filament or tube diameter. The reinforced braided HF mem-branes, namely the Zenon and Puron products, thus tend to provide lower specific sur-face areas. The MTs, although larger in i.d. than the HFs are in outside diameter, cannonetheless provide a high packing density because of the degree of tessellation pos-sible (Fig. 4.32): tubes can be packed together without any requirement for separation,whereas HFs must provide flow channels for the sludge retentate. With the exception
202 The MBR Book
Table 4.5 Membrane product specifications (see also Appendix D)
Supplier Membrane Pore size, Diameter d Specific Proprietary name, (configuration, �m or separation surface membrane or material) (�), mm area* �, m�1 module
Berghof MT, PES 0.08 9 110 HyPerm-AEor PVDF 0.12 HyperFlux
Brightwater FS, PES 0.08 9 110, 47 MEMBRIGHT®
Toray FS, PVDF 0.08 7 135 TorayKubota FS, PE 0.4 8 115 KubotaColloide FS, PES 0.04 10 133 Sub SnakeHuber FS, PES 0.038 6 160, 90 VRMMillenniumpore MT, PES 0.1 5.3 180 MillenniumporeKoch-Puron HF, PES 0.05 2.6 (3.5) 314, 125 PuronZenon HF, PVDF 0.04 1.9 (3.0) 300 ZW500C-DNorit X-Flow MT, PVDF 0.038 5.2 320, 30 F4385
8 290, 27 F5385Siemens-Memcor HF, PVDF 0.04 1.3 (2.5) 334 B10R, B30RMitsubishi Rayon HF, PE 0.4 0.54 (1.7) 485, 131 SUR
HF, PVDF 0.4 2.8 (2.9) 333, 71 SADF™Asahi Kasei HF, PVDF 0.1 1.3 (1.3) 710, 66 MicrozaPolymem HF, PS 0.08 0.7 (1.1)–1.4 800 WW120Ultraflo HF, PAN 0.01–0.1 2.1 (0.7) 1020 SS60Motimo HF, PVDF 0.1–0.2 1.0 (0.9) 1100, 735 Flat Plat
* Refers to elements; italicised figures refer to modules.
1856174817_Ch04.qxd 6/5/06 12:15 PM Page 202
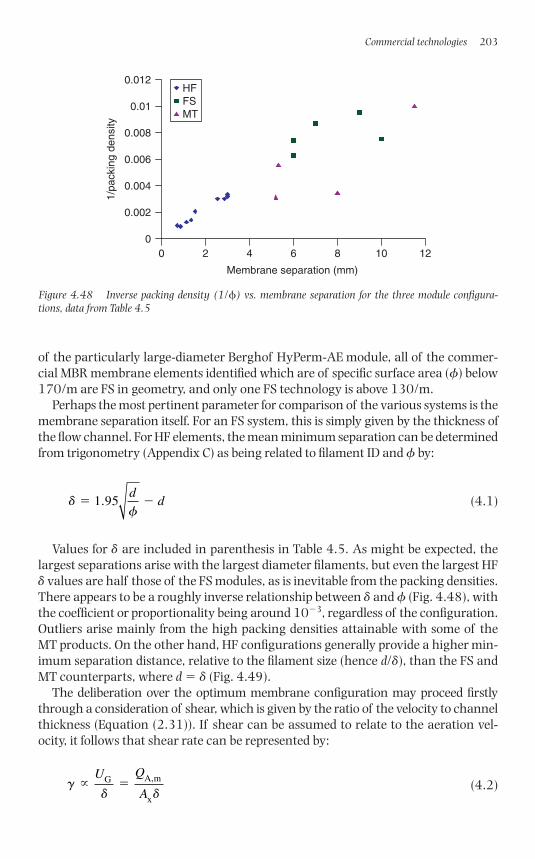
of the particularly large-diameter Berghof HyPerm-AE module, all of the commer-cial MBR membrane elements identified which are of specific surface area (�) below170/m are FS in geometry, and only one FS technology is above 130/m.
Perhaps the most pertinent parameter for comparison of the various systems is themembrane separation itself. For an FS system, this is simply given by the thickness ofthe flow channel. For HF elements, the mean minimum separation can be determinedfrom trigonometry (Appendix C) as being related to filament ID and � by:
(4.1)
Values for � are included in parenthesis in Table 4.5. As might be expected, thelargest separations arise with the largest diameter filaments, but even the largest HF� values are half those of the FS modules, as is inevitable from the packing densities.There appears to be a roughly inverse relationship between � and � (Fig. 4.48), withthe coefficient or proportionality being around 10�3, regardless of the configuration.Outliers arise mainly from the high packing densities attainable with some of theMT products. On the other hand, HF configurations generally provide a higher min-imum separation distance, relative to the filament size (hence d/�), than the FS andMT counterparts, where d � � (Fig. 4.49).
The deliberation over the optimum membrane configuration may proceed firstlythrough a consideration of shear, which is given by the ratio of the velocity to channelthickness (Equation (2.31)). If shear can be assumed to relate to the aeration vel-ocity, it follows that shear rate can be represented by:
(4.2)gd d
�U Q
AG A,m
x
df
� �1.95d
d
Commercial technologies 203
0
0.002
0.004
0.006
0.008
0.01
0.012
0 2 4 6 8 10 12
Membrane separation (mm)
HFFSMT
1/pa
ckin
g de
nsity
Figure 4.48 Inverse packing density (1/) vs. membrane separation for the three module configura-tions, data from Table 4.5
1856174817_Ch04.qxd 6/5/06 12:15 PM Page 203
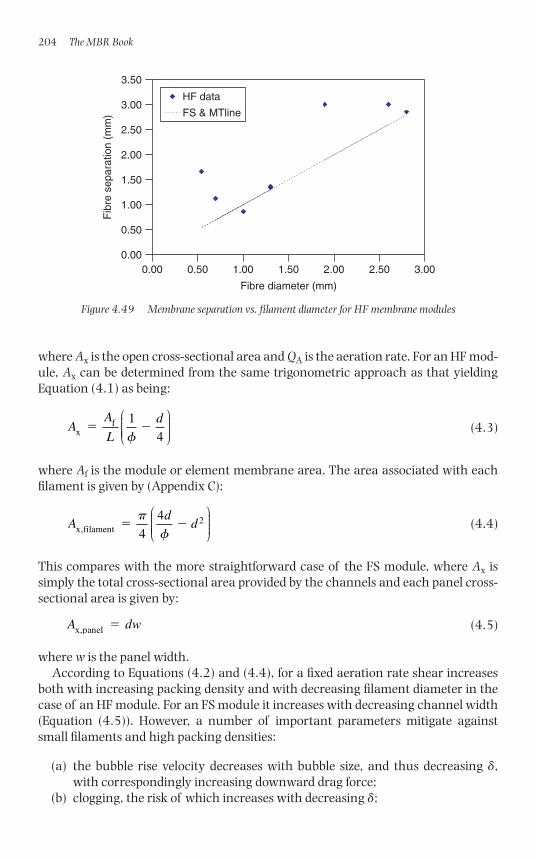
where Ax is the open cross-sectional area and QA is the aeration rate. For an HF mod-ule, Ax can be determined from the same trigonometric approach as that yieldingEquation (4.1) as being:
(4.3)
where Af is the module or element membrane area. The area associated with eachfilament is given by (Appendix C):
(4.4)
This compares with the more straightforward case of the FS module, where Ax issimply the total cross-sectional area provided by the channels and each panel cross-sectional area is given by:
(4.5)
where w is the panel width.According to Equations (4.2) and (4.4), for a fixed aeration rate shear increases
both with increasing packing density and with decreasing filament diameter in thecase of an HF module. For an FS module it increases with decreasing channel width(Equation (4.5)). However, a number of important parameters mitigate againstsmall filaments and high packing densities:
(a) the bubble rise velocity decreases with bubble size, and thus decreasing �,with correspondingly increasing downward drag force;
(b) clogging, the risk of which increases with decreasing �;
A dwx,panel �
Ad
dx,filament2
4
4� �p
f
⎛
⎝⎜⎜⎜⎜
⎞
⎠⎟⎟⎟⎟
AA
L
dx
f 1
4� �
f
⎛
⎝⎜⎜⎜⎜
⎞
⎠⎟⎟⎟⎟
204 The MBR Book
0.00
0.50
1.00
1.50
2.00
2.50
3.00
3.50
0.00 0.50 1.00 1.50 2.00 2.50 3.00
Fibre diameter (mm)
Fib
re s
epar
atio
n (m
m)
HF data
FS & MTline
Figure 4.49 Membrane separation vs. filament diameter for HF membrane modules
1856174817_Ch04.qxd 6/5/06 12:15 PM Page 204
(c) air channelling, the risk of which is likely to be a function of �;(d) hydraulic losses on the permeate side, leading to differential fouling (Section
2.3.8.3) and which increase with decreasing i.d.
It can be envisaged that there exists a range of optimum values of d (and corres-ponding i.d. values) and � at which, when coupled with the appropriate aeration rateQA,m, clogging, air-channelling and permeate-side hydraulic losses are minimised.However, little research into the first two of these specific areas of MBR module designappears to have made its way into the open literature. Moreover, and as already stated(Section 2.3.10), research into clogging is difficult given its generally insidiousnature. Given the challenges imposed, it is perhaps more apposite to review infor-mation provided from case studies and practical experience (Chapter 5) to shed lighton the practical aspects of MBR technology and membrane module design.
References
Alavi Moghaddam, M.R., Satoh, H. and Mino, T. (2002) Performance of coarse porefiltration activated sludge system. Water Sci. Techol., 46 (11–12), 71–76.
Chang, I.S., Gander, M., Jefferson, B. and Judd, S. (2001) Low-cost membranes foruse in a submerged MBR. Trans. IchemE., 79, Part B, May, 183–188.
Chang, M.C., Tzou, W.Y., Chuang, S.H. and Chang, W.K. (2003) Application ofnon-woven fabric material in membrane bioreactor processes for industrial waste-water treatment, Proceedings of 5th International Membrane Science and TechnologyConference (IMSTEC), November 10–14, Sydney, Australia.
Fuchs, W., Resch, C., Kernstock, M., Mayer, M., Schoeberl, P. and Braun, R. (2005)Influence of operational conditions on the performance of a mesh filter activatedsludge process. Water Res., 39, 803–810.
Kennedy, S. and Churchouse, S.J. (2005) Progress in membrane bioreactors: newadvances. Proceedings of Water and Wastewater Europe Conference, Milan, June 2005.
Meng, Z.G., Yang, F.L. and Zhang, X.W. (2005) Do non-wovens offer a cheaperoption? Filtr. Separat., June, 28–30.
Robinson, A. (2005) Landfill leachate treatment. MBR5, Cranfield University,January 2005.
Seo, G.T., Moon, B.H., Lee, T.S., Lim, T.J. and Kim, I.S. (2002) Non-woven fabric fil-ter separation activated sludge reactor for domestic wastewater reclamation. WaterSci. Technol., 47, 133–138.
ZEK (2004) Project references: technologies, products, companies; North Rhine-Westphalian water management industry, Report by Zentrum für Entsorgungstechnikund Kreislaufwirtschaft (Centre for Waste Disposal Technologies and Recycling), VVA,Dusseldorf.
Commercial technologies 205
1856174817_Ch04.qxd 6/5/06 12:15 PM Page 205

This page intentionally left blank
Chapter 5
Case Studies
With acknowledgements to:
Sections 5.2.1.1 Silas Warren Wessex Water, UKand 5.2.1.2 Steve Churchouse –
Section 5.2.1.4 Dennis Livingstone Enviroquip, Inc., USABerinda Ross Water Environment Federation, USARunning Springs Adapted with permission fromplant data and “Membrane Systems for Wastewaterphotographs Treatment”, Copyright © 2006 Water
Environment Federation: Alexandria,Virginia
Section 5.2.2.1 Paul Zuber Brightwater Engineering, UK
Section 5.2.2.2 Paul Zuber Brightwater Engineering, UKHalfway plant Reproduced by permission of Corkphotograph County Council
Section 5.2.3 Paddy McGuinness Colloide Engineering Systems, Northern Ireland
Section 5.2.4 Torsten Hackner Hans Huber AG, Germany
Section 5.2.5 Shanshan Chou, Industrial Technology ResearchWang-Kuan Chang Institute, Taiwan
Section 5.2.6 Marc Fayaerts Keppel Seghers, BelgiumDerek Rodman Naston, UKJan Willem Mulder Water Authority Hollandse Delta
Photographs reproduced by permissionof Water Authority Hollandse Delta
Section 5.2.6.1 Marc Fayaerts Keppel Seghers, Belgium
Section 5.3.1 Nicholas David, – Anjou Recherche, Generale des Eaux,Jean Christophe FranceSchrotter
1856174817_Ch05.qxd 6/6/06 5:12 PM Page 207
Section 5.3.1.2 Luca Belli, Zenon Environmental Inc, ItalySandro Monti ASM, ItalyTullioMontagnoli
Section 5.3.1.3 Christoph Brepols Erftverband, Germany
Section 5.3.1.4 Enrico Vonghia, Zenon Environmental Inc, CanadaJeff Peters
Section 5.3.1.5 Shanshan Chou, Industrial Technology ResearchWang-Kuan Chang Institute, TaiwanChen-Hung Ni Green Environmental Technology Co,
Ltd, Taiwan
Section 5.3.2.2 John Minnery GE Water and Process Technologies,USA
Sections 5.3.3.1 Nathan Haralson, Siemens Water Technologies – Memcorand 5.3.3.2 Ed Jordan, Products, USA
Scott Pallwitz
Sections 5.3.4.1 Klaus Vossenkaul Koch Membrane Systems GmbH,and 5.3.4.2 Germany
Section 5.3.5 Atsuo Kubota Microza Division, Asahi KaseiChemicals Corporation, Japan
Section 5.4.1 Ronald van’t Oever Norit X-Flow BV, Netherlands
Sections 5.4.2.1, Steve Goodwin Aquabio Ltd, UKto 5.4.2.3
Sections 5.4.3 Gunter Gehlert, Wehrle Werk AG, Germanyto 5.4.3.4 Tony Robinson
Section 5.4.4 Ingrid Werdler Triqua BV, The NetherlandsSections 5.4.5.1 Steve Wilkes Millenniumpore, UKand 5.4.5.2
Sections 5.4.6.1 Marine Bence, Novasep Process, Orelis, Franceand 5.4.7 Sylvie Fraval
208 The MBR Book
1856174817_Ch05.qxd 6/6/06 5:12 PM Page 208
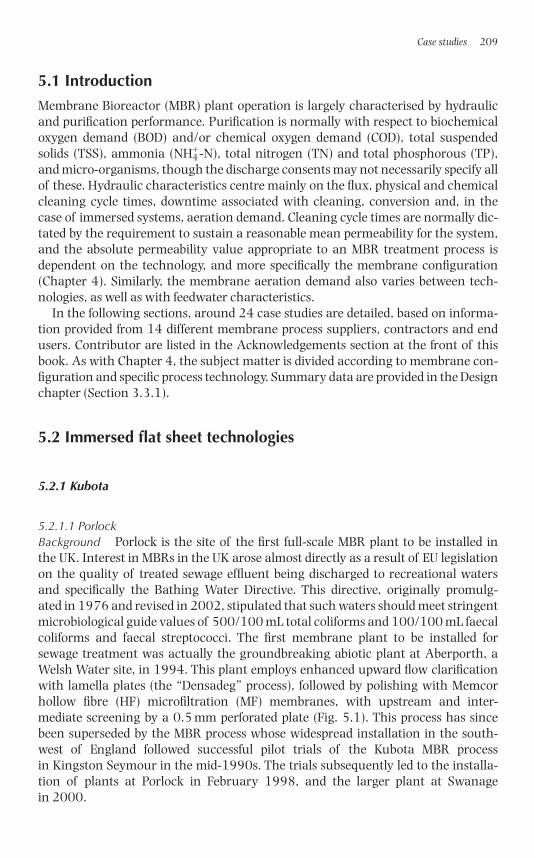
5.1 Introduction
Membrane Bioreactor (MBR) plant operation is largely characterised by hydraulicand purification performance. Purification is normally with respect to biochemicaloxygen demand (BOD) and/or chemical oxygen demand (COD), total suspendedsolids (TSS), ammonia (NH4
�-N), total nitrogen (TN) and total phosphorous (TP),and micro-organisms, though the discharge consents may not necessarily specify allof these. Hydraulic characteristics centre mainly on the flux, physical and chemicalcleaning cycle times, downtime associated with cleaning, conversion and, in thecase of immersed systems, aeration demand. Cleaning cycle times are normally dic-tated by the requirement to sustain a reasonable mean permeability for the system,and the absolute permeability value appropriate to an MBR treatment process isdependent on the technology, and more specifically the membrane configuration(Chapter 4). Similarly, the membrane aeration demand also varies between tech-nologies, as well as with feedwater characteristics.
In the following sections, around 24 case studies are detailed, based on informa-tion provided from 14 different membrane process suppliers, contractors and endusers. Contributor are listed in the Acknowledgements section at the front of thisbook. As with Chapter 4, the subject matter is divided according to membrane con-figuration and specific process technology. Summary data are provided in the Designchapter (Section 3.3.1).
5.2 Immersed flat sheet technologies
5.2.1 Kubota
5.2.1.1 PorlockBackground Porlock is the site of the first full-scale MBR plant to be installed inthe UK. Interest in MBRs in the UK arose almost directly as a result of EU legislationon the quality of treated sewage effluent being discharged to recreational watersand specifically the Bathing Water Directive. This directive, originally promulg-ated in 1976 and revised in 2002, stipulated that such waters should meet stringentmicrobiological guide values of 500/100 mL total coliforms and 100/100 mL faecalcoliforms and faecal streptococci. The first membrane plant to be installed forsewage treatment was actually the groundbreaking abiotic plant at Aberporth, aWelsh Water site, in 1994. This plant employs enhanced upward flow clarificationwith lamella plates (the “Densadeg” process), followed by polishing with Memcorhollow fibre (HF) microfiltration (MF) membranes, with upstream and inter-mediate screening by a 0.5 mm perforated plate (Fig. 5.1). This process has sincebeen superseded by the MBR process whose widespread installation in the south-west of England followed successful pilot trials of the Kubota MBR processin Kingston Seymour in the mid-1990s. The trials subsequently led to the installa-tion of plants at Porlock in February 1998, and the larger plant at Swanage in 2000.
Case studies 209
1856174817_Ch05.qxd 6/6/06 5:12 PM Page 209
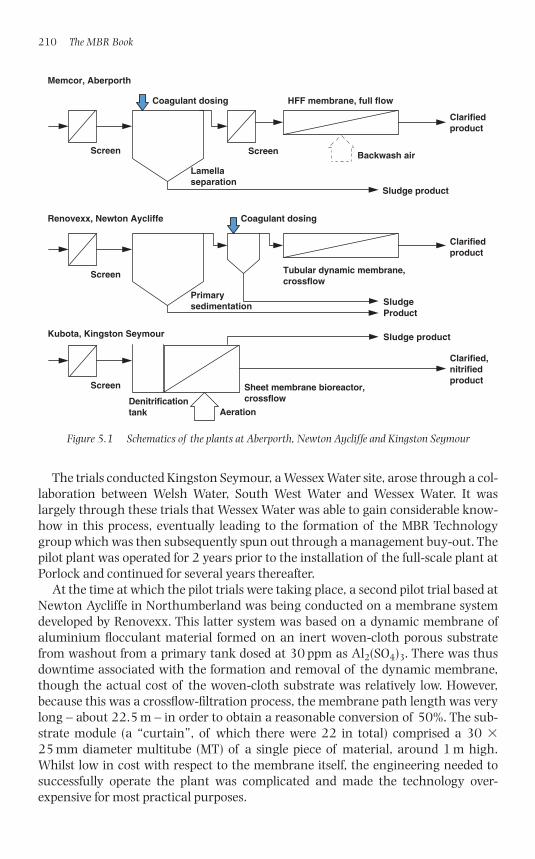
The trials conducted Kingston Seymour, a Wessex Water site, arose through a col-laboration between Welsh Water, South West Water and Wessex Water. It waslargely through these trials that Wessex Water was able to gain considerable know-how in this process, eventually leading to the formation of the MBR Technologygroup which was then subsequently spun out through a management buy-out. Thepilot plant was operated for 2 years prior to the installation of the full-scale plant atPorlock and continued for several years thereafter.
At the time at which the pilot trials were taking place, a second pilot trial based atNewton Aycliffe in Northumberland was being conducted on a membrane systemdeveloped by Renovexx. This latter system was based on a dynamic membrane ofaluminium flocculant material formed on an inert woven-cloth porous substratefrom washout from a primary tank dosed at 30 ppm as Al2(SO4)3. There was thusdowntime associated with the formation and removal of the dynamic membrane,though the actual cost of the woven-cloth substrate was relatively low. However,because this was a crossflow-filtration process, the membrane path length was verylong – about 22.5 m – in order to obtain a reasonable conversion of 50%. The sub-strate module (a “curtain”, of which there were 22 in total) comprised a 30 �25 mm diameter multitube (MT) of a single piece of material, around 1 m high.Whilst low in cost with respect to the membrane itself, the engineering needed tosuccessfully operate the plant was complicated and made the technology over-expensive for most practical purposes.
210 The MBR Book
Renovexx, Newton Aycliffe
Clarifiedproduct
Coagulant dosing
SludgeProduct
Primarysedimentation
Tubular dynamic membrane,crossflow
Kubota, Kingston Seymour
Clarified,nitrifiedproduct
Aeration
Sludge product
Sheet membrane bioreactor,crossflow
Screen
Denitrificationtank
Memcor, Aberporth
Clarifiedproduct
Backwash air
Coagulant dosing
Sludge product
Lamellaseparation
HFF membrane, full flow
Screen Screen
Screen
Figure 5.1 Schematics of the plants at Aberporth, Newton Aycliffe and Kingston Seymour
1856174817_Ch05.qxd 6/6/06 5:12 PM Page 210
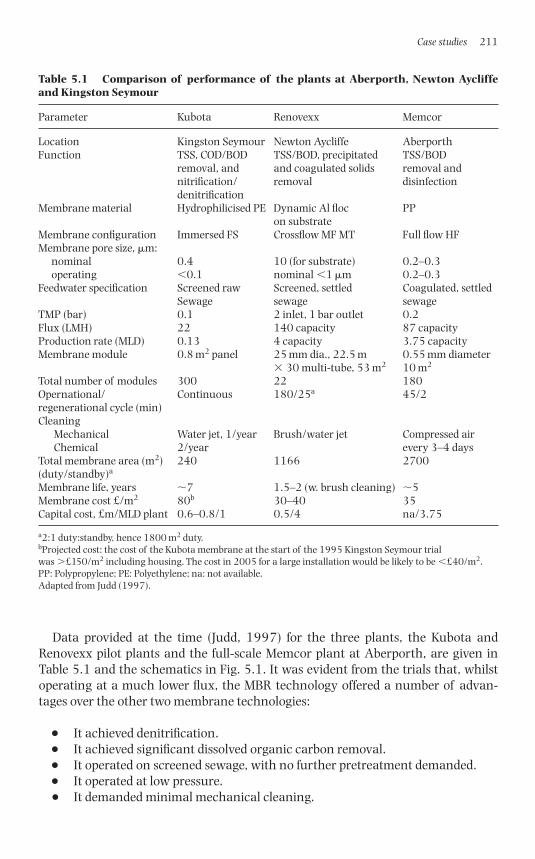
Data provided at the time (Judd, 1997) for the three plants, the Kubota andRenovexx pilot plants and the full-scale Memcor plant at Aberporth, are given inTable 5.1 and the schematics in Fig. 5.1. It was evident from the trials that, whilstoperating at a much lower flux, the MBR technology offered a number of advan-tages over the other two membrane technologies:
● It achieved denitrification.● It achieved significant dissolved organic carbon removal.● It operated on screened sewage, with no further pretreatment demanded.● It operated at low pressure.● It demanded minimal mechanical cleaning.
Case studies 211
Table 5.1 Comparison of performance of the plants at Aberporth, Newton Aycliffeand Kingston Seymour
Parameter Kubota Renovexx Memcor
Location Kingston Seymour Newton Aycliffe AberporthFunction TSS, COD/BOD TSS/BOD, precipitated TSS/BOD
removal, and and coagulated solids removal andnitrification/ removal disinfectiondenitrification
Membrane material Hydrophilicised PE Dynamic Al floc PPon substrate
Membrane configuration Immersed FS Crossflow MF MT Full flow HFMembrane pore size, �m:
nominal 0.4 10 (for substrate) 0.2–0.3operating �0.1 nominal �1 �m 0.2–0.3
Feedwater specification Screened raw Screened, settled Coagulated, settledSewage sewage sewage
TMP (bar) 0.1 2 inlet, 1 bar outlet 0.2Flux (LMH) 22 140 capacity 87 capacityProduction rate (MLD) 0.13 4 capacity 3.75 capacityMembrane module 0.8 m2 panel 25 mm dia., 22.5 m 0.55 mm diameter
� 30 multi-tube, 53 m2 10 m2
Total number of modules 300 22 180Opernational/ Continuous 180/25a 45/2regenerational cycle (min)Cleaning
Mechanical Water jet, 1/year Brush/water jet Compressed airChemical 2/year every 3–4 days
Total membrane area (m2) 240 1166 2700(duty/standby)a
Membrane life, years �7 1.5–2 (w. brush cleaning) �5Membrane cost £/m2 80b 30–40 35Capital cost, £m/MLD plant 0.6–0.8/1 0.5/4 na/3.75
a2:1 duty:standby, hence 1800 m2 duty.bProjected cost: the cost of the Kubota membrane at the start of the 1995 Kingston Seymour trialwas �£150/m2 including housing. The cost in 2005 for a large installation would be likely to be �£40/m2.PP: Polypropylene; PE: Polyethylene; na: not available.Adapted from Judd (1997).
1856174817_Ch05.qxd 6/6/06 5:12 PM Page 211
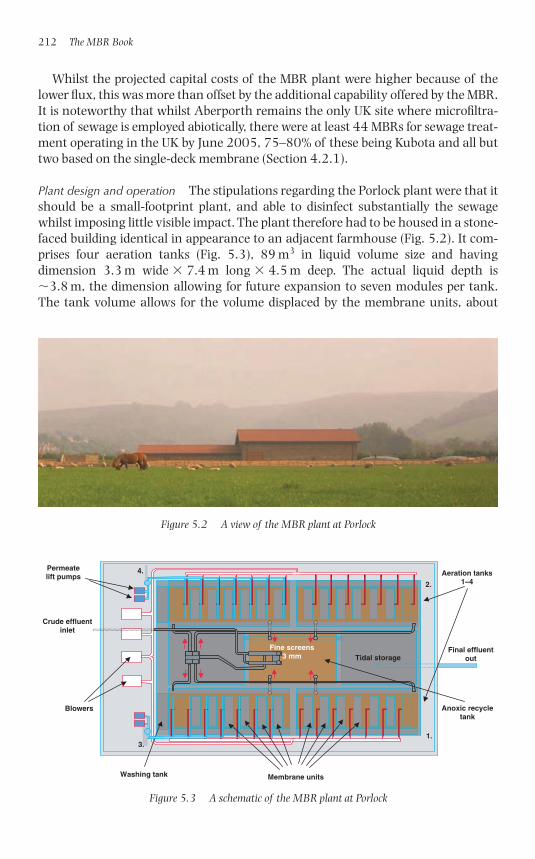
Whilst the projected capital costs of the MBR plant were higher because of thelower flux, this was more than offset by the additional capability offered by the MBR.It is noteworthy that whilst Aberporth remains the only UK site where microfiltra-tion of sewage is employed abiotically, there were at least 44 MBRs for sewage treat-ment operating in the UK by June 2005, 75–80% of these being Kubota and all buttwo based on the single-deck membrane (Section 4.2.1).
Plant design and operation The stipulations regarding the Porlock plant were that itshould be a small-footprint plant, and able to disinfect substantially the sewagewhilst imposing little visible impact. The plant therefore had to be housed in a stone-faced building identical in appearance to an adjacent farmhouse (Fig. 5.2). It com-prises four aeration tanks (Fig. 5.3), 89 m3 in liquid volume size and havingdimension 3.3 m wide � 7.4 m long � 4.5 m deep. The actual liquid depth is�3.8 m, the dimension allowing for future expansion to seven modules per tank.The tank volume allows for the volume displaced by the membrane units, about
212 The MBR Book
Figure 5.2 A view of the MBR plant at Porlock
Tidal storage
Blowers
Permeatelift pumps Aeration tanks
1–4
Anoxic recycletank
1.
2.
3.
4.
Membrane units
Final effluentout
Crude effluentinlet
Fine screens3 mm
Washing tank
Figure 5.3 A schematic of the MBR plant at Porlock
1856174817_Ch05.qxd 6/6/06 5:12 PM Page 212
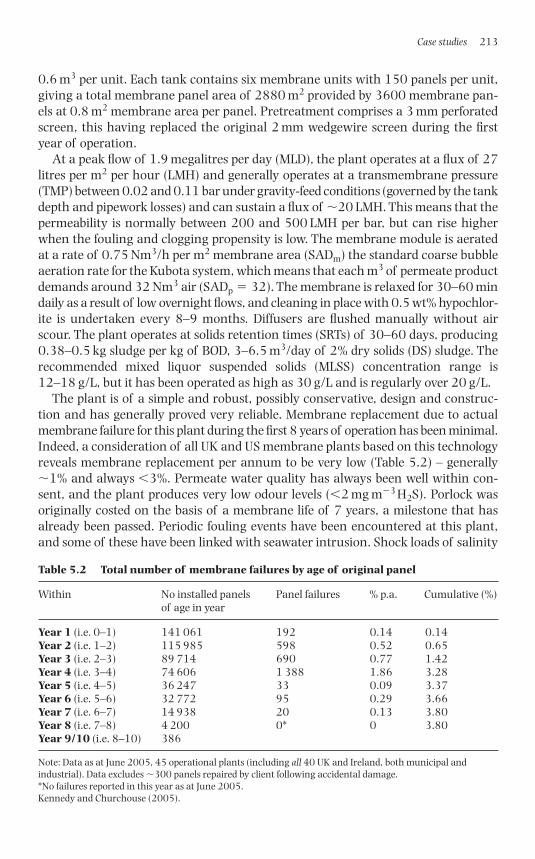
0.6 m3 per unit. Each tank contains six membrane units with 150 panels per unit,giving a total membrane panel area of 2880 m2 provided by 3600 membrane pan-els at 0.8 m2 membrane area per panel. Pretreatment comprises a 3 mm perforatedscreen, this having replaced the original 2 mm wedgewire screen during the firstyear of operation.
At a peak flow of 1.9 megalitres per day (MLD), the plant operates at a flux of 27litres per m2 per hour (LMH) and generally operates at a transmembrane pressure(TMP) between 0.02 and 0.11 bar under gravity-feed conditions (governed by the tankdepth and pipework losses) and can sustain a flux of �20 LMH. This means that thepermeability is normally between 200 and 500 LMH per bar, but can rise higherwhen the fouling and clogging propensity is low. The membrane module is aeratedat a rate of 0.75 Nm3/h per m2 membrane area (SADm) the standard coarse bubbleaeration rate for the Kubota system, which means that each m3 of permeate productdemands around 32 Nm3 air (SADp � 32). The membrane is relaxed for 30–60 mindaily as a result of low overnight flows, and cleaning in place with 0.5 wt% hypochlor-ite is undertaken every 8–9 months. Diffusers are flushed manually without airscour. The plant operates at solids retention times (SRTs) of 30–60 days, producing0.38–0.5 kg sludge per kg of BOD, 3–6.5 m3/day of 2% dry solids (DS) sludge. Therecommended mixed liquor suspended solids (MLSS) concentration range is12–18 g/L, but it has been operated as high as 30 g/L and is regularly over 20 g/L.
The plant is of a simple and robust, possibly conservative, design and construc-tion and has generally proved very reliable. Membrane replacement due to actualmembrane failure for this plant during the first 8 years of operation has been minimal.Indeed, a consideration of all UK and US membrane plants based on this technologyreveals membrane replacement per annum to be very low (Table 5.2) – generally�1% and always �3%. Permeate water quality has always been well within con-sent, and the plant produces very low odour levels (�2 mg m�3 H2S). Porlock wasoriginally costed on the basis of a membrane life of 7 years, a milestone that hasalready been passed. Periodic fouling events have been encountered at this plant,and some of these have been linked with seawater intrusion. Shock loads of salinity
Case studies 213
Table 5.2 Total number of membrane failures by age of original panel
Within No installed panels Panel failures % p.a. Cumulative (%)of age in year
Year 1 (i.e. 0–1) 141 061 192 0.14 0.14Year 2 (i.e. 1–2) 115 985 598 0.52 0.65Year 3 (i.e. 2–3) 89 714 690 0.77 1.42Year 4 (i.e. 3–4) 74 606 1 388 1.86 3.28Year 5 (i.e. 4–5) 36 247 33 0.09 3.37Year 6 (i.e. 5–6) 32 772 95 0.29 3.66Year 7 (i.e. 6–7) 14 938 20 0.13 3.80Year 8 (i.e. 7–8) 4 200 0* 0 3.80Year 9/10 (i.e. 8–10) 386
Note: Data as at June 2005, 45 operational plants (including all 40 UK and Ireland, both municipal and industrial). Data excludes �300 panels repaired by client following accidental damage.*No failures reported in this year as at June 2005.Kennedy and Churchouse (2005).
1856174817_Ch05.qxd 6/6/06 5:12 PM Page 213
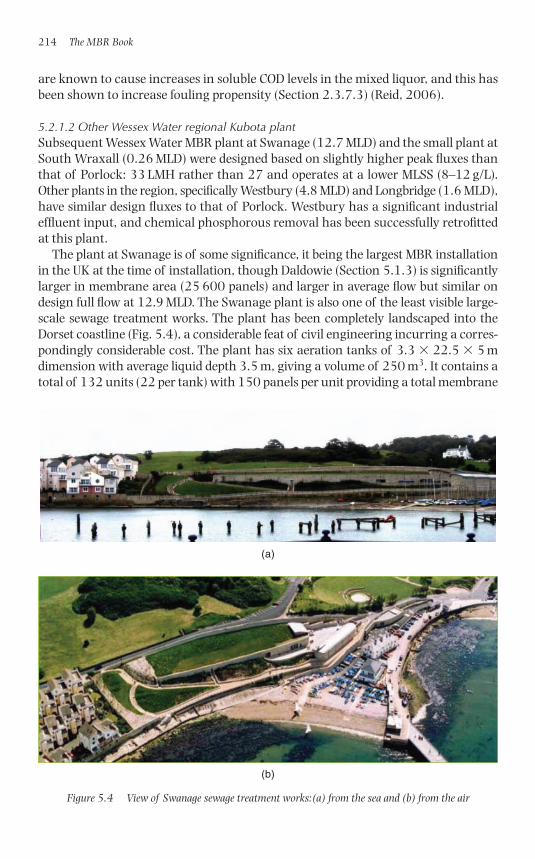
are known to cause increases in soluble COD levels in the mixed liquor, and this hasbeen shown to increase fouling propensity (Section 2.3.7.3) (Reid, 2006).
5.2.1.2 Other Wessex Water regional Kubota plantSubsequent Wessex Water MBR plant at Swanage (12.7 MLD) and the small plant atSouth Wraxall (0.26 MLD) were designed based on slightly higher peak fluxes thanthat of Porlock: 33 LMH rather than 27 and operates at a lower MLSS (8–12 g/L).Other plants in the region, specifically Westbury (4.8 MLD) and Longbridge (1.6 MLD),have similar design fluxes to that of Porlock. Westbury has a significant industrialeffluent input, and chemical phosphorous removal has been successfully retrofittedat this plant.
The plant at Swanage is of some significance, it being the largest MBR installationin the UK at the time of installation, though Daldowie (Section 5.1.3) is significantlylarger in membrane area (25 600 panels) and larger in average flow but similar ondesign full flow at 12.9 MLD. The Swanage plant is also one of the least visible large-scale sewage treatment works. The plant has been completely landscaped into theDorset coastline (Fig. 5.4), a considerable feat of civil engineering incurring a corres-pondingly considerable cost. The plant has six aeration tanks of 3.3 � 22.5 � 5 mdimension with average liquid depth 3.5 m, giving a volume of 250 m3. It contains atotal of 132 units (22 per tank) with 150 panels per unit providing a total membrane
214 The MBR Book
(a)
(b)
Figure 5.4 View of Swanage sewage treatment works:(a) from the sea and (b) from the air
1856174817_Ch05.qxd 6/6/06 5:12 PM Page 214
area of 15 840 m2. This plant operates under similar aeration conditions as that ofPorlock and also operates with manual diffuser flushing with no diffuser air-scour.
The most recent Kubota MBR plants installed for sewage treatment in the UK havean automated diffuser maintenance programme, whereby they are periodically flushedwith water and air-scoured. It is generally recognised by the operator that these plantsrequire careful maintenance to suppress clogging (or sludging), since the filling of thechannels with sludge represents a very significant constraint to the viable operation ofthese plant. To this end, more conservative peak fluxes of 27 LMH appear to be appro-priate, though mean operating fluxes are much lower, coupled with rigorously cleanedaerators to maintain the aeration rate, and thus air-scour, in the membrane flowchannels.
5.2.1.3 DaldowieSludge liquor and treatment The plant at Daldowie is a sludge liquor treatment plantowned and operated by Scottish Water. Sludge liquor is the aqueous fraction ofsewage sludge which has undergone dewatering by processes such as belt pressing,rotary drum vacuum filtration and centrifugation following conditioning with coag-ulant and/or polymeric flocculant reagents. It may contain up to 25% of the TN loadin the original sludge and contribute as little as 2% of the total influent flow. It is thushighly concentrated in ammonia (Table 5.3), as well as in dissolved organic matter.Composition and flow are extremely variable and dependent on the upstream sludgehandling and treatment processes. Whilst the most economical option is to returnthe liquor to the head of works, this is not always possible either due to logistical lim-itations or due to the excessive load it would place on the existing sewage treatmentprocess. Under such circumstances, a number of options for its treatment can be con-sidered (Table 5.4). Of key importance in choosing the most suitable option are confi-dence in a robust solution, cost and environmental factors such as the impact of thewastes generated. Speed of start-up may also be of importance if the plant will onlyrun seasonally.
Plant design and operation As is often the case for this duty, the choice of technologyat Daldowie was seen as being between a sequencing batch reactor (SBR) and anMBR. However, the large fluctuations in organic loading arising from periodicalreleases of poor-quality effluent from the centrifuges and the belt presses meant thatoperation of an SBR was seen as being more problematic than the MBR. This was
Case studies 215
Table 5.3 Sludge liquor properties
Parameter Average concentration Range (mg/L)(mg/L)
BOD 1221 162–3004COD 941 470–1411NH4-N 750 162–1218SS 1442 50–5000Alkalinity 2200 1900–2500pH 7.2 7–7.5
1856174817_Ch05.qxd 6/6/06 5:12 PM Page 215
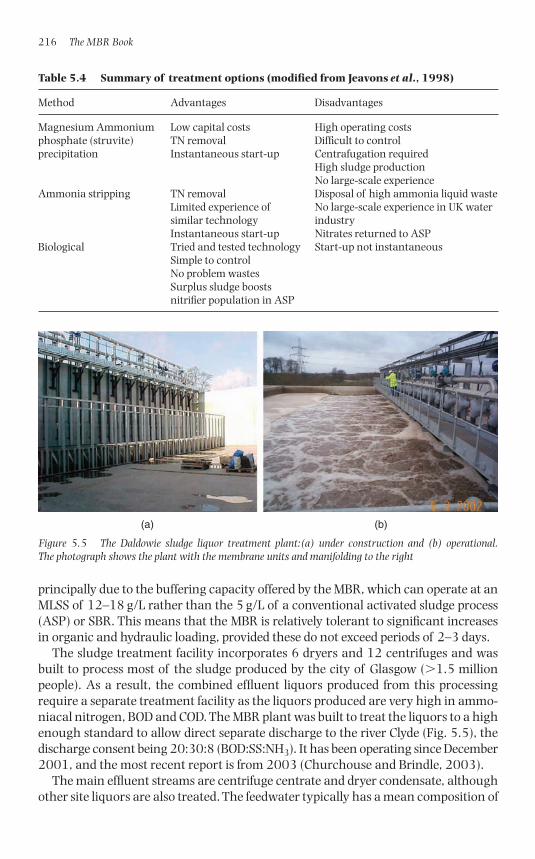
principally due to the buffering capacity offered by the MBR, which can operate at anMLSS of 12–18 g/L rather than the 5 g/L of a conventional activated sludge process(ASP) or SBR. This means that the MBR is relatively tolerant to significant increasesin organic and hydraulic loading, provided these do not exceed periods of 2–3 days.
The sludge treatment facility incorporates 6 dryers and 12 centrifuges and wasbuilt to process most of the sludge produced by the city of Glasgow (�1.5 millionpeople). As a result, the combined effluent liquors produced from this processingrequire a separate treatment facility as the liquors produced are very high in ammo-niacal nitrogen, BOD and COD. The MBR plant was built to treat the liquors to a highenough standard to allow direct separate discharge to the river Clyde (Fig. 5.5), thedischarge consent being 20:30:8 (BOD:SS:NH3). It has been operating since December2001, and the most recent report is from 2003 (Churchouse and Brindle, 2003).
The main effluent streams are centrifuge centrate and dryer condensate, althoughother site liquors are also treated. The feedwater typically has a mean composition of
216 The MBR Book
Table 5.4 Summary of treatment options (modified from Jeavons et al., 1998)
Method Advantages Disadvantages
Magnesium Ammonium Low capital costs High operating costs phosphate (struvite) TN removal Difficult to controlprecipitation Instantaneous start-up Centrafugation required
High sludge productionNo large-scale experience
Ammonia stripping TN removal Disposal of high ammonia liquid wasteLimited experience of No large-scale experience in UK watersimilar technology industryInstantaneous start-up Nitrates returned to ASP
Biological Tried and tested technology Start-up not instantaneousSimple to controlNo problem wastesSurplus sludge boosts nitrifier population in ASP
(a) (b)
Figure 5.5 The Daldowie sludge liquor treatment plant:(a) under construction and (b) operational. The photograph shows the plant with the membrane units and manifolding to the right
1856174817_Ch05.qxd 6/6/06 5:12 PM Page 216
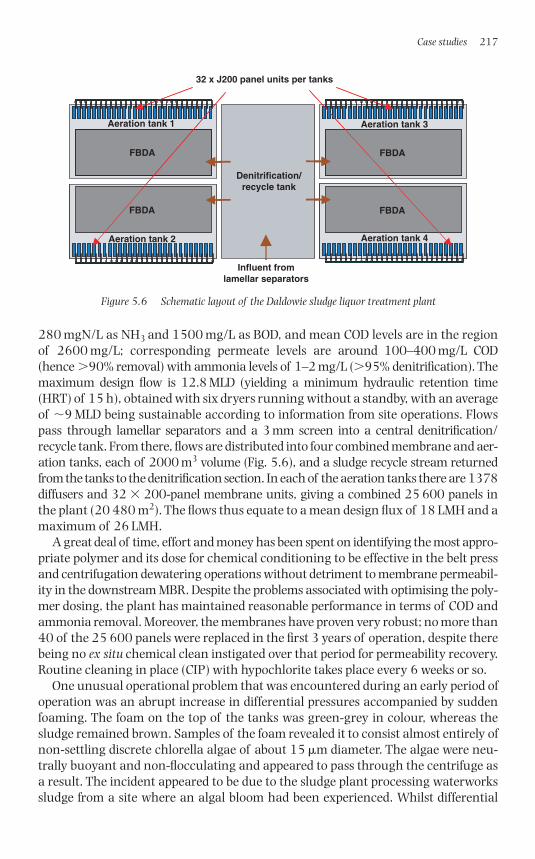
280 mgN/L as NH3 and 1500 mg/L as BOD, and mean COD levels are in the regionof 2600 mg/L; corresponding permeate levels are around 100–400 mg/L COD(hence �90% removal) with ammonia levels of 1–2 mg/L (�95% denitrification). Themaximum design flow is 12.8 MLD (yielding a minimum hydraulic retention time(HRT) of 15 h), obtained with six dryers running without a standby, with an averageof �9 MLD being sustainable according to information from site operations. Flowspass through lamellar separators and a 3 mm screen into a central denitrification/recycle tank. From there, flows are distributed into four combined membrane and aer-ation tanks, each of 2000 m3 volume (Fig. 5.6), and a sludge recycle stream returnedfrom the tanks to the denitrification section. In each of the aeration tanks there are 1378diffusers and 32 � 200-panel membrane units, giving a combined 25 600 panels inthe plant (20 480 m2). The flows thus equate to a mean design flux of 18 LMH and amaximum of 26 LMH.
A great deal of time, effort and money has been spent on identifying the most appro-priate polymer and its dose for chemical conditioning to be effective in the belt pressand centrifugation dewatering operations without detriment to membrane permeabil-ity in the downstream MBR. Despite the problems associated with optimising the poly-mer dosing, the plant has maintained reasonable performance in terms of COD andammonia removal. Moreover, the membranes have proven very robust; no more than40 of the 25 600 panels were replaced in the first 3 years of operation, despite therebeing no ex situ chemical clean instigated over that period for permeability recovery.Routine cleaning in place (CIP) with hypochlorite takes place every 6 weeks or so.
One unusual operational problem that was encountered during an early period ofoperation was an abrupt increase in differential pressures accompanied by suddenfoaming. The foam on the top of the tanks was green-grey in colour, whereas thesludge remained brown. Samples of the foam revealed it to consist almost entirely ofnon-settling discrete chlorella algae of about 15 �m diameter. The algae were neu-trally buoyant and non-flocculating and appeared to pass through the centrifuge asa result. The incident appeared to be due to the sludge plant processing waterworkssludge from a site where an algal bloom had been experienced. Whilst differential
Case studies 217
Aeration tan k 2 Aeration tank 4
FBDA
FBDA
FBDA
Influent fromlamellar separators
Denitrification/recycle tank
Aeration tank 1
Aeration tank 2
Aeration tank 3
Aeration tank 4
32 x J200 panel units per tanks
FBDA
FBDAFBDA
Figure 5.6 Schematic layout of the Daldowie sludge liquor treatment plant
1856174817_Ch05.qxd 6/6/06 5:12 PM Page 217
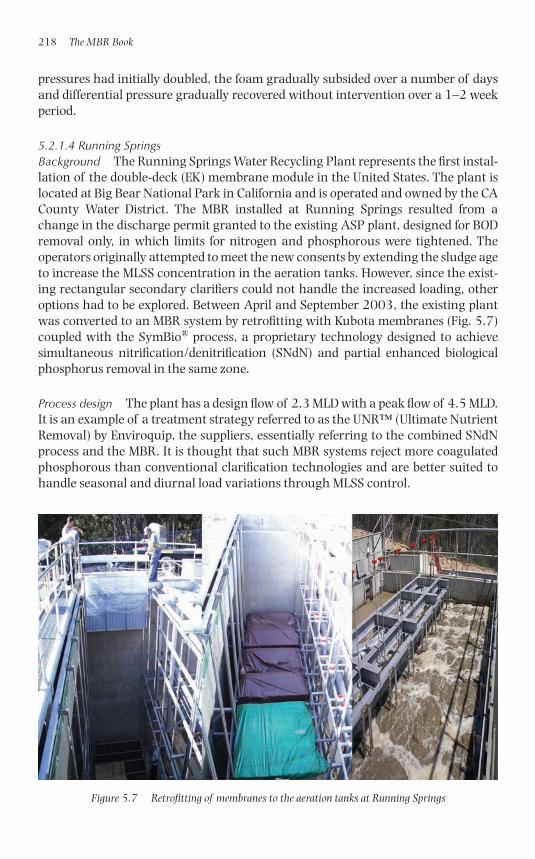
pressures had initially doubled, the foam gradually subsided over a number of daysand differential pressure gradually recovered without intervention over a 1–2 weekperiod.
5.2.1.4 Running SpringsBackground The Running Springs Water Recycling Plant represents the first instal-lation of the double-deck (EK) membrane module in the United States. The plant islocated at Big Bear National Park in California and is operated and owned by the CACounty Water District. The MBR installed at Running Springs resulted from achange in the discharge permit granted to the existing ASP plant, designed for BODremoval only, in which limits for nitrogen and phosphorous were tightened. Theoperators originally attempted to meet the new consents by extending the sludge ageto increase the MLSS concentration in the aeration tanks. However, since the exist-ing rectangular secondary clarifiers could not handle the increased loading, otheroptions had to be explored. Between April and September 2003, the existing plantwas converted to an MBR system by retrofitting with Kubota membranes (Fig. 5.7)coupled with the SymBio® process, a proprietary technology designed to achievesimultaneous nitrification/denitrification (SNdN) and partial enhanced biologicalphosphorus removal in the same zone.
Process design The plant has a design flow of 2.3 MLD with a peak flow of 4.5 MLD.It is an example of a treatment strategy referred to as the UNR™ (Ultimate NutrientRemoval) by Enviroquip, the suppliers, essentially referring to the combined SNdNprocess and the MBR. It is thought that such MBR systems reject more coagulatedphosphorous than conventional clarification technologies and are better suited tohandle seasonal and diurnal load variations through MLSS control.
218 The MBR Book
Figure 5.7 Retrofitting of membranes to the aeration tanks at Running Springs
1856174817_Ch05.qxd 6/6/06 5:12 PM Page 218
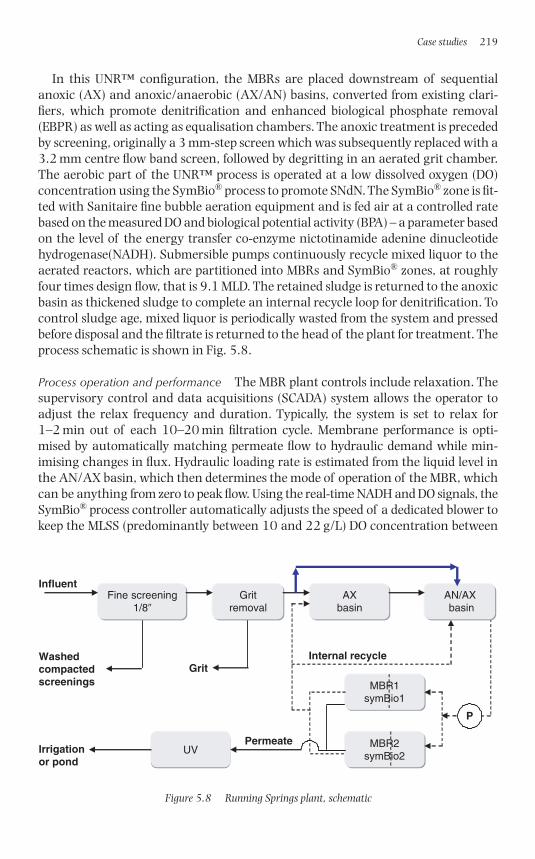
In this UNR™ configuration, the MBRs are placed downstream of sequentialanoxic (AX) and anoxic/anaerobic (AX/AN) basins, converted from existing clari-fiers, which promote denitrification and enhanced biological phosphate removal(EBPR) as well as acting as equalisation chambers. The anoxic treatment is precededby screening, originally a 3 mm-step screen which was subsequently replaced with a3.2 mm centre flow band screen, followed by degritting in an aerated grit chamber.The aerobic part of the UNR™ process is operated at a low dissolved oxygen (DO)concentration using the SymBio® process to promote SNdN. The SymBio® zone is fit-ted with Sanitaire fine bubble aeration equipment and is fed air at a controlled ratebased on the measured DO and biological potential activity (BPA) – a parameter basedon the level of the energy transfer co-enzyme nictotinamide adenine dinucleotidehydrogenase(NADH). Submersible pumps continuously recycle mixed liquor to theaerated reactors, which are partitioned into MBRs and SymBio® zones, at roughlyfour times design flow, that is 9.1 MLD. The retained sludge is returned to the anoxicbasin as thickened sludge to complete an internal recycle loop for denitrification. Tocontrol sludge age, mixed liquor is periodically wasted from the system and pressedbefore disposal and the filtrate is returned to the head of the plant for treatment. Theprocess schematic is shown in Fig. 5.8.
Process operation and performance The MBR plant controls include relaxation. Thesupervisory control and data acquisitions (SCADA) system allows the operator toadjust the relax frequency and duration. Typically, the system is set to relax for1–2 min out of each 10–20 min filtration cycle. Membrane performance is opti-mised by automatically matching permeate flow to hydraulic demand while min-imising changes in flux. Hydraulic loading rate is estimated from the liquid level inthe AN/AX basin, which then determines the mode of operation of the MBR, whichcan be anything from zero to peak flow. Using the real-time NADH and DO signals, theSymBio® process controller automatically adjusts the speed of a dedicated blower tokeep the MLSS (predominantly between 10 and 22 g/L) DO concentration between
Case studies 219
Washedcompactedscreenings
Permeate
Internal recycle
Influent
Grit
Fine screening1/8�
Gritremoval
AXbasin
AN/AX basin
MBR1symBio1
MBR2symBio2
UV
P
Irrigationor pond
Figure 5.8 Running Springs plant, schematic
1856174817_Ch05.qxd 6/6/06 5:12 PM Page 219
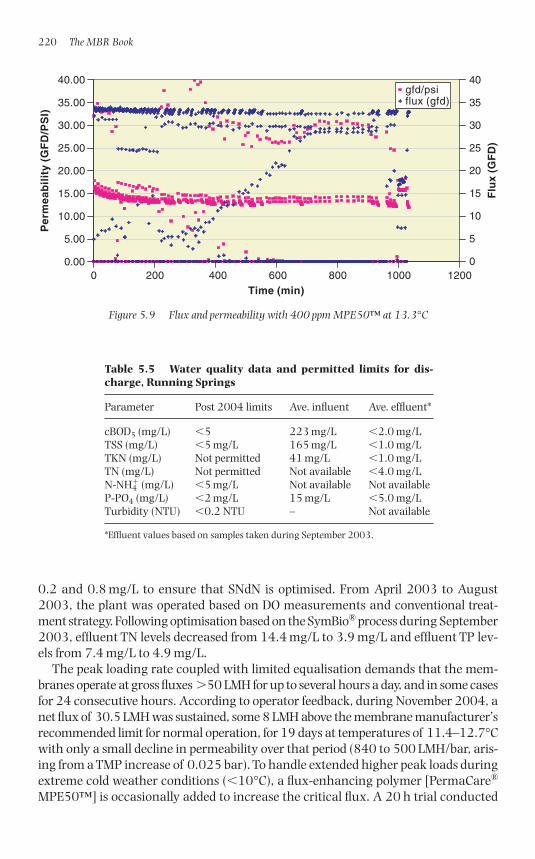
0.2 and 0.8 mg/L to ensure that SNdN is optimised. From April 2003 to August2003, the plant was operated based on DO measurements and conventional treat-ment strategy. Following optimisation based on the SymBio® process during September2003, effluent TN levels decreased from 14.4 mg/L to 3.9 mg/L and effluent TP lev-els from 7.4 mg/L to 4.9 mg/L.
The peak loading rate coupled with limited equalisation demands that the mem-branes operate at gross fluxes �50 LMH for up to several hours a day, and in some casesfor 24 consecutive hours. According to operator feedback, during November 2004, anet flux of 30.5 LMH was sustained, some 8 LMH above the membrane manufacturer’srecommended limit for normal operation, for 19 days at temperatures of 11.4–12.7°Cwith only a small decline in permeability over that period (840 to 500 LMH/bar, aris-ing from a TMP increase of 0.025 bar). To handle extended higher peak loads duringextreme cold weather conditions (�10°C), a flux-enhancing polymer [PermaCare®
MPE50™] is occasionally added to increase the critical flux. A 20 h trial conducted
220 The MBR Book
0.00
5.00
10.00
15.00
20.00
25.00
30.00
35.00
40.00
0 200 400 600 800 1000 1200Time (min)
Per
mea
bil
ity
(GF
D/P
SI)
0
5
10
15
20
25
30
35
40
Flu
x (G
FD
)
gfd/psiflux (gfd)
Figure 5.9 Flux and permeability with 400 ppm MPE50™ at 13.3°C
Table 5.5 Water quality data and permitted limits for dis-charge, Running Springs
Parameter Post 2004 limits Ave. influent Ave. effluent*
cBOD5 (mg/L) �5 223 mg/L �2.0 mg/LTSS (mg/L) �5 mg/L 165 mg/L �1.0 mg/LTKN (mg/L) Not permitted 41 mg/L �1.0 mg/LTN (mg/L) Not permitted Not available �4.0 mg/LN-NH4
� (mg/L) �5 mg/L Not available Not availableP-PO4 (mg/L) �2 mg/L 15 mg/L �5.0 mg/LTurbidity (NTU) �0.2 NTU – Not available
*Effluent values based on samples taken during September 2003.
1856174817_Ch05.qxd 6/6/06 5:12 PM Page 220
in December 2003 demonstrated that a stable net flux of around 54 LMH (32 GFD,Fig. 5.9) was achieved following the addition of 400 mg/L of the polymer. Performancewith respect to purification and system hydraulics is given in Tables 5.5 and 5.6,respectively, with the latter including a summary of the process design.
5.2.2 Brightwater Engineering
5.2.2.1 Coill Dubh, IrelandBackground Coill Dubh is a small village about a 1 h drive west of Dublin. The exist-ing works consisted of basic concrete primary/septic tanks followed by peat filterbeds. Effluent was directly discharged from these peat beds to a small local river.The works was in a poor condition and, on completion of the MBR scheme, wasdemolished.
The new works (Fig. 5.10) was provided by a developer as part of his planningconsent for a housing estate close to the site. This works was to treat the sewage fromthis new estate plus the existing village. At the tender and design stage in 2001–2003,little information was available on the influent, other than it was to be mainly domesticin nature, contain storm flows, have a maximum flow to treatment of 50 m3/h andcontain loads of 2000 p.e. (population equivalent). The treated effluent consent was:BOD 10 mg/L, SS 10 mg/L, NH3 5 mg/L and total phosphorus 1 mg/L. Though thisstandard could arguably be achieved with a conventional treatment process, the smallfootprint and relatively shallow tanks afforded by the MBR process led to this technologybeing selected; the new works was to be built on a peat bog with a very high water
Case studies 221
Table 5.6 Design criteria, Running Springs
Parameters Units Current Future
Maximum month average daily flow MLD 2.3 3.8Peak day flow MLD 4.6 7.6Minimum day average process temperature °C 15 15Maximum day average process temperature °C 20 20Annual average flux LMH 25a 25Peak hour average flux LMH 50 50Membrane cassette type – EK300 EK200Number of cartridges per cassette – 150 100Surface area per cassette m2 120 120Number of cassettes installed per train – 8 16Number of MBRs (membrane tanks) – 2 2Coarse bubble aeration rate (20°C), per cartridge l/min 7.5 7.5Typical cleaning cycle time days 180 180Typical cleaning reagent – hypo hypoTypical cleaning reagent strengthb mg/L 8000 8000Typical Cleaning (soak) time/protocol h 2 2
aAssuming an operating temperature of 15°C.bAn existing sodium hypochlorite system is used that generates a 0.8% solution that isstronger than the 0.5% solution recommended by the system supplier.
1856174817_Ch05.qxd 6/6/06 5:12 PM Page 221
table, making deep excavations difficult and expensive. The simplicity of theMEMBRIGHT® design made this option competitive and attractive.
No piloting was undertaken as this influent was considered “normal” domesticsewerage based on an inland catchment with an observable existing treatmentprocess. The contract was led by the house developer MDY Construction. MDY alsosupplied the civil element to the contract based on supplied designs. The process,mechanical and electrical design element of the contract was delivered by Bord naMona Environmental and supplied by Brightwater Engineering. M&E installationwas supplied by BnM subcontractors, while process commissioning, verification andpre-handover operational support was supplied by Brightwater. The plant was com-missioned in June 2004.
Design The works (Fig. 5.11) consists of an inlet flume, followed by an overflowsump from where flows in excess of 50 m3/h are diverted to a storm tank with 2 hretention at flows between 50 and 100 m3/h. Excess flows from the storm tank dis-charge from it direct to the stream. Storm water is pumped back to the inlet sumponce works inlet flows have reduced.
Flows to treatment are dosed with ferric for phosphorous control and pumped toa 6mm free-standing wedgewire rotary screen. Flows drop from the screen into astilling zone located in a settling tank that also acts as the works sludge and scumstorage. From the stilling zone, flows pass under a fat-retaining submerged weir andonto a 3 mm drum screen. Flows are then diverted via a common manifold to fourmembrane tanks, each containing six modules. Each module provides a total effect-ive surface area of 92 m2 from 50 panels. Aeration is supplied to the modules only byduty/duty blowers. Treated effluent/permeate gravitates by siphoning from eachreactor to a common collection sump via flow measurement on each reactor. Permeate
222 The MBR Book
Figure 5.10 The Coill Dubh site. The four MBR tanks are adjacent to the lifting davits
1856174817_Ch05.qxd 6/6/06 5:12 PM Page 222
is then, on level, pumped to outfall, or can be recycled back to the inlet of the worksvia a divert valve, conducted to assist in commissioning.
Excess sludge is removed manually from each reactor via a single progressivecavity pump and discharged into the inlet sludge storage tank. Fat, scum and grit arealso collected in this tank, and the accumulated waste periodically removed fromsite. Also supplied on-site are a control/mess building, ferric storage and a standbygenerator. A remote monitoring system provides Brightwater with site feedback.
Operation and maintenance The MBR operates at a maximum TMP of 300 mbarand a gross flux of 27 LMH (hence �90 LMH/bar permeability) with relaxation for 5 min every hour. Aeration is supplied by an aeration lateral system located atthe base of each plate providing coarse-bubble aeration for both membrane scour and process aeration at a rate of up to 118 Nm3/h per module, or a SADm of1.28 Nm3/(m2 h). No additional fine bubble aeration system is required for the com-bined sewer loads supplied to Coill Dubh. Although chemical cleaning is suggestedat 12-monthly intervals, none has been applied over the first 18 months of opera-tion; the performance of the membranes is maintained with the air scour rate sup-plied. Cleaning is to be conducted ex situ by sluicing, followed by a 4–12 h soak ineither hypochlorite or citric acid, depending on the assessed fouling. Flushing of theaeration system can be conducted at the same time. The design sludge age is 21days, though this often increases to �30days such that the design MLSS concentra-tion of 12 g/L increases to �15 g/L. The HRT is �11 h at full flow.
The process at Coill Dubh was built as a low-tech approach to membrane technol-ogy and has performed better than anticipated despite periods of operational stress.The permeability remains acceptable at flux rates between 22 and 27 LMH and thepermeate water contaminant levels have consistently been below most of theparameter limits of detection (i.e. �5 mg/L BOD, �5 mg/L SS, �0.5 mg/L N-NH�
4and �0.05 mg/L TP). While the effluent quality exceeds that required for discharge,the simplicity of the system and the robustness of the membranes have made thisplant very simple to operate, despite fat and rag levels far in excess of those antici-pated. The continued operation without the requirement for chemical cleaning
Case studies 223
Storm water
Stormtank
Worksinlet Inlet
works
Ferricdosing
6 and 2 mmscreens
4 No.MBRtanks
Permeatepumpingchamber Permeate
to river
Figure 5.11 Schematic of Coill Dubh wastewater treatment works
1856174817_Ch05.qxd 6/6/06 5:12 PM Page 223
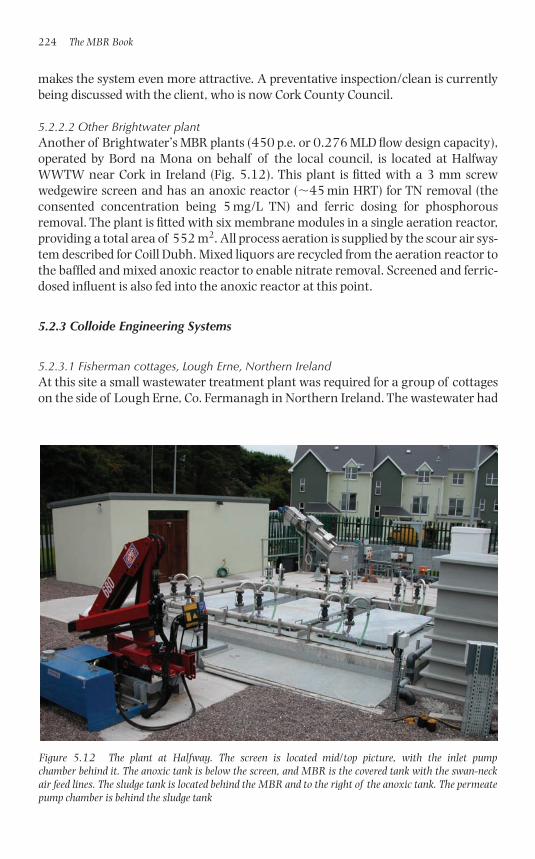
makes the system even more attractive. A preventative inspection/clean is currentlybeing discussed with the client, who is now Cork County Council.
5.2.2.2 Other Brightwater plantAnother of Brightwater’s MBR plants (450 p.e. or 0.276 MLD flow design capacity),operated by Bord na Mona on behalf of the local council, is located at HalfwayWWTW near Cork in Ireland (Fig. 5.12). This plant is fitted with a 3 mm screwwedgewire screen and has an anoxic reactor (�45 min HRT) for TN removal (theconsented concentration being 5 mg/L TN) and ferric dosing for phosphorousremoval. The plant is fitted with six membrane modules in a single aeration reactor,providing a total area of 552 m2. All process aeration is supplied by the scour air sys-tem described for Coill Dubh. Mixed liquors are recycled from the aeration reactor tothe baffled and mixed anoxic reactor to enable nitrate removal. Screened and ferric-dosed influent is also fed into the anoxic reactor at this point.
5.2.3 Colloide Engineering Systems
5.2.3.1 Fisherman cottages, Lough Erne, Northern IrelandAt this site a small wastewater treatment plant was required for a group of cottageson the side of Lough Erne, Co. Fermanagh in Northern Ireland. The wastewater had
224 The MBR Book
Figure 5.12 The plant at Halfway. The screen is located mid/top picture, with the inlet pump chamber behind it. The anoxic tank is below the screen, and MBR is the covered tank with the swan-neckair feed lines. The sludge tank is located behind the MBR and to the right of the anoxic tank. The permeatepump chamber is behind the sludge tank
1856174817_Ch05.qxd 6/6/06 5:13 PM Page 224
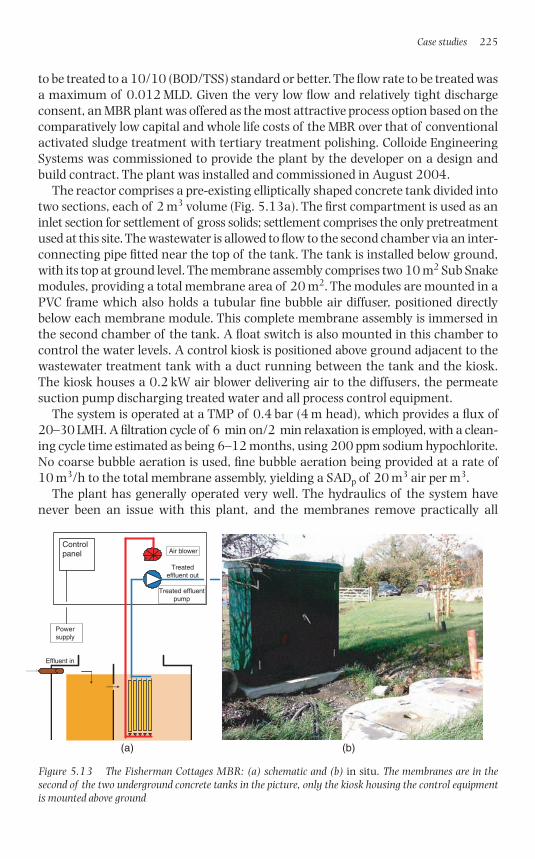
to be treated to a 10/10 (BOD/TSS) standard or better. The flow rate to be treated wasa maximum of 0.012 MLD. Given the very low flow and relatively tight dischargeconsent, an MBR plant was offered as the most attractive process option based on thecomparatively low capital and whole life costs of the MBR over that of conventionalactivated sludge treatment with tertiary treatment polishing. Colloide EngineeringSystems was commissioned to provide the plant by the developer on a design andbuild contract. The plant was installed and commissioned in August 2004.
The reactor comprises a pre-existing elliptically shaped concrete tank divided intotwo sections, each of 2 m3 volume (Fig. 5.13a). The first compartment is used as aninlet section for settlement of gross solids; settlement comprises the only pretreatmentused at this site. The wastewater is allowed to flow to the second chamber via an inter-connecting pipe fitted near the top of the tank. The tank is installed below ground,with its top at ground level. The membrane assembly comprises two 10 m2 Sub Snakemodules, providing a total membrane area of 20 m2. The modules are mounted in aPVC frame which also holds a tubular fine bubble air diffuser, positioned directlybelow each membrane module. This complete membrane assembly is immersed inthe second chamber of the tank. A float switch is also mounted in this chamber tocontrol the water levels. A control kiosk is positioned above ground adjacent to thewastewater treatment tank with a duct running between the tank and the kiosk.The kiosk houses a 0.2 kW air blower delivering air to the diffusers, the permeatesuction pump discharging treated water and all process control equipment.
The system is operated at a TMP of 0.4 bar (4 m head), which provides a flux of20–30 LMH. A filtration cycle of 6 min on/2 min relaxation is employed, with a clean-ing cycle time estimated as being 6–12 months, using 200 ppm sodium hypochlorite.No coarse bubble aeration is used, fine bubble aeration being provided at a rate of10 m3/h to the total membrane assembly, yielding a SADp of 20 m3 air per m3.
The plant has generally operated very well. The hydraulics of the system havenever been an issue with this plant, and the membranes remove practically all
Case studies 225
Air blowerControlpanel
Powersupply
(a) (b)
Effluent in
Treatedeffluent out
Treated effluentpump
Figure 5.13 The Fisherman Cottages MBR: (a) schematic and (b) in situ. The membranes are in the second of the two underground concrete tanks in the picture, only the kiosk housing the control equipmentis mounted above ground
1856174817_Ch05.qxd 6/6/06 5:13 PM Page 225
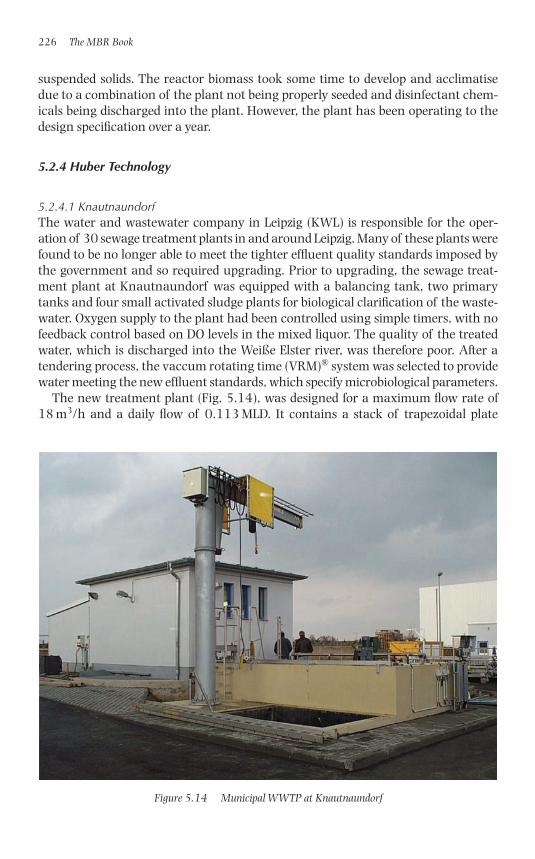
suspended solids. The reactor biomass took some time to develop and acclimatisedue to a combination of the plant not being properly seeded and disinfectant chem-icals being discharged into the plant. However, the plant has been operating to thedesign specification over a year.
5.2.4 Huber Technology
5.2.4.1 KnautnaundorfThe water and wastewater company in Leipzig (KWL) is responsible for the oper-ation of 30 sewage treatment plants in and around Leipzig. Many of these plants werefound to be no longer able to meet the tighter effluent quality standards imposed bythe government and so required upgrading. Prior to upgrading, the sewage treat-ment plant at Knautnaundorf was equipped with a balancing tank, two primarytanks and four small activated sludge plants for biological clarification of the waste-water. Oxygen supply to the plant had been controlled using simple timers, with nofeedback control based on DO levels in the mixed liquor. The quality of the treatedwater, which is discharged into the Weiße Elster river, was therefore poor. After atendering process, the vaccum rotating time (VRM)® system was selected to providewater meeting the new effluent standards, which specify microbiological parameters.
The new treatment plant (Fig. 5.14), was designed for a maximum flow rate of18 m3/h and a daily flow of 0.113 MLD. It contains a stack of trapezoidal plate
226 The MBR Book
Figure 5.14 Municipal WWTP at Knautnaundorf
1856174817_Ch05.qxd 6/6/06 5:13 PM Page 226
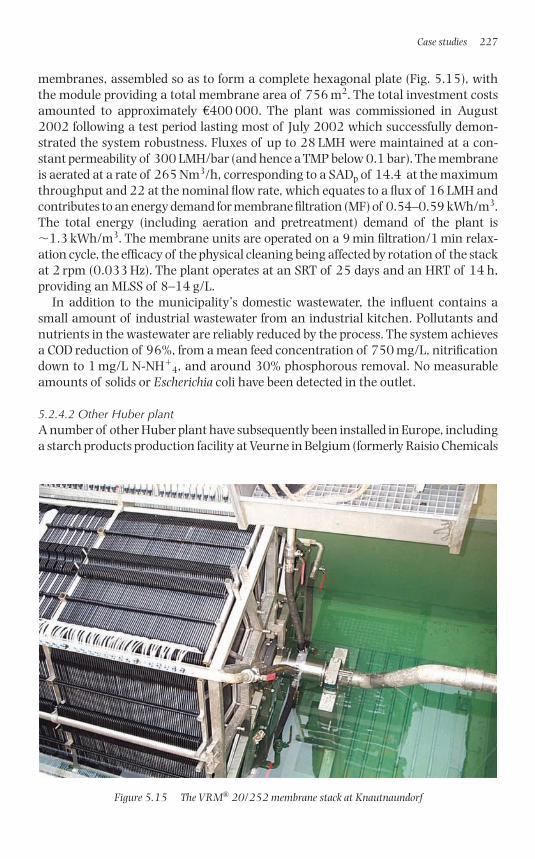
membranes, assembled so as to form a complete hexagonal plate (Fig. 5.15), withthe module providing a total membrane area of 756 m2. The total investment costsamounted to approximately €400 000. The plant was commissioned in August2002 following a test period lasting most of July 2002 which successfully demon-strated the system robustness. Fluxes of up to 28 LMH were maintained at a con-stant permeability of 300 LMH/bar (and hence a TMP below 0.1 bar). The membraneis aerated at a rate of 265 Nm3/h, corresponding to a SADp of 14.4 at the maximumthroughput and 22 at the nominal flow rate, which equates to a flux of 16 LMH andcontributes to an energy demand for membrane filtration (MF) of 0.54–0.59 kWh/m3.The total energy (including aeration and pretreatment) demand of the plant is�1.3 kWh/m3. The membrane units are operated on a 9 min filtration/1 min relax-ation cycle, the efficacy of the physical cleaning being affected by rotation of the stackat 2 rpm (0.033 Hz). The plant operates at an SRT of 25 days and an HRT of 14 h,providing an MLSS of 8–14 g/L.
In addition to the municipality’s domestic wastewater, the influent contains asmall amount of industrial wastewater from an industrial kitchen. Pollutants andnutrients in the wastewater are reliably reduced by the process. The system achievesa COD reduction of 96%, from a mean feed concentration of 750 mg/L, nitrificationdown to 1 mg/L N-NH�
4, and around 30% phosphorous removal. No measurableamounts of solids or Escherichia coli have been detected in the outlet.
5.2.4.2 Other Huber plantA number of other Huber plant have subsequently been installed in Europe, includinga starch products production facility at Veurne in Belgium (formerly Raisio Chemicals
Case studies 227
Figure 5.15 The VRM® 20/252 membrane stack at Knautnaundorf
1856174817_Ch05.qxd 6/6/06 5:13 PM Page 227
and now Ciba Speciality Chemicals) and another small municipal wastewater treatmentworks at an alpine hotel at Schwägalp railway station in Switzerland, which hasbeen in operation since April 2002. The plant at Schwägalp receives effluent from adairy as well as an hotel and a guest house. The dry weather and peak flows are 0.1 MLDand 6.5 m3/h, respectively and, as such, the plant is similar to that at Knautnaundorf(Table 5.7).
5.2.5 The Industrial Technology Research Institute non-woven fabric MBR
The NWF MBR developed by the Industrial Technology Research Institute (ITRI) ofTaiwan (Section 4.2.5) has been trialled for food processing effluent at a companymanufacturing vinegar from grains and vegetables. The wastewater has a COD ofaround 2600 mg/L, mainly soluble, and BOD, TSS and TKN concentrations of 1400,600 and 60 mg/L respectively. Additionally, the effluent has an average fats, oils andgrease (FOG) concentration of 34 g/L. The MBR was retrofitted into the existing 75 m3
square-sided SBR tank, since the latter process was found to be unable to cope withfluctuations in loading and space for expansion of the plant was limited. The mem-brane module has dimensions of 2.4 � 1.1 � 1.0 m (L � W � D), offering a total fil-tration area of 270 m2. The module was found to consistently achieve over 95% CODremoval efficiency, with �90 mg/L of COD in permeate when the influent CODwas �2935 mg/L, SS was less than 1010 mg/L and volumetric loading maintained at1.6 kg COD/m3-day. The operational flux attained was around 4.5 LMH. Two otherindustrial effluent treatment plants in Taiwan are also based on an NWF MBR.
5.2.6 Toray
Toray membranes have been employed by Keppel Seghers (Singapore–Belgium) fortheir UNIBRANE® MBR and by Naston (UK) for their package plant (Fig. 5.16). Thereare about 25 operating plant worldwide, all but three being below 0.5 MLD. Theinstallation at Heenvliet in Belgium (due early 2006) appears to be the first reference
228 The MBR Book
Table 5.7 Summary of municipal wastewater treatment data, Huber MBRs
Parameter Knautnaundorf Schwägalp
Commissioned March 2002 April 2002Dry weather flow (based on nominal flux) (MLD) 0.113 0.1Peak flow (m3/h) 18.4 6.5Number of membrane elements 1 1Total membrane area (m2) 756 270Feed COD concentration (mg/L) 750 233COD removal (%) 96 97Nominal flux (LMH) 16 13Peak flux (LMH) 25 25Permeability (LMH/bar) �300 �300SADm (m3 air/m2h) 0.35 0.35SADp (m3 air/m3)normal (peak) 22 (14) 27(14)Energy demand (kWhr/m3) 1.3 1.4
1856174817_Ch05.qxd 6/6/06 5:13 PM Page 228
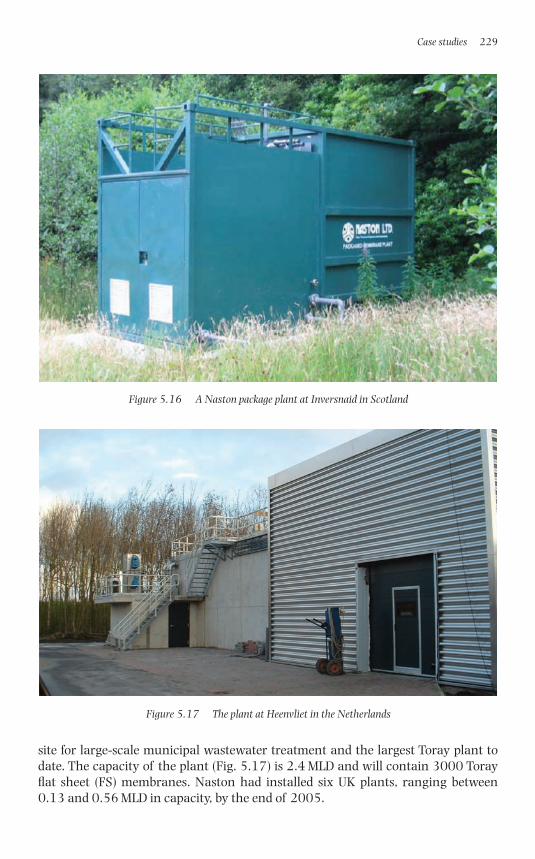
site for large-scale municipal wastewater treatment and the largest Toray plant todate. The capacity of the plant (Fig. 5.17) is 2.4 MLD and will contain 3000 Torayflat sheet (FS) membranes. Naston had installed six UK plants, ranging between0.13 and 0.56 MLD in capacity, by the end of 2005.
Case studies 229
Figure 5.16 A Naston package plant at Inversnaid in Scotland
Figure 5.17 The plant at Heenvliet in the Netherlands
1856174817_Ch05.qxd 6/6/06 5:13 PM Page 229
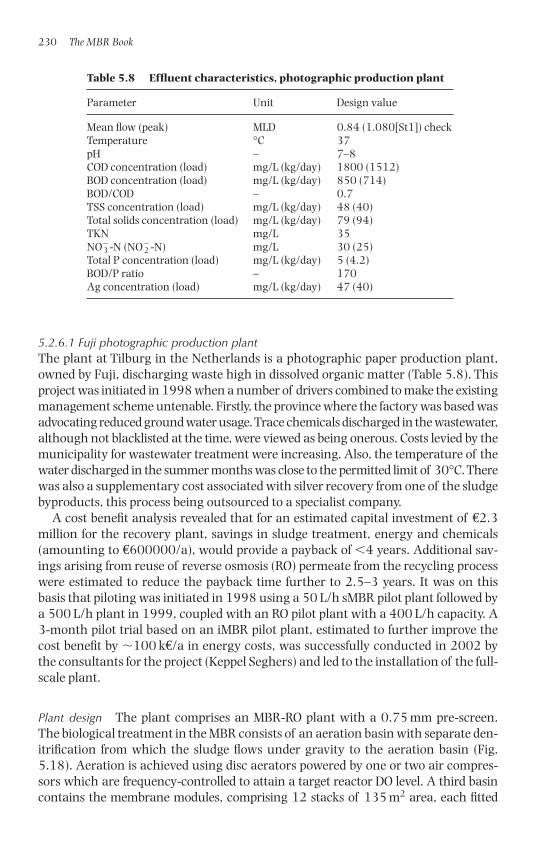
5.2.6.1 Fuji photographic production plantThe plant at Tilburg in the Netherlands is a photographic paper production plant,owned by Fuji, discharging waste high in dissolved organic matter (Table 5.8). Thisproject was initiated in 1998 when a number of drivers combined to make the existingmanagement scheme untenable. Firstly, the province where the factory was based wasadvocating reduced ground water usage. Trace chemicals discharged in the wastewater,although not blacklisted at the time, were viewed as being onerous. Costs levied by themunicipality for wastewater treatment were increasing. Also, the temperature of thewater discharged in the summer months was close to the permitted limit of 30°C. Therewas also a supplementary cost associated with silver recovery from one of the sludgebyproducts, this process being outsourced to a specialist company.
A cost benefit analysis revealed that for an estimated capital investment of €2.3million for the recovery plant, savings in sludge treatment, energy and chemicals(amounting to €600000/a), would provide a payback of �4 years. Additional sav-ings arising from reuse of reverse osmosis (RO) permeate from the recycling processwere estimated to reduce the payback time further to 2.5–3 years. It was on thisbasis that piloting was initiated in 1998 using a 50 L/h sMBR pilot plant followed bya 500 L/h plant in 1999, coupled with an RO pilot plant with a 400 L/h capacity. A3-month pilot trial based on an iMBR pilot plant, estimated to further improve thecost benefit by �100 k€/a in energy costs, was successfully conducted in 2002 bythe consultants for the project (Keppel Seghers) and led to the installation of the full-scale plant.
Plant design The plant comprises an MBR-RO plant with a 0.75 mm pre-screen.The biological treatment in the MBR consists of an aeration basin with separate den-itrification from which the sludge flows under gravity to the aeration basin (Fig.5.18). Aeration is achieved using disc aerators powered by one or two air compres-sors which are frequency-controlled to attain a target reactor DO level. A third basincontains the membrane modules, comprising 12 stacks of 135 m2 area, each fitted
230 The MBR Book
Table 5.8 Effluent characteristics, photographic production plant
Parameter Unit Design value
Mean flow (peak) MLD 0.84 (1.080[St1]) checkTemperature °C 37pH – 7–8COD concentration (load) mg/L (kg/day) 1800 (1512)BOD concentration (load) mg/L (kg/day) 850 (714)BOD/COD – 0.7TSS concentration (load) mg/L (kg/day) 48 (40)Total solids concentration (load) mg/L (kg/day) 79 (94)TKN mg/L 35NO�
3 -N (NO�2 -N) mg/L 30 (25)
Total P concentration (load) mg/L (kg/day) 5 (4.2)BOD/P ratio – 170Ag concentration (load) mg/L (kg/day) 47 (40)
1856174817_Ch05.qxd 6/6/06 5:13 PM Page 230
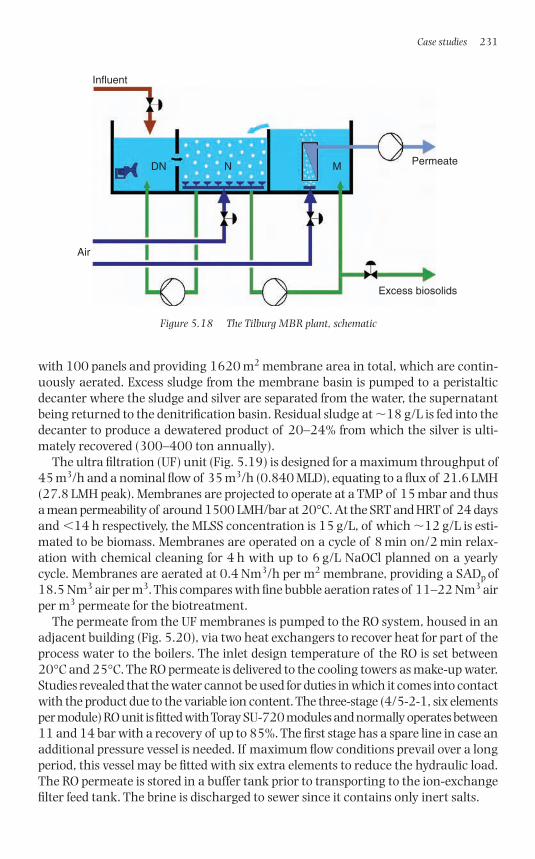
with 100 panels and providing 1620 m2 membrane area in total, which are contin-uously aerated. Excess sludge from the membrane basin is pumped to a peristalticdecanter where the sludge and silver are separated from the water, the supernatantbeing returned to the denitrification basin. Residual sludge at �18 g/L is fed into thedecanter to produce a dewatered product of 20–24% from which the silver is ulti-mately recovered (300–400 ton annually).
The ultra filtration (UF) unit (Fig. 5.19) is designed for a maximum throughput of45 m3/h and a nominal flow of 35 m3/h (0.840 MLD), equating to a flux of 21.6 LMH(27.8 LMH peak). Membranes are projected to operate at a TMP of 15 mbar and thusa mean permeability of around 1500 LMH/bar at 20°C. At the SRT and HRT of 24 daysand �14 h respectively, the MLSS concentration is 15 g/L, of which �12 g/L is esti-mated to be biomass. Membranes are operated on a cycle of 8 min on/2 min relax-ation with chemical cleaning for 4 h with up to 6 g/L NaOCl planned on a yearlycycle. Membranes are aerated at 0.4 Nm3/h per m2 membrane, providing a SADp of18.5 Nm3 air per m3. This compares with fine bubble aeration rates of 11–22 Nm3 airper m3 permeate for the biotreatment.
The permeate from the UF membranes is pumped to the RO system, housed in anadjacent building (Fig. 5.20), via two heat exchangers to recover heat for part of theprocess water to the boilers. The inlet design temperature of the RO is set between20°C and 25°C. The RO permeate is delivered to the cooling towers as make-up water.Studies revealed that the water cannot be used for duties in which it comes into contactwith the product due to the variable ion content. The three-stage (4/5-2-1, six elementsper module) RO unit is fitted with Toray SU-720 modules and normally operates between11 and 14 bar with a recovery of up to 85%. The first stage has a spare line in case anadditional pressure vessel is needed. If maximum flow conditions prevail over a longperiod, this vessel may be fitted with six extra elements to reduce the hydraulic load.The RO permeate is stored in a buffer tank prior to transporting to the ion-exchangefilter feed tank. The brine is discharged to sewer since it contains only inert salts.
Case studies 231
Permeate
Excess biosolids
Air
Influent
DN N M
Figure 5.18 The Tilburg MBR plant, schematic
1856174817_Ch05.qxd 6/6/06 5:13 PM Page 231
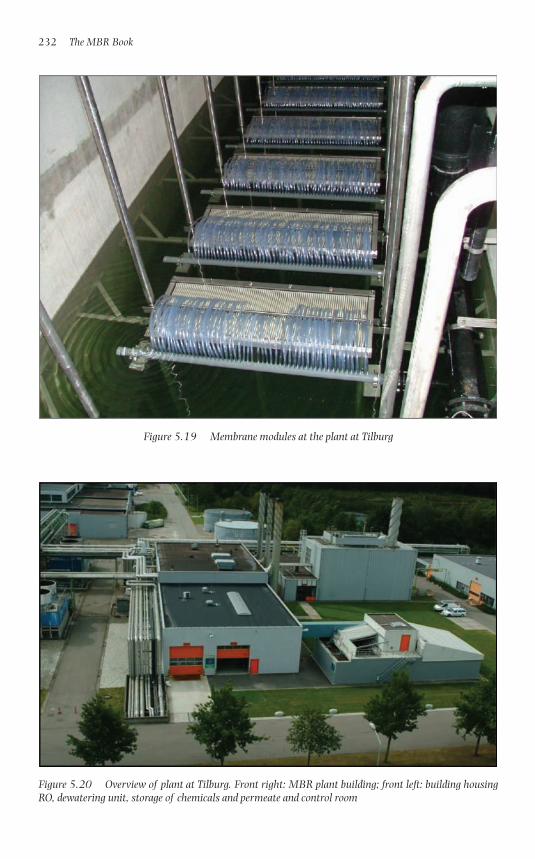
232 The MBR Book
Figure 5.19 Membrane modules at the plant at Tilburg
Figure 5.20 Overview of plant at Tilburg. Front right: MBR plant building; front left: building housingRO, dewatering unit, storage of chemicals and permeate and control room
1856174817_Ch05.qxd 6/6/06 5:13 PM Page 232
The plant is guaranteed to meet effluent concentration limits of �51 mg/L COD(�97% removal), undetectable TSS and �5 mg/L TN. Thus far, some minor teethingproblems have been experienced since commissioning. These have included foam-ing, linked to wider than expected variation in feedwater quality, and concrete ero-sion. Further improvements, and specifically automated control, are in progress.
5.2.6.2 Comparison of plant O&M dataDesign parameters for the Heenvliet and Fuji, both of which were designed by KeppelSeghers (who are also responsible for the Unibrane MBR systems in Singapore), and theNaston package plants are provided in Table 5.9. All of the six UK examples of Nastonpackage plants are operated at 6–18 (average 12) g/L MLSS. The data collated for allthree plant or plant types are characterised by high projected permeabilities and lowaeration demands. It remains to be seen whether these are sustainable over extendedperiods of time.
Thus far, the largest operational Toray plant in Europe, Reynoldston in Wales with acapacity of 0.69 MLD at peak flow, operates at a permeability of around 210 LMH/bar.As with all Naston package plants, this plant has not been chemically cleaned. Instead,the membranes are subjected to a mild backwash, every 6 months or so, which causessufficient membrane displacement to dislodge accumulated solids. The solids are thensubsequently flushed away when the air scour is applied. Clogging which has beennoted has been attributed to blocked diffusers, which is overcome by their physicalcleaning.
5.3 Immersed HF technologies
5.3.1 Zenon Environmental
5.3.1.1 Perthes en Gatinais sewage treatment worksThe plant at Perthes en Gatinais is one of the earliest examples of a Zenon MBRsewage treatment plant and the earliest in Europe. It was commissioned in 1999 andwas built and is operated by Veolia Water (formerly Vivendi). The plant treats theeffluent from four small communities in the Paris region, and there are currently 24
Case studies 233
Table 5.9 Toray membrane-based MBR plant, design parameters
Parameter Fuji Heenvliet Naston
Effluent Industrial Municipal MunicipalCapacity (MLD) 0.84 (1.08 peak) 2.4 (5.6 peak)* 0.13–0.56Flux (LMH) 21.6 (27.8 peak) 24.3 (56.3 peak)* 17–25Permeability (LMH/bar) 1500 �1000* 210SADm (m3/m2.h) 0.4 0.3 0.25–0.82SADp (m3 air/m3) 19 (14 peak) 12 (5.3 peak) �15
*design data from Mulder et al. (Mulder and Kramer, 2005).
1856174817_Ch05.qxd 6/6/06 5:13 PM Page 233
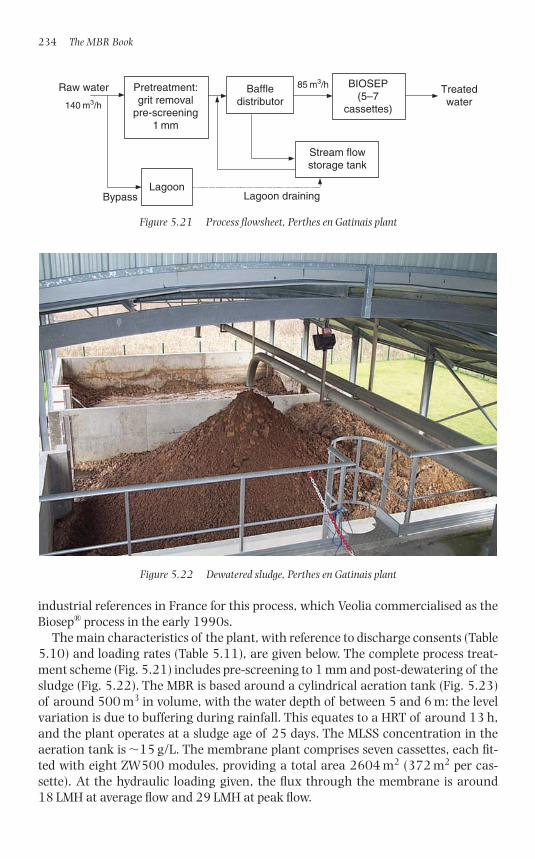
industrial references in France for this process, which Veolia commercialised as theBiosep® process in the early 1990s.
The main characteristics of the plant, with reference to discharge consents (Table5.10) and loading rates (Table 5.11), are given below. The complete process treat-ment scheme (Fig. 5.21) includes pre-screening to 1 mm and post-dewatering of thesludge (Fig. 5.22). The MBR is based around a cylindrical aeration tank (Fig. 5.23)of around 500 m3 in volume, with the water depth of between 5 and 6 m: the levelvariation is due to buffering during rainfall. This equates to a HRT of around 13 h,and the plant operates at a sludge age of 25 days. The MLSS concentration in theaeration tank is �15 g/L. The membrane plant comprises seven cassettes, each fit-ted with eight ZW500 modules, providing a total area 2604 m2 (372 m2 per cas-sette). At the hydraulic loading given, the flux through the membrane is around18 LMH at average flow and 29 LMH at peak flow.
234 The MBR Book
Lagoon drainingLagoon
Bypass
Raw water
140 m3/h
Pretreatment:grit removal
pre-screening1 mm
Baffledistributor
85 m3/h BIOSEP(5–7
cassettes)
Treatedwater
Stream flowstorage tank
Figure 5.21 Process flowsheet, Perthes en Gatinais plant
Figure 5.22 Dewatered sludge, Perthes en Gatinais plant
1856174817_Ch05.qxd 6/6/06 5:13 PM Page 234
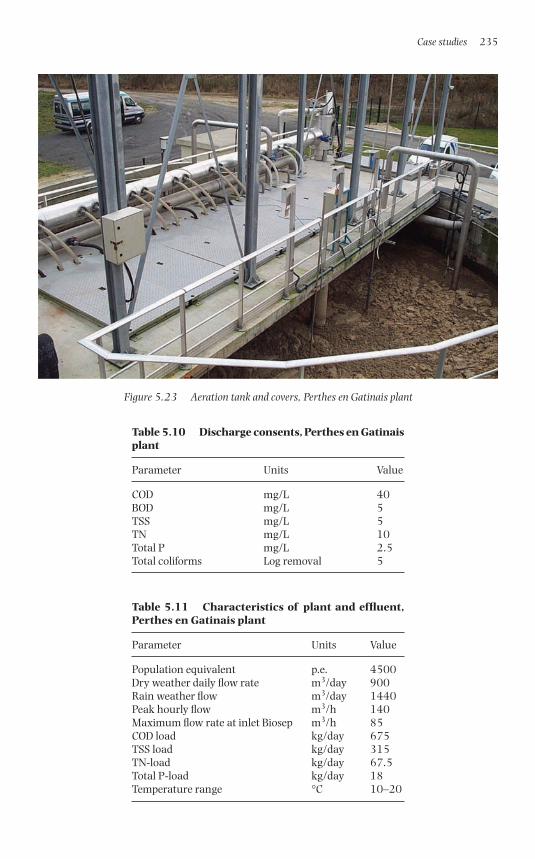
Case studies 235
Figure 5.23 Aeration tank and covers, Perthes en Gatinais plant
Table 5.10 Discharge consents, Perthes en Gatinaisplant
Parameter Units Value
COD mg/L 40BOD mg/L 5TSS mg/L 5TN mg/L 10Total P mg/L 2.5Total coliforms Log removal 5
Table 5.11 Characteristics of plant and effluent,Perthes en Gatinais plant
Parameter Units Value
Population equivalent p.e. 4500Dry weather daily flow rate m3/day 900Rain weather flow m3/day 1440Peak hourly flow m3/h 140Maximum flow rate at inlet Biosep m3/h 85COD load kg/day 675TSS load kg/day 315TN-load kg/day 67.5Total P-load kg/day 18Temperature range °C 10–20
1856174817_Ch05.qxd 6/6/06 5:13 PM Page 235
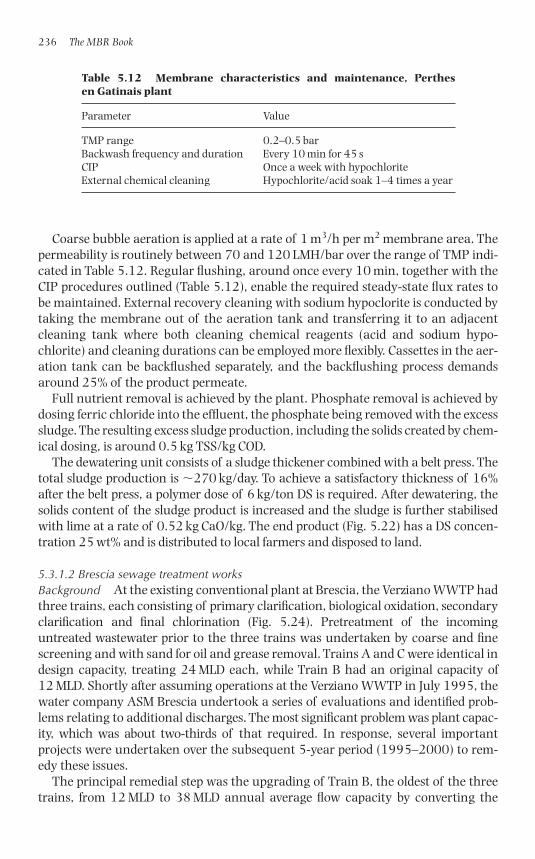
Coarse bubble aeration is applied at a rate of 1 m3/h per m2 membrane area. Thepermeability is routinely between 70 and 120 LMH/bar over the range of TMP indi-cated in Table 5.12. Regular flushing, around once every 10 min, together with theCIP procedures outlined (Table 5.12), enable the required steady-state flux rates tobe maintained. External recovery cleaning with sodium hypoclorite is conducted bytaking the membrane out of the aeration tank and transferring it to an adjacentcleaning tank where both cleaning chemical reagents (acid and sodium hypo-chlorite) and cleaning durations can be employed more flexibly. Cassettes in the aer-ation tank can be backflushed separately, and the backflushing process demandsaround 25% of the product permeate.
Full nutrient removal is achieved by the plant. Phosphate removal is achieved bydosing ferric chloride into the effluent, the phosphate being removed with the excesssludge. The resulting excess sludge production, including the solids created by chem-ical dosing, is around 0.5 kg TSS/kg COD.
The dewatering unit consists of a sludge thickener combined with a belt press. Thetotal sludge production is �270 kg/day. To achieve a satisfactory thickness of 16%after the belt press, a polymer dose of 6 kg/ton DS is required. After dewatering, thesolids content of the sludge product is increased and the sludge is further stabilisedwith lime at a rate of 0.52 kg CaO/kg. The end product (Fig. 5.22) has a DS concen-tration 25 wt% and is distributed to local farmers and disposed to land.
5.3.1.2 Brescia sewage treatment worksBackground At the existing conventional plant at Brescia, the Verziano WWTP hadthree trains, each consisting of primary clarification, biological oxidation, secondaryclarification and final chlorination (Fig. 5.24). Pretreatment of the incominguntreated wastewater prior to the three trains was undertaken by coarse and finescreening and with sand for oil and grease removal. Trains A and C were identical indesign capacity, treating 24 MLD each, while Train B had an original capacity of12 MLD. Shortly after assuming operations at the Verziano WWTP in July 1995, thewater company ASM Brescia undertook a series of evaluations and identified prob-lems relating to additional discharges. The most significant problem was plant capac-ity, which was about two-thirds of that required. In response, several importantprojects were undertaken over the subsequent 5-year period (1995–2000) to rem-edy these issues.
The principal remedial step was the upgrading of Train B, the oldest of the threetrains, from 12 MLD to 38 MLD annual average flow capacity by converting the
236 The MBR Book
Table 5.12 Membrane characteristics and maintenance, Perthes en Gatinais plant
Parameter Value
TMP range 0.2–0.5 barBackwash frequency and duration Every 10 min for 45 sCIP Once a week with hypochloriteExternal chemical cleaning Hypochlorite/acid soak 1–4 times a year
1856174817_Ch05.qxd 6/6/06 5:13 PM Page 236
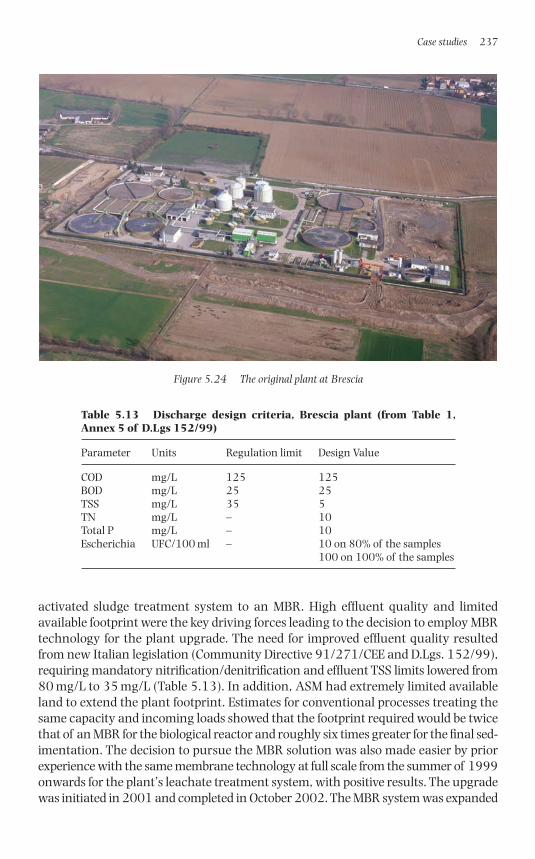
activated sludge treatment system to an MBR. High effluent quality and limitedavailable footprint were the key driving forces leading to the decision to employ MBRtechnology for the plant upgrade. The need for improved effluent quality resultedfrom new Italian legislation (Community Directive 91/271/CEE and D.Lgs. 152/99),requiring mandatory nitrification/denitrification and effluent TSS limits lowered from80 mg/L to 35 mg/L (Table 5.13). In addition, ASM had extremely limited availableland to extend the plant footprint. Estimates for conventional processes treating thesame capacity and incoming loads showed that the footprint required would be twicethat of an MBR for the biological reactor and roughly six times greater for the final sed-imentation. The decision to pursue the MBR solution was also made easier by priorexperience with the same membrane technology at full scale from the summer of 1999onwards for the plant’s leachate treatment system, with positive results. The upgradewas initiated in 2001 and completed in October 2002. The MBR system was expanded
Case studies 237
Figure 5.24 The original plant at Brescia
Table 5.13 Discharge design criteria, Brescia plant (from Table 1,Annex 5 of D.Lgs 152/99)
Parameter Units Regulation limit Design Value
COD mg/L 125 125BOD mg/L 25 25TSS mg/L 35 5TN mg/L – 10Total P mg/L – 10Escherichia UFC/100 ml – 10 on 80% of the samples
100 on 100% of the samples
1856174817_Ch05.qxd 6/6/06 5:13 PM Page 237
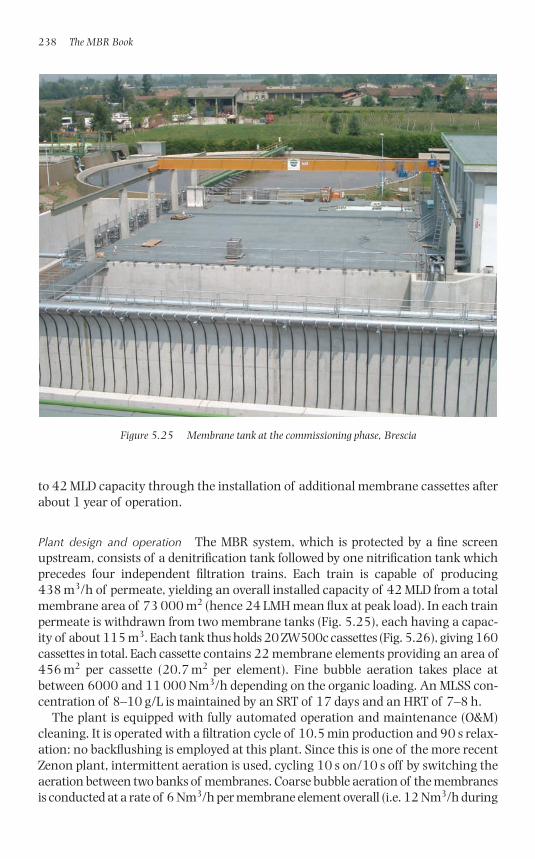
to 42 MLD capacity through the installation of additional membrane cassettes afterabout 1 year of operation.
Plant design and operation The MBR system, which is protected by a fine screenupstream, consists of a denitrification tank followed by one nitrification tank whichprecedes four independent filtration trains. Each train is capable of producing438 m3/h of permeate, yielding an overall installed capacity of 42 MLD from a totalmembrane area of 73 000 m2 (hence 24 LMH mean flux at peak load). In each trainpermeate is withdrawn from two membrane tanks (Fig. 5.25), each having a capac-ity of about 115 m3. Each tank thus holds 20 ZW500c cassettes (Fig. 5.26), giving 160cassettes in total. Each cassette contains 22 membrane elements providing an area of456 m2 per cassette (20.7 m2 per element). Fine bubble aeration takes place atbetween 6000 and 11 000 Nm3/h depending on the organic loading. An MLSS con-centration of 8–10 g/L is maintained by an SRT of 17 days and an HRT of 7–8 h.
The plant is equipped with fully automated operation and maintenance (O&M)cleaning. It is operated with a filtration cycle of 10.5 min production and 90 s relax-ation: no backflushing is employed at this plant. Since this is one of the more recentZenon plant, intermittent aeration is used, cycling 10 s on/10 s off by switching theaeration between two banks of membranes. Coarse bubble aeration of the membranesis conducted at a rate of 6 Nm3/h per membrane element overall (i.e. 12 Nm3/h during
238 The MBR Book
Figure 5.25 Membrane tank at the commissioning phase, Brescia
1856174817_Ch05.qxd 6/6/06 5:13 PM Page 238
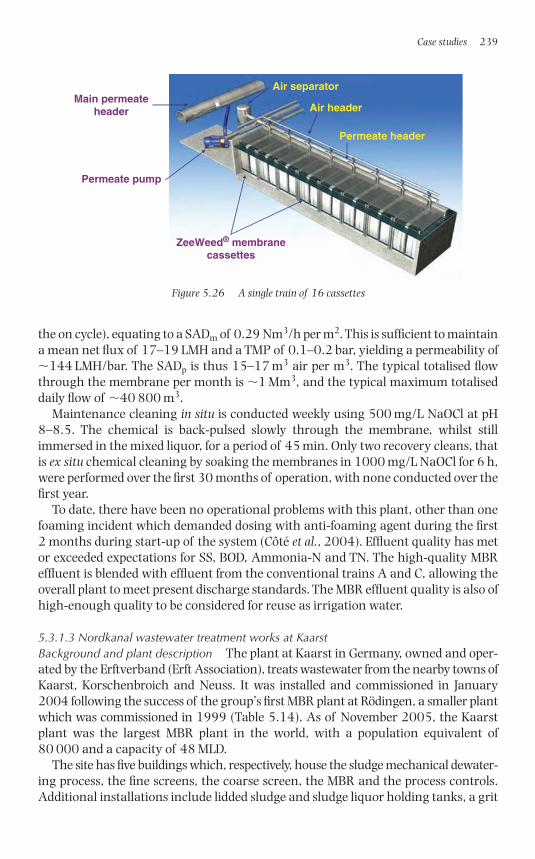
the on cycle), equating to a SADm of 0.29 Nm3/h per m2. This is sufficient to maintaina mean net flux of 17–19 LMH and a TMP of 0.1–0.2 bar, yielding a permeability of�144 LMH/bar. The SADp is thus 15–17 m3 air per m3. The typical totalised flowthrough the membrane per month is �1 Mm3, and the typical maximum totaliseddaily flow of �40 800 m3.
Maintenance cleaning in situ is conducted weekly using 500 mg/L NaOCl at pH8–8.5. The chemical is back-pulsed slowly through the membrane, whilst stillimmersed in the mixed liquor, for a period of 45 min. Only two recovery cleans, thatis ex situ chemical cleaning by soaking the membranes in 1000 mg/L NaOCl for 6 h,were performed over the first 30 months of operation, with none conducted over thefirst year.
To date, there have been no operational problems with this plant, other than onefoaming incident which demanded dosing with anti-foaming agent during the first2 months during start-up of the system (Côté et al., 2004). Effluent quality has metor exceeded expectations for SS, BOD, Ammonia-N and TN. The high-quality MBReffluent is blended with effluent from the conventional trains A and C, allowing theoverall plant to meet present discharge standards. The MBR effluent quality is also ofhigh-enough quality to be considered for reuse as irrigation water.
5.3.1.3 Nordkanal wastewater treatment works at KaarstBackground and plant description The plant at Kaarst in Germany, owned and oper-ated by the Erftverband (Erft Association), treats wastewater from the nearby towns ofKaarst, Korschenbroich and Neuss. It was installed and commissioned in January2004 following the success of the group’s first MBR plant at Rödingen, a smaller plantwhich was commissioned in 1999 (Table 5.14). As of November 2005, the Kaarstplant was the largest MBR plant in the world, with a population equivalent of80 000 and a capacity of 48 MLD.
The site has five buildings which, respectively, house the sludge mechanical dewater-ing process, the fine screens, the coarse screen, the MBR and the process controls.Additional installations include lidded sludge and sludge liquor holding tanks, a grit
Case studies 239
ZeeWeed® membranecassettes
Permeate header
Permeate pump
Air header
Air separatorMain permeate
header
Figure 5.26 A single train of 16 cassettes
1856174817_Ch05.qxd 6/6/06 5:13 PM Page 239
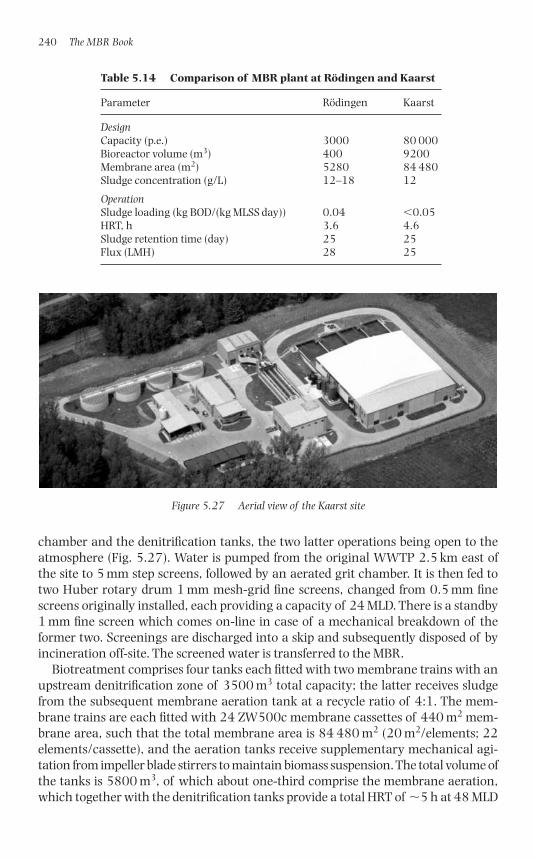
chamber and the denitrification tanks, the two latter operations being open to theatmosphere (Fig. 5.27). Water is pumped from the original WWTP 2.5 km east ofthe site to 5 mm step screens, followed by an aerated grit chamber. It is then fed totwo Huber rotary drum 1 mm mesh-grid fine screens, changed from 0.5 mm finescreens originally installed, each providing a capacity of 24 MLD. There is a standby1 mm fine screen which comes on-line in case of a mechanical breakdown of theformer two. Screenings are discharged into a skip and subsequently disposed of byincineration off-site. The screened water is transferred to the MBR.
Biotreatment comprises four tanks each fitted with two membrane trains with anupstream denitrification zone of 3500 m3 total capacity; the latter receives sludgefrom the subsequent membrane aeration tank at a recycle ratio of 4:1. The mem-brane trains are each fitted with 24 ZW500c membrane cassettes of 440 m2 mem-brane area, such that the total membrane area is 84 480 m2 (20 m2/elements; 22elements/cassette), and the aeration tanks receive supplementary mechanical agi-tation from impeller blade stirrers to maintain biomass suspension. The total volume ofthe tanks is 5800 m3, of which about one-third comprise the membrane aeration,which together with the denitrification tanks provide a total HRT of �5 h at 48 MLD
240 The MBR Book
Table 5.14 Comparison of MBR plant at Rödingen and Kaarst
Parameter Rödingen Kaarst
DesignCapacity (p.e.) 3000 80 000Bioreactor volume (m3) 400 9200Membrane area (m2) 5280 84 480Sludge concentration (g/L) 12–18 12
OperationSludge loading (kg BOD/(kg MLSS day)) 0.04 �0.05HRT, h 3.6 4.6Sludge retention time (day) 25 25Flux (LMH) 28 25
Figure 5.27 Aerial view of the Kaarst site
1856174817_Ch05.qxd 6/6/06 5:13 PM Page 240
flow. Sludge wasted from the tank is dewatered by centrifuge to around 25 wt%.There is also a simultaneous precipitation for phosphorous removal.
Plant operation The plant is operated at an SRT of 25 days, which maintains themixed liquor at between 10 and 15 g/L. The membranes are operated at a net flux of25 LMH and a mean permeability of 150–200 LMH/bar. Intermittent coarse bubbleaeration is provided at 34 000 m3/h on a 10 s on/10 s off basis, giving a SADm of0.40 Nm3/h per m2 and a SADp of 17 m3 air per m3. Physical cleaning comprises abackflush every 7 min for 60 s at 1.5 times the operating flux. A maintenance chem-ical clean is conducted every two weeks by draining the membrane tank and back-flushing for 1 h alternately with different cleaning agents, including 500 mg/Lhypochlorite. Cleaning is conducted on individual tanks, that is 12.5% of theinstalled capacity. The number of membranes on-line is adjusted according to theflow, but this is controlled in such a way as to ensure that no membrane train is off-line for more than a total of 70 min. The total specific power demand for all operations is 0.9 kWh/m3, which compares to an average of 0.5 kWh/m3 for all con-ventional sewage treatment plants operated by the Erftverband.
The plant, which incurred a total capital cost of €25 m, has been successfullyoperating for 23 months without major incidents.
5.3.1.4 Unifine Richardson Foods effluent treatment plantBackground The plant at Unifine Richardson Foods in St Mary’s, Ontario (Figs 5.28and 5.29) is an industrial pretreatment facility that discharges to a municipal waste-water treatment works and must meet 300 mg/L BOD and 350 mg/L TSS. Anyorganic load in excess of this is levied an additional surcharge by the municipality.Reliance on the municipality to receive and treat any high-strength waste leaves theindustrial client in a vulnerable position should the works not be able to receive theindustrial wastewater in the future. Richardson Foods moved to its new productionfacility in 1999 and needed a new wastewater pretreatment facility to replace theexisting SBR, which was over 20 years old. The latter was labour-intensive, gener-ated nuisance odours and was subject to upsets due to the proliferation of filamen-tous bacteria. Richardson Foods hired CH2MHill to select bidders for a newwastewater pretreatment system and, as a result of the selection process, ZenonEnvironmental Inc. was selected to design, build and install the system on a com-plete turn-key basis. The total contract value was $1 102 000, and installation andcommissioning were completed in November 2000.
Plant design and operation Unifine Richardson Foods Ltd. manufactures condi-ments for the food service industry. The plant makes over 200 products, includingdrink syrups, sundae toppings, sauces, mayonnaise and salad dressings. The waste-water strength and composition is highly variable and changes with productchanges, tank flushes, etc. The mean influent COD and BOD concentrations are7400 and 5500 mg/L, respectively, and the average daily flow is 0.15 MLD. There isa significant concentration of oil and grease in the wastewater. Wastewater from the
Case studies 241
1856174817_Ch05.qxd 6/6/06 5:13 PM Page 241
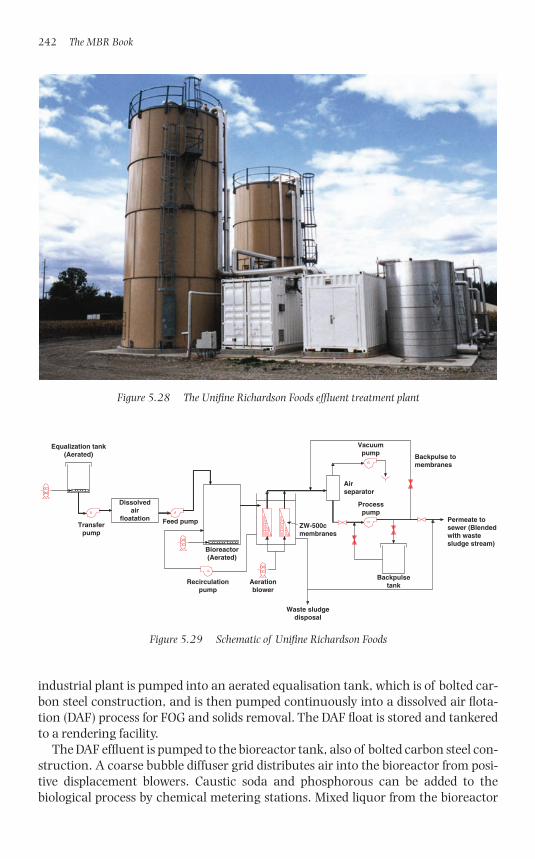
industrial plant is pumped into an aerated equalisation tank, which is of bolted car-bon steel construction, and is then pumped continuously into a dissolved air flota-tion (DAF) process for FOG and solids removal. The DAF float is stored and tankeredto a rendering facility.
The DAF effluent is pumped to the bioreactor tank, also of bolted carbon steel con-struction. A coarse bubble diffuser grid distributes air into the bioreactor from posi-tive displacement blowers. Caustic soda and phosphorous can be added to thebiological process by chemical metering stations. Mixed liquor from the bioreactor
242 The MBR Book
Figure 5.28 The Unifine Richardson Foods effluent treatment plant
Backpulse tomembranes
BackpulsetankAeration
blower
Equalization tank(Aerated)
Transferpump
ZW-500cmembranes
Processpump
Airseparator
Vacuumpump
Permeate tosewer (Blendedwith wastesludge stream)
Feed pump
Dissolvedair
floatation
Bioreactor(Aerated)
Waste sludgedisposal
Recirculationpump
Figure 5.29 Schematic of Unifine Richardson Foods
1856174817_Ch05.qxd 6/6/06 5:13 PM Page 242
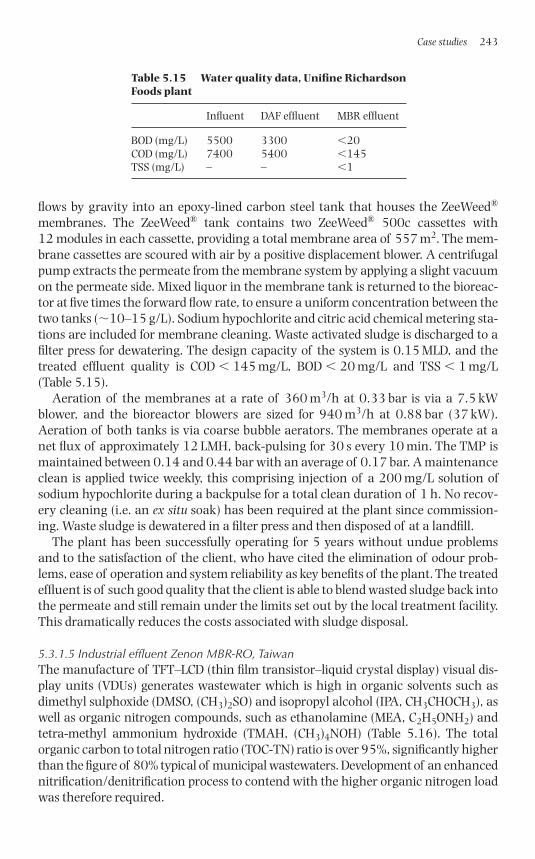
flows by gravity into an epoxy-lined carbon steel tank that houses the ZeeWeed®
membranes. The ZeeWeed® tank contains two ZeeWeed® 500c cassettes with 12 modules in each cassette, providing a total membrane area of 557 m2. The mem-brane cassettes are scoured with air by a positive displacement blower. A centrifugalpump extracts the permeate from the membrane system by applying a slight vacuumon the permeate side. Mixed liquor in the membrane tank is returned to the bioreac-tor at five times the forward flow rate, to ensure a uniform concentration between thetwo tanks (�10–15 g/L). Sodium hypochlorite and citric acid chemical metering sta-tions are included for membrane cleaning. Waste activated sludge is discharged to afilter press for dewatering. The design capacity of the system is 0.15 MLD, and thetreated effluent quality is COD � 145 mg/L, BOD � 20 mg/L and TSS � 1 mg/L(Table 5.15).
Aeration of the membranes at a rate of 360 m3/h at 0.33 bar is via a 7.5 kWblower, and the bioreactor blowers are sized for 940 m3/h at 0.88 bar (37 kW).Aeration of both tanks is via coarse bubble aerators. The membranes operate at anet flux of approximately 12 LMH, back-pulsing for 30 s every 10 min. The TMP ismaintained between 0.14 and 0.44 bar with an average of 0.17 bar. A maintenanceclean is applied twice weekly, this comprising injection of a 200 mg/L solution ofsodium hypochlorite during a backpulse for a total clean duration of 1 h. No recov-ery cleaning (i.e. an ex situ soak) has been required at the plant since commission-ing. Waste sludge is dewatered in a filter press and then disposed of at a landfill.
The plant has been successfully operating for 5 years without undue problemsand to the satisfaction of the client, who have cited the elimination of odour prob-lems, ease of operation and system reliability as key benefits of the plant. The treatedeffluent is of such good quality that the client is able to blend wasted sludge back intothe permeate and still remain under the limits set out by the local treatment facility.This dramatically reduces the costs associated with sludge disposal.
5.3.1.5 Industrial effluent Zenon MBR-RO, TaiwanThe manufacture of TFT–LCD (thin film transistor–liquid crystal display) visual dis-play units (VDUs) generates wastewater which is high in organic solvents such asdimethyl sulphoxide (DMSO, (CH3)2SO) and isopropyl alcohol (IPA, CH3CHOCH3), aswell as organic nitrogen compounds, such as ethanolamine (MEA, C2H5ONH2) andtetra-methyl ammonium hydroxide (TMAH, (CH3)4NOH) (Table 5.16). The totalorganic carbon to total nitrogen ratio (TOC-TN) ratio is over 95%, significantly higherthan the figure of 80% typical of municipal wastewaters. Development of an enhancednitrification/denitrification process to contend with the higher organic nitrogen loadwas therefore required.
Case studies 243
Table 5.15 Water quality data, Unifine RichardsonFoods plant
Influent DAF effluent MBR effluent
BOD (mg/L) 5500 3300 �20COD (mg/L) 7400 5400 �145TSS (mg/L) – – �1
1856174817_Ch05.qxd 6/6/06 5:13 PM Page 243
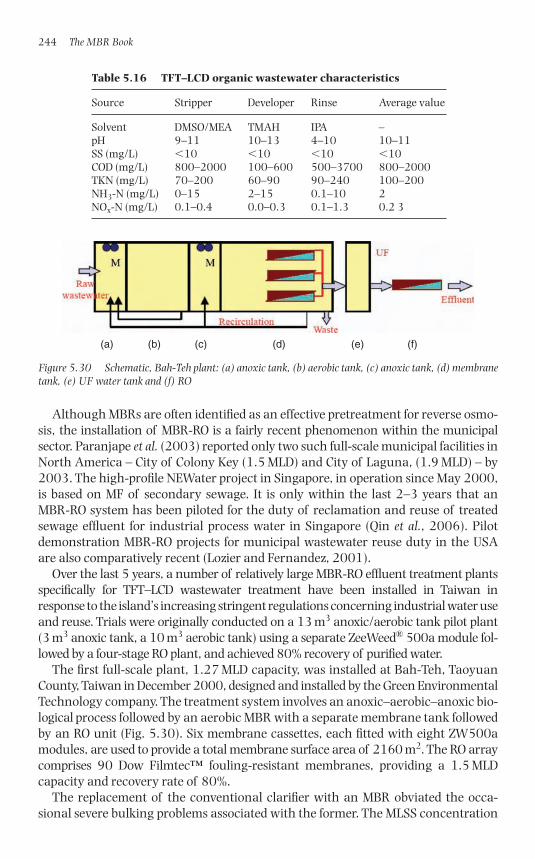
Although MBRs are often identified as an effective pretreatment for reverse osmo-sis, the installation of MBR-RO is a fairly recent phenomenon within the municipalsector. Paranjape et al. (2003) reported only two such full-scale municipal facilities inNorth America – City of Colony Key (1.5 MLD) and City of Laguna, (1.9 MLD) – by2003. The high-profile NEWater project in Singapore, in operation since May 2000,is based on MF of secondary sewage. It is only within the last 2–3 years that anMBR-RO system has been piloted for the duty of reclamation and reuse of treatedsewage effluent for industrial process water in Singapore (Qin et al., 2006). Pilotdemonstration MBR-RO projects for municipal wastewater reuse duty in the USAare also comparatively recent (Lozier and Fernandez, 2001).
Over the last 5 years, a number of relatively large MBR-RO effluent treatment plantsspecifically for TFT–LCD wastewater treatment have been installed in Taiwan inresponse to the island’s increasing stringent regulations concerning industrial water useand reuse. Trials were originally conducted on a 13 m3 anoxic/aerobic tank pilot plant(3 m3 anoxic tank, a 10 m3 aerobic tank) using a separate ZeeWeed® 500a module fol-lowed by a four-stage RO plant, and achieved 80% recovery of purified water.
The first full-scale plant, 1.27 MLD capacity, was installed at Bah-Teh, TaoyuanCounty, Taiwan in December 2000, designed and installed by the Green EnvironmentalTechnology company. The treatment system involves an anoxic–aerobic–anoxic bio-logical process followed by an aerobic MBR with a separate membrane tank followedby an RO unit (Fig. 5.30). Six membrane cassettes, each fitted with eight ZW500amodules, are used to provide a total membrane surface area of 2160 m2. The RO arraycomprises 90 Dow Filmtec™ fouling-resistant membranes, providing a 1.5 MLDcapacity and recovery rate of 80%.
The replacement of the conventional clarifier with an MBR obviated the occa-sional severe bulking problems associated with the former. The MLSS concentration
244 The MBR Book
Table 5.16 TFT–LCD organic wastewater characteristics
Source Stripper Developer Rinse Average value
Solvent DMSO/MEA TMAH IPA –pH 9–11 10–13 4–10 10–11SS (mg/L) �10 �10 �10 �10 COD (mg/L) 800–2000 100–600 500–3700 800–2000TKN (mg/L) 70–200 60–90 90–240 100–200NH3-N (mg/L) 0–15 2–15 0.1–10 2NOx-N (mg/L) 0.1–0.4 0.0–0.3 0.1–1.3 0.2 3
(a) (b) (c) (d) (e) (f)
Figure 5.30 Schematic, Bah-Teh plant: (a) anoxic tank, (b) aerobic tank, (c) anoxic tank, (d) membranetank, (e) UF water tank and (f) RO
1856174817_Ch05.qxd 6/6/06 5:13 PM Page 244
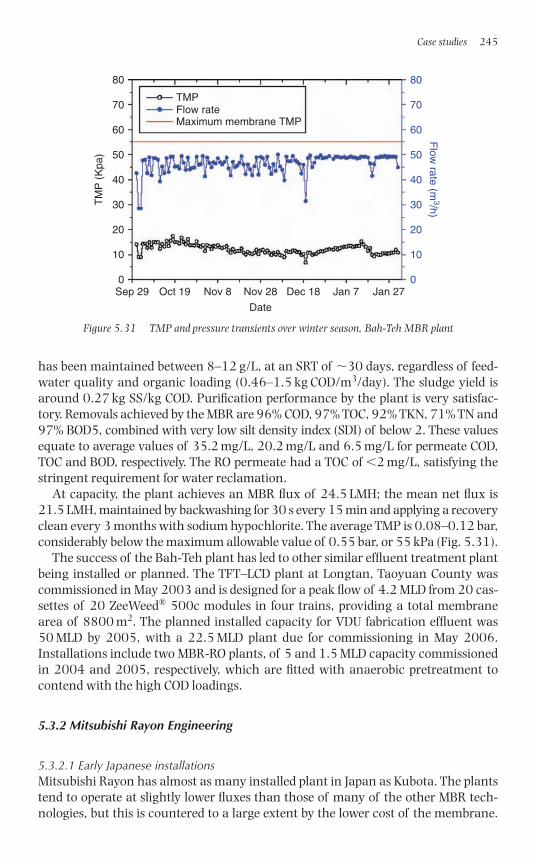
has been maintained between 8–12 g/L, at an SRT of �30 days, regardless of feed-water quality and organic loading (0.46–1.5 kg COD/m3/day). The sludge yield isaround 0.27 kg SS/kg COD. Purification performance by the plant is very satisfac-tory. Removals achieved by the MBR are 96% COD, 97% TOC, 92% TKN, 71% TN and97% BOD5, combined with very low silt density index (SDI) of below 2. These valuesequate to average values of 35.2 mg/L, 20.2 mg/L and 6.5 mg/L for permeate COD,TOC and BOD, respectively. The RO permeate had a TOC of �2 mg/L, satisfying thestringent requirement for water reclamation.
At capacity, the plant achieves an MBR flux of 24.5 LMH; the mean net flux is21.5 LMH, maintained by backwashing for 30 s every 15 min and applying a recoveryclean every 3 months with sodium hypochlorite. The average TMP is 0.08–0.12 bar,considerably below the maximum allowable value of 0.55 bar, or 55 kPa (Fig. 5.31).
The success of the Bah-Teh plant has led to other similar effluent treatment plantbeing installed or planned. The TFT–LCD plant at Longtan, Taoyuan County wascommissioned in May 2003 and is designed for a peak flow of 4.2 MLD from 20 cas-settes of 20 ZeeWeed® 500c modules in four trains, providing a total membranearea of 8800 m2. The planned installed capacity for VDU fabrication effluent was50 MLD by 2005, with a 22.5 MLD plant due for commissioning in May 2006.Installations include two MBR-RO plants, of 5 and 1.5 MLD capacity commissionedin 2004 and 2005, respectively, which are fitted with anaerobic pretreatment tocontend with the high COD loadings.
5.3.2 Mitsubishi Rayon Engineering
5.3.2.1 Early Japanese installationsMitsubishi Rayon has almost as many installed plant in Japan as Kubota. The plantstend to operate at slightly lower fluxes than those of many of the other MBR tech-nologies, but this is countered to a large extent by the lower cost of the membrane.
Case studies 245
80
70
60
50
40
30
20
10
0
80
70
60
50
40
30
20
10
0
TM
P (
Kpa
)
Sep 29 Oct 19 Nov 8 Nov 28 Dec 18 Jan 7 Jan 27
Date
Flow
rate (m3/h)
TMPFlow rateMaximum membrane TMP
Figure 5.31 TMP and pressure transients over winter season, Bah-Teh MBR plant
1856174817_Ch05.qxd 6/6/06 5:13 PM Page 245
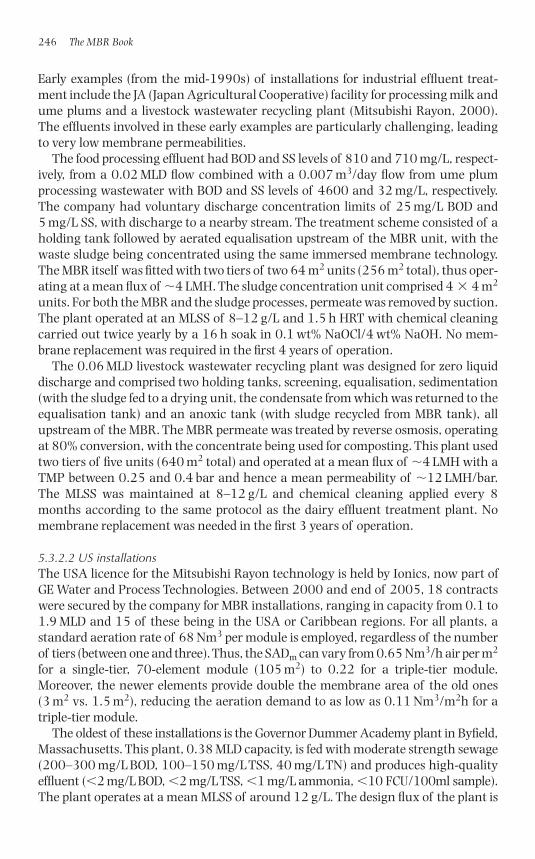
Early examples (from the mid-1990s) of installations for industrial effluent treat-ment include the JA (Japan Agricultural Cooperative) facility for processing milk andume plums and a livestock wastewater recycling plant (Mitsubishi Rayon, 2000).The effluents involved in these early examples are particularly challenging, leadingto very low membrane permeabilities.
The food processing effluent had BOD and SS levels of 810 and 710 mg/L, respect-ively, from a 0.02 MLD flow combined with a 0.007 m3/day flow from ume plumprocessing wastewater with BOD and SS levels of 4600 and 32 mg/L, respectively.The company had voluntary discharge concentration limits of 25 mg/L BOD and5 mg/L SS, with discharge to a nearby stream. The treatment scheme consisted of aholding tank followed by aerated equalisation upstream of the MBR unit, with thewaste sludge being concentrated using the same immersed membrane technology.The MBR itself was fitted with two tiers of two 64 m2 units (256 m2 total), thus oper-ating at a mean flux of �4 LMH. The sludge concentration unit comprised 4 � 4 m2
units. For both the MBR and the sludge processes, permeate was removed by suction.The plant operated at an MLSS of 8–12 g/L and 1.5 h HRT with chemical cleaningcarried out twice yearly by a 16 h soak in 0.1 wt% NaOCl/4 wt% NaOH. No mem-brane replacement was required in the first 4 years of operation.
The 0.06 MLD livestock wastewater recycling plant was designed for zero liquiddischarge and comprised two holding tanks, screening, equalisation, sedimentation(with the sludge fed to a drying unit, the condensate from which was returned to theequalisation tank) and an anoxic tank (with sludge recycled from MBR tank), allupstream of the MBR. The MBR permeate was treated by reverse osmosis, operatingat 80% conversion, with the concentrate being used for composting. This plant usedtwo tiers of five units (640 m2 total) and operated at a mean flux of �4 LMH with aTMP between 0.25 and 0.4 bar and hence a mean permeability of �12 LMH/bar.The MLSS was maintained at 8–12 g/L and chemical cleaning applied every 8months according to the same protocol as the dairy effluent treatment plant. Nomembrane replacement was needed in the first 3 years of operation.
5.3.2.2 US installationsThe USA licence for the Mitsubishi Rayon technology is held by Ionics, now part ofGE Water and Process Technologies. Between 2000 and end of 2005, 18 contractswere secured by the company for MBR installations, ranging in capacity from 0.1 to1.9 MLD and 15 of these being in the USA or Caribbean regions. For all plants, astandard aeration rate of 68 Nm3 per module is employed, regardless of the numberof tiers (between one and three). Thus, the SADm can vary from 0.65 Nm3/h air per m2
for a single-tier, 70-element module (105 m2) to 0.22 for a triple-tier module.Moreover, the newer elements provide double the membrane area of the old ones(3 m2 vs. 1.5 m2), reducing the aeration demand to as low as 0.11 Nm3/m2h for atriple-tier module.
The oldest of these installations is the Governor Dummer Academy plant in Byfield,Massachusetts. This plant, 0.38 MLD capacity, is fed with moderate strength sewage(200–300 mg/L BOD, 100–150 mg/L TSS, 40 mg/L TN) and produces high-qualityeffluent (�2 mg/L BOD, �2 mg/L TSS, �1 mg/L ammonia, �10 FCU/100ml sample).The plant operates at a mean MLSS of around 12 g/L. The design flux of the plant is
246 The MBR Book
1856174817_Ch05.qxd 6/6/06 5:13 PM Page 246
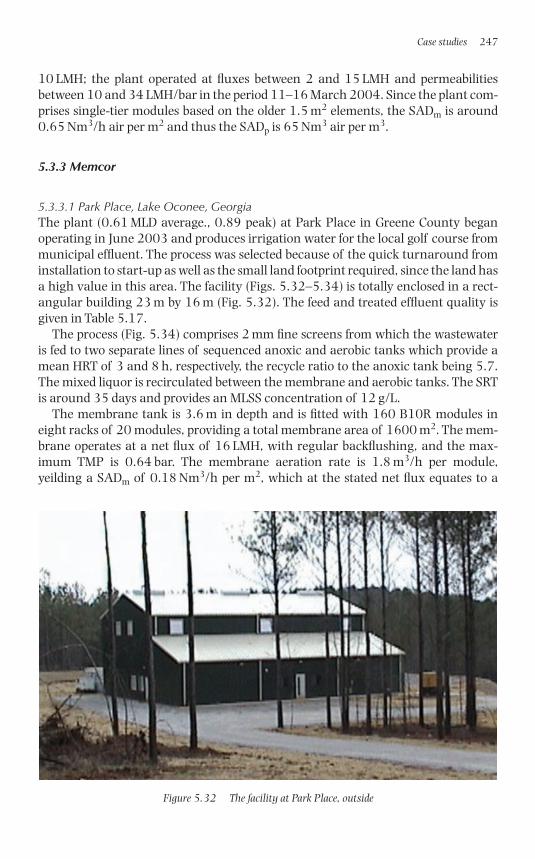
10 LMH; the plant operated at fluxes between 2 and 15 LMH and permeabilitiesbetween 10 and 34 LMH/bar in the period 11–16 March 2004. Since the plant com-prises single-tier modules based on the older 1.5 m2 elements, the SADm is around0.65 Nm3/h air per m2 and thus the SADp is 65 Nm3 air per m3.
5.3.3 Memcor
5.3.3.1 Park Place, Lake Oconee, GeorgiaThe plant (0.61 MLD average., 0.89 peak) at Park Place in Greene County beganoperating in June 2003 and produces irrigation water for the local golf course frommunicipal effluent. The process was selected because of the quick turnaround frominstallation to start-up as well as the small land footprint required, since the land hasa high value in this area. The facility (Figs. 5.32–5.34) is totally enclosed in a rect-angular building 23 m by 16 m (Fig. 5.32). The feed and treated effluent quality isgiven in Table 5.17.
The process (Fig. 5.34) comprises 2 mm fine screens from which the wastewateris fed to two separate lines of sequenced anoxic and aerobic tanks which provide amean HRT of 3 and 8 h, respectively, the recycle ratio to the anoxic tank being 5.7.The mixed liquor is recirculated between the membrane and aerobic tanks. The SRTis around 35 days and provides an MLSS concentration of 12 g/L.
The membrane tank is 3.6 m in depth and is fitted with 160 B10R modules ineight racks of 20 modules, providing a total membrane area of 1600 m2. The mem-brane operates at a net flux of 16 LMH, with regular backflushing, and the max-imum TMP is 0.64 bar. The membrane aeration rate is 1.8 m3/h per module,yeilding a SADm of 0.18 Nm3/h per m2, which at the stated net flux equates to a
Case studies 247
Figure 5.32 The facility at Park Place, outside
1856174817_Ch05.qxd 6/6/06 5:13 PM Page 247
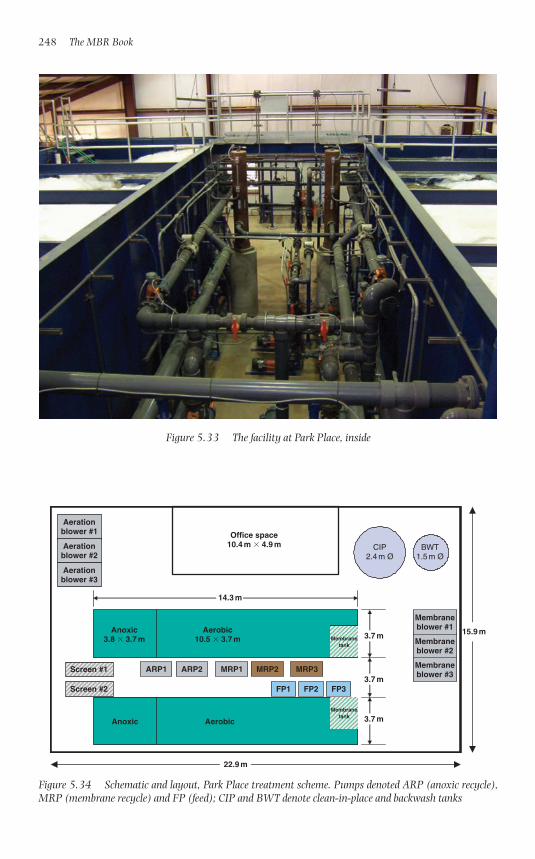
248 The MBR Book
Figure 5.33 The facility at Park Place, inside
CIP2.4 m Ø
Aerationblower #1
Aerationblower #2
Aerationblower #3
Membraneblower #2
Membraneblower #1
Membraneblower #3
Office space10.4 m � 4.9 m
Anoxic3.8 � 3.7 m
Aerobic10.5 � 3.7 m
Membranetank
Anoxic Aerobic
Screen #1
Screen #2
BWT1.5 m Ø
FP1 FP2 FP3
ARP1 ARP2 MRP1 MRP2 MRP3
14.3 m
3.7 m
3.7 m
3.7 m
22.9 m
15.9 mMembrane
tank
Figure 5.34 Schematic and layout, Park Place treatment scheme. Pumps denoted ARP (anoxic recycle),MRP (membrane recycle) and FP (feed); CIP and BWT denote clean-in-place and backwash tanks
1856174817_Ch05.qxd 6/6/06 5:13 PM Page 248
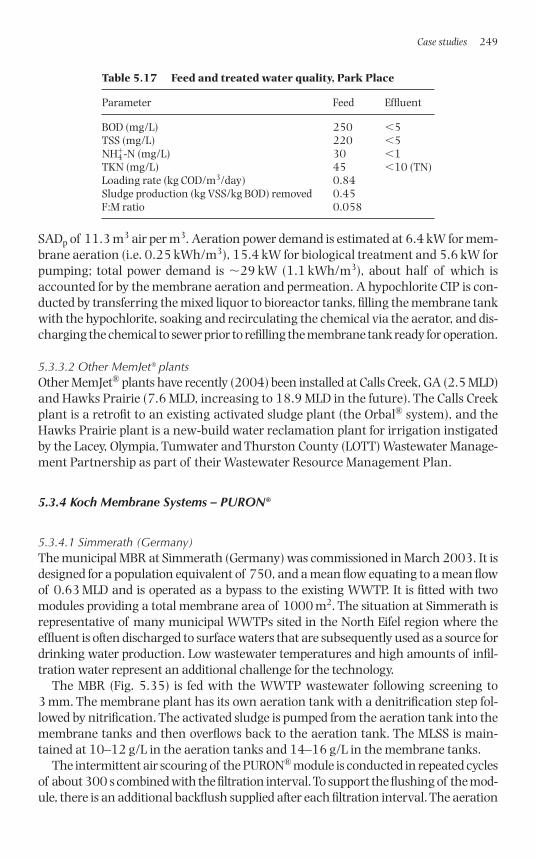
SADp of 11.3 m3 air per m3. Aeration power demand is estimated at 6.4 kW for mem-brane aeration (i.e. 0.25 kWh/m3), 15.4 kW for biological treatment and 5.6 kW forpumping; total power demand is �29 kW (1.1 kWh/m3), about half of which isaccounted for by the membrane aeration and permeation. A hypochlorite CIP is con-ducted by transferring the mixed liquor to bioreactor tanks, filling the membrane tankwith the hypochlorite, soaking and recirculating the chemical via the aerator, and dis-charging the chemical to sewer prior to refilling the membrane tank ready for operation.
5.3.3.2 Other MemJet® plantsOther MemJet® plants have recently (2004) been installed at Calls Creek, GA (2.5 MLD)and Hawks Prairie (7.6 MLD, increasing to 18.9 MLD in the future). The Calls Creekplant is a retrofit to an existing activated sludge plant (the Orbal® system), and theHawks Prairie plant is a new-build water reclamation plant for irrigation instigatedby the Lacey, Olympia, Tumwater and Thurston County (LOTT) Wastewater Manage-ment Partnership as part of their Wastewater Resource Management Plan.
5.3.4 Koch Membrane Systems – PURON®
5.3.4.1 Simmerath (Germany)The municipal MBR at Simmerath (Germany) was commissioned in March 2003. It isdesigned for a population equivalent of 750, and a mean flow equating to a mean flowof 0.63 MLD and is operated as a bypass to the existing WWTP. It is fitted with twomodules providing a total membrane area of 1000 m2. The situation at Simmerath isrepresentative of many municipal WWTPs sited in the North Eifel region where theeffluent is often discharged to surface waters that are subsequently used as a source fordrinking water production. Low wastewater temperatures and high amounts of infil-tration water represent an additional challenge for the technology.
The MBR (Fig. 5.35) is fed with the WWTP wastewater following screening to3 mm. The membrane plant has its own aeration tank with a denitrification step fol-lowed by nitrification. The activated sludge is pumped from the aeration tank into themembrane tanks and then overflows back to the aeration tank. The MLSS is main-tained at 10–12 g/L in the aeration tanks and 14–16 g/L in the membrane tanks.
The intermittent air scouring of the PURON® module is conducted in repeated cyclesof about 300 s combined with the filtration interval. To support the flushing of the mod-ule, there is an additional backflush supplied after each filtration interval. The aeration
Case studies 249
Table 5.17 Feed and treated water quality, Park Place
Parameter Feed Effluent
BOD (mg/L) 250 �5TSS (mg/L) 220 �5NH4
�-N (mg/L) 30 �1TKN (mg/L) 45 �10 (TN)Loading rate (kg COD/m3/day) 0.84Sludge production (kg VSS/kg BOD) removed 0.45F:M ratio 0.058
1856174817_Ch05.qxd 6/6/06 5:13 PM Page 249
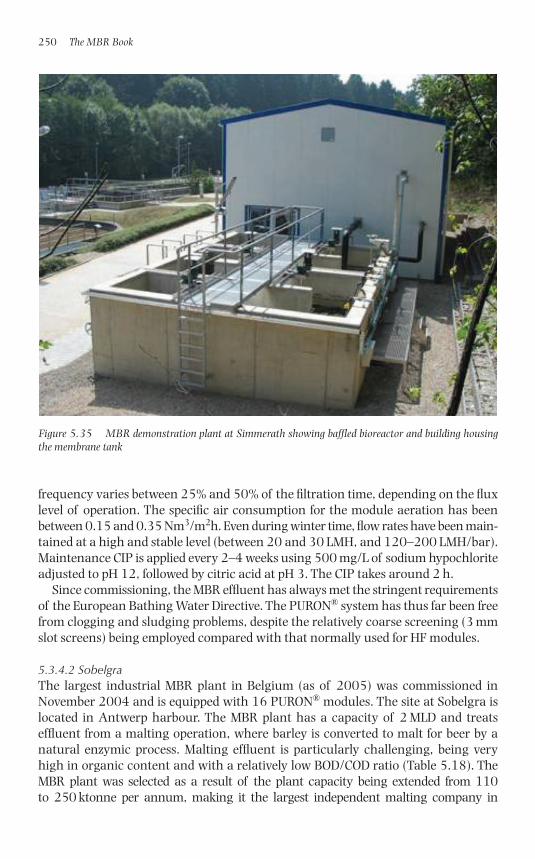
frequency varies between 25% and 50% of the filtration time, depending on the fluxlevel of operation. The specific air consumption for the module aeration has beenbetween 0.15 and 0.35 Nm3/m2h. Even during winter time, flow rates have been main-tained at a high and stable level (between 20 and 30 LMH, and 120–200 LMH/bar).Maintenance CIP is applied every 2–4 weeks using 500 mg/L of sodium hypochloriteadjusted to pH 12, followed by citric acid at pH 3. The CIP takes around 2 h.
Since commissioning, the MBR effluent has always met the stringent requirementsof the European Bathing Water Directive. The PURON® system has thus far been freefrom clogging and sludging problems, despite the relatively coarse screening (3 mmslot screens) being employed compared with that normally used for HF modules.
5.3.4.2 SobelgraThe largest industrial MBR plant in Belgium (as of 2005) was commissioned inNovember 2004 and is equipped with 16 PURON® modules. The site at Sobelgra islocated in Antwerp harbour. The MBR plant has a capacity of 2 MLD and treatseffluent from a malting operation, where barley is converted to malt for beer by anatural enzymic process. Malting effluent is particularly challenging, being veryhigh in organic content and with a relatively low BOD/COD ratio (Table 5.18). TheMBR plant was selected as a result of the plant capacity being extended from 110 to 250 ktonne per annum, making it the largest independent malting company in
250 The MBR Book
Figure 5.35 MBR demonstration plant at Simmerath showing baffled bioreactor and building housingthe membrane tank
1856174817_Ch05.qxd 6/6/06 5:13 PM Page 250
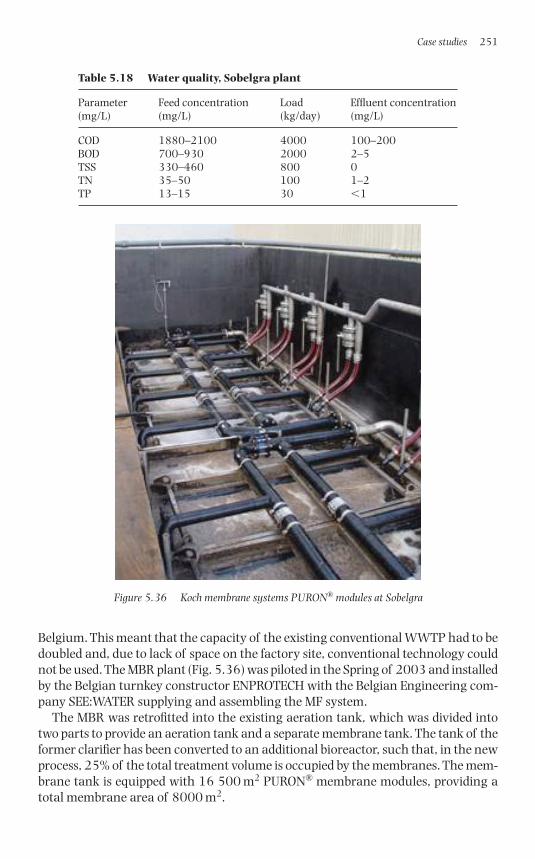
Belgium. This meant that the capacity of the existing conventional WWTP had to bedoubled and, due to lack of space on the factory site, conventional technology couldnot be used. The MBR plant (Fig. 5.36) was piloted in the Spring of 2003 and installedby the Belgian turnkey constructor ENPROTECH with the Belgian Engineering com-pany SEE:WATER supplying and assembling the MF system.
The MBR was retrofitted into the existing aeration tank, which was divided intotwo parts to provide an aeration tank and a separate membrane tank. The tank of theformer clarifier has been converted to an additional bioreactor, such that, in the newprocess, 25% of the total treatment volume is occupied by the membranes. The mem-brane tank is equipped with 16 500 m2 PURON® membrane modules, providing atotal membrane area of 8000 m2.
Case studies 251
Table 5.18 Water quality, Sobelgra plant
Parameter Feed concentration Load Effluent concentration(mg/L) (mg/L) (kg/day) (mg/L)
COD 1880–2100 4000 100–200BOD 700–930 2000 2–5TSS 330–460 800 0TN 35–50 100 1–2TP 13–15 30 �1
Figure 5.36 Koch membrane systems PURON® modules at Sobelgra
1856174817_Ch05.qxd 6/6/06 5:13 PM Page 251
The plant consists of a screening at 0.25 mm prior to biotreatment using twotanks in series. The sludge is then transferred to two membrane compartments, witha third chamber being available for future extensions of the plant. The membranecompartments are fed from the bottom so that the sludge flows upwards through themembrane modules. Permeate is extracted from the membrane modules under aslight vacuum. The activated sludge is concentrated during this process and is ledback into the biology tanks by means of spillways.
5.3.5 Asahi Kasei
The Asahi Kasei Microza HF membrane module was installed at a 0.6 MLD foodeffluent treatment plant in Japan in August 2004 and subsequently expanded to0.9 MLD in early 2005. The respective mean BOD, COD and TSS values of the feedare 1080, 630 and 377 mg/L, respectively, and all are removed by at least 99.5% bythe process. Originally, 16 racks of 100 m2 modules (i.e. a total membrane area of1600 m2), each containing four elements (Fig. 4.27a), were inserted in the tank toachieve the total flow capacity required, the modules being retrofitted into an exist-ing MBR membrane tank plant. The plant is operated at �8 g/L MLSS. A stable TMPof around 0.2 bar was maintained over the first 3 months of operation at a flux closeto 16 LMH at an aeration rate of 384 m3/h, equating to a SADm of 0.24 m3/h per m2
and a SADp of 15 m3 air per m3.
5.4 Sidestream membrane plants
5.4.1 Norit X-Flow airlift process
The earliest example of the use of an airlift sidestream membrane bioreactor (sMBR)for municipal wastewater is probably that of the pilot plant at Vienna (Fig. 5.37),installed in 1999. This plant has a capacity of 0.24 MLD and the feed strength is300–700 mg/L COD. The plant provides an effluent of �30 mg/L COD at all times.
The plant comprises pretreatment using a coarse grid followed by a sand and FOGtrap. A submersible pump, which also provides a degree of comminution, pumps theraw effluent into a sedimentation tank with an HRT of 30–60 min. The supernatantis then fed through a 0.8 mm screen and into the bioreactor, into which ferric coagu-lant is dosed directly. Membrane separation is achieved by four vertically-mounted38PR-type MT modules fitted with 5.2 mm F4385 membranes. The modules areoperated at a TMP of 0.05–0.15 bar with a combined pumped air and liquid cross-flow rate of �1 m/s. This achieves a flux of 40 LMH for dry weather flow, rising to55 LMH at full capacity when the TMP is at its highest value of 0.3 bar. The permea-bility is generally maintained between 300 and 400 LMH/bar, only falling belowthis range when fluxes of �50 LMH are sustained for several days. Membrane clean-ing is achieved by chemical soaking every 15–30 days using a combined chemicalclean of hypochlorite and citric acid (Fig 5.37).
252 The MBR Book
1856174817_Ch05.qxd 6/6/06 5:13 PM Page 252
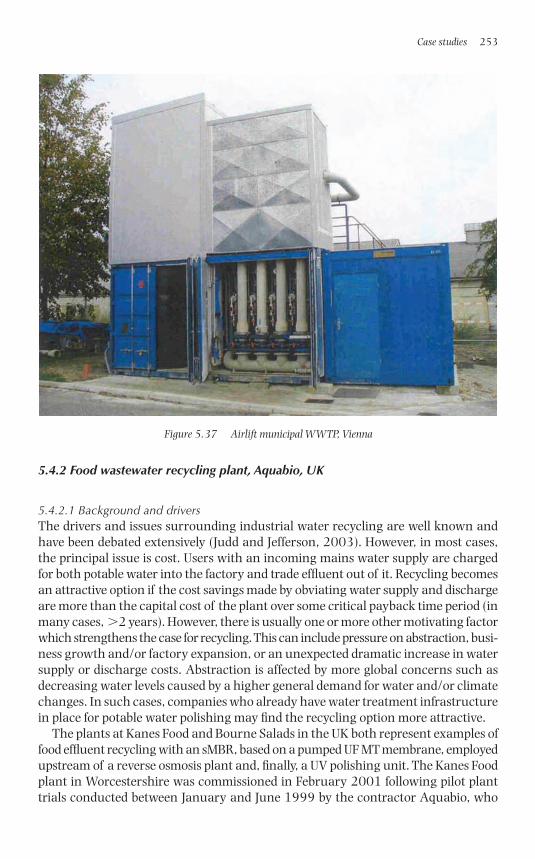
5.4.2 Food wastewater recycling plant, Aquabio, UK
5.4.2.1 Background and driversThe drivers and issues surrounding industrial water recycling are well known andhave been debated extensively (Judd and Jefferson, 2003). However, in most cases,the principal issue is cost. Users with an incoming mains water supply are chargedfor both potable water into the factory and trade effluent out of it. Recycling becomesan attractive option if the cost savings made by obviating water supply and dischargeare more than the capital cost of the plant over some critical payback time period (inmany cases, �2 years). However, there is usually one or more other motivating factorwhich strengthens the case for recycling. This can include pressure on abstraction, busi-ness growth and/or factory expansion, or an unexpected dramatic increase in watersupply or discharge costs. Abstraction is affected by more global concerns such asdecreasing water levels caused by a higher general demand for water and/or climatechanges. In such cases, companies who already have water treatment infrastructurein place for potable water polishing may find the recycling option more attractive.
The plants at Kanes Food and Bourne Salads in the UK both represent examples offood effluent recycling with an sMBR, based on a pumped UF MT membrane, employedupstream of a reverse osmosis plant and, finally, a UV polishing unit. The Kanes Foodplant in Worcestershire was commissioned in February 2001 following pilot planttrials conducted between January and June 1999 by the contractor Aquabio, who
Case studies 253
Figure 5.37 Airlift municipal WWTP, Vienna
1856174817_Ch05.qxd 6/6/06 5:13 PM Page 253
refer to their process as an advanced membrane bioreactor (AMBR). The plant has a0.815 MLD capacity (Table 5.19), with 80% of this flow being recycled.
5.4.2.2 Plant configurationThe process treatment scheme (Fig. 5.38 and Table 5.20) comprises upstreamscreening, flow balancing, the AMBR and downstream treatment by reverse osmo-sis followed by UV disinfection to yield potable quality water suitable for blendingwith mains water for use within the factory. Screening down to 0.75 mm is achievedby a 150 m3/h rotary drum screen. Flow balancing is carried out in a 900 m3 bal-ance tank, thus providing 18 h HRT, where aeration and mixing is carried out usingtwo self-entraining JETOX aerators. A proportion of the wastewater collected at thebalance tank is discharged directly to the public sewer, having undergone screening,balancing and pH correction. The remaining wastewater (up to 0.815 MLD) ispassed forward to the bioreactors for biological treatment in the AMBR process,comprising two 250 m3 bioreactors with four banks of crossflow membrane mod-ules. The two bioreactors provide process flexibility, allowing them to operate inseries or in parallel. Currently, series operation is utilised successfully to provide“roughing” treatment in the first tank, followed by “polishing” in the second.
The JETOX aeration systems provide a total of 1980 kgO2/day with reference toclean water and standard conditions. The maximum MLSS concentration employed
254 The MBR Book
Table 5.19 Design basis for plant at Kanes Foods
Parameter Value
Volume to screening/balancing 1.2 MLDCOD concentration (average) 1000 mg/LVolume to MBR process 0.815 MLDVolume to RO system 0.815 MLDVolume of potable quality water for reuse 0.65 MLD
Figure 5.38 Treatment scheme at Kanes Foods, schematic
1856174817_Ch05.qxd 6/6/06 5:13 PM Page 254
has been 20 g/L, but the bioreactor is generally operated at around 10 g/L resultingin food-to-micro-organism (F:M) ratios of around 0.13 kg COD/kg MLSS day. Sludgeproduction is calculated as being 0.14 kg DS/kg COD removed from a sludge age ofover 100 days. Each membrane bank (Fig. 5.39) comprises three 200 mm diametermodules, fitted with MT UF (0.03 �m pore, Norit X-Flow) membranes, with space for expansion to up to five modules. The membranes operate at an average flux of153 LMH normalised to 25°C. The permeate water has mean TSS, BOD and COD con-centrations of 4, 7 and 16 mg/L, respectively, with COD residuals generally rangingbetween 5 and 25 mg/L.
Up to 34 m3/h of the UF permeate is passed to a two-stage reverse osmosis plant com-prising low fouling RO membrane modules arranged as a 3 � 2 array which achievesan overall recovery of 75–80%. The reject stream from the second stage is discharged
Case studies 255
Table 5.20 Summary of process treatment scheme, Kanes Foods
Process stage Characteristics
Preliminary screening Rotary drum screen, 0.75 mmBalancing 900 m3 balance tank c/w mixing/aerationSecondary screening Backflushing filter/screen, 0.5 mmBiological treatment 2 No. 250 m3 Bioreactors c/w mixing/aerationUF membrane separation 4 No. Membrane banks, 324 m2 total membrane area, 34 m3/hReverse osmosis two stage RO system, 27 m3/hUV disinfection UV disinfection unit, 27 m3/hSludge handling 22 m3 Sludge tank
Figure 5.39 UF membrane banks at Kanes Foods
1856174817_Ch05.qxd 6/6/06 5:13 PM Page 255
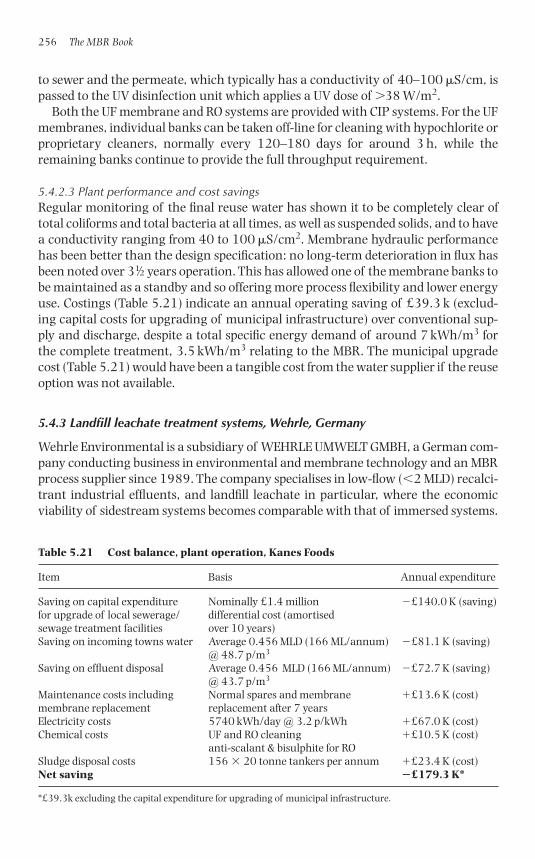
to sewer and the permeate, which typically has a conductivity of 40–100 �S/cm, ispassed to the UV disinfection unit which applies a UV dose of �38 W/m2.
Both the UF membrane and RO systems are provided with CIP systems. For the UFmembranes, individual banks can be taken off-line for cleaning with hypochlorite orproprietary cleaners, normally every 120–180 days for around 3 h, while theremaining banks continue to provide the full throughput requirement.
5.4.2.3 Plant performance and cost savingsRegular monitoring of the final reuse water has shown it to be completely clear oftotal coliforms and total bacteria at all times, as well as suspended solids, and to havea conductivity ranging from 40 to 100 �S/cm2. Membrane hydraulic performancehas been better than the design specification: no long-term deterioration in flux hasbeen noted over 31⁄2 years operation. This has allowed one of the membrane banks tobe maintained as a standby and so offering more process flexibility and lower energyuse. Costings (Table 5.21) indicate an annual operating saving of £39.3 k (exclud-ing capital costs for upgrading of municipal infrastructure) over conventional sup-ply and discharge, despite a total specific energy demand of around 7 kWh/m3 forthe complete treatment, 3.5 kWh/m3 relating to the MBR. The municipal upgradecost (Table 5.21) would have been a tangible cost from the water supplier if the reuseoption was not available.
5.4.3 Landfill leachate treatment systems, Wehrle, Germany
Wehrle Environmental is a subsidiary of WEHRLE UMWELT GMBH, a German com-pany conducting business in environmental and membrane technology and an MBRprocess supplier since 1989. The company specialises in low-flow (�2 MLD) recalci-trant industrial effluents, and landfill leachate in particular, where the economicviability of sidestream systems becomes comparable with that of immersed systems.
256 The MBR Book
Table 5.21 Cost balance, plant operation, Kanes Foods
Item Basis Annual expenditure
Saving on capital expenditure Nominally £1.4 million �£140.0 K (saving)for upgrade of local sewerage/ differential cost (amortisedsewage treatment facilities over 10 years)Saving on incoming towns water Average 0.456 MLD (166 ML/annum) �£81.1 K (saving)
@ 48.7 p/m3
Saving on effluent disposal Average 0.456 MLD (166 ML/annum) �£72.7 K (saving)@ 43.7 p/m3
Maintenance costs including Normal spares and membrane �£13.6 K (cost)membrane replacement replacement after 7 yearsElectricity costs 5740 kWh/day @ 3.2 p/kWh �£67.0 K (cost)Chemical costs UF and RO cleaning �£10.5 K (cost)
anti-scalant & bisulphite for ROSludge disposal costs 156 � 20 tonne tankers per annum �£23.4 K (cost)Net saving �£179.3 K*
*£39.3k excluding the capital expenditure for upgrading of municipal infrastructure.
1856174817_Ch05.qxd 6/6/06 5:13 PM Page 256
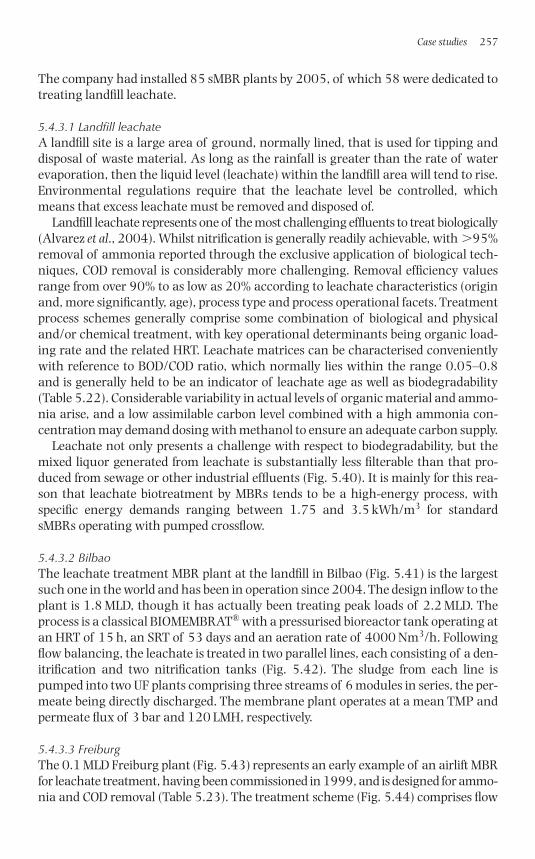
The company had installed 85 sMBR plants by 2005, of which 58 were dedicated totreating landfill leachate.
5.4.3.1 Landfill leachateA landfill site is a large area of ground, normally lined, that is used for tipping anddisposal of waste material. As long as the rainfall is greater than the rate of waterevaporation, then the liquid level (leachate) within the landfill area will tend to rise.Environmental regulations require that the leachate level be controlled, whichmeans that excess leachate must be removed and disposed of.
Landfill leachate represents one of the most challenging effluents to treat biologically(Alvarez et al., 2004). Whilst nitrification is generally readily achievable, with �95%removal of ammonia reported through the exclusive application of biological tech-niques, COD removal is considerably more challenging. Removal efficiency valuesrange from over 90% to as low as 20% according to leachate characteristics (originand, more significantly, age), process type and process operational facets. Treatmentprocess schemes generally comprise some combination of biological and physicaland/or chemical treatment, with key operational determinants being organic load-ing rate and the related HRT. Leachate matrices can be characterised convenientlywith reference to BOD/COD ratio, which normally lies within the range 0.05–0.8and is generally held to be an indicator of leachate age as well as biodegradability(Table 5.22). Considerable variability in actual levels of organic material and ammo-nia arise, and a low assimilable carbon level combined with a high ammonia con-centration may demand dosing with methanol to ensure an adequate carbon supply.
Leachate not only presents a challenge with respect to biodegradability, but themixed liquor generated from leachate is substantially less filterable than that pro-duced from sewage or other industrial effluents (Fig. 5.40). It is mainly for this rea-son that leachate biotreatment by MBRs tends to be a high-energy process, withspecific energy demands ranging between 1.75 and 3.5 kWh/m3 for standardsMBRs operating with pumped crossflow.
5.4.3.2 BilbaoThe leachate treatment MBR plant at the landfill in Bilbao (Fig. 5.41) is the largestsuch one in the world and has been in operation since 2004. The design inflow to theplant is 1.8 MLD, though it has actually been treating peak loads of 2.2 MLD. Theprocess is a classical BIOMEMBRAT® with a pressurised bioreactor tank operating atan HRT of 15 h, an SRT of 53 days and an aeration rate of 4000 Nm3/h. Followingflow balancing, the leachate is treated in two parallel lines, each consisting of a den-itrification and two nitrification tanks (Fig. 5.42). The sludge from each line ispumped into two UF plants comprising three streams of 6 modules in series, the per-meate being directly discharged. The membrane plant operates at a mean TMP andpermeate flux of 3 bar and 120 LMH, respectively.
5.4.3.3 FreiburgThe 0.1 MLD Freiburg plant (Fig. 5.43) represents an early example of an airlift MBRfor leachate treatment, having been commissioned in 1999, and is designed for ammo-nia and COD removal (Table 5.23). The treatment scheme (Fig. 5.44) comprises flow
Case studies 257
1856174817_Ch05.qxd 6/6/06 5:13 PM Page 257
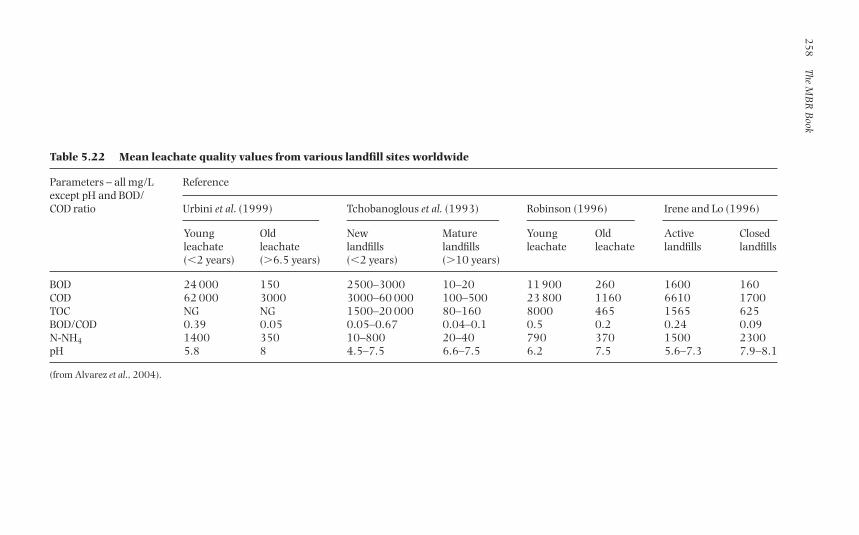
25
8The M
BR
Book
Table 5.22 Mean leachate quality values from various landfill sites worldwide
Parameters – all mg/Lexcept pH and BOD/
Reference
COD ratio Urbini et al. (1999) Tchobanoglous et al. (1993) Robinson (1996) Irene and Lo (1996)
Young Old New Mature Young Old Active Closedleachate leachate landfills landfills leachate leachate landfills landfills(�2 years) (�6.5 years) (�2 years) (�10 years)
BOD 24 000 150 2500–3000 10–20 11 900 260 1600 160COD 62 000 3000 3000–60 000 100–500 23 800 1160 6610 1700TOC NG NG 1500–20 000 80–160 8000 465 1565 625BOD/COD 0.39 0.05 0.05–0.67 0.04–0.1 0.5 0.2 0.24 0.09N-NH4 1400 350 10–800 20–40 790 370 1500 2300pH 5.8 8 4.5–7.5 6.6–7.5 6.2 7.5 5.6–7.3 7.9–8.1
(from Alvarez et al., 2004).
1856174817_Ch05.qxd 6/6/06 5:13 PM Page 258
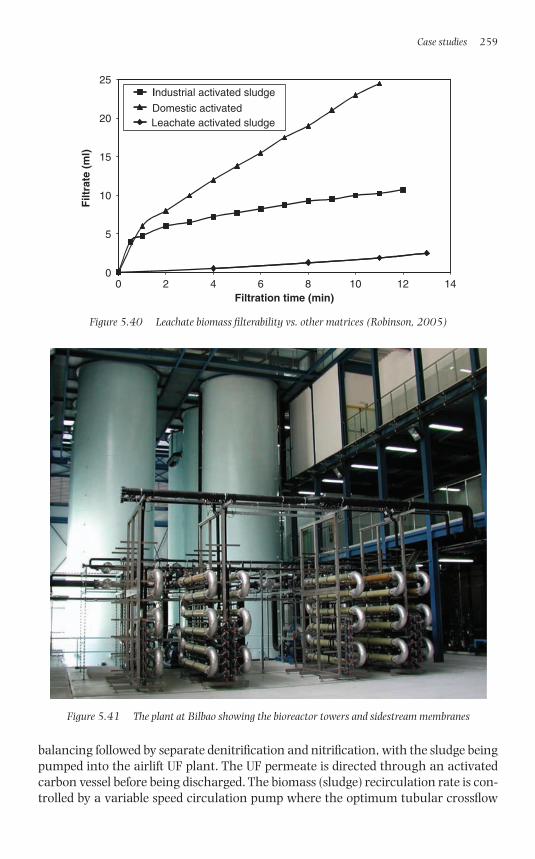
balancing followed by separate denitrification and nitrification, with the sludge beingpumped into the airlift UF plant. The UF permeate is directed through an activatedcarbon vessel before being discharged. The biomass (sludge) recirculation rate is con-trolled by a variable speed circulation pump where the optimum tubular crossflow
Case studies 259
0
5
10
15
20
25
0 2 4 6 8 10 12 14
IF
iltra
te (
ml)
Industrial activated sludge
Domestic activatedLeachate activated sludge
Filtration time (min)
Figure 5.40 Leachate biomass filterability vs. other matrices (Robinson, 2005)
Figure 5.41 The plant at Bilbao showing the bioreactor towers and sidestream membranes
1856174817_Ch05.qxd 6/6/06 5:13 PM Page 259
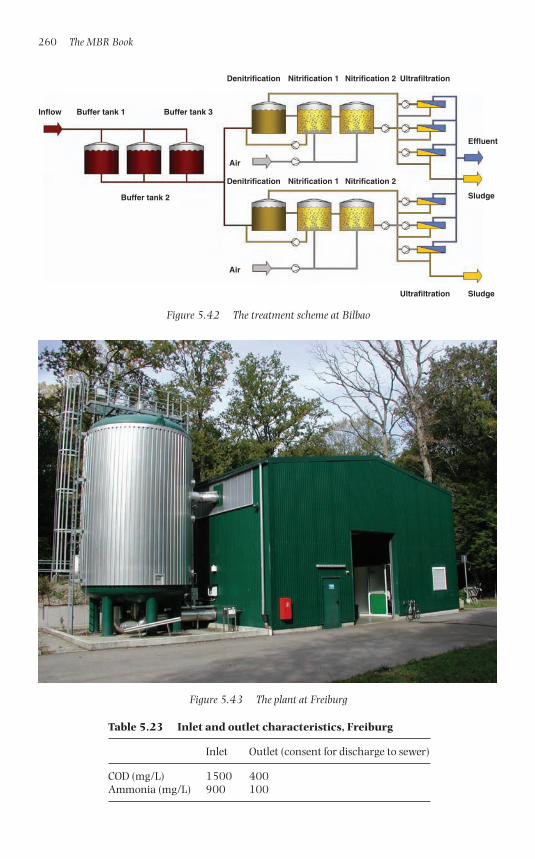
260 The MBR Book
Denitrification Nitrification 1 Nitrification 2
Denitrification Nitrification 1 Nitrification 2
Ultrafiltration
Ultrafiltration
Effluent
Sludge
Sludge
Air
Air
Buffer tank 2
Buffer tank 3Buffer tank 1Inflow
Figure 5.42 The treatment scheme at Bilbao
Figure 5.43 The plant at Freiburg
Table 5.23 Inlet and outlet characteristics, Freiburg
Inlet Outlet (consent for discharge to sewer)
COD (mg/L) 1500 400Ammonia (mg/L) 900 100
1856174817_Ch05.qxd 6/6/06 5:14 PM Page 260
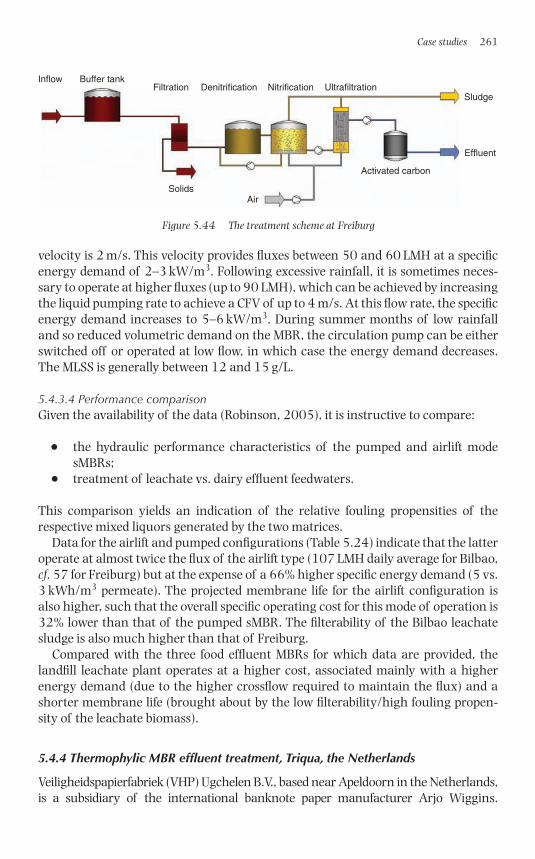
velocity is 2 m/s. This velocity provides fluxes between 50 and 60 LMH at a specificenergy demand of 2–3 kW/m3. Following excessive rainfall, it is sometimes neces-sary to operate at higher fluxes (up to 90 LMH), which can be achieved by increasingthe liquid pumping rate to achieve a CFV of up to 4 m/s. At this flow rate, the specificenergy demand increases to 5–6 kW/m3. During summer months of low rainfalland so reduced volumetric demand on the MBR, the circulation pump can be eitherswitched off or operated at low flow, in which case the energy demand decreases.The MLSS is generally between 12 and 15 g/L.
5.4.3.4 Performance comparisonGiven the availability of the data (Robinson, 2005), it is instructive to compare:
● the hydraulic performance characteristics of the pumped and airlift modesMBRs;
● treatment of leachate vs. dairy effluent feedwaters.
This comparison yields an indication of the relative fouling propensities of therespective mixed liquors generated by the two matrices.
Data for the airlift and pumped configurations (Table 5.24) indicate that the latteroperate at almost twice the flux of the airlift type (107 LMH daily average for Bilbao,cf. 57 for Freiburg) but at the expense of a 66% higher specific energy demand (5 vs.3 kWh/m3 permeate). The projected membrane life for the airlift configuration isalso higher, such that the overall specific operating cost for this mode of operation is32% lower than that of the pumped sMBR. The filterability of the Bilbao leachatesludge is also much higher than that of Freiburg.
Compared with the three food effluent MBRs for which data are provided, thelandfill leachate plant operates at a higher cost, associated mainly with a higherenergy demand (due to the higher crossflow required to maintain the flux) and ashorter membrane life (brought about by the low filterability/high fouling propen-sity of the leachate biomass).
5.4.4 Thermophylic MBR effluent treatment, Triqua, the Netherlands
Veiligheidspapierfabriek (VHP) Ugchelen B.V., based near Apeldoorn in the Netherlands,is a subsidiary of the international banknote paper manufacturer Arjo Wiggins.
Case studies 261
Inflow Buffer tankFiltration Denitrification Nitrification Ultrafiltration
SolidsAir
Activated carbon
Effluent
Sludge
Figure 5.44 The treatment scheme at Freiburg
1856174817_Ch05.qxd 6/6/06 5:14 PM Page 261
Banknote paper is made from cotton combers bleached with sodium hydroxide andhydrogen peroxide. The project concerned the use of an MBR, originally developedfor landfill leachate treatment, operating under thermophilic conditions for remov-ing colloidal and high molecular weight dissolved material to allow the reuse ofwastewater from the bleaching plant. The process, based on 8 mm diameter MTpolyvinyllidene difluoride (PVDF) membranes, has been piloted on a variety of high-strength recalcitrant industrial effluents.
A trial was originally conducted between June and October 1999 for the clarifica-tion of wastewater from the bleaching plant. Wastewater from the bleaching processhas a mean COD of 4500 mg/L, a pH of �12 and a temperature of 75–85°C. Thequality of the effluent from these trials, which has a COD of around 400 mg/L, wassufficient to allow it to be reused in the bleaching vessels and led to the decision toinstall a full-scale plant (Fig. 5.45) with a capacity of 0.24 MLD in November 2000.
The system comprises a buffer tank followed by a dual-chamber DAF process forthe removal of cotton flocks and fibres. In the second chamber, waste carbon dioxidefrom the boiler house is introduced to lower the pH of the solution from �12 to 8–9,an ingenious use of waste gas which reduces CO2 emissions. The pH-adjusted clarifiedeffluent is then transferred to the MBR aeration tank, 250 m3 in volume and thusproviding an HRT of �24 h. The MBR operates at between 55°C and 60°C and anMLSS of 20 g/L. Three sidestream MT membrane units are employed (Fig. 5.46), eachcomprising 6 � 3 m-long modules in series with each module having a membranearea of 4 m2 and hence providing a total area of 72 m2. The membrane units operateat a mean flux of �120 LMH, an average TMP of 4 bar, and a mean crossflow veloc-ity of �4.5 m/s. The permeate COD concentration is 400–500 mg/L, and it isreheated by passing it through a heat exchanger with the influent before being reused
262 The MBR Book
Table 5.24 Data for various Wehrle leachate and food effluent treatment plant
Customer/site: Units Freiburg Bilbao Kellogg Dairy Crest Dairy GoldApplication: Leachate Leachate Food Dairy Dairy
Airlift Pumped Pumped Pumped Pumped
Flow rate MLD 0.12 1.8 1.8 1.2 2.0Membrane area m2 88 700 864 486 648Flux (year average) LMH 54 102 71 98 125Flux (day average) LMH 57 107 87 103 129Membrane price total € 19 360 189 000 198 400 111 600 163 200Membrane life years 6 4 4.50 5.00 6.00Membrane replacement €/a 3227 47 250 44 089 22 320 27 200costSpecific energy demandb kWh/m3 3 5 3.75 3.18 2.14Specific energy cost €/kWh 0.06 0.06 0.06 0.06 0.06Total energy cost €/a 7490 187 245 121 564 79 347 91 264Total operating costc
€/a 10 716 234 495 165 653 101 667 118 464Total specific operating €/m3 0.26 0.38 0.31 0.24 0.17cost
aMembrane � Biology � CivilsbUF stagecSum of energy and membrane replacementRobinson (2005).
1856174817_Ch05.qxd 6/6/06 5:14 PM Page 262
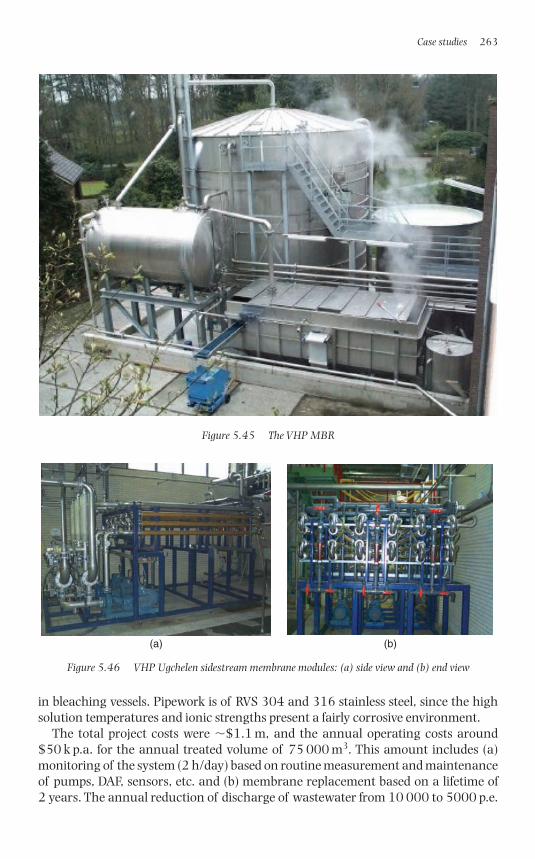
in bleaching vessels. Pipework is of RVS 304 and 316 stainless steel, since the highsolution temperatures and ionic strengths present a fairly corrosive environment.
The total project costs were �$1.1 m, and the annual operating costs around$50 k p.a. for the annual treated volume of 75 000 m3. This amount includes (a)monitoring of the system (2 h/day) based on routine measurement and maintenanceof pumps, DAF, sensors, etc. and (b) membrane replacement based on a lifetime of2 years. The annual reduction of discharge of wastewater from 10 000 to 5000 p.e.
Case studies 263
Figure 5.45 The VHP MBR
(a) (b)
Figure 5.46 VHP Ugchelen sidestream membrane modules: (a) side view and (b) end view
1856174817_Ch05.qxd 6/6/06 5:14 PM Page 263
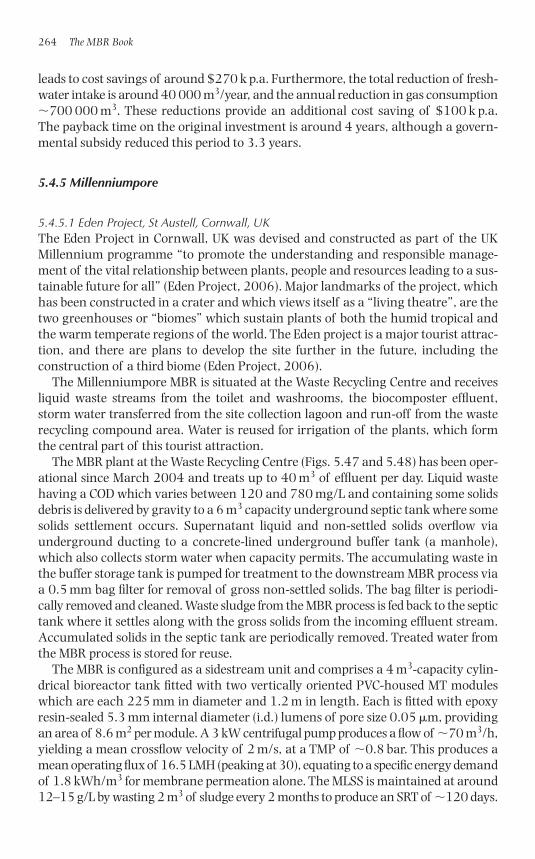
leads to cost savings of around $270 k p.a. Furthermore, the total reduction of fresh-water intake is around 40 000 m3/year, and the annual reduction in gas consumption�700 000 m3. These reductions provide an additional cost saving of $100 k p.a.The payback time on the original investment is around 4 years, although a govern-mental subsidy reduced this period to 3.3 years.
5.4.5 Millenniumpore
5.4.5.1 Eden Project, St Austell, Cornwall, UKThe Eden Project in Cornwall, UK was devised and constructed as part of the UKMillennium programme “to promote the understanding and responsible manage-ment of the vital relationship between plants, people and resources leading to a sus-tainable future for all” (Eden Project, 2006). Major landmarks of the project, whichhas been constructed in a crater and which views itself as a “living theatre”, are thetwo greenhouses or “biomes” which sustain plants of both the humid tropical andthe warm temperate regions of the world. The Eden project is a major tourist attrac-tion, and there are plans to develop the site further in the future, including theconstruction of a third biome (Eden Project, 2006).
The Millenniumpore MBR is situated at the Waste Recycling Centre and receivesliquid waste streams from the toilet and washrooms, the biocomposter effluent,storm water transferred from the site collection lagoon and run-off from the wasterecycling compound area. Water is reused for irrigation of the plants, which formthe central part of this tourist attraction.
The MBR plant at the Waste Recycling Centre (Figs. 5.47 and 5.48) has been oper-ational since March 2004 and treats up to 40 m3 of effluent per day. Liquid wastehaving a COD which varies between 120 and 780 mg/L and containing some solidsdebris is delivered by gravity to a 6 m3 capacity underground septic tank where somesolids settlement occurs. Supernatant liquid and non-settled solids overflow viaunderground ducting to a concrete-lined underground buffer tank (a manhole),which also collects storm water when capacity permits. The accumulating waste inthe buffer storage tank is pumped for treatment to the downstream MBR process viaa 0.5 mm bag filter for removal of gross non-settled solids. The bag filter is periodi-cally removed and cleaned. Waste sludge from the MBR process is fed back to the septictank where it settles along with the gross solids from the incoming effluent stream.Accumulated solids in the septic tank are periodically removed. Treated water fromthe MBR process is stored for reuse.
The MBR is configured as a sidestream unit and comprises a 4 m3-capacity cylin-drical bioreactor tank fitted with two vertically oriented PVC-housed MT moduleswhich are each 225 mm in diameter and 1.2 m in length. Each is fitted with epoxyresin-sealed 5.3 mm internal diameter (i.d.) lumens of pore size 0.05 �m, providingan area of 8.6 m2 per module. A 3 kW centrifugal pump produces a flow of �70 m3/h,yielding a mean crossflow velocity of 2 m/s, at a TMP of �0.8 bar. This produces amean operating flux of 16.5 LMH (peaking at 30), equating to a specific energy demandof 1.8 kWh/m3 for membrane permeation alone. The MLSS is maintained at around12–15 g/L by wasting 2 m3 of sludge every 2 months to produce an SRT of �120 days.
264 The MBR Book
1856174817_Ch05.qxd 6/6/06 5:14 PM Page 264
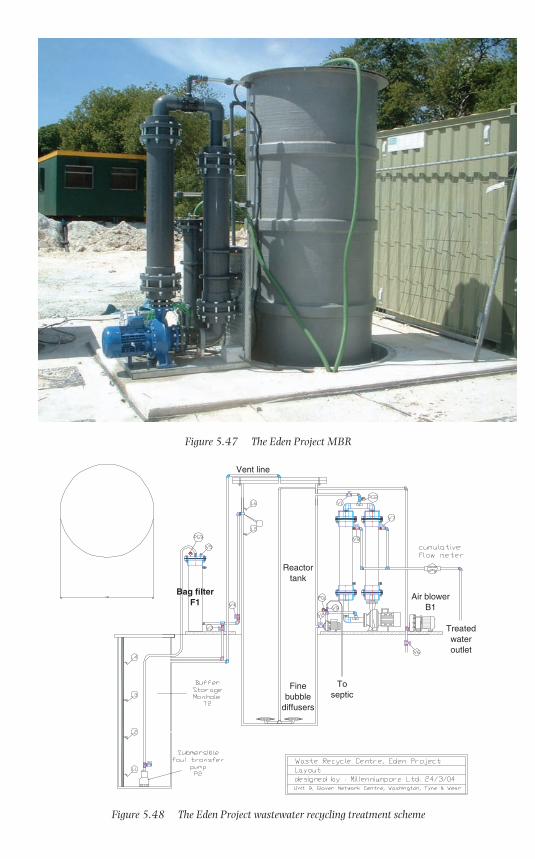
Figure 5.47 The Eden Project MBR
Finebubble
diffusers
Bag filterF1
Vent line
Air blowerB1
Treatedwateroutlet
Toseptic
Reactortank
Figure 5.48 The Eden Project wastewater recycling treatment scheme
1856174817_Ch05.qxd 6/6/06 5:14 PM Page 265
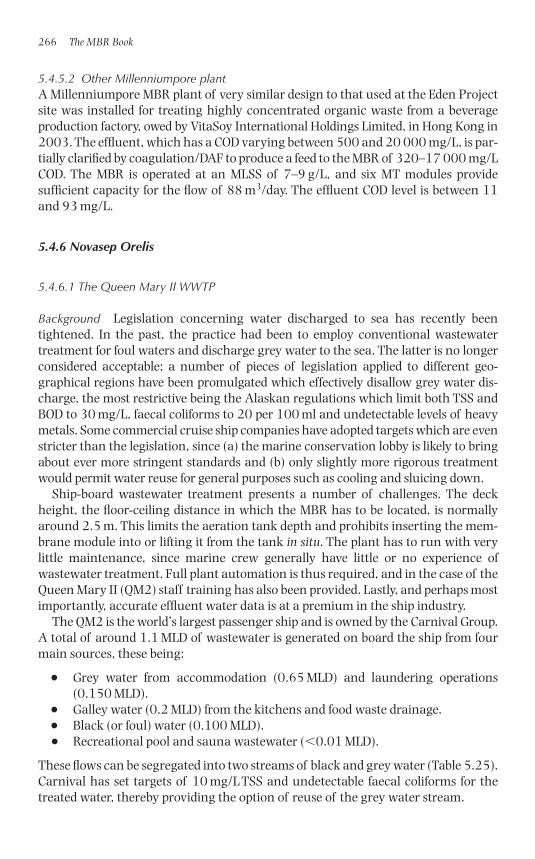
5.4.5.2 Other Millenniumpore plantA Millenniumpore MBR plant of very similar design to that used at the Eden Projectsite was installed for treating highly concentrated organic waste from a beverageproduction factory, owed by VitaSoy International Holdings Limited, in Hong Kong in2003. The effluent, which has a COD varying between 500 and 20 000 mg/L, is par-tially clarified by coagulation/DAF to produce a feed to the MBR of 320–17 000 mg/LCOD. The MBR is operated at an MLSS of 7–9 g/L, and six MT modules provide sufficient capacity for the flow of 88 m3/day. The effluent COD level is between 11and 93 mg/L.
5.4.6 Novasep Orelis
5.4.6.1 The Queen Mary II WWTP
Background Legislation concerning water discharged to sea has recently beentightened. In the past, the practice had been to employ conventional wastewatertreatment for foul waters and discharge grey water to the sea. The latter is no longerconsidered acceptable; a number of pieces of legislation applied to different geo-graphical regions have been promulgated which effectively disallow grey water dis-charge, the most restrictive being the Alaskan regulations which limit both TSS andBOD to 30 mg/L, faecal coliforms to 20 per 100 ml and undetectable levels of heavymetals. Some commercial cruise ship companies have adopted targets which are evenstricter than the legislation, since (a) the marine conservation lobby is likely to bringabout ever more stringent standards and (b) only slightly more rigorous treatmentwould permit water reuse for general purposes such as cooling and sluicing down.
Ship-board wastewater treatment presents a number of challenges. The deckheight, the floor-ceiling distance in which the MBR has to be located, is normallyaround 2.5 m. This limits the aeration tank depth and prohibits inserting the mem-brane module into or lifting it from the tank in situ. The plant has to run with verylittle maintenance, since marine crew generally have little or no experience ofwastewater treatment. Full plant automation is thus required, and in the case of theQueen Mary II (QM2) staff training has also been provided. Lastly, and perhaps mostimportantly, accurate effluent water data is at a premium in the ship industry.
The QM2 is the world’s largest passenger ship and is owned by the Carnival Group.A total of around 1.1 MLD of wastewater is generated on board the ship from fourmain sources, these being:
● Grey water from accommodation (0.65 MLD) and laundering operations(0.150 MLD).
● Galley water (0.2 MLD) from the kitchens and food waste drainage.● Black (or foul) water (0.100 MLD).● Recreational pool and sauna wastewater (�0.01 MLD).
These flows can be segregated into two streams of black and grey water (Table 5.25).Carnival has set targets of 10 mg/L TSS and undetectable faecal coliforms for thetreated water, thereby providing the option of reuse of the grey water stream.
266 The MBR Book
1856174817_Ch05.qxd 6/6/06 5:14 PM Page 266
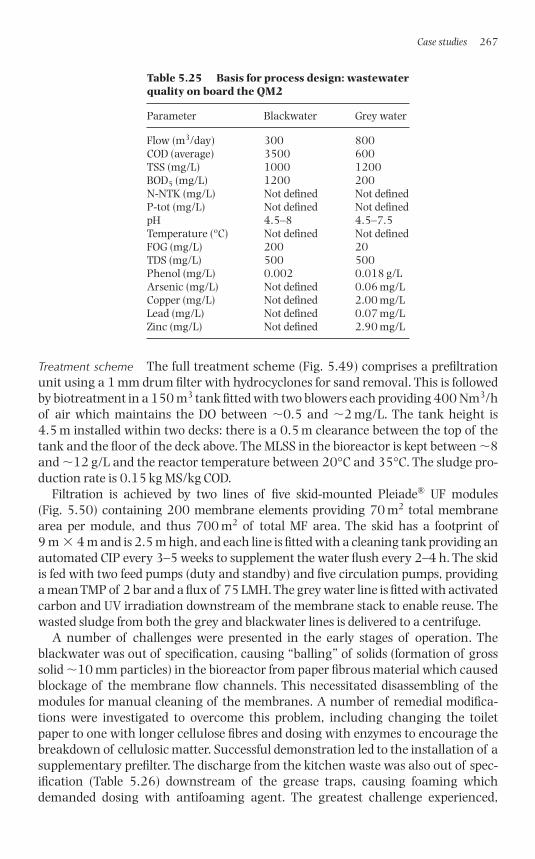
Treatment scheme The full treatment scheme (Fig. 5.49) comprises a prefiltrationunit using a 1 mm drum filter with hydrocyclones for sand removal. This is followedby biotreatment in a 150 m3 tank fitted with two blowers each providing 400 Nm3/hof air which maintains the DO between �0.5 and �2 mg/L. The tank height is4.5 m installed within two decks: there is a 0.5 m clearance between the top of thetank and the floor of the deck above. The MLSS in the bioreactor is kept between �8and �12 g/L and the reactor temperature between 20°C and 35°C. The sludge pro-duction rate is 0.15 kg MS/kg COD.
Filtration is achieved by two lines of five skid-mounted Pleiade® UF modules (Fig. 5.50) containing 200 membrane elements providing 70 m2 total membranearea per module, and thus 700 m2 of total MF area. The skid has a footprint of9 m � 4 m and is 2.5 m high, and each line is fitted with a cleaning tank providing anautomated CIP every 3–5 weeks to supplement the water flush every 2–4 h. The skidis fed with two feed pumps (duty and standby) and five circulation pumps, providinga mean TMP of 2 bar and a flux of 75 LMH. The grey water line is fitted with activatedcarbon and UV irradiation downstream of the membrane stack to enable reuse. Thewasted sludge from both the grey and blackwater lines is delivered to a centrifuge.
A number of challenges were presented in the early stages of operation. Theblackwater was out of specification, causing “balling” of solids (formation of grosssolid �10 mm particles) in the bioreactor from paper fibrous material which causedblockage of the membrane flow channels. This necessitated disassembling of themodules for manual cleaning of the membranes. A number of remedial modifica-tions were investigated to overcome this problem, including changing the toiletpaper to one with longer cellulose fibres and dosing with enzymes to encourage thebreakdown of cellulosic matter. Successful demonstration led to the installation of asupplementary prefilter. The discharge from the kitchen waste was also out of spec-ification (Table 5.26) downstream of the grease traps, causing foaming whichdemanded dosing with antifoaming agent. The greatest challenge experienced,
Case studies 267
Table 5.25 Basis for process design: wastewaterquality on board the QM2
Parameter Blackwater Grey water
Flow (m3/day) 300 800COD (average) 3500 600TSS (mg/L) 1000 1200BOD5 (mg/L) 1200 200N-NTK (mg/L) Not defined Not definedP-tot (mg/L) Not defined Not definedpH 4.5–8 4.5–7.5Temperature (ºC) Not defined Not definedFOG (mg/L) 200 20TDS (mg/L) 500 500Phenol (mg/L) 0.002 0.018 g/LArsenic (mg/L) Not defined 0.06 mg/LCopper (mg/L) Not defined 2.00 mg/LLead (mg/L) Not defined 0.07 mg/LZinc (mg/L) Not defined 2.90 mg/L
1856174817_Ch05.qxd 6/6/06 5:14 PM Page 267
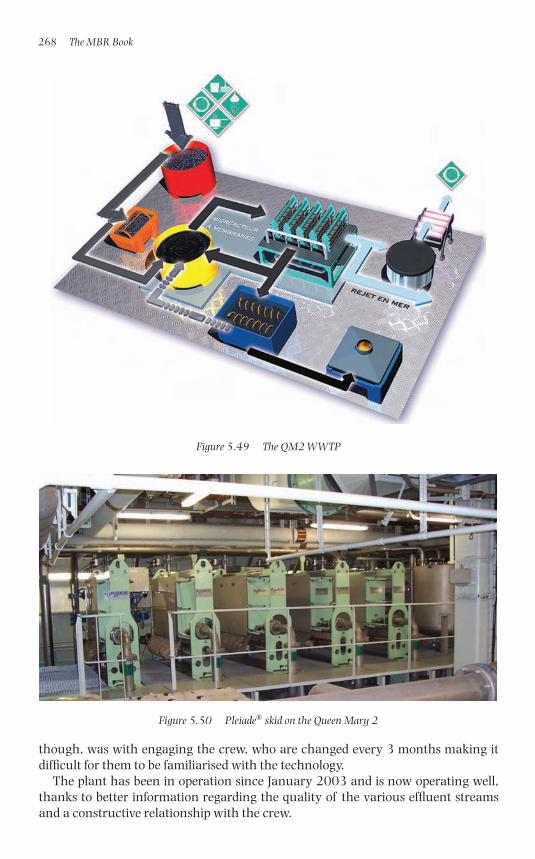
though, was with engaging the crew, who are changed every 3 months making itdifficult for them to be familiarised with the technology.
The plant has been in operation since January 2003 and is now operating well,thanks to better information regarding the quality of the various effluent streamsand a constructive relationship with the crew.
268 The MBR Book
Figure 5.50 Pleiade® skid on the Queen Mary 2
Figure 5.49 The QM2 WWTP
1856174817_Ch05.qxd 6/6/06 5:14 PM Page 268
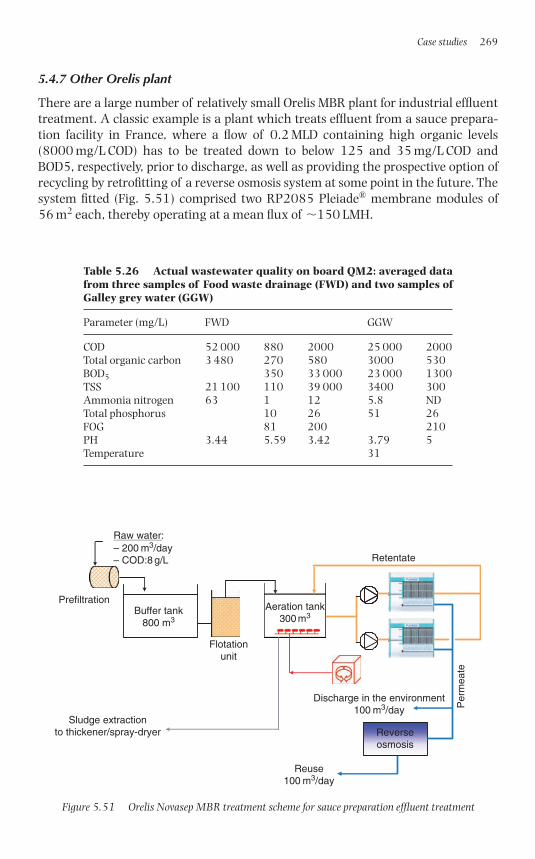
5.4.7 Other Orelis plant
There are a large number of relatively small Orelis MBR plant for industrial effluenttreatment. A classic example is a plant which treats effluent from a sauce prepara-tion facility in France, where a flow of 0.2 MLD containing high organic levels(8000 mg/L COD) has to be treated down to below 125 and 35 mg/L COD andBOD5, respectively, prior to discharge, as well as providing the prospective option ofrecycling by retrofitting of a reverse osmosis system at some point in the future. Thesystem fitted (Fig. 5.51) comprised two RP2085 Pleiade® membrane modules of56 m2 each, thereby operating at a mean flux of �150 LMH.
Case studies 269
Table 5.26 Actual wastewater quality on board QM2: averaged datafrom three samples of Food waste drainage (FWD) and two samples ofGalley grey water (GGW)
Parameter (mg/L) FWD GGW
COD 52 000 880 2000 25 000 2000Total organic carbon 3 480 270 580 3000 530BOD5 350 33 000 23 000 1300TSS 21 100 110 39 000 3400 300Ammonia nitrogen 63 1 12 5.8 NDTotal phosphorus 10 26 51 26FOG 81 200 210PH 3.44 5.59 3.42 3.79 5Temperature 31
Buffer tank800 m3
Flotationunit
Aeration tank300 m3
Raw water:– 200 m3/day– COD:8 g/L
Reverseosmosis
Reuse100 m3/day
Prefiltration
Sludge extractionto thickener/spray-dryer
Discharge in the environment100 m3/day
Retentate
Per
mea
te
Figure 5.51 Orelis Novasep MBR treatment scheme for sauce preparation effluent treatment
1856174817_Ch05.qxd 6/6/06 5:14 PM Page 269
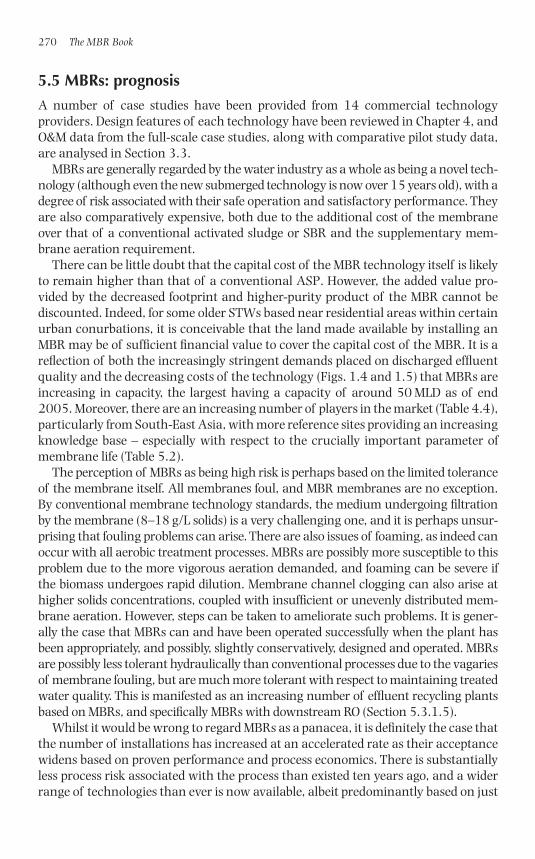
5.5 MBRs: prognosis
A number of case studies have been provided from 14 commercial technologyproviders. Design features of each technology have been reviewed in Chapter 4, andO&M data from the full-scale case studies, along with comparative pilot study data,are analysed in Section 3.3.
MBRs are generally regarded by the water industry as a whole as being a novel tech-nology (although even the new submerged technology is now over 15 years old), with adegree of risk associated with their safe operation and satisfactory performance. Theyare also comparatively expensive, both due to the additional cost of the membraneover that of a conventional activated sludge or SBR and the supplementary mem-brane aeration requirement.
There can be little doubt that the capital cost of the MBR technology itself is likelyto remain higher than that of a conventional ASP. However, the added value pro-vided by the decreased footprint and higher-purity product of the MBR cannot bediscounted. Indeed, for some older STWs based near residential areas within certainurban conurbations, it is conceivable that the land made available by installing anMBR may be of sufficient financial value to cover the capital cost of the MBR. It is areflection of both the increasingly stringent demands placed on discharged effluentquality and the decreasing costs of the technology (Figs. 1.4 and 1.5) that MBRs areincreasing in capacity, the largest having a capacity of around 50 MLD as of end2005. Moreover, there are an increasing number of players in the market (Table 4.4),particularly from South-East Asia, with more reference sites providing an increasingknowledge base – especially with respect to the crucially important parameter ofmembrane life (Table 5.2).
The perception of MBRs as being high risk is perhaps based on the limited toleranceof the membrane itself. All membranes foul, and MBR membranes are no exception.By conventional membrane technology standards, the medium undergoing filtrationby the membrane (8–18 g/L solids) is a very challenging one, and it is perhaps unsur-prising that fouling problems can arise. There are also issues of foaming, as indeed canoccur with all aerobic treatment processes. MBRs are possibly more susceptible to thisproblem due to the more vigorous aeration demanded, and foaming can be severe ifthe biomass undergoes rapid dilution. Membrane channel clogging can also arise athigher solids concentrations, coupled with insufficient or unevenly distributed mem-brane aeration. However, steps can be taken to ameliorate such problems. It is gener-ally the case that MBRs can and have been operated successfully when the plant hasbeen appropriately, and possibly, slightly conservatively, designed and operated. MBRsare possibly less tolerant hydraulically than conventional processes due to the vagariesof membrane fouling, but are much more tolerant with respect to maintaining treatedwater quality. This is manifested as an increasing number of effluent recycling plantsbased on MBRs, and specifically MBRs with downstream RO (Section 5.3.1.5).
Whilst it would be wrong to regard MBRs as a panacea, it is definitely the case thatthe number of installations has increased at an accelerated rate as their acceptancewidens based on proven performance and process economics. There is substantiallyless process risk associated with the process than existed ten years ago, and a widerrange of technologies than ever is now available, albeit predominantly based on just
270 The MBR Book
1856174817_Ch05.qxd 6/6/06 5:14 PM Page 270
two membrane module configurations. A number of process improvements havebeen introduced within the past 5–10 years to increase reliability and also to reducemembrane module fabrication and process O&M costs. As a result, the MBR processis becoming increasingly competitive, and few would predict that their increasingmarket penetration is likely to wane in the near future.
References
Alvarez-Vazquez, H., Jefferson, B. and Judd, S.J. (2004) Membrane bioreactors vs.conventional biological treatment of landfill leachate: a brief review. J. Chem.Technol. Biotechnol., 79(10), 1043–1049.
Catley, G. and Goodwin, S. (2004) Industrial water re-use, full scale studies in thefood industry: technical performance and cost savings, CIWEM 2nd NationalConference, September, Wakefield, UK.
Chen, T.K., Ni, C.H., Chen, J.N. and Lin, J. (2003) High-strength nitrogen removalof opto-electro industrial wastewater in membrane bioreactor – a pilot study. Wat.Sci. Techol., 48(1), pp. 191–198.
Churchouse, S. and Brindle, K. (2003) Long-term operating experience ofmembrane bioreactors, MBR4, April, Cranfield University, UK.
Côté, P., Belli, L., Rondi, S. and Meraviglia, I. (2004) Brescia large-scale membranebioreactor: case study, Paper Presented at UK MAIN, May, Cranfield University, UK.
Eden Project www.edenproject.com accessed February 2006.Irene, M. and Lo, C. (1996) Characteristics and treatment of leachates from
domestic landfills. Environ. Intern., 4, 433–442.Jeavons, J., Stokes, L., Upton, J. and Bingley, M. (1998) Successful sidestream nitri-
fication of digested sludge liquors. Wat. Sci. Techol., 38(3), 111–118.Judd, S. (1997) MBRs – why bother? Proceedings MBR1, Cranfield University, March.Judd, S. and Jefferson, B. (2003) Membranes for Industrial Wastewater Recovery and
Re-use. Elsevier, Oxford.Kennedy, S. and Churchouse, S.J. (2005) Progress in membrane bioreactors: new
advances, Proceedings of the Water and Wastewater Europe Conference, Milan, June.Lozier, J. and Fernandez, A. (2001) Using a membrane bioreactor/reverse osmosis
system for indirect potable reuse, Water Suppl 5–6(1) 303.Mitsubishi Rayon (2000). Sterapore Water Treatment, Case Reports 1 & 2: Dairy
and ume plum processing wastewater treatment system, and Livestock wastewatertreatment and reuse system
Mulder, J.W. and Kramer, F. (2005) Hybrid MBR – the Perfect Upgrade for Heenvliet,H2O, Rinus Visser, the Netherlands, pp. 66–68.
Paranjape, S. Reardon, R. and Foussereau, X. (2003) Pretreatment technology forreverse osmosis membrane used in wastewater reclamation application – past, pres-ent and future literature review, Proceedings of the 76th Water Environment FederationTechnical Exposition and Conference (WEFTEC), Oct., Los Angeles.
Qin, J.J., Kekre, K.A., Tao, G., Oo, M.H., Wai, M.N., Lee, T.C., Viswanath, B. andSeah, H. (2006) New option of MBR-RO process for production of NEWater fromdomestic sewage J. Membrane Sci., in press.
Case studies 271
1856174817_Ch05.qxd 6/6/06 5:14 PM Page 271
Robinson, H.D. (1995) A review of the composition of leachates from domesticwastes in landfill sites. Report Prepared for the UK Department of the Environment,Contract PECD 7/10/238, ref: DE0918A/FR1.
Robinson, A. (2005) Landfill leachate treatment, Proceedings MBR5, January2005, Cranfield University.
Symposium. S. Margherita di Pula, Cagliari, Italy, CISA. Environmental SanitaryEngineering Centre Cagliari, Italy, pp. 73–80.Tchobanoglous, G., Theisen, H. and Vigil, S.A. (1993) Integrated Solid Waste
Management: Engineering Principles and Management Issues. McGraw-HillInternational Editions, p. 978.
Trivedi, H.K. and Heinen, N. (2000) Simultaneous nitrification/denitrification bymonitoring NADH fluorescence in activated sludge, Proceedings of the 73rd WaterEnvironment Federation Technical Exposition and Conference, Anaheim, CA.
Urbini, G., Ariati, L., Teruggi, S. and Pace, C. (1999) Leachate Quality andProduction from Real Scale MSW Landfills, Proceedings of the Seventh Managementand Landfill Conference, Jun., Sardina.
272 The MBR Book
1856174817_Ch05.qxd 6/6/06 5:14 PM Page 272

Appendix A
Blower Power Consumption
1856174817_Appendices A.qxd 6/3/06 4:42 PM Page 273
An air blower is a mechanical process that increases the pressure of air by applyingshaft work. According to the first law of thermodynamics:
(A.1)
where Q � heat transferred, E � system energy and W � work done by the system.The system energy comprises kinetic energy (1⁄2 mu2, m and u being mass and velocity,respectively), potential energy (mgh, h being height and g being acceleration due togravity) and internal energy (e). The work done by the system is made up of externalwork (W) and work performed against forces due to pressure, p/�. From this informationit is possible to derive Equation (A.2) for a fluid moving at steady flow between points 1and 2 as illustrated in Fig. A.1.
(A.2)
This equation is known as the steady-flow energy equation. In this case the changein internal, kinetic and potential energy of the fluid are negligible, such that associ-ated terms in Equation (A.2) may be ignored. Ignoring, in the first instance, fric-tional losses, manifested as heat, �Q � 0. Because a blower exerts work on the fluidthe work term will be negative in this case and to simplify the equation this will beignored. The fluid density in this system is not constant and the conditions are saidto be adiabatic (change in density with no heat transferred to the gas):
(A.3)
where w is the work done per unit mass of fluid. For an ideal gas under adiabaticconditions
prl
� const
dwdp
�r
d
d
d
d
Qm
e eu u
g z zWm
p p� � �
�� � � �
�2 1
22
12
2 12 1
2( )
( )( ) (( )
r
� � � � �Q E W
274 The MBR Book
u1, p1
Shaft work dw
u2, p2
Heat input dQz1
z2
Figure A.1 Steady flow system
1856174817_Appendices A.qxd 6/3/06 4:42 PM Page 274
or
or
(A.4)
where � is the ratio of specific heat capacity at constant pressure to specific heatcapacity at constant volume (cp/cv) and is assumed to be constant. SubstitutingEquation (A.4) into Equation (A.3) and integrating between points 1 and 2:
This equation can be manipulated to give:
(A.5)
This equation gives the work done per unit mass by a blower that is 100% efficient.No mechanical process is 100% efficient so a term for the mechanical efficiency of thesystem (�) is added; this accounts for any losses in the system, including friction. w iswork per unit mass and power is total work per second. Equation (A.5) can be convertedinto power consumption in (W) by dividing by time. The density of air varies withtemperature according to:
(A.6)
Where T0 is the standard temperature (273°K). The power consumed, in kW, thusbecomes:
(A.7)
but
(A.8)V qt�
Pm
p
t
T p
p�
�
�
1
0
1 2
1
1
1000 1 273
l
lj r( )⎛
⎝⎜⎜⎜⎜
⎞
⎠⎟⎟⎟⎟⎟
11
1l
�
⎡
⎣
⎢⎢⎢⎢
⎤
⎦
⎥⎥⎥⎥
r rt 00
t
�T
T
wp p
p�
��
�
1
1
2
1
1
11
1
l
l
l
( )⎛
⎝⎜⎜⎜⎜
⎞
⎠⎟⎟⎟⎟⎟
⎡
⎣
⎢⎢⎢⎢
⎤
⎦r
⎥⎥⎥⎥⎥
wp p
p
pp p
p
p� �
��
� �1
1
1
1
21
11
1
1
1
1
2 1 1d
1 1
l
l
l
l
lr r( )∫ ll( )
rr
� 1
1
1
1
pp
l
l
p p1
1r rl l�
Appendix A: Blower power consumption 275
1856174817_Appendices A.qxd 6/3/06 4:42 PM Page 275

where V is volume, q is volumetric flow and t is time. Also:
(A.9)
Substituting Equation (A.9) into (A.7) provides theoretical blower power of:
(A.10)
Note: all values are in SI units unless otherwise stated.
Power2.73 10 1
1 15
2
1
�� �
p T q p
p
l
lj( )⎛
⎝⎜⎜⎜⎜
⎞
⎠⎟⎟⎟⎟⎟
11 1
1�
�l
⎡
⎣
⎢⎢⎢⎢
⎤
⎦
⎥⎥⎥⎥
r� �mV
mqt
276 The MBR Book
1856174817_Appendices A.qxd 6/3/06 4:42 PM Page 276

Appendix B
MBR Biotreatment Base Parameter Values
1856174817_Appendices B.qxd 6/3/06 4:43 PM Page 277
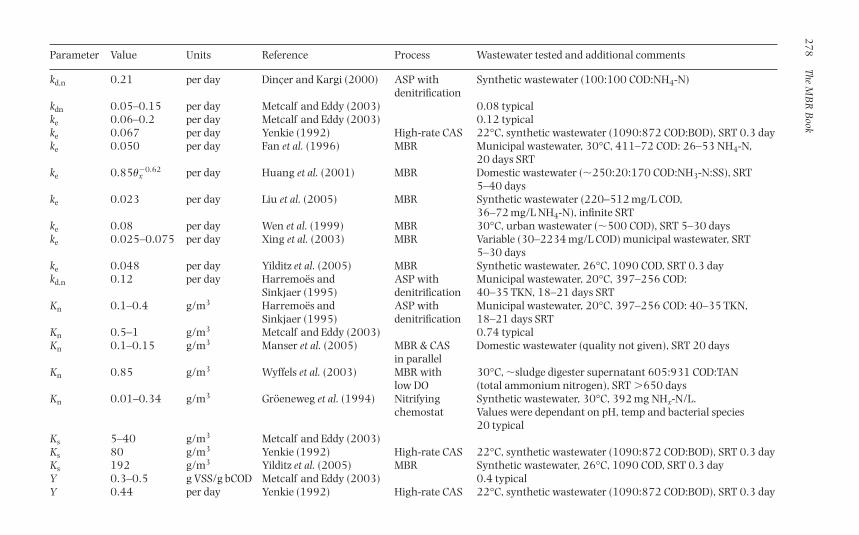
27
8The M
BR
Book
Parameter Value Units Reference Process Wastewater tested and additional comments
kd,n 0.21 per day Dinçer and Kargi (2000) ASP with Synthetic wastewater (100:100 COD:NH4-N)denitrification
kdn 0.05–0.15 per day Metcalf and Eddy (2003) 0.08 typicalke 0.06–0.2 per day Metcalf and Eddy (2003) 0.12 typicalke 0.067 per day Yenkie (1992) High-rate CAS 22°C, synthetic wastewater (1090:872 COD:BOD), SRT 0.3 dayke 0.050 per day Fan et al. (1996) MBR Municipal wastewater, 30°C, 411–72 COD: 26–53 NH4-N,
20 days SRTke 0.85�x
�0.62 per day Huang et al. (2001) MBR Domestic wastewater (�250:20:170 COD:NH3-N:SS), SRT5–40 days
ke 0.023 per day Liu et al. (2005) MBR Synthetic wastewater (220–512 mg/L COD,36–72 mg/L NH4-N), infinite SRT
ke 0.08 per day Wen et al. (1999) MBR 30°C, urban wastewater (�500 COD), SRT 5–30 dayske 0.025–0.075 per day Xing et al. (2003) MBR Variable (30–2234 mg/L COD) municipal wastewater, SRT
5–30 dayske 0.048 per day Yilditz et al. (2005) MBR Synthetic wastewater, 26°C, 1090 COD, SRT 0.3 daykd,n 0.12 per day Harremoës and ASP with Municipal wastewater, 20°C, 397–256 COD:
Sinkjaer (1995) denitrification 40–35 TKN, 18–21 days SRTKn 0.1–0.4 g/m3 Harremoës and ASP with Municipal wastewater, 20°C, 397–256 COD: 40–35 TKN,
Sinkjaer (1995) denitrification 18–21 days SRTKn 0.5–1 g/m3 Metcalf and Eddy (2003) 0.74 typicalKn 0.1–0.15 g/m3 Manser et al. (2005) MBR & CAS Domestic wastewater (quality not given), SRT 20 days
in parallelKn 0.85 g/m3 Wyffels et al. (2003) MBR with 30°C, �sludge digester supernatant 605:931 COD:TAN
low DO (total ammonium nitrogen), SRT �650 daysKn 0.01–0.34 g/m3 Gröeneweg et al. (1994) Nitrifying Synthetic wastewater, 30°C, 392 mg NHx-N/L.
chemostat Values were dependant on pH, temp and bacterial species20 typical
Ks 5–40 g/m3 Metcalf and Eddy (2003)Ks 80 g/m3 Yenkie (1992) High-rate CAS 22°C, synthetic wastewater (1090:872 COD:BOD), SRT 0.3 dayKs 192 g/m3 Yilditz et al. (2005) MBR Synthetic wastewater, 26°C, 1090 COD, SRT 0.3 dayY 0.3–0.5 g VSS/g bCOD Metcalf and Eddy (2003) 0.4 typicalY 0.44 per day Yenkie (1992) High-rate CAS 22°C, synthetic wastewater (1090:872 COD:BOD), SRT 0.3 day
1856174817_Appendices B.qxd 6/3/06 4:43 PM Page 278
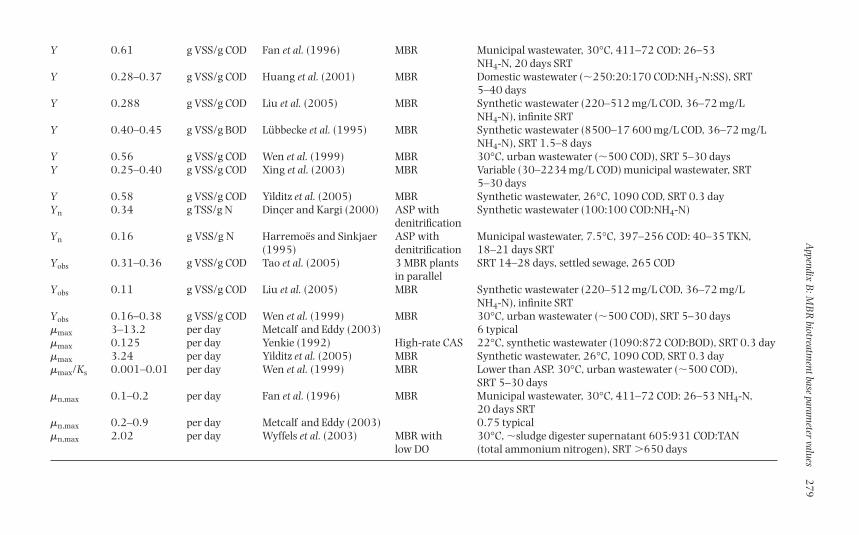
Appendix B
: MB
R biotreatm
ent base parameter values
27
9Y 0.61 g VSS/g COD Fan et al. (1996) MBR Municipal wastewater, 30°C, 411–72 COD: 26–53
NH4-N, 20 days SRTY 0.28–0.37 g VSS/g COD Huang et al. (2001) MBR Domestic wastewater (�250:20:170 COD:NH3-N:SS), SRT
5–40 daysY 0.288 g VSS/g COD Liu et al. (2005) MBR Synthetic wastewater (220–512 mg/L COD, 36–72 mg/L
NH4-N), infinite SRTY 0.40–0.45 g VSS/g BOD Lübbecke et al. (1995) MBR Synthetic wastewater (8500–17 600 mg/L COD, 36–72 mg/L
NH4-N), SRT 1.5–8 days Y 0.56 g VSS/g COD Wen et al. (1999) MBR 30°C, urban wastewater (�500 COD), SRT 5–30 daysY 0.25–0.40 g VSS/g COD Xing et al. (2003) MBR Variable (30–2234 mg/L COD) municipal wastewater, SRT
5–30 daysY 0.58 g VSS/g COD Yilditz et al. (2005) MBR Synthetic wastewater, 26°C, 1090 COD, SRT 0.3 dayYn 0.34 g TSS/g N Dinçer and Kargi (2000) ASP with Synthetic wastewater (100:100 COD:NH4-N)
denitrificationYn 0.16 g VSS/g N Harremoës and Sinkjaer ASP with Municipal wastewater, 7.5°C, 397–256 COD: 40–35 TKN,
(1995) denitrification 18–21 days SRTYobs 0.31–0.36 g VSS/g COD Tao et al. (2005) 3 MBR plants SRT 14–28 days, settled sewage, 265 COD
in parallelYobs 0.11 g VSS/g COD Liu et al. (2005) MBR Synthetic wastewater (220–512 mg/L COD, 36–72 mg/L
NH4-N), infinite SRTYobs 0.16–0.38 g VSS/g COD Wen et al. (1999) MBR 30°C, urban wastewater (�500 COD), SRT 5–30 days�max 3–13.2 per day Metcalf and Eddy (2003) 6 typical�max 0.125 per day Yenkie (1992) High-rate CAS 22°C, synthetic wastewater (1090:872 COD:BOD), SRT 0.3 day�max 3.24 per day Yilditz et al. (2005) MBR Synthetic wastewater, 26°C, 1090 COD, SRT 0.3 day�max/Ks 0.001–0.01 per day Wen et al. (1999) MBR Lower than ASP. 30°C, urban wastewater (�500 COD),
SRT 5–30 days�n,max 0.1–0.2 per day Fan et al. (1996) MBR Municipal wastewater, 30°C, 411–72 COD: 26–53 NH4-N,
20 days SRT�n,max 0.2–0.9 per day Metcalf and Eddy (2003) 0.75 typical�n,max 2.02 per day Wyffels et al. (2003) MBR with 30°C, �sludge digester supernatant 605:931 COD:TAN
low DO (total ammonium nitrogen), SRT �650 days
1856174817_Appendices B.qxd 6/3/06 4:43 PM Page 279
References
Dinçer, A. and Kargi, F. (2000) Kinetics of sequential nitrification and denitrificationprocesses. Enzyme Microb. Tech., 27, 37–42.
Fan, X-J., Urbain, V., Qian, Y. and Manem, J. (1996) Nitrification and mass balancewith a membrane bioreactor for municipal wastewater treatment. Water Sci. Technol.,34(1–2), 129–136.
Gröeneweg, J., Sellner, B. and Tappe, W. (1994) Ammonia oxidation in Nitrosomonasat NH3 concentrations near Km: effects of pH and temperature. Water Res., 28(12),2561–2566.
Harremoës, P. and Sinkjaer, O. (1995) Kinetic interpretation of nitrogen removalin pilot scale experiments. Water Res., 29(3), 899–905.
Huang, X., Gui, P. and Qian, Y. (2001) Effect of sludge retention time on microbialbehaviour in a submerged membrane bioreactor. Process Biochem., 36, 1001–1006.
Lübbecke, S., Vogelpohl, A. and Dewjanin W. (1995) Wastewater treatment in abiological high performance system with high biomass concentration. Water Res.,29(3), 793–802.
Liu, R., Huang, X., Jinying, X. and Quan, Y. (2005) Microbial behaviour in a mem-brane bioreactor with complete sludge retention. Process Biochem., 40, 3165–3170.
Manser, R., Gujer, W. and Hansruedi, S. (2005) Consequences of mass transfereffects on the kinetics of nitrifiers. Water Res., 39, 4633–4642.
Metcalf and Eddy (2003) Wastewater Engineering – Treatment and Reuse (3rd edn.).McGraw-Hill, New York.
Tao, G., Kekre, K., Wei, Z., Lee, T.-C., Viswanath, B. and Seah, H. (2005) Membranebioreactors for water reclamation. Water Sci. Technol., 51(6–7), 431–440.
Wen, X.-H., Xing, C.-H. and Qian, Y. (1999) A kinetic model for the prediction ofsludge formation in a membrane bioreactor. Process Biochem., 35, 249–254.
Wyffels, S., Van Hulle, S., Boeckx, P., Volcke, E., Van Cleemput, O., Vanrolleghem, P.and Verstraete, W. (2003) Modelling and simulation of oxygen-limited partial nitrita-tion in a membrane assisted bioreactor (MBR). Biotechnol. Bioeng., 86(5), 531–542.
Xing, C.-H., Wu, W.-Z., Qian, Y. and Tardieu, E. (2003) Excess sludge production inmembrane bioreactors: a theoretical investigation. J. Environ. Eng., 129(4), 291–297.
Yenkie, M., Gerssen, S. and Vogelphol, A. (1992) Biokinetics of wastewater treat-ment in the high performance compact reactor (HCR). Chem. Eng. J., 49, B1–B12.
Yilditz, E., Keskinler, B., Pekdemir, T., Akay, G. and Nuhoglu, A. (2005) Highstrength wastewater in a jet loop membrane bioreactor: kinetics and performanceevaluation. Chem. Eng. Sci., 60, 1103–1116.
280 The MBR Book
1856174817_Appendices B.qxd 6/3/06 4:43 PM Page 280

Appendix C
Hollow Fibre Module Parameters
1856174817_Appendices C.qxd 6/3/06 4:44 PM Page 281
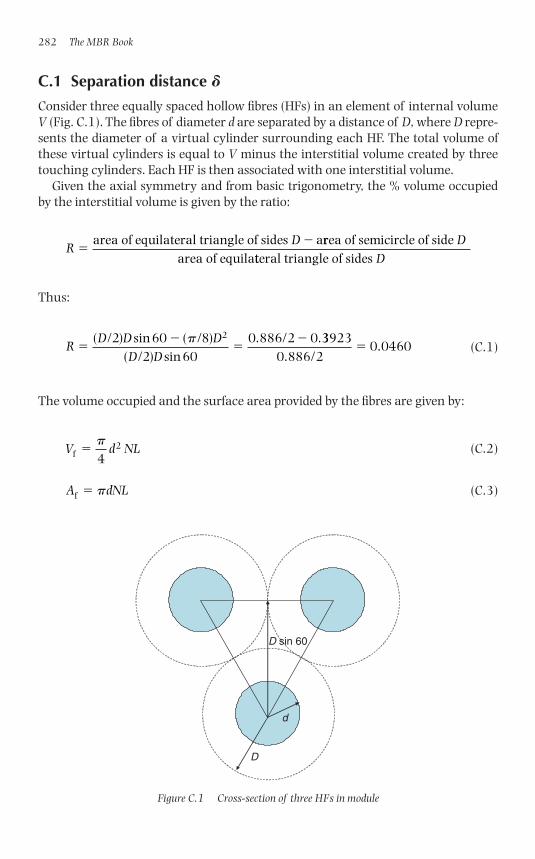
C.1 Separation distance D
Consider three equally spaced hollow fibres (HFs) in an element of internal volumeV (Fig. C.1). The fibres of diameter d are separated by a distance of D, where D repre-sents the diameter of a virtual cylinder surrounding each HF. The total volume ofthese virtual cylinders is equal to V minus the interstitial volume created by threetouching cylinders. Each HF is then associated with one interstitial volume.
Given the axial symmetry and from basic trigonometry, the % volume occupied by the interstitial volume is given by the ratio:
Thus:
(C.1)
The volume occupied and the surface area provided by the fibres are given by:
(C.2)
(C.3)A dNLf � p
V d NLf2
4�p
RD D D
D D�
��
�( / ) sin ( / )( / ) sin
2 60 82 60
0.886/2 0.2p 339230.886/2
0.0460�
RD
��area of equilateral triangle of sides arrea of semicircle of side
area of equilaD
tteral triangle of sides D
282 The MBR Book
d
D
D sin 60
Figure C.1 Cross-section of three HFs in module
1856174817_Appendices C.qxd 6/3/06 4:44 PM Page 282
L being the internal module length and N being the number of fibres per element.The total cross-sectional area associated with each fibre is thus given by:
(C.4)
Substituting Equation (C.3) into Equation (C.4) yields:
(C.5)
where � is the fibre surface area per unit module volume (Af/Vf). So, combiningEquation (C.1) and Equation (C.5) yields:
(C.6)
The separation, � is thus given by:
(C.7)
In fact, this separation differs by only 2.5% from the value calculated on the basis of ignoring the excluded area, for which the coefficient in the above equationbecomes 2.
C.2 Free area Ax
The total free area can be obtained by subtracting the cross-sectional area of thefibres from that of the module:
(C.8)
Substituting for V and N with � and Af, from Equation (C.3), produces:
(C.9)AA
L
A d
Lxf f
4� �f
AVL
d Nx
2
4� �
p
df
� �1.95d
d
Dd
��4(1 0.046)f
XdV
Ad
ff
f
� �p p
f
XV
LNff�
Appendix C: Hollow fibre module parameters 283
1856174817_Appendices C.qxd 6/3/06 4:44 PM Page 283

284 The MBR Book
Thus:
(C.10)
The free area per filament is simply given by:
(C.11)
and hence:
(C.12)Ad
dx,filament2
44
� �p
f
⎛
⎝⎜⎜⎜⎜
⎞
⎠⎟⎟⎟⎟
AD
Rdx,filament
22
4 1�
��
p ⎛
⎝⎜⎜⎜⎜
⎞
⎠⎟⎟⎟⎟
AA
Ld
xf 1
4� �
f
⎛
⎝⎜⎜⎜⎜
⎞
⎠⎟⎟⎟⎟
1856174817_Appendices C.qxd 6/3/06 4:44 PM Page 284

Appendix D
Membrane Products
1856174817_Appendices D.qxd 6/6/06 2:18 PM Page 285
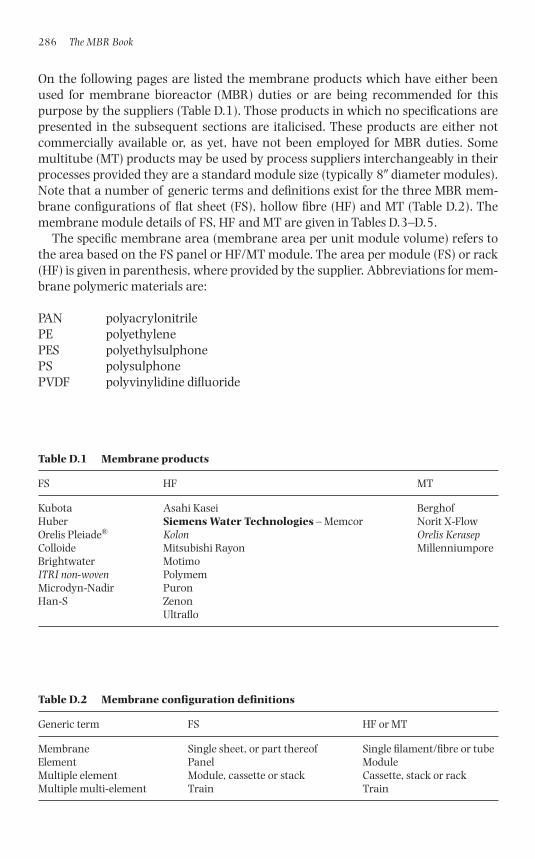
286 The MBR Book
On the following pages are listed the membrane products which have either beenused for membrane bioreactor (MBR) duties or are being recommended for this purpose by the suppliers (Table D.1). Those products in which no specifications arepresented in the subsequent sections are italicised. These products are either notcommercially available or, as yet, have not been employed for MBR duties. Somemultitube (MT) products may be used by process suppliers interchangeably in theirprocesses provided they are a standard module size (typically 8� diameter modules).Note that a number of generic terms and definitions exist for the three MBR mem-brane configurations of flat sheet (FS), hollow fibre (HF) and MT (Table D.2). Themembrane module details of FS, HF and MT are given in Tables D.3–D.5.
The specific membrane area (membrane area per unit module volume) refers tothe area based on the FS panel or HF/MT module. The area per module (FS) or rack(HF) is given in parenthesis, where provided by the supplier. Abbreviations for mem-brane polymeric materials are:
PAN polyacrylonitrilePE polyethylenePES polyethylsulphonePS polysulphonePVDF polyvinylidine difluoride
Table D.1 Membrane products
FS HF MT
Kubota Asahi Kasei BerghofHuber Siemens Water Technologies – Memcor Norit X-FlowOrelis Pleiade® Kolon Orelis KerasepColloide Mitsubishi Rayon MillenniumporeBrightwater MotimoITRI non-woven PolymemMicrodyn-Nadir PuronHan-S Zenon
Ultraflo
Table D.2 Membrane configuration definitions
Generic term FS HF or MT
Membrane Single sheet, or part thereof Single filament/fibre or tubeElement Panel ModuleMultiple element Module, cassette or stack Cassette, stack or rackMultiple multi-element Train Train
1856174817_Appendices D.qxd 6/6/06 2:18 PM Page 286
Appendix D: Membrane products 287
Table D.3 Membrane module details of FS
Supplier Brightwater Engineering
Membrane or module proprietary name (model) MembrightMembrane material PESPore size (�m) or MWCO (kDa) 150 kDaPanel dimensions, length � width � depth (mm) 950 � 950 � 7Panel area (m2) 1.84Membrane separation (mm) �9Module dimensions, length � width � depth (mm) 1120 � 1215 � 1450 (50-panel unit)
1120 � 715 � 1450 (25-panel unit)Number of panels per module 50 or 25Total membrane area per module (m2/m3) 110 (47)Clean water permeability (LMH/bar) –
Supplier Colloide Engineering Systems
Membrane or module proprietary name (model) Sub snakeMembrane material PESPore size (�m) or MWCO (kDa) 0.04 �mPanel dimensions, length � width � depth (mm) 1000 width � 5Panel area (m2) 10Membrane separation, mm 10Module dimensions, length � width � depth (mm) –Number of panels per module 5Total membrane area per module (m2/m3) 160Clean water permeability (LMH/bar) –
Supplier Huber Technology
Membrane or module proprietary name (model) VRMMembrane material PESPore size (�m) or MWCO (kDa) 0.038Panel dimensions, length � width � depth (mm) –Panel area (m2) 0.75 for a single four-panel trapezoid
elementMembrane separation (mm) 6 (6 mm membrane thickness)Module dimensions, length � width � depth (mm) Diameter � 2 or 3 mNumber of panels per module Four plates/element; 6–8 elements per
complete panelTotal membrane area per module (m2/m3) 160 (80–90)Clean water permeability (LMH/bar) –
Supplier Kubota
Membrane or module proprietary name (model) Kubota (ES, single-deck; EK, double510)
Membrane material Chlorinated PEPore size (�m) or MWCO (kDa) 0.4 �mPanel dimensions, length � width � depth (mm) 1000 � 500 � 6Panel area (m2) 0.8Membrane separation (mm) 7Module dimensions, length � width � depth (mm) 1000 � 500 � 1300Number of panels per module 100
(Table continued on next page)
1856174817_Appendices D.qxd 6/6/06 2:18 PM Page 287
288 The MBR Book
Table D.4 Membrane module details of HF
Supplier Asahi-Kasei
Membrane or module proprietary name (model) MicrozaMembrane material PVDFPore size (�m) or (MWCO) (kDa) 0.1 �mFilament diameter (mm) 1.3Module dimensions, length � diameter (mm) 2000 � 150
Table D.3 (continued)
Supplier Kubota
Total membrane area per module (m2/m3) 115Clean water permeability (LMH/bar) 1110
Supplier Microdyne-Nadir
Membrane or module proprietary name (model) BioCelMembrane material PESPore size (�m) or MWCO (kDa) 150 kDaPanel dimensions, length � width � depth (mm) –Panel area (m2) –Membrane separation (mm) 8 (2 mm membrane thickness)Module dimensions, length � width � depth (mm) 1200, 1340 � 650, 1140 � 1800, 2880Number of panels per module –Total membrane area per module (m2/m3) 70 (90)Clean water permeability (LMH/bar) 450–550
Supplier Novasep Orelis
Membrane or module proprietary name (model) Pleiade®
Membrane material PANPore size (�m) or MWCO (kDa) 40 kDaPanel dimensions, length � width � depth (mm) 2610 � 438Panel area (m2) �2Membrane separation (mm) 3Module dimensions, length � width � depth (mm) 2610 � 438 � 1710Number of panels per module –Total membrane area per module (m2/m3) (36)Clean water permeability (LMH/bar) 1250 � 500
Supplier Toray Industries
Membrane or module proprietary name (model) Toray (TRM140-100S )Membrane material PVDFPore size (�m) or MWCO (kDa) 0.08 �mPanel dimensions, length � width � depth (mm) 1608 � 515 � 13.5 (inc. 6 mm
separation)Panel area (m2) 1.4Membrane separation (mm) 6Module dimensions, length � width � depth (mm) 2100 � 810 � 1620Number of panels per module 50 , 100 or 200Total membrane area per module (m2/m3) 135Clean water permeability (LMH/bar) –
1856174817_Appendices D.qxd 6/6/06 2:18 PM Page 288
Appendix D: Membrane products 289
Table D.4 (continued)
Supplier Asahi-Kasei
Module area (m2) 25Number of filaments per element 765Rack dimensions, length � width � depth (mm) 2700 � 800 � 700Number of modules per rack 4Total membrane area per module (rack) (m2/m3) 710 (89)Clean water permeability (LMH/bar) –
Supplier Koch Membrane Systems
Membrane or module proprietary name (model) PuronMembrane material PESPore size (�m) or MWCO (kDa) 0.04 �mFilament diameter 2.6 mmModule dimensions, length � diameter (mm) –Module area (m2) 30, 235 and 500Number of filaments per element –Rack dimensions, length � width � depth (mm) 2000 � 1000 � 2600Number of modules per rack –Total membrane area per module (rack) (m2/m3) 260 (96)Clean water permeability (LMH/bar) –
Supplier Mitsubishi Rayon Engineering
Membrane or module proprietary name (model) Sterapore SURMembrane material PEPore size (�m) or MWCO (kDa) 0.4 �mFilament diameter 0.54 mmModule dimensions, length � width � depth (mm) 1035 � 13 � 524 446Module area (m2) Up to 210Number of filaments per element –Cassette dimensions, length � width � depth (mm) 1442 � 1538 � 725Number of modules per cassette 70Total membrane area per module (m2/m3) 485Clean water permeability (LMH/bar) –
Supplier Motimo Membrane Technologies Ltd.
Membrane or module proprietary name (model) Flat plat (FP AIV)Membrane material PVDFPore size (�m) or MWCO (kDa) 0.1–0.2 �mFilament diameter 1.0 (0.6 ID)Element area (m2) 25Module dimensions, length � width � depth (mm) 1510 � 530 � 450Module area (m2) 10 000Number of filaments per element –Total membrane area per module (m2/m3) 1100Number of modules per rack 360
Supplier Polymem
Membrane or module proprietary name (model) Immem (WW120)Membrane material PS
(Table continued on next page)
1856174817_Appendices D.qxd 6/6/06 2:18 PM Page 289
290 The MBR Book
Table D.4 (continued)
Supplier Polymem
Pore size (�m) or MWCO (kDa) 300 kDa; 0.08 �mFilament diameter 0.7 to 1.4 mmModule dimensions, length � diameter (mm) 1000 to 1500 � 315Module area (m2) 60–100 m2
Number of filaments per element a few tens of thousandsNumber of modules per rack naTotal membrane area per module (m2/m3) 800Clean water permeability (LMH/bar) 500
Supplier Siemens Water Technologies
Membrane or module proprietary name (model) Memcor MemJet® (B10R, B30R)Membrane material PVDFPore size (�m) or MWCO (kDa) 0.04 �mFilament diameter 1.3Module dimensions, length � diameter (mm) 1610 � 154 (B10R); 203 � 203
(B40R)Module area (m2) 10 (B10R) or 38 (B30R)Number of filaments per element –Number of modules per rack 40 (B10R) or 16 (B30R)Total membrane area per module (m2/m3) 334Clean water permeability (LMH/bar) 300
Supplier Zenon Environmental
Membrane or module proprietary name (model) ZeeWeed 500 c–dMembrane material PVDFPore size (�m) or MWCO (kDa) 0.04 �mFilament diameter (mm) 1.9 (0.8 ID)Module dimensions, length � width � depth (mm) 1940 � 678 � 60 (c);
2198 � 844 � 56 (d)Module area (m2) 23.2 (c), 31.6 (d)Number of filaments per element �2700Stack dimensions, length � width � depth (mm) –Number of modules per stack –Total membrane area per module (m2/m3) 294 (c), 304 (d)
Supplier Ultrafo
Membrane or module proprietary name (model) Ultraflo (SS60)Membrane material PANPore size (�m) or MWCO (kDa) 0.01–0.1Filament diameter 2.1 mm OD (1.2 mm ID)Element dimensions, length � diameter (mm) 1515 � 152Element area (m2) 28Number filaments per element –Number of elements per module naTotal membrane area per module (m2/m3) 1020Clean water permeability (LMH/bar) 500
1856174817_Appendices D.qxd 6/6/06 2:18 PM Page 290
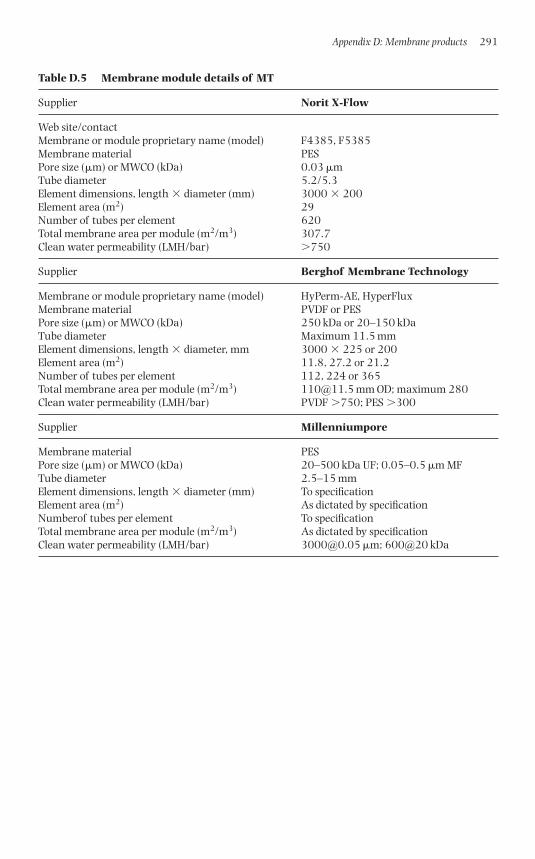
Appendix D: Membrane products 291
Table D.5 Membrane module details of MT
Supplier Norit X-Flow
Web site/contactMembrane or module proprietary name (model) F4385, F5385Membrane material PESPore size (�m) or MWCO (kDa) 0.03 �mTube diameter 5.2/5.3Element dimensions, length � diameter (mm) 3000 � 200Element area (m2) 29Number of tubes per element 620Total membrane area per module (m2/m3) 307.7Clean water permeability (LMH/bar) �750
Supplier Berghof Membrane Technology
Membrane or module proprietary name (model) HyPerm-AE, HyperFluxMembrane material PVDF or PESPore size (�m) or MWCO (kDa) 250 kDa or 20–150 kDaTube diameter Maximum 11.5 mmElement dimensions, length � diameter, mm 3000 � 225 or 200Element area (m2) 11.8, 27.2 or 21.2Number of tubes per element 112, 224 or 365Total membrane area per module (m2/m3) [email protected] mm OD; maximum 280Clean water permeability (LMH/bar) PVDF �750; PES �300
Supplier Millenniumpore
Membrane material PESPore size (�m) or MWCO (kDa) 20–500 kDa UF; 0.05–0.5 �m MFTube diameter 2.5–15 mmElement dimensions, length � diameter (mm) To specificationElement area (m2) As dictated by specificationNumberof tubes per element To specificationTotal membrane area per module (m2/m3) As dictated by specificationClean water permeability (LMH/bar) [email protected] �m; 600@20 kDa
1856174817_Appendices D.qxd 6/6/06 2:18 PM Page 291

This page intentionally left blank

Appendix E
Major Recent MBR and Wastewater Conferences
1856174817_Appendices E.qxd 6/6/06 2:27 PM Page 293
Listed below is a selection of membrane bioreactor (MBR) and Wastewater InternationalConferences since 2000. While every effort has been made to include information whichis as comprehensive and accurate as possible, this is for guidance only and no responsi-bility is taken for any omissions or errors. Details were correct at the time of publicationand websites were accessed in February 2006. Future conferences are listed wheredetails are available. Conferences relating to desalination have not been included.
Conference title meet Dates Location Web address
Department of Chemical Engineering, Aachen UniversityAachen Membrane Colloquium (AMC)8th AMC 2001 27–29 March 2001 www.ivt.rwth-aachen.de/
Amk/Eng/index_eng.html9th AMC 2003 18–20 March 2003 Aachen, Germany10th AMC 2005 16–17 March 200511th AMC 2007 27–29 March 2007
Cranfield University, UKMembrane Bioreactors for Wastewater TreatmentMBR3 16 May 2001MBR4 09 April 2003 Cranfield, UK
www.cranfield.ac.uk/
MBR5 28 January 2005 sims/water
The European Membrane Society; Institute for Membrane TechnologyEuromembrane 2000 24–27 September 2000 Jerusalem, IsraelEuromembrane 2004 28 September–1 October Hamburg,
2004 GermanyEuromembrane 2006 24–28 September 2006 Taormina, Italy euromembrane2006.itm.
cnr.it/primaryindex.asp
International Conference on Application of Membrane Technology2nd Conference 27–29 September 2002 Beijing, China
International Conference and Exhibition for Filtration and Separation Technology (FILTEC)Filtech Europa 2001 16–18 October 2001 Dusseldorf,
GermanyFiltech Europa 2003 21–23 October 2003 Dusseldorf,
Germany www.filtecheuropa.comFiltech Europa 2005 11–13 October 2005 Wiesbaden,
GermanyFiltech Europa 2007 27 February–1 March Wiesbaden,
2007 Germany
International Congress on Membranes and Membrane Processes (ICOM)ICOM 2002 7–12 July 2002 Toulouse, FranceICOM 2005 21–26 August 2005 Seoul, Korea www.icom2005.org
International Membrane Science and Technology Conference (IMSTEC)IMSTEC’03 10–14 November 2003 Sydney, Australia
International Water AssociationWater Environment Membrane Technology (WEMT)WEMT 2004 7–10 June 2004 Seoul, www.iwahq.org.uk
South Korea
294 The MBR Book
�
�
�
1856174817_Appendices E.qxd 6/6/06 2:27 PM Page 294
Conference title meet Dates Location Web address
International Water AssociationLeading Edge Technology (LET) Conferences1st LET Conference 26–28 May 2003 Amsterdam,
The Netherlands2nd LET Conference 1–4 June 2004 Prague3rd LET Conference 6–8 June 2005 Sapporo, Japan www.iwahq.org.ukand Exhibition onWater and WastewaterTreatment Technologies
International Water AssociationMembranes for Water and Wastewater Treatment4th International 13–16 May 2007 Harrogate, UK www.iwamembranes.infoMembranes Conference
International Water AssociationWorld Water Congress (WWC)2nd WWC 15–19 October 2001 Berlin, Germany3rd WWC 7–12 April 2002 Melbourne,
Australiawww.iwahq.org.uk4th WWC 19–24 September 2004 Marrakech,
Morocco5th WWC 10–14 September 2006 Beijing, China
Membrane Industry Association of China (and others)Water and Membrane China (WMC)WMC 2004 27–29 September 2004 Beijing, ChinaWMC 2005 14–16 September 2005 Beijing, China
www.grandexh.comWMC 2005 29–31 March 2005 Shanghai, ChinaWMC 2006 29–31 March 2006 Shanghai, China
Network Young Membrains (NYM)NYM 2 7–8 September 2000 Aachen, The
NetherlandsNYM 3 6–7 September 2001 Delft, The
NetherlandsNYM 4 5–7 July 2002 Toulouse, France
www.itm.cnr.it/NYM 5 1–3 October 2003 Barcelona, SpainNYM8/site/history.htmNYM 6 22–24 September 2004 Hamburg,
GermanyNYM 7 22–24 June 2005 Enschede, The
NetherlandsNYM 8 21–23 September 2006 Rende, Italy www.itm.cnr.it/NYM8
North American Membrane Society (NAMS)11th Annual Meeting 23–27 May 2000 Colorado, USA www.membranes.org12th Annual Meeting 15–20 May 2001 Kentucky, USA13th Annual Meeting 11–15 May 2002 California, USA14th Annual Meeting 17–21 May 2003 Wyoming, USA15th Annual Meeting 26–30 June 2004 Hawaii, USA16th Annual Meeting 11–15 June 2005 Rhode Island, USA
Slovak Society of Chemical EngineeringMembrane Science and Technology Conference of Visegrad Countries (PERMEA)PERMEA 2003 7–11 September 2003 Slovakia sschi.chtf.stuba.sk/PERMEA 2005 18–22 September 2005 Poland permea
Appendix E: Major recent MBR and wastewater conferences 295
��
�
1856174817_Appendices E.qxd 6/6/06 2:27 PM Page 295
Conference title meet Dates Location Web address
Water Environment FederationWater Environment Federation’s Technical Exhibition and Conference (WEFTEC)WEFTEC.00 October 2000 Anaheim, USAWEFTEC.01 13–17 October 2001 Atlanta, USAWEFTEC.02 28 September–2 Chicago, USA
October 2002WEFTEC.03 11–15 October 2003 Los Angeles, USAWEFTEC.04 2–6 October 2004 New Orleans,
USAWEFTEC.05 29 October–2 Washington DC, www.weftec.org
November 2005 USAWEFTEC.06 21–25 October 2006 Dallas, USAWEFTEC.07 13–17 October 2007 San Diego, USAWEFTEC.08 18–22 October 2008 Chicago, USAWEFTEC.09 17–21 October 2009 Orlando, USAWEFTEC.10 2–6 October 2010 New Orleans,
USA
Water Quality Association; Amsterdam RAIAquatechAquatech Amsterdam 28 September–1 Amsterdam, The www.wqa.org2004 October 2004 NetherlandsAquatech USA 2005 29 March–2 April 2005 Las Vegas, USAAquatech USA 2006 29–31 March 2006 Chicago, USAAquatech Amsterdam 26–29 September 2006 Amsterdam, The2006 NetherlandsAquatech USA 2007 28–30 March 2007 Orlando, USA www.eshow2000.com/
wqa
World Filtration Congress (WFC)WFC8 3–7 April 2000 Brighton, UKWFC9 18–22 April 2004 New Orleans,
USAWFC10 14–18 April 2008 Leipzig, www.wfc10.com
Germany
In addition to the above, the following related conferences and workshops have alsobeen held – again, this list is not comprehensive but represents a flavour of theevents which are available:
Event Last held Location Website
Advanced Membrane 23–28 May 2004 Irsee, Germany www.engconfintl.org/Technology calendar.html#environtech
Annual Membrane/ December 2003 USA www.bccresearch.com/Separations Technology conferencesPlanning Conference
CITEM (Ibero American 6–8 July 2005 Valencia, SpainCongress on Membrane Science and Technology)
296 The MBR Book
�
1856174817_Appendices E.qxd 6/6/06 2:27 PM Page 296
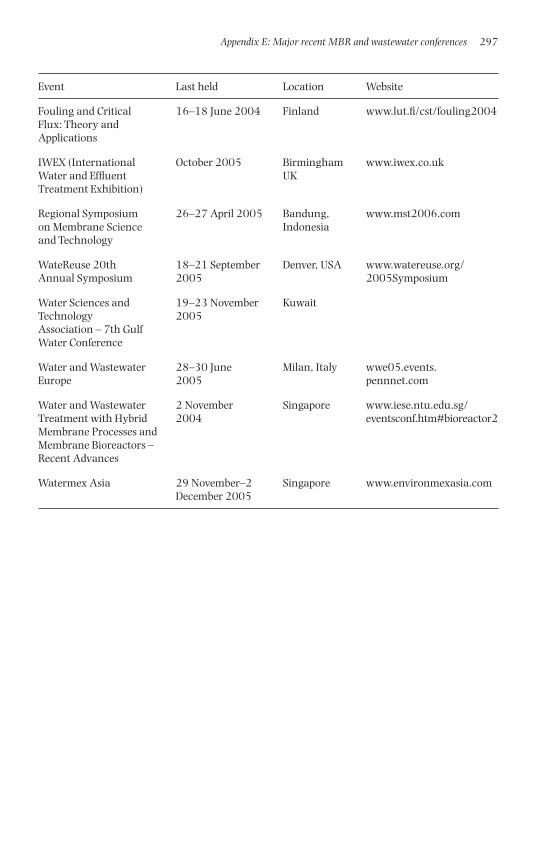
Event Last held Location Website
Fouling and Critical 16–18 June 2004 Finland www.lut.fi/cst/fouling2004Flux: Theory and Applications
IWEX (International October 2005 Birmingham www.iwex.co.ukWater and Effluent UKTreatment Exhibition)
Regional Symposium 26–27 April 2005 Bandung, www.mst2006.comon Membrane Science Indonesiaand Technology
WateReuse 20th 18–21 September Denver, USA www.watereuse.org/Annual Symposium 2005 2005Symposium
Water Sciences and 19–23 November KuwaitTechnology 2005Association – 7th GulfWater Conference
Water and Wastewater 28–30 June Milan, Italy wwe05.events.Europe 2005 pennnet.com
Water and Wastewater 2 November Singapore www.iese.ntu.edu.sg/Treatment with Hybrid 2004 eventsconf.htm#bioreactor2Membrane Processes andMembrane Bioreactors – Recent Advances
Watermex Asia 29 November–2 Singapore www.environmexasia.comDecember 2005
Appendix E: Major recent MBR and wastewater conferences 297
1856174817_Appendices E.qxd 6/6/06 2:27 PM Page 297

This page intentionally left blank

Appendix F
Selected Professional and Trade Bodies
1856174817_Appendices F.qxd 6/3/06 4:46 PM Page 299
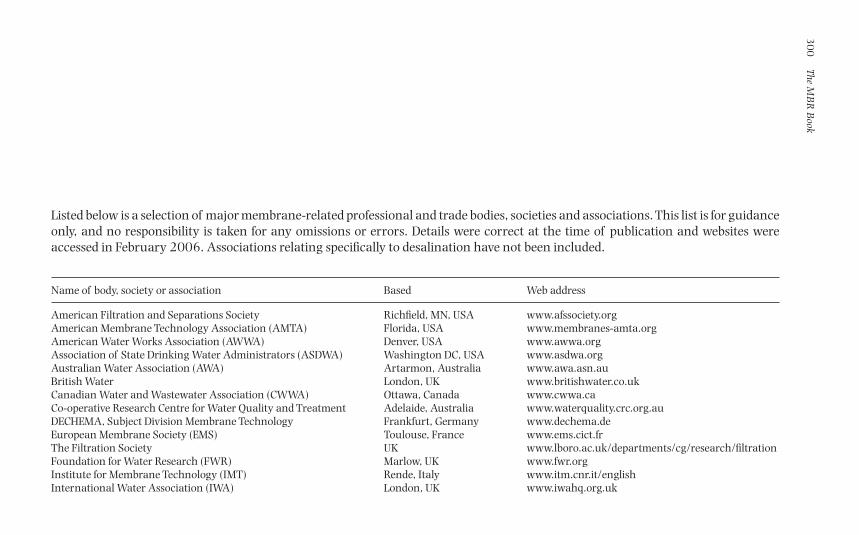
30
0The M
BR
Book
Listed below is a selection of major membrane-related professional and trade bodies, societies and associations. This list is for guidanceonly, and no responsibility is taken for any omissions or errors. Details were correct at the time of publication and websites wereaccessed in February 2006. Associations relating specifically to desalination have not been included.
Name of body, society or association Based Web address
American Filtration and Separations Society Richfield, MN, USA www.afssociety.orgAmerican Membrane Technology Association (AMTA) Florida, USA www.membranes-amta.orgAmerican Water Works Association (AWWA) Denver, USA www.awwa.orgAssociation of State Drinking Water Administrators (ASDWA) Washington DC, USA www.asdwa.orgAustralian Water Association (AWA) Artarmon, Australia www.awa.asn.auBritish Water London, UK www.britishwater.co.ukCanadian Water and Wastewater Association (CWWA) Ottawa, Canada www.cwwa.caCo-operative Research Centre for Water Quality and Treatment Adelaide, Australia www.waterquality.crc.org.auDECHEMA, Subject Division Membrane Technology Frankfurt, Germany www.dechema.deEuropean Membrane Society (EMS) Toulouse, France www.ems.cict.frThe Filtration Society UK www.lboro.ac.uk/departments/cg/research/filtrationFoundation for Water Research (FWR) Marlow, UK www.fwr.orgInstitute for Membrane Technology (IMT) Rende, Italy www.itm.cnr.it/englishInternational Water Association (IWA) London, UK www.iwahq.org.uk
1856174817_Appendices F.qxd 6/3/06 4:46 PM Page 300
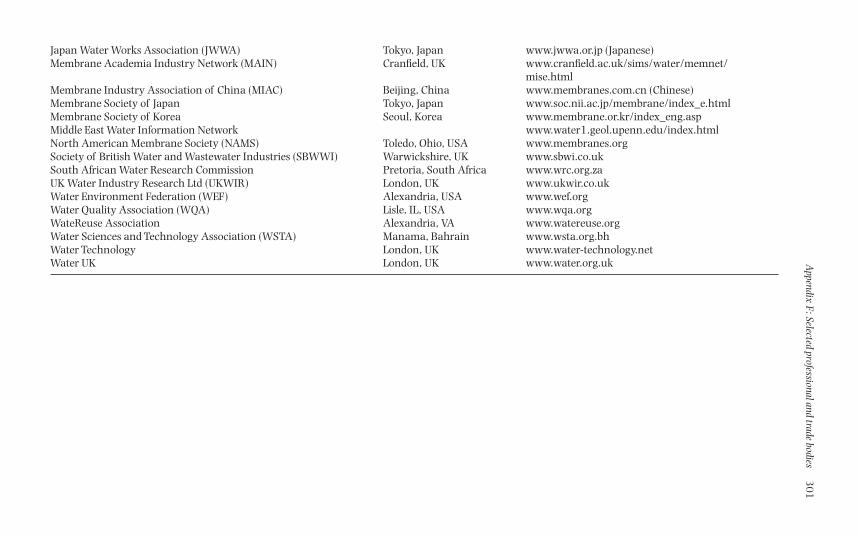
Appendix F
: Selected professional and trade bodies3
01
Japan Water Works Association (JWWA) Tokyo, Japan www.jwwa.or.jp (Japanese)Membrane Academia Industry Network (MAIN) Cranfield, UK www.cranfield.ac.uk/sims/water/memnet/
mise.htmlMembrane Industry Association of China (MIAC) Beijing, China www.membranes.com.cn (Chinese)Membrane Society of Japan Tokyo, Japan www.soc.nii.ac.jp/membrane/index_e.htmlMembrane Society of Korea Seoul, Korea www.membrane.or.kr/index_eng.aspMiddle East Water Information Network www.water1.geol.upenn.edu/index.htmlNorth American Membrane Society (NAMS) Toledo, Ohio, USA www.membranes.orgSociety of British Water and Wastewater Industries (SBWWI) Warwickshire, UK www.sbwi.co.ukSouth African Water Research Commission Pretoria, South Africa www.wrc.org.zaUK Water Industry Research Ltd (UKWIR) London, UK www.ukwir.co.ukWater Environment Federation (WEF) Alexandria, USA www.wef.orgWater Quality Association (WQA) Lisle, IL, USA www.wqa.orgWateReuse Association Alexandria, VA www.watereuse.orgWater Sciences and Technology Association (WSTA) Manama, Bahrain www.wsta.org.bhWater Technology London, UK www.water-technology.netWater UK London, UK www.water.org.uk
1856174817_Appendices F.qxd 6/3/06 4:46 PM Page 301

This page intentionally left blank
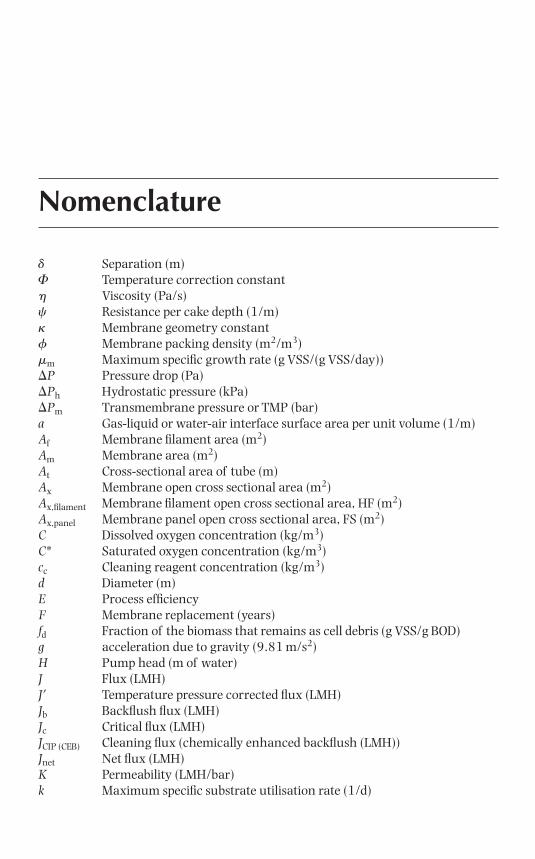
Nomenclature
� Separation (m)� Temperature correction constant� Viscosity (Pa/s)� Resistance per cake depth (1/m)� Membrane geometry constant� Membrane packing density (m2/m3)�m Maximum specific growth rate (g VSS/(g VSS/day))�P Pressure drop (Pa)�Ph Hydrostatic pressure (kPa)�Pm Transmembrane pressure or TMP (bar)a Gas-liquid or water-air interface surface area per unit volume (1/m)Af Membrane filament area (m2)Am Membrane area (m2)At Cross-sectional area of tube (m)Ax Membrane open cross sectional area (m2)Ax,filament Membrane filament open cross sectional area, HF (m2)Ax,panel Membrane panel open cross sectional area, FS (m2)C Dissolved oxygen concentration (kg/m3)C* Saturated oxygen concentration (kg/m3)cc Cleaning reagent concentration (kg/m3)d Diameter (m)E Process efficiencyF Membrane replacement (years)fd Fraction of the biomass that remains as cell debris (g VSS/g BOD)g acceleration due to gravity (9.81 m/s2)H Pump head (m of water)J Flux (LMH)J� Temperature pressure corrected flux (LMH)Jb Backflush flux (LMH)Jc Critical flux (LMH)JCIP (CEB) Cleaning flux (chemically enhanced backflush (LMH))Jnet Net flux (LMH)K Permeability (LMH/bar)k Maximum specific substrate utilisation rate (1/d)
1856174817_Noman.qxd 6/3/06 4:40 PM Page 303
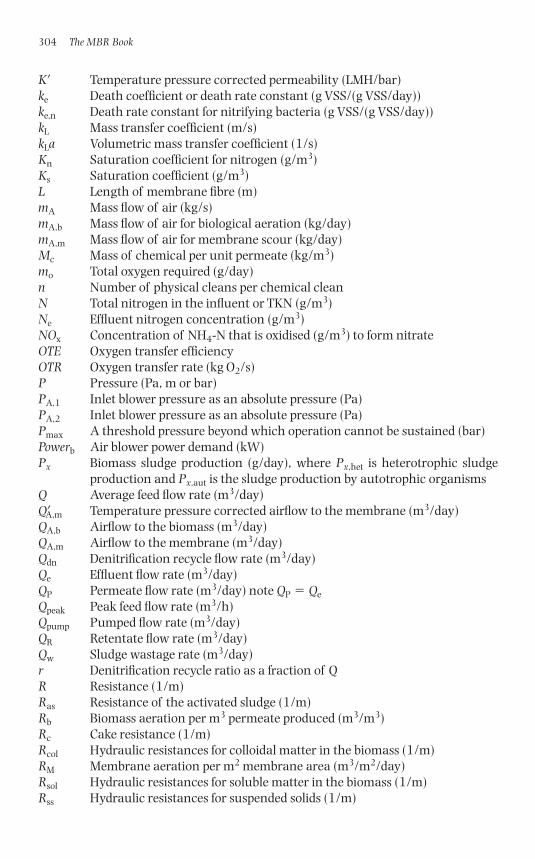
K� Temperature pressure corrected permeability (LMH/bar)ke Death coefficient or death rate constant (g VSS/(g VSS/day))ke,n Death rate constant for nitrifying bacteria (g VSS/(g VSS/day))kL Mass transfer coefficient (m/s)kLa Volumetric mass transfer coefficient (1/s)Kn Saturation coefficient for nitrogen (g/m3)Ks Saturation coefficient (g/m3)L Length of membrane fibre (m)mA Mass flow of air (kg/s)mA,b Mass flow of air for biological aeration (kg/day)mA,m Mass flow of air for membrane scour (kg/day)Mc Mass of chemical per unit permeate (kg/m3)mo Total oxygen required (g/day)n Number of physical cleans per chemical cleanN Total nitrogen in the influent or TKN (g/m3)Ne Effluent nitrogen concentration (g/m3)NOx Concentration of NH4-N that is oxidised (g/m3) to form nitrateOTE Oxygen transfer efficiencyOTR Oxygen transfer rate (kg O2/s)P Pressure (Pa, m or bar)PA,1 Inlet blower pressure as an absolute pressure (Pa)PA,2 Inlet blower pressure as an absolute pressure (Pa)Pmax A threshold pressure beyond which operation cannot be sustained (bar)Powerb Air blower power demand (kW)Px Biomass sludge production (g/day), where Px,het is heterotrophic sludge
production and Px,aut is the sludge production by autotrophic organismsQ Average feed flow rate (m3/day)Q�A,m Temperature pressure corrected airflow to the membrane (m3/day)QA,b Airflow to the biomass (m3/day)QA,m Airflow to the membrane (m3/day)Qdn Denitrification recycle flow rate (m3/day)Qe Effluent flow rate (m3/day)QP Permeate flow rate (m3/day) note QP � QeQpeak Peak feed flow rate (m3/h)Qpump Pumped flow rate (m3/day)QR Retentate flow rate (m3/day)Qw Sludge wastage rate (m3/day)r Denitrification recycle ratio as a fraction of QR Resistance (1/m)Ras Resistance of the activated sludge (1/m)Rb Biomass aeration per m3 permeate produced (m3/m3)Rc Cake resistance (1/m)Rcol Hydraulic resistances for colloidal matter in the biomass (1/m)RM Membrane aeration per m2 membrane area (m3/m2/day)Rsol Hydraulic resistances for soluble matter in the biomass (1/m)Rss Hydraulic resistances for suspended solids (1/m)
304 The MBR Book
1856174817_Noman.qxd 6/3/06 4:40 PM Page 304
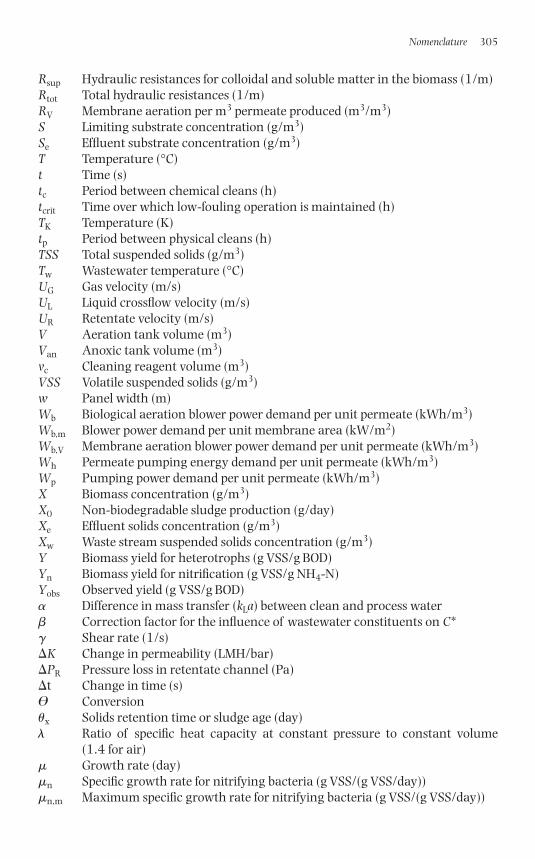
Rsup Hydraulic resistances for colloidal and soluble matter in the biomass (1/m)Rtot Total hydraulic resistances (1/m)RV Membrane aeration per m3 permeate produced (m3/m3)S Limiting substrate concentration (g/m3)Se Effluent substrate concentration (g/m3)T Temperature (°C)t Time (s)tc Period between chemical cleans (h)tcrit Time over which low-fouling operation is maintained (h)TK Temperature (K)tp Period between physical cleans (h)TSS Total suspended solids (g/m3)Tw Wastewater temperature (°C)UG Gas velocity (m/s)UL Liquid crossflow velocity (m/s)UR Retentate velocity (m/s)V Aeration tank volume (m3)Van Anoxic tank volume (m3)vc Cleaning reagent volume (m3)VSS Volatile suspended solids (g/m3)w Panel width (m)Wb Biological aeration blower power demand per unit permeate (kWh/m3)Wb,m Blower power demand per unit membrane area (kW/m2)Wb,V Membrane aeration blower power demand per unit permeate (kWh/m3)Wh Permeate pumping energy demand per unit permeate (kWh/m3)Wp Pumping power demand per unit permeate (kWh/m3)X Biomass concentration (g/m3)X0 Non-biodegradable sludge production (g/day)Xe Effluent solids concentration (g/m3)Xw Waste stream suspended solids concentration (g/m3)Y Biomass yield for heterotrophs (g VSS/g BOD)Yn Biomass yield for nitrification (g VSS/g NH4-N)Yobs Observed yield (g VSS/g BOD) Difference in mass transfer (kLa) between clean and process water Correction factor for the influence of wastewater constituents on C*� Shear rate (1/s)�K Change in permeability (LMH/bar)�PR Pressure loss in retentate channel (Pa)�t Change in time (s)� Conversion x Solids retention time or sludge age (day)� Ratio of specific heat capacity at constant pressure to constant volume
(1.4 for air)� Growth rate (day)�n Specific growth rate for nitrifying bacteria (g VSS/(g VSS/day))�n,m Maximum specific growth rate for nitrifying bacteria (g VSS/(g VSS/day))
Nomenclature 305
1856174817_Noman.qxd 6/3/06 4:40 PM Page 305

306 The MBR Book
� Mechanical efficiency� Density (kg/m3) where subscript p refers to permeate, b relates to biomass
and a to air�c Duration of chemical clean (h)�p Duration of physical clean (h)ϕ Temperature correction factor for aeration
1856174817_Noman.qxd 6/3/06 4:40 PM Page 306

Abbreviations
The following lists key abbreviations used in the book. Further definitions are givenin the Glossary of Terms. Note that proprietary abbreviations are not listed.
ABR Anaerobic baffled reactorAD Anaerobic digestionADUF Anaerobic digester ultrafiltrationAlum Aluminum [aluminium?] sulphateAN AnaerobicanMBR Anaerobic membrane bioreactorAOC Assimilable organic carbonASP Activated sludge processAX AnoxicBAC Biologically activated carbonBAF Biological aerated filterBPA Biological potential activityBER Biofilm-electrode reactorBNR Biological nutrient removalBOD Biochemical oxygen demandCEB Chemically-enhanced backwashCF CrossflowCFV Crossflow velocityCIL Cleaning in lineCIP Cleaning in placeCOD Chemical oxygen demandCP Concentration polarisationCPR Chemical phosphorous removalCST Capillary suction timeCT Capillary tubeDa DaltonDE Dead-end (or full flow)dMBR Diffusive membrane bioreactorDO Dissolved oxygenDOC Dissolved organic carbonDS Dry solidsEBPR Enhanced biological phosphate removalED Electrodialysis(e)EPS (Extracted) extracellular polymeric substancesEGSB Expanded granular sludge bed
1856174817_Abbreviations.qxd 6/3/06 4:41 PM Page 307
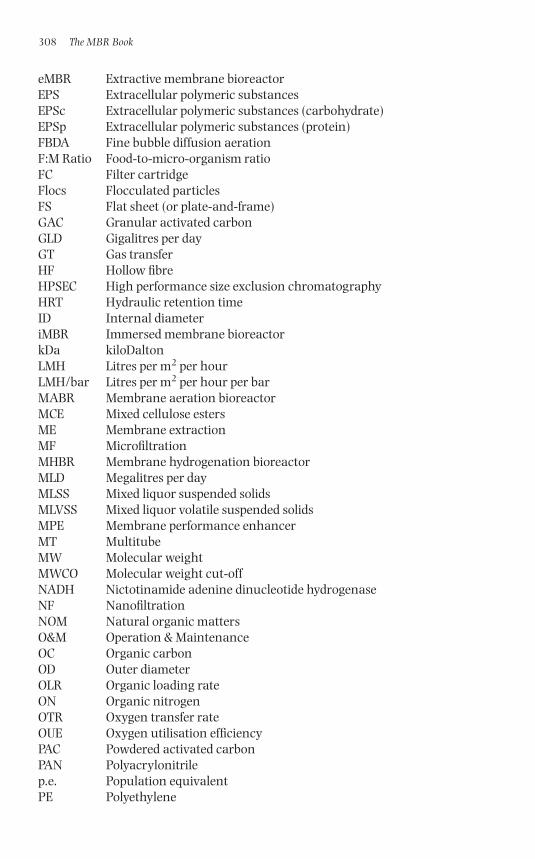
eMBR Extractive membrane bioreactorEPS Extracellular polymeric substancesEPSc Extracellular polymeric substances (carbohydrate)EPSp Extracellular polymeric substances (protein)FBDA Fine bubble diffusion aerationF:M Ratio Food-to-micro-organism ratioFC Filter cartridgeFlocs Flocculated particlesFS Flat sheet (or plate-and-frame)GAC Granular activated carbonGLD Gigalitres per dayGT Gas transferHF Hollow fibreHPSEC High performance size exclusion chromatographyHRT Hydraulic retention timeID Internal diameteriMBR Immersed membrane bioreactorkDa kiloDaltonLMH Litres per m2 per hourLMH/bar Litres per m2 per hour per barMABR Membrane aeration bioreactorMCE Mixed cellulose estersME Membrane extractionMF MicrofiltrationMHBR Membrane hydrogenation bioreactorMLD Megalitres per dayMLSS Mixed liquor suspended solidsMLVSS Mixed liquor volatile suspended solidsMPE Membrane performance enhancerMT MultitubeMW Molecular weightMWCO Molecular weight cut-offNADH Nictotinamide adenine dinucleotide hydrogenaseNF NanofiltrationNOM Natural organic mattersO&M Operation & MaintenanceOC Organic carbonOD Outer diameterOLR Organic loading rateON Organic nitrogenOTR Oxygen transfer rateOUE Oxygen utilisation efficiencyPAC Powdered activated carbonPAN Polyacrylonitrilep.e. Population equivalentPE Polyethylene
308 The MBR Book
1856174817_Abbreviations.qxd 6/3/06 4:41 PM Page 308
PES PolyethylsulphonePP PolypropylenePV PervaporationPVDF Polyvinylidene difluorideRBC Rotating biological contactorRc Cake resistanceRedox Reduction-oxidationrMBR (Biomass) rejection membrane bioreactorRO Reverse osmosisSAD Specific aeration demandSADm Specific aeration demand – membrane area (in Nm3 air/(hr�m2))SADp Specific aeration demand – permeate volume (in Nm3 air/m3 permeate)SAE Standard aeration efficiency (kgO2/kWh)SBR Sequencing batch reactorSCADA Supervisory control and data acquisitionsSDI Silt density indexsMBR Sidestream membrane bioreactorSME small-to-medium sized enterpriseSMP Soluble microbial productSMPc Soluble microbial product (carbohydrate)SMPp Soluble microbial product (protein)SNdN Simultaneous nitrification/denitirificationSRF Specific resistance to filtrationSRT Solids retention timeSUVA Specific UV absorbance per unit organic carbon concentrationSVI Sludge volume indexSW Spiral-woundTDS Total dissolved solidsTF Trickling filterTHMFP Tri-halo methane formation potentialTKN Total Kjedldahl nitrogenTMDL Total maximum daily loadTMP Transmembrane pressureTOC Total organic carbonTSS Total suspended solidsUASB Upflow anaerobic sludge blanketUF UltrafiltrationVRM Vacuum rotating membraneVSS Volatile suspended solidsWRP Water recycling (or reclamation) plantWWTP Wastewater treatment plant
Abbreviations 309
1856174817_Abbreviations.qxd 6/3/06 4:41 PM Page 309

This page intentionally left blank
Glossary of Terms
A number of key terms used in the book are defined below. Proprietary names andprocesses are not included.
Aerobic Conditions where oxygen acts as electron donor forbiochemical reactions
Allochthonous Of terrestrial origin
Anaerobic Conditions where biochemical reactions take place inabsence of oxygen
Anisotropic Having symmetry only in one plane
anMBR Anaerobic membrane bioreactor
Annular flow Flow through an annulus (or gap created concentric cylinders)
Anoxic Conditions where some species other than oxygen acts as theelectron donor for biochemical reactions
Anthropogenic Of human origin or derived from human activity
Autochthonous Of microbial origin
Autotrophic Using carbon dioxide as sole carbon source for growth and development
Backflushing Reversing flow through a membrane to remove foulants
Biofilm Film or layer of biological material
Biological Process whereby dissolved organic chemical constituents aretreatment removed through biodegradation(or biotreatment)
Biomass Viable (living) micro-organisms used to achieve removal oforganics through biotreatment
Bubble flow Air/liquid two-phase flow where the liquid is the continuum
Cake Solid material formed on the membrane during operation
Cassette See Appendix D
Churn flow Air/liquid two-phase flow at high air/liquid ratio
1856174817_Glossary.qxd 6/6/06 2:28 PM Page 311
Clogging/ The accumulation of solids within the membrane channelssludging
Concentration Tendency of solute to accumulate at membrane: Solution polarisation (CP) interface within concentration boundary layer, or liquid film,
during crossflow operation
Conditioning First stage of membrane fouling through adsorption of materialfouling
Critical flux Flux below which permeability decline is considered negligible
Critical suction Threshold pressure arising during sub-critical flux foulingpressure
Crossflow Retentate flow parallel to the membrane surface
Cyclic aeration Aeration on n s on/n s off basis, where n is normally between5 and 30 s
Dalton (Da) Molecular mass relative to that of a hydrogen atom
Dead-end or Flow where all of the feed is converted to permeatefull-flow
Death coefficient A biokinetic parameter
Denitrification Biochemical reduction of nitrate to nitrogen gas
Dense membrane Membrane of high selectivity attained by specific physicochemicalinteractions between solute and membrane
Electrodialysis Membrane separation process by which ions are removed via ion-exchange membranes under the influence of an electromotive force (voltage)
Electron donor Species capable of donating an electron to a suitable acceptor,and is oxidised as a result
Element See Appendix D(membrane)
EMBR Extractive MBR: MBR configured so that priority pollutantsare selectively extracted into the bioreactor via the membrane
Endogenous Developing or originating within, or part of, a micro-organismmetabolism or cell
Exogenous Originating outside the micro-organism or cell
F:M (ratio) Food-to-micro-organism (ratio): Rate at which substrate is fed to the biomass compared to the mass of biomass solids
Filament Single hollow fibre or capillary tube
Filamentous Parameter indicating relative presence of filamentousindex bacteria in sludge
Fixed film Process configured with the biofilm attached to a solidprocess medium (which may be a membrane)
312 The MBR Book
1856174817_Glossary.qxd 6/6/06 2:28 PM Page 312
Glossary of terms 313
Floc Aggregated solid (biomass) particle
Flux (or permeate The quantity of material passing through a unit area ofvelocity) membrane per unit time
Flux-step Critical flux identification method whereby flux is incrementally increased and the TMP or permeability response recorded
Fouling Processes leading to deterioration of flux due to surface or internal blockage of the membrane
Gas/air sparging Introduction of gas/air bubbles
Gas/air-lift Lifting of liquid using gas/air
Gel layer Precipitation of sparingly soluble macromolecular species at formation membrane surface
Heterotrophic Requiring an organic substrate to get carbon for growth anddevelopment
Humic matter Organic matter of terrestrial origin
Hydraulic Rate at which water enters the reactorloading rate
Hydrogenotrophic Feeding of hydrogen
Hydrophilic Water-absorbent
Hydrophobic Water-repellent
Inoculum Medium containing micro-organisms initially introduced into a reactor to establish new populations and start thebiotreatment process
Intensive/ Cleaning with aggressive chemicals to recover membranerecovery clean permeability
Irrecoverable Fouling which is not removed by physical or chemical cleaningfouling
Irreversible/ Fouling which is removed by chemical cleaningpermanentfouling
Lumen-side Inside the fibre/filament/lumen
Macropore Pore with diameter above 50 mm
Maintenance Cleaning with less aggressive chemicals to maintaincleaning membrane permeability
Membrane Membrane area per unit volumepacking density
Mesophilic Thriving at intermediate temperatures (20–45°C, 15°C optimum)
1856174817_Glossary.qxd 6/6/06 2:28 PM Page 313
Mesopore Pore with diameter between 2 and 50 mm
Methanogens Microorganisms producing methane as a metabolic byproduct
Micropore Pore with diameter below 2 mm
Mist flow Air/liquid two-phase flow where the air is the continuum
Modularisation Based on modules: Using more modules at higher flows, rather than increasing the unit process size
Module See Appendix D(membrane)
Monod kinetics Kinetics defining biomass growth and decay during biotreatment
Nitrification Biochemical oxidation of ammonia to nitrate
(Organic) loading Rate at which (organic) matter is introduced into the reactorrate
Panel FS membrane element
Percolation Theory defining probability of water flowing through a theory medium containing three-dimensional network of
interconnected pores
Permeability Ease of flow through membrane, represented byflux:pressure ratio
Permeate Water or fluid which has passed through the membrane
Perm-selectivity Permeation of some components in preference to others
Plate-and-frame Synonymous with “flat sheet”
Pleated filter Type of flat sheet modulecartridge
Plug flow Flow in which no back-mixing or dispersion occurs along thelength of the pipe or reactor
Pore plugging Type of membrane fouling (by blocking of pores)
Porous Membrane of low selectivity operating by physical strainingmembrane alome
Psychrophilic Thriving at relatively low temperatures (0–20°C)
Rack See Appendix D
Recovery or Fraction of feed water converted to permeate productconversion
Reduction- Conditions defined by the presence of either dissolved oxidation oxygen or some other species capable of providing oxygen(Redox) for bioactivityconditions
314 The MBR Book
1856174817_Glossary.qxd 6/6/06 2:28 PM Page 314
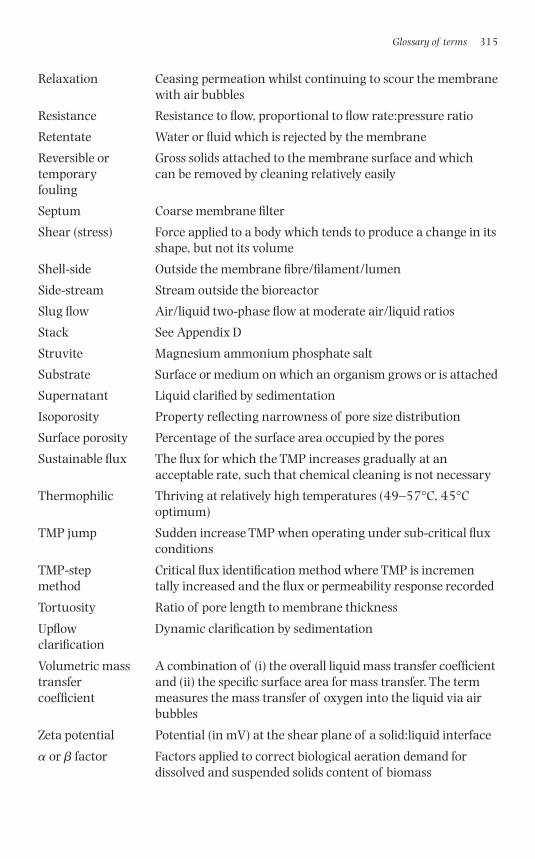
Glossary of terms 315
Relaxation Ceasing permeation whilst continuing to scour the membranewith air bubbles
Resistance Resistance to flow, proportional to flow rate:pressure ratio
Retentate Water or fluid which is rejected by the membrane
Reversible or Gross solids attached to the membrane surface and whichtemporary can be removed by cleaning relatively easilyfouling
Septum Coarse membrane filter
Shear (stress) Force applied to a body which tends to produce a change in itsshape, but not its volume
Shell-side Outside the membrane fibre/filament/lumen
Side-stream Stream outside the bioreactor
Slug flow Air/liquid two-phase flow at moderate air/liquid ratios
Stack See Appendix D
Struvite Magnesium ammonium phosphate salt
Substrate Surface or medium on which an organism grows or is attached
Supernatant Liquid clarified by sedimentation
Isoporosity Property reflecting narrowness of pore size distribution
Surface porosity Percentage of the surface area occupied by the pores
Sustainable flux The flux for which the TMP increases gradually at an acceptable rate, such that chemical cleaning is not necessary
Thermophilic Thriving at relatively high temperatures (49–57°C, 45°Coptimum)
TMP jump Sudden increase TMP when operating under sub-critical fluxconditions
TMP-step Critical flux identification method where TMP is incremenmethod tally increased and the flux or permeability response recorded
Tortuosity Ratio of pore length to membrane thickness
Upflow Dynamic clarification by sedimentationclarification
Volumetric mass A combination of (i) the overall liquid mass transfer coefficienttransfer and (ii) the specific surface area for mass transfer. The termcoefficient measures the mass transfer of oxygen into the liquid via air
bubbles
Zeta potential Potential (in mV) at the shear plane of a solid:liquid interface
� or � factor Factors applied to correct biological aeration demand for dissolved and suspended solids content of biomass
1856174817_Glossary.qxd 6/6/06 2:28 PM Page 315

This page intentionally left blank
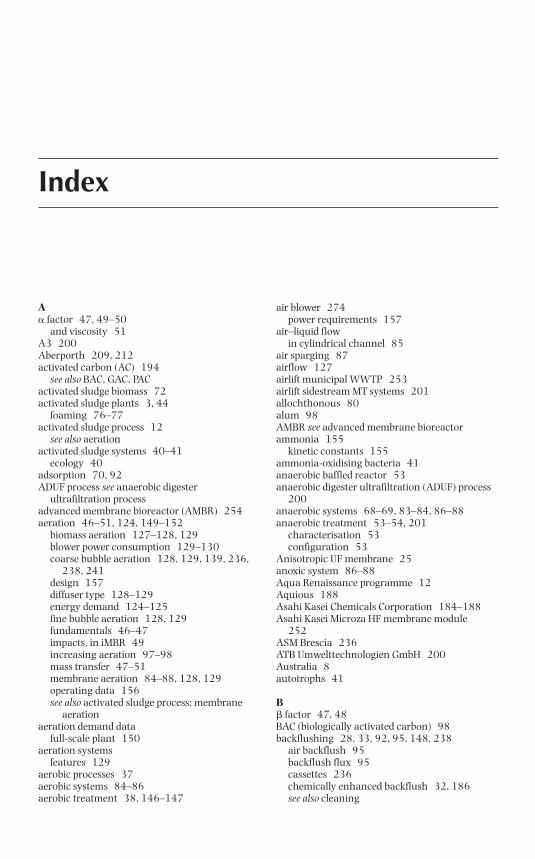
A� factor 47, 49–50
and viscosity 51A3 200Aberporth 209, 212activated carbon (AC) 194
see also BAC, GAC, PACactivated sludge biomass 72activated sludge plants 3, 44
foaming 76–77activated sludge process 12
see also aerationactivated sludge systems 40–41
ecology 40adsorption 70, 92ADUF process see anaerobic digester
ultrafiltration processadvanced membrane bioreactor (AMBR) 254aeration 46–51, 124, 149–152
biomass aeration 127–128, 129blower power consumption 129–130coarse bubble aeration 128, 129, 139, 236,
238, 241design 157diffuser type 128–129energy demand 124–125fine bubble aeration 128, 129fundamentals 46–47impacts, in iMBR 49increasing aeration 97–98mass transfer 47–51membrane aeration 84–88, 128, 129operating data 156see also activated sludge process; membrane
aerationaeration demand data
full-scale plant 150aeration systems
features 129aerobic processes 37aerobic systems 84–86aerobic treatment 38, 146–147
air blower 274power requirements 157
air–liquid flowin cylindrical channel 85
air sparging 87airflow 127airlift municipal WWTP 253airlift sidestream MT systems 201allochthonous 80alum 98AMBR see advanced membrane bioreactorammonia 155
kinetic constants 155ammonia-oxidising bacteria 41anaerobic baffled reactor 53anaerobic digester ultrafiltration (ADUF) process
200anaerobic systems 68–69, 83–84, 86–88anaerobic treatment 53–54, 201
characterisation 53configuration 53
Anisotropic UF membrane 25anoxic system 86–88Aqua Renaissance programme 12Aquious 188Asahi Kasei Chemicals Corporation 184–188Asahi Kasei Microza HF membrane module
252ASM Brescia 236ATB Umwelttechnologien GmbH 200Australia 8autotrophs 41
B� factor 47, 48BAC (biologically activated carbon) 98backflushing 28, 33, 92, 95, 148, 238
air backflush 95backflush flux 95cassettes 236chemically enhanced backflush 32, 186see also cleaning
Index
1856174817_Index.qxd 6/3/06 4:40 PM Page 317
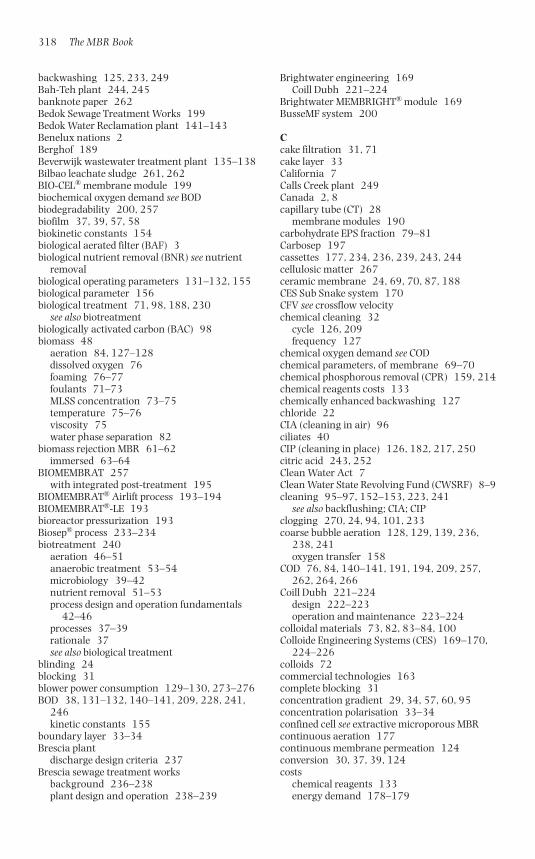
backwashing 125, 233, 249Bah-Teh plant 244, 245banknote paper 262Bedok Sewage Treatment Works 199Bedok Water Reclamation plant 141–143Benelux nations 2Berghof 189Beverwijk wastewater treatment plant 135–138Bilbao leachate sludge 261, 262BIO-CEL® membrane module 199biochemical oxygen demand see BODbiodegradability 200, 257biofilm 37, 39, 57, 58biokinetic constants 154biological aerated filter (BAF) 3biological nutrient removal (BNR) see nutrient
removalbiological operating parameters 131–132, 155biological parameter 156biological treatment 71, 98, 188, 230
see also biotreatmentbiologically activated carbon (BAC) 98biomass 48
aeration 84, 127–128dissolved oxygen 76foaming 76–77foulants 71–73MLSS concentration 73–75temperature 75–76viscosity 75water phase separation 82
biomass rejection MBR 61–62immersed 63–64
BIOMEMBRAT 257with integrated post-treatment 195
BIOMEMBRAT® Airlift process 193–194BIOMEMBRAT®-LE 193bioreactor pressurization 193Biosep® process 233–234biotreatment 240
aeration 46–51anaerobic treatment 53–54microbiology 39–42nutrient removal 51–53process design and operation fundamentals
42–46processes 37–39rationale 37see also biological treatment
blinding 24blocking 31blower power consumption 129–130, 273–276BOD 38, 131–132, 140–141, 209, 228, 241,
246kinetic constants 155
boundary layer 33–34Brescia plant
discharge design criteria 237Brescia sewage treatment works
background 236–238plant design and operation 238–239
Brightwater engineering 169Coill Dubh 221–224
Brightwater MEMBRIGHT® module 169BusseMF system 200
Ccake filtration 31, 71cake layer 33California 7Calls Creek plant 249Canada 2, 8capillary tube (CT) 28
membrane modules 190carbohydrate EPS fraction 79–81Carbosep 197cassettes 177, 234, 236, 239, 243, 244cellulosic matter 267ceramic membrane 24, 69, 70, 87, 188CES Sub Snake system 170CFV see crossflow velocitychemical cleaning 32
cycle 126, 209frequency 127
chemical oxygen demand see CODchemical parameters, of membrane 69–70chemical phosphorous removal (CPR) 159, 214chemical reagents costs 133chemically enhanced backwashing 127chloride 22CIA (cleaning in air) 96ciliates 40CIP (cleaning in place) 126, 182, 217, 250citric acid 243, 252Clean Water Act 7Clean Water State Revolving Fund (CWSRF) 8–9cleaning 95–97, 152–153, 223, 241
see also backflushing; CIA; CIPclogging 270, 24, 94, 101, 233coarse bubble aeration 128, 129, 139, 236,
238, 241oxygen transfer 158
COD 76, 84, 140–141, 191, 194, 209, 257,262, 264, 266
Coill Dubh 221–224design 222–223operation and maintenance 223–224
colloidal materials 73, 82, 83–84, 100Colloide Engineering Systems (CES) 169–170,
224–226colloids 72commercial technologies 163complete blocking 31concentration gradient 29, 34, 57, 60, 95concentration polarisation 33–34confined cell see extractive microporous MBRcontinuous aeration 177continuous membrane permeation 124conversion 30, 37, 39, 124costs
chemical reagents 133energy demand 178–179
318 The MBR Book
1856174817_Index.qxd 6/3/06 4:40 PM Page 318
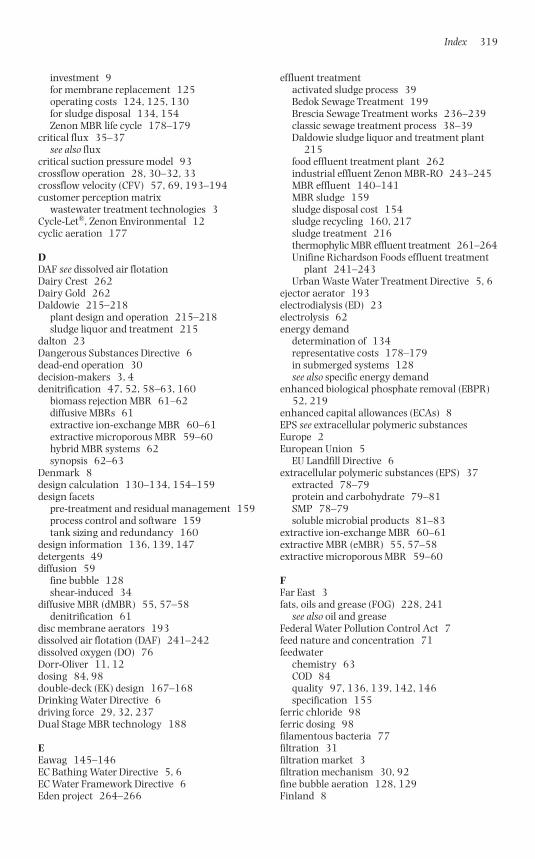
investment 9for membrane replacement 125operating costs 124, 125, 130for sludge disposal 134, 154Zenon MBR life cycle 178–179
critical flux 35–37see also flux
critical suction pressure model 93crossflow operation 28, 30–32, 33crossflow velocity (CFV) 57, 69, 193–194customer perception matrix
wastewater treatment technologies 3Cycle-Let®, Zenon Environmental 12cyclic aeration 177
DDAF see dissolved air flotationDairy Crest 262Dairy Gold 262Daldowie 215–218
plant design and operation 215–218sludge liquor and treatment 215
dalton 23Dangerous Substances Directive 6dead-end operation 30decision-makers 3, 4denitrification 47, 52, 58–63, 160
biomass rejection MBR 61–62diffusive MBRs 61extractive ion-exchange MBR 60–61extractive microporous MBR 59–60hybrid MBR systems 62synopsis 62–63
Denmark 8design calculation 130–134, 154–159design facets
pre-treatment and residual management 159process control and software 159tank sizing and redundancy 160
design information 136, 139, 147detergents 49diffusion 59
fine bubble 128shear-induced 34
diffusive MBR (dMBR) 55, 57–58denitrification 61
disc membrane aerators 193dissolved air flotation (DAF) 241–242dissolved oxygen (DO) 76Dorr-Oliver 11, 12dosing 84, 98double-deck (EK) design 167–168Drinking Water Directive 6driving force 29, 32, 237Dual Stage MBR technology 188
EEawag 145–146EC Bathing Water Directive 5, 6EC Water Framework Directive 6Eden project 264–266
effluent treatmentactivated sludge process 39Bedok Sewage Treatment 199Brescia Sewage Treatment works 236–239classic sewage treatment process 38–39Daldowie sludge liquor and treatment plant
215food effluent treatment plant 262industrial effluent Zenon MBR-RO 243–245MBR effluent 140–141MBR sludge 159sludge disposal cost 154sludge recycling 160, 217sludge treatment 216thermophylic MBR effluent treatment 261–264Unifine Richardson Foods effluent treatment
plant 241–243Urban Waste Water Treatment Directive 5, 6
ejector aerator 193electrodialysis (ED) 23electrolysis 62energy demand
determination of 134representative costs 178–179in submerged systems 128see also specific energy demand
enhanced biological phosphate removal (EBPR)52, 219
enhanced capital allowances (ECAs) 8EPS see extracellular polymeric substancesEurope 2European Union 5
EU Landfill Directive 6extracellular polymeric substances (EPS) 37
extracted 78–79protein and carbohydrate 79–81SMP 78–79soluble microbial products 81–83
extractive ion-exchange MBR 60–61extractive MBR (eMBR) 55, 57–58extractive microporous MBR 59–60
FFar East 3fats, oils and grease (FOG) 228, 241
see also oil and greaseFederal Water Pollution Control Act 7feed nature and concentration 71feedwater
chemistry 63COD 84quality 97, 136, 139, 142, 146specification 155
ferric chloride 98ferric dosing 98filamentous bacteria 77filtration 31filtration market 3filtration mechanism 30, 92fine bubble aeration 128, 129Finland 8
Index 319
1856174817_Index.qxd 6/3/06 4:40 PM Page 319
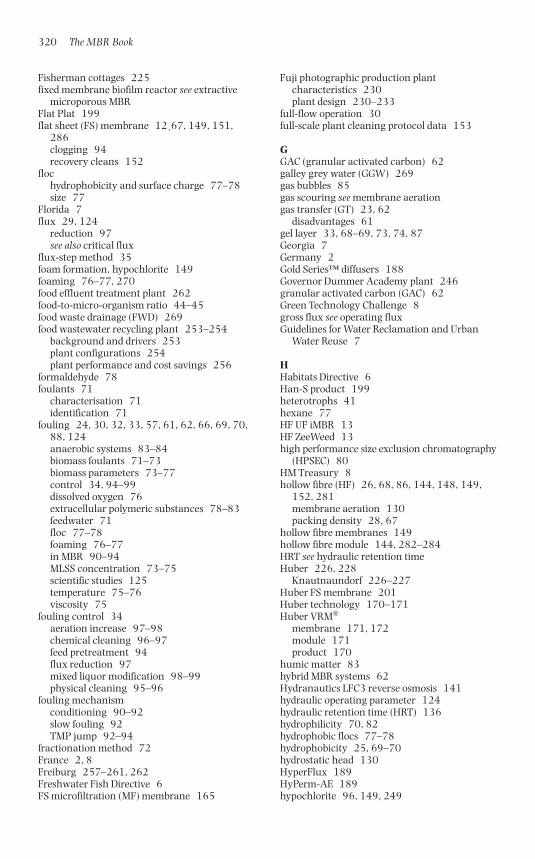
Fisherman cottages 225fixed membrane biofilm reactor see extractive
microporous MBRFlat Plat 199flat sheet (FS) membrane 12¸67, 149, 151,
286clogging 94recovery cleans 152
flochydrophobicity and surface charge 77–78size 77
Florida 7flux 29, 124
reduction 97see also critical flux
flux-step method 35foam formation, hypochlorite 149foaming 76–77, 270food effluent treatment plant 262food-to-micro-organism ratio 44–45food waste drainage (FWD) 269food wastewater recycling plant 253–254
background and drivers 253plant configurations 254plant performance and cost savings 256
formaldehyde 78foulants 71
characterisation 71identification 71
fouling 24, 30, 32, 33, 57, 61, 62, 66, 69, 70,88, 124anaerobic systems 83–84biomass foulants 71–73biomass parameters 73–77control 34, 94–99dissolved oxygen 76extracellular polymeric substances 78–83feedwater 71floc 77–78foaming 76–77in MBR 90–94MLSS concentration 73–75scientific studies 125temperature 75–76viscosity 75
fouling control 34aeration increase 97–98chemical cleaning 96–97feed pretreatment 94flux reduction 97mixed liquor modification 98–99physical cleaning 95–96
fouling mechanismconditioning 90–92slow fouling 92TMP jump 92–94
fractionation method 72France 2, 8Freiburg 257–261, 262Freshwater Fish Directive 6FS microfiltration (MF) membrane 165
Fuji photographic production plantcharacteristics 230plant design 230–233
full-flow operation 30full-scale plant cleaning protocol data 153
GGAC (granular activated carbon) 62galley grey water (GGW) 269gas bubbles 85gas scouring see membrane aerationgas transfer (GT) 23, 62
disadvantages 61gel layer 33, 68–69, 73, 74, 87Georgia 7Germany 2Gold Series™ diffusers 188Governor Dummer Academy plant 246granular activated carbon (GAC) 62Green Technology Challenge 8gross flux see operating fluxGuidelines for Water Reclamation and Urban
Water Reuse 7
HHabitats Directive 6Han-S product 199heterotrophs 41hexane 77HF UF iMBR 13HF ZeeWeed 13high performance size exclusion chromatography
(HPSEC) 80HM Treasury 8hollow fibre (HF) 26, 68, 86, 144, 148, 149,
152, 281membrane aeration 130packing density 28, 67
hollow fibre membranes 149hollow fibre module 144, 282–284HRT see hydraulic retention timeHuber 226, 228
Knautnaundorf 226–227Huber FS membrane 201Huber technology 170–171Huber VRM®
membrane 171, 172module 171product 170
humic matter 83hybrid MBR systems 62Hydranautics LFC3 reverse osmosis 141hydraulic operating parameter 124hydraulic retention time (HRT) 136hydrophilicity 70, 82hydrophobic flocs 77–78hydrophobicity 25, 69–70hydrostatic head 130HyperFlux 189HyPerm-AE 189hypochlorite 96, 149, 249
320 The MBR Book
1856174817_Index.qxd 6/3/06 4:40 PM Page 320
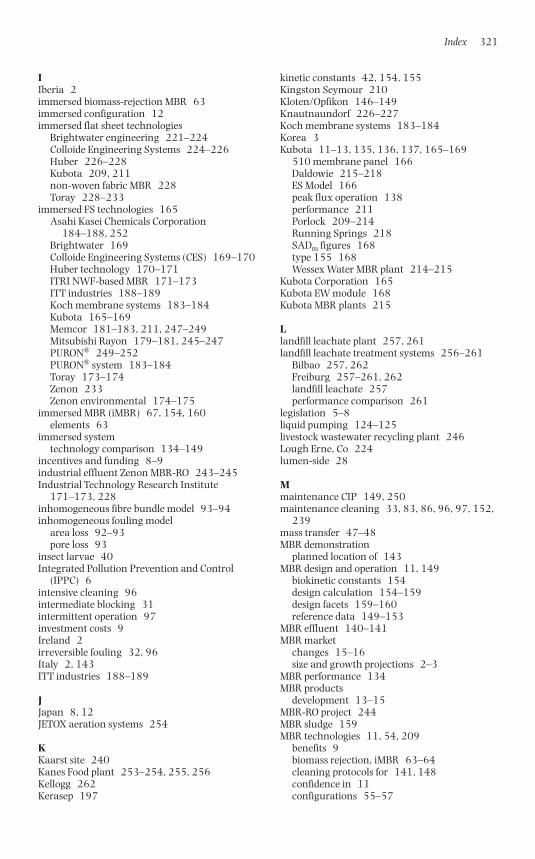
IIberia 2immersed biomass-rejection MBR 63immersed configuration 12immersed flat sheet technologies
Brightwater engineering 221–224Colloide Engineering Systems 224–226Huber 226–228Kubota 209, 211non-woven fabric MBR 228Toray 228–233
immersed FS technologies 165Asahi Kasei Chemicals Corporation
184–188, 252Brightwater 169Colloide Engineering Systems (CES) 169–170Huber technology 170–171ITRI NWF-based MBR 171–173ITT industries 188–189Koch membrane systems 183–184Kubota 165–169Memcor 181–183, 211, 247–249Mitsubishi Rayon 179–181, 245–247PURON® 249–252PURON® system 183–184Toray 173–174Zenon 233Zenon environmental 174–175
immersed MBR (iMBR) 67, 154, 160elements 63
immersed systemtechnology comparison 134–149
incentives and funding 8–9industrial effluent Zenon MBR-RO 243–245Industrial Technology Research Institute
171–173, 228inhomogeneous fibre bundle model 93–94inhomogeneous fouling model
area loss 92–93pore loss 93
insect larvae 40Integrated Pollution Prevention and Control
(IPPC) 6intensive cleaning 96intermediate blocking 31intermittent operation 97investment costs 9Ireland 2irreversible fouling 32, 96Italy 2, 143ITT industries 188–189
JJapan 8, 12JETOX aeration systems 254
KKaarst site 240Kanes Food plant 253–254, 255, 256Kellogg 262Kerasep 197
kinetic constants 42, 154, 155Kingston Seymour 210Kloten/Opfikon 146–149Knautnaundorf 226–227Koch membrane systems 183–184Korea 3Kubota 11–13, 135, 136, 137, 165–169
510 membrane panel 166Daldowie 215–218ES Model 166peak flux operation 138performance 211Porlock 209–214Running Springs 218SADm figures 168type 155 168Wessex Water MBR plant 214–215
Kubota Corporation 165Kubota EW module 168Kubota MBR plants 215
Llandfill leachate plant 257, 261landfill leachate treatment systems 256–261
Bilbao 257, 262Freiburg 257–261, 262landfill leachate 257performance comparison 261
legislation 5–8liquid pumping 124–125livestock wastewater recycling plant 246Lough Erne, Co 224lumen-side 28
Mmaintenance CIP 149, 250maintenance cleaning 33, 83, 86, 96, 97, 152,
239mass transfer 47–48MBR demonstration
planned location of 143MBR design and operation 11, 149
biokinetic constants 154design calculation 154–159design facets 159–160reference data 149–153
MBR effluent 140–141MBR market
changes 15–16size and growth projections 2–3
MBR performance 134MBR products
development 13–15MBR-RO project 244MBR sludge 159MBR technologies 11, 54, 209
benefits 9biomass rejection, iMBR 63–64cleaning protocols for 141, 148confidence in 11configurations 55–57
Index 321
1856174817_Index.qxd 6/3/06 4:40 PM Page 321
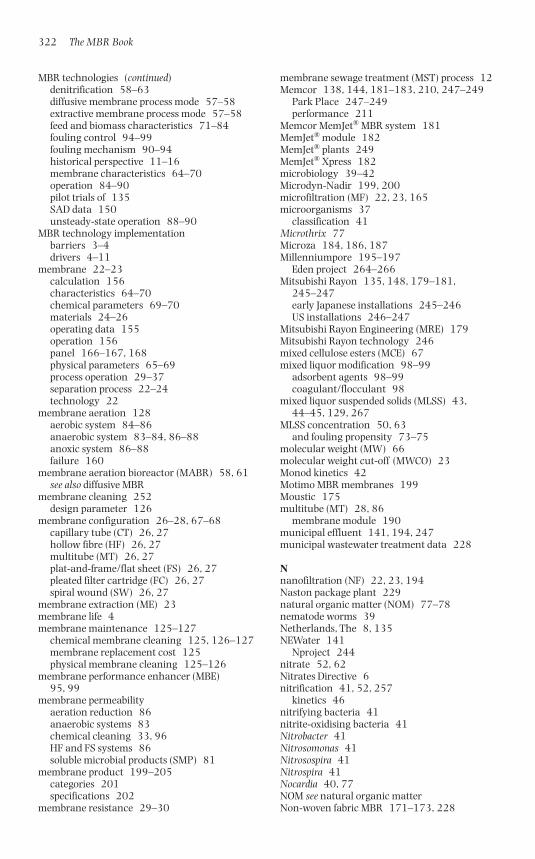
MBR technologies (continued)denitrification 58–63diffusive membrane process mode 57–58extractive membrane process mode 57–58feed and biomass characteristics 71–84fouling control 94–99fouling mechanism 90–94historical perspective 11–16membrane characteristics 64–70operation 84–90pilot trials of 135SAD data 150unsteady-state operation 88–90
MBR technology implementationbarriers 3–4drivers 4–11
membrane 22–23calculation 156characteristics 64–70chemical parameters 69–70materials 24–26operating data 155operation 156panel 166–167, 168physical parameters 65–69process operation 29–37separation process 22–24technology 22
membrane aeration 128aerobic system 84–86anaerobic system 83–84, 86–88anoxic system 86–88failure 160
membrane aeration bioreactor (MABR) 58, 61see also diffusive MBR
membrane cleaning 252design parameter 126
membrane configuration 26–28, 67–68capillary tube (CT) 26, 27hollow fibre (HF) 26, 27multitube (MT) 26, 27plat-and-frame/flat sheet (FS) 26, 27pleated filter cartridge (FC) 26, 27spiral wound (SW) 26, 27
membrane extraction (ME) 23membrane life 4membrane maintenance 125–127
chemical membrane cleaning 125, 126–127membrane replacement cost 125physical membrane cleaning 125–126
membrane performance enhancer (MBE)95, 99
membrane permeabilityaeration reduction 86anaerobic systems 83chemical cleaning 33, 96HF and FS systems 86soluble microbial products (SMP) 81
membrane product 199–205categories 201specifications 202
membrane resistance 29–30
membrane sewage treatment (MST) process 12Memcor 138, 144, 181–183, 210, 247–249
Park Place 247–249performance 211
Memcor MemJet® MBR system 181MemJet® module 182MemJet® plants 249MemJet® Xpress 182microbiology 39–42Microdyn-Nadir 199, 200microfiltration (MF) 22, 23, 165microorganisms 37
classification 41Microthrix 77Microza 184, 186, 187Millenniumpore 195–197
Eden project 264–266Mitsubishi Rayon 135, 148, 179–181,
245–247early Japanese installations 245–246US installations 246–247
Mitsubishi Rayon Engineering (MRE) 179Mitsubishi Rayon technology 246mixed cellulose esters (MCE) 67mixed liquor modification 98–99
adsorbent agents 98–99coagulant/flocculant 98
mixed liquor suspended solids (MLSS) 43,44–45, 129, 267
MLSS concentration 50, 63and fouling propensity 73–75
molecular weight (MW) 66molecular weight cut-off (MWCO) 23Monod kinetics 42Motimo MBR membranes 199Moustic 175multitube (MT) 28, 86
membrane module 190municipal effluent 141, 194, 247municipal wastewater treatment data 228
Nnanofiltration (NF) 22, 23, 194Naston package plant 229natural organic matter (NOM) 77–78nematode worms 39Netherlands, The 8, 135NEWater 141
Nproject 244nitrate 52, 62Nitrates Directive 6nitrification 41, 52, 257
kinetics 46nitrifying bacteria 41nitrite-oxidising bacteria 41Nitrobacter 41Nitrosomonas 41Nitrosospira 41Nitrospira 41Nocardia 40, 77NOM see natural organic matterNon-woven fabric MBR 171–173, 228
322 The MBR Book
1856174817_Index.qxd 6/3/06 4:40 PM Page 322
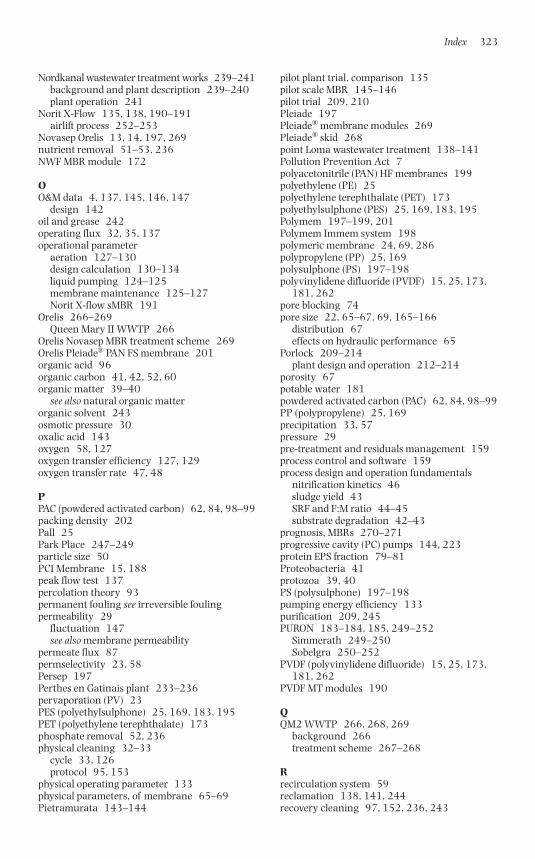
Nordkanal wastewater treatment works 239–241background and plant description 239–240plant operation 241
Norit X-Flow 135, 138, 190–191airlift process 252–253
Novasep Orelis 13, 14, 197, 269nutrient removal 51–53, 236NWF MBR module 172
OO&M data 4, 137, 145, 146, 147
design 142oil and grease 242operating flux 32, 35, 137operational parameter
aeration 127–130design calculation 130–134liquid pumping 124–125membrane maintenance 125–127Norit X-flow sMBR 191
Orelis 266–269Queen Mary II WWTP 266
Orelis Novasep MBR treatment scheme 269Orelis Pleiade® PAN FS membrane 201organic acid 96organic carbon 41, 42, 52, 60organic matter 39–40
see also natural organic matterorganic solvent 243osmotic pressure 30oxalic acid 143oxygen 58, 127oxygen transfer efficiency 127, 129oxygen transfer rate 47, 48
PPAC (powdered activated carbon) 62, 84, 98–99packing density 202Pall 25Park Place 247–249particle size 50PCI Membrane 15, 188peak flow test 137percolation theory 93permanent fouling see irreversible foulingpermeability 29
fluctuation 147see also membrane permeability
permeate flux 87permselectivity 23, 58Persep 197Perthes en Gatinais plant 233–236pervaporation (PV) 23PES (polyethylsulphone) 25, 169, 183, 195PET (polyethylene terephthalate) 173phosphate removal 52, 236physical cleaning 32–33
cycle 33, 126protocol 95, 153
physical operating parameter 133physical parameters, of membrane 65–69Pietramurata 143–144
pilot plant trial, comparison 135pilot scale MBR 145–146pilot trial 209, 210Pleiade 197Pleiade® membrane modules 269Pleiade® skid 268point Loma wastewater treatment 138–141Pollution Prevention Act 7polyacetonitrile (PAN) HF membranes 199polyethylene (PE) 25polyethylene terephthalate (PET) 173polyethylsulphone (PES) 25, 169, 183, 195Polymem 197–199, 201Polymem Immem system 198polymeric membrane 24, 69, 286polypropylene (PP) 25, 169polysulphone (PS) 197–198polyvinylidene difluoride (PVDF) 15, 25, 173,
181, 262pore blocking 74pore size 22, 65–67, 69, 165–166
distribution 67effects on hydraulic performance 65
Porlock 209–214plant design and operation 212–214
porosity 67potable water 181powdered activated carbon (PAC) 62, 84, 98–99PP (polypropylene) 25, 169precipitation 33, 57pressure 29pre-treatment and residuals management 159process control and software 159process design and operation fundamentals
nitrification kinetics 46sludge yield 43SRF and F:M ratio 44–45substrate degradation 42–43
prognosis, MBRs 270–271progressive cavity (PC) pumps 144, 223protein EPS fraction 79–81Proteobacteria 41protozoa 39, 40PS (polysulphone) 197–198pumping energy efficiency 133purification 209, 245PURON 183–184, 185, 249–252
Simmerath 249–250Sobelgra 250–252
PVDF (polyvinylidene difluoride) 15, 25, 173,181, 262
PVDF MT modules 190
QQM2 WWTP 266, 268, 269
background 266treatment scheme 267–268
Rrecirculation system 59reclamation 138, 141, 244recovery cleaning 97, 152, 236, 243
Index 323
1856174817_Index.qxd 6/3/06 4:40 PM Page 323
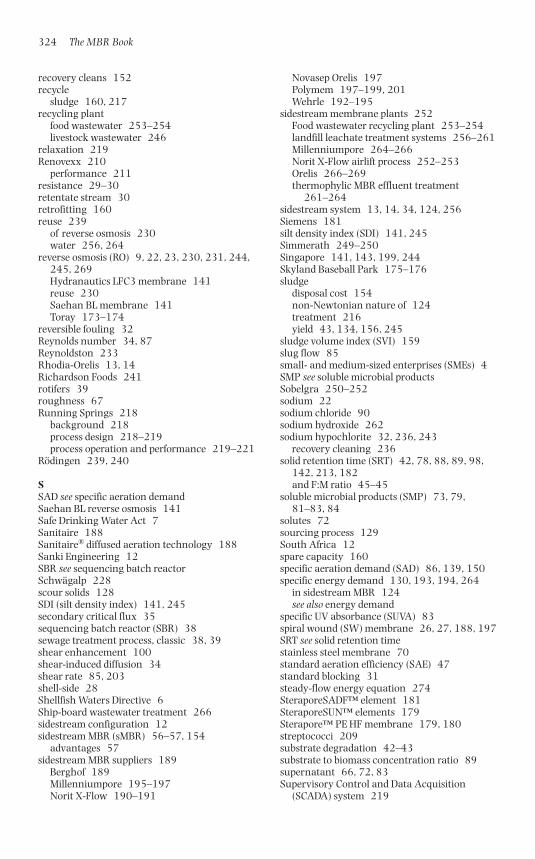
recovery cleans 152recycle
sludge 160, 217recycling plant
food wastewater 253–254livestock wastewater 246
relaxation 219Renovexx 210
performance 211resistance 29–30retentate stream 30retrofitting 160reuse 239
of reverse osmosis 230water 256, 264
reverse osmosis (RO) 9, 22, 23, 230, 231, 244,245, 269Hydranautics LFC3 membrane 141reuse 230Saehan BL membrane 141Toray 173–174
reversible fouling 32Reynolds number 34, 87Reynoldston 233Rhodia-Orelis 13, 14Richardson Foods 241rotifers 39roughness 67Running Springs 218
background 218process design 218–219process operation and performance 219–221
Rödingen 239, 240
SSAD see specific aeration demandSaehan BL reverse osmosis 141Safe Drinking Water Act 7Sanitaire 188Sanitaire® diffused aeration technology 188Sanki Engineering 12SBR see sequencing batch reactorSchwägalp 228scour solids 128SDI (silt density index) 141, 245secondary critical flux 35sequencing batch reactor (SBR) 38sewage treatment process, classic 38, 39shear enhancement 100shear-induced diffusion 34shear rate 85, 203shell-side 28Shellfish Waters Directive 6Ship-board wastewater treatment 266sidestream configuration 12sidestream MBR (sMBR) 56–57, 154
advantages 57sidestream MBR suppliers 189
Berghof 189Millenniumpore 195–197Norit X-Flow 190–191
Novasep Orelis 197Polymem 197–199, 201Wehrle 192–195
sidestream membrane plants 252Food wastewater recycling plant 253–254landfill leachate treatment systems 256–261Millenniumpore 264–266Norit X-Flow airlift process 252–253Orelis 266–269thermophylic MBR effluent treatment
261–264sidestream system 13, 14, 34, 124, 256Siemens 181silt density index (SDI) 141, 245Simmerath 249–250Singapore 141, 143, 199, 244Skyland Baseball Park 175–176sludge
disposal cost 154non-Newtonian nature of 124treatment 216yield 43, 134, 156, 245
sludge volume index (SVI) 159slug flow 85small- and medium-sized enterprises (SMEs) 4SMP see soluble microbial productsSobelgra 250–252sodium 22sodium chloride 90sodium hydroxide 262sodium hypochlorite 32, 236, 243
recovery cleaning 236solid retention time (SRT) 42, 78, 88, 89, 98,
142, 213, 182and F:M ratio 45–45
soluble microbial products (SMP) 73, 79,81–83, 84
solutes 72sourcing process 129South Africa 12spare capacity 160specific aeration demand (SAD) 86, 139, 150specific energy demand 130, 193, 194, 264
in sidestream MBR 124see also energy demand
specific UV absorbance (SUVA) 83spiral wound (SW) membrane 26, 27, 188, 197SRT see solid retention timestainless steel membrane 70standard aeration efficiency (SAE) 47standard blocking 31steady-flow energy equation 274SteraporeSADF™ element 181SteraporeSUN™ elements 179Sterapore™ PE HF membrane 179, 180streptococci 209substrate degradation 42–43substrate to biomass concentration ratio 89supernatant 66, 72, 83Supervisory Control and Data Acquisition
(SCADA) system 219
324 The MBR Book
1856174817_Index.qxd 6/3/06 4:40 PM Page 324
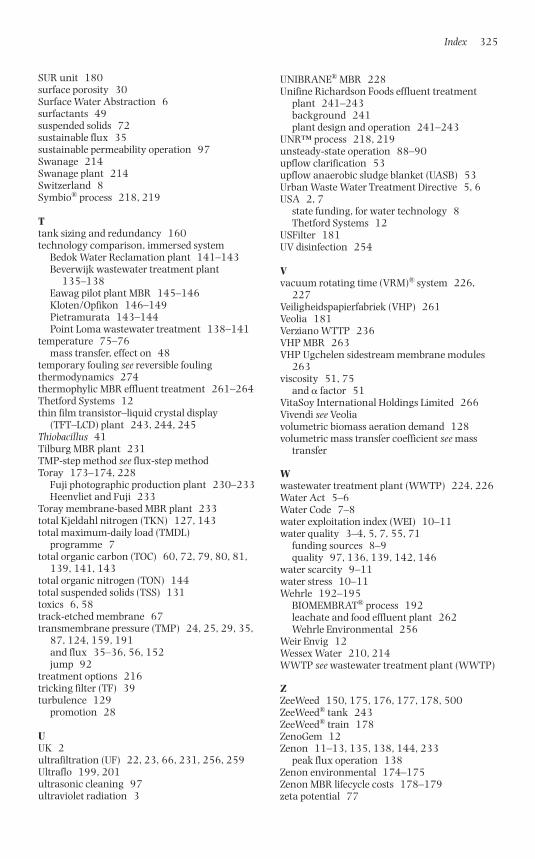
SUR unit 180surface porosity 30Surface Water Abstraction 6surfactants 49suspended solids 72sustainable flux 35sustainable permeability operation 97Swanage 214Swanage plant 214Switzerland 8Symbio® process 218, 219
Ttank sizing and redundancy 160technology comparison, immersed system
Bedok Water Reclamation plant 141–143Beverwijk wastewater treatment plant
135–138Eawag pilot plant MBR 145–146Kloten/Opfikon 146–149Pietramurata 143–144Point Loma wastewater treatment 138–141
temperature 75–76mass transfer, effect on 48
temporary fouling see reversible foulingthermodynamics 274thermophylic MBR effluent treatment 261–264Thetford Systems 12thin film transistor–liquid crystal display
(TFT–LCD) plant 243, 244, 245Thiobacillus 41Tilburg MBR plant 231TMP-step method see flux-step methodToray 173–174, 228
Fuji photographic production plant 230–233Heenvliet and Fuji 233
Toray membrane-based MBR plant 233total Kjeldahl nitrogen (TKN) 127, 143total maximum-daily load (TMDL)
programme 7total organic carbon (TOC) 60, 72, 79, 80, 81,
139, 141, 143total organic nitrogen (TON) 144total suspended solids (TSS) 131toxics 6, 58track-etched membrane 67transmembrane pressure (TMP) 24, 25, 29, 35,
87, 124, 159, 191and flux 35–36, 56, 152jump 92
treatment options 216tricking filter (TF) 39turbulence 129
promotion 28
UUK 2ultrafiltration (UF) 22, 23, 66, 231, 256, 259Ultraflo 199, 201ultrasonic cleaning 97ultraviolet radiation 3
UNIBRANE® MBR 228Unifine Richardson Foods effluent treatment
plant 241–243background 241plant design and operation 241–243
UNR™ process 218, 219unsteady-state operation 88–90upflow clarification 53upflow anaerobic sludge blanket (UASB) 53Urban Waste Water Treatment Directive 5, 6USA 2, 7
state funding, for water technology 8Thetford Systems 12
USFilter 181UV disinfection 254
Vvacuum rotating time (VRM)® system 226,
227Veiligheidspapierfabriek (VHP) 261Veolia 181Verziano WTTP 236VHP MBR 263VHP Ugchelen sidestream membrane modules
263viscosity 51, 75
and � factor 51VitaSoy International Holdings Limited 266Vivendi see Veoliavolumetric biomass aeration demand 128volumetric mass transfer coefficient see mass
transfer
Wwastewater treatment plant (WWTP) 224, 226Water Act 5–6Water Code 7–8water exploitation index (WEI) 10–11water quality 3–4, 5, 7, 55, 71
funding sources 8–9quality 97, 136, 139, 142, 146
water scarcity 9–11water stress 10–11Wehrle 192–195
BIOMEMBRAT® process 192leachate and food effluent plant 262Wehrle Environmental 256
Weir Envig 12Wessex Water 210, 214WWTP see wastewater treatment plant (WWTP)
ZZeeWeed 150, 175, 176, 177, 178, 500ZeeWeed® tank 243ZeeWeed® train 178ZenoGem 12Zenon 11–13, 135, 138, 144, 233
peak flux operation 138Zenon environmental 174–175Zenon MBR lifecycle costs 178–179zeta potential 77
Index 325
1856174817_Index.qxd 6/3/06 4:40 PM Page 325