Embed Size (px)
Citation preview

' ‘- W..- . 0.0. a: 0‘ v.9..o-.-\. "~“"“““~V‘I"WMO
THE master-105m cnoss RIVER
AS A COMMERCIAL HmHWAY-m
~ SOUTH EASTERN NEG-EMA -
‘thesis for the Degree 5f :14. A. '
MECHFGAN STATE UNWERSIW
GRACE EKDNG -
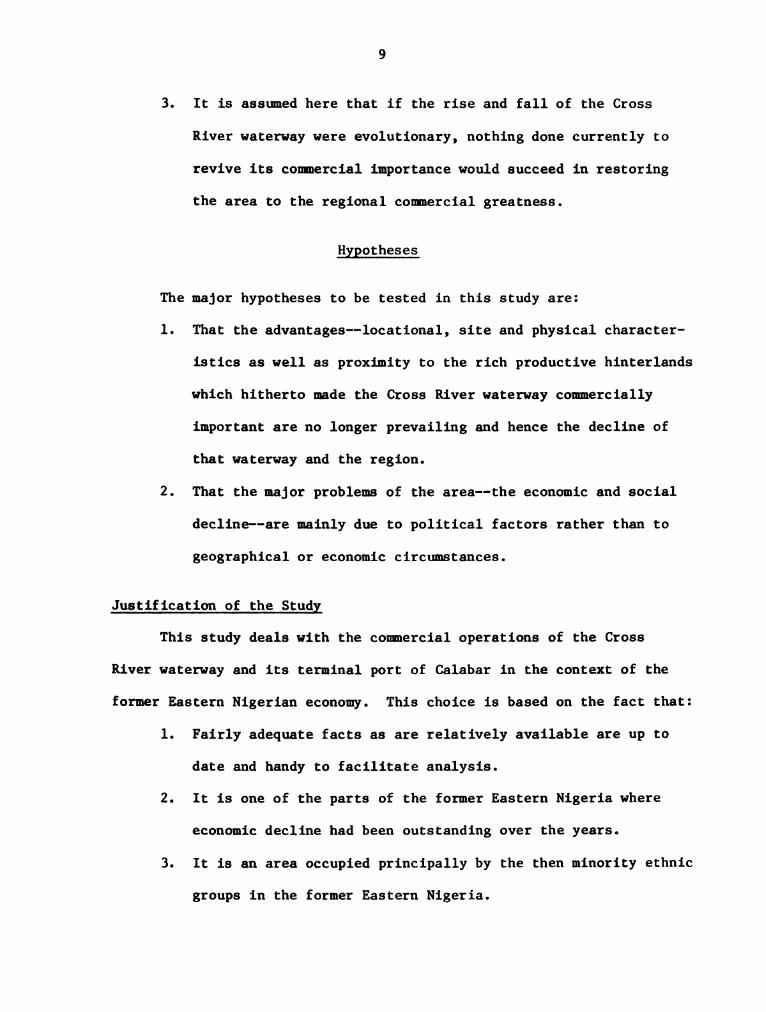
' 1974 '

11:4,! ""111an III llllll 1mm«7111 mm][In931
SSSSSS

ABSTRACT
THE DECLINE OF THE CROSS RIVER AS A COMMERCIAL
HIGHWAY IN SOUTH EASTERN NIGERIA
BY
Eyibl'o
Grace‘Ekong
The major purpose of this thesis is to examine the main causes
of the decline of the Cross River waterway and its ports for commercial
purposes in South Eastern Nigeria. Within this context, it is
intended to determine whether the major factors underlying the
decline of that waterway were purely physical and geographic or
they were social and political. In other words, the aim of the study
is to test and ascertain whether such causes were natural or man made,
and also whether such causes were related or unrelated to the cause-and-
effect conditions which generally follow developments in a developing
and expanding region.
The study first traces the historical development of the Cross
River waterway and its ports in the wake of European contacts and
international trade between West Africa and Europe and America dating
back to the early 17th century. This area's prominence lasted well
into the early 20th century. After the First world war, the area
steadily declined in commercial importance and conditions became so
deplorable that by early 19603, it was but a ghost region of the
former Eastern Nigeria.

Grace Ekong
The hotly debated question among the natives of the Cross
River basin was whether the decline of the area was due to social
and political reasons or just a function of natural factors.
Two hypotheses are tested and those are:
(1) whether the locational, site and physical characteristics
hitherto responsible for the prominence of the area had
since changed for the worse; and
(2) whether political and social actions taken by the controlling
authorities were responsible for such a decline.
Drawing from analysis of available statistical tables, graphs
and diagrams and opinions of experts, the two hypotheses are examined.
It was discovered that those geographical and physical factors such
as site, locational and physical characteristics which had hitherto made
the area strategically important in commerce have not declined in their
role. If anything, they have become more prominent in making that
zone important from transportation and commercial standpoint. Rather
the misfortunes of the Cross River waterway and its ports were the
outcomes of a series of political directives dating back from the
British Colonial governments and worsened by the political decisions
of the Nigerian indigenous governments.
The study traces the decision to connect the coal mines at
Enugu to Port Carcourt and not Calabar, even when it cost more to
deepen and open the waterway from Port Harcourt to the sea as the
beginning of such actions. The removal of the administrative head-
quarters of the country from Calabar to Lagos and the later decision
to develop the ports of Lagos and Port Harcourt for ocean shipping

Grace Ekong
while neglecting Calabar port all indicate the biased nature of those
political decisions. The government of the former Eastern Nigeria
worsened the situation by economic neglect of the area, reversal of
the flow of traffic north-south to east-west to help Port Harcourt
and the use of the Regional Marketing Board to enhance the use of
Port Harcourt at the expense of Calabar. All helped to ruin the
Cross River and its ocean port of Calabar.
In conclusion, the reasons for the decline of the area are
found to be more political and social than geographic and physical.
This knowledge thus raises the hope that the current efforts to
reactivate the Cross River basin and waterway for economic and
general commercial purposes will, all things considered, yield
reasonable dividends for the future.
THE DECLINE OF THE CROSS RIVER AS
A COMMERCIAL HIGHWAY IN
SOUTH EASTERN NIGERIA
By
{$59
GraceAEkong
A THESIS
Submitted to
Michigan State University
in partial fulfillment of the requirements
for the degree of
MASTER OF ARTS
Department of Geography
1974
tgggékfto\
ACKNOWLEDGMENTS
I am deeply grateful to my husband, Bassey U. Ekong for making
my study in Michigan State university possible. He has given me all
the physical, moral and financial support needed for this pursuit.
My sincere appreciation also goes to Dr. I. Matley, my academic
adviser, for his great faith in me by giving me his time, generous
advice and direction throughout both my course work and this research.
I want also to express my thanks to Dr. D. Stephenson for his assistance,
to Mr. Hollander for his cartographic work and advice and other faculty
members of the Geography Department for all their help and contributions
to me.
My sincere gratitude goes also to my parents Ni. and Mrs. Eyibio
Akpan Efiong for my basic education which laid the groundwork for
this ultimate university education. I thank them for the spiritual
and moral support.
11

Chapter
II
III
IV
V
Appendix
TABLE OF CONTENTS
THE PROBm. O O O O O O O O O O O O O O 0
Introduction. . . . . . . . . . . . . .
Problem Definition. . . . . . . . . . .
Objectives of the Study . . . . . . . .
Scope of the Study. . . . . . . . . . .
Assumptions . . . . . . . . . . . . . .
Hypotheses O C O O O O O O O O O O O O O O
Justification of the Study. . . . . . .
Tools of Analysis and Methodology . . .
Plan of the Study . . . . . . . . . . .
THE GEOGRAPHIC AND HISTORICAL COMMERICAL
BACKGROUND TO THE IMPORTANCE OF THE
CROSS RIVER. O O O O O O O O C O O O O O 0
Geography . . . . . . . . . . . . . . .
Location Factors . . . . . . . . . .
Physical Advantages. . . . . . . . .
Pre-Colonial Inland Trade . . . . . . .
Pre-Colonial International Trade. . . .
Slave Trade. . . . . . . . . . . . .
The Rise of Legitimate Trade . . . .
Palm Oil . . . . . . . . . . . . . .
Colonial Trade . . . . . . . . . . .
THE DECLINE OF THE CROSS RIVER AS A MAJOR
COMMERICAL HIGHWAY . . . . . . . . . . . .
FACTORS RESPONSIBLE FOR THE COMMERCIAL
DECLINE OF THE CROSS RIVER WATERWAY. . . .
SUMMARY AND CONCLUSIONS. . . . . . . . . .
Bibliography. . .‘. . . . . . . . . . . . . . . . .
Page
0000me
H\O
10
11
12
12
16
18
20
22
23
25
26
29
34
46
7O
77
87
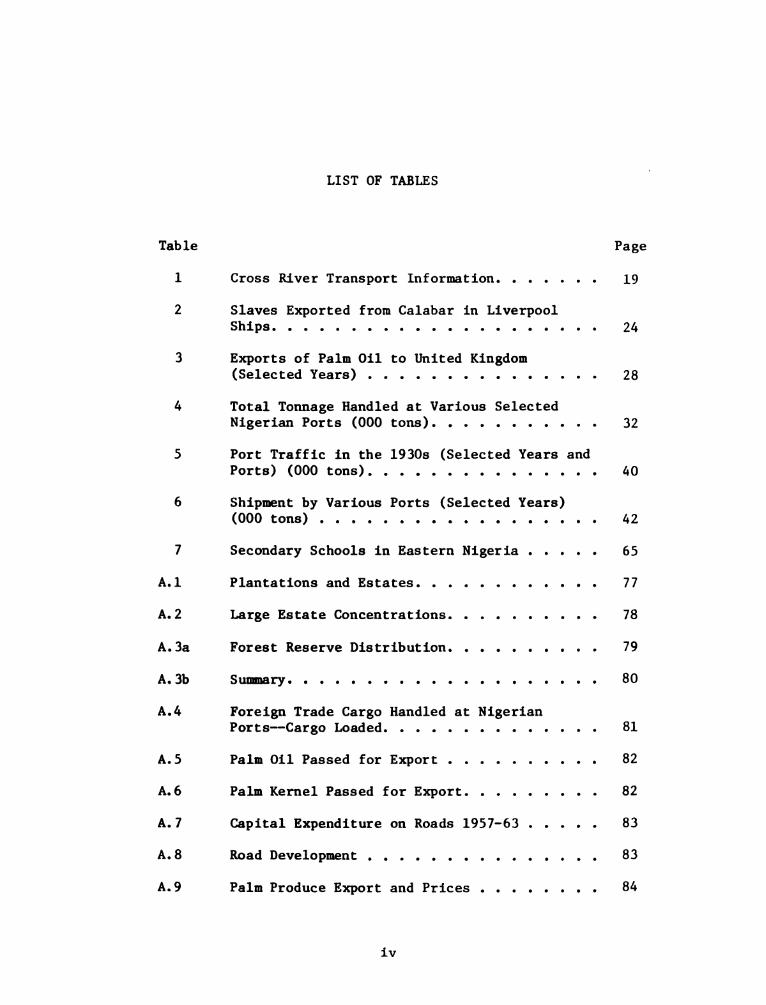
Table
A01
A02
A.3a
A.3b
A.4
A.5
A.6
A.8
A.9
LIST OF TABLES
Cross River Transport Information. .
Slaves Exported from Calabar in Liverpool
Ships. I O I O O O O O O O O O O O 0
Exports of Palm Oil to United Kingdom
(Selected Years) . . . . . . . . . .
Total Tonnage Handled at Various Selected
Nigerian Ports (000 tons). . . . . . . . . . .
Port Traffic in the 19308 (Selected Years and
Ports) (000 tons). . . . . . . . . .
Shipment by Various Ports (Selected Years)
(000 tons) . . . . . . . . . . . . .
Secondary Schools in Eastern Nigeria
Plantations and Estates. . . . . . .
Large Estate Concentrations. . . . .
Forest Reserve Distribution. . . . .
Summary. . . . . . . . . . . . . . .
Foreign Trade Cargo Handled at Nigerian
Ports-Cargo Loaded. . . . . . . . .
Palm Oil Passed for Export . . . . .
Palm Kernel Passed for Export. . . .
Capital Expenditure on Roads 1957-63
Road Development . . . . . . . . . .
Palm Produce Export and Prices . .
iv
Page
19
24
28
32
40
42
65
77
78
79
80
81
82
82
83
83
84

Table
A.10
A.11
A.12
Page
Location of Industries 1962-63. . . . . . . . . 84
Tonnage of Cargo Shipped Coastwise--Cargo
Loaded o o o o o o o o o o o o o a a o o o o o o 85
General Cargo Handled From 1955-56 to 1972-73
(All Ports) (Metric Tonne). . . . . . . . . . . 86

LIST OF FIGURES
Figure Page
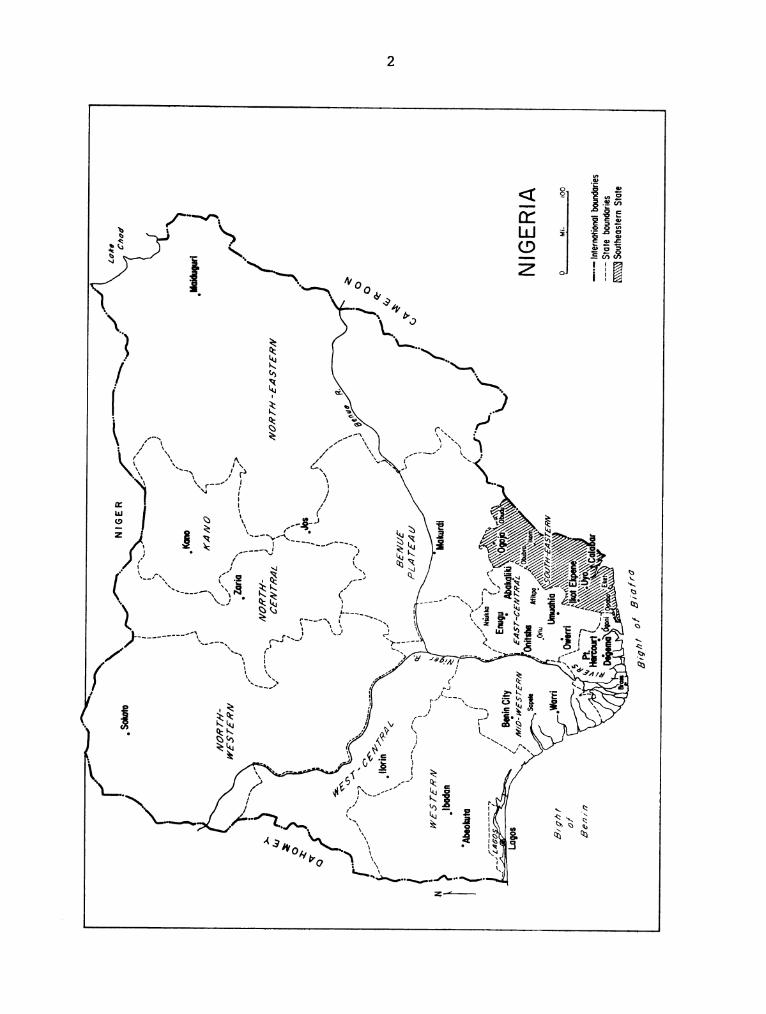
1 Nigeria Showing Location of South Eastern Nigeria. . . 2
2 Political Divisions of South Eastern State of
Nigeria 0 O O O O O O O O O O O O I O O O O O O O O O 4
3 Main Physiographic Regions of South Eastern Nigeria. . 14
4 Ports of the Cross River . . . . . . . . . . . . . . . l7
5 Proximal Location of Ports in Southern Nigeria . . . . 48
6 Nigeria Transportation . . . . . . . . . . . . . . . . 56
vi

CHAPTER I
THE PROBLEM
Introduction
The earliest European contact with West Africa dates back to the
Fifteenth Century.1 This contact was mostly spurred by trade because,
according to Dike,2 the whole history of modern West Africa is one of
five centuries of trade with European nations. Possibly out of the
desire to procure and control trade among other reasons, several groups
of adventurers--religious, commercial, military--politica1 and settler
elements have come to Africa. While the early contacts were with the
coastal natives, certain ocean terminals offered better facilities for
shipping and trade than the rest. In particular, in the area now known
as Nigeria, the town of Lagos on the Lagos Lagoon; Akassa, Brass and
Bonny in the Niger Delta and Calabar on the Cross River had in time
gained great commercial importance.
These early contacts led to the introduction of slave trade
across the sea of African natives--the unfortunate victims of the
nefarious triangular economic deals linking Africa, Europe and America.
1The Portuguese came around 1450 to 1460 before even the Treaty
of Tordessilas in 1494. See J. W. Blake: European Beginnings in West
Africa, London, 1937.
2Dike, Kenneth 0. Trade and Politics in the Niger Delta,
Clarendon Press, Oxford, 1956.
.__._..
.Lalo
h/
Q's“
[if
\.
.5/
WW
”0”779"
lI
\\
WESTé‘R/V
,~-/
‘
\\
NORTH-EASTERN
.A
A 3’90/1
,’-—
PMr54
7/
'9‘
fV
W55fER/t/
“7
.Ibadaa
‘A
Makurdt
”I
'Abookuta
,I’
,.
/I
r-"'|
:
I
\\'_
.J
-IA/"fink"
{2”
“NI/fl
'1‘.\f/
[-‘J[2.1C6;0J’-‘I‘s
\‘
l/
‘Ema“
”‘1“k
(‘x\ \
\
I
"‘/’
I) a 195/”
I
(
“J
I A‘
,W
..’
r,
at"
gx.
\,
I“BEAM/E
.|
<7
‘
‘
\\
~-
U,
as
/BeginCi
tyAb
akgl
iki
9a,
M/o-we'srgmv
[ASf-C‘EIVfRAZA
I
/Sonata
100"“
'M\\
MW
Afikpo«\,;§k\\\\\\\\\\l\§
NIGERIA
.h
‘|
0/
I”
’‘
6P;'Ih";:{.:rtiSufi?E§<i\\w;
LM,-
op
Ben/n
'r;‘2
\Uz;
W\\\(\;‘\¢\ll
’M
73W
1......
.—
‘“19:4lg
--
Internationalbaundaries
£u\\
-—-
State
boundaries
\\\\\\VSoutheastern
State
5/9/77
ofB’OHU

In this trade, both the Cross River waterway and the Port of Calabar
played a leading role. With its official abolition in 1807, greater
3 Palmattention was paid to what came to be called "legitimate" trade.
oil, and later palm kernel, came to be the principal articles of exports
from the Bights of Benin and Biafra. Indeed, the importance of palm oil
exports from the area lent the area the name of Oil Rivers Protectorate.
By the 18303 palm oil trade had made both the Cross River and the
port city of Calabar famous. This export commodity was shipped down
from the hinterlands of Old Ogoja Province, Old Calabar Province and
parts of Old Owerri Province to the Port of Calabar. The period between
1885 and 1920 made the Cross River a busy commercial highway. Indeed,
exports via Calabar port constituted a major part of the total Nigerian
exports up to and including the First World War years.
Between 1920 and 1966 the Cross River and the Port of Calabar
passed through three stages into complete decadence. Directly after
the First World War a period of stagnation sets in. During and after
the Second World War, from 1939 to 1954, the area passed through a
critical stage in which major economic shifts were being made by
traders to areas west of Calabar. Between 1954 and 1966, Calabar and
the Cross River declined to a point where the port city was nothing but
a ghost town. Little, if any, of the export-import trade then passed
through the Cross River waterway anymore. The contrast between the
Cross River waterway and Calabar port in 1860 and 1960 must have been
heartbreaking to a centenarian.
3Dike, K. 0., 92, cit., pp. 48-49.

POLITICAL DIVISIONS OF
THE SOUTHEASTERN j\..\‘
STATE OF NIGERIA
Ogoja
' KROGOJA OBUDUI
© State capital
0 Major cities and townsQ
--- International boundary ’ I KO M 00
-..- State boundary 9' ‘2 (3‘
------- Internal political (z 'Obubra3.: ' \“divisions c, I” .- v.
(0" 9
0 OBU BRA
\,\.-:‘ .. AKAMKPA .....‘
”Um, ..-(L; CALA BAR
fikpene'fi, Calabar 'IKOT EKPENE ..':-...:.. 3W0
4wAmt..."UYO
-. ABA K jogORON\;;.E.:1
\-----
OPOBOFAK
E“
gt>Opobo " ' '

What is involved in this study is the rise and fall in the commercial
activities of a region of Nigeria. Quite varied reasons--relevant and
irrelevant--have been offered in trying to explain the decline of the
Cross River waterway and its ports. Some have been based on physical
factors of geography, such as: location, site, proximity to rich and busy
areas. These are the usual factors involved in analysis of location of
business activities. Other reasons offered are purely economic, while
the rest are either social and political or else associated with a
philosophy of development. This study intends to examine these reasons
with a view to unravelling those which principally underlie the decline
of the Cross River waterway and its ports.
Problem Definition
A study conducted on the factors responsible for the emergence
and later decline of the Niger Delta ports4 has generally attributed the
reasons to such geographical factors as locational advantages, site
advantages and change of economic activities. The Udo—Ogundana thesis
has treated the problems of the rise and fall of these regions as an
evolutionary process inherent in economic development of a developing
nation. This treatment upholds the "survival-of-the-fittest" argument.
The thesis also accepts competition as a potent weapon for selection of
economic activities and their locations.
0n the other hand, the peoples of the Cross River area have
accused the government of the former Eastern Nigeria with deliberate
4Udo, Reuben K. and Ogundana, Babafemi. "Factors Influencing
the Fortunes of Ports in the Niger Delta," Scottish Geographical
Magazine, No. 82, 1966, pp. 169-183.

economic sabOtage of their area through calculated neglect and diversion
of activities to other areas but theirs.5 Whether there is enough sub-
stance in this allegation depends on ability to isolate the geographic
and normal economic factors from the events leading to the decline of the
Cross River waterway, its inland ports and the seaport of Calabar. The
problem is to distinguish between the sets of purely physical geographic
factors and of socio-political factors and to determine which set has
contributed more to the decline of the Cross River waterway and its ports.
It is firmly held that a region rises into prominence because of specific
advantages it enjoys--physical, social and economic. Its fall must be
due to the decline of those factors either by comparison to other more
superior nearby regions or a decline which is absolute. In either case,
the decline must be a function of changed situations for the worse.
This study intends to classify those factors, geographic and
physical, economic, social and political, which contribute to the decline
of the Cross River waterway for commercial purposes. This will enable
facts to be isolated from fictions. A knowledge gained in this way will
prove or disprove the evolution theory held by some geographers6 with
respect to the rise and fall of the Cross River region. How far the
dynamic factors which make for specific changes in the fortunes or mis-
fortunes of the Cross River waterway are due to chance or to deliberate
decisions of socio-political authorities would be revealed in this study.
5Aye, E. U. Old Calabar Through the Centuries, Calabar, 1967, and
Latham, A. J. H. Old Calabar 1600-1891, Clarendon Press, Oxford 1973.
(Epilogue 1891-1971).
6Odo-Ogundana, op, cit.

Objectives of the Study
This study is expected to throw light on the thorny question of
whether geographical factors by themselves are capable of causing regional
decline in the absence of nongeographic reasons. In general, the question
is on the power of geographical advantages as factors in the location of
economic activities. What happens when locational, natural endowments,
site and physical characteristics and relative economic advantages
change for the worse? What part do changes in social and political
fortunes of a region play in the promotion or retardation of the region?
Specifically, these theories must be examined with reference to
the Cross River inland ports and the seaport of Calabar in the commercial
history of Nigeria. Since diverse reasons have been offered in explana-
tion of the decline of that region's trade, a proper knowledge will:
1. Place facts in their proper perspective so as to enable wild
and unsubstantiated allegations to be isolated from the
truths as they are.
2. Offer opportunities for people to know the facts and thereby
disabuse their minds of the oft-repeated allegations against,
the former government of the area if the allegations are untrue.
3. Offer the present government proper tools on which to base
their decisions in the current effort to reactivate the Cross
River waterway and the economic development and rehabilitation
of the area generally and Calabar port in particular.
4. Help test the theories of geography on locational analysis
and the conventional factors affecting such location of
economic activities.

Scope of the Study
This study is confined to the commercial fortunes and misfortunes
of the Cross River waterway, its inland ports and the seaport of Calabar
in the context of South Eastern Nigeria, (usually known as Eastern
Nigeria). The area involved is that zone west of the Cameroon Mountains
and east of the Niger River, but covering the two continguous Old
Calabar and Ogoja provinces. Specifically, the area of study will
relate to the Cross River basin,7 to the South Eastern Nigeria and
references to places outside the area will only serve historical
connections or illustrative purposes. Facts and figures will be drawn
from available sources--commercial, historical, etc. to strengthen
discussions.
Assumption
In this study it is assumed that casues of the rise and later
the decline of the Cross River waterway for commercial purposes are
mainly physical, economic and socio-political.
1. For the study of the Cross River waterway, the river ports
of the waterway would be included as major areas of the study.
2. It is intended that the usual factors in geographye-location
and site-believed to be responsible for the rise and fall
of locations for economic activity purposes will be examined
with respect to the Cross River waterway and its ports.
7R. K. Udo differentiated between Cross River District and Cross
River plain or basis, the latter including the former. See Journal
of Tropical Geography, No. 1066, Singapore, 1965, pp. 65-72.
3. It is assumed here that if the rise and fall of the Cross
River waterway were evolutionary, nothing done currently to
revive its commercial importance would succeed in restoring
the area to the regional commercial greatness.
Hypotheses
major hypotheses to be tested in this study are:
That the advantages--locational, site and physical character-
istics as well as proximity to the rich productive hinterlands
which hitherto made the Cross River waterway commercially
important are no longer prevailing and hence the decline of
that waterway and the region.
That the major problems of the area--the economic and social
decline--are mainly due to political factors rather than to
geographical or economic circumstances.
Justification of the Study
This study deals with the commercial operations of the Cross
River waterway and its terminal port of Calabar in the context of the
former Eastern Nigerian economy. This choice is based on the fact that:
1. Fairly adequate facts as are relatively available are up to
date and handy to facilitate analysis.
It is one of the parts of the former Eastern Nigeria where
economic decline had been outstanding over the years.
It is an area occupied principally by the then minority ethnic
groups in the former Eastern Nigeria.

lO
4. It is the area where the controversies of state creation were
very pronounced and where the regional government was accused
of deliberate economic sabotage for political reasons.
5. A test of the major factors which are accountable for the
decline of that region will make it easy to determine which
factors were mostly responsible for that region's decline.
6. Only on such grounds can proper knowledge be obtained such
that either the former regional government is exonerated or
blamed, based on factual evidences.
7. This study should also offer one more opportunity of testing
the theoretical factors of geography which generally affect
location of major economic activities, in this instance,
inland and ocean shipping and foreign trade.
Tools of Analysis and Methodology
Most of the analysis in this study will make use of statistical
tables, graphs and diagrams along with expert opinions of practical
people to draw the necessary conclusions. The gaps likely to exist in
the available information where conclusions may not be supported by
empirical evidence will be filled by theoretical arguments where available.
Deductive analysis will be used in combination with the interpretation
of available data and standard theses in the field, to explain the factors
responsible for the decline of the Cross River waterway and its terminal
ocean port of Calabar. In most cases, the conclusions may be based
more on qualitative than quantitative analysis, unless sufficient
explanatory data exist to make such analysis sufficiently quantitative.
11
Plan of the Study
Chapter II of this study will explore the geographic and historical
background to the importance of the Cross River as a great commercial
highway in South Eastern Nigeria.
Chapter III will examine and analyze the decline of the Cross
River as a commercial highway along with its ocean port of Calabar
between 1920 and 1966. This should involve the comparison of traffic
volumes before and after the World war I years on the Cross River.
Chapter IV analyzes the major factors responsible for the decline
of the Cross River waterway for commercial purposes of the former Eastern
Region. Here tests will be made of geographic factors affecting location
of economic activities and even the political factor of power possession
and its use.
Chapter V contains the major summaries and conclusions on the
factors affecting the rise and decline of the Cross River. Which
factors are and which are not positively contributing to the decline of
the Cross River region. Major statements on the role of the factors
will be made in this chapter.

CHAPTER II
THE GEOGRAPHIC AND HISTORICAL COMMERCIAL BACKGROUND
TO THE IMPORTANCE OF THE CROSS RIVER
Geography
For the purpose of this study, the area designated as South Eastern
Nigeria will cover and include that whole administrative part of Nigeria
formerly known as Eastern Nigeria, but which is today made up of three
contiguous states-~South Eastern, East Central and Rivers.8 The area
is bounded on the west by the River Niger, on the east by the Cameroon
Republic and the north by the Benue-Plateau State and on the south by
the Atlantic Ocean at the Bight of Biafra. The land area is 29,484
square miles and has a population estimated at 17.5 million by 1973.
The chief physiographic distinction of this area lies in its
predominantly level plainlands, which are well watered by a number of
rivers flowing into the sea. The coastal plains with their peculiar
soil types derived from relatively undisturbed young sediment of the
Cretaceous and Tertiary periods, which have been eroded to form
extensive plains, only slightly incised by river action.9 The presence
8Created by the military decree of 1967. See Federal Gazette,
May 27, 1967. For circumstances of the decree and the Nigerian Civil
War, see Akpan, N.U. The Strgggle for Seccession—-l966-l970, Frank
Cass, London, 1971.
9Geolggical Survengeports, Bulletin Nos. 6 and 8, Nigerian
Government, Lagos, 1925.
12

13
of younger sediments within the crystalline or metamorphic blocks has
resulted in the occurrence of mineral fuels like lignite and coal of
the East Central State, oil and natural gas of the Rivers and the South
Eastern States.10
The physiographic features of the area show a gradual slow ascent
from the Niger Delta in the southwest to the Cameroon Mountains in the
east and northeast, interrupted by a series of steplike scoops running
through the center of the region. Indeed, South Eastern Nigeria thus
has five major geographical zones running from northeast to southwest:
l. The Western Spurs of the Cameroon Mountains.
2. The Cross River Basin
3. The Plateau and Escarpment Zone of the East Central State
4. The Coastal Plains of Onitsha, Owerri, Uyo and Annang
Provinces and Port Harcourt areas.
5. The River Plains and Deltas of the Niger and Lower Cross
River basin areas.11 (Figure 3, Map)
The climate here, like most of Nigeria, is controlled by the forces
of the Northeast and Southwest trade winds. The former is responsible
for the dry season and the latter the rainy season. The mean annual
temperature is around 80° F and the mean rainfall annually is over 200
m.m., graduated in intensity north to south with the coastal areas having
10Karmon, Yehuda. A Geography of Settlement in Eastern Nigeria.
Jerusalem, 1966, p. 8.
11Classified by Karmon, Yehuda, pp. cit., see also Oduah, 8.0.
Geoggaphy of the Eastern Provinces of Nigeria, Cambridge University,
1966, p. 136.

MAIN
PHYSIOGRAPHIC
/y.-.‘
REGIONSOFSOUTH-
1"
II
a,.....I
’{
I’
a,
\/
.
EASTERN
NIGERIA
{‘I
r\
J\
\-__..¢O"-~‘
A
PLATEAU e E50AR?“
029
J!
\
\
\
’I
a}
II
a'"
«5 I
ll
K‘9
[I
904
nI
STAL
\\
VPLA
IN
~‘s‘,
[’0‘
\_
\\
‘Colabor
N
l’
J\_--~
Port
\.‘
-o
.°
\oHarcourt
\1;}..-
.
\.‘-.
DELTA
‘s\
’/
.3
‘’
In".
9W-
.59
14

15
the heaviest.12 The drainage system can be classified into three:
1. The Niger River and Delta system.
2. The Cross River system.
3. The independent streams.
The Cross River rises in the Cameroon Mountains and flows north-
west until it meets the Anyim River. There it turns southwest toward
the Enyong Creek from where it flows southeast to the sea, some thirty-
five miles from the port city of Calabar. The Cross River plain is well
watered and bordered by the very rich agricultural lands of the entire
southeastern Nigeria. The area covers Ikom, Obubra, Akamkpa, Itu,
Calabar and Oran Divisions and are close in proximity to such divisions
as Abakaliki, Afikpo and Beads in East Central State as well as Uyo
and Ikot Kepene Divisions of the present South Eastern State. The
Cross River thus forms the major drainage system of the eastern part of
the South Eastern Nigeria. Udo13 noted that
"The Cross River has been the main connecting unit
between this region and the outside world. The slave
traders, the missionaries and later the political
agents of the British Government reached the region
by way of the Cross River."
The major question now is: What factors made the Cross River such
a major transportation and communications artery to so vast an area
covering the borders of Western Cameroon to the Igbo areas of Abakaliki,
Afikpo and Beads Divisions as well as the Ogoja-Obudu down to Calabar
12Meteorological Report, Enugu, 1964.
13Udo, Reuben K. "The Cross River District of Eastern Nigeria,"
Journal of Tropical Geography, 2p. cit.

16
Division? What were the relationships of this river waterway and its
ports to the internal and external commercial activities of these
areas? To understand the importance of the Cross River waterway and
its parts in the context of Nigeria's early commerce is to analyze
these factors which gave rise to the importance of this river way.
Location Factors.-The major reason for the most immediate
importance of the Cross River and its inland and ocean parts was
locational.14 Most of the early European trade with Nigerian natives
was concentrated at river port entrances linking the hinterlands with
the ocean. In Nigeria, apart from the Niger Delta and the Lagos Lagoon,
the other major seaport connection with the hinterland by the waterway
to the sea was Calabar on the Cross River. Initially, early shipping
trade with the Nigerian natives was at the coastal towns and ports
which acted as intermediaries between the European traders and the
inland natives who invariably produced the major articles of trade.
The strategic location of the Cross River within the rich areas
producing the trade cargoes made the river a major highway. From
Calabar up to_Itu (50 miles up the river) a large inland market for
food, oil palm and kernels and salves (during the slave days) had
developed. At this confluence of the Cross River and Enyong Creek-the
meeting point of the peoples of Umon, Afikpo, Ibibio and Efiks of Enyong
Creek-~a large market for all types of local commodities as well as
imported goods had developed at Okopedi and the water side. Further up
the Cross River, some 105 miles from Calabar, are the adjacent towns of
1l'Udo, Reuben K. and Ogundana, Babafemi, pp, cit.

l7
PORTS OF THE CROSS RIVER
Abakaliki.
Obubra
.Emuramura
Umon0
”WWW ©CALABAR
u, Oku lboku J
"‘90 '\w\anlba l
“he... _
o
"s
__
[avg/2x 0f s/afr'a
2
Nil. 25
Mature!

18
Afikpo, Ediba and Itigidi, which became river ports on their own
right for the movement of produce from the hinterland peoples.
I Obubra, 136 miles from Calabar is the natural port of that area,
covering Ogada, Ofombunga, Ofunatam, Awakande and areas near Apiapum.
These are rich agricultural areas noted for their yams and cocoyams.
Ikom.and Mamie, 44 and 128 miles, respectively, from Obubra are ports
covering the large rich districts of Ikom, Nsofang and the Western
Cameroon borders. Details of the peoples and life style there was
15 Thus the locational advantages enjoyed by thesketched by Patridge.
Cross River and its inland and ocean ports are relative to the rich
borderlands and the products for which it offered means of transportation
for trade purposes (see Figure 4, Map)-
Physical Advantaggg,--At a time when there were no roads nor rail
lines, the Cross River offered natural advantages for transportation
purposes. Dugout wooden canoes, rafts and later launches made travelling
and the carriage of commodities easy. The river is navigable all the
year round to Itu, only navigable between May and November between Itu
and Afkipo and up to Ikom between June and October, whereas traffic to
16 Details of theMamfe is only possible between July and October.
physical characteristics of the waterway and traffic possibilities are
outlined in Table l.
15Charles Patridge. The Cross River Natives. Hutchinson and Co.,
London, 1905.
16Netherlands Engineering Consultants. Development of the Ports
of Nigeria 1970-1990, The Hague, 1971, pp. 10-11.

19
Table 1. Cross River Transportation Information.
Ports Distance Maximum Navigable Maximum
From. Depth at Periods Dimension
Calabar High Water of Convoys
(Miles) (Feet) (Feet)
Calabar 0 25-30 All year No limit
Oku Iboku 39 20—25 All year 650 x 75
Itu 50 15-20 May-Nov. 650 x 75
Afikpo 103 25 May-Oct. 450 x 65
Ediba 105 30 May-Oct. 450 x 65
Itighidi 105 30 May-Oct. 450 x 65
Obubra 136 30 June-Oct. 250 x 65
Ikom 183 35 June-Oct. 250 x 65
Mamfe 264 35 June-Oct. 250 x 65 Source: NEDECO, pp. V, 10-11, 1971.
Initially, traffic was based on canoes for which depth of water
was no serious hinderance and traffic was undisturbed all the year round
between the upper country and the coastal areas of the Cross River.
Even the early European traders had boats which were by modern standards
small, but since they were restricted to the coastal areas while the
middle men alone penetrated the hinterlands, the traffic was never
disturbed by physical factors except hostilities which arose from
intertribal and inter-community conflicts on the river way.
The Cross River has one major advantage again in respect of its
land borders and types of soil. The flood plains have low silting rate
and, but for this, the absence of artificial channel clearance would
have led to the closure of the waterway altogether. The only problem
between Oku-Iboku and Itu is the tidal flow and ebb on which navigators
20
must depend to regulate their transportation. The mangrove swamps
around the Calabar river area simply do not extend to the upper reaches
of the river and hence the problems of dredging are not so acutely felt.
The solid land by the waterways assisted the development of landing
stages and river ports as well as inland markets for collecting and
distribution of goods down to Calabar or the hinterlands.
The seaward approaches into Calabar and hence the hinterlands
through the Cross River had been most favorable for the trade of the
area. The navigation channel to Calabar has a length of about 42
miles marked with buoys and beacons. Silting here is indeed minimal
since "dredging has never been carried out and the channel profile
d."17 Thisseems to change only little as far as the depth is concerne
compares with parts like Lagos and Port Harcourt where very costly
dredging is annually maintained.18 Thus, from the seaward approach
and the landward approach the Cross River offered a unique waterway
for transportation purposes. It is well located by rich and productive
hinterlands. It is mostly navigable for most parts of its course, and
that for most months of the year. Inside the river course are good
inland ports acting as collecting and distribution centers for exports
and imports of the area.
Pre-Colonial Inland Trade
The peoples who lived around and on the borders of the Cross River
basin had been holding some commercial intercourse before the coming of
“nausea, J. cit., p. 1—19.
18Nigerian Ports Authority Annual Reports 1958-1959 and 1969-1970.

21
the Europeans and colonialism to that part of the world. Even though
the picture painted by early European reporters and writers about the
Cross River area was one of "primitive" and "savage" headhunters, very
reliable evidence indicated that the Europeans met well-ordered societies
19 It would appear thatwith laws and cultures distinctly their own.
as a result of soil types, characteristics of the peoples and their
orientations, different localities specialized in certain economic
activities and trade naturally arose among the different ethnic
groups or clans.
The Igbos around Aro-Chuku were famed for their Long Juju as an
oracle and fertility spirit.20 To the west of the Cross River were
the Ibibios--the home of the palm oil and palm kernel which became the
greatest article of external trade after the slave trade abolition.21
The riverurine peoples specialized in fishing and salt making from the
salt water of the coastal swamps. The bulk of the yams are produced
around Afikpo, Obubra, Ugep, Ikom and Abakaliki and Ogoja where
rice is richly produced.
Canoe traffic on the Cross River assisted the exchange of products
from each area. Indeed, the yams from Obubra and Afikpo were exchanged
with palm oil at Itu, Oku Iboku, Ifianyong and Ikpa markets as well as
19Ekundare, R. Olufemi. An Economic History of Nigeria 1860-1960.
Africans Publishing Co., New York 1973, pp. 37-38.
20Daryll Fords and G. I. Jones. The Ibo and Ibibio-Speakigg
Peoples of South Eastern Nigeria, London 1962, p. 52. See also Dike,
2p, cit., pp. 37-41.
21Anne Martin. The Oil Palm Economy of the Ibibio Farmer,
(Ibadan, 1956).

22
to the down river settlements around Calabar. In return shrimps, fish,
salt and prawn were sent inland where petty traders helped to distribute
them farther inland. 22
Indeed, during the 19th century, a pattern seems to develop
whereby particular places specialized in the production of certain
durable items. Pottery was made in Afikpo,23 canoes were constructed
at Emuramura,24 raffia cloth at Ikot Ekpene and metal work by itinerant
blacksmiths, mostly Ibibios and Igbos.25 To the east of the Cross
River the people--the Ejaghams lived mostly by themselves and appeared
to be self sufficient.26
The Pre-Colonial International Trade
European adventurers reached west Africa in the middle of the 15th
century. Contact with Africa were mostly with the coastal settlers
who thereafter acted as middlemen between the Europeans and the hinter-
land African people. According to Dike27 trade fluctuated with European
policies and demands such that while gold was the main quest between
the 15th and 16th centuries, slave trade predominated during the 17th
22Fords and Jones, pp. cit., p. 81.
23$. and P. Ottenberg. "Afikpo Markets" in P. Bohannan and G.
Dalton (ed.), Markets in Africa, Northwestern University Press, Evanston,
1962, p. 121.
24Revd. H. Goldie, Calabar and Its Mission, Edinburgh and London,
1901, p. 340.
25Jones, Trading;States, p. 13, Waddel, Journal, Vol. 8, p. 77,
March 22, 1851.
. 26Latham, A. J. H., Old Calabar 1600-1891, Clarendon Press, Oxford
1973, p. 7.
27Dike, K. 0. Trade and Politics in Niger Delta, Oxford 1956, p. 1.

23
and 18th centuries. Calabar on the estuary of the Cross River was one
of the many coastal markets where the wares of the hinterlands and the
Europeans were traded through the coastal middlemen. Apparently,
there is no accurate record of when the first European trade came to the
port city of Calabar, and hence the Cross River.28 What is known is
that the first European traders to those parts were the Portuguese whom
the natives called "Boriki."29
Slave Trade.--Among the first and documented articles of trade
from Calabar port and indeed from the Cross River area were slaves,
taken to West Indian Islands by 1668.30 Calabar became a major West
African slave market thereafter while the Cross River became the major
highway for this nefarious trade. Sub-markets up the Cross River were
established at Itu, Afikpo, Obubra, Abakaliki, Ikom and Ogoja areas
where the middlemen bought slaves for onward shipment through the
Cross River to Calabar.
According to Latham the number of slaves handled at Calabar
through the Cross River route averaged annually over 2,000 between
1752 and 1799 (Table 2). These estimates were made from different
sources and must include some undercounting. Moreover, these estimates
do not include those shipped away by other European traders or other
British traders not based in Liverpool. Whatever the case, the figures
28Latham, A. J. H. _p. cit., p. 17.
291:. N. Amaku. Edikot Nwed Mbuk, Vol. II.
30Latham quotes John Watts, an English sailor, who reported
in that year of entering Cross River with their ship to take on
slave cargo, _p. cit., p. 17.

24
indicate that Calabar and, for that matter, the Cross River area were
major slave markets.
Table 2. Slaves Exported
from Calabar in
Liverpool Ships
Year Ships Slaves
1752 8 3,130
1771 11 3,250
1784 11 4,200
1785 8 31,50
1786 13 5,150
1787 7 2,360
1798 6 2,473
1799 6 2,275
During the two hundred years that the Calabar people were selling
slaves to the European slave dealers how were they able to obtain the
slaves? According to Latham31
the development of a powerful internal
marketing system which was able to channel slaves from the hinterlands
to the coast originated from the Aro Long Juju.32 Situated at Aro Chuku
in Bende Division of what is now the East Central State, the oracle was
used by the priests for judgments in matters of some disputes. Fees
and fines were exacted in slaves believed to have been devoured by the
oracle. The slaves were hidden and later sold.
31
Latham, _p. cit., p. 37.
32
1939, pp. 100-103.
From those points they
G. I. Jones. "Who Are the Ara?" Nigerian Field, Vol. 8, No. 3,

25
were taken to the slave markets and sold to dealers who delivered them
to Calabar merchants. Where the Long Juju was not the origin, inter-
tribal wars and raids provided victims--(war prisoners) for sale to
the slave dealers in the hinterland.
When, however, slave trade was officially abolished by the Act
of Westminister of 1807, it required the British naval patrols and
forces to effect compliance. In most cases, as in Calabar, cash rewards
were needed to persuade slave merchants to give up the trade. The sum
of 2,000 Spanish dollars33 was paid annually for five years to Calabar
chiefs to persuade them to enter into a treaty in 1841 in order to put
an end to the nefarious trade.
The Rise of Legipimate Trade
The vacuum created by the abolition of slave trade was filled by
what came to be "legitimate" trade. Local exports of palm oil and
kernel, monkeys, ivory, elephant tusks, camwood and other dyes as well
as other commodities were exchanged for European textile cloths,
spinets, and household furniture. Aye34 even noted that some of the
ships' captains exported yams to England--l,000 yams were sold to
Captain Savage, 6,000 to Captain Hughes. But, of all the export goods,
palm oil, according to Dike,3S was the one factor in the trade expansion
between Nigeria and Europe by the 18603.
33Latham,'_p. cit., p. 22, valued at £416 133 4d per year.
34E. U. Aye, pp. cit.
35Dike, Kenneth 0., _p. cit.

26
Palm Oil.--By the 18508, Liverpool merchants were important oil
traders in Old Calabar and Latham36 holds that James Penny and Jonas
Bold were the first Liverpool firms to trade in palm oil at Calabar
and the Cross River area. The Calabar traders were the middlemen who
controlled trade on the Cross River from the interior and cited as the
go-between for the European traders on the one side and export producers
of the interior on the other. Udo and Ogundana37 noted that,
". . .in the early days of shipping along the Nigerian
Coast (that is beginning from the period of the slave
trade) and indeed up to the end of the nineteenth century
local kins like Peppel of Bonny, Jaja of Opobo and Eyo
Honesty of Calabar held jurisdiction over the waters
within their kingdoms. European vessels could only trade
in such areas with the permission of the local overlord
and even then the trade was confined to the coast towns."
The restictions placed on the areas of trade of the European
traders forced them to house their wares on board their boats anchored
outside the wharf. The European merchants lived and slept on these
floating warehouses later called the supercargoes.38 For want of capital
to handle the expanding trade, the Calabar middlemen could not cape with
such demands. A system was then developed by the European traders by
which the European traders trusted the local traders with a considerable
amount of goods in exchange for an equivalent value of slaves or palm
36Latham,_o_p. cit., p. 56.
37Udo, Reuben K. and Ogundana, B. "Factors Influencing the
Fortunes of Ports in the Niger Delta," _p. cit., p. 173.
38Dike, pp, cit., pp. 88-89; Latham, pp. cit., p. 58.

27
oil to be delivered by a specified date.39 The goods in trust might
consist of gunpowder, cloth, iron goods, utensils and alcohol in
various forms.
Nair4O noted that the profit made by the Calabar middlemen and
the Europeans were "scandalously high." Europeans inflated prices
and exaggerated the values of goods they handed to the Calabar middlemen.
The Calabar middlemen, on the other hand, paid ridiculously low
prices in the hinterland markets even though they sold the European
wares at higher prices. Trade thus benefitted the European traders
and the Calabar middlemen at the expense of the interior producer
and consumer. These types of profits helped to promote the trade
all the more.
Latham noted that in quantity terms, Old Calabar exported 700-800
tons of oil per annum in the last years of the legitimate slave trade.41
From the calculations of Latham the contribution to the oil export
through Calabar are sketched out in Table 3. At the same time, the
West African total exports of oil are calculated by both Lathaml'2
and.Ekundare43and are shown along in Table 3. Apparently some reliable
records were kept for Calabar for most of the years which may be
absent from the West African trading area. What is important, however, is
39Kannen, K. Nair. Politics and Society in South Eastern
Nigeria 1941-1906, Frank Cass, London, 1972, p. 22.
40 . cit., p. 22.L?
41 . cit., pp. 65-66.E
42
L?
. cit.
43 cit., p. 51.l?

28
that the Cross River continued to be a large trading area both in
the slave trade as well as in the palm oil trading days.
Table 3. Exports of Palm Oil to United
Kingdom (Selected Years).
Year From Wgst From Wgst From 01g
Africa Africa Calabar
(cwt) (tons) (tons)
1821 n.a. 5,124 2,000
1828 n.a. 6,328 2,000
1833 266,990 13,345 5,000
1847 469,348 23,467 5,217
1848 499,719 24,986 4,634
1849 475,364 23,768 2,782
1850 434,450 21,722 4,260
1851 n.a. 29,224 2,838
1855 n.a. n.a. 4,090
1864 n.a. n.a. 4,500
1871 n.a. n.a. 6,000
1875 n.a. n.a. 5,085
1883 n.a. n.a. 7,365
1887 n.a. n.a. 7,000
aEkundare
bLatham
cLatham
The strategic position of the port of Calabar and the Cross River
waterway in these trades cannot be overemphasized. Not only did the
waterway make traffic easier, but large inland markets--Oku Iboku, Itu,
Umon, Afikpo, Itighidi, Obubra, Ikom, Nsofang and Mamfe up the Cross
River made the collection and delivering of both internal trade

29
commodites as well as export and import articles possible. Without
this waterway in the era when there were no motor roads or rail systems,
such elaborate trade systems would have been almost impossible.
Colonial Trade
European trade in the Cross River and, indeed, throughout West
Africa, was characterized by international competition and excessive
rivalries. The British government's interest in the trade is revealed
by the complaints made by their nationals against the Portuguese, the
French and the Dutch. Most of the British firms were chartered to
carry out such trade and British protection was always available in
case of need. The suppression of slave trade exercises led to consular
appointments to supervise the areas and make them safe for legitimate
trade. One of such appointed for the Bight of Biafra was stationed at
Fernando Po. When the treaties of friendships signed with different
coastal chiefs degenerated into treaties of protection, the coastal
areas became protectorate of the British Crown.44
By 1899 British government withdrew the charter granted to the
Royal Niger Company to administer and trade in Northern Nigeria since
1886. By proclaiming Northern Nigeria a protectorate in 1900, formal
British rule was instituted. The Oil Rivers and Lagos were unified in
1906 as the colony and Protectorate of Nigeria. The complete unification
of both North and South into a single nation of Nigeria was accomplished
in 1914. Some developments in transportation included the institution
44Sir Alan Burns, History of Nigeria.

30
of government marine services in 1905 for Cross River where three motor
launches were used in the services. Railroads were built between Enugu
and Port Harcourt between 1913 and 1920. Government withdrew from
most of the inland water marine services and "transferred to Elder
Dempster Lines the services on the Cross River between Itu and Ikom.
These services were used by the company during high water, but the
government retained control during the low water season."45
In terms of commerical activities, most British firms established
at Calabar and maintained trading depots on the main inland markets up
the Cross River between 1885 and 1940. As Latham noted, the "establish-
ment of European trading stations at the main stations" up the Cross
River tended to weaken the position of the Calabar middlemen. On the
other hand, it enhanced the production and wealth of the people up the
Cross River areas. Initially European traders were not allowed to
build on Calabar soil. But after the constitution of the Mission Station
at Calabar, traders established their factors on the waterfront of
Calabar. Such names as "Matilda," "Southsea," "Ivy," and "Millerio"
are reminders of those hulks on the river.46
The erection of the Consulate and government departments--the
Police, Judiciary and Administration--around the turn of the last
century helped most foreign firms to establish on Calabar soil as well
47as on the inland markets on the Cross River. Nair noted that even
45Ekundare,pp_. cit., p. 133.
46Aye, E. U., pp, cit., p. 138.
471b1d., p. 240.

31
with the absence of specific figures on the Cross River trade, the
general trend of the national trade and that of the Oil Rivers in
18803 and 18903 went together. Indeed, H. H. Johnston who went to
Calabar about 1886 noted that,
"Old Calabar in those times was sufficiently prosperous
and the firms trading there sufficiently enlightened
not only to maintain for their employees well built,
bright, well furnished, but to support a first class
doctor, who rose in time to be Principal Medical Officer
of the Protectorate."48
At this point in time, the British government's policy was
directed at stopping the French and German expansion into their trading
areas. Where peaceful penetrations were not possible due to native
resistance, punitive expeditions were conducted to extend British
trading interests.49 To protect the trade, military posts were
established at Unwana, Obubra, Obukun, Ediba and Aro Chuku in Bende
Division. The Calabar monopoly of the Cross River trade was reduced by
the introduction of silver coins, the regular shipping up and down the
Cross River, the entry of new competitors on the area trade and the
introduction of stated prices on commodities. These advantages led the
European firms to establish upstream.
The firms of George Miller Brothers, G. B. Ollivant, the African
Association, etc. built up trading stations at Oku Iboku, Itu, Umon,
48Quoted in Nair, pp. cit., p. 240.
49Nair, _p, cit., note the Aro Expedition of 1901-1902 as examples.

32
Ediba, Obubra, Ikom.and Mamfe. Traffic on the Cross River continued to
be of interest to both the United Africa Company and John Holt whose
trading depots maintained the buying of export craps into the early
19503. Apart from the British, the French and Levantine firms traded
on the Cross River and made the waterway a very busy route indeed.
Despite the opening of the Port Harcourt-Enugu railroad in 1916,
trade on the Cross River to Calabar port continued to be significant.
For example, ocean shipping between 1912 and 1933 showed the following
distributions in respect of export tons (Table 4). Calabar, Burutu
and, to an extent, Degema were the only ports which showed consistent
growth over those years. And, since Calabar export trade depended on
the Cross River route for all its external export commodities, the
Cross River trade mu3t have been important. Notice should be taken
again that the difference by 1932 and 1933 between what Port Harcourt
and Calabar handled respetively showed very slight difference inspite
of the heavy dependence by design of Port Harcourt on the Northern
Nigeria produce.
Table 4. Total Tonnage Handled at Various Selected Nigerian Parts (000).
Year Sapele Koko warri Burutu PH Calabar Degema
1912 22 40 61 117 --- 89 22
1913 25 46 48 137 --- 86 27
1914 20 31 45 135 --- 73 25
1932 45 29 70 141 129 103 48
1933 33 21 65 170 111 108 50 Source: Trade Statistical Abstract, Lagos, Nigeria.

33
Thus, the Cross River waterway not only helped to unify the
spatially far flung areas around the Cross River, it also made the
transportation of bulky export produce possible. This makes for a
cheaper mode of transportation and given technological advantages of
barges and lighterage services, it became possible for the agricultural
products of the hinterlands of the Cross River area to enter internal
and international trade at a time when roads and rails were not available.
D 50For details of the economic advantages of inland waterways see
Ton Edward Bierman. "The chtion of the Oder River as an Artery of
ra1'18poration,"Ph. D. Thesis, Michigan State University, 1970.

CHAPTER III
THE DECLINE OF THE CROSS RIVER
AS A MAJOR COMMERCIAL HIGHWAY
For purposes of definition, the decline of the Cross River
commerical route must be distinguished from the decline of the commercial
role of the Calabar middlemen.51 At the same time, such a decline in
the commercial importance of the Cross River waterway must be linked
with the international trade importance of the port of Calabar for, as
history has shown, the glories of the Cross River trade route have been
always linked with the importance of Calabar port. This situation may
be linked to the economic fortunes of the Cross River basin and its
environs, since increased activities of the Cross River basin may, for
certain reasons, make the river waterway important.
The accounts of the decline in the commercial importance of
Calabar by most history writers have focused on the loss of trade by
Calabar middlemen. During the slave trade and the introduction of
legitimate trade period Calabar traders acted as middlemen between
European traders on the coast and producers and consumers in the
51Most writers about Calabar trade deal with the middlemen
functions of the Calabar people and their eventual decline. See
Aye, Dike, Latham and Nair on this matter.
34

35
hinterlands. Nair52 offered six reasons for the decline of that middle-
men role of Calabar traders. AyeS3 while acknowledging these factors
tended to blame the ruin of Calabar on such forces as exodus of Calabar
teachers elsewhere, witchcraft and other social qualities of the
Calabar peOple. Indeed, he is one of those who blame the ruins of
Calabar on political factors.
The decline of Calabar middlemen functions in local and inter-
national trade ought not imply the ruin of Calabar as a seaport. Aye54
rightly disagrees with the view that the decline of Calabar port is due
to its locational isolation. It was the "geographic position with its
"55 It isoverseas gateway that made it once commercially important.
meanwhile difficult to believe that the earlier locational advantage
had diminished over time.
Observers had agreed that Calabar seaport and the Cross River
waterway had declined. Latham,56 Nair,57 and Aye,58 among others, noted
52Kannan K. Nair, _p, pip., pp. 252-256. The reasons included
the introduction of silver coins to replace barter system, the opening
of hinterland to European traders, the introduction of barge service
up the Cross River by European trading firms, the licensing system
which later restricted Calabar traders to Calabar market and the
hostilities of German government at the Cameroon borders are among the
factors.
53Aye, E. U., _p, cit.
5['Aye, E. U., pp. cit.
SSIbid.
56Latham,pp. cit.
57Nair, K.K., pp. cit.
58Aye, E. U., pp, cit.

36
the commercial and political decadence of this port city and the
waterway it commands. Latham noted that "only a brief outline of the
decline in Old Calabar's importance can be indicated."59 Aye fully
describes the plight of the old city under the caption of "Bleak Days"
and the picture so painted is sorrowful. It only remains here to
sketch out some stages by which this waterway and its terminal port
declined.
Latham noted briefly that,
". . .until 1900, Old Calabar was headquarters of the
Niger Coast Protectorate, and then headquarters of the
Protectorate of Southern Nigeria, which followed.
Renamed Calabar in 1904, its future as an administrative
center was ruined by the amalgamation of Southern
Nigeria and Lagos in 1906--the latter becoming the new
seat of government."60
Nair stated that the most important factor with long term consequences
was the transport and communications factor.61 A tussel had developed
within the colonial government's decision process as to the possibility
of connecting the port of Calabar with the hinterlands by roads and rail
transport system. The railway line decision was the one big factor
leading to the neglect of Calabar. At this point it was decided to
connect the rail line from the Enugu coal mines to Port Harcourt rather
than to Calabar. Why was the decision so made and on what principles?
As Nair62 noted, "Calabar harbor was still superior to most others
at the beginning of the present century" and was described as the
59Ibid.
6oIbid., p. 149.
61Nair,pp. cit., p. 255.
62Ibid.

37
"finest port on the Bight of Biafra until the Lagos Bar was removed."
The Chief Secretary to the Government of Nigeria63 in his report, noted
of Calabar port,
". . .the approach to the river has no definite bar,
but a series of flats with a least depth in the seward
channel of 18 feet."
The same report noted also that,
". . .at one time the seat of the Government of Southern
Nigeria, Calabar has since lost much of its importance
as a center of the administration, though it still
retains all its activity from a commercial point of
view."64
It was the same report which stated that "in 1907, when dredging
operations were first started (in respect of Lagos port) the draught
limit for the port was 9 feet: today it is 21 feet while the depth
.T."65 This clearly showedof water on the bar is 24 feet L.W.O.S
the comparative superiority of Calabar over Lagos as a port. Even
when Port Harcourt is compared, the same report noted that Calabar
has a channel width of 4 miles below the part, but about half a mile
at the port area, whereas Port Harcourt had a channel width of 500-800
feet.
Quite a number of geographers have made it appear that the choice
of Port Harcourt was because of its deep water berthing and its connection
63The Nigeria Handbook, Government Printer, Lagos, 1924, p. 75.
6('The Nigeria Handbook, 1923, pp. cit.
65
Ibid,

38
with the heavily populated areas of the East Central State. Apparently,
however, nobody has had time to examine the dredging problems of the 41
mile channel between Port Harcourt and the sea. It is, however, on
record that while Port Harcourt channel had been kept open with
continuous costly dredging, Calabar channel had never once been
dredged.66 This must be why Nair noted on the decision to abandon
Calabar that "it could not have been Calabar as a port which discouraged
the railway builders."67
It was Aye, himself a Calabar man, who remarked that "Old Calabar
unlike Port Harcourt which was a European built town, was purely of
native origin."68 Port Harcourt, which was the chosen town, was built
with equipment transported from England to the Port of Calabar and
moved along the Cross River through Itu, Ikot Ekpene and Aba to the
town site. Cross River peoples--Efiks, Ibibios and the Anangs were
conscripted to carry the iron bars on their heads on foot to Port
Harcourt from Itu on the Cross River.69 Evidently because of the pains
taken by Mr. Harcourt in constructing the new town, the British
government was willing to reward his labor with port and railroad
development no matter what the cost turned out to be.
The decline of Calabar port and hence the Cross River waterway
is sketched by Aye7O thus:
66Nigerian Ports Authority Annual Reports 1959-60 and 1969-70 and
Inland Waterways Hydrographic Reports.
6792 cit,p. 260.
689p cit,p. 129.
69Recounted by some of the chiefs and elders in Itu and Uyo
Division.
70Aye, pp, cit.
39
"The thirties of this century may be described as a
period of stagnation, but not of general retrogression.
By the late forties Calabar had entered on a period
more critical than any since the disaster of the thirties
and although it emerged from its ordeal, it was hence-
forth quite definitely on the down grade."
This means that Calabar started its decline after the First World War
and the period 1920-1939 marked the period of stagnation. For at that
time, road construction was undertaken to such an extent that, as Nair
remarked,
". . .the trade that came from the district at the back
of the Enyong Creek near the new station of Ikot Ekpene
did not, as it should have done,71 come to Calabar but
went down to Eket, nganga and Bonny. In fact, this
factor was to make Ibibio land look outwards to Ikot
Ekpene, Aba and Onitsha as cultural and commerical
centers."72
The stagnation of Calabar port for trade purposes at this period
was more a function of all efforts to divert this unusual river traffic
to the newly created port at Port Harcourt. There was little to dis-
tinguish the port traffic of Calabar from Port Harcourt at this time
even though Calabar carried the bulk of the South Eastern trade traffic
before 1920-39.
The diversion at this time tended to place the traffic on the
Cross River and Calabar at a stable level. This is because, despite the
diversion of traffic to Port Harcourt, stations on the Cross River ports
71Ikot Ekpene is 21 miles by road from Itu and 71 miles from
Calabar while it is over 100 miles from Bonny.
72Nair,pp. cit., p. 260.


40
were still maintained and what was left naturally went to Calabar.
Over the years this level of traffic continued to move to Calabar via the
Cross River with little or no real variations (Table 5).
Table 5. Port Traffic in the 19308 (Selected Years and Parts) (000 tons).
Year Lagos Sapele Warri Burutu Calabar PH
1932 484 45 70 141 103 129
1933 448 33 65 170 .108 111 Source: Nigeria Trade Abstracts
Even though traffic on Port Harcourt and Calabar did not vary
substantially due to each port maintaining control of its immediate
hinterland traffic, Port Harcourt controlled exports and imports from
the Northern States as well as the Onitsha and Owerri provinces and the
Rivers area. Calabar thus continued as the natural outlet for the
export products of and imports for the Cross River basin. Naturally
those areas appeared to have been their natural zones of transport
control (see Figure l).
The war years between 1940-1945 and the immediate post war period
were to bring to Calabar more problems. This is the critical period in
which Aye describes the long downward move of the Cross River and
Calabar ports' commercial life. In particular the early 19503 saw
the increasing Nigerian responsiblity running the affairs of the country.
Prior to 1950 the Legislative Council depended on not elected but
appointed representatives of major communities for governmental purposes.
In 1951, the Nigerian Constitution had adopted the adult suffrage and

41
party politics. Seats to the National Parliament no more depended
on selected comunities but on the representation of all peoples of
the nation. The definite control of the different arms of government
by Nigerians on the basis of parties and interest created difficulties
for areas where differences of opinions existed.
As a result of the creation of the autonomous Nigerian Ports
Authority in 1954 to take care of Lagos and Port Harcourt, other parts
were seriously neglected. At the same time, four Commodity Marketing
Boards (Cocoa, Palm Produce, Groundnuts and Cotton) were created, but
were later replaced by "all purpose" Regional Marketing Boards in 1954.73
These boards were empowered to control the purchase, storage, evacuation
to ports, shipment and disposal in the world markets of the regions
controlled produce. The Regional boards decided the producer prices
for different stations and types of produce in the region. The boards
also advised their buying agents by which transport channels the produce
was to be transported and to which part outlets it was to be delivered.
Udo and Ogundana74 admit that these marketing boards maintained a
policy "to channel most of the traffic to the ports of Lagos and Port
Harcourt which are the best equipped" by the Ports Authority which
decided to neglect other ports.
Calabar port and, indeed, the Cross River waterway lost most of
its natural traffic by this device which had nothing to consider about
distances and costs from production centers to the sea. So, what
73R. K. Udo and B. Ogundana. ._p. cit., p. 181.
74Ibid.

42
natural traffic was left in the 19303 and 19403 did not substantially
increase due to the new political actions of the new marketing boards
of the 19503 (Table 6). Even before the takeover of such produce
buying and shipment by the Regional Marketing Boards, the British
firms--the United Africa Company and John Holt which dealt in these
produce marketing controlled the transportation routes for these
produce. The United Africa Company owned the port of Burutu and the
installations while John Holt owned Warri. These companies directed
their agents to their parts only and even influenced the import
hinterland by controlling the distribution of the foreign imported
goods for their customers.
Table 6. Shipments by Various Ports (Selected Years) (000 Tons).
Year Lagos Sapele Warri Burutu Calabar PH Degema
1942 1,273 71 63 144 110 380 63
1943 1,252 79 56 140 114 376 27
1952 1,727 162 52 103 148 507 74
1953 1,763 249 66 110 171 683 83
Source: Nigerian Trade Statistical Abstract.
Based on these factors, the trade on the Cross River and the port
of Calabar did not grow as it should, but continued to weaken in the
commercial importance. Thus, Weigand75 must be right when he concluded
that "human factors predominate in port geography,‘ since ports have
75Weigand, G. G. "Some Elements in the Study of Port Geography,"
Geographical Review, Vol. 48, 1958, p. 194.

43
been founded and have evolved despite physical obstacles when economic
and political expediency were of overriding importance. Little wonder
that the Nigerian government is prepared to maintain Lagos and Port
Harcourt and neglect Calabar despite the high costs of doing so.
Between 1955 and 1967 (the latter year marking the outbreak of
the Civil War in Nigeria) the Cross River ports and Calabar faced
complete decline commercially. The effects of the takeover of export
produce marketing by Regional Marketing Boards forced large companies
to withdraw from retail trade altogether. In particular, when the
Marketing Boards secured the legal rights to appoint licensed buying
agents, they refused to appoint these firms which themselves saw
opportunities for less profit levels than they had enjoyed before. On
this score the major firms found Calabar no more a profitable place
to operate and ceased operations. Their trading stations at Cross
River stations like Oku Iboku, Itu, Umon, Ediba, Apiapum, Obubra, Ikom
and Mamfe were closed down. The United Africa Company moved its
Eastern headquarters off Calabar and John Holt, Kings-way and a host
of other firms followed.
It was at this time that the government of the Eastern Region
embarked on road transportation development. The Premier76 had in
1955 just returned from economic missions overseas. What followed was
' a government sponsored series of developments in agriculture, industry,
77education and transportation. The pattern of development was such
76Azikiwe Namdi and Ojukwu, L. P. (later Sir Odumegwu, footnote 76).
Economic Mission to Europe and America, Government Printer (1955) Enugu.
7Eastern Nigeria Development Programme, Government Printer, Enugu,
1955-60 and 1962-68.

44
that the areas close to the Cross River and Old Ogoja and Calabar
provinces received little or no major shares. For example, the Cross
River basin was devoted to the position of raw material and agricultural
zone (see Table A.l in the Appendix). Road development was such that
they ran East-West across the Cross River rather than North-South to
Calabar. By 1964, not a single industry was sited at the Old Ogoja
and Calabar provinces. Health and educational amenities were rather
concentrated elsewhere than in this Cross River basin.
What followed was the exodus of commercial firms. With this
came economic depression. This is the period which Aye has described
as "Bleak Days" in his book. Because of reduced commercial activities
(Table A.4) unemployment set in. Poverty gripped the people and the
inevitable resort was migration to Aba, Port Harcourt, Umnahia, Enugu
and other ports of Nigeria. That area bordering the Cross River took
on the look of a ghost land. Except the numerous plantations and
estates developed in the available open lands (Tables A.2 and A.3a and
A.3b) the area fell completely out of the economic wheel. The whole
area became the producer of raw materials and food for the industries
and cities located outside the Cross River area.
To ensure that the water way would not be of any commercial
significance, the major roads linking these places of plantations and
estates ran east-west, thus isolating the Cross River waterway and its
ocean port, Calabar, more and more. All these roads never crossed the
Cross River by solid bridges, but by pontoons. Ikom, Ogoja and Obudu
were connected to Abakaliki and Enugu. Ediba and Itigidi were connected
by pontoon to Afikpo and Abakaliki to link Enugu or Umuahia. The
Western Calabar district was linked by a pontoon road to Ikot-Okpora,
45
Arochuku and Umuahia. No efforts were made to link Itu to Calabar,
nor was it deemed necessary to link Calabar with roads to Ikom, Obubra,
Umon and even Ediba. Even when it was found to be shorter to transport
produce via Calabar it still became necessary to ensure their shipment
at Port Harcourt.
The overall efforts of all these were to depress the area, cause
out-migration of its people, retard progress and reduce the area to one
of ghost estates. Except for the numerous plantations which employed
more people from outside the Cross River basin area than the natives
of the area,77 nothing of any economic importance in terms of modern
industrialization, health and education, transportation catering for
the general well-being of the people were done for the area. Thus what
started out in 1905 as mere choice of another seaport by the government
apparently turned out to set the path for economic neglect and general
depression of the Cross River commerce and industry by successive
governments.
77ENDC Progress Report, 1955-63.

CHAPTER IV
FACTORS RESPONSIBLE FOR THE COMMERCIAL
DECLINE OF THE CROSS RIVER WATERWAY
In the previous chapters of this study, the historical developments
in the rise and decline of the Cross River waterway had been traced. The
climax was reached during the decade preceding the Nigerian Civil War
of 1967-70. During that period, both the Cross River inland ports,
trading stations and the ocean terminal port of Calabar had become
ghost areas. In this chapter efforts will be made to understand the
real factors-~economic, geographical, political and social--which
caused the ruin of the area. A number of hypotheses will be tested
and some literature opinions examined here.
The first hypothesis is that the advantages--locational, site and
physical characteristics as well as proximity to the rich productive
hinterlands which hitherto made the Cross River commercially important
are no more prevailingpand hence the decline of the waterway and the
§£2é°78
The Cross River waterway became prominent in internal and inter-
national commerce because of its locational advantages--proximity to
rich hinterlands, all season ocean port, physical characteristics conducive
to transportation development and the attitude to economic activities of
78See Hypotheses--Chapter I.
46

47
its diverse peoples. Most writers have tended to blame the decline of
this region only on the rise of Port Harcourt as a seaport and a rail-
79 This claim can be partly refuted from two major grounds.way terminal.
Firstly, the sources of traffic on the Cross River to Calabar differ
from the source of traffic to Port Harcourt on the Bonny seaway.
Secondly, this refutation can be best tested by considering the natural
physical advantages of both areas.
Writing on "port location and port spatial competition" of most
Nigerian ports, Ogundana80 noted the potential area of influence of
Calabar port to be significantly different from that of Port Harcourt
(see Figure 5). The distance advantage of the Cross River and Calabar
port from Port Harcourt is such that the Cross River could naturally
have continued to draw its traffic from its area of influence without
hinderance from Port Harcourt, rail line or no rail lines. In fact,
Ogundana noted:81
"In eastern Nigeria, it is found that as much of the
area is nearer to Calabar as to Port Harcourt. If each
unit area had a given constant traffic potential, the
possible traffic generation of Calabar's proximal area
would thus be as large as that of Port Harcourt."
Even when the concentric circles of the diagram are taken as the guide,
Calabar still has a superior sphere of influence than Port Harcourt.
79Aye (1967), Nair (1972), Latham (1973), Ogundana (1966).
80"The Location Factor in Changing Seaport Significance in Nigeria,’
Nigerian Geoggaphical Journal, 1966.
81Ogundana,.pp. cit.

EQUIDISTANT
LOCI
—Logos
and
Sapele
—-
Port
Harcourtand
Calabar
Figures
give
distance
from
parts
inmiles
0Mi.
1I
|O_O
PROXIMAL
LOCATION
OF
PORTS
INSOUTHERN
NIGERIA
I40
20
\
oSAPELE
r‘
PI—-\
HeRCOURT
48

49
Indeed, Port Harcourt was intended for services to the Northern States
and parts of the East Central State. Calabar port and the Cross River
serve the natural areas of the Cross River basin.
The question is, have the locational advantages of Calabar port
diminished over the years? The answer is in the negative. Unfortunately,
Ogundana noted:82
"In relation to northern Nigeria, if Calabar is consid-
ered as a possible outlet for northern Nigeria, its area
of distance advantage is much smaller than that of Lagos."
This type of statement does not agree with the findings of the
Netherlands Engineering Consultants, appointed to study port developments
in Nigeria, which concluded that:
"The.extension to the North of Calabar's hinterland
(which is only served by road) would appear to be a
most logical development."83
It also added that:
"For Makurdi and all Northern regions, the Makurdi-
Calabar line provides a reduction in railway distance
to the sea of 25.5 miles compared with Port Harcourt.
For Kaduna and the areas to the North of it, the planned
lines also result in a shorter railway distance of
17.5 miles compared with Lagos."34
82Ogundana, op. cit., p. 82.
83NEDECO, Developments of the Ports of Nigeria, 1970-1990,
The Hague, 1971, p. 57.
84Loc. cit., p. 58.
SO
Evidently, the problem is not a function of the locational disadvantages
of Calabar port or the Cross River waterway. Rather it is a function
of the port continuing to "function in its natural situation without
technological improvement"85 when its "competitors were selected as
"86 Since fortunesfoci of transport improvements in Southern Nigeria.
of the Cross River are inextricably bound with Calabar, the fall of one
must be the fall of the other. In the context of this study, the
locational advantage of the area is not impaired by time or space
whatsoever.
Another advantage of the Cross River and its ocean terminal port
was its proximity to rich hinterlands. The major question here is
whether these proximities to rich hinterlands advantages had diminished
over time. The main occuaptions of the Cross River basin and environs
had been mostly production of agricultural and forest products. Except
for the 17th-19th century slave trade, the popular trade commodities
of the area had been agricultural products. Palm oil, and kernels, rubber,
timber, cocoa and piassava had always been sold to European traders.
Have these been reduced in quantity over time? The current information
does not seem to indicate that.
Initially, these products came from wild and uncultivated planta-
tions. Over time, both private individuals and firms, as well as
governments, have opened up plantations of cocoa, oil palms, rubber and
also increased forest reserves (see Tables A.l, A.2, A.3a and A.3b). No
less than a total of 3,000,000 acres had been devoted to plantation
85Ogundana, 92. cit .
86Ibid.
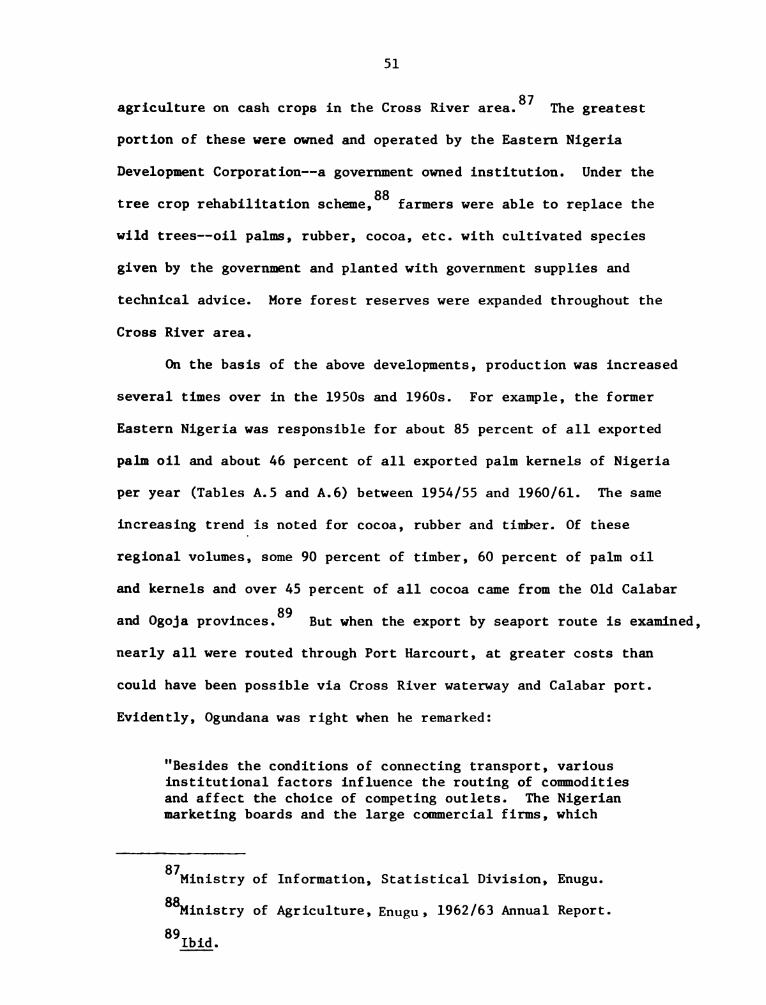
51
agriculture on cash crops in the Cross River area.87 The greatest
portion of these were owned and operated by the Eastern Nigeria
Development Corporation-~a government owned institution. Under the
tree crop rehabilitation scheme,88 farmers were able to replace the
wild trees--oil palms, rubber, cocoa, etc. with cultivated species
given by the government and planted with government supplies and
technical advice. More forest reserves were expanded throughout the
Cross River area.
On the basis of the above developments, production was increased
several times over in the 19503 and 19603. For example, the former
Eastern Nigeria was responsible for about 85 percent of all exported
palm oil and about 46 percent of all exported palm kernels of Nigeria
per year (Tables A.5 and A.6) between 1954/55 and 1960/61. The same
increasing trend is noted for cocoa, rubber and timber. Of these
regional volumes, some 90 percent of timber, 60 percent of palm oil
and kernels and over 45 percent of all cocoa came from the 01d Calabar
and Ogoja provinces.89 But when the export by seaport route is examined,
nearly all were routed through Port Harcourt, at greater costs than
could have been possible via Cross River waterway and Calabar port.
Evidently, Ogundana was right when he remarked:
"Besides the conditions of connecting transport, various
institutional factors influence the routing of commodities
and affect the choice of competing outlets. The Nigerian
marketing boards and the large commercial firms, which
7Ministry of Information, Statistical Division, Enugu.
88Ministry of Agriculture, Enugu, 1962/63 Annual Report.
89Ibid.

52
control a large proportion of the export and import
commodities, respectively, influence the routing
of these commodities."
To the question whether the proximity of the Cross River waterway
to the rich hinterlands have changed, the answer is in the negative.
In fact, if anything, production of the commodities on which the trade
depends had increased over time. Thus the issue is not changing
economic conditions of the surrounding areas to the riverway but the
directives which control the routing of these commodities to ports
outside their natural routing system.
Another major question here is whether the site and physical
characteristics of the Cross River waterway have worsened over the
years. By itself the distance in time between 1900 and 1960 is sub-
stantial. But when the Cross River waterway is compared with other
waterways, there must be a lot of difference. For with increased use
of land at the Upper Course of the Cross River, natural agents as is
the case in other rivers, have increased the deposition and building
of sand bars. The waterway, like other rivers, would have been kept
constantly open by dredging where it tends to be too narrow and shallow.
For example, dredging between Oku Iboku and Itu and Afikpo to Ediba
where sand bars are becoming powerful would have improved the greater
part of the waterway during the greater part of the year. Unfortunately,
while these hydrographic surveys and channel maintenance are carried
91out on other rivers, the Inland Waterways Departments had tended to
neglect the Cross River altogether.
90Ogundana, op, cit., p. 83.
91Inland Waterways Department, Annual Reports, Lagos (Various issues).

53
At Calabar port, the oceanward approach had demonstrated some of
the best features of low silting activities. By 1907 and even by 1923,
92the Nigeria Handbook had reported of Calabar port that:
"The approach to the river has no definite bar, but
a series of long flats with a least depth in the seaward
channel of 18 feet. At the entrance the river is about
11 miles wide but gradually narrows as one approaches the
Calabar Beach. Four miles below the limits of the port
where the width is reduced to half a mile."
The report noted also that the least depth of water is found on nearing
the anchorage off the town where on the Duke Town crossing one meets
with 15 feet L.W.0.S.T. Note was also taken that the rise of water
was 10 feet additional during spring and 8 feet at deep tide.
At the same time, the report93 showed that by 1907, when dredging
operations were first started at Lagos port, the draught limit for
Lagos port was 9 feet. By 1923, it was 21 feet as a result of the
dredging and the depth was 24 feet L.W.0.S.T. Dredging was required
to make Lagos port servicable. The same process was needed for Port
Harcourt to make for depths of between 12 feet and 20 feet L.W.0.S.T.
So once again, it was not the natural factors but the man-made decisions
which discriminated against the Cross River which led to the ruin
of the area.
Thirteen years after the 1923 report, Lagos would boast of draught
94limit of 25 feet. Port Harcourt could also be assured of 19 feet but
92Published by the Chief Secretary of the Government, Lagos, p. 75.
'93Nigeria Handbook (1923), p. 74.
94Nigeria Handbook, (1936).

54
Calabar had the least depth of 15 feet L.W.O.S.T. at the Duke Town
crossing. Twenty six years later (1959)95 Lagos and Port Harcourt, cared
for by the government corporation-—the Nigerian ports authority, improved
their minimum depths. The Lagos channel depths were:
Commodore and Pool Channels 27 Feet M.L.W.O.S.T.
Apapa Channel 27 Feet M.L.W.0.S.T.
Customs Channel 26 Feet M.L.W.0.S.T.
Port Harcourt had 21 feet M.L.W.0.S.T. Calabar, not under the control
and care of the Nigerian Ports authority had 13 feet M.L.W.O.S.T. at
Duke Town crossing.
In 1970, some sixty three years after the start of dredging at
Lagos and fifty-seven years after such operations at Port Harcourt, apart
from provisions of extra shipping amenities, Calabar had a maximum
recommended draught limit of 19 feet 6 inches of the channel and minimum
depth of 12 feet on Duke Town Crossing.96 At Lagos harbour the following
channel depths were announced:
Harbour Entrances 30 Feet
Commodore and Pool No. 2 Channel 27 Feet
Apapa Channel 27 Feet
Customs Channel 26 Feet
In short, between 1907 and 1970, Calabar port's minimum depth had
shrunk from the original 18 feet L.W.0.S.T. to 12 feet or what works out
as about 1 inch every year. On the other hand, the least depth of water
95Nigerian Ports Authority, Annual Report, 1958/59, Lagos.
96Nigerian Ports Authority, 1970.

55
in Lagos had expanded from 9 feet to 26 feet L.W.0.S.T. and for Port
Harcourt from 12 feet to 19 feet M.L.W.O.S.T.97
When the amount of cubical capacity of dredging materials98
removed from the water in respect of both Lagos and Port Harcourt are
weighed against the absence of dredging in Calabar or Cross River
channel, for that matter, one can easily see which of these ports have
had superior site and physical characteristics. Indeed, the site and
physical characteristics of the Cross River waterway and for Calabar
port have not diminished significantly over the years. What has created
the apparent superiority of Port Harcourt and Lagos over Calabar is the
human decision factor.
Another major aspect of the locational and pattern of inland
network system is the development of transport. When the seasonal
nature of transportation on the Cross River is accounted as a major
disadvantage (when compared with other traffic alternatives) it is
pertinent to see the land features of the Cross River basin in deter-
mining their suitability for development. Between 1957/58 and 1962/63,
the government of the former Eastern Nigeria spent over N2 million
yearly on road work (Table A.7). Of that much expenditure the mileage
of roads distributed throughout the region showed a complete bias against
the 01d Calabar and Ogoja provinces (Table A.8).
97Ibid., 1964.
98These capacities of dredging materials are reported in the
Annual Reports of the Nigerian Ports Authority. No details of costs
are, however, available. Some 1,433,600 cubic yards from Port Harcourt
in 1963/64. None was dredged in Calabar.

Z
-——-———
I
\
‘--—---_.--’\
’—
I
llorln
\~-———~’I
NIGERIA
TRANSPORTATION
9Mi.
IOO
---*
Railroads
Existing
trunkroads(A)
———-
Projected
trunkroads(A)
——————
Existing
trunkroads(8)
----
----
----
Projected
trunkroadsIB)
56

57
The Cross River area had 13 percent of the region's tarred Trunk
A road, 22 percent tarred Trunk B road, 100 percent of dirt roads (Trunk
A Gravel) and nearly 40 percent of Trunk B's despite its relative
smaller land area in the region (Table A.8). A careful examination
showed that the only roads were directed to the plantations on the Cross
River area and ran east-west to join the industrialized cities outside
the Cross River area and with direct connections to Port Harcourt.
Indeed, no efforts were made to run the roads north-south of the Cross
99 This raised the question of the topography of the CrossRiver basin.
River Basin and its suitability for road development connecting Calabar.
For many years nobody thought of this possibility. The important
consideration appeared to have been roads needed to transport export
products from the Cross River Basin to Port Harcourt. Crossing of the
Cross River at Ikot Okpora to Aro-Chunku and Umuahia (some forty miles
from.Calabar to Ikot Okpora) made that transportation distance too long
when Port Harcourt was the destination. The same is true of Itigidi,
Obubra, and Ikom pontoon crossings.
It was not until the creation of the South Eastern State within
the twelve-state structure of Nigeria that the north-south roads
connecting Calabar port with the Cross River Basin was completed. As
a result of these decision, the following roads are planned100 and
some are being built:
1. Ikom Calabar Road
2. Obubra Calabar Road
99Eastern Nigeria Development Plans 1955-60 and 1962-68, Enugu.
1001970-74 Development Plan.
58
3. Itu Calabar Road
4. Biase Calabar Road
5. Ogoja Ikom - Calabar Extension
Since most of these are within shorter distances from Calabar
port than from Port Harcourt, all-the—year round transportation system
may be expected to supplement the water transport which may be maintained
for most part of the year.
According to the present government of South Eastern Nigeria, the
Ministry of Information101 reported that:
"The Government, aware of the state's transport and
commercial problems, launched the South Eastern
State Coastal Transport Company (SESCOT) later renamed
Cross River Lines Limited, to counter these problems."
Under this scheme a fleet of boats was acquired by that company to
supplement the efforts of Elder Dempster Agencies in Calabar and the
major towns in the Northern Divisions are now served by SESCOT buses.
Why were these developments possible? The answer is because there was
a government based at Calabar which understood the needs of the area.
No physical impediments were possible to overcome the desire to serve
the area.
Another side of the possible change of inherent advantages which
helped the early development of the area was the attitude of the Cross
River people and their'neighbour towards economic activities and the
profit motive. In those periods, the peoples of the area were as
eager as ever before to pursue economic gains. They farmed more
101This is Nigeria's South East. Calabar, 1972, p. 49.

59
and produced more export crops though they seemed to receive less for
their labour (Table A.9). By 1960, the farmers of the Cross River
area were exporting their food stuffs to the Cameroons and Ferdando Po
where prices were better. The government of the former Eastern Nigeria
complained that such action was bound to increase the price of food in
the region and banned such export of food. Rather the farmers were
asked to produce more despite falling incomes. Indeed, they were to
produce more cheap food for the industrial workers of the other areas
of the region. When the incomes were not worth the labour, most of them,
especially the school leavers, migrated to the urban industrial towns,
like Onitsha, Aba, Enugu, and Port Harcourt.
At this perod, too, most if not all, of the industries were
located outside the Cross River region (see Table A.10). It is
believed it took foreign investors much time to convince the government
of the former Eastern Nigeria of the necessity to locate industries
in the Cross River area. The present Calabar Cement Company at Calabar
and the Calabar Veneer and Plywood Factory were established in 1964
and 1965, respectively, after much pressure from the foreign investors
and only because the industries were material-oriented.102 Despite
these problems, employees were mostly from outside the Cross River area
by deliberate government quota policy.
Thus to the question raised in the hypothesis whether the decline
of the Cross River waterway was due to the absence of those geographic
and locational advantages which hitherto helped that area to rise into
102Ministry of Information, South Eastern State, Calabar, 1972.

60
commercial prominence, the answer is that the hypothesis is not proved
true. In terms of port and waterway location in close proximity to
rich hinterlands, in terms of physical characteristics of the waterway,
the chances of developing good land transport and the attitude of the
peoples of the area to economically gainful activities, nothing had
naturally changed. The problems were imposed on the area by forces not
internal to their system. And most of these impositions were not
economical when alternative costs of using the Cross River waterway
and area are compared.
The next hypothesis is that the major problem of the Cross River
area——the economic and social decline of the waterway and the ocean
pgrt--were mainly due to political factors than geographic and normal
economic circumstances.
Latham writing of Calabar and its depressed state stated:
"During the forties and fifties, Calabar remained a back-
water, and the political wranglings of the post-inde-
pendence era of the sixties only made matters worse.
Because Calabar chose to back the Action Group103 rather
than the N.C.N.C.104 she was largely excluded from the
latter's economic policy."105
Aye went at length to recreate the story of the agitation of the people
of the Cross River area for a separate state of their own within the
103Political Party then in control of Western Nigeria.
104National Council of Nigeria and the Cameroons later National
Council of Nigerian Citizens when Western Cameroons joined Southern
Cameroon to form one nation instead of being in Nigeria. That party
controlled the Eastern Nigerian government.
105Latham,__p. cit., p. 150.
61
Federation of Nigeria. This was to be carved out of the former Eastern
Nigeria. According to Aye, the decline of Calabar was partly political
because "it supported the Action Group Party in 1957 and when the N.C.
N.C. was finally the governing party its development had to be ignored."106
His story of the separate state--the Calabar-Ogoja-River State-—agitation
is sufficiently detailed.107 It appears that with the declaration of
Independence in 1960, things were bound to be worse for the minority
areas.
Aye gave the graphic impression of what took place thus:
"The first five years of independence confirmed the fears
of the minorities and Calabar suffered greatly;this
had its supreme expression when the firms closed down
without any economic substitutes, with the consequent
unemployment and the speeding up of immigration of sub-
stantial number of the citizens."108
What Aye summed up above for the port city of Calabar was equally
true for all of the Cross River area. Itu, Oku Iboku, Umon, Obubra,
and even lkom--river ports and trading stations on the Cross River
became semi-ghost towns. Unemployment and immigration were part and
parcel of the situation.
The question is: taking the allegation about government's
economic sabotage of the Cross River basin by itself, were these events
106Aye,_p_. cit.
107Ibid., p. 176-180. The separate state was demanded so that
the minority peoples could run their affairs outside the control of
the former Eastern Nigerian government.
1”Ibid., p. 178.

62
due to political actions? To what extent can one isolate the political
from the pure economic and geographical factors? To understand and to
answer these searching questions, some details of governmental actions
between 1905 and 1967 must be diagnosed. Without going into too many
historical details, the general trend in governmental decisions and
actions must be analysed.
According to Nair109 the decision in 1905 by the colonial govern-
ment to connect the railroad to Port Harcourt instead of Calabar was more
political than economic. Walter Egerton, commenting on the recommenda-
tions of Sir Ralph Moore for a railroad to link Enugu to Calabar,
confessed that the turning down of the recommendation was a grevious
error since "the country behind Itu.was one of the richest in the pro-
tectorate and the bulk of its products rots on the ground owing to want
"110 Instead, Port Harcourt was chosen as the oceanof transport.
terminal of the rail line for the transporation of the coal trade from
the Udi, Enugu, and Iva mines.
A careful analysis has convinced most researchers in this area
that since Mr. Harcourt had already laboured so much to create what Aye111
termed a "European built town" as opposed to a "purely native town," he
had to be rewarded. .He had spent most of his time in this part of
South Eastern Nigeria and had created a model city. His recommendations
were considered weighty enough to the colonial government as to the
direction of the rail line to Port Harcourt as an ocean terminus.
109Nair, _p. cit., p. 259.
110
Egerton, 22, cit., p. 259.
111
Aye, 22, cit., p. 138.

63
Despite the contrary recommendations of Walter Egerton who was not an
engineer and city planner, government could not change its mind.
The same situation is noted in the removal of the capital of the
Southern Nigeria Protectorate from Calabar to Lagos. Lagos was a crown
colony ceded to the Crown by King Dosumu of Lagos in 1861, ten years
after the British bombardment of the place in the war with King Kosoko.112
Though many writers113 believe the making of Lagos the capital city had
something to do with the efforts to suppress slave trade, the more
plausible belief is that the government in London believed that the
colony of Lagos was a bona fide property purchased by the Crown. Hence,
the decision to remove the capital from Calabar to Lagos, and to develop
the seaport and connect it with the railine to the hinterland. If
these decisions were not political, it is difficult to accept what else
would have been. Thus, the removal of the administrative headquarters
from Calabar and the decision to refuse its connection by rail to the
hinterland had no basis in economics and geography. These were purely
political.
Whatever else was done by the colonial government to spite the Cross
River waterway was little compared withthe later and recent actions taken
by the recent Nigerian governments. In 1954, the Nigerian Ports Authority
was created to take care of the major port development throughout the
country. That public corporation singled out Lagos and Port Harcourt
for development. Between 1955 and 1960, the Nigerian government spent
112Burns, Sir Alan. History of Nigeria.
113J. F. Ade Ajayi; and Robert Smith. Yoruba Warfare in the Nine-
teenth Centu y. J. D. Fage, Slavery and Slave Trade.

64
114 15over N5,276,000 in respect of Lagos ports, N6,500,OOOl in reSpect
of Port Harcourt port and with additional expenses on waterway develOp-
ments for some midwestern areas, the total estimates stood at N20,428,OOO}l6
Not a penny of this went to the development of Calabar port of the
Cross River inland waterways.
During the 1962-68 Development Programme period,117 all funds
were committed to the development of Lagos and Apapa. Estimates were
made for inland waterways and port developments which stood at over
N51.l million. None of these once again went to the development of the
Cross River waterway or the Calabar port. One can compare this state
of affairs with the policy statements in the Development Bulletin which
states that, "The river and creek system of Nigeria provides a poten-
"118 Even withtially cheap and extensive network of communications.
this, the Cross River waterway had no part in that "Potentially cheap
and extensive network of communications." Since no reasons were given
for the neglect of a really rich area like the Cross River and since
these events were at a time that the Federal Government was controlled
by a coalition of one of the parties not supported in the Cross River
area, one has to examine the situation critically.
Within Eastern Nigeria itself, the actions of the government gave
the peoples of the Cross River area little consolation nor confidence.
The development of roads which ran east-west to support the transportation
114Ibid.
115Ibid.
1161bid.
117Federal Government Development Programme, 1962-68, p. 23.
113Ib1d., p. 18.

65
of produce from the numerous plantations to Port Harcourt was considered
nothing short of exploitation. For, despite the spread of the numerous
plantations in this area, social amenities were not developed. Of the
total of 238 secondary schools in Eastern Nigeria by 1965 (Table 7)
only 16 percent were in the Cross River area. Indeed, Ogoja and Obudu
divisions had only one each. The effect was that the parents who could
at all afford children's education had to send their children to such
schools outside their division and generally to urbanized areas outside
the Cross River area.
Table 7. Secondary Schools in Eastern Nigeria.
Area No. of Schools Percent
Calabar 5 2.1
Ogoja 4 1.7
Uyo 21 8.8
Annang 9 3.4
Cross River Area 39 16.4
Region 238 100.0 Source: Aye,_Jp. cit., p. 173.
When it is noticed that the bulk of the foreign exchange earners
the export crops are produced from the numerous plantations opened in
the Cross River area (Tables A.1 and A.2), and forest reserves (Tables
A.3a and A.3b), one can understand the anxiety of the people there on the
question of allocation and siting of industries. By 1963, not one
industry was sited in the Cross River area (Table A.10). In fact, some
of these industries depended on raw materials drawn from the Cross River

66
area. For example, the proposed Palm Kernel crushing industry at
Aro Ndizugu was to be located in an area not noted for the production
of the kernels. The bulk of the products for the industry was to come
from the Cross River area. Decisions like these were more political
than economic since industries were sited in areas outside the raw
material zone even when it was not more economical to do so.
The Marketing Boards forced the transportation of produce to ports
of their choice, even when produce had to be transported farther than
necessary to reach the ports. The continual transportation of the palm
oil and kernels of the Cross River area in Itu, Ediba, Umon, Obubra, Uyo,
Ikot Ikpene, etc., via Port Harcourt instead of Calabar is an example of
such policies. Indeed, Ogundana noted that "the differential spatial
pricing of commodities instituted by the marketing boards sometimes
conditions the routing of commodities. An example is the case of
Port Harcourt, and Opobo, the price of Palm oil was higher in Port
Harcourt than in Opobo, because Port Harcourt was designated as the
terminal port."119 The result of that practice was that traffic which
otherwise might have been routed to Opobo was diverted to Port Harcourt
to take advantage of the higher statutory price. What was true for
Opobo was true for Calabar in comparison with Port Harcourt. How far
this type of decision was influenced by a purely economic or geographical
factor can only be imagined.
The Premier of Eastern Nigeria was reported to have told a
political rally at Calabar in 1963 that:
119Ogundana. The Location Factor in Changing Seaport Significance
in Nigeria, p. 83.
67
"120". . .if you do not vote for me, I don't vote for you.
Strong as this statement might have been, it tended to reflect on the
policy followed by the Eastern Government when the people of the Calabar-
Ogoja-Rivers areas opted for the Action Group and rejected the ruling
party in Eastern Nigeria. The agitation for a separate state was a
major issue which if carried through would have reduced the area of
influence of the Eastern Nigerian N.C.N.C.--controlled government.
Virtually all the Cross River area would have been completely removed
from the Eastern region. Such a thought would have made matters
irreconcillable between the government and the State-hungry group in
the Cross River area.
One would have believed that the government should have done
something to court the friendship of the people of the area. Not so at
all. For, if therewere:such conciliatory moves, the spread of amenities
would have shown it. The location of secondary schools and colleges in
the region did not reflect the principle of need. The Old Ogoja and
121Calabar provinces had the least. In fact, of the 33 teacher training
colleges in the region, Obudu,Ogoja, and Obubra divisions had one each
while Ikom had none at all.122
While it may be difficult to remove purely economic and geographical
factors from some of the decisions of the government, it is not
impossible to see cases of glaring politically-motivated decisions. The
removal of administrative headquarters from Calabar was political. The
120Aye,_p.. cit.,p. 165.
121Eastern Nigeria Statistical Information on Education, Enugu, 1965.
122Ib1d.

68
decision to link the Enugu by rail to Port Harcourt was political. The
decision by the government owned Nigerian Ports Authority to discrimin-
ate against the port of Calabar and the Cross River inland waterway
while developing the ports of Lagos and Port Harcourt along with other
inland waterways was purely political. The spread of amenities to
parts of the former Eastern Nigeria with some bias against the Cross
River area cannot be defended on economic or geographical grounds. The
location of medical, educational, and industrial facilities in a biased
pattern only savoured of politics.
If the above decisions contained some economic considerations,
even however minute, the decision of the Eastern Nigeria Marketing
Board to price export commodities in such a way that only Port Harcourt
would attract them against the other ports must be seen in the context
of noneconomic reasons. When specific directives were given to produce
buying agents to export only through Port Harcourt even when other ports
would have been nearer cannot be an economic thinking. The decision
to develop roads only in an eastdwest direction to connect the numerous
plantations of the Cross River basin to Port Harcourt must be anything
but an economic decision.
It is these series of government decisions which were so well
timed that their total impact paralyzed the economic life of the Cross
River waterway and its ocean terminal port. Consequent on these
decisions, the Cross River and the port of Calabar had never been
dredged since 1907 to date. No government funds had been used to develop
the ocean and river ports. Consequently, the area became depressed
and came into the economic wheel of the nation indirectly. Poverty,

69
unemployment and general outmigration followed. As to the question
whether the factors most responsible for the depression of the area
were mostly political, the hypothesis has been proved true.

CHAPTER V
SUMMARY AND CONCLUSIONS
This study attempts to discover and diagnose those factors which
were directly and indirectly responsible for the decline of the Cross
River waterway and its terminal ocean port of Calabar between 1920
and 1967}23 To appreciate the importance of the Cross River waterway
and its role in the commerce of what later came to be known as Eastern
Nigeria, a historical sketch was necessary. This history went back to
the early Portugese contacts with Calabar port and the Cross River
around the 15th century. The role of this waterway was found to be
significant in the promotion of trade between the then Eastern Nigeria
and the European traders.
Such a role was found to be important before, during and after
what came to be two and a half centuries of slave trade across the
atlantic Ocean. When legitimate trade was restored, the Cross River
waterway continued its major commercial role. Between the Niger Delta
and the Cross River areas, that portion of Nigeria which became the
primary palm oil market of West Africa, took on the popular name of
"The Oil Rivers." Even the British traders induced their government to
adopt political actions to protect their newfound markets, by certain
treaties with the native rulers. The whole area was later declared the
123The Cross River and the Port of Calabar had always been
individisible in terms of economic fortunes.
7O
71
Oil Rivers Protectorate. The seat of government was later moved from
the former Spanish island of Fernando P0 to Calabar from where the
Southern area of Nigeria was administered between 1886 and 1906. The
administrative headquarters was in 1906 moved to Lagos when the country
was amalgamated. Thereafter, the port of Calabar and the Cross River
waterway began a systematic decline which ended up in a total depression
in the 19603.
The main theme of the study was based on the hypotheses: whether
the major factors responsible for the decline of the Cross River water-
way and its ocean terminal port were due to purely geographical and
economic factors often inherent in evolutions of development, or whether
the decline was the function of political and social factors, that
is, man-made conditions.
A careful analysis on the basis of geographic and economic
considerations were centered on:
(a) the locational advantages of the Cross River waterway.
(b) the physical characteristics of the waterway--seaward approach
channels, landward approach channels, and proximity to busy
and rich hinterlands.
(c) the attitude of the peoples of the Cross River basin to
gainful economic activities in the past and later on.
The study discovered that in terms of location, the Cross River water
way is unique and its locational advantages had not diminished over the
centuries. Indeed, its location gave it greater advantages over Port
Harcourt with respect to the movement of export products from the Cross
River basin. The same locational advantage made the Cross River waterway

72
and the port of Calabar superior to both Lagos and Port Harcourt with
railroad connections.124 As far as transportation of export produce
from the northeastern section of Nigeria is concerned, the NEDECO
Report125 concluded thus:
"For Makurdi and all more northern regions, the Makurdi
Calabar line provided a reduction in railway distance to
the sea of 25.5 miles compared with Port Harcourt. For
Kaduna and areas to the North of it, the planned line
also results in a shorter railway distance of 17.5 miles
compared with Lagos."
As far as physical characteristics are concerned, the Cross River
waterway was discovered to be still superior than either Lagos or Port
Harcourt. By 1907, the lowest draught limit for Lagos was 9 feet when
it was 18 feet at Calabar. By 1970 the lowest permissable draught
limit of water at Calabar was 13 feet excluding the rise of water by
10 feet at spring tide, despite absence of dredging. In Lagos and
Port Harcourt, with yearly dredging exercises, the depths of over 20
and 27 feet are artificially maintained. Thus, both the seaward
approach and the port area of Calabar and the Cross River waterway
generally have shown the lowest level of annual silting among the
country's waterways.
Even assuming that the present port site at Calabar does not
.have adequate land space for warehouses and storages, apprOpriate shifts
would have been made to a more convenient area within the general port
124NEDECO Report, 92- cit., p. 57.
125Ibid.

73
area.126 Again allowing seasonal traffic on the Cross River water,
the disadvantage127 would have been minimized by appropriate road
transport networks to Calabar port. But these disadvantages were not
more exaggerated since the same problems of physical nature are evident
in almost all Nigerian ports. Thus, in terms of physical character-
istics, the Cross River waterway and the port of Calabar were in no
way inferior. Nair,128 in a comparative study remarked that:
"The Calabar harbour was still superior to most at the
beginning of the present century. It was described as
the finest port on the Bight of Benin129 until Lagos
bar was removed."
On the attitude of the peoples of the Cross River Basin to
gainful economic activities, the study revealed increased production
of agricultura1,forestry, fishery products. Their attitudes did not
change for the worse. Rather, increased agricultural activities were
noticed until producer prices paid to farmers tended to discourage
most of them from further production. Indeed the younger generations
of farmers had to reduce production or else abandon the farms. This
was at the instance of the government-owned Regional Marketing Board's
pricing policies on agricultural produce. Thus the continued appre-
ciation of profit motive by the people made the Cross River waterway
126As recommended in NEDECO Report.
127The St. Lawrence Seaway is navigable for some months of the
year. During the months of traffic closure, commodities are stock-
piled. Very little disadvantage is encountered by this system if
heavier volumes are carried during the spring, summer and fall months,
so in Nigeria the seasonality of export products could be used to
similar advantage.
128Nair,_p_. cit., p. 258.
129Should have read Biafra here.

74
still lie close to a rich and busy hinterland which should foster its
trade activities.
The overall conclusion of the first hypothesis was that the
decline of the Cross River waterway was not a function of changes
in its inherent physical factors or economic circumstances. That
hypothesis was proved to be untrue.
On the second hypothesis whether the decline was due to political
and social factors, it was necessary to trace governmental decisions
dating back to 1906. The removal of the administrative headquarters
of Southern Nigeria from Calabar to Lagos was more a political question
than an economic one since Lagos was then a Crown Colony ceded to the
British government in 1861. The British were proud to run the country
from their "own property" than from the native city of Calabar.
When it became necessary to connect the Enugu coal mines to the
sea in 1913, the decision was in favour of Port Harcourt. Here again,
Port Harcourt was the "European town" of Mr. Harcourt and was necessary
to spend more funds to make a success of Mr. Harcourt's town planning
skills. Even when it meant more dredging to the open sea at Port
Harcourt than at Calabar, the odds were against a choice of Calabar.
Despite the recommendations of Sir Ralph Moore for connecting Calabar
to Enugu-coal mine, the decision was for Port Harcourt. It was left
for Sir Walter Egerton to confess later that:
". . .the administration now knew that the country behind
the Itu was one of the richest in the Protectorate. The
bulk of its groducts rots on the ground for lack of
transport."1 0
130Nair, 22, cit.
75
The Ministry of Public Works in Enugu decided to run all roads
east-west of the Cross River basin to connect it to the sprawling agri-
cultural estates and to the chosen port of Port Harcourt. The Eastern
Nigeria marketing board adopted a commodity policy which made Port
Harcourt the most favored port of the region for export produce sales
and evacuation purposes. Indeed, it is believed that the pricing
differential was such that areas nearest Calabar found it profitable
to move their export produce to Port Harcourt, still farther away.
In 1954, the inauguration of the Nigerian Ports Authority to
develop and cater for Nigerian ports, decided to adopt and develop
only Lagos and Port Harcourt initially. It was not until after ten
years that the Delta ports was included for developing, thanks to the
creation of the Midwestern Region at that time (see Table A.10).
All that time Calabar was sadly neglected and discriminated against
when millions of Nigerian Naira were pumped in to develop Lagos and
Port Harcourt and later the Delta ports. It is difficult to imagine
that such a decision was based on economics or sound management of the
nation. It was after the creation of the South Eastern State with
Calabar as its capital that the port of Calabar complex was included
as the responsibility of the Nigerian ports authority for development
purposes (Table A.12).
As Ogundana131 noted, it was impossible for the port of Calabar
(and indeed the Cross River waterway) to be expected to function so
effectively without technological innovations, when its competitors
131Ogundana, _p. cit.
76
were selected for development. Indeed, all waterways and ports of
Nigeria have physical problems. At the turn of the century, Calabar
port and the Cross River was naturally in a more favorable position
for commercial purposes. A series of-decisions beginning from 1906
had tended to discriminate against the Cross River waterway and its
terminal ocean port of Calabar. Its rivals were by these decisions
placed artificially at special advantages.
Thus to the question whether the decline of the Cross River
waterway and its ocean port of Calabar was due to geographic and
economic factors or due to political factors, the answer is that
physical factors applied equally to all waterways of Nigeria, but
political decisions have discriminated against the Cross River waterway.
The factors were thus more of a political nature than pure economic
and geographical ones.

APPENDIX
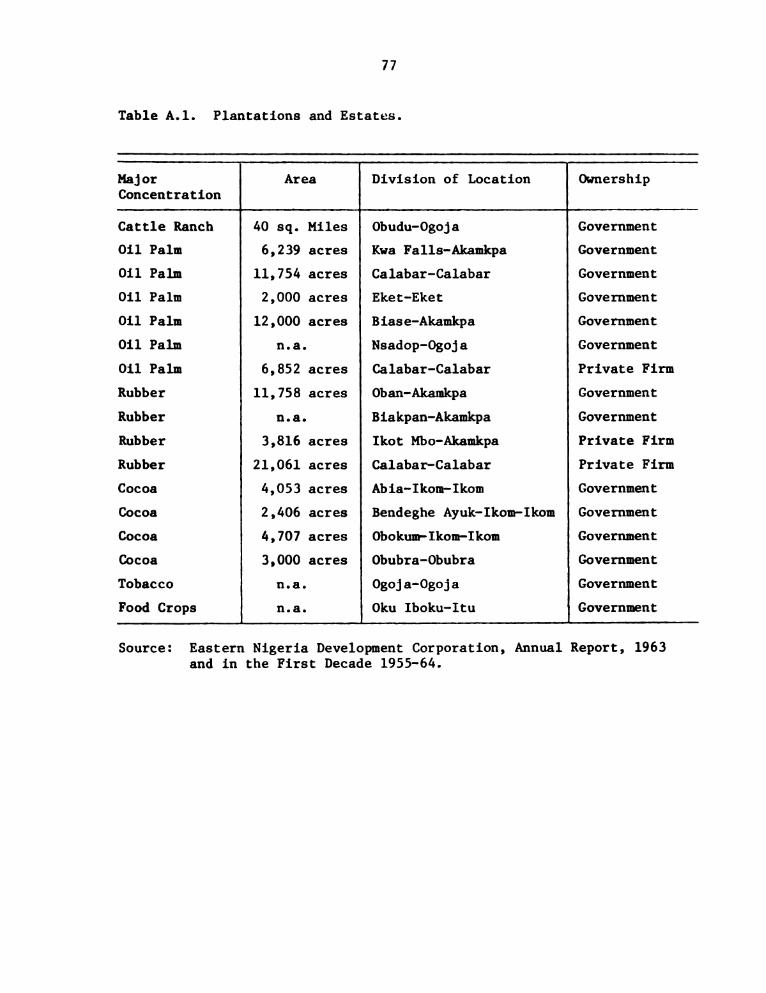
77
Table A.1. Plantations and Estates.
Major Area Division of Location Ownership
Concentration
Cattle Ranch 40 sq. Miles Obudu-Ogoja Government
Oil Palm 6,239 acres Kwa Falls-Akamkpa Government
Oil Palm 11,754 acres Calabar-Calabar Government
Oil Palm 2,000 acres Eket-Eket Government
Oil Palm 12,000 acres Biase-Akamkpa Government
Oil Palm n.a. Nsadop-Ogoja Government
011 Palm 6,852 acres Calabar-Calabar Private Firm
Rubber 11,758 acres Oban-Akamkpa Government
Rubber n.a. Biakpan—Akamkpa Government
Rubber 3,816 acres Ikot Mbo-Akamkpa Private Firm
Rubber 21,061 acres Calabar—Calabar Private Firm
Cocoa 4,053 acres Abia-Ikom-Ikom Government
Cocoa 2,406 acres Bendeghe Ayukelkom-Ikom Government
Cocoa 4,707 acres Obokum-Ikom-Ikom Government
Cocoa 3,000 acres Obubra-Obubra Government
Tobacco n.a. Ogoja-Ogoja Government
Food Crops n.a. Oku Iboku-Itu Government
Source:
and in the First Decade 1955-64.
Eastern Nigeria Development Corporation, Annual Report, 1963

78
Table A.2. Large Estate Concentrations.
Political No. of Areas of Types of Project
Divisions Estates Land Activities Ownership
(Acres)
Akamkpa 5 51,058 Oil palms Government
Rubber Private
Calabar 3 22,422 Oil palms Government
Rubber Private
Ikom 3 11,166 Cocoa Government
Ogoja 2 n.a. Tobacco Government
Oil palms
Obudu 1 25,600 Cattle Government
Obubra 1 3,000 Cocoa Government
Eket 1 2,000 Oil palm Government
Itu 2 n.a. Food crops Government
011 palm Private
Source: E.N.D.C. Reports (See Source of Table A.1).

79
Table A.3a. Forest Reserve Distribution.
Division Forest Reserve Area in Square Miles
Calabar Ekinta River 42
Calabar/Akamkpa Oban Group 1,445
Calabar/Itu Uwet Odot 110
Ikom Afi River 148
Ikom Cross River South 135
Ikom Cross River North 50
Ikom/Obudu Okwangwo 181
Obubra Ukpong River 121
Obubra Agoi 18
Obudu Boshi l6
Obudu Boshi Extension 26
Itu Lower Enyong 11
Ogoja Yahe 6
Ogoja Ikirigon 2
Ogoja Gabu 2
Ikot Ekpene Ogu/Itu 2
Ikot Ekpene Obot Ndon l
Eket/Oron Stubbs Creek 120
Akamkpa/Itu Umon Ndeachi 42
Total 2,478
Source: South Eastern State Ministry of Information, 1972.

80
Table A.3b. Summary.
Divisions No. of Reserves Total Areas
(Square Miles)
Calabar 1 1,597 42
Calabar/Others 2 1,555
Ikom 3 514 333
Ikom/Others l 181
Akamkpa/Others 2 1,487
Obudu 2 42
Obudu/Others l 181
Ikot Ekpene 2 3
Itu/Others 3 152
Ogoja 3 10
Obubra 2 139
1 120Eket/Oron Source: South Eastern State Ministry of Information, 1972.
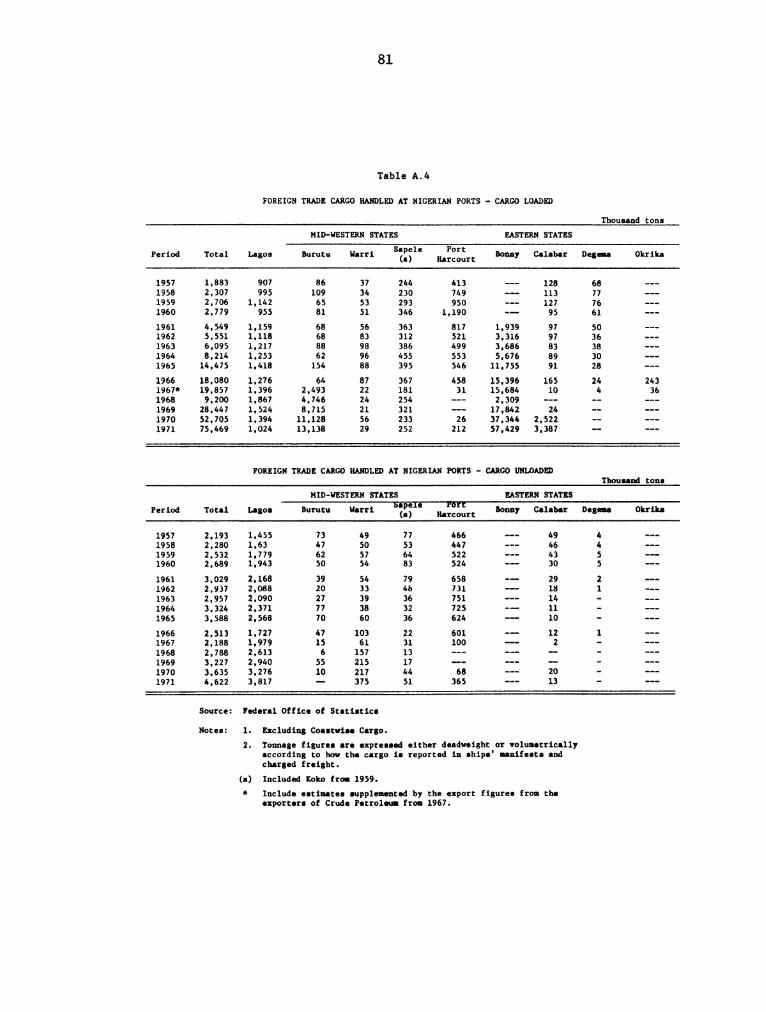
81
Table A.4
FOREIGN TRADE CARGO HANDLED AT NIGERIAN PORTS - CARGO LOADED
Thousand tons
MID—WESTERN STATES EASTERN STATES
Sapele PortPeriod Total Lagos Burutu Harri (a) Harcourt Bonny Calabar Degema Okrika
1957 1,883 907 86 37 244 413 --- 128 68 -—-
1958 2,307 995 109 34 230 749 --— 113 77 —--
1959 2.706 1,142 65 53 293 950 -- 127 76 —--
1960 2,779 955 81 51 346 1,190 -- 95 61 ---
1961 4.549 1,159 68 56 363 817 1,939 97 50 ---
1962 5,551 1,118 68 83 312 521 3,316 97 36 ---
1963 6,095 1,217 88 98 386 499 3,686 83 38 ---
1964 8,214 1,253 62 96 455 553 5,676 89 30 ---
1965 14,475 1,418 154 88 395 546 11,755 91 28 ---
1966 18,080 1,276 64 87 367 458 15,396 165 24 243
1967* 19,857 1,396 2,493 22 181 31 15,684 10 4 36
1968 9,200 1,867 4,746 24 254 —-- 2.309 -- -- ---
1969 28.447 1,524 8,715 21 321 -- 17,842 24 -- ---
1970 52.705 1.394 11.128 56 233 26 37,344 2,522 -- ---
1971 75,469 1,024 13,138 29 252 212 57,429 3,387 -- --—
FOREIGN TRADE CARGO HANDLED AT NIGERIAN PORTS - CARGO UNLOADEI
Thousaggltons
MID-WESTERN STATES EASTERN STATES
EspeIe ’TFOPUPeriod Total Lagos Burutu Harri (a) Harcourt Bonny Calabar Degema Okrika
1957 2,193 1.455 73 49 77 466 --- 49 4 ---
1958 2,280 1,63 47 50 53 447 --- 46 4 ---
1959 2,532 1,779 62 57 64 522 --- 43 5 --
1960 2,689 1,943 50 54 83 524 -- 30 5 ---
1961 3.029 2,168 39 54 79 658 —- 29 2 ---
1962 2,937 2,088 20 33 48 731 -- 18 1 -—-
1963 2,957 2.090 27 39 36 751 ~-- 14 - ---
1964 3,324 2.371 77 38 32 725 -- 11 - --_
1965 3,588 2.568 70 60 36 624 -- 10 - --_
1966 2,513 1.727 47 103 22 601 -- 12 1 —--
1967 2,188 1,979 15 61 31 100 —- 2 — ---
1968 2,788 2,613 6 157 13 --- -—- -— _ -__
1969 3,227 2,940 55 215 17 —-— --- -— — ---
1970 3,635 3.276 10 217 44 68 --- 20 - —--
1971 4,622 3.817 - 375 51 365 --- 13 - ---
Source: Federal Office of Statistics
Notes: 1. Excluding Coastwiss Cargo.
2. Tonnage figures are expressed either deadweight or volumetricslly
according to how the cargo is reported in ships' manifests and
charged freight.
(a) Included Koko from 1959.
* Include estimates supplemented by the export figures from the
exporters of Crude Patrolsul from 1967.
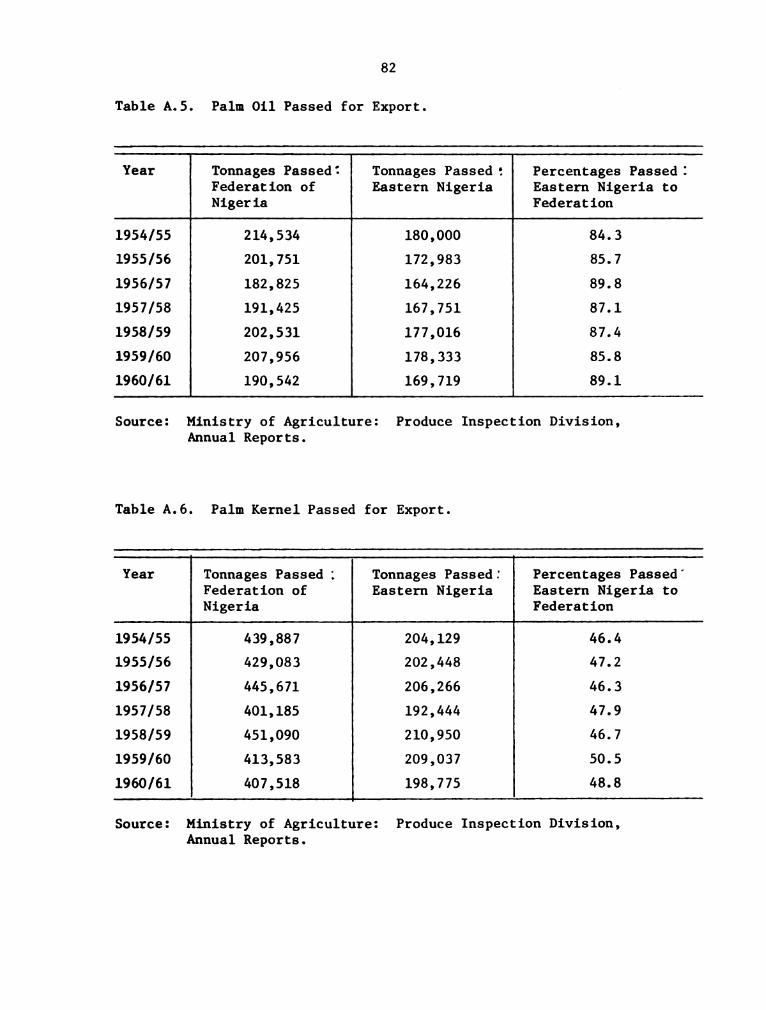
82
Table A.5. Palm Oil Passed for Export.
Year Tonnages Passed: Tonnages Passed: Percentages Passed:
Federation of Eastern Nigeria Eastern Nigeria to
Nigeria Federation
1954/55 214,534 180,000 84.3
1955/56 201,751 172,983 85.7
1956/57 182,825 164,226 89.8
1957/58 191,425 167,751 87.1
1958/59 202,531 177,016 87.4
1959/60 207,956 178,333 85.8
1960/61 190,542 169,719 89.1
Source: Ministry of Agriculture: Produce Inspection Division,
Annual Reports.
Table A.6. Palm Kernel Passed for Export.
Year Tonnages Passed 1 Tonnages Passed: Percentages Passedi
Federation of Eastern Nigeria Eastern Nigeria to
Nigeria Federation
1954/55 439,887 204,129 46.4
1955/56 429,083 202,448 47.2
1956/57 445,671 206,266 46.3
1957/58 401,185 192,444 47.9
1958/59 451,090 210,950 46.7
1959/60 413,583 209,037 50.5
1960/61 407,518 198,775 48.8
Source: Ministry of Agriculture: Produce Inspection Division,
Annual Reports.
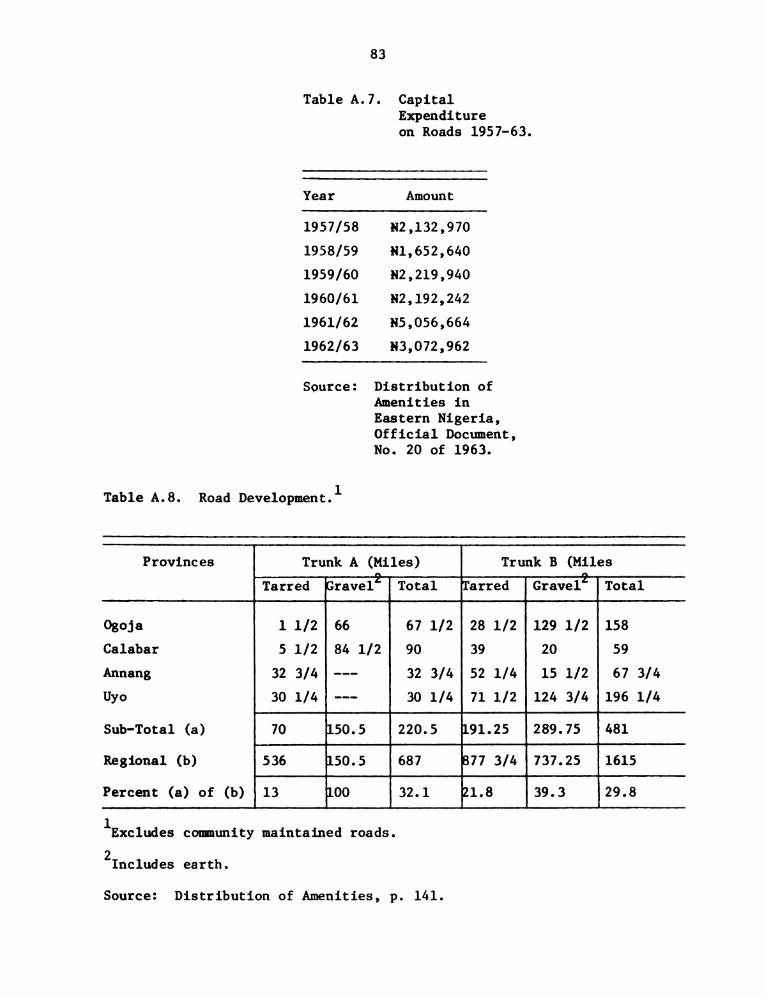
83
Table A.7. Capital
Expenditure
on Roads 1957-63.
Year Amount
1957/58 N2,132,970
1958/59 Nl,652,640
1959/6O 82,219,940
1960/61 N2,l92,242
1961/62 N5,056,664
1962/63 N3,072,962
Source: Distribution of
Amenities in
Eastern Nigeria,
Official Document,
No. 20 of 1963.
Table A.8. Road Development.1
Provinces Trunk A (Miles) Trunk B (Miles
Tarred Cravel: Total Tarred Gravel‘ Total
Ogoja 1 1/2 66 67 1/2 28 1/2 129 1/2 158
Calabar 5 1/2 84 1/2 90 39 20 59
Annang 32 3/4 -—- 32 3/4 52 1/4 15 1/2 67 3/4
Uyo 30 1/4 --- 30 1/4 71 1/2 124 3/4 196 1/4
Sub-Total (a) 70 150.5 220.5 191.25 289.75 481
Regional (b) 536 150.5 687 877 3/4 737.25 1615
Percent (a) of (b) 13 00 32.1 21.8 39.3 29.8 1Excludes community maintained roads.
2Includes earth.
Source: Distribution of Amenities, p. 141.

84
Table A.9. Palm Produce Export and Prices.
Palm Kernels Palm Oil
Year Purchased Basic Producer Purchased Basic Producer
For Export Prices $ Per Ton For Export Prices Dollar Per
(Tons) North West East (Tons) Tona (East)
1953 433,584 68 68 68 224,214 116
1954 462,399 68 68 68 216,449 100
1955 418,002 60 6O 60 196,860 86
1956 465,652 62 62 62 190,792 86
1957 411,898 62 62 62 176,706 86
1958 460,720 62 6O 58 190,167 80
1959 428,450 62 60 58 190,705 80
1960 422,067 62 6O 58 189,148 80
8Grade I.
Note: In the Northern and Western Regions actual payments to producers
are reduced through the operation of Sales of Produce (Taxation)
Ordinance by $2 per ton on palm kernels and palm oil. For the
Eastern Region, the prices shown are those paid to producers;
the Board pays the Produce Purchase Tax of $4 per ton on palm
kernels and $8 per ton on palm oil.
Source: Barclays Bank D.C.O. Nigeria, An Economic Survey, Lagos, 1961,
p. 14.
Table A.10. Location of Industries 1962-63.
Location No. of Industries Capital Invested
Port Harcourt 9 $11,080,000
Enugu 6 $ 3,500,000
Nkalagu 1 $ 8,200,000
Onitsha 2 $ 6,068,000
Ummahia 2 $ 3,588,000
Abs 1 $ 2,142,000
Source: Distribution of Amenities in Eastern Nigeria.

Table A.11.
85
Tonnage of Cargo Shipped Coastwise-Cargo Loaded (Thousand Tons).
Period Total Lagos Mid-Western States Agggtern States
Burutu Harri Sapele Port Bonny Calabar Degema Orika
(b) Harcourt '
1957 431 104 31 24 21 245 2 4 -
1958 368 116 12 32 15 189 3 1 --
1959 342 120 42 18 16 143 2 1 -
1960 422 126 34 30 48 152 23 9 --
1961 282 113 11 12 14 128 4 - --
1962 292 80 8 6 38 189 6 ~-
1963 202 86 - - 12 101 3 - -
1964 220 66 2 -- 1 144 7 - --
1965 322 88 - - 2 165 8 - 59
1966 1,136 35 2 1 - 131 2 - 965
1967‘ 210 38 1 1 1 7 1 1 160
1968 103 100 2 - - -- - - --
1969 113 99 - ,- -— -- 14 - --
1970 512 200 - 1 16 284 ll - ---
1971 524 47 - 5 - 464 7 - --
Tonnage of Cargo Shipped Coastwise-Cargo Unleaded
1957 399 335 23 3 ll 16 10 1 --
1958 307 448 19 2 1 25 11 1 ---
1959 302 258 7 2 2 27 5 1 ---
1960 332 182 19 11 18 ‘88 13 l --*
1961 158 131 12 1 3 7 3 1 ---
1962 243 176 8 8 10 38 3 - ---
1963 166 118 3 4 4 40 2 - --
1964 182 143 7 l 2 27 2 - --
1965 215 159 21 3 -- 29 3 - --
1966 800 759 22 3 1 11 4 - ---
1967 546 524 10 3 6 2 1 - --
1968 65 6 3 19 37 -- -- - --
1969 191 30 6 37 66 -- 51 - --
1970 589 414 6 32 65 39 43 - --
1971 1,128 944 1 47 84 12 40 - --
Source: Federal Office of Statistics.
Notes: 1. Figures exclude cargo handled at non-Customs ports.
2. Only cargo carried by ocean-going ships is included.
(a) Figures for 1959 and earlier years include Opobo which was closed as a port in
January, 1950.
(6) Includes Koko from 1959.

Table
A.12.
General
Cargo
Handled
From
1955-56
to
1972-73
(All
Ports)
(Metric
Tonne).
Year
La
08
Ports
Complex
Port
Harcourt
Port8
Gogglex
Delta
Ports
Com
lex
Calgbar
Port
A11
Ports
C
Import
Export
Total
Import
Export
Total
Import
Export
Total
Import
Export
Total
Import
qulexes
C
Export
ombined
Total
1955-56
1956-57
1957-58
1958-59
1959-60
1960-61
1961-62
1962-63
1963-64
1964-65
1965-66
1966-67
1967-68
1968-69
1969-70
1970-71
1971-72
1972-73
799,862
900,275
855,927
901,477
1,043,103
1,107,029
1,029,081
909,167
964,447
967,139
1,038,292
997,031
1,137,254
1,052,180
1,349,981
2,168,132
2,578,780
2,202,363
544,981
651,960
559,870
749,977
684,655
615,524
821,185
762,072
920,560
1,038,944
1,130,504
1,094,723
1,436,676
1,496,208
1,290,713
1,135,439
813,178
734,283
1,344,843
1,552,235
1,415,797
1,651,454
1,727,758
1,722,553
1,850,266
1,671,239
1,885,007
2,006,083
2,168,796
2,091,754
2,573,930
2,548,388
2,640,694
3,303,571
3,391,958
2,936,646
277,941
336,928
360,142
368,393
421,482
445,160
444,013
498,871
484,980
447,370
477,679
483,815
79,829
326,202
617,032 478,390 2
35,221
255,507
228,105
320,510
282,729
298,689
400,301
391,234
450,135
380,779
409,800
292,060
23,553
54,178
110,075
172,174
513,162
592,435
588,247
688,903
704,211
743,849
844,314
890,105
935,115
828,149
887,479
775,875
103,374
380,380
727,107 650,564
13,866
2,990
777
6,813
35,597
284,701
372,053 204,376 1
31
546
106
3,274
78,126
27,309
27,165
13,997
3,536
883
6,813
38,870
362,827
399,362
231,541 4
4,026
34,262
20,188
15,220 2
5,947
57,579
60,528
41,290 6
9,973
91,841
80,715
56,510 1
,077,803
1,237,203
1,216,069
1,269,870
1,464,585
1,552,189
1,473,094
1,408,038
1,449,427
1,414,509
1,529,837
1,483,836
1,138,031
1,058,993
1,509,433
2,813,297
3,588,053
2,900,349 1
,070,487
1,221,486
1,153,306
1,370,695
1,419,723
1,540,435
1,387,329
1,436,782
1,496,208
1,343,478
1,325,322
1,011,090
780,202
907,467
787,975
967,384
914,213
1,858,005
2,144,670
2,004,044
2,340,357
2,431,969
2,466,402
2,694,580
2,561,344
2,820,122
2,831,232
3,070,272
2,871,165
2,574,813
2,555,201
2,852,911
4,138,619
4,599,143
974,912
3,875,261
Source:
Nigerian
Port
Authority,
Lagos.
£36

BIBLIOGRAPHY
BIBLIOGRAPHY
Books
Amaku, E. N. Edikot Nwed Mbuk, Vol. II.
Akpan, N.U. The Strpggle of Secession 1966-1970. Frank Cass, London,
1971.
Aye, E. U. 01d Calabar Through the Centuries. Hope Waddell Press,
Calabar, 1967.
Blake, J.W. European Beginnings in West Africa, London, 1937.
Buxton, T. F. The African Slave Trade and Its Remedy. London, 1839.
Bower, P.A., Brown, A.8. Leubuscher, C. Mars, J. Pim, Alan.Mining,
Commerce, and Finance in Nigeria. Faber and Fabar, Ltd., London.
Cook, A. C. British Enterprise in Nigeria. Philadelphia, 1943.
Coupland, Sir Reginald. The British Anti-Slavery Movement. London,
Butterworth, 1933.
Crowder, Michael. The Story of Nigeria. Faber and Babar, Ltd., 1962.
Davidson, Basil. A History of West Africa, 1000-1800. London, Longmans,
1965.
Davies, K.G. The Royal Company. London Longmans, 1957.
Davies, Oliver. West Africa Before the Europeans. London, Methuene,
1967.
Dike, K. 0. Trade and Politics in the Niger Delta, 1830-1885: An
Introduction to the Economic and Political History of Niggria.
Oxford, Clarendon Press, 1956.
Due, John F. Taxation and Economic Development in Tropical Africa.
Cambridge, Massachusset, M.I.T. Press, 1963.
Eicher, C. K. and Liedholm, C. Growth and Development of the Nigerian
Economy. East Lansing, Michigan, Michigan State University Press,
1970.
87
88
Ekundare, R. 0. An Economic History of Nigeria, 1869-1960. Africana
Publishing Co., New York. A Division of Holmes & Meier Publishers,
Inc., 1973.
Faulkner, O. T. and Mackie, J.R. West African Agriculture. Cambridge,
Cambridge University Press, 1933.
Forde, Daryll, Efik Traders of Old Calabar. London, 1956.
and Jones, C. I. The Ibo and Ibibio-Speakinngeoples of
South-Eastern Niggria. London, 1950.
Frankel, Herbert S. Capital Investment in Africa, Its Course and
Effects. New York, Oxford University Press. 1938.
Geary, Sir William. Nigeria Under British Rule. London, Frank Cass,
1965.
Goldie, Rev. H. Calabar and Its Mission. Edinburgh and London, 1901,
Harrison-Church, R. J. West Africa: A Study of the Environment and
of Man's Use of It. London, Longmans, 1957.
Hawkins, E. K. Road Transport in Nigeria: A Study of African Enterprise.
London, Oxford University Press, 1958.
Helleiner, G. K. Peasgnt Agriculture, Government and Economic Growth
in Nigeria. Homewood, Illinois, Irwin, 1966.
Irvine, F. R. A Textbook of West African Agriculture, 2nd Edition,
London, Oxford University Press, 1953.
Jackson, I.C. Advance in Africa: A Study of Community Development
in Eastern Nigeria. London, Oxford University Press, 1956.
Jennings, J. H. and Oduah, S. O. A Geography of the Eastern Provinces
of Niggria. Cambridge University Press, 1966.
Jones, C. I. The Trading States of the Oil Rivers. London, Oxford
University Press, 1963.
Karmon, Y. A Geography of Settlement in Eastern Niggria. Jerusalem,
Magnes Press, The Hebrew University, 1966.
Latham, A. J. H. Old Calabar 1600-1891: The Impact of the International
Economy Upon a Traditional Society. Clarendon Press, Oxford, 1973.
Martin, Ann. The Oil Palm Economy of the Ibibio Farmer. Ibadan, 1956.
Morel, E. D. Nigeria: Its People and Its Problems, 3rd Edition, London,
Frank Cass, 1968.

89
Nair, K.K. Politics and Sociepy in South Eastern Nigeria 1841-1906:
A Study of Power,_Diplomacy and Commerce in Old Calabar. London,
Frank Cass, 1972.
Nicolson, I.F. The Administration of Nigeria 1900-1960. Oxford,
Clarendon Press, 1969.
Oliver, E. 1. Nigeria: Economic and Commercial Conditions in Nigeria.
London, H.M.S.O., 1957.
Patridge, Charles. Cross River Natives. Hutchinson and Co., Paternoster
Row, London, 1905.
Peterec, R. J. Dakar and West African Economic Development. Columbia
University Press, New York and London, 1967.
Perham, Margery, Africans and British Rule. London, Oxford University
Press, 1941.
. The Native Economics of Nigeria. London, Faber and Faber,
1946-8.
. Native Administrations in Niggria. London, Oxford University
Press, 1937.
Pim, A. Colonial Agricultural Production. London, Oxford University
Press, 1946.
Prest, A. R. War Economics of Primary ProducinggCountries. Cambridge,
Cambridge University Press, 1948.
Talbot, P. A. The Peoples of Southern Nigeria. London, Humphrey
Milford, 1926, Vol. I.
Waddell, H. M. Twenty Nine Years in the West Indies and Central Africa
1829-1858, 2nd Edition, Frank Cass, London, 1970.
Documents
Eastern Nigeria Development Plan 1926-68, Government Printer, Enugu, 1962.
Department of Statistics, Population of Census of the Eastern Region of
Nigeria 1953; Published by Government Statistician, Lagos, Printed
by C.M.S., Niger Press, Port Harcourt.
Economic Rehabilitation of Eastern Nigeria, Government Printer, Enugu,
1955, Sessional Paper No. 6 of 1955.
Minorities, States and Nigerian Unity. Published by Old Calabar and
Ogoja Provincial Communities, Lagos, 1967.

9O
Barclays Bank D.C.O., Nigeria, Lagos, 1961.
The Nigeria Handbook, Containing Statistical and General Information
respecting the Colony and Protectorate, compiled in the Chief
Secretary's Office, Government Printer, Lagos, 1927.
The Nigeria Handbook, compiled by Chief Secretary's Office, Published
by Government Printer, Lagos, 1924 (5th ed.).
The Nigeria Handbook, Government Printer, Lagos, 1926, 7th edition.
The Nigeria Handbook by Chief Secretary's Office, Government Printer,
Lagos, 1933, 8th edition.
The Nigeria Handbook by Chief Secretary's Office, Government Printer,
Lagos, 1929, 9th edition.
The Nigeria Handbook by Chief Secretary's Office, Government Printer,
Lagos, 1933, 10th edition.
The Nigeria Handbook by Chief Secretary's Office, Government Printer,
Lagos, 1936, 11th edition.
Ministry of Agriculture, Produce Inspection Division, Annual Report,
1960-61, Government Printer, Enugu, 1962.
Federation of Nigeria, Federal Government, Development Programme
1962-68, Sessional Paper No. l of 1962, Federal Printing Division,
Lagos.
Federation of Nigeria, The Economic Programme of the Government of the
Federation of Nigeria 1955-60, Sessional Paper No. 2 of 1956,
Federal Government Printer, Lagos.
Preliminary Statement on Development Planning in Nigeria, Sessional
Paper No. 16 of 1945.
Report of a Committee appointed in Nigeria to examine recommendations
made by the Commission on the Marketing of West African Cocoa,
Sessional Paper No. 20 of 1939.
Report of Committee on Road Vs. Railway Competition, Sessional Paper
No. 21 of 1933.
Interim Report of the Road-Rail Competition Committee, 1936, Sessional
Paper No. 160 of 1937.
Report of Committee upon the System of Produce Inspection in Nigeria,
1931, Sessional Paper No. l of 1932.
Report on the Oil Palm Industry in British West Africa (F.M. Dyke),
Lagos, Government Printer, 1927.
91
A Ten-Year Plan of Development and Welfare in Nigeria, Sessional Paper
No. 24 of 1945.
Report by the Ad Hoc Meeting of the Nigeria Constitutional Conference
held in Lagos in February 1958, Lagos, 1958.
Report on the Ad Hoc Committee of the Conference on the Nigerian Con-
stitution, April 1959.
Handbook of Commerce and Industry in Nigeria, Lagos, 1960.
National Development Plan 1962-8, 1962.
United Africa Company Ltd., Statistical and Economic Review, 1954-57
Nos. 13—20
united Africa Company Ltd., Statistical and Economic Review, 1958-62,
Nos. 21-27.
Eastern Nigeria Development Corporation Annual Reports, 1955-64,
Government Printer, Enugu.
Azikwe, Namdi and Ojukwu, Sir L.P., Economy Mission to Europe and
America, Government Printer, 1955, Enugu.
Federal Gazette, May 27, 1967.
Geological Survey Reports, Bulletin Nos. 6 and 8, Nigerian Government,
Lagos, 1925.
Meteorological Report, Enugu, 1964.
NEDECO, Netherlands Engineering Consultants, Development of the Ports
of Nigeria 1970-1990, The Hague 1971.
Nigerian Ports Authority, Annual Reports 1958-59, 1969-70.
Journals
Jones, G.I., Trading States, Waddell, Journal, March 22, 1851, Vol.8.
Who are the Arc? Nigerian Field, Vol. 8, No. 3 1939.
Udo, R.K. and Ogundana, 3., "Factors Influencing the Fortunes of Ports
in Niger Delta, Scottish Geographical Magazine, No. 82, 1966.
. Differentiation between Cross River District and Cross River
plain or basin, Journal of Tropical Geographical, No. 1066,
Singapore, 1965.
92
. "The Cross River District of Eastern Nigeria", Journal of
Tropical Geography, Op. cit.
S. and P. Ottenberg, Afikpo Markets in P. Bohanan and G. Dalton (Eds.),
Markets in Africa, Northwestern University Press, Evanston 1962.
Weigand, G.G., "Some elements in the Study for Port Geography".
Review, Vol. 48, 1958.