Embed Size (px)
Citation preview

The Mass Spectrograph & Average Atomic Mass

Inventor
• Francis William Aston won the 1922 Nobel Prize in Chemistry for his work in mass spectrometry
The First Mass Spectrograph
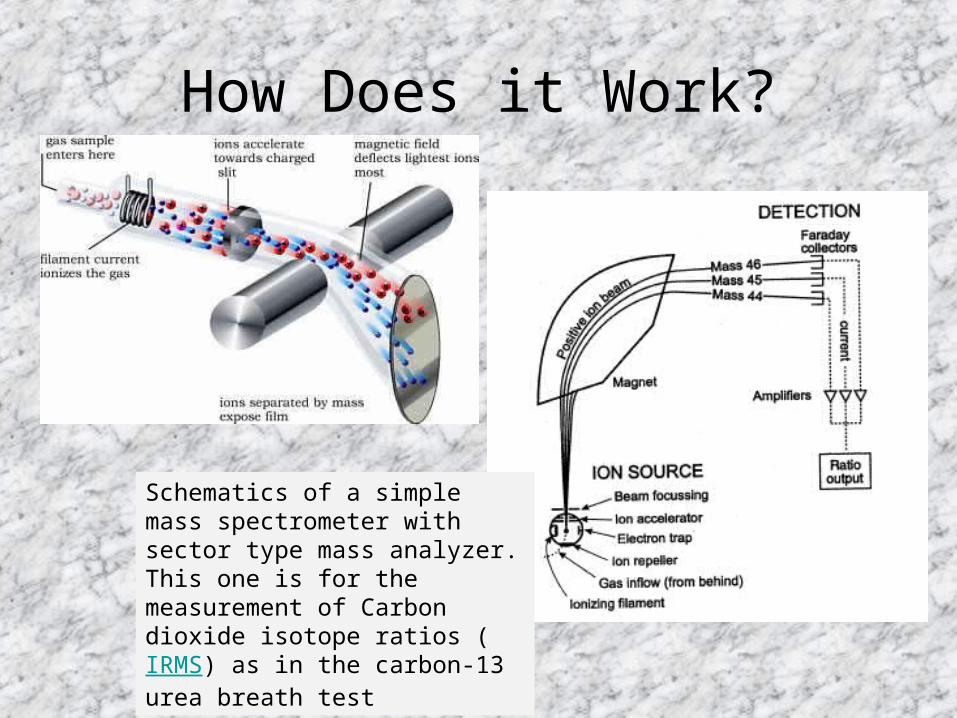
How Does it Work?
Schematics of a simple mass spectrometer with sector type mass analyzer. This one is for the measurement of Carbon dioxide isotope ratios (IRMS) as in the carbon-13 urea breath test


The Detector
A continuous dynode particle multiplier detector.

The Data
Mass Spectrograph of a protein


The Data as a Bar Graph

The Modern Mass Spectrograph


Use of Inductively Coupled Plasma-MassSpectrometry in Boron-lO Stable Isotope
Experiments with Plants, Rats, and HumansRichard A. Vanderpool1, Deb Hoff1, and Phyllis E. Johnson2'United States Department of Agriculture, Agricultural Research Service, Grand Forks, North Dakota;
2UnitedStates Department of Agriculture, Agricultural Research Service, Albany, CaliforniaThe commercial availability of inductively coupled plasma-mass spectrometry technology (ICP-MS)
has presented the opportunity to measure theboron concentrations and isotope ratios in a large number of samples with minimal sample
preparation. A typical analytical sequence for fecal samplesconsists of 25 acid blanks, 1 digestion blank, 5 calibration solutions, 4 standard reference material
solutions, 10 samples, and 4 natural abundancebias standards. Boron detection limits (3 x 1a) for acid blanks are 0.11 ppb for '0B, and 0.40 ppb for "
B. Isotope ratios were measured in fecalsamples with 20 to 50 ppb boron with <2% relative standard deviation. Rapid washout and minimal
memory effects were observed for a 50 ppbberyllium internal standard, but a 200 ppb boron biological sample had a 1.0 ppb boron memory after
a 6-min washout. Boron isotope ratios in geologicalmaterials are highly variable; apparently this variability is reflected in plants. The lack of a fixed
natural abundance value for boron requires thata natural abundance ratio be determined for each sample or related data set. The natural abundance
variability also prevents quantitation and calculationof isotope dilution by instrument-supplied software. To measure boron transport in animal systems, 20
pg of '°B were fed to a fasted rat. Duringthe 3 days after a 10B oral dose, 95% of the '0B was recovered from the urine and 4% from the
feces Urinary isotope ratios, I B/°0B, changed froma natural abundance of 4.1140 to an enriched value of 0.9507, a 77% change. The '°B label in
perfused rat livers peaked within 3 hr (>90% recovery,56% change in " B/`B) and returned to a natural abundance ratio within 24 hr. In summary, boron
concentrations and enriched isotope ratios have

Note:• Percent = out of 100 %
• Relative abundance = out of one whole
• Average Atomic Mass – the average mass of all the naturally occuring isotopes of an element expressed in atomic mass units.
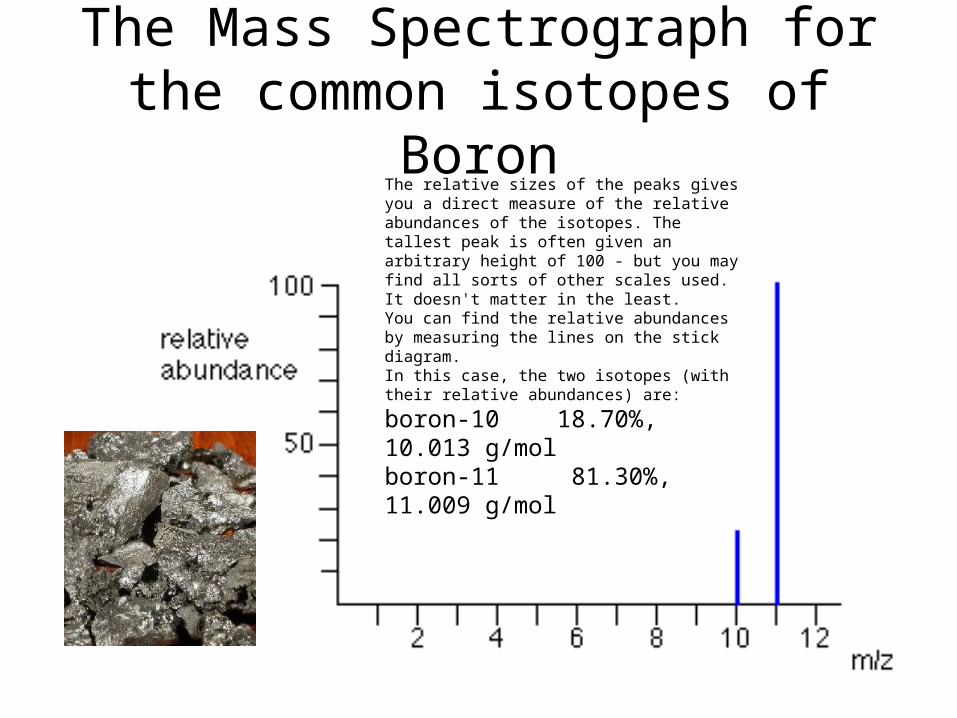
The Mass Spectrograph for the common isotopes of Boron
The relative sizes of the peaks gives you a direct measure of the relative abundances of the isotopes. The tallest peak is often given an arbitrary height of 100 - but you may find all sorts of other scales used. It doesn't matter in the least.You can find the relative abundances by measuring the lines on the stick diagram.In this case, the two isotopes (with their relative abundances) are:
boron-10 18.70%, 10.013 g/molboron-11 81.30%, 11.009 g/mol

Sample Problems• What is average atomic mass of Lithium if 7.42% exists
as 6Li (6.015 g/mol) and 92.58% exists as 7Li (7.016 g/mol)?
• Two isotopes of silver are found using the mass spectrograph. Silver – 107 has an atomic mass of 106.91 amu and an abundance of 51.86 %. The second isotope has an abundance of 48.14 %, but its atomic mass was unable to be determined. What is the atomic mass and the mass number(identity) of this isotope?