Embed Size (px)
Citation preview

The Markets Now
●US T-Bonds have ended their secular bull market
● Global stock markets are experiencing a
corrective phase due to seasonal factors, ‘Grexit’
fears, and rising Treasury yields
● However, stock markets are also cushioned by
QE in Japan and the EU, plus China’s stimulus.
David Fuller – 15th June 2015
fullertreacymoney.com
East India Club – 16 St. James Square
London SW1Y 4LH, UK
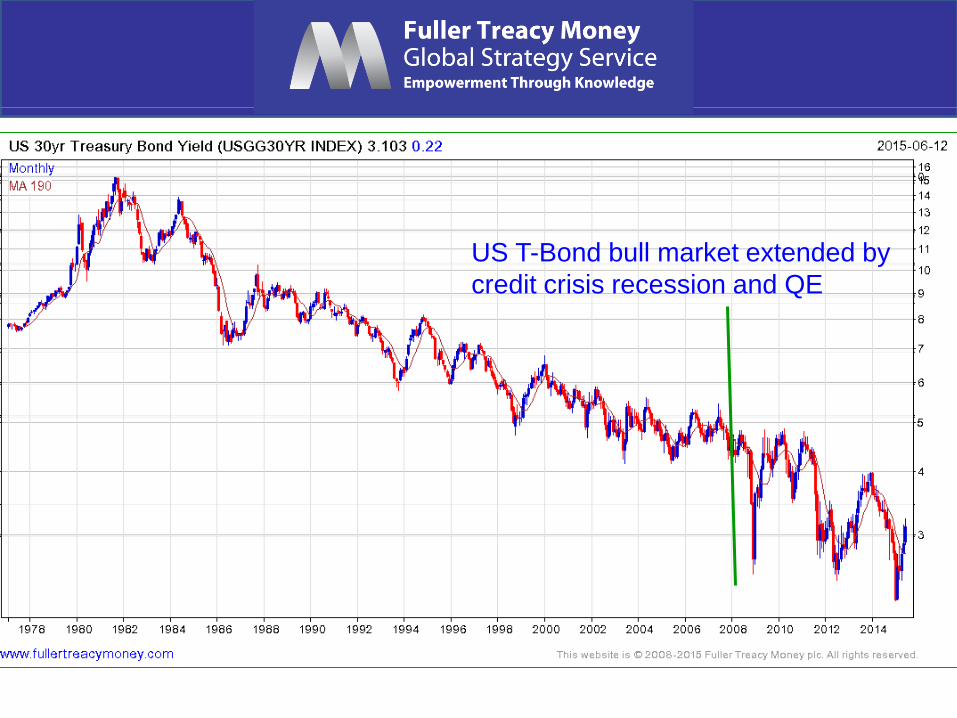
US T-Bond bull market extended by
credit crisis recession and QE

10-Yr T-Bond over last 10 years
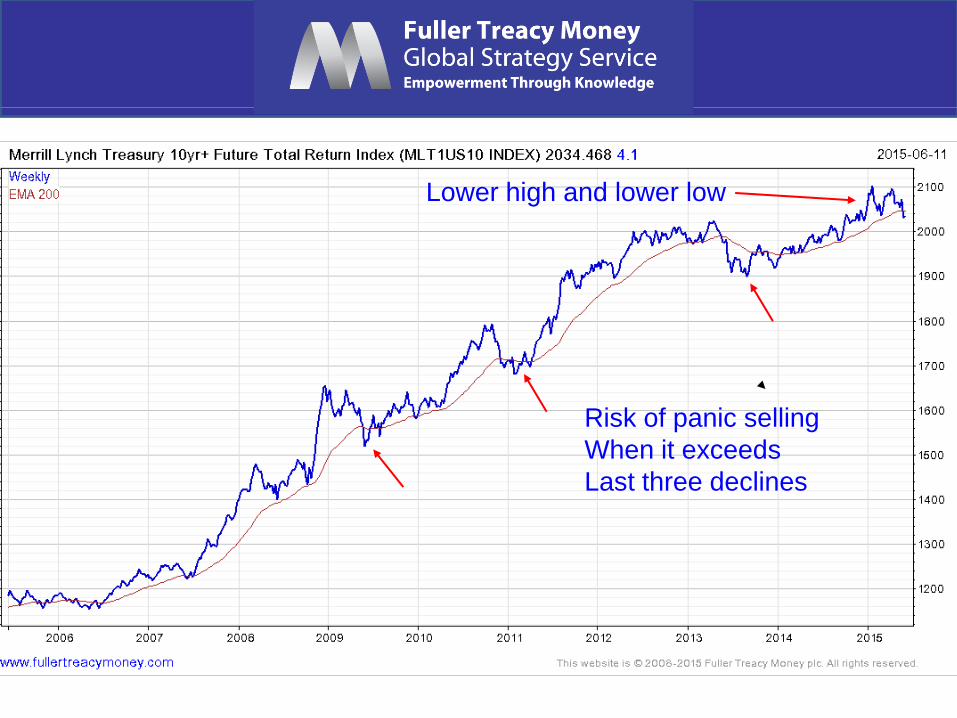
Lower high and lower low
Risk of panic selling
When it exceeds
Last three declines
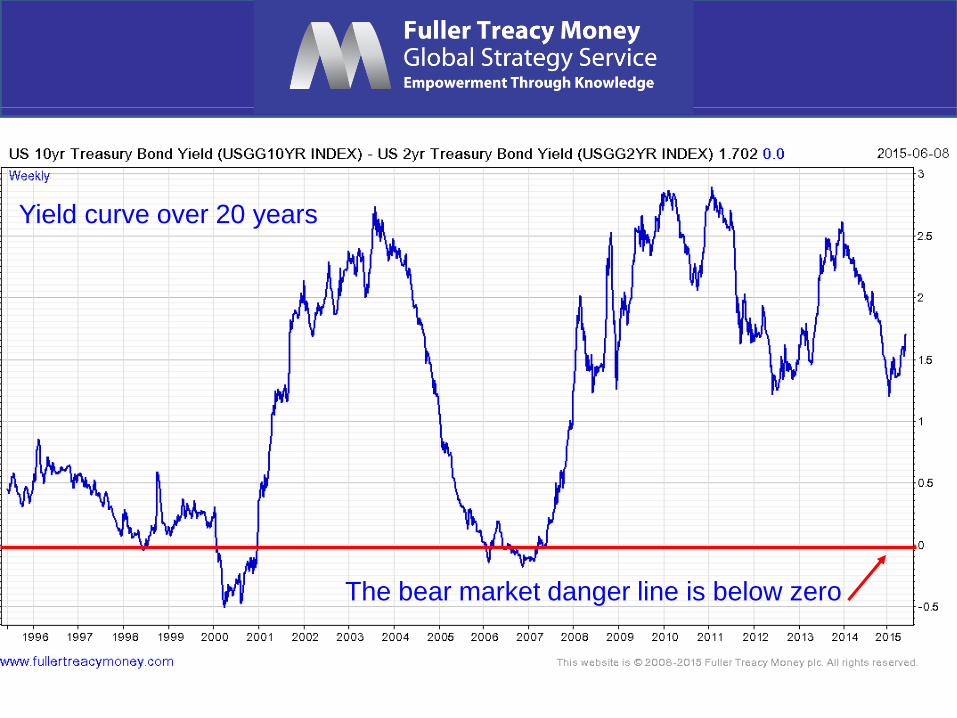
The bear market danger line is below zero
Yield curve over 20 years

While the inverted yield curve does predict bear
markets, the lead time can be a problem, as seen with
the 2006-2007 signals.
Yield Curve over 10 years

Europe
European stock markets have corrected the previous
overbought condition and are currently oversold.
However, the ‘Grexit’ threat needs to be removed by
an acceptable agreement between Greece and its three
creditors: the International Monetary Fund, the
European Central Bank and the European Commission,
before Mario Draghi’s €60bn per month QE programme
produces another strong rally. Actual ‘Grexit’ would
temporarily deepen the correction.
Seasonal factors are less favourable from May through
October.
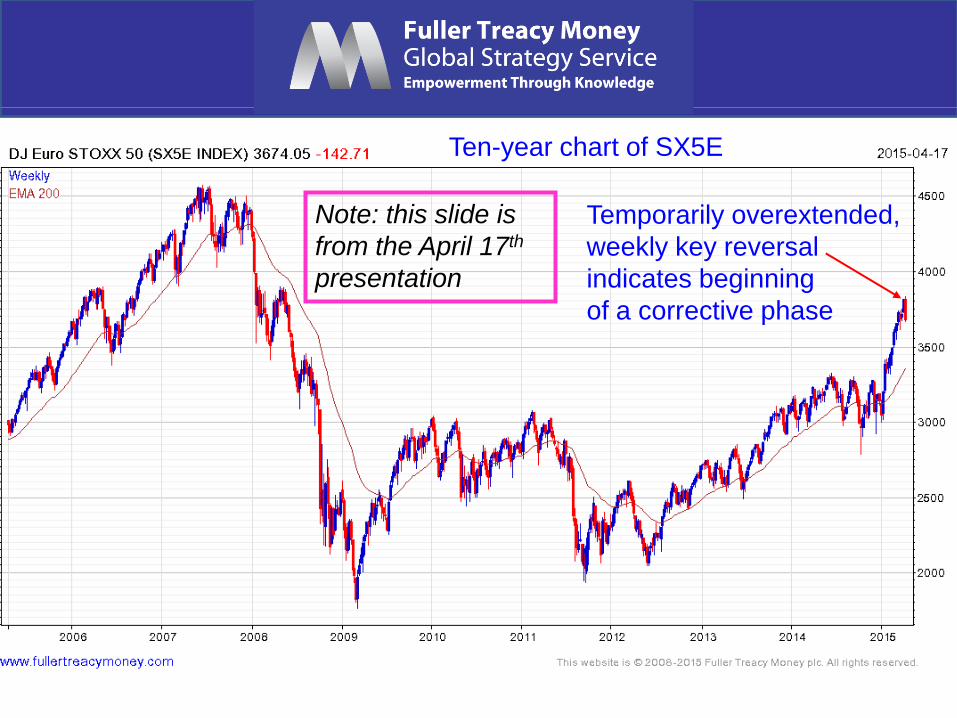
Temporarily overextended,
weekly key reversal
indicates beginning
of a corrective phase
Ten-year chart of SX5E
Note: this slide is
from the April 17th
presentation
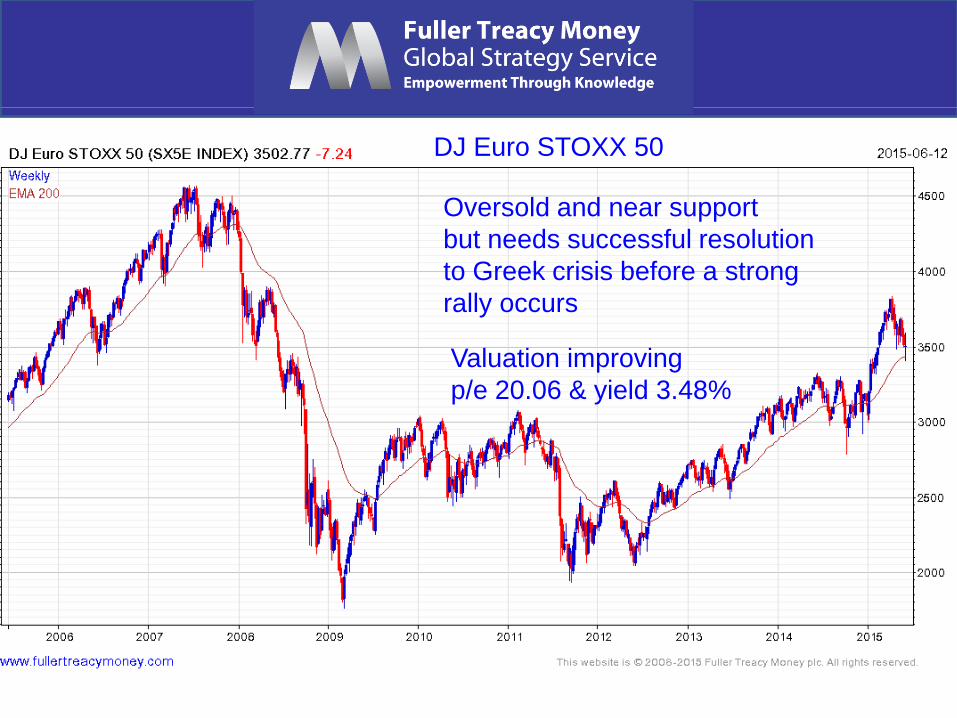
Oversold and near support
but needs successful resolution
to Greek crisis before a strong
rally occurs
Valuation improving
p/e 20.06 & yield 3.48%
DJ Euro STOXX 50
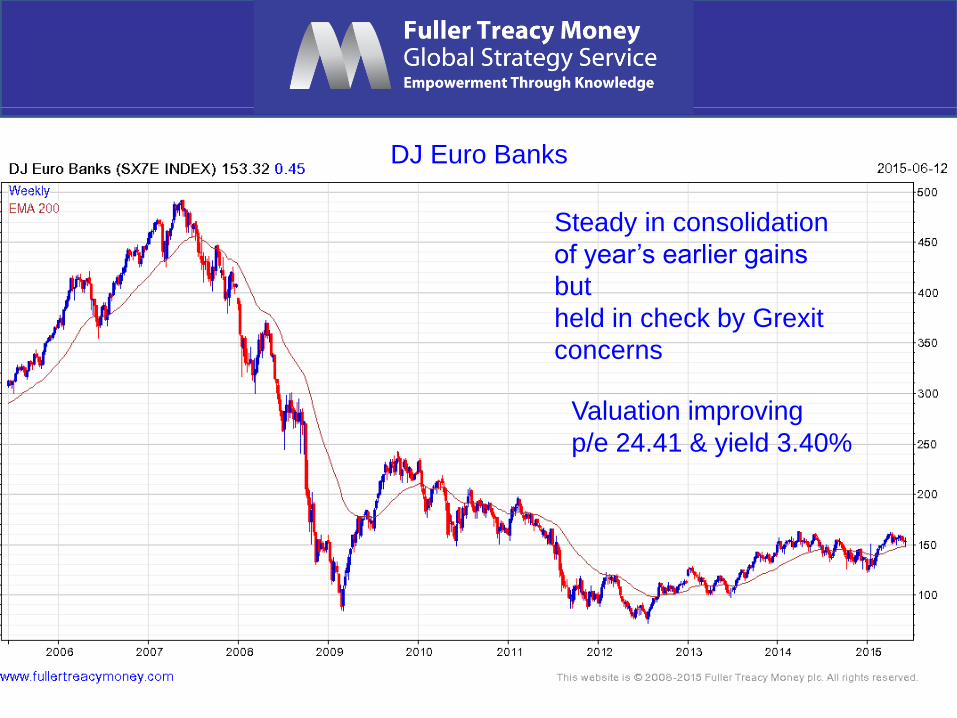
Steady in consolidation
of year’s earlier gains
but
held in check by Grexit
concerns
Valuation improving
p/e 24.41 & yield 3.40%
DJ Euro Banks
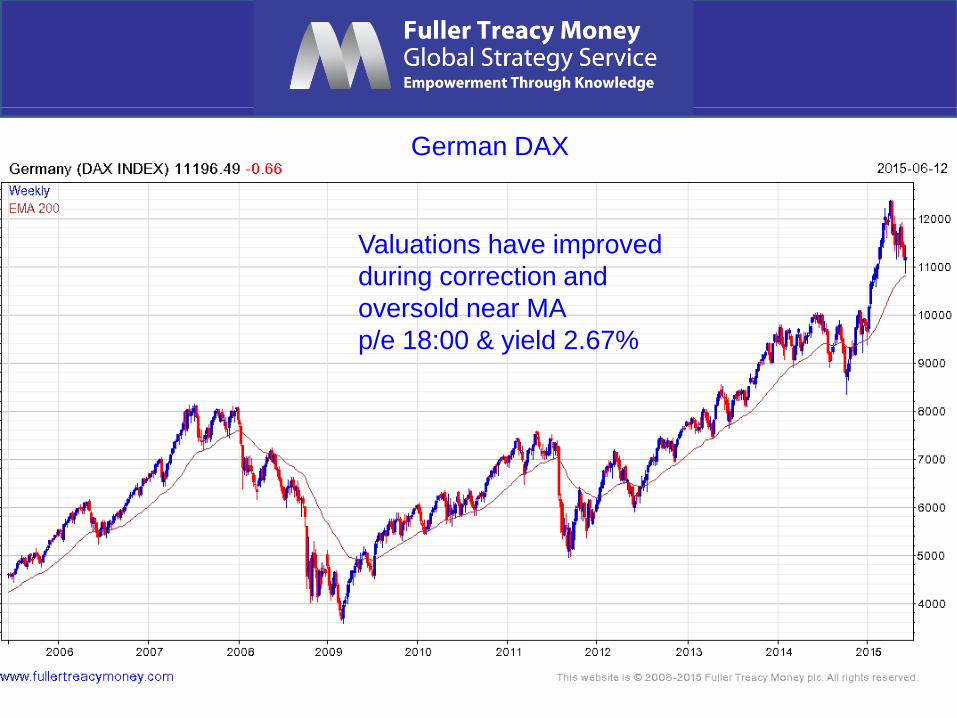
Valuations have improved
during correction and
oversold near MA
p/e 18:00 & yield 2.67%
German DAX

Remember this concern?

Valuations have improved
during correction
p/e 21.31 & yield 3.84%
Now we can worry about the
EU Referendum
UK FTSE 100
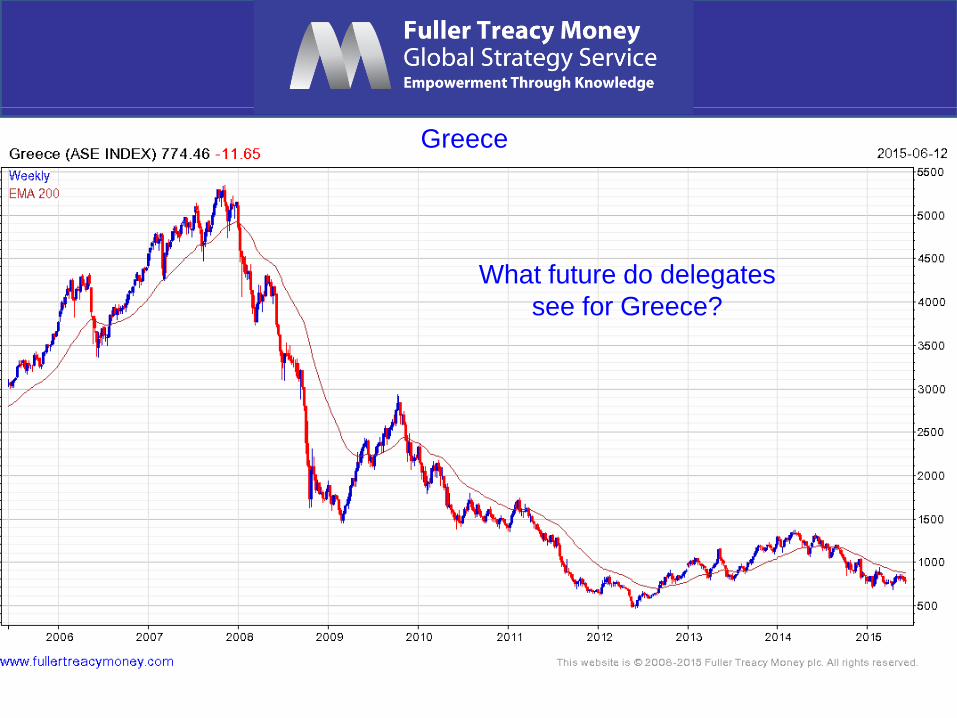
Greece
What future do delegates
see for Greece?

Is this
Greece’s
Future
Outside the
Eurozone?

USA
• Pre-Presidential Election year usually ends on a bullish note
• However, valuations are now on the higher side of average
• The US stock market is way overdue a 10% plus correction
• The US Dollar’s sharp rise since June 2014 is a headwind
• Fracking slowdown and cold winter slowed GDP growth
• Bearish forecasts continue to abound - contrary indicator?
• Pre-Fed rate hike jitters but this should not be a problem
• US Election result in 2016 should be bullish
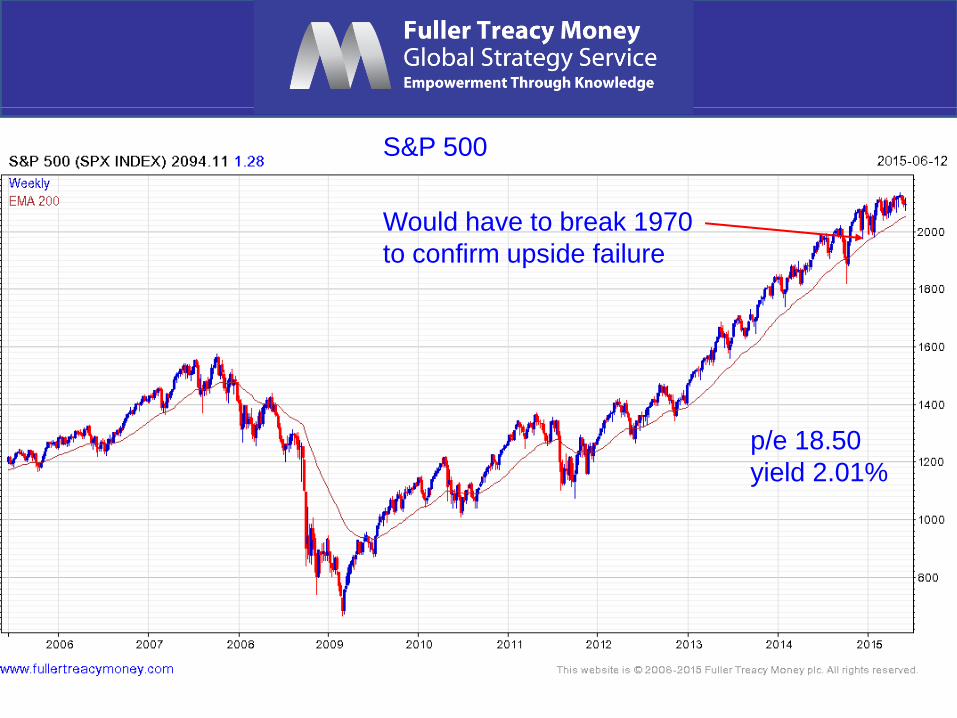
Would have to break 1970
to confirm upside failure
p/e 18.50
yield 2.01%
S&P 500

Tech-led Nasdaq Composite is not
cheap (p/e 30.16 & yield 1.21%)
but still consistent near
psychological 5000 level
Would have to
close beneath
4500 to indicate
significant technical
deterioration
Nasdaq Composite
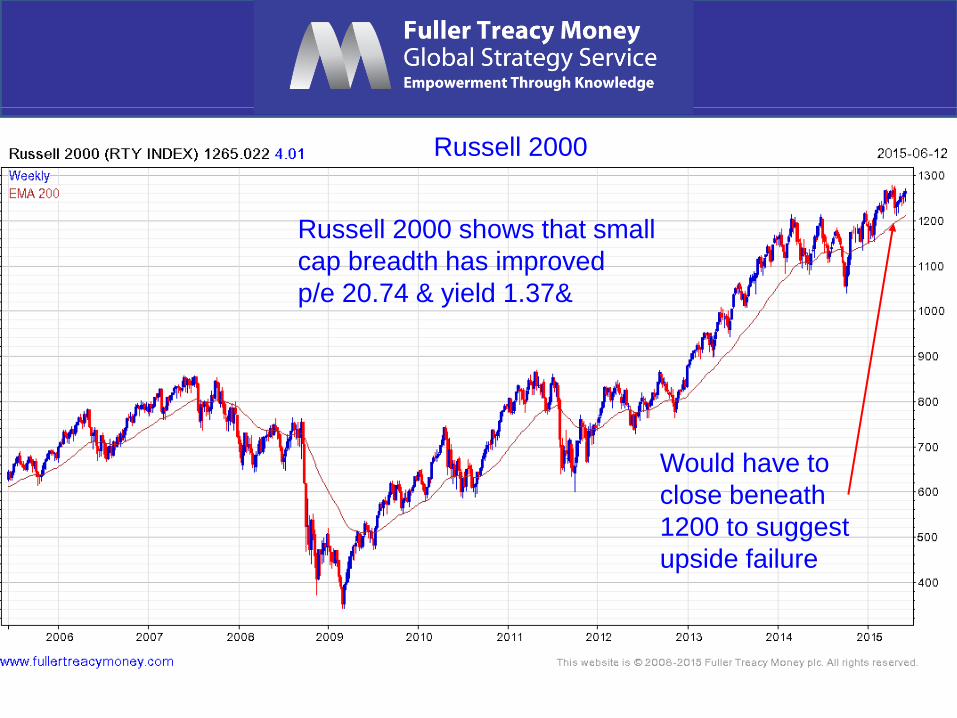
Russell 2000
Russell 2000 shows that small
cap breadth has improved
p/e 20.74 & yield 1.37&
Would have to
close beneath
1200 to suggest
upside failure

Transport Average
TRAN shows a loss of upside momentum and
further pattern deterioration – needs rally above
9000, at minimum, to reduce risk
p/e 17.27
yield 1.31%

Utilities
UTIL has seen further pattern deterioration
and needs a rally back above 600, at
minimum, to indicate that demand is
regaining the upper hand
p/e 16.06
yield 3.61%

Biotech Index
Near higher side of range following
overextension - some loss of momentum
and bubbly – needs new closing high to
reaffirm uptrend
p/e 87.20
yield 0.22%
Wall Street’s top performing sector
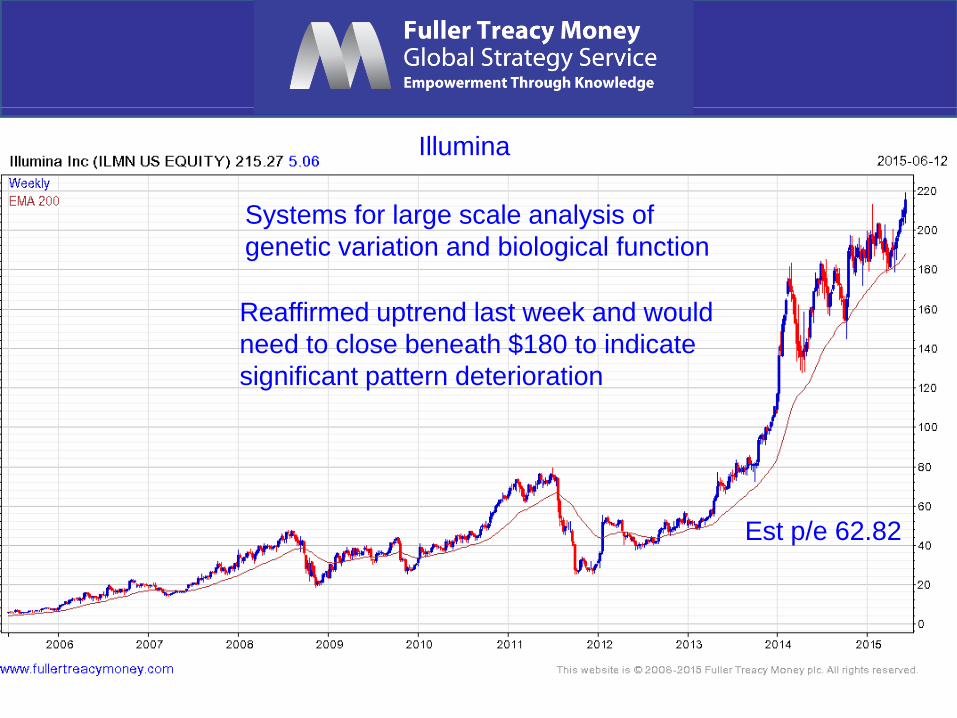
Illumina
Systems for large scale analysis of
genetic variation and biological function
Reaffirmed uptrend last week and would
need to close beneath $180 to indicate
significant pattern deterioration
Est p/e 62.82

Gilead Sciences
Discovers, develops, and commercialises
therapeutics to advance the care of patients
from life-threatening diseases
Reaffirmed uptrend last week, would
need close beneath $100 to indicate
significant pattern deterioration
Est p/e 10.92
Gross yield 1.46%
Cash yield 0.43%

Celgene
Discovery and development of therapies designed
to treat cancer and immune-inflammatory diseases
Loss of momentum and testing MA, need $120, at
minimum, to signal renewed demand
Est p/e 23.40

Amgen
Human therapeutics for grievous illnesses
based on cellular and molecular biology
Loss of momentum in pullback to MA, needs
close above $170 to reaffirm uptrend
Est p/e 16.31
Ind gross yield 2.02%
Cash 0.79%

Biogen
Neurology, oncology, and immunology for
multiple sclerosis, non-Hodgkin’s lymphoma,
rheumatoid arthritis, Crohn’s disease and
psoriasis
Pullback to MA following overextension, needs
at least $410 to indicate renewed demand
Est ple 23.28
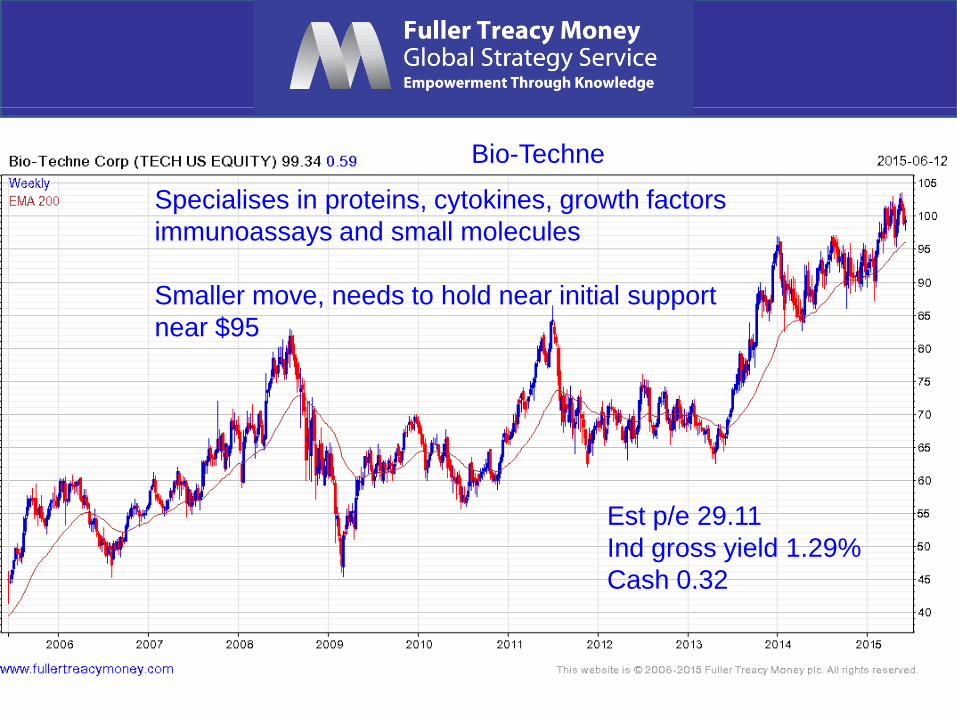
Bio-Techne
Specialises in proteins, cytokines, growth factors
immunoassays and small molecules
Smaller move, needs to hold near initial support
near $95
Est p/e 29.11
Ind gross yield 1.29%
Cash 0.32
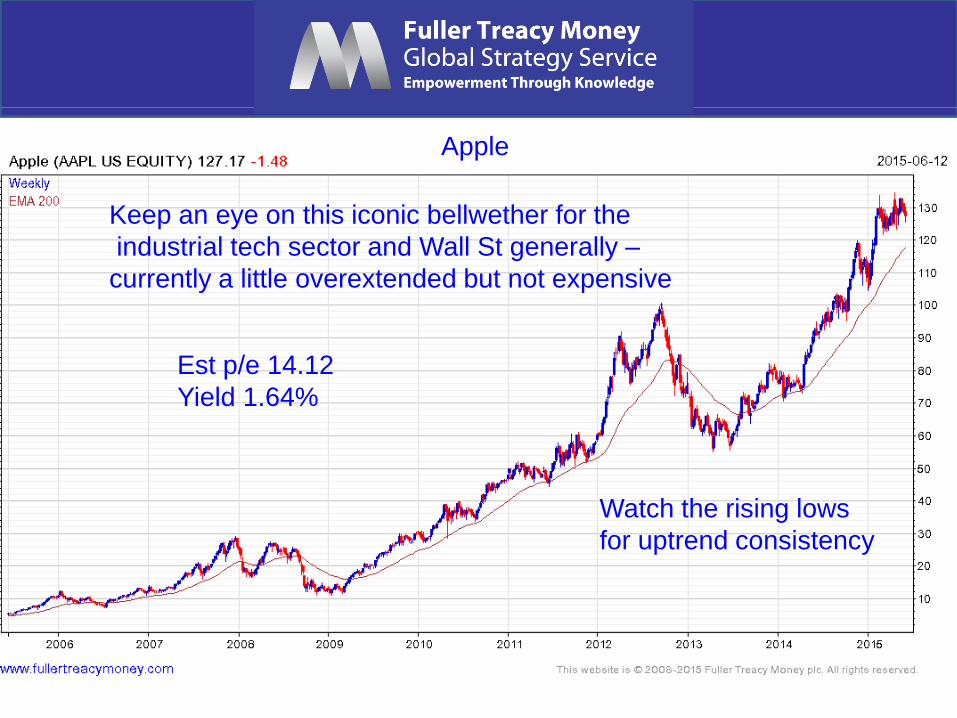
Apple
Keep an eye on this iconic bellwether for the
industrial tech sector and Wall St generally –
currently a little overextended but not expensive
Est p/e 14.12
Yield 1.64%
Watch the rising lows
for uptrend consistency

OEX Volatility Index (VIX)
So far, not affected
by ‘Grexit’

Shinzo Abe and the BoJ
have the right policies
for Japan’s economic recovery
and a long-term bull market
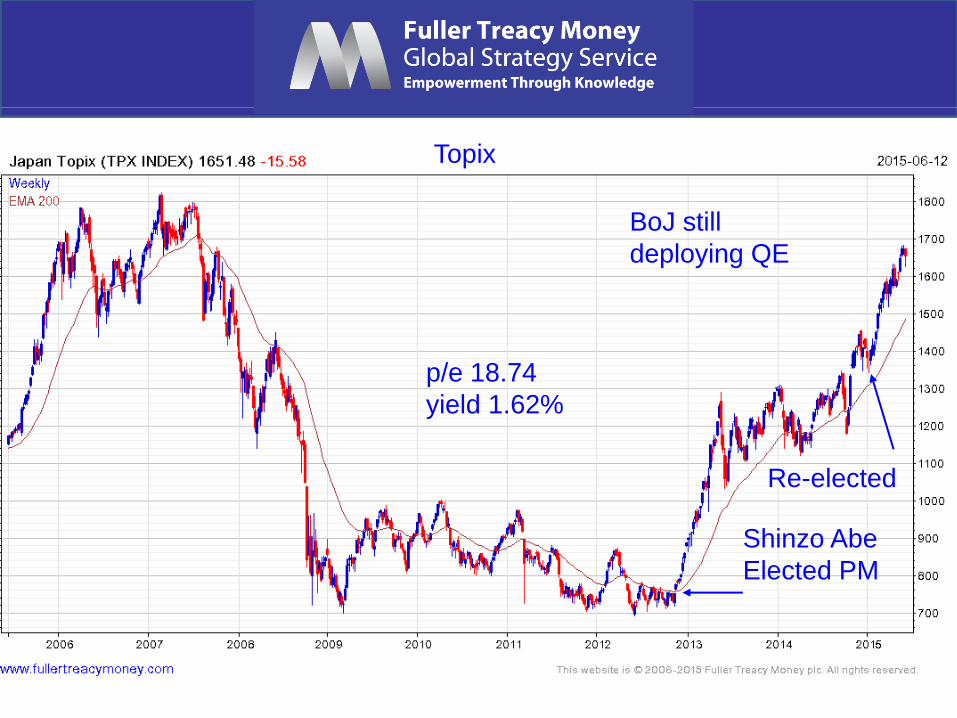
Topix
BoJ still
deploying QE
Shinzo Abe
Elected PM
Re-elected
p/e 18.74
yield 1.62%
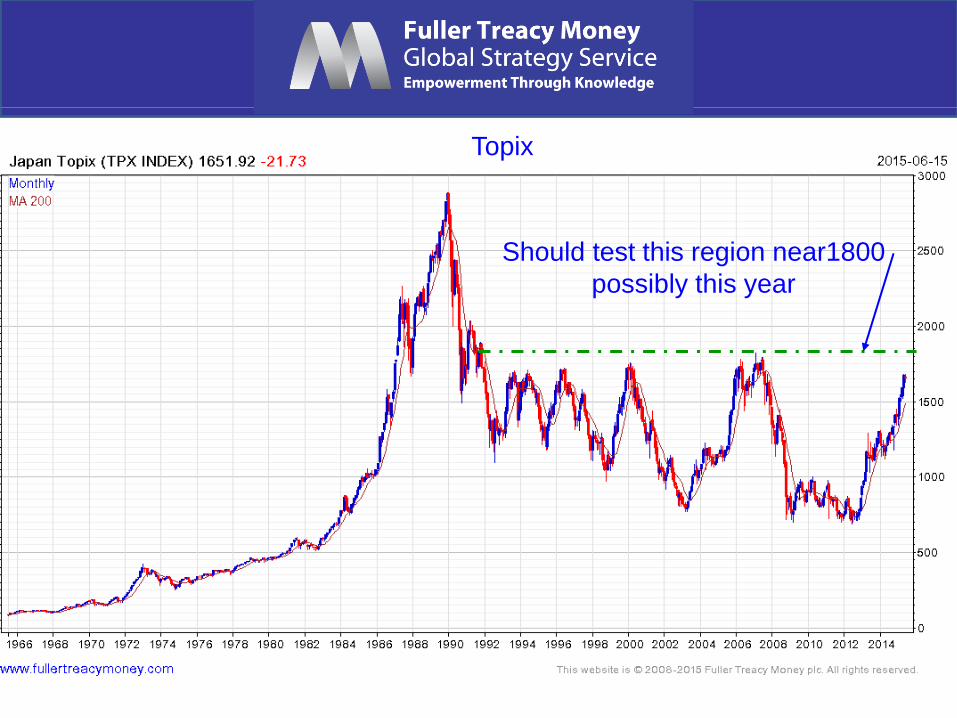
Topix
Should test this region near1800
possibly this year

Topix 2nd Section
Topix 2nd Section
often leads
TSE2
p/e 17.08
yield 1.38%

Fanuc
A share for this era
Fanuc leading Japan’s Indices
est p/e 25.96
est 12m yield 2.43%

Still a favourite of mine
over the next few years but
a lengthy consolidation of
earlier gains is underway
Loss of uptrend consistency
But back in a buying range –
alternatively after break back
above 28000 signals
renewed demand
Monsoon
concerns
India Mumbai Sensex
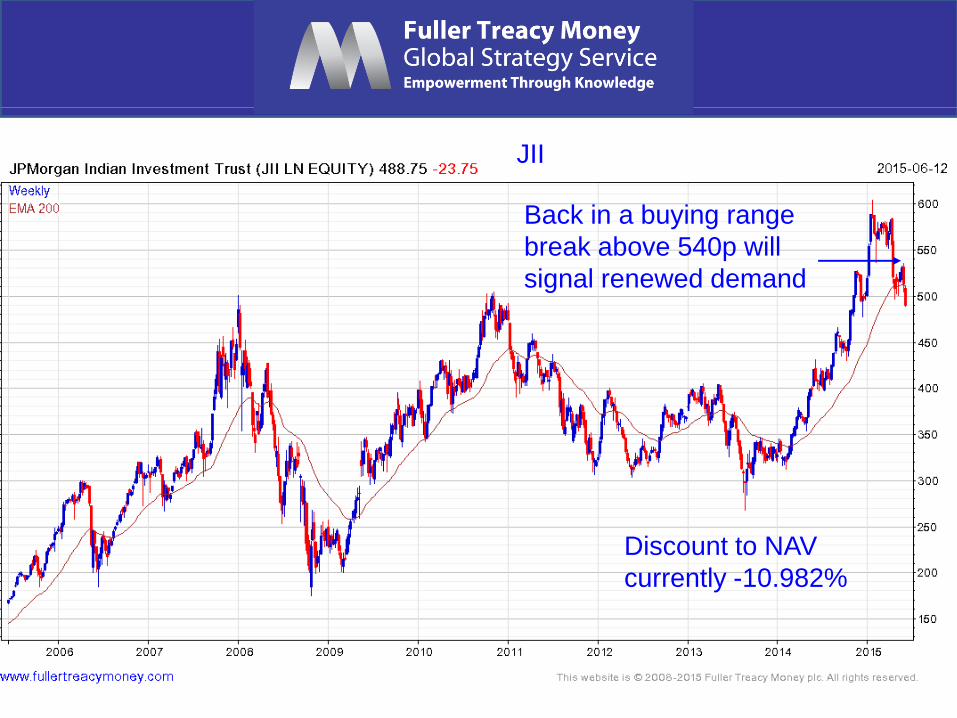
JII
Back in a buying range
break above 540p will
signal renewed demand
Discount to NAV
currently -10.982%

SHASHR
Susceptible to a lengthy
corrective phase
p/e 25.22
yield 1.32%

Hong Kong HSI
Consolidating upside breakout
– probable buying range
p/e 11.16
yield 3.07
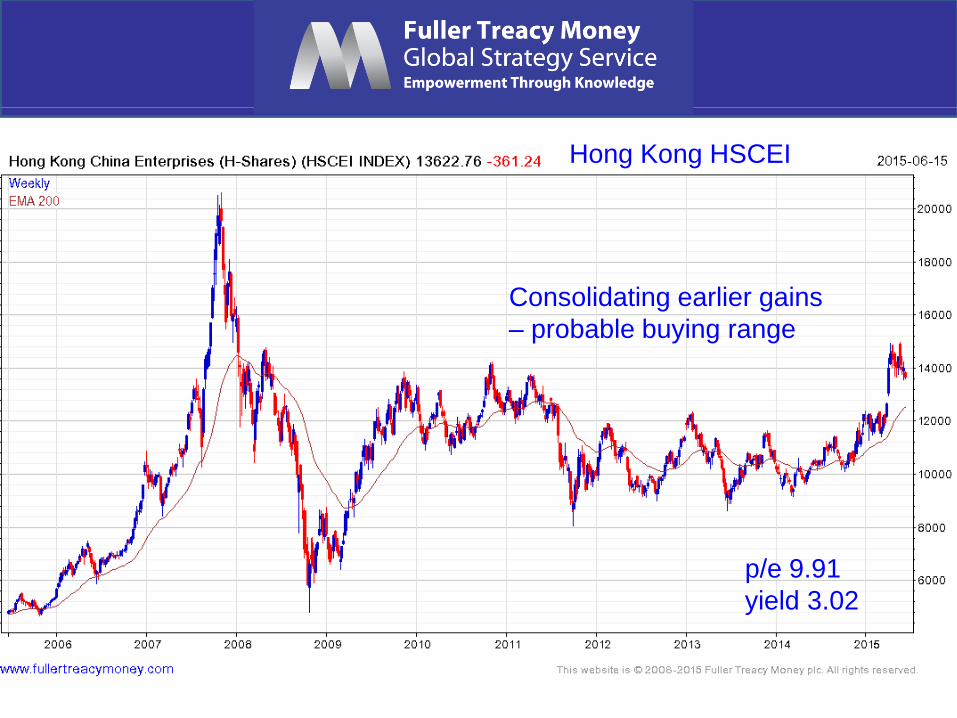
Hong Kong HSCEI
Consolidating earlier gains
– probable buying range
p/e 9.91
yield 3.02

Dollar Index
A very lengthy consolidation
phase, triggered by probable
Fed intervention, following first stage
of DXY’s secular bull market

Many thanks for your interest! Any questions?
Please visit our site:
www.fullertreacymoney.com


Technical warning signs to watch for among indices
• Trend acceleration relative to 200-day moving averages
• Declining market breadth (fewer shares rising)
• Failed upside breakouts from trading ranges
• Loss of uptrend consistency characteristics
• Churning price action relative to recent trading ranges
• Breaks of 200-day moving averages
• Broadening patterns relative the last several trading ranges
• 200-day moving averages turn downwards
• Resistance is encountered beneath declining 200-day MAs
• Previous rising lows are replaced by lower rally highs
• Indices fall faster than they rose to their highs

● My view: Much of today’s deflation is largely positive,
at least for corporations, because it is caused by
technological innovation. For instance, better
technology enables companies to produce improved
products, at lower prices, in greater volume, while
increasing profits due to increased sales.
● Destructive deflation is generally described as a
vicious cycle of falling prices, wages and output. It is
particularly bad for indebted governments, corporations
and people who lose jobs or scope for salary increases.
Deflation?
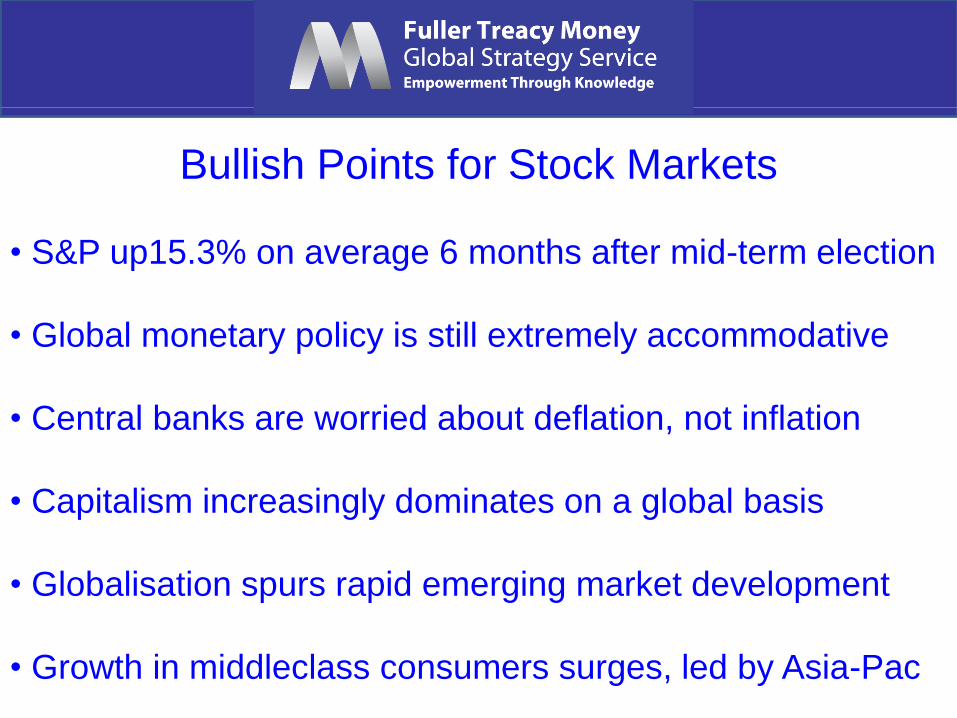
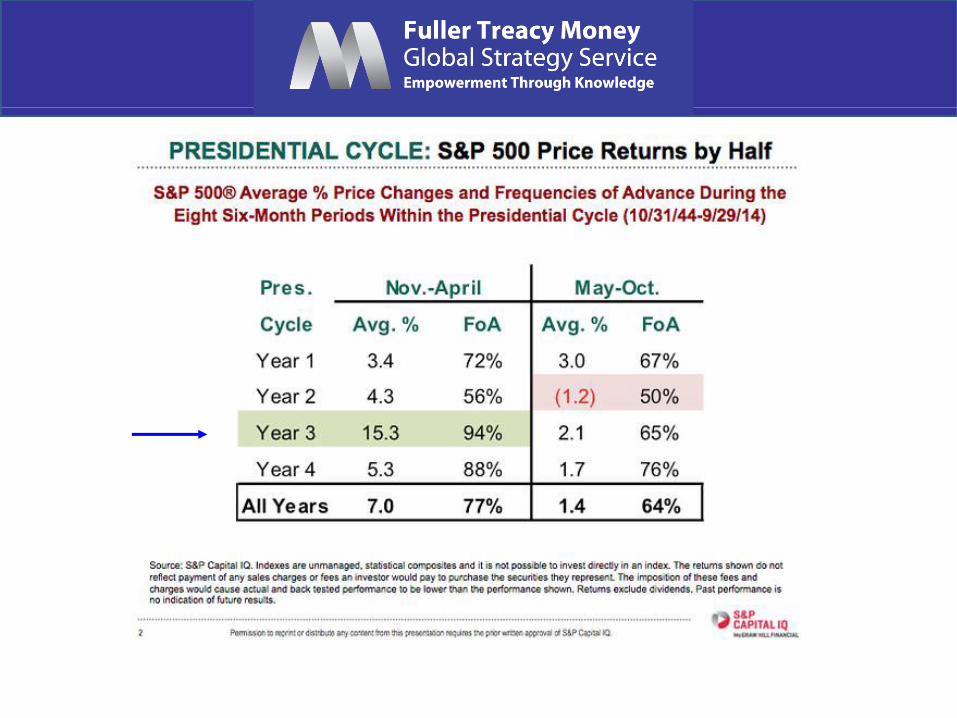
Bullish Points for Stock Markets
• S&P up15.3% on average 6 months after mid-term election
• Global monetary policy is still extremely accommodative
• Central banks are worried about deflation, not inflation
• Capitalism increasingly dominates on a global basis
• Globalisation spurs rapid emerging market development
• Growth in middleclass consumers surges, led by Asia-Pac
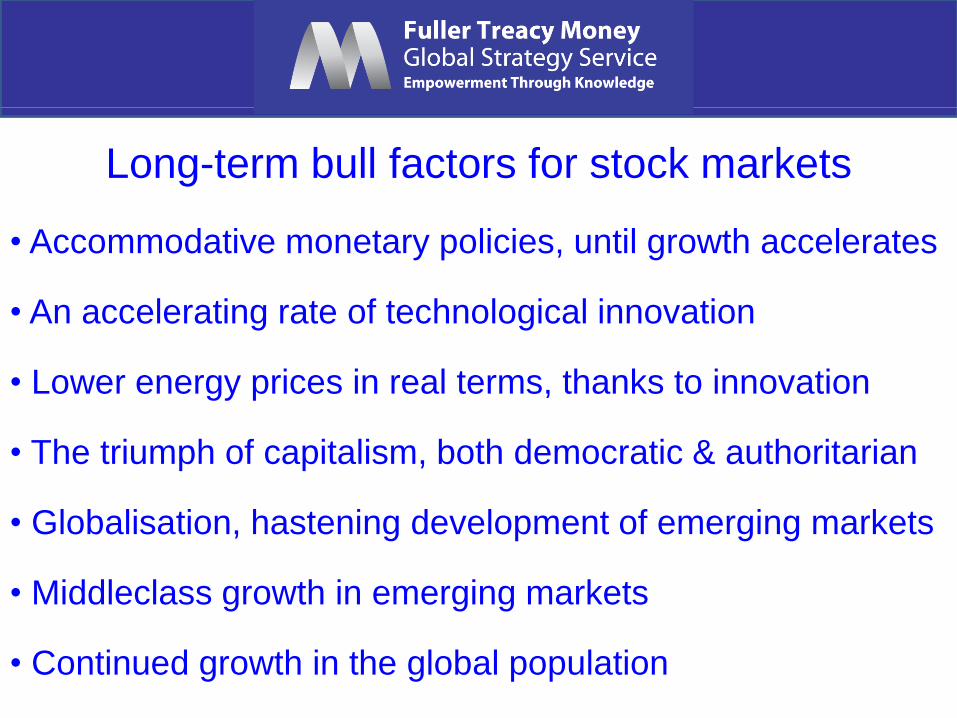
Long-term bull factors for stock markets
• Accommodative monetary policies, until growth accelerates
• An accelerating rate of technological innovation
• Lower energy prices in real terms, thanks to innovation
• The triumph of capitalism, both democratic & authoritarian
• Globalisation, hastening development of emerging markets
• Middleclass growth in emerging markets
• Continued growth in the global population
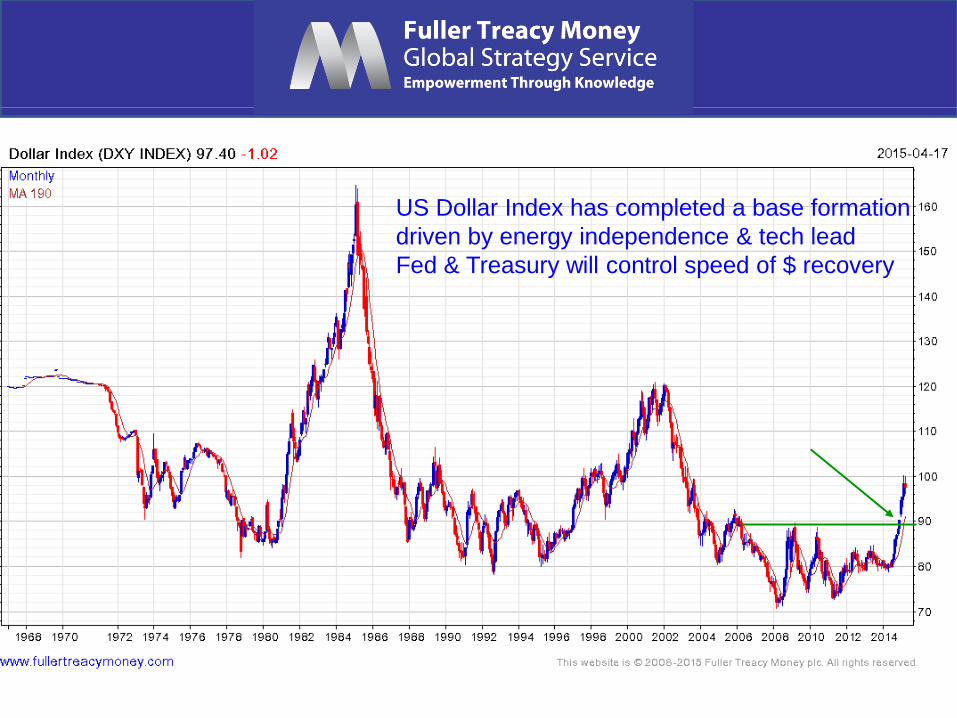
US Dollar Index has completed a base formation
driven by energy independence & tech lead
Fed & Treasury will control speed of $ recovery
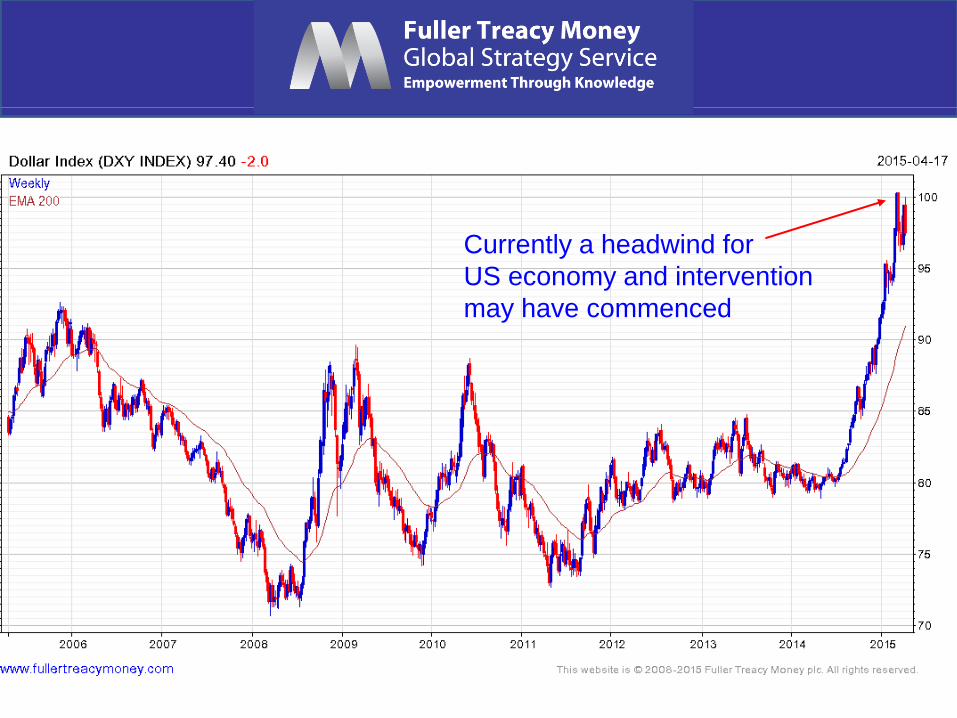
Currently a headwind for
US economy and intervention
may have commenced
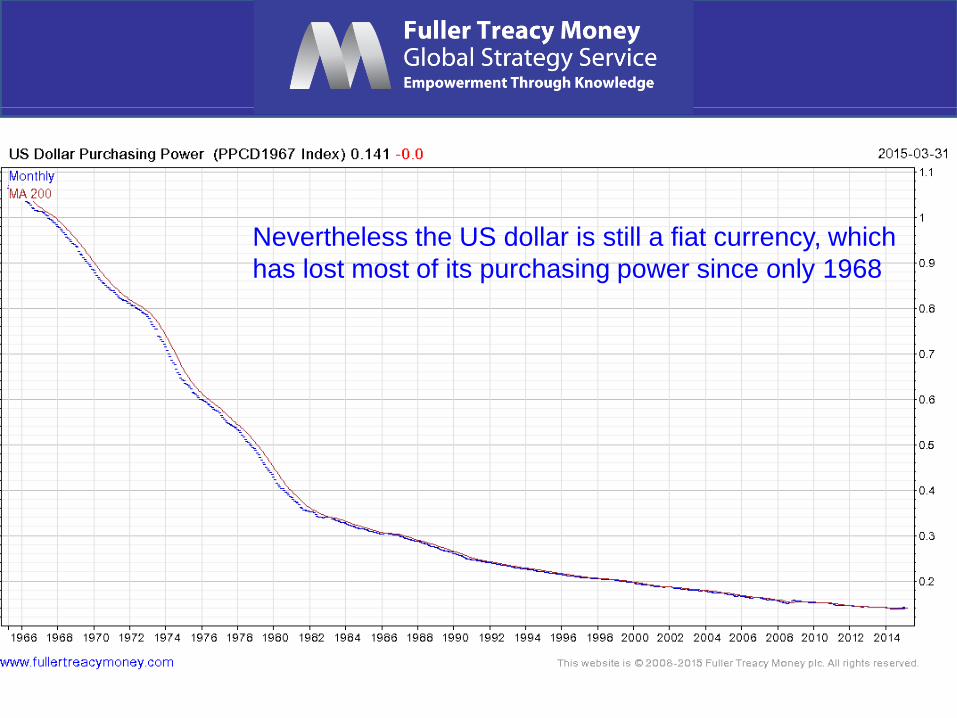
Nevertheless the US dollar is still a fiat currency, which
has lost most of its purchasing power since only 1968

Gold is hard money, albeit with
a fluctuating price, just like
anything else which can be
bought or sold.
1. Traders mostly short
2. ETF long holds of gold still
liquidating
3. Indians & Chinese buying
4. Testing range lows
5. Gold needs a weaker Dollar
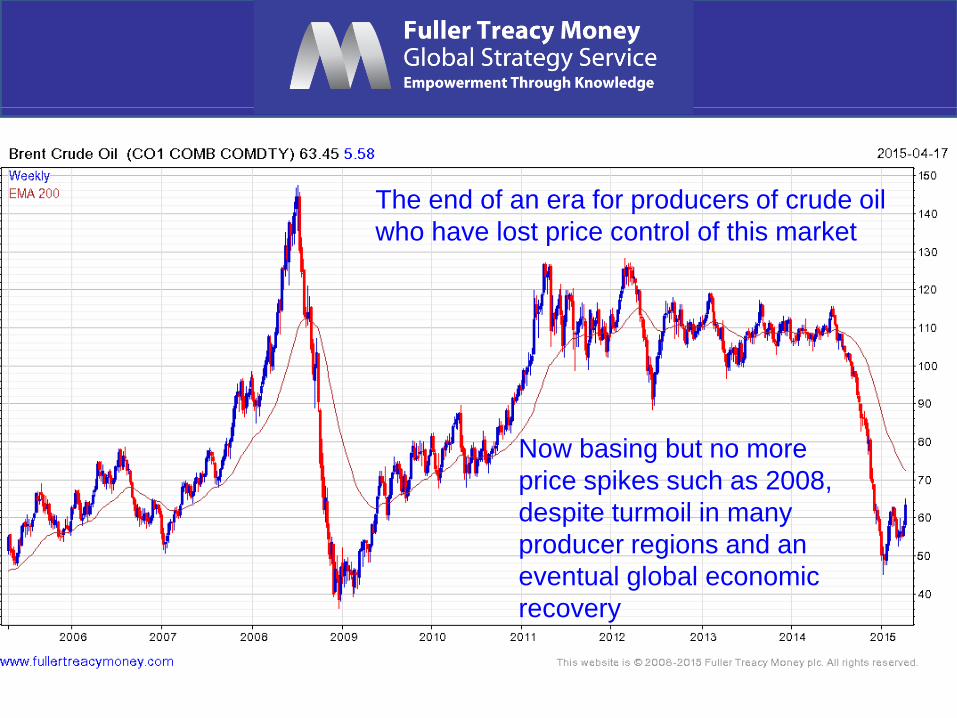
The end of an era for producers of crude oil
who have lost price control of this market
Now basing but no more
price spikes such as 2008,
despite turmoil in many
producer regions and an
eventual global economic
recovery

Gold remains
out of favour
with Western
Investors who
are mainly in
stocks & bonds

Is this what
a bear market
feels like?
We are not there yet;
in Wall Street terms
this cyclist is about to
resume climbing the
hill, exercising his pet
bear in the process