Embed Size (px)
Citation preview

© 2016 CoreLogic — Proprietary. This material may not be reproduced in any form without express written permission.i
| The MarketPulse g December 2016 g Volume 5, Issue 12
The MarketPulse
DECEMBER 2016
© 2016 CoreLogic — Proprietary. This material may not be reproduced in any form without express written permission.ii
Table of Contents | The MarketPulse December 2016 Volume 5, Issue 12
Table of Contents
Peering into 2017: The Outlook for U.S. Housing and Mortgage Markets ....................................................................................................1
Home Prices Projected Up 5%, Rent Up 3%, and Purchase and HELOC Originations Up
Collateral Issues Are Third Most-Likely Cause of Mortgage Loan Denial ......................................................................................................................... 2
About 10–13 Percent of Appraisals are Below Pre-Closing Contract Price
Earthquake Risk: Spotlight on the Pacifi c Northwest ....................................4
The Triple Threat of the Cascadia subduction zone
FHA Reforms Bringing New Risks as Well as Rewards ................................. 6
Easing restrictions should drive increased volume, but spot loans will challenge insurance fund stability
In the News .............................................................................................................................................................. 8
Time Series — National Foreclosure Overview October 2016 ......................................................... 8
Home Price Index State-Level Detail — Combined Single Family Including Distressed October 2016 ........................................................................................................................................................... 8
Charts & Graphs ..................................................................................................................................................... 9
Variable Descriptions .......................................................................................................................................... 11
Housing Statistics
October 2016
HPI® YOY Chg 6.7%
HPI YOY Chg XD 6.1%
NegEq Share (Q3 2016) 6.3%
Cash Sales Share
(as of August 2016)
31.1%
Distressed Sales
(as of August 2016)
7.3%
The MarketPulseVolume 5, Issue 12December 2016Data as of October 2016
News Media Contact
Alyson [email protected]
949.214.1414 (offi ce)
© 2016 CoreLogic — Proprietary. This material may not be reproduced in any form without express written permission. 1
The MarketPulse g December 2016 g Volume 5 Issue 12 | Articles
Peering into 2017: The Outlook for U.S. Housing and Mortgage MarketsHome Prices Projected Up 5%, Rent Up 3%, and Purchase and HELOC Originations Up
By Frank E. Nothaft
Economic growth will be a primary factor
affecting the housing market in 2017. The
latest projections show a consensus that
the economy will grow between 2 and 2¼
percent next year.1 With this as a backdrop,
here are five features to look for in next
year’s housing market.
First, mortgage rates will be higher, with
fixed-rates averaging just over 4 percent
for 2017, about one-half percentage point
higher than in 2016 for both single-family
and multifamily loans. The Federal Reserve
is widely anticipated to hike its federal funds
target by one-quarter of a percentage point
this month, with additional increases during
2017. This will increase the cost of loans tied
to short-term rates, such as home equity
lines of credit, also known as HELOCs.
Second, vacancy rates will likely remain
relatively low in the rental market and
decline in the homeowner market. The
low level of single-family building means
that for-sale inventories will remain
lean in many markets.
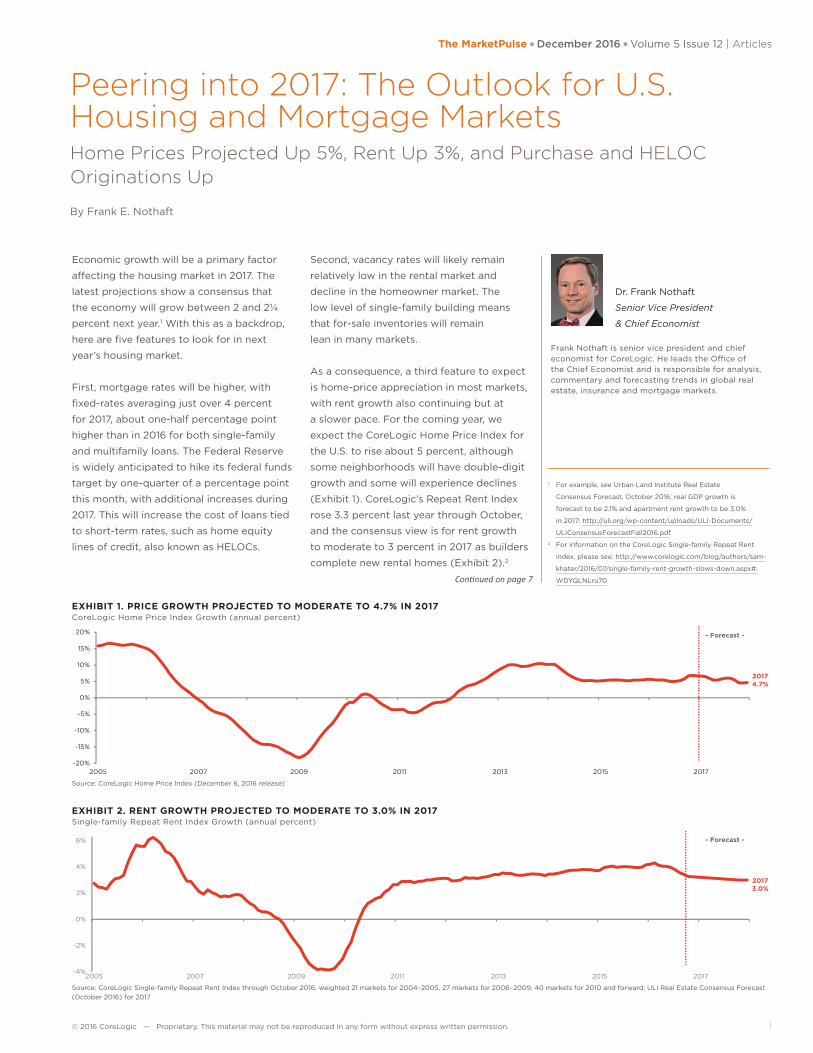
As a consequence, a third feature to expect
is home-price appreciation in most markets,
with rent growth also continuing but at
a slower pace. For the coming year, we
expect the CoreLogic Home Price Index for
the U.S. to rise about 5 percent, although
some neighborhoods will have double-digit
growth and some will experience declines
(Exhibit 1). CoreLogic’s Repeat Rent Index
rose 3.3 percent last year through October,
and the consensus view is for rent growth
to moderate to 3 percent in 2017 as builders
complete new rental homes (Exhibit 2).2
Dr. Frank Nothaft
Senior Vice President
& Chief Economist
Frank Nothaft is senior vice president and chief economist for CoreLogic. He leads the Office of the Chief Economist and is responsible for analysis, commentary and forecasting trends in global real estate, insurance and mortgage markets.
1 For example, see Urban Land Institute Real Estate
Consensus Forecast, October 2016; real GDP growth is
forecast to be 2.1% and apartment rent growth to be 3.0%
in 2017: http://uli.org/wp-content/uploads/ULI-Documents/
ULIConsensusForecastFall2016.pdf2 For information on the CoreLogic Single-family Repeat Rent
index, please see: http://www.corelogic.com/blog/authors/sam-
khater/2016/07/single-family-rent-growth-slows-down.aspx#.
WDYQLNLru70
EXHIBIT 1. PRICE GROWTH PROJECTED TO MODERATE TO 4.7% IN 2017CoreLogic Home Price Index Growth (annual percent)
-20%
-15%
-10%
-5%
0%
5%
10%
15%
20%
2005 2007 2009 2011 2013 2015 2017
nothaft: exhibit 1
- Forecast -
20174.7%
Source: CoreLogic Home Price Index (December 6, 2016 release)
EXHIBIT 2. RENT GROWTH PROJECTED TO MODERATE TO 3.0% IN 2017Single-family Repeat Rent Index Growth (annual percent)
-4%
-2%
0%
2%
4%
6%
2005 2007 2009 2011 2013 2015 2017
nothaft: exhibit 2
- Forecast -
20173.0%
Source: CoreLogic Single-family Repeat Rent Index through October 2016, weighted 21 markets for 2004–2005, 27 markets for 2006–2009, 40 markets for 2010 and forward; ULI Real Estate Consensus Forecast (October 2016) for 2017
Continued on page 7
© 2016 CoreLogic — Proprietary. This material may not be reproduced in any form without express written permission.2
Articles | The MarketPulse g December 2016 g Volume 5, Issue 12
Collateral Issues Are Third Most-Likely Cause of Mortgage Loan DenialAbout 10–13 Percent of Appraisals are Below Pre-Closing Contract Price
By Yanling Mayer
According to newly released 2015 Home
Mortgage Disclosure Act (HMDA) data,
collateral was the third most-frequently
cited reason for denials of mortgage loan
applications, or 13.7 percent on first-lien
purchase mortgages for one-to-four family,
owner-occupied homes—trailing distantly
behind denials citing applicant’s debt-to-
income ratio (23.4 percent) or credit history
(20.4 percent).1 The collateral-related denial
rate was up slightly from 12.9 percent in
2014. Lenders denied these purchase-loan
applications because the value or type of
collateral was not sufficient, presumably
because an independent, third-party
appraisal could not support the buyer’s and
seller’s agreed-upon sales price of the home
in most of these cases.
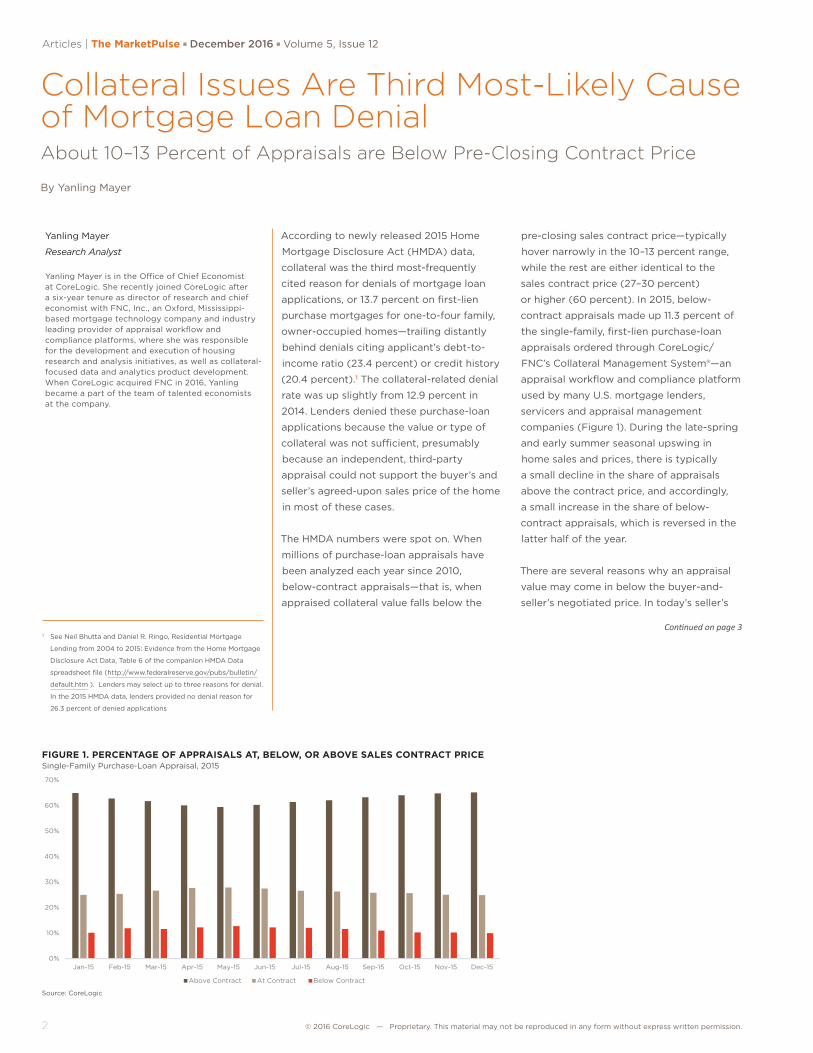
The HMDA numbers were spot on. When
millions of purchase-loan appraisals have
been analyzed each year since 2010,
below-contract appraisals—that is, when
appraised collateral value falls below the
pre-closing sales contract price—typically
hover narrowly in the 10–13 percent range,
while the rest are either identical to the
sales contract price (27–30 percent)
or higher (60 percent). In 2015, below-
contract appraisals made up 11.3 percent of
the single-family, first-lien purchase-loan
appraisals ordered through CoreLogic/
FNC’s Collateral Management System®—an
appraisal workflow and compliance platform
used by many U.S. mortgage lenders,
servicers and appraisal management
companies (Figure 1). During the late-spring
and early summer seasonal upswing in
home sales and prices, there is typically
a small decline in the share of appraisals
above the contract price, and accordingly,
a small increase in the share of below-
contract appraisals, which is reversed in the
latter half of the year.
There are several reasons why an appraisal
value may come in below the buyer-and-
seller’s negotiated price. In today’s seller’s
Continued on page 31 See Neil Bhutta and Daniel R. Ringo, Residential Mortgage
Lending from 2004 to 2015: Evidence from the Home Mortgage
Disclosure Act Data, Table 6 of the companion HMDA Data
spreadsheet file (http://www.federalreserve.gov/pubs/bulletin/
default.htm ). Lenders may select up to three reasons for denial.
In the 2015 HMDA data, lenders provided no denial reason for
26.3 percent of denied applications
Yanling Mayer
Research Analyst
Yanling Mayer is in the Office of Chief Economist at CoreLogic. She recently joined CoreLogic after a six-year tenure as director of research and chief economist with FNC, Inc., an Oxford, Mississippi-based mortgage technology company and industry leading provider of appraisal workflow and compliance platforms, where she was responsible for the development and execution of housing research and analysis initiatives, as well as collateral-focused data and analytics product development. When CoreLogic acquired FNC in 2016, Yanling became a part of the team of talented economists at the company.
FIGURE 1. PERCENTAGE OF APPRAISALS AT, BELOW, OR ABOVE SALES CONTRACT PRICESingle-Family Purchase-Loan Appraisal, 2015
0%
10%
20%
30%
40%
50%
60%
70%
Jan-15 Feb-15 Mar-15 Apr-15 May-15 Jun-15 Jul-15 Aug-15 Sep-15 Oct-15 Nov-15 Dec-15
Above Contract At Contract Below Contract
yanling: fig 1
Source: CoreLogic
© 2016 CoreLogic — Proprietary. This material may not be reproduced in any form without express written permission. 3
The MarketPulse g December 2016 g Volume 5 Issue 12 | Articles
market where homes sell quickly and
bidding wars have become commonplace
in many of the nation’s largest housing
markets during the last few years, there
is a good chance that the winning bidder
may have overpaid for the home. Similarly,
when buyers fall in love with the design or
unique custom features a home has to offer
and are more than willing to pay extra for
personal preference, appraisers may not
attach as much value to these non-standard
features as the buyers out of concern for
their broader appeal and marketability
upon future resale.
At other times, the appraisal may fall short
because home prices in the local market
area might be rising quickly but the data
appraisers rely on have not fully kept up
with the market. Although appraisers are
supposed to make “date of sale” or market
trend adjustments on past comparable
sales, it is likely that the adjustments may be
inadequate in keeping up with a fast-rising
market. Given rapid price acceleration in
many markets during 2014 to 2015, some
appraisals may have insufficiently adjusted
for market price movements.
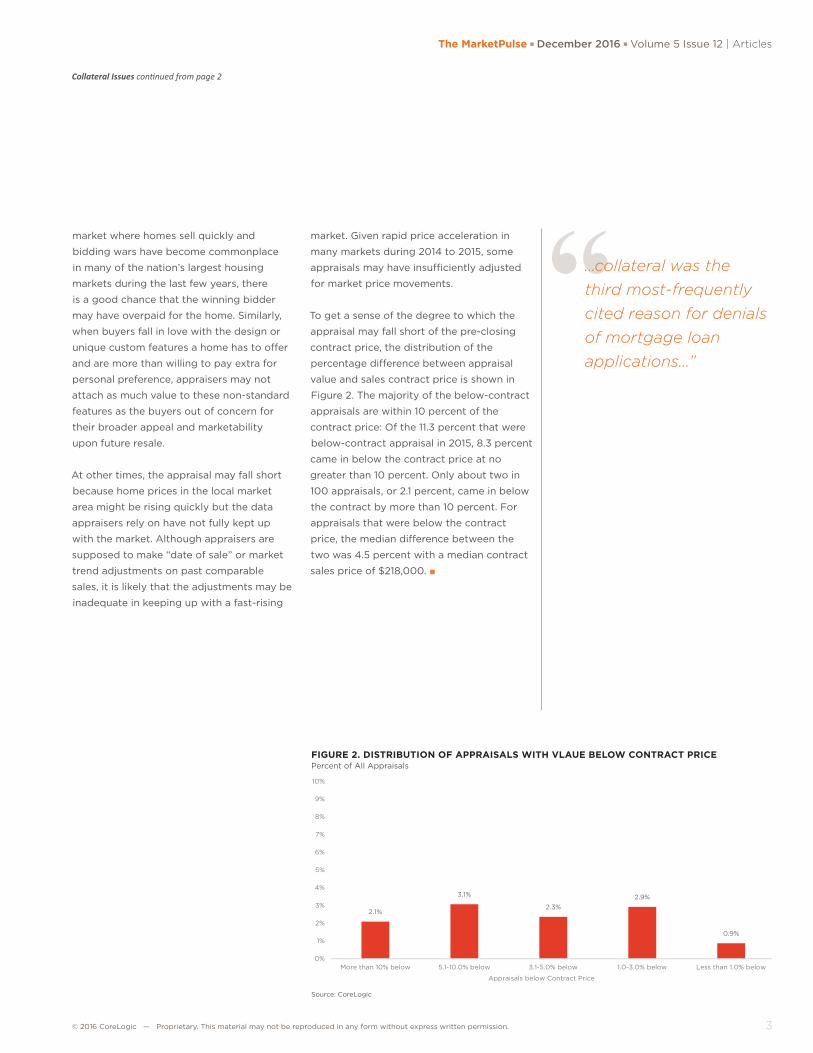
To get a sense of the degree to which the
appraisal may fall short of the pre-closing
contract price, the distribution of the
percentage difference between appraisal
value and sales contract price is shown in
Figure 2. The majority of the below-contract
appraisals are within 10 percent of the
contract price: Of the 11.3 percent that were
below-contract appraisal in 2015, 8.3 percent
came in below the contract price at no
greater than 10 percent. Only about two in
100 appraisals, or 2.1 percent, came in below
the contract by more than 10 percent. For
appraisals that were below the contract
price, the median difference between the
two was 4.5 percent with a median contract
sales price of $218,000. ■
FIGURE 2. DISTRIBUTION OF APPRAISALS WITH VLAUE BELOW CONTRACT PRICEPercent of All Appraisals
2.1%
3.1%
2.3%2.9%
0.9%
0%
1%
2%
3%
4%
5%
6%
7%
8%
9%
10%
More than 10% below 5.1-10.0% below 3.1-5.0% below 1.0-3.0% below Less than 1.0% below
Appraisals below Contract Price
yanling: fig 2
Source: CoreLogic
Collateral Issues continued from page 2
“…collateral was the third most-frequently cited reason for denials of mortgage loan applications…”
© 2016 CoreLogic — Proprietary. This material may not be reproduced in any form without express written permission.4
Articles | The MarketPulse g December 2016 g Volume 5, Issue 12
Earthquake Risk: Spotlight on the Pacific NorthwestThe Triple Threat of the Cascadia subduction zone
By Maiclaire Bolton
It was a cold, dark, wintery night in 1700
when the ground shook violently for
several minutes during one of the largest
earthquakes the world has ever experienced.
This massive magnitude 9.0 earthquake
ruptured the full length of the Cascadia
subduction zone—a 1,000-kilometer-long
off-shore fault paralleling the west coast
of North America, extending from mid-
Vancouver Island, Canada to Humboldt
County in Northern California.1,2 Just minutes
after the ground shaking subsided, a
massive tsunami inundated coastal regions.
Ancient Native American and First Nations
legend tells the story of the Thunderbird
and the Whale, which has been passed
down for three centuries, and details the
account of this great earthquake.3,4 While
this oral history describes the event’s effects
and date remarkably well, scientific evidence,
including tsunami deposits along the coast,
mud slides offshore, carbon dating of trees
in drowned forests on the coasts of the
Pacific Northwest and the Japanese record
of an “orphan tsunami” reaching the coast
of Japan, also confirm the occurrence of this
massive Cascadia event on January 26, 1700.
For centuries, the Japanese were unsure
of the origin of this tsunami since it was
neither generated from a local earthquake in
Japan nor on any other known tsunamigenic
subduction zone in the world.
It was Mount St. Helen’s volcanic eruption
in 1980 that gave seismologists additional
proof that the Cascadia subduction zone
was still active. It was believed for years
that the subduction zone was one of
the few on Earth that did not produce
massive earthquakes, but active volcanism
is indicative of active subduction. In a
subduction zone, an oceanic tectonic
plate that is created at an oceanic ridge
pushes beneath a continental plate. The
descending plate will continue to be
pulled, or subducted, under a continent
until it reaches a depth at which it begins
to melt. The melting of the plate at depth
produces magma which then ascends
through the continental plate where it is
expelled by volcanoes.5
Research has shown that these megathrust,
or giant, complete subduction-zone-
rupturing earthquakes occur along the
Cascadia subduction zone, on average,
every 500 years.⁶ A full rupture of the
fault from mid-Vancouver Island, Canada
to Northern California would be similar
to the 2011 magnitude 9.0 Tohoku-oki
Japan earthquake.7 The disaster would
be widespread, adding to response
and recovery challenges as resources
would need to be dispersed across
the entire region.8
A 2012 study by Chris Goldfinger of Oregon
State University suggests that the entire
subduction zone may not always rupture,
and that smaller—yet still catastrophic—
earthquakes are more common along the
southern end of the subduction zone with
a recurrence interval of about 240 years.9
The 2014 U.S. Geological Survey National
Seismic Hazard Maps10 incorporate this
new research and highlight an important
change because the result is a 40-percent
increase in earthquake hazard along the
southern end of the Cascadia subduction
zone, which includes offshore Oregon and
Northern California.
Understanding these megathrust
earthquakes is critical for managing
earthquake risk; however, it is important
to recognize that there are three different
types of earthquakes associated with
the Cascadia subduction zone (Figure 1),
producing a triple threat of earthquake risk
in the region. While the massive megathrust
earthquakes are the largest magnitude
events that can occur, they are also very rare.
Shallow earthquakes11—known in seismology
Continued on page 5
Maiclaire Bolton
Senior Product Manager,
Insurance and Spatial Solutions
Maiclaire Bolton is senior product manager for CoreLogic Insurance and Spatial Solutions responsible for the product management of the global suite of earthquake and geological hazard products. Maiclaire joined CoreLogic in March of 2013 and is based in Oakland, CA. Maiclaire earned a M.S. in Geophysics, specializing in earthquake seismology from the University of Victoria, and a B.S. in Geophysics from the University of Western Ontario. Prior to joining EQECAT in March of 2013, Maiclaire previously spent three years with RMS as a manger of earthquake product management for the regions of Canada, Latin America, and the Caribbean. She has also held positions at Emergency Management British Columbia, the International Seismological Centre, and the Geological Survey of Canada. She is also a Director of the British Columbia Earthquake Alliance.
1 https://earthquake.usgs.gov/earthquakes/states/
events/1700_01_26.php2 http://www.earthquakescanada.nrcan.gc.ca/historic-historique/
events/17000126-en.php3. https://www.pnsn.org/outreach/native-american-stories/
thunderbird-and-whale/thunderbird-and-whale-stories/list-of-
stories4. https://www.hakaimagazine.com/article-long/great-quake-and-
great-drowning5. http://www.geology.sdsu.edu/how_volcanoes_work/
subducvolc_page.html6. http://www.amnh.org/explore/science-bulletins/earth/
documentaries/tsunami-science-reducing-the-risk/ghosts-of-
tsunamis-past7. https://earthquake.usgs.gov/earthquakes/eqarchives/
poster/2011/20110311.php8. http://www.crew.org/sites/default/files/cascadia_subduction_
scenario_2013.pdf9. http://oregonstate.edu/ua/ncs/archives/2012/jul/13-year-
cascadia-study-complete-%E2%80%93-and-earthquake-risk-
looms-large10. http://pubs.usgs.gov/of/2014/1091/11. http://www.crew.org/sites/default/files/
CREWshallowFinalSmall.pdf12. http://www.crew.org/sites/default/files/CascDeepEQweb.pdf13. http://earthquake.usgs.gov/earthquakes/eventpage/
uw10530748#executive14. http://www.teara.govt.nz/en/historic-earthquakes/page-1315. https://pubs.usgs.gov/dds/dds-29/16. http://scedc.caltech.edu/significant/northridge1994.html17. http://www.earthquakescanada.nrcan.gc.ca/historic-historique/
events/19460623-en.php18. https://earthquake.usgs.gov/earthquakes/states/
events/1872_12_15.php
© 2016 CoreLogic — Proprietary. This material may not be reproduced in any form without express written permission. 5
The MarketPulse December 2016 Volume 5 Issue 12 | Articles
“The triple threat of earthquake risk in the Pacific Northwest makes the region among the highest risk areas in the nation…”
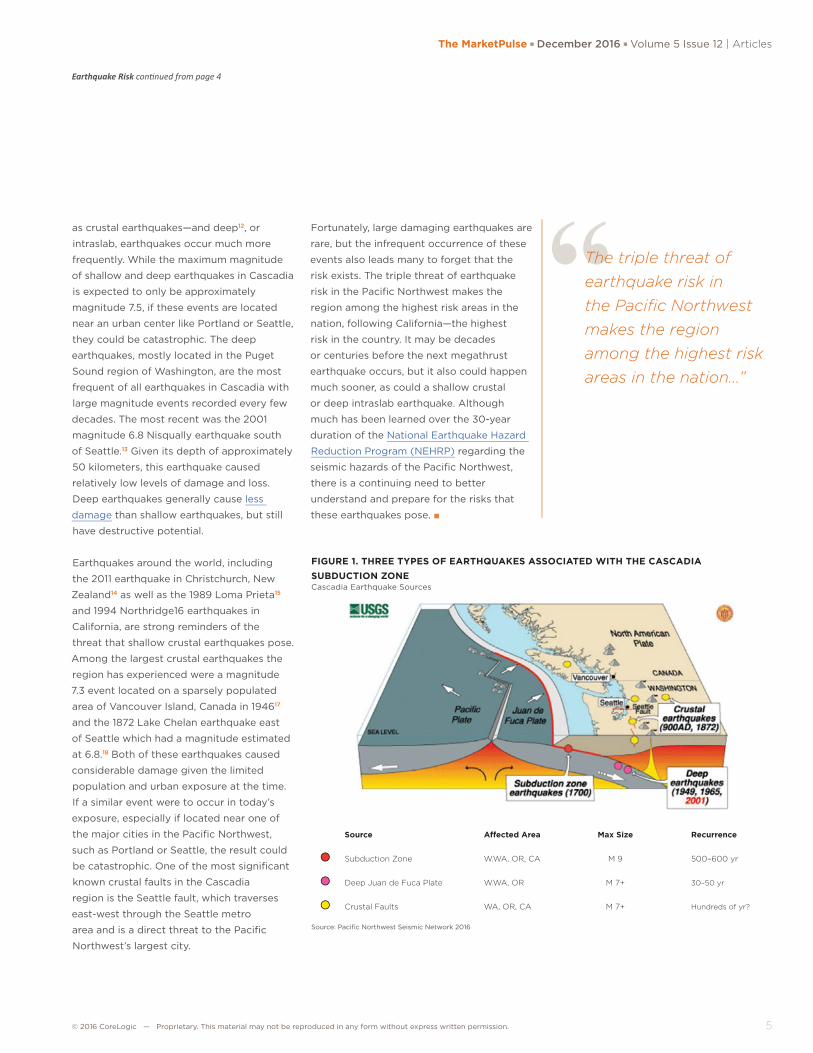
FIGURE 1. THREE TYPES OF EARTHQUAKES ASSOCIATED WITH THE CASCADIA SUBDUCTION ZONECascadia Earthquake Sources
Source: Pacifi c Northwest Seismic Network 2016
as crustal earthquakes—and deep12, or
intraslab, earthquakes occur much more
frequently. While the maximum magnitude
of shallow and deep earthquakes in Cascadia
is expected to only be approximately
magnitude 7.5, if these events are located
near an urban center like Portland or Seattle,
they could be catastrophic. The deep
earthquakes, mostly located in the Puget
Sound region of Washington, are the most
frequent of all earthquakes in Cascadia with
large magnitude events recorded every few
decades. The most recent was the 2001
magnitude 6.8 Nisqually earthquake south
of Seattle.13 Given its depth of approximately
50 kilometers, this earthquake caused
relatively low levels of damage and loss.
Deep earthquakes generally cause less
damage than shallow earthquakes, but still
have destructive potential.
Earthquakes around the world, including
the 2011 earthquake in Christchurch, New
Zealand14 as well as the 1989 Loma Prieta15
and 1994 Northridge16 earthquakes in
California, are strong reminders of the
threat that shallow crustal earthquakes pose.
Among the largest crustal earthquakes the
region has experienced were a magnitude
7.3 event located on a sparsely populated
area of Vancouver Island, Canada in 194617
and the 1872 Lake Chelan earthquake east
of Seattle which had a magnitude estimated
at 6.8.18 Both of these earthquakes caused
considerable damage given the limited
population and urban exposure at the time.
If a similar event were to occur in today’s
exposure, especially if located near one of
the major cities in the Pacifi c Northwest,
such as Portland or Seattle, the result could
be catastrophic. One of the most signifi cant
known crustal faults in the Cascadia
region is the Seattle fault, which traverses
east-west through the Seattle metro
area and is a direct threat to the Pacifi c
Northwest’s largest city.
Fortunately, large damaging earthquakes are
rare, but the infrequent occurrence of these
events also leads many to forget that the
risk exists. The triple threat of earthquake
risk in the Pacifi c Northwest makes the
region among the highest risk areas in the
nation, following California—the highest
risk in the country. It may be decades
or centuries before the next megathrust
earthquake occurs, but it also could happen
much sooner, as could a shallow crustal
or deep intraslab earthquake. Although
much has been learned over the 30-year
duration of the National Earthquake Hazard
Reduction Program (NEHRP) regarding the
seismic hazards of the Pacifi c Northwest,
there is a continuing need to better
understand and prepare for the risks that
these earthquakes pose. ■
Earthquake Risk con nued from page 4
Source Aff ected Area Max Size Recurrence
Subduction Zone W.WA, OR, CA M 9 500–600 yr
Deep Juan de Fuca Plate W.WA, OR M 7+ 30–50 yr
Crustal Faults WA, OR, CA M 7+ Hundreds of yr?
© 2016 CoreLogic — Proprietary. This material may not be reproduced in any form without express written permission.6
Articles | The MarketPulse g December 2016 g Volume 5, Issue 12
FHA Reforms Bringing New Risks as Well as RewardsEasing restrictions should drive increased volume, but spot loans will challenge insurance fund stability
By Jacqueline Doty
Now that President Obama has signed
Federal Housing Administration condominium
reforms into law, it is time to make a clear-
eyed assessment of the risks and rewards
that HR 3700 will bring.
It’s great that Congress has acted to ease
regulations that made FHA condo loans
more difficult to get. But are the proposed
rules being discussed during the current
comment period the best way to do this?
There might still be opportunities for
adjustments to provide greater insight
into these risks and to standardize project
approval from lender to lender and across
various government agencies.
What’s changing?In a recent press release, the National
Association of Realtors, which championed
the passage of the bill, said that changes
include “efforts to make FHA's recertification
process substantially less burdensome, while
lowering FHA's current owner-occupancy
requirement from 50 percent to 35 percent.
The bill also requires FHA to replace
existing policy on transfer fees with the
less-restrictive model already in place at the
Federal Housing Finance Agency” for condo
lending at Fannie Mae and Freddie Mac.
Less burdensome rules are good. But
prudent assessments have to be made on
whether the rewards outweigh the risks.
Take the subject of spot loans. The law
allows spot loans to individual buyers of
non-FHA certified condo projects. FHA
rules have gone back and forth on this
topic over the years but now they will be
allowed again. Spot loans will increase the
risk to the FHA insurance fund, because
they will provide guarantees on units in
less financially stable projects.
The Department of Housing and Urban
Development, during its 90-day window
to comment on the new regulations before
they automatically go into law, has endorsed
the return of the spot loan.
But at the same time, HUD also has
recommended a change in the owner-
occupancy rate of 35 percent set out in the bill
to a range between 25 percent to 75 percent.
NAR doesn’t agree with this change and has
asked its members to weigh in on it.
The last time NAR reached out to its
membership on HR 3700, Realtors®
flooded Congress with more than 140,000
comments on that bill.
Congress in drafting and passing HR 3700
clearly recognized the need for easing
standards but wasn’t overly prescriptive
in how to do it. Instead it gave FHA
latitude to make decisions on prudent
underwriting. Ideally, these decisions should
incorporate as much relevant data and
analysis as possible.
One of the challenges in assessing condo
lending risk is the lack of standardization.
For example, there is still no standardized
questionnaire used in determining project
approval, and there should be.
It’s true that condos often represent the
most affordable alternatives for first-time
and low-to-moderate income borrowers,
and seniors. There’s no question that some
reforms are necessary to improve the ease
of both buying and selling condos, as the
number of FHA-insured condo loans has
fallen dramatically in recent years. In fact,
FHA condo lending in the first three months
of this year dropped 8.6 percent from
the previous quarter, according to Inside
Mortgage Finance, which said in the fourth
quarter of last year, volume declined by
20.3 percent from the third quarter. ■
Jacqueline Doty
VP, Product Management,
Collateral Risk Solutions
Jacqueline Doty is vice president and product line manager at CoreLogic. She is responsible for strategic planning, research and development of innovative products and solutions to collateral risk management problems. She also oversees the CondoSafe and LoanSafe Appraisal Manager offerings, ensuring these CoreLogic solutions provide an accurate, timely and cost-effective method of underwriting collateral. Jacqueline earned a bachelor’s degree in economics from the University of Maryland, College Park, and is a graduate of the Mortgage Bankers Association School of Mortgage Banking.
© 2016 CoreLogic — Proprietary. This material may not be reproduced in any form without express written permission. 7
The MarketPulse g December 2016 g Volume 5 Issue 12 | Articles
And with higher mortgage rates reducing
incentives to refinance, a fourth feature to
expect is a drop in refinance originations in
2017. This drop will be at least partly offset
by higher purchase-money volume and
second liens, either HELOCs on single-family
or mezzanine debt on multifamily.
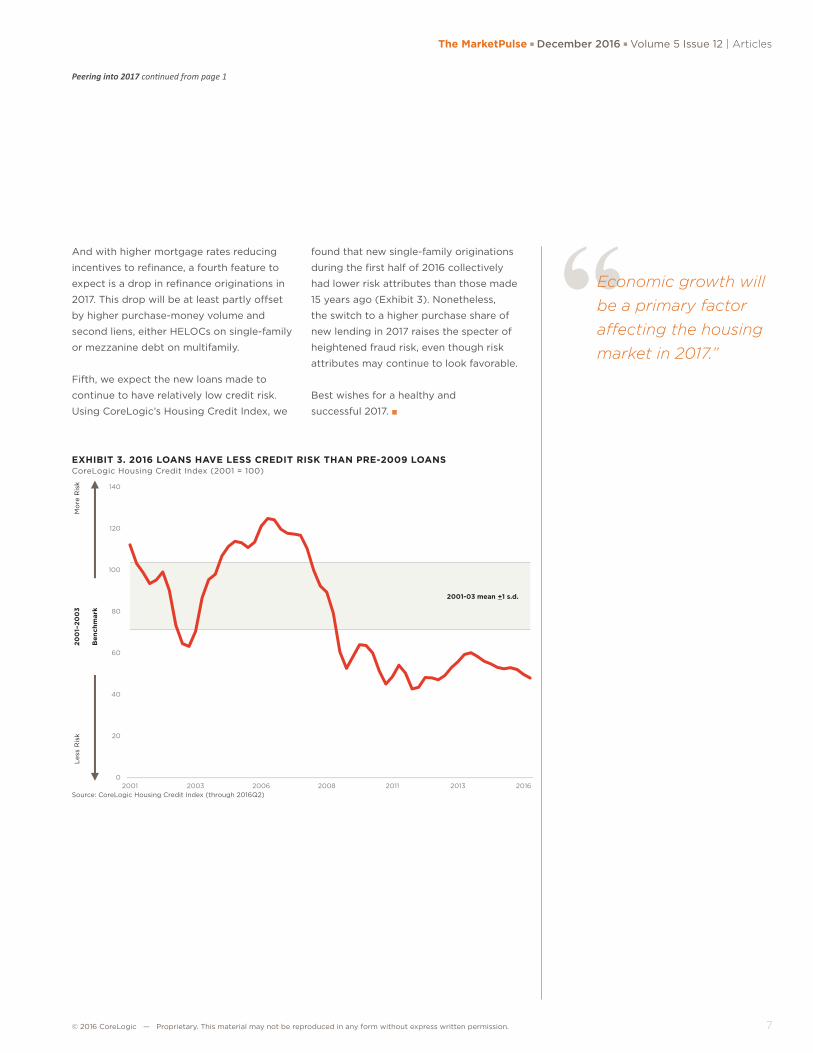
Fifth, we expect the new loans made to
continue to have relatively low credit risk.
Using CoreLogic’s Housing Credit Index, we
found that new single-family originations
during the first half of 2016 collectively
had lower risk attributes than those made
15 years ago (Exhibit 3). Nonetheless,
the switch to a higher purchase share of
new lending in 2017 raises the specter of
heightened fraud risk, even though risk
attributes may continue to look favorable.
Best wishes for a healthy and
successful 2017. ■
Peering into 2017 continued from page 1
“Economic growth will be a primary factor affecting the housing market in 2017.”
EXHIBIT 3. 2016 LOANS HAVE LESS CREDIT RISK THAN PRE-2009 LOANSCoreLogic Housing Credit Index (2001 = 100)
nothaft: exhibit 3
0
20
40
60
80
100
120
140
2001 2003 2006 2008 2011 2013 2016
2001-03 mean +1 s.d.
Mo
re R
isk
200
1–20
03
Less
Ris
k
Ben
chm
ark
Source: CoreLogic Housing Credit Index (through 2016Q2)
© 2016 CoreLogic — Proprietary. This material may not be reproduced in any form without express written permission.8
Analysis | The MarketPulse g December 2016 g Volume 5, Issue 12
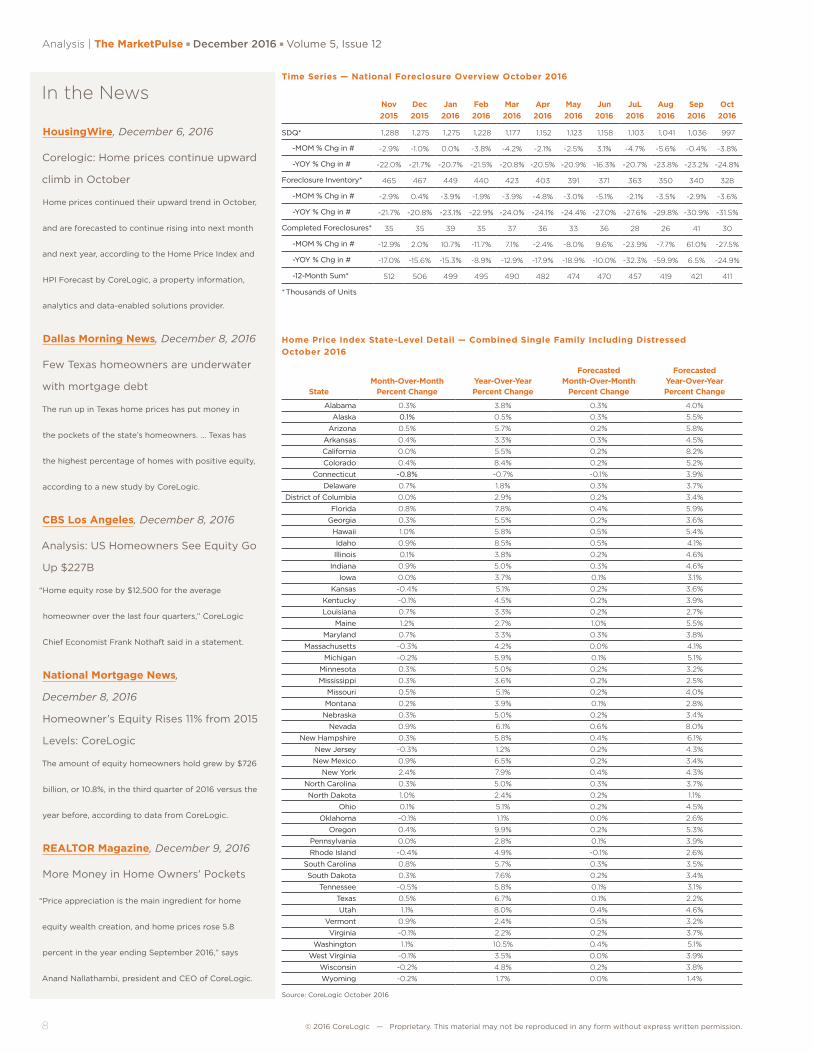
Time Series — National Foreclosure Overview October 2016
Nov 2015
Dec 2015
Jan 2016
Feb 2016
Mar 2016
Apr 2016
May 2016
Jun 2016
JuL 2016
Aug 2016
Sep 2016
Oct 2016
SDQ* 1,288 1,275 1,275 1,228 1,177 1,152 1,123 1,158 1,103 1,041 1,036 997
-MOM % Chg in # -2.9% -1.0% 0.0% -3.8% -4.2% -2.1% -2.5% 3.1% -4.7% -5.6% -0.4% -3.8%
-YOY % Chg in # -22.0% -21.7% -20.7% -21.5% -20.8% -20.5% -20.9% -16.3% -20.7% -23.8% -23.2% -24.8%
Foreclosure Inventory* 465 467 449 440 423 403 391 371 363 350 340 328
-MOM % Chg in # -2.9% 0.4% -3.9% -1.9% -3.9% -4.8% -3.0% -5.1% -2.1% -3.5% -2.9% -3.6%
-YOY % Chg in # -21.7% -20.8% -23.1% -22.9% -24.0% -24.1% -24.4% -27.0% -27.6% -29.8% -30.9% -31.5%
Completed Foreclosures* 35 35 39 35 37 36 33 36 28 26 41 30
-MOM % Chg in # -12.9% 2.0% 10.7% -11.7% 7.1% -2.4% -8.0% 9.6% -23.9% -7.7% 61.0% -27.5%
-YOY % Chg in # -17.0% -15.6% -15.3% -8.9% -12.9% -17.9% -18.9% -10.0% -32.3% -59.9% 6.5% -24.9%
-12-Month Sum* 512 506 499 495 490 482 474 470 457 419 421 411
* Thousands of Units
Home Price Index State-Level Detail — Combined Single Family Including Distressed October 2016
StateMonth-Over-Month
Percent ChangeYear-Over-Year Percent Change
Forecasted Month-Over-Month
Percent Change
Forecasted Year-Over-Year Percent Change
Alabama 0.3% 3.8% 0.3% 4.0%
Alaska 0.1% 0.5% 0.3% 5.5%
Arizona 0.5% 5.7% 0.2% 5.8%
Arkansas 0.4% 3.3% 0.3% 4.5%
California 0.0% 5.5% 0.2% 8.2%
Colorado 0.4% 8.4% 0.2% 5.2%
Connecticut -0.8% -0.7% -0.1% 3.9%
Delaware 0.7% 1.8% 0.3% 3.7%
District of Columbia 0.0% 2.9% 0.2% 3.4%
Florida 0.8% 7.8% 0.4% 5.9%
Georgia 0.3% 5.5% 0.2% 3.6%
Hawaii 1.0% 5.8% 0.5% 5.4%
Idaho 0.9% 8.5% 0.5% 4.1%
Illinois 0.1% 3.8% 0.2% 4.6%
Indiana 0.9% 5.0% 0.3% 4.6%
Iowa 0.0% 3.7% 0.1% 3.1%
Kansas -0.4% 5.1% 0.2% 3.6%
Kentucky -0.1% 4.5% 0.2% 3.9%
Louisiana 0.7% 3.3% 0.2% 2.7%
Maine 1.2% 2.7% 1.0% 5.5%
Maryland 0.7% 3.3% 0.3% 3.8%
Massachusetts -0.3% 4.2% 0.0% 4.1%
Michigan -0.2% 5.9% 0.1% 5.1%
Minnesota 0.3% 5.0% 0.2% 3.2%
Mississippi 0.3% 3.6% 0.2% 2.5%
Missouri 0.5% 5.1% 0.2% 4.0%
Montana 0.2% 3.9% 0.1% 2.8%
Nebraska 0.3% 5.0% 0.2% 3.4%
Nevada 0.9% 6.1% 0.6% 8.0%
New Hampshire 0.3% 5.8% 0.4% 6.1%
New Jersey -0.3% 1.2% 0.2% 4.3%
New Mexico 0.9% 6.5% 0.2% 3.4%
New York 2.4% 7.9% 0.4% 4.3%
North Carolina 0.3% 5.0% 0.3% 3.7%
North Dakota 1.0% 2.4% 0.2% 1.1%
Ohio 0.1% 5.1% 0.2% 4.5%
Oklahoma -0.1% 1.1% 0.0% 2.6%
Oregon 0.4% 9.9% 0.2% 5.3%
Pennsylvania 0.0% 2.8% 0.1% 3.9%
Rhode Island -0.4% 4.9% -0.1% 2.6%
South Carolina 0.8% 5.7% 0.3% 3.5%
South Dakota 0.3% 7.6% 0.2% 3.4%
Tennessee -0.5% 5.8% 0.1% 3.1%
Texas 0.5% 6.7% 0.1% 2.2%
Utah 1.1% 8.0% 0.4% 4.6%
Vermont 0.9% 2.4% 0.5% 3.2%
Virginia -0.1% 2.2% 0.2% 3.7%
Washington 1.1% 10.5% 0.4% 5.1%
West Virginia -0.1% 3.5% 0.0% 3.9%
Wisconsin -0.2% 4.8% 0.2% 3.8%
Wyoming -0.2% 1.7% 0.0% 1.4%
Source: CoreLogic October 2016
In the News
HousingWire, December 6, 2016
Corelogic: Home prices continue upward
climb in October
Home prices continued their upward trend in October,
and are forecasted to continue rising into next month
and next year, according to the Home Price Index and
HPI Forecast by CoreLogic, a property information,
analytics and data-enabled solutions provider.
Dallas Morning News, December 8, 2016
Few Texas homeowners are underwater
with mortgage debt
The run up in Texas home prices has put money in
the pockets of the state’s homeowners. … Texas has
the highest percentage of homes with positive equity,
according to a new study by CoreLogic.
CBS Los Angeles, December 8, 2016
Analysis: US Homeowners See Equity Go
Up $227B
“Home equity rose by $12,500 for the average
homeowner over the last four quarters,” CoreLogic
Chief Economist Frank Nothaft said in a statement.
National Mortgage News,
December 8, 2016
Homeowner’s Equity Rises 11% from 2015
Levels: CoreLogic
The amount of equity homeowners hold grew by $726
billion, or 10.8%, in the third quarter of 2016 versus the
year before, according to data from CoreLogic.
REALTOR Magazine, December 9, 2016
More Money in Home Owners’ Pockets
“Price appreciation is the main ingredient for home
equity wealth creation, and home prices rose 5.8
percent in the year ending September 2016,” says
Anand Nallathambi, president and CEO of CoreLogic.
© 2016 CoreLogic — Proprietary. This material may not be reproduced in any form without express written permission. 9
The MarketPulse g December 2016 g Volume 5 Issue 12 | Analysis
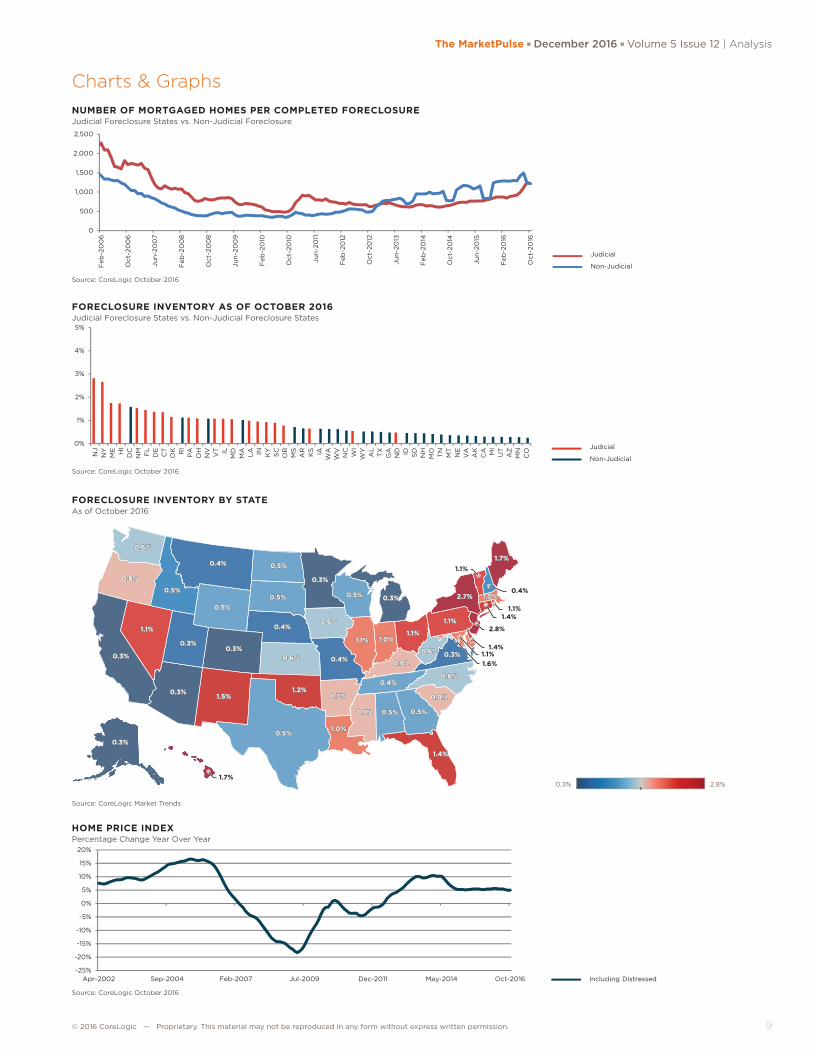
Charts & GraphsNUMBER OF MORTGAGED HOMES PER COMPLETED FORECLOSUREJudicial Foreclosure States vs. Non-Judicial Foreclosure
Source: CoreLogic October 2016
0
500
1,000
1,500
2,000
2,500
Feb
-20
06
Oct
-20
06
Jun
-20
07
Feb
-20
08
Oct
-20
08
Jun
-20
09
Feb
-20
10
Oct
-20
10
Jun
-20
11
Feb
-20
12
Oct
-20
12
Jun
-20
13
Feb
-20
14
Oct
-20
14
Jun
-20
15
Feb
-20
16
Oct
-20
16
1.46x5.11foreclosure oct 2016: number of mortgaged homes per
completed foreclosure
Judicial
Non-Judicial
FORECLOSURE INVENTORY AS OF OCTOBER 2016Judicial Foreclosure States vs. Non-Judicial Foreclosure States
Source: CoreLogic October 2016
0%
1%
2%
3%
4%
5%
NJ
NY
ME HI
DC
NM FL
DE
CT
OK RI
PA
OH
NV
VT IL
MD
MA
LA IN KY
SC
OR
MS
AR
KS IA
WA
WV
NC
WI
WY
AL
TX
GA
ND ID SD
NH
MO TN
MT
NE
VA
AK
CA MI
UT
AZ
MN
CO
Judicial
Non-Judicial
1.63x5.01foreclosure inventory as of oct 2016
HOME PRICE INDEXPercentage Change Year Over Year
Source: CoreLogic October 2016
-25%
-20%
-15%
-10%
-5%
0%
5%
10%
15%
20%
Apr-2002 Sep-2004 Feb-2007 Jul-2009 Dec-2011 May-2014 Oct-2016
1.63x4.93hpi as of sep 2016
Including Distressed
FORECLOSURE INVENTORY BY STATEAs of October 2016
Source: CoreLogic Market Trends
0.6%
0.8%
0.3%
1.1%
0.3%
0.3%1.5%
0.3%
0.5%
0.4% 0.5%
0.5%
0.4%
0.6%
1.2%
0.5%1.0%
0.7%
0.4%
0.6%
0.3%
0.5%
1.1%
0.3%
1.0%1.1%
0.9%
0.4%
0.7% 0.5% 0.5%
1.4%
0.9%
0.6%
0.3%0.6%
1.1%
2.7%
1.7%
1.0%
0.3%
0.5%
0.6%
0.8%
0.3%
1.1%
0.3%
0.3%1.5%
0.3%
0.5%
0.4% 0.5%
0.5%
0.4%
0.6%
1.2%
0.5%
2.8%
1.0%
0.7%
0.4%
0.6%
0.3%
0.5%
1.1%
0.3%
1.0%1.1%
0.9%
0.4%
0.7% 0.5% 0.5%
1.4%
0.9%
0.6%
0.3%0.6%
1.1%
2.7%
1.7%
1.0%
0.3%
1.7%
1.1%
1.6%1.1%
1.4%
2.8%
1.4%1.1%
0.4%0.5%
0.3%
© 2016 CoreLogic — Proprietary. This material may not be reproduced in any form without express written permission.10
Analysis | The MarketPulse g December 2016 g Volume 5, Issue 12
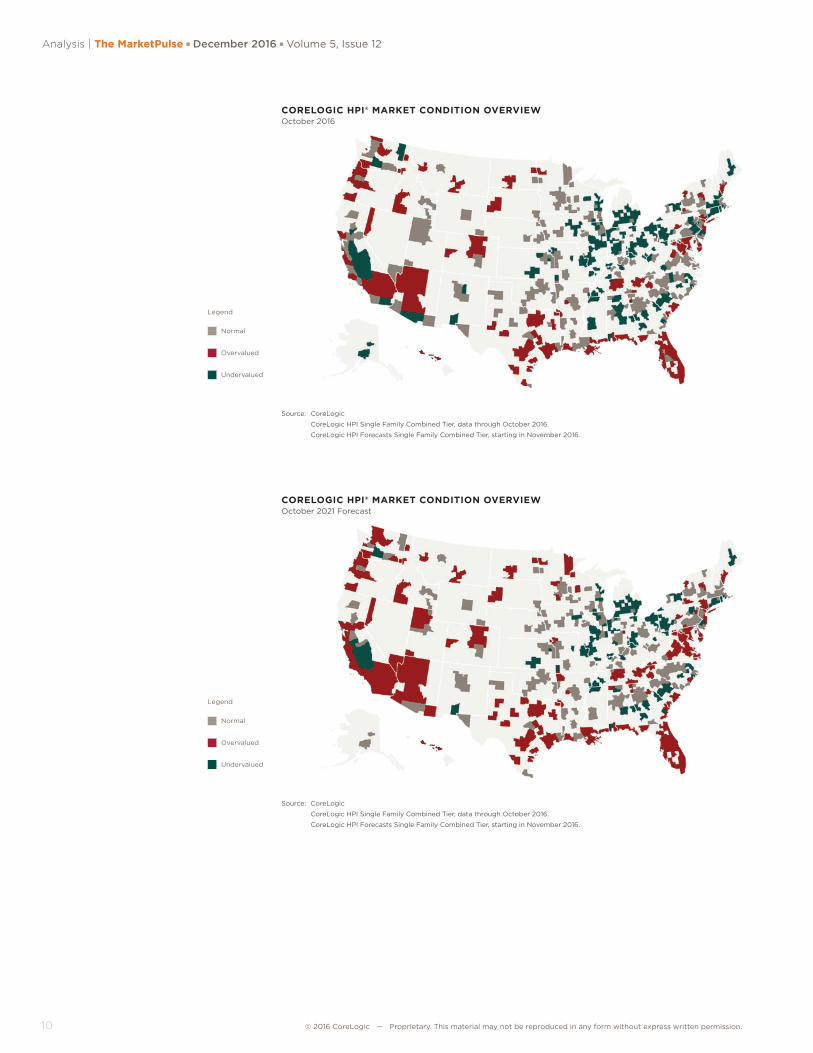
CORELOGIC HPI® MARKET CONDITION OVERVIEWOctober 2016
Source: CoreLogic
CoreLogic HPI Single Family Combined Tier, data through October 2016.
CoreLogic HPI Forecasts Single Family Combined Tier, starting in November 2016.
Legend
Normal
Overvalued
Undervalued
CORELOGIC HPI® MARKET CONDITION OVERVIEWOctober 2021 Forecast
Source: CoreLogic
CoreLogic HPI Single Family Combined Tier, data through October 2016.
CoreLogic HPI Forecasts Single Family Combined Tier, starting in November 2016.
Legend
Normal
Overvalued
Undervalued
© 2016 CoreLogic — Proprietary. This material may not be reproduced in any form without express written permission. 11
The MarketPulse g December 2016 g Volume 5 Issue 12 | Analysis
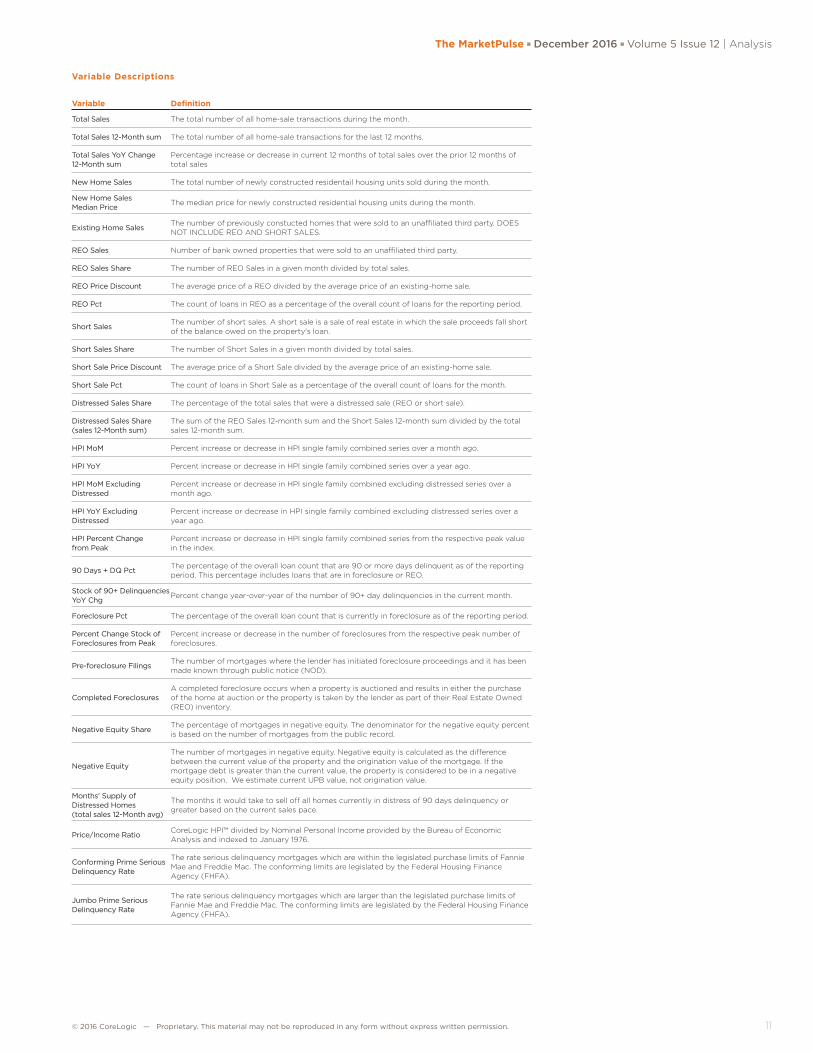
Variable Descriptions
Variable Definition
Total Sales The total number of all home-sale transactions during the month.
Total Sales 12-Month sum The total number of all home-sale transactions for the last 12 months.
Total Sales YoY Change 12-Month sum
Percentage increase or decrease in current 12 months of total sales over the prior 12 months of total sales
New Home Sales The total number of newly constructed residentail housing units sold during the month.
New Home Sales Median Price
The median price for newly constructed residential housing units during the month.
Existing Home Sales The number of previously constucted homes that were sold to an unaffiliated third party. DOES NOT INCLUDE REO AND SHORT SALES.
REO Sales Number of bank owned properties that were sold to an unaffiliated third party.
REO Sales Share The number of REO Sales in a given month divided by total sales.
REO Price Discount The average price of a REO divided by the average price of an existing-home sale.
REO Pct The count of loans in REO as a percentage of the overall count of loans for the reporting period.
Short SalesThe number of short sales. A short sale is a sale of real estate in which the sale proceeds fall short of the balance owed on the property's loan.
Short Sales Share The number of Short Sales in a given month divided by total sales.
Short Sale Price Discount The average price of a Short Sale divided by the average price of an existing-home sale.
Short Sale Pct The count of loans in Short Sale as a percentage of the overall count of loans for the month.
Distressed Sales Share The percentage of the total sales that were a distressed sale (REO or short sale).
Distressed Sales Share (sales 12-Month sum)
The sum of the REO Sales 12-month sum and the Short Sales 12-month sum divided by the total sales 12-month sum.
HPI MoM Percent increase or decrease in HPI single family combined series over a month ago.
HPI YoY Percent increase or decrease in HPI single family combined series over a year ago.
HPI MoM Excluding Distressed
Percent increase or decrease in HPI single family combined excluding distressed series over a month ago.
HPI YoY Excluding Distressed
Percent increase or decrease in HPI single family combined excluding distressed series over a year ago.
HPI Percent Change from Peak
Percent increase or decrease in HPI single family combined series from the respective peak value in the index.
90 Days + DQ Pct The percentage of the overall loan count that are 90 or more days delinquent as of the reporting period. This percentage includes loans that are in foreclosure or REO.
Stock of 90+ Delinquencies YoY Chg
Percent change year-over-year of the number of 90+ day delinquencies in the current month.
Foreclosure Pct The percentage of the overall loan count that is currently in foreclosure as of the reporting period.
Percent Change Stock of Foreclosures from Peak
Percent increase or decrease in the number of foreclosures from the respective peak number of foreclosures.
Pre-foreclosure FilingsThe number of mortgages where the lender has initiated foreclosure proceedings and it has been made known through public notice (NOD).
Completed ForeclosuresA completed foreclosure occurs when a property is auctioned and results in either the purchase of the home at auction or the property is taken by the lender as part of their Real Estate Owned (REO) inventory.
Negative Equity ShareThe percentage of mortgages in negative equity. The denominator for the negative equity percent is based on the number of mortgages from the public record.
Negative Equity
The number of mortgages in negative equity. Negative equity is calculated as the difference between the current value of the property and the origination value of the mortgage. If the mortgage debt is greater than the current value, the property is considered to be in a negative equity position. We estimate current UPB value, not origination value.
Months' Supply of Distressed Homes (total sales 12-Month avg)
The months it would take to sell off all homes currently in distress of 90 days delinquency or greater based on the current sales pace.
Price/Income RatioCoreLogic HPI™ divided by Nominal Personal Income provided by the Bureau of Economic Analysis and indexed to January 1976.
Conforming Prime Serious Delinquency Rate
The rate serious delinquency mortgages which are within the legislated purchase limits of Fannie Mae and Freddie Mac. The conforming limits are legislated by the Federal Housing Finance Agency (FHFA).
Jumbo Prime Serious Delinquency Rate
The rate serious delinquency mortgages which are larger than the legislated purchase limits of Fannie Mae and Freddie Mac. The conforming limits are legislated by the Federal Housing Finance Agency (FHFA).

corelogic.com
End Notes | The MarketPulse g December 2016 g Volume 5, Issue 12
© 2016 CoreLogic, Inc. All rights reserved.
CORELOGIC, the CoreLogic logo and CORELOGIC HPI are trademarks of CoreLogic, Inc. and/or its subsidiaries. All other trademarks are the property of their respective holders.
17-MKTPLSE-1216-00
Source: CoreLogicThe data provided is for use only by the primary recipient or the primary recipient's
publication or broadcast. This data may not be re-sold, republished or licensed to any
other source, including publications and sources owned by the primary recipient's parent
company without prior written permission from CoreLogic. Any CoreLogic data used for
publication or broadcast, in whole or in part, must be sourced as coming from CoreLogic,
a data and analytics company. For use with broadcast or web content, the citation
must directly accompany first reference of the data. If the data is illustrated with maps,
charts, graphs or other visual elements, the CoreLogic logo must be included on screen
or website. For questions, analysis or interpretation of the data, contact CoreLogic at
[email protected]. Data provided may not be modified without the prior written
permission of CoreLogic. Do not use the data in any unlawful manner. This data is compiled
from public records, contributory databases and proprietary analytics, and its accuracy is
dependent upon these sources.
For more information please call 866-774-3282
The MarketPulse is a newsletter published by CoreLogic, Inc. ("CoreLogic"). This information is made
available for informational purposes only and is not intended to provide specific commercial, financial or
investment advice. CoreLogic disclaims all express or implied representations, warranties and guaranties,
including implied warranties of merchantability, fitness for a particular purpose, title, or non-infringement.
Neither CoreLogic nor its licensors make any representations, warranties or guaranties as to the quality,
reliability, suitability, truth, accuracy, timeliness or completeness of the information contained in this
newsletter. CoreLogic shall not be held responsible for any errors, inaccuracies, omissions or losses
resulting directly or indirectly from your reliance on the information contained in this newsletter.
This newsletter contains links to third-party websites that are not controlled by CoreLogic. CoreLogic is
not responsible for the content of third-party websites. The use of a third-party website and its content
is governed by the terms and conditions set forth on the third-party’s site and CoreLogic assumes no
responsibility for your use of or activities on the site.
MORE INSIGHTS
The CoreLogic Insights Blog
(corelogic.com/blog) provides an
expanded perspective on housing
economies and property markets,
including policy, trends, regulation
and compliance. Please visit the
blog for timely analysis, thought-
provoking data visualizations and
unique commentary from our team
in the Office of the Chief Economist.
CoreLogic CoreLogic Econ
CoreLogic Insights – On The Go. Download our free App now: