Embed Size (px)
Citation preview

The MarketPulseMarch 2020
Volume 9, Issue 3
March 2020
Data as of January 2020 (unless otherwise stated)
News Media Contact
Todd Taylor [email protected]
619-938-6829 (office)
2
The MarketPulse
Table of ContentsSingle-Family Rents Increasing Twice as Fast as Inflation . . . .3
HECMs: Programmatic Issues . . . . . . . . . . . . . . . . . . . . . . . . . . .4
Share of Homes Selling at or Above List Price Back to Long Term Average . . . . . . . . . . . . . . . . . . . . . . . . . . . . . . . . .5
Mortgage Delinquency Rates Fell to Historically Low Levels in 2019 . . . . . . . . . . . . . . . . . . . . . . . . . . . . . . . . . . . .7
In The News . . . . . . . . . . . . . . . . . . . . . . . . . . . . . . . . . . . . . . . . . .9
Charts & Graphs . . . . . . . . . . . . . . . . . . . . . . . . . . . . . . . . . . . . .10
10 Largest CBSA – Loan Performance Insights Report December 2019 . . . . . . . . . . . . . . . . . . . . . . . . . . . . . . . . . . . . . . . . . . . . . . 10
Overview of Loan Performance . . . . . . . . . . . . . . . . . . . . . . . . . . . . . . . . . 10
Home Price Index State-Level Detail — Combined Single Family Including Distressed . . . . . . . . . . . . . . . . . . . . . 11
Home Price Index . . . . . . . . . . . . . . . . . . . . . . . . . . . . . . . . . . . . . . . . . . . . . 12
CoreLogic HPI® Market Condition Overview . . . . . . . . . . . . . . . . . . . . . . 13
January 2020 . . . . . . . . . . . . . . . . . . . . . . . . . . . . . . . . . . . . . . . . . . . . . . . . . . . . . . . . . 13
January 2025 . . . . . . . . . . . . . . . . . . . . . . . . . . . . . . . . . . . . . . . . . . . . . . . . . . . . . . . . . 13
National Home Equity Distribution . . . . . . . . . . . . . . . . . . . . . . . . . . . . . . 14
Map of Average Year-Over-Year Equity Gain/Loss per Borrower . . . . . 14
Housing Statistics March 2020
HPI® YOY Chg 4 .0%
HPI YOY Chg XD 3 .7%
NegEq Share (Q4 2019) 3 .5%
3
� Rents for lower-priced homes increased faster than those of higher-priced homes in January compared with a year earlier.
� Phoenix and Tucson were on top for rent growth.
1 As measured by the Consumer Price Index (CPI) Less Shelter .
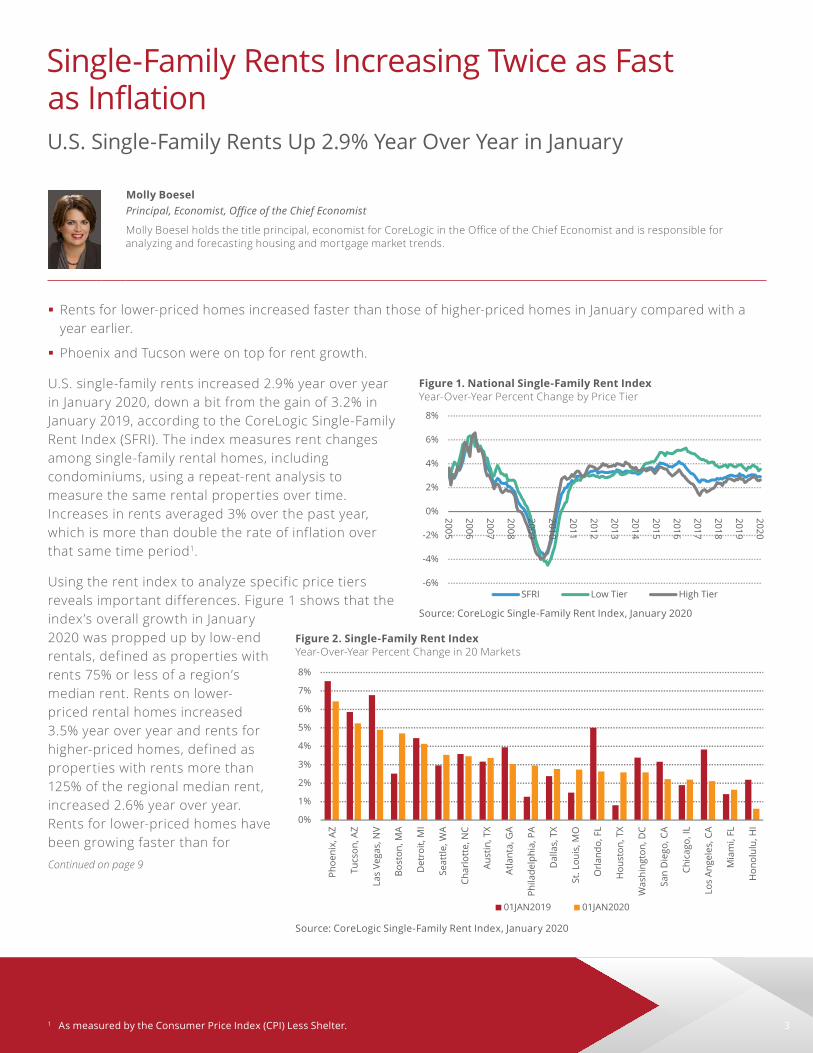
U.S. single-family rents increased 2.9% year over year in January 2020, down a bit from the gain of 3.2% in January 2019, according to the CoreLogic Single-Family Rent Index (SFRI). The index measures rent changes among single-family rental homes, including condominiums, using a repeat-rent analysis to measure the same rental properties over time. Increases in rents averaged 3% over the past year, which is more than double the rate of inflation over that same time period1.
Using the rent index to analyze specific price tiers reveals important differences. Figure 1 shows that the index’s overall growth in January 2020 was propped up by low-end rentals, defined as properties with rents 75% or less of a region’s median rent. Rents on lower-priced rental homes increased 3.5% year over year and rents for higher-priced homes, defined as properties with rents more than 125% of the regional median rent, increased 2.6% year over year. Rents for lower-priced homes have been growing faster than for
Single-Family Rents Increasing Twice as Fast as InflationU .S . Single-Family Rents Up 2 .9% Year Over Year in January
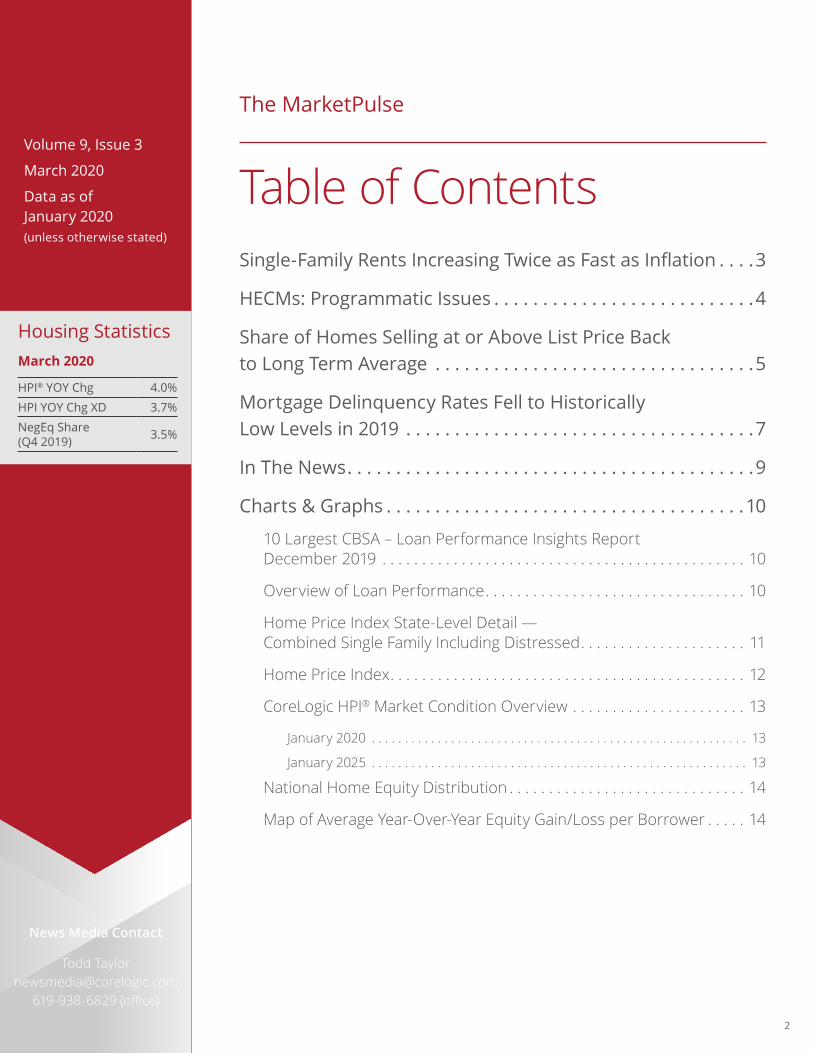
Molly BoeselPrincipal, Economist, Office of the Chief Economist
Molly Boesel holds the title principal, economist for CoreLogic in the Office of the Chief Economist and is responsible for analyzing and forecasting housing and mortgage market trends.
Figure 1. National Single-Family Rent IndexYear-Over-Year Percent Change by Price Tier
©2019 CoreLogic, Inc. All Rights Reserved.
-6%
-4%
-2%
0%
2%
4%
6%
8%
2005
2006
2007
2008
2009
2010
2011
2012
2013
2014
2015
2016
2017
2018
2019
2020
SFRI Low Tier High Tier
1
1 Boesel fig 1 Subhead copy goes here
Source: CoreLogic Single-Family Rent Index, January 2020
Continued on page 9
Figure 2. Single-Family Rent Index Year-Over-Year Percent Change in 20 Markets
©2019 CoreLogic, Inc. All Rights Reserved.
0%
1%
2%
3%
4%
5%
6%
7%
8%
Phoe
nix,
AZ
Tucs
on, A
Z
Las
Vega
s, N
V
Bost
on, M
A
Det
roit,
MI
Seat
tle, W
A
Char
lott
e, N
C
Aust
in, T
X
Atla
nta,
GA
Phila
delp
hia,
PA
Dal
las,
TX
St. L
ouis
, MO
Orla
ndo,
FL
Hou
ston
, TX
Was
hing
ton,
DC
San
Die
go, C
A
Chic
ago,
IL
Los
Ange
les,
CA
Mia
mi,
FL
Hon
olul
u, H
I
01JAN2019 01JAN2020
2
1 Boesel fig 2 Subhead copy goes here
Source: CoreLogic Single-Family Rent Index, January 2020
4
HECMs: Programmatic IssuesOver-appraisal, under-maintenance, tax/fee nonpayment and LIBOR sunset
Dr. Frank NothaftExecutive, Chief Economist, Office of the Chief Economist
Frank Nothaft holds the title executive, chief economist for CoreLogic. He leads the Office of the Chief Economist and is responsible for analysis, commentary and forecasting trends in global real estate, insurance and mortgage markets.
One goal of a reverse mortgage is to help elderly homeowners convert part of their home equity into a monthly income supplement. Since the Great Recession, the Home Equity Conversion Mortgage, or HECM, has been the primary—and often the only—reverse mortgage in the market. Insured by the FHA, there are more than 500,000 HECM loans outstanding today.
Defaults in the HECM program have been a drain on the financial resources of the FHA. The FHA has tightened underwriting and added more risk controls, helping to reduce losses. Nonetheless, there are at least four issues that remain important for FHA to address.
First, FHA has recognized that over-appraisal of the collateral has contributed to HECM losses.1 Given the reliance on the appraised value, it is imperative the appraised value accurately reflects the true market value of each property insured by the federal government.
Table 1. Reverse Mortgage Borrowers Have Lived in Their Home Longer than Other OwnersYears in Home for Owner-Occupants
Type of Owner Years (median)
Owners with no Reverse Mortgage 13
Owners with a Reverse Mortgage 30
Source: CoreLogic analysis of American Housing Survey for 2017
Second, homes depreciate and require maintenance over time to maintain value. The typical HECM borrower has lived in their homes much longer than other owner occupants but often have fewer financial resources to spend on repair, leading to deterioration in the home.2
Third, nonpayment of property taxes and Homeowners Association (HOA) fees can take lien priority over a HECM, and nonpayment of property insurance puts collateral at risk. While FHA has taken steps to address this, the increasing longevity of America’s seniors add additional risk of ultimate nonpayment.3
Table 2. LIBOR Replacement Alternatives On average, 1-year Treasury and SOFR both have lower rates One-Year LIBOR less Yield on Alternate Indexes (April 3, 2018 to February 28, 2020)
Alternate IndexBasis Points
(average)
One-Year Constant Maturity Treasury 37
Secured Overnight Financing Rate (SOFR) 47
Source: CoreLogic analysis of Federal Reserve data .
The fourth key issue is the sunset of the London Inter-Bank Offered Rate, commonly referred to as LIBOR, by the end of 2021. LIBOR-indexed floating-rate loans have been the majority of HECM endorsements for the last decade. Replacement indexes for LIBOR could include the 1-year Treasury yield and the Secured Overnight Financing Rate (SOFR). Both of these have interest rates that are about 25 to 50 basis points below 1-year LIBOR, and could cause qualifying loan amounts to increase above the amount based on LIBOR, adding to HECM risk exposure.
A reverse mortgage, if underwritten well, can provide an important income supplement to elderly homeowners. While FHA has taken important steps to address losses in its HECM program, there are at least four areas that FHA will need to remain focused on in coming years.
Continued on page 9
5
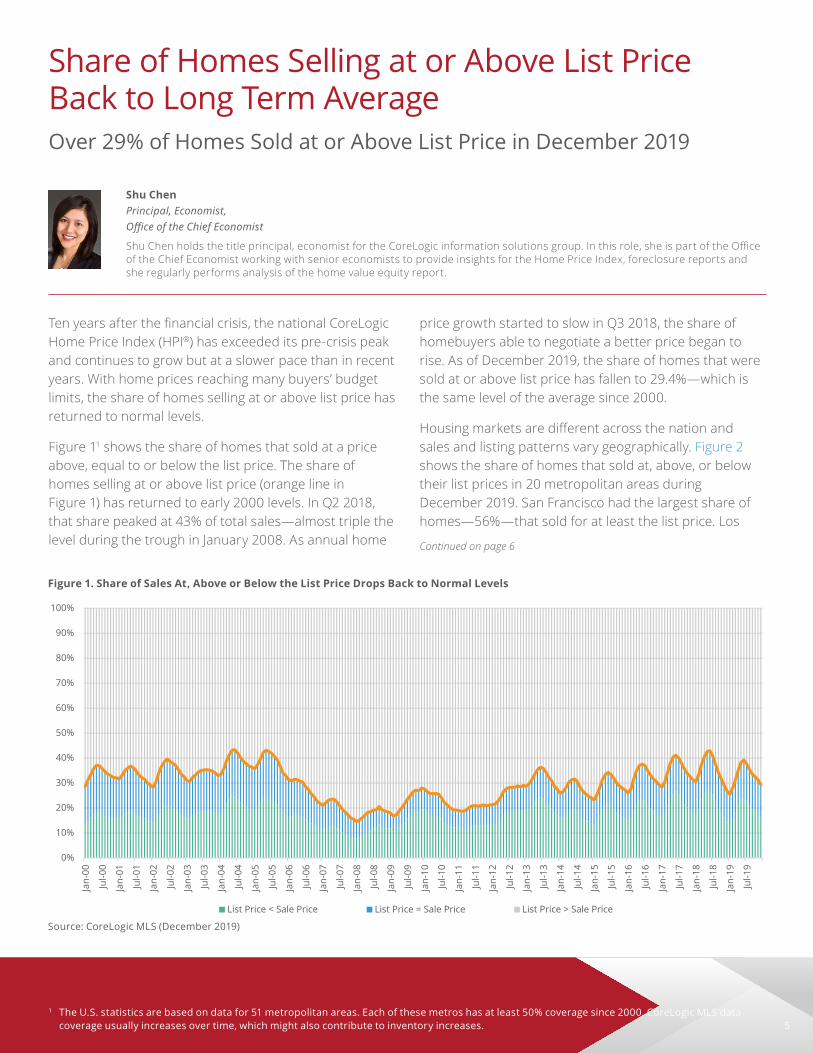
Ten years after the financial crisis, the national CoreLogic Home Price Index (HPI®) has exceeded its pre-crisis peak and continues to grow but at a slower pace than in recent years. With home prices reaching many buyers’ budget limits, the share of homes selling at or above list price has returned to normal levels.
Figure 11 shows the share of homes that sold at a price above, equal to or below the list price. The share of homes selling at or above list price (orange line in Figure 1) has returned to early 2000 levels. In Q2 2018, that share peaked at 43% of total sales—almost triple the level during the trough in January 2008. As annual home
1 The U .S . statistics are based on data for 51 metropolitan areas . Each of these metros has at least 50% coverage since 2000 . CoreLogic MLS data coverage usually increases over time, which might also contribute to inventory increases .
price growth started to slow in Q3 2018, the share of homebuyers able to negotiate a better price began to rise. As of December 2019, the share of homes that were sold at or above list price has fallen to 29.4%—which is the same level of the average since 2000.
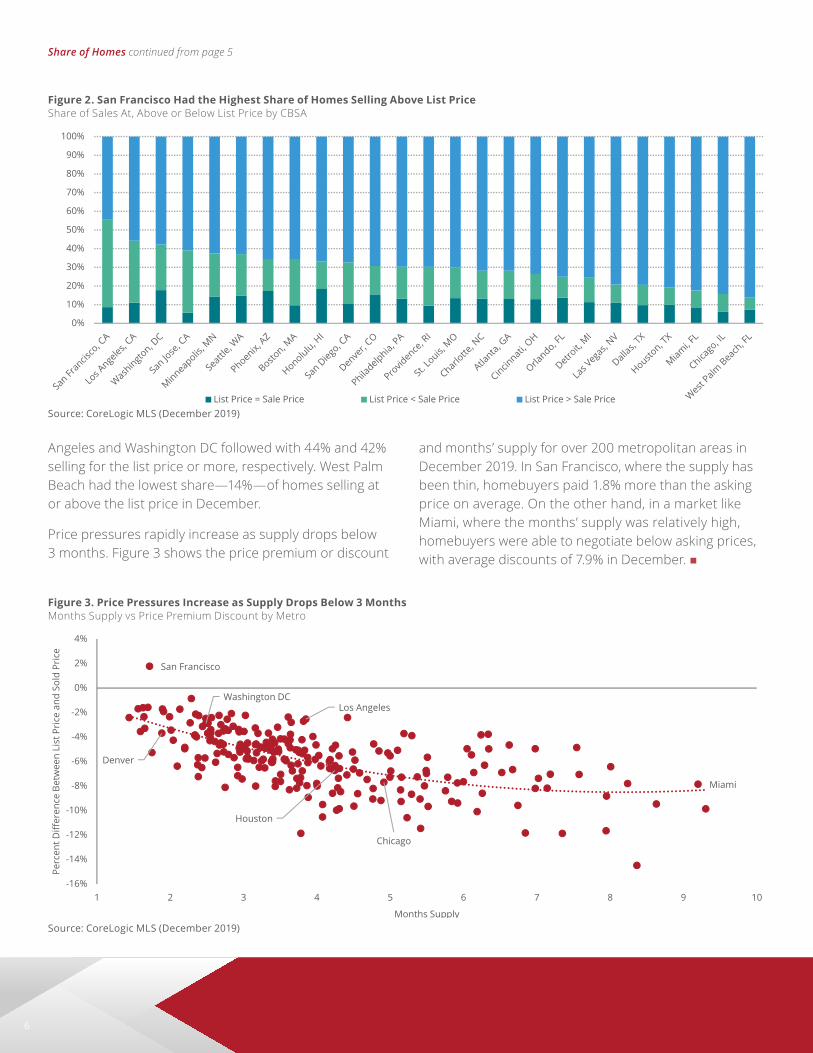
Housing markets are different across the nation and sales and listing patterns vary geographically. Figure 2 shows the share of homes that sold at, above, or below their list prices in 20 metropolitan areas during December 2019. San Francisco had the largest share of homes—56%—that sold for at least the list price. Los
Share of Homes Selling at or Above List Price Back to Long Term AverageOver 29% of Homes Sold at or Above List Price in December 2019
Shu ChenPrincipal, Economist, Office of the Chief Economist
Shu Chen holds the title principal, economist for the CoreLogic information solutions group. In this role, she is part of the Office of the Chief Economist working with senior economists to provide insights for the Home Price Index, foreclosure reports and she regularly performs analysis of the home value equity report.
Continued on page 6
Figure 1. Share of Sales At, Above or Below the List Price Drops Back to Normal Levels
©2019 CoreLogic, Inc. All Rights Reserved.
0%
10%
20%
30%
40%
50%
60%
70%
80%
90%
100%
Jan-
00
Jul-0
0
Jan-
01
Jul-0
1
Jan-
02
Jul-0
2
Jan-
03
Jul-0
3
Jan-
04
Jul-0
4
Jan-
05
Jul-0
5
Jan-
06
Jul-0
6
Jan-
07
Jul-0
7
Jan-
08
Jul-0
8
Jan-
09
Jul-0
9
Jan-
10
Jul-1
0
Jan-
11
Jul-1
1
Jan-
12
Jul-1
2
Jan-
13
Jul-1
3
Jan-
14
Jul-1
4
Jan-
15
Jul-1
5
Jan-
16
Jul-1
6
Jan-
17
Jul-1
7
Jan-
18
Jul-1
8
Jan-
19
Jul-1
9
List Price < Sale Price List Price = Sale Price List Price > Sale Price
1
3 chen fig 1 Subhead copy goes here
Source: CoreLogic MLS (December 2019)
6
Share of Homes continued from page 5
Angeles and Washington DC followed with 44% and 42% selling for the list price or more, respectively. West Palm Beach had the lowest share—14%—of homes selling at or above the list price in December.
Price pressures rapidly increase as supply drops below 3 months. Figure 3 shows the price premium or discount
and months’ supply for over 200 metropolitan areas in December 2019. In San Francisco, where the supply has been thin, homebuyers paid 1.8% more than the asking price on average. On the other hand, in a market like Miami, where the months’ supply was relatively high, homebuyers were able to negotiate below asking prices, with average discounts of 7.9% in December.
Figure 2. San Francisco Had the Highest Share of Homes Selling Above List PriceShare of Sales At, Above or Below List Price by CBSA
©2019 CoreLogic, Inc. All Rights Reserved.
0%
10%
20%
30%
40%
50%
60%
70%
80%
90%
100%
List Price = Sale Price List Price < Sale Price List Price > Sale Price
2
3 chen fig 2 Subhead copy goes here
Source: CoreLogic MLS (December 2019)
Figure 3. Price Pressures Increase as Supply Drops Below 3 MonthsMonths Supply vs Price Premium Discount by Metro
©2019 CoreLogic, Inc. All Rights Reserved.
San Francisco
Denver
Washington DCLos Angeles
Houston
Chicago
Miami
-16%
-14%
-12%
-10%
-8%
-6%
-4%
-2%
0%
2%
4%
1 2 3 4 5 6 7 8 9 10
Perc
ent D
iffer
ence
Bet
wee
n Li
st P
rice
and
Sol
d Pr
ice
Months Supply
3
3 chen fig 3 Subhead copy goes here
Source: CoreLogic MLS (December 2019)
7
Continued on page 8
� The nation’s overall delinquency rate was 3.7% in December.
� The serious delinquency rate and the foreclosure rate have flattened out at low levels.
1 Data in this report is provided by TrueStandings Servicing . https://www .corelogic .com/products/truestandings-servicing .aspx2 The data in this report date back to January 1999 .
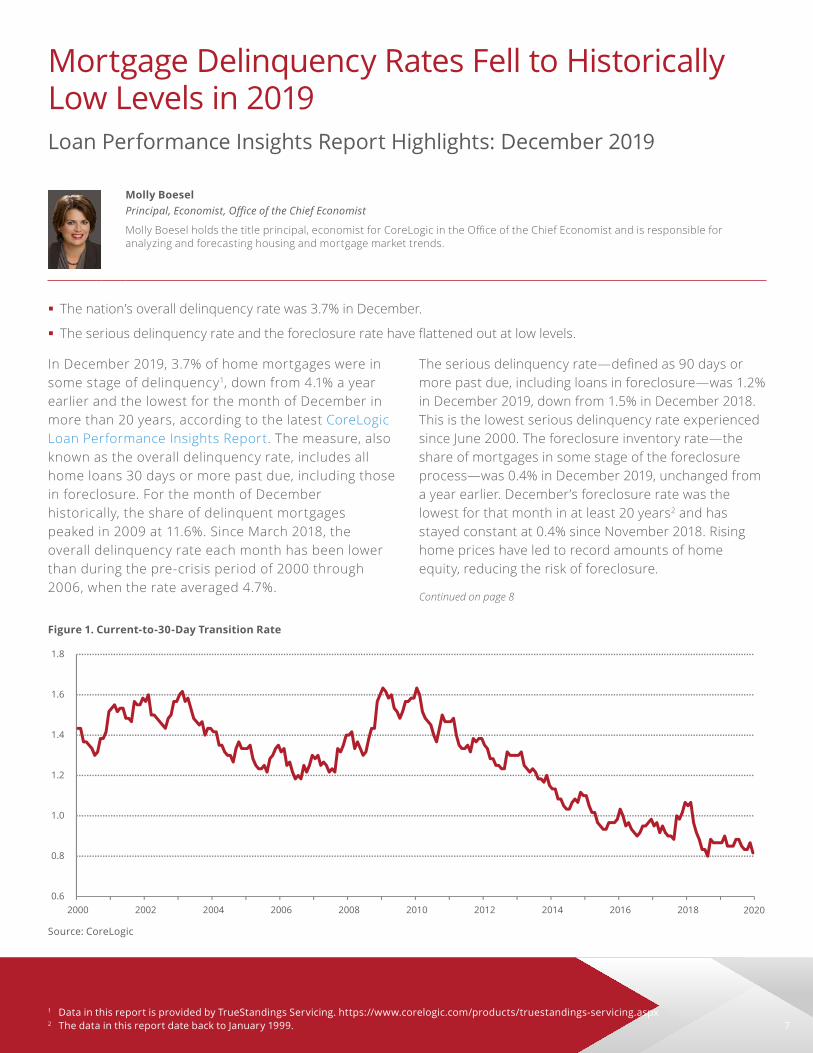
In December 2019, 3.7% of home mortgages were in some stage of delinquency1, down from 4.1% a year earlier and the lowest for the month of December in more than 20 years, according to the latest CoreLogic Loan Performance Insights Report. The measure, also known as the overall delinquency rate, includes all home loans 30 days or more past due, including those in foreclosure. For the month of December historically, the share of delinquent mortgages peaked in 2009 at 11.6%. Since March 2018, the overall delinquency rate each month has been lower than during the pre-crisis period of 2000 through 2006, when the rate averaged 4.7%.
The serious delinquency rate—defined as 90 days or more past due, including loans in foreclosure—was 1.2% in December 2019, down from 1.5% in December 2018. This is the lowest serious delinquency rate experienced since June 2000. The foreclosure inventory rate—the share of mortgages in some stage of the foreclosure process—was 0.4% in December 2019, unchanged from a year earlier. December’s foreclosure rate was the lowest for that month in at least 20 years2 and has stayed constant at 0.4% since November 2018. Rising home prices have led to record amounts of home equity, reducing the risk of foreclosure.
Mortgage Delinquency Rates Fell to Historically Low Levels in 2019 Loan Performance Insights Report Highlights: December 2019
Molly BoeselPrincipal, Economist, Office of the Chief Economist
Molly Boesel holds the title principal, economist for CoreLogic in the Office of the Chief Economist and is responsible for analyzing and forecasting housing and mortgage market trends.
Figure 1. Current-to-30-Day Transition Rate
©2019 CoreLogic, Inc. All Rights Reserved.
0.6
0.8
1.0
1.2
1.4
1.6
1.8
2000 2002 2004 2006 2008 2010 2012 2014 2016 2018
1
3 boesel fig 1 Subhead copy goes here
2020
Source: CoreLogic
8
Mortgage Delinquency Rates continued from page 7
The share of mortgages that were 30 to 59 days past due—considered early-stage delinquencies—was 1.8% in December 2019, down from 2% in December 2018. The share of mortgages 60 to 89 days past due was 0.6% in December 2019, down from 0.7% in December 2018.
In addition to delinquency rates, CoreLogic tracks the rate at which mortgages transition from one stage of delinquency to the next, such as going from current to 30 days past due. Figure 1 shows that in December 2019 the current- to 30-day transition rate remained well below levels during the housing crisis. The December current- to 30-day rate was 0.8%, down from 0.9% a year earlier. The 30- to 60-day transition rate was 15.2% in December, down from 17% in December 2018, and the 60- to 90-day transition rate was 25.3% in December, down from 27.5% a year earlier.
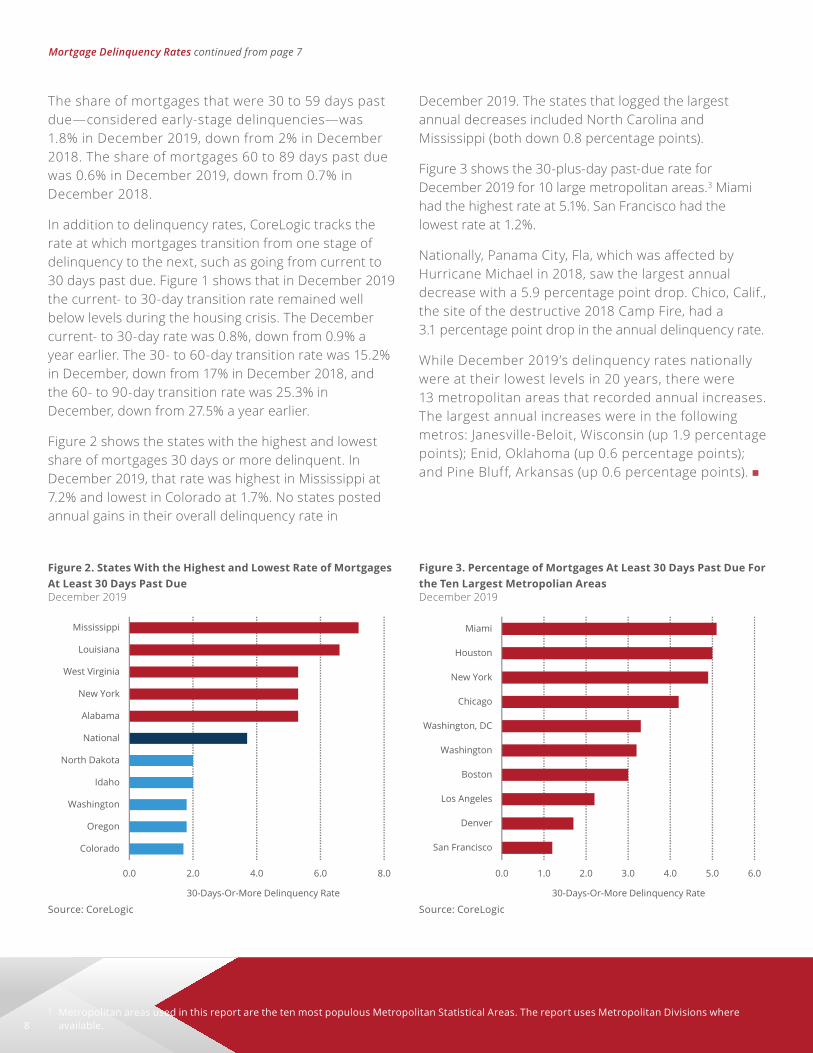
Figure 2 shows the states with the highest and lowest share of mortgages 30 days or more delinquent. In December 2019, that rate was highest in Mississippi at 7.2% and lowest in Colorado at 1.7%. No states posted annual gains in their overall delinquency rate in
3 Metropolitan areas used in this report are the ten most populous Metropolitan Statistical Areas . The report uses Metropolitan Divisions where available .
December 2019. The states that logged the largest annual decreases included North Carolina and Mississippi (both down 0.8 percentage points).
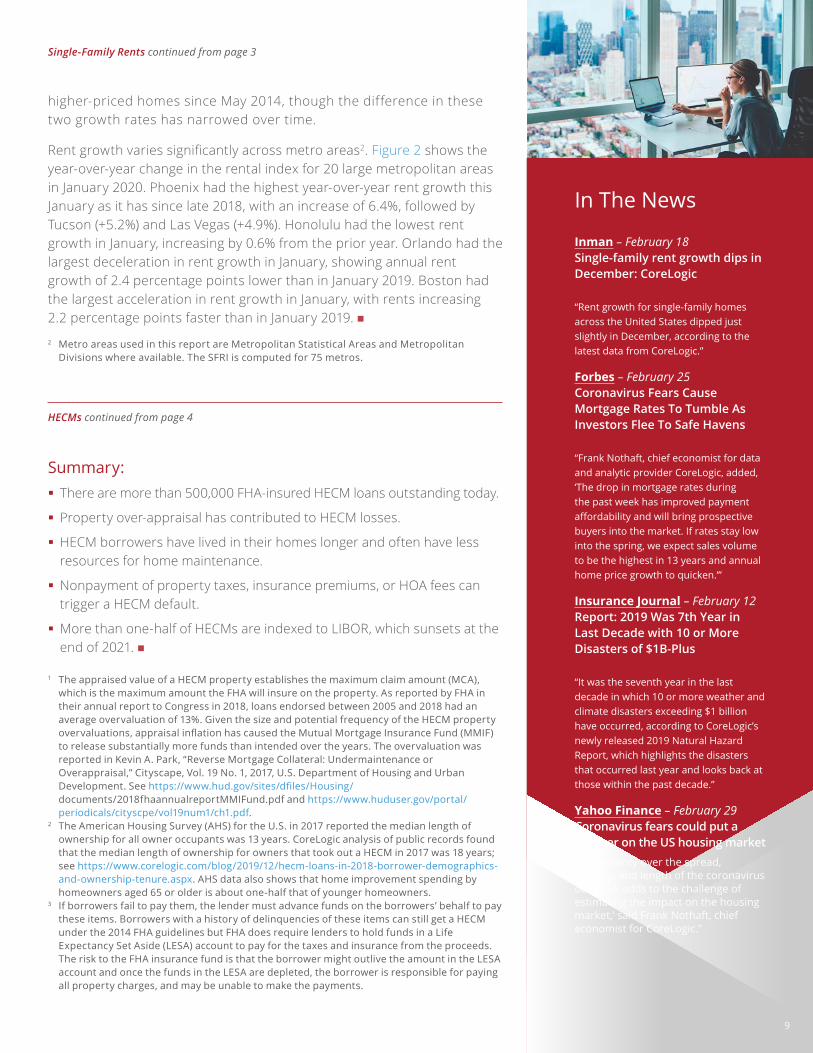
Figure 3 shows the 30-plus-day past-due rate for December 2019 for 10 large metropolitan areas.3 Miami had the highest rate at 5.1%. San Francisco had the lowest rate at 1.2%.
Nationally, Panama City, Fla, which was affected by Hurricane Michael in 2018, saw the largest annual decrease with a 5.9 percentage point drop. Chico, Calif., the site of the destructive 2018 Camp Fire, had a 3.1 percentage point drop in the annual delinquency rate.
While December 2019’s delinquency rates nationally were at their lowest levels in 20 years, there were 13 metropolitan areas that recorded annual increases. The largest annual increases were in the following metros: Janesville-Beloit, Wisconsin (up 1.9 percentage points); Enid, Oklahoma (up 0.6 percentage points); and Pine Bluff, Arkansas (up 0.6 percentage points).
Figure 2. States With the Highest and Lowest Rate of Mortgages At Least 30 Days Past DueDecember 2019
©2019 CoreLogic, Inc. All Rights Reserved.
0.0 2.0 4.0 6.0 8.0
Colorado
Oregon
Washington
Idaho
North Dakota
National
Alabama
New York
West Virginia
Louisiana
Mississippi
30-Days-Or-More Delinquency Rate
2
3 boesel fig 2 Subhead copy goes here
Source: CoreLogic
Figure 3. Percentage of Mortgages At Least 30 Days Past Due For the Ten Largest Metropolian AreasDecember 2019
©2019 CoreLogic, Inc. All Rights Reserved.
0.0 1.0 2.0 3.0 4.0 5.0 6.0
San Francisco
Denver
Los Angeles
Boston
Washington
Washington, DC
Chicago
New York
Houston
Miami
30-Days-Or-More Delinquency Rate
3
3 boesel fig 3 Subhead copy goes here
Source: CoreLogic
9
higher-priced homes since May 2014, though the difference in these two growth rates has narrowed over time.
Rent growth varies significantly across metro areas2. Figure 2 shows the year-over-year change in the rental index for 20 large metropolitan areas in January 2020. Phoenix had the highest year-over-year rent growth this January as it has since late 2018, with an increase of 6.4%, followed by Tucson (+5.2%) and Las Vegas (+4.9%). Honolulu had the lowest rent growth in January, increasing by 0.6% from the prior year. Orlando had the largest deceleration in rent growth in January, showing annual rent growth of 2.4 percentage points lower than in January 2019. Boston had the largest acceleration in rent growth in January, with rents increasing 2.2 percentage points faster than in January 2019.
2 Metro areas used in this report are Metropolitan Statistical Areas and Metropolitan Divisions where available. The SFRI is computed for 75 metros.
In The News
Inman – February 18Single-family rent growth dips in December: CoreLogic
“Rent growth for single-family homes across the United States dipped just slightly in December, according to the latest data from CoreLogic .”
Forbes – February 25Coronavirus Fears Cause Mortgage Rates To Tumble As Investors Flee To Safe Havens
“Frank Nothaft, chief economist for data and analytic provider CoreLogic, added, ‘The drop in mortgage rates during the past week has improved payment affordability and will bring prospective buyers into the market . If rates stay low into the spring, we expect sales volume to be the highest in 13 years and annual home price growth to quicken .’”
Insurance Journal – February 12Report: 2019 Was 7th Year in Last Decade with 10 or More Disasters of $1B-Plus
“It was the seventh year in the last decade in which 10 or more weather and climate disasters exceeding $1 billion have occurred, according to CoreLogic’s newly released 2019 Natural Hazard Report, which highlights the disasters that occurred last year and looks back at those within the past decade .”
Yahoo Finance – February 29Coronavirus fears could put a damper on the US housing market“’Uncertainty over the spread, severity, and length of the coronavirus outbreak adds to the challenge of estimating the impact on the housing market,’ said Frank Nothaft, chief economist for CoreLogic .”
Summary: � There are more than 500,000 FHA-insured HECM loans outstanding today.
� Property over-appraisal has contributed to HECM losses.
� HECM borrowers have lived in their homes longer and often have less resources for home maintenance.
� Nonpayment of property taxes, insurance premiums, or HOA fees can trigger a HECM default.
� More than one-half of HECMs are indexed to LIBOR, which sunsets at the end of 2021.
1 The appraised value of a HECM property establishes the maximum claim amount (MCA), which is the maximum amount the FHA will insure on the property . As reported by FHA in their annual report to Congress in 2018, loans endorsed between 2005 and 2018 had an average overvaluation of 13% . Given the size and potential frequency of the HECM property overvaluations, appraisal inflation has caused the Mutual Mortgage Insurance Fund (MMIF) to release substantially more funds than intended over the years . The overvaluation was reported in Kevin A . Park, “Reverse Mortgage Collateral: Undermaintenance or Overappraisal,” Cityscape, Vol . 19 No . 1, 2017, U .S . Department of Housing and Urban Development . See https://www.hud.gov/sites/dfiles/Housing/documents/2018fhaannualreportMMIFund .pdf and https://www .huduser .gov/portal/periodicals/cityscpe/vol19num1/ch1 .pdf .
2 The American Housing Survey (AHS) for the U .S . in 2017 reported the median length of ownership for all owner occupants was 13 years . CoreLogic analysis of public records found that the median length of ownership for owners that took out a HECM in 2017 was 18 years; see https://www .corelogic .com/blog/2019/12/hecm-loans-in-2018-borrower-demographics-and-ownership-tenure .aspx . AHS data also shows that home improvement spending by homeowners aged 65 or older is about one-half that of younger homeowners .
3 If borrowers fail to pay them, the lender must advance funds on the borrowers’ behalf to pay these items . Borrowers with a history of delinquencies of these items can still get a HECM under the 2014 FHA guidelines but FHA does require lenders to hold funds in a Life Expectancy Set Aside (LESA) account to pay for the taxes and insurance from the proceeds . The risk to the FHA insurance fund is that the borrower might outlive the amount in the LESA account and once the funds in the LESA are depleted, the borrower is responsible for paying all property charges, and may be unable to make the payments .
HECMs continued from page 4
Single-Family Rents continued from page 3
10
Charts & Graphs
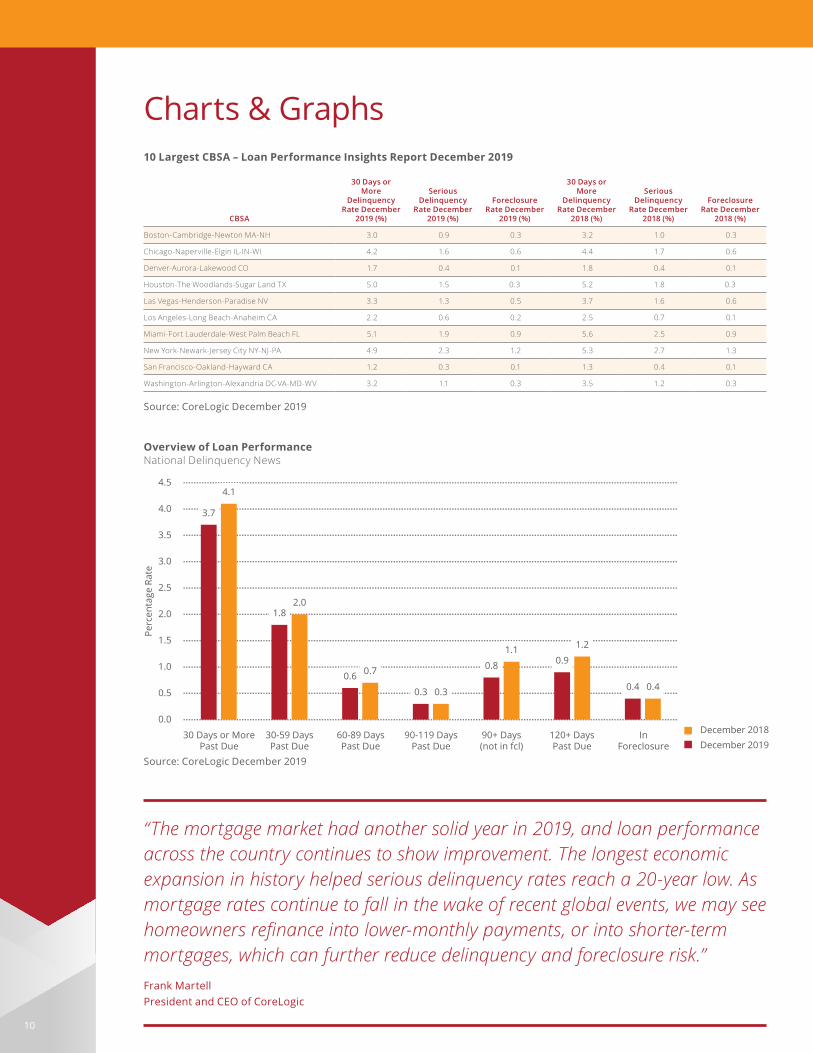
“The mortgage market had another solid year in 2019, and loan performance across the country continues to show improvement. The longest economic expansion in history helped serious delinquency rates reach a 20-year low. As mortgage rates continue to fall in the wake of recent global events, we may see homeowners refinance into lower-monthly payments, or into shorter-term mortgages, which can further reduce delinquency and foreclosure risk.”Frank Martell President and CEO of CoreLogic
10 Largest CBSA – Loan Performance Insights Report December 2019
CBSA
30 Days or More
Delinquency Rate December
2019 (%)
Serious Delinquency
Rate December 2019 (%)
Foreclosure Rate December
2019 (%)
30 Days or More
Delinquency Rate December
2018 (%)
Serious Delinquency
Rate December 2018 (%)
Foreclosure Rate December
2018 (%)
Boston-Cambridge-Newton MA-NH 3.0 0.9 0.3 3.2 1.0 0.3
Chicago-Naperville-Elgin IL-IN-WI 4.2 1.6 0.6 4.4 1.7 0.6
Denver-Aurora-Lakewood CO 1.7 0.4 0.1 1.8 0.4 0.1
Houston-The Woodlands-Sugar Land TX 5.0 1.5 0.3 5.2 1.8 0.3
Las Vegas-Henderson-Paradise NV 3.3 1.3 0.5 3.7 1.6 0.6
Los Angeles-Long Beach-Anaheim CA 2.2 0.6 0.2 2.5 0.7 0.1
Miami-Fort Lauderdale-West Palm Beach FL 5.1 1.9 0.9 5.6 2.5 0.9
New York-Newark-Jersey City NY-NJ-PA 4.9 2.3 1.2 5.3 2.7 1.3
San Francisco-Oakland-Hayward CA 1.2 0.3 0.1 1.3 0.4 0.1
Washington-Arlington-Alexandria DC-VA-MD-WV 3.2 1.1 0.3 3.5 1.2 0.3
Source: CoreLogic December 2019
Overview of Loan PerformanceNational Delinquency News
©2020 CoreLogic, Inc. All Rights Reserved.
3.7
1.8
0.6
0.3
0.8 0.9
0.4
4.1
2.0
0.7
0.3
1.1 1.2
0.4
0.0
0.5
1.0
1.5
2.0
2.5
3.0
3.5
4.0
4.5
Perc
enta
ge R
ate
2.78x5.93; no legend, no horizontal axis labels; 7ptloan performance sept 2019: national overview
90-119 DaysPast Due
120+ DaysPast Due
60-89 DaysPast Due
30 Days or MorePast Due
30-59 DaysPast Due
90+ Days(not in fcl)
InForeclosure
December 2018December 2019
Source: CoreLogic December 2019
11
State
Month- Over-Month
Percent Change Year-Over-Year
Forecasted Month- Over-Month
Percent Change
Forecasted Year-Over-Year Percent Change
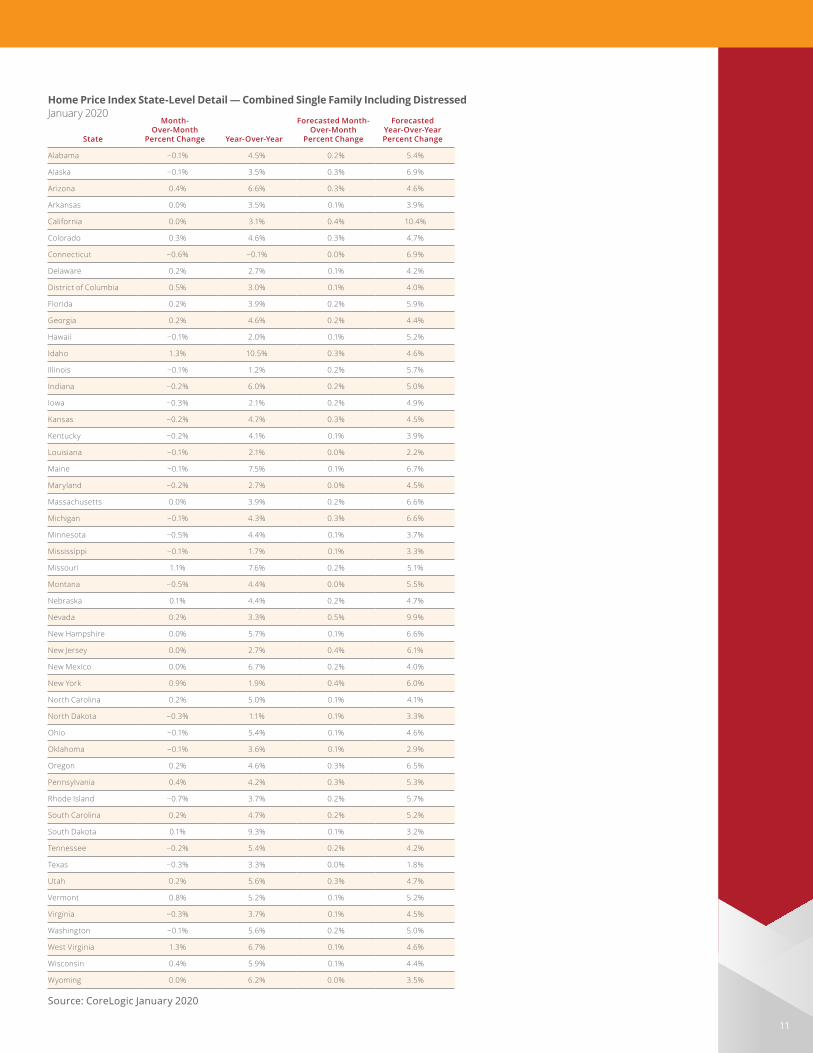
Alabama −0.1% 4.5% 0.2% 5.4%
Alaska −0.1% 3.5% 0.3% 6.9%
Arizona 0.4% 6.6% 0.3% 4.6%
Arkansas 0.0% 3.5% 0.1% 3.9%
California 0.0% 3.1% 0.4% 10.4%
Colorado 0.3% 4.6% 0.3% 4.7%
Connecticut −0.6% −0.1% 0.0% 6.9%
Delaware 0.2% 2.7% 0.1% 4.2%
District of Columbia 0.5% 3.0% 0.1% 4.0%
Florida 0.2% 3.9% 0.2% 5.9%
Georgia 0.2% 4.6% 0.2% 4.4%
Hawaii −0.1% 2.0% 0.1% 5.2%
Idaho 1.3% 10.5% 0.3% 4.6%
Illinois −0.1% 1.2% 0.2% 5.7%
Indiana −0.2% 6.0% 0.2% 5.0%
Iowa −0.3% 2.1% 0.2% 4.9%
Kansas −0.2% 4.7% 0.3% 4.5%
Kentucky −0.2% 4.1% 0.1% 3.9%
Louisiana −0.1% 2.1% 0.0% 2.2%
Maine −0.1% 7.5% 0.1% 6.7%
Maryland −0.2% 2.7% 0.0% 4.5%
Massachusetts 0.0% 3.9% 0.2% 6.6%
Michigan −0.1% 4.3% 0.3% 6.6%
Minnesota −0.5% 4.4% 0.1% 3.7%
Mississippi −0.1% 1.7% 0.1% 3.3%
Missouri 1.1% 7.6% 0.2% 5.1%
Montana −0.5% 4.4% 0.0% 5.5%
Nebraska 0.1% 4.4% 0.2% 4.7%
Nevada 0.2% 3.3% 0.5% 9.9%
New Hampshire 0.0% 5.7% 0.1% 6.6%
New Jersey 0.0% 2.7% 0.4% 6.1%
New Mexico 0.0% 6.7% 0.2% 4.0%
New York 0.9% 1.9% 0.4% 6.0%
North Carolina 0.2% 5.0% 0.1% 4.1%
North Dakota −0.3% 1.1% 0.1% 3.3%
Ohio −0.1% 5.4% 0.1% 4.6%
Oklahoma −0.1% 3.6% 0.1% 2.9%
Oregon 0.2% 4.6% 0.3% 6.5%
Pennsylvania 0.4% 4.2% 0.3% 5.3%
Rhode Island −0.7% 3.7% 0.2% 5.7%
South Carolina 0.2% 4.7% 0.2% 5.2%
South Dakota 0.1% 9.3% 0.1% 3.2%
Tennessee −0.2% 5.4% 0.2% 4.2%
Texas −0.3% 3.3% 0.0% 1.8%
Utah 0.2% 5.6% 0.3% 4.7%
Vermont 0.8% 5.2% 0.1% 5.2%
Virginia −0.3% 3.7% 0.1% 4.5%
Washington −0.1% 5.6% 0.2% 5.0%
West Virginia 1.3% 6.7% 0.1% 4.6%
Wisconsin 0.4% 5.9% 0.1% 4.4%
Wyoming 0.0% 6.2% 0.0% 3.5%
Source: CoreLogic January 2020
Home Price Index State-Level Detail — Combined Single Family Including DistressedJanuary 2020
12
Charts & Graphs (continued)
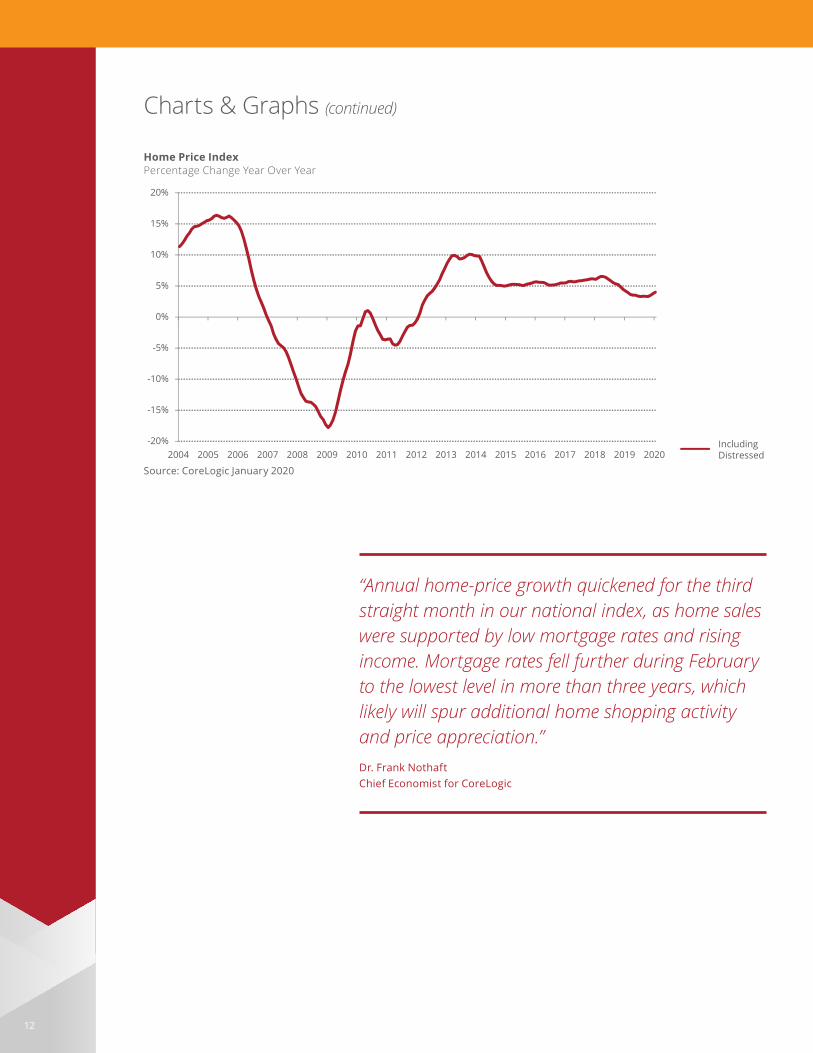
“Annual home-price growth quickened for the third straight month in our national index, as home sales were supported by low mortgage rates and rising income. Mortgage rates fell further during February to the lowest level in more than three years, which likely will spur additional home shopping activity and price appreciation.”Dr . Frank Nothaft Chief Economist for CoreLogic
Home Price IndexPercentage Change Year Over Year
©2020 CoreLogic, Inc. All Rights Reserved.
-20%
-15%
-10%
-5%
0%
5%
10%
15%
20%
2004 2005 2006 2007 2008 2009 2010 2011 2012 2013 2014 2015 2016 2017 2018 2019 2020Including Distressed
3.04x5.67; 7pt typehpi as of jan 2020
Source: CoreLogic January 2020
13
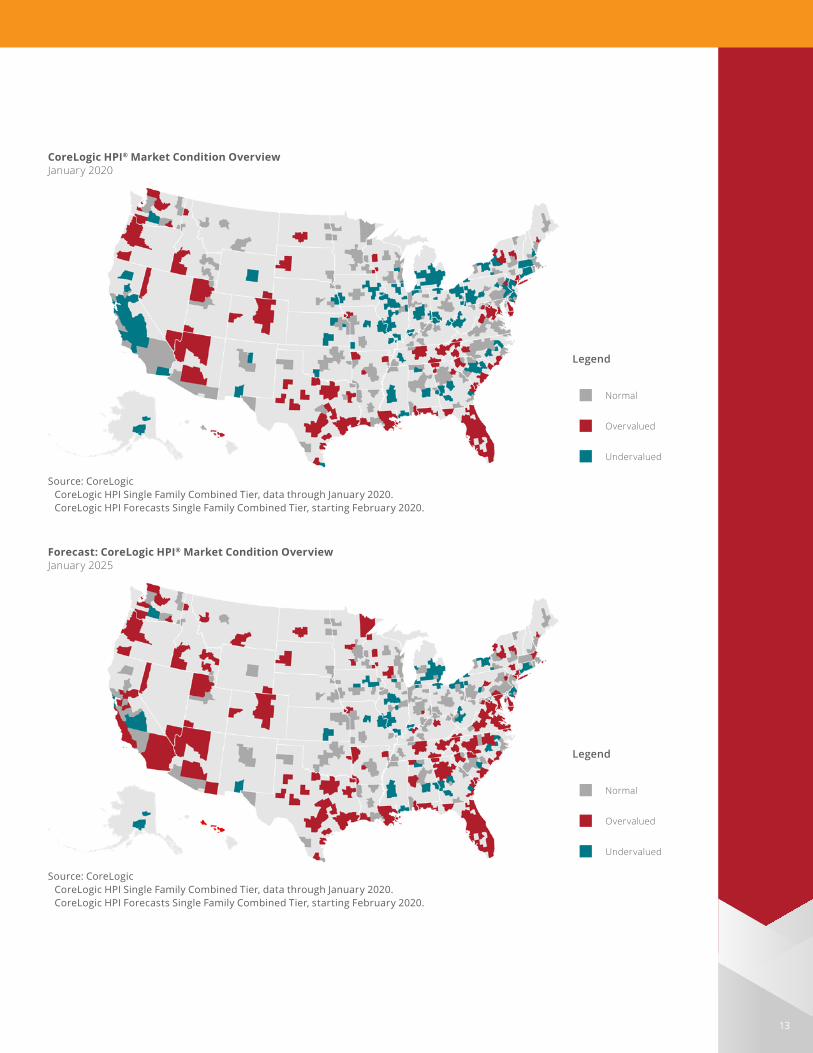
CoreLogic HPI® Market Condition OverviewJanuary 2020
Source: CoreLogic CoreLogic HPI Single Family Combined Tier, data through January 2020 . CoreLogic HPI Forecasts Single Family Combined Tier, starting February 2020 .
Legend
■ Normal
■ Overvalued
■ Undervalued
Forecast: CoreLogic HPI® Market Condition OverviewJanuary 2025
Source: CoreLogic CoreLogic HPI Single Family Combined Tier, data through January 2020 . CoreLogic HPI Forecasts Single Family Combined Tier, starting February 2020 .
Legend
■ Normal
■ Overvalued
■ Undervalued
14
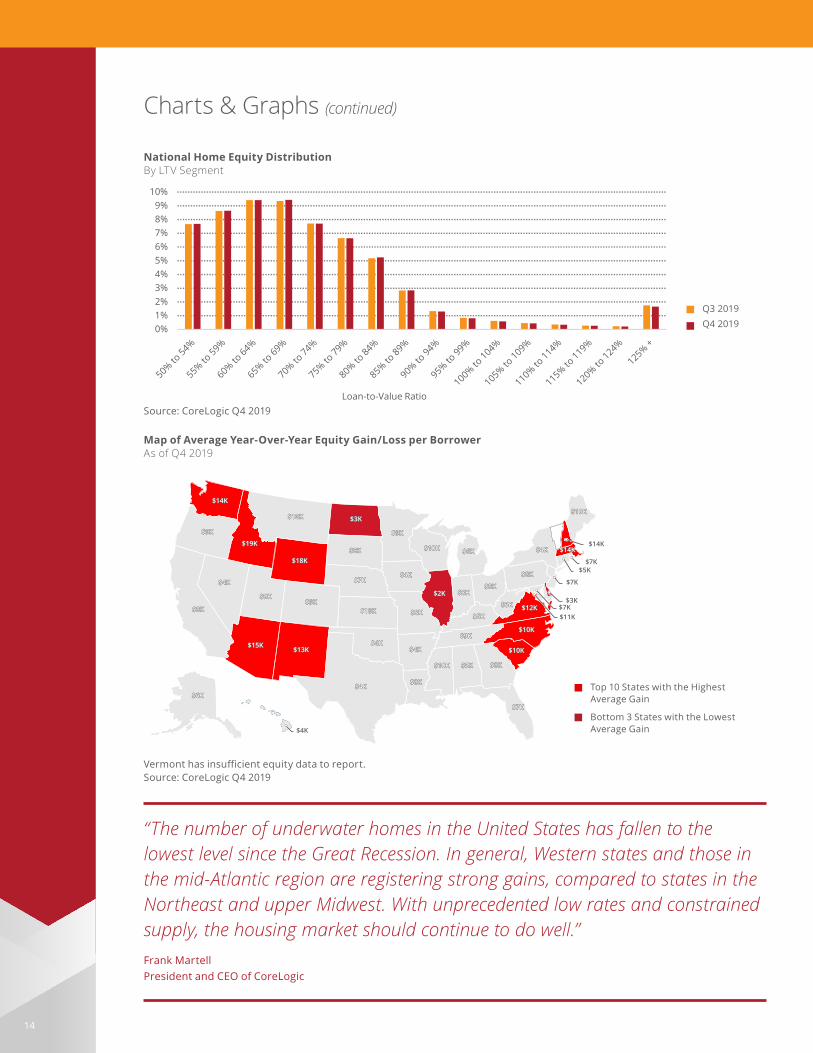
Map of Average Year-Over-Year Equity Gain/Loss per BorrowerAs of Q4 2019
$14K$14K
$9K$9K
$8K$8K
$4K$4K
$9K$9K
$15K$15K$13K$13K
$9K$9K
$18K$18K
$10K$10K $3K$3K
$8K$8K
$7K$7K
$10K$10K
$4K$4K
$4K$4K$8K$8K
$4K$4K
$8K$8K
$4K$4K
$9K$9K
$10K$10K
$2K$2K
$6K$6K
$8K$8K$8K$8K
$5K$5K
$9K$9K
$10K$10K $5K$5K $8K$8K
$7K$7K
$10K$10K
$10K$10K
$12K$12K$6K$6K
$8K$8K
$4K$4K
$19K$19K
$14K$14K
$6K$6K
$19K$19K
$14K
$9K
$8K
$4K
$9K
$15K$13K
$9K
$18K
$10K $3K
$8K
$7K
$10K
$4K
$4K$8K
$4K
$8K
$4K
$9K
$10K
$2K
$6K
$8K$8K
$5K
$9K
$10K $5K $8K
$7K
$10K
$10K
$12K$6K
$8K
$4K
$19K
$14K
$6K
$4K
$11K$7K
$3K
$7K
$5K$7K
$14K$19K
Vermont has insufficient equity data to report.Source: CoreLogic Q4 2019
Charts & Graphs (continued)
“The number of underwater homes in the United States has fallen to the lowest level since the Great Recession. In general, Western states and those in the mid-Atlantic region are registering strong gains, compared to states in the Northeast and upper Midwest. With unprecedented low rates and constrained supply, the housing market should continue to do well.”Frank Martell President and CEO of CoreLogic
National Home Equity DistributionBy LTV Segment
©2020 CoreLogic, Inc. All Rights Reserved.
0%1%2%3%4%5%6%7%8%9%
10%
Loan-to-Value Ratio
2.54x5.78q4 2019 equity
Including Distressed
Q3 2019Q4 2019
Source: CoreLogic Q4 2019
Top 10 States with the Highest Average Gain
Bottom 3 States with the Lowest Average Gain
15
Variable Definition
Total Sales The total number of all home-sale transactions during the month.
Total Sales 12-Month sum The total number of all home-sale transactions for the last 12 months.
Total Sales YoY Change 0.3%
12-Month sum Percentage increase or decrease in current 12 months of total sales over the prior 12 months of total sales
New Home Sales The total number of newly constructed residentail housing units sold during the month.
New Home Sales 0.9%
Median Price The median price for newly constructed residential housing units during the month.
Existing Home Sales The number of previously constucted homes that were sold to an unaffiliated third party. DOES NOT INCLUDE REO AND SHORT SALES.
REO Sales Number of bank owned properties that were sold to an unaffiliated third party.
REO Sales Share The number of REO Sales in a given month divided by total sales.
REO Price Discount The average price of a REO divided by the average price of an existing-home sale.
REO Pct The count of loans in REO as a percentage of the overall count of loans for the reporting period.
Short Sales The number of short sales. A short sale is a sale of real estate in which the sale proceeds fall short of the balance owed on the property's loan.
Short Sales Share The number of Short Sales in a given month divided by total sales.
Short Sale Price Discount The average price of a Short Sale divided by the average price of an existing-home sale.
Short Sale Pct The count of loans in Short Sale as a percentage of the overall count of loans for the month.
Distressed Sales Share The percentage of the total sales that were a distressed sale (REO or short sale).
Distressed Sales Share 0.4%
(sales 12-Month sum) The sum of the REO Sales 12-month sum and the Short Sales 12-month sum divided by the total sales 12-month sum.
HPI MoM Percent increase or decrease in HPI single family combined series over a month ago.
HPI YoY Percent increase or decrease in HPI single family combined series over a year ago.
HPI MoM Excluding Distressed Percent increase or decrease in HPI single family combined excluding distressed series over a month ago.
HPI YoY Excluding Distressed Percent increase or decrease in HPI single family combined excluding distressed series over a year ago.
HPI Percent Change 0.2%
from Peak Percent increase or decrease in HPI single family combined series from the respective peak value in the index.
90 Days + DQ Pct The percentage of the overall loan count that are 90 or more days delinquent as of the reporting period. This percentage includes loans that are in foreclosure or REO.
Stock of 90+ Delinquencies YoY Chg Percent change year-over-year of the number of 90+ day delinquencies in the current month.
Foreclosure Pct The percentage of the overall loan count that is currently in foreclosure as of the reporting period.
Percent Change Stock of Foreclosures from Peak
Percent increase or decrease in the number of foreclosures from the respective peak number of foreclosures.
Pre-foreclosure Filings The number of mortgages where the lender has initiated foreclosure proceedings and it has been made known through public notice (NOD).
Completed Foreclosures A completed foreclosure occurs when a property is auctioned and results in either the purchase of the home at auction or the property is taken by the lender as part of their Real Estate Owned (REO) inventory.
Negative Equity Share The percentage of mortgages in negative equity. The denominator for the negative equity percent is based on the number of mortgages from the public record.
Negative Equity The number of mortgages in negative equity. Negative equity is calculated as the difference between the current value of the property and the origination value of the mortgage. If the mortgage debt is greater than the current value, the property is considered to be in a negative equity position. We estimate current UPB value, not origination value.
Months' Supply of Distressed Homes 0.4%
(total sales 12-Month avg) The months it would take to sell off all homes currently in distress of 90 days delinquency or greater based on the current sales pace.
Price/Income Ratio CoreLogic HPI™ divided by Nominal Personal Income provided by the Bureau of Economic Analysis and indexed to January 1976.
Conforming Prime Serious Delinquency Rate
The rate serious delinquency mortgages which are within the legislated purchase limits of Fannie Mae and Freddie Mac. The conforming limits are legislated by the Federal Housing Finance Agency (FHFA).
Jumbo Prime Serious Delinquency Rate
The rate serious delinquency mortgages which are larger than the legislated purchase limits of Fannie Mae and Freddie Mac. The conforming limits are legislated by the Federal Housing Finance Agency (FHFA).

16
This page is intentionally blank.

17
Source: CoreLogicThe data provided is for use only by the primary recipient or the primary recipient's publication or broadcast . This data may not be re-sold, republished or licensed to any other source, including publications and sources owned by the primary recipient's parent company without prior written permission from CoreLogic . Any CoreLogic data used for publication or broadcast, in whole or in part, must be sourced as coming from CoreLogic, a data and analytics company . For use with broadcast or web content, the citation must directly accompany first reference of the data . If the data is illustrated with maps, charts, graphs or other visual elements, the CoreLogic logo must be included on screen or website . For questions, analysis or interpretation of the data, contact CoreLogic at newsmedia@corelogic .com . Data provided may not be modified without the prior written permission of CoreLogic. Do not use the data in any unlawful manner . This data is compiled from public records, contributory databases and proprietary analytics, and its accuracy is dependent upon these sources .
For more information please call 866 .774 .3282The MarketPulse is a newsletter published by CoreLogic, Inc . ("CoreLogic") . This information is made available for informational purposes only and is not intended to provide specific commercial, financial or investment advice. CoreLogic disclaims all express or implied representations, warranties and guaranties, including implied warranties of merchantability, fitness for a particular purpose, title, or non-infringement. Neither CoreLogic nor its licensors make any representations, warranties or guaranties as to the quality, reliability, suitability, truth, accuracy, timeliness or completeness of the information contained in this newsletter . CoreLogic shall not be held responsible for any errors, inaccuracies, omissions or losses resulting directly or indirectly from your reliance on the information contained in this newsletter .
This newsletter contains links to third-party websites that are not controlled by CoreLogic . CoreLogic is not responsible for the content of third-party websites . The use of a third-party website and its content is governed by the terms and conditions set forth on the third-party’s site and CoreLogic assumes no responsibility for your use of or activities on the site .
More Insights
The CoreLogic Insights Blog
(corelogic.com/blog) provides an
expanded perspective on housing
economies and property markets,
including policy, trends, regulation
and compliance. Please visit the
blog for timely analysis, thought-
provoking data visualizations and
unique commentary from our team
in the Office of the Chief Economist.
CoreLogic Econ
CoreLogic

corelogic .com
©2020 CoreLogic, Inc . All Rights Reserved . CORELOGIC, the CoreLogic logo, CORELOGIC HPI and CORELOGIC CASE-SHILLER INDEXES are trademarks of CoreLogic,
Inc . and/or its subsidiaries . All other trademarks are the property of their respective holders .17-MKTPLSE-0320-00