Embed Size (px)
Citation preview
The Market Viability of Nuclear Hydrogen Technologies
ANL-07/13
Decision and Information Sciences Division

Availability of This ReportThis report is available, at no cost, at http://www.osti.gov/bridge. It is also available on paper to the U.S. Department of Energy and its contractors, for a processing fee, from:
U.S. Department of Energy
OfficeofScientificandTechnicalInformation
P.O. Box 62
Oak Ridge, TN 37831-0062
phone (865) 576-8401
fax (865) 576-5728
Disclaimer
This report was prepared as an account of work sponsored by an agency of the United States Government. Neither the United States
Governmentnoranyagencythereof,norUChicagoArgonne,LLC,noranyoftheiremployeesorofficers,makesanywarranty,express
or implied, or assumes any legal liability or responsibility for the accuracy, completeness, or usefulness of any information, apparatus,
product,orprocessdisclosed,orrepresentsthatitsusewouldnotinfringeprivatelyownedrights.Referencehereintoanyspecific
commercial product, process, or service by trade name, trademark, manufacturer, or otherwise, does not necessarily constitute or imply
its endorsement, recommendation, or favoring by the United States Government or any agency thereof. The views and opinions of
documentauthorsexpressedhereindonotnecessarilystateorreflectthoseoftheUnitedStatesGovernmentoranyagencythereof,
Argonne National Laboratory, or UChicago Argonne, LLC.
About Argonne National Laboratory Argonne is a U.S. Department of Energy laboratory managed by UChicago Argonne, LLC under contract DE-AC02-06CH11357. The Laboratory’s main facility is outside Chicago, at 9700 South Cass Avenue, Argonne, Illinois 60439. For information about Argonne, see www.anl.gov.
The Market Viability of Nuclear Hydrogen Technologies
ANL-07/13
by A. Botterud1, B. Yildiz2, G. Conzelmann1, and M.C. Petri31Decision and Information Sciences Division, Argonne National Laboratory2Nuclear Engineering Division, Argonne National Laboratory3Applied Science and Technology, Argonne National Laboratory
February 2007
The Market Viability of Nuclear Hydrogen Technologies
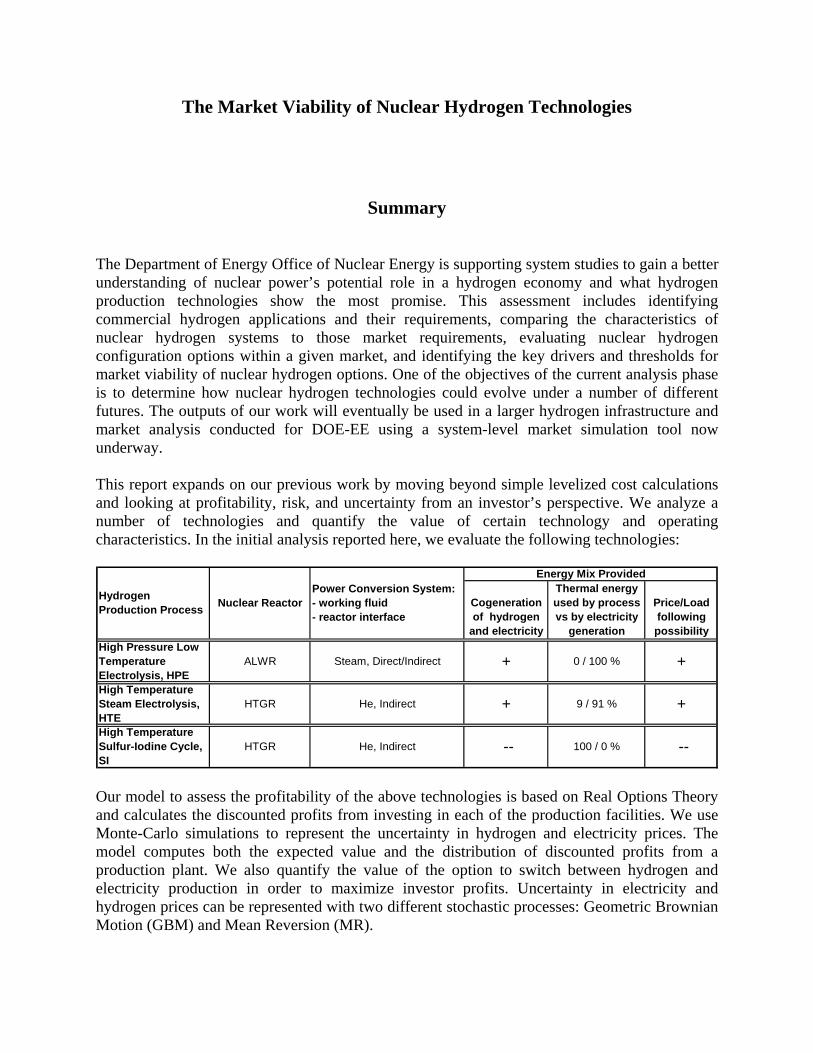
Summary The Department of Energy Office of Nuclear Energy is supporting system studies to gain a better understanding of nuclear power’s potential role in a hydrogen economy and what hydrogen production technologies show the most promise. This assessment includes identifying commercial hydrogen applications and their requirements, comparing the characteristics of nuclear hydrogen systems to those market requirements, evaluating nuclear hydrogen configuration options within a given market, and identifying the key drivers and thresholds for market viability of nuclear hydrogen options. One of the objectives of the current analysis phase is to determine how nuclear hydrogen technologies could evolve under a number of different futures. The outputs of our work will eventually be used in a larger hydrogen infrastructure and market analysis conducted for DOE-EE using a system-level market simulation tool now underway. This report expands on our previous work by moving beyond simple levelized cost calculations and looking at profitability, risk, and uncertainty from an investor’s perspective. We analyze a number of technologies and quantify the value of certain technology and operating characteristics. In the initial analysis reported here, we evaluate the following technologies:
Cogeneration of hydrogen
and electricity
Thermal energy used by process vs by electricity
generation
Price/Load following possibility
+High Pressure Low Temperature Electrolysis, HPE
ALWR Steam, Direct/Indirect +
Energy Mix Provided
0 / 100 %
Nuclear ReactorPower Conversion System: - working fluid - reactor interface
Hydrogen Production Process
HTGR He, Indirect + +
High Temperature Sulfur-Iodine Cycle, SI
HTGR He, Indirect -- --
9 / 91 %
100 / 0 %
High Temperature Steam Electrolysis, HTE
Our model to assess the profitability of the above technologies is based on Real Options Theory and calculates the discounted profits from investing in each of the production facilities. We use Monte-Carlo simulations to represent the uncertainty in hydrogen and electricity prices. The model computes both the expected value and the distribution of discounted profits from a production plant. We also quantify the value of the option to switch between hydrogen and electricity production in order to maximize investor profits. Uncertainty in electricity and hydrogen prices can be represented with two different stochastic processes: Geometric Brownian Motion (GBM) and Mean Reversion (MR).
The Market Viability of Nuclear Hydrogen Technologies Page ii Summary
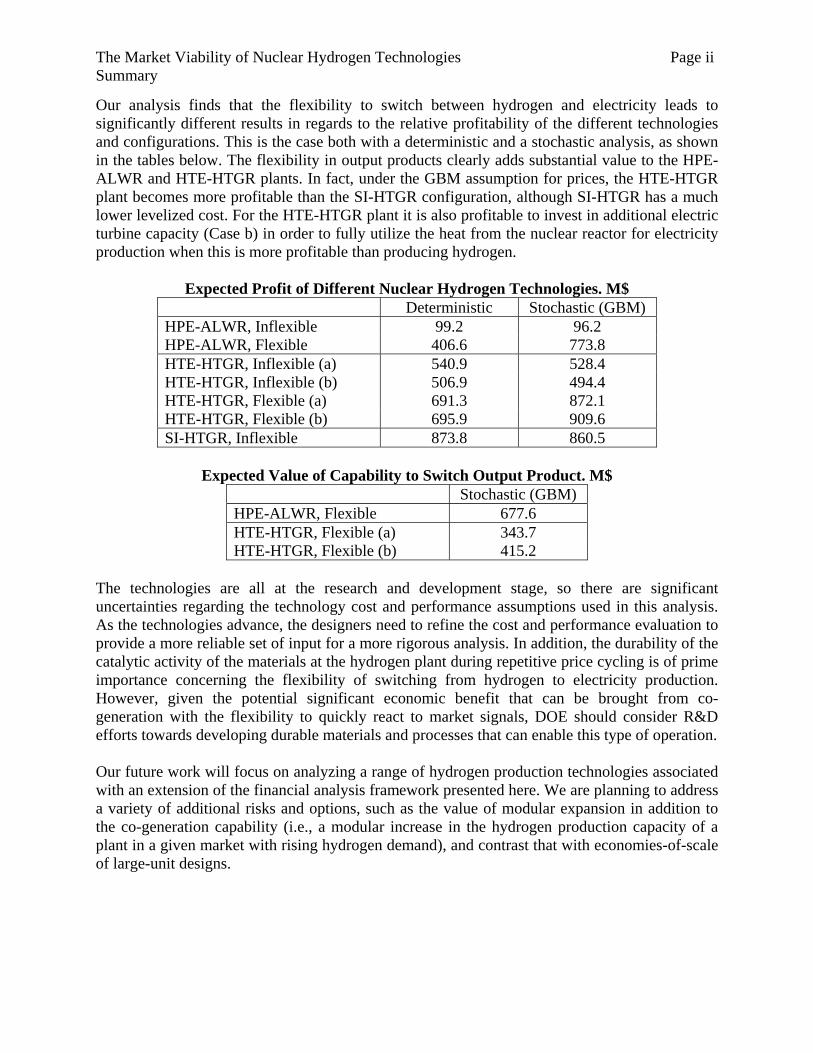
Our analysis finds that the flexibility to switch between hydrogen and electricity leads to significantly different results in regards to the relative profitability of the different technologies and configurations. This is the case both with a deterministic and a stochastic analysis, as shown in the tables below. The flexibility in output products clearly adds substantial value to the HPE-ALWR and HTE-HTGR plants. In fact, under the GBM assumption for prices, the HTE-HTGR plant becomes more profitable than the SI-HTGR configuration, although SI-HTGR has a much lower levelized cost. For the HTE-HTGR plant it is also profitable to invest in additional electric turbine capacity (Case b) in order to fully utilize the heat from the nuclear reactor for electricity production when this is more profitable than producing hydrogen.
Expected Profit of Different Nuclear Hydrogen Technologies. M$ Deterministic Stochastic (GBM) HPE-ALWR, Inflexible 99.2 96.2 HPE-ALWR, Flexible 406.6 773.8 HTE-HTGR, Inflexible (a) 540.9 528.4 HTE-HTGR, Inflexible (b) 506.9 494.4 HTE-HTGR, Flexible (a) 691.3 872.1 HTE-HTGR, Flexible (b) 695.9 909.6 SI-HTGR, Inflexible 873.8 860.5
Expected Value of Capability to Switch Output Product. M$
Stochastic (GBM) HPE-ALWR, Flexible 677.6 HTE-HTGR, Flexible (a) 343.7 HTE-HTGR, Flexible (b) 415.2
The technologies are all at the research and development stage, so there are significant uncertainties regarding the technology cost and performance assumptions used in this analysis. As the technologies advance, the designers need to refine the cost and performance evaluation to provide a more reliable set of input for a more rigorous analysis. In addition, the durability of the catalytic activity of the materials at the hydrogen plant during repetitive price cycling is of prime importance concerning the flexibility of switching from hydrogen to electricity production. However, given the potential significant economic benefit that can be brought from co-generation with the flexibility to quickly react to market signals, DOE should consider R&D efforts towards developing durable materials and processes that can enable this type of operation. Our future work will focus on analyzing a range of hydrogen production technologies associated with an extension of the financial analysis framework presented here. We are planning to address a variety of additional risks and options, such as the value of modular expansion in addition to the co-generation capability (i.e., a modular increase in the hydrogen production capacity of a plant in a given market with rising hydrogen demand), and contrast that with economies-of-scale of large-unit designs.
Abbreviations
ABMS: agent-based modeling and simulation
ACR: advanced CANDU reactor
AGR: advanced gas reactor
AHTR: advanced high-temperature reactor
ALWR: advanced light-water reactor
APWR: advanced pressurized water reactor
GBM: Geometric Brownian Motion
GFR: gas fast reactor
GHG: greenhouse gas
HPE: high-pressure electrolysis
HTE/HTSE: high-temperature steam electrolysis
HTGR: high-temperature gas-cooled reactor (pebble bed or prismatic)
LFR: lead-cooled (Pb/Pb-Bi) fast reactors
LWR: light-water reactor
MHR: modular helium reactor
MR: Mean Reversion
S-AGR: supercritical CO2 advanced gas reactor
SBWR: simplified boiling water reactor;
SCWR: supercritical water-cooled reactor
SMR: steam methane reforming
SFR: sodium-cooled fast reactor
SI: sulfur-iodine
TC: thermochemical
TI: Technology Insights
VHTR: very high temperature gas-cooled reactor
WSP: Westinghouse hybrid sulfur process

Table of Contents
1. Introduction................................................................................................................................. 1 2. Nuclear Hydrogen Market Outlook ............................................................................................ 4 3. Nuclear Hydrogen Production Technologies.............................................................................. 8
3.1 Overview of Nuclear Hydrogen Production Technologies:............................................ 8 3.1.1 Advanced Nuclear Reactors.................................................................................... 9
3.2 Nuclear Hydrogen Production Technologies in this Analysis........................................ 9 3.3 Plant Configurations and Operating Modes.................................................................. 10
3.3.1 Operation Modes of the Technologies Considered in this Analysis..................... 12 3.3.2 Some Challenges in Load/Price-Following Co-generation Operation ................. 13
4. Investment under Uncertainty and Real Options ...................................................................... 15 5. A Stochastic Model for Appraisal of H2 Production Technologies.......................................... 17
5.1 Nomenclature................................................................................................................ 17 5.2 Assumptions.................................................................................................................. 18 5.3 Profit Calculation and Cash Flow Analysis .................................................................. 19 5.4 Representation of Electricity and Hydrogen Prices ...................................................... 20
5.4.1 Geometric Brownian Motion (GBM) ................................................................... 20 5.4.2 Mean Reversion (MR) .......................................................................................... 21 5.4.3 Estimation of Parameters in Price Models............................................................ 21
5.5 Monte Carlo Simulations .............................................................................................. 21 6. Profitability Analysis of Three Nuclear H2 Production Technologies...................................... 22
6.1 Cost Assumptions for the Nuclear Hydrogen Production Technologies ...................... 22 6.2 Uncertainty in H2 and Electricity Prices ....................................................................... 23 6.3 HPE-ALWR.................................................................................................................. 25 6.4 HTE-HTGR................................................................................................................... 26 6.5 SI-HTGR....................................................................................................................... 28 6.6 Sensitivity Analysis ...................................................................................................... 28 6.7 Summary and Discussion of Results............................................................................. 30
7. Conclusions and Future Work .................................................................................................. 32 References .................................................................................................................................... 34
The Market Viability of Nuclear Hydrogen Technologies
Audun Botterud
Bilge Yildiz Guenter Conzelmann
Mark C. Petri
Argonne National Laboratory
September 15, 2006
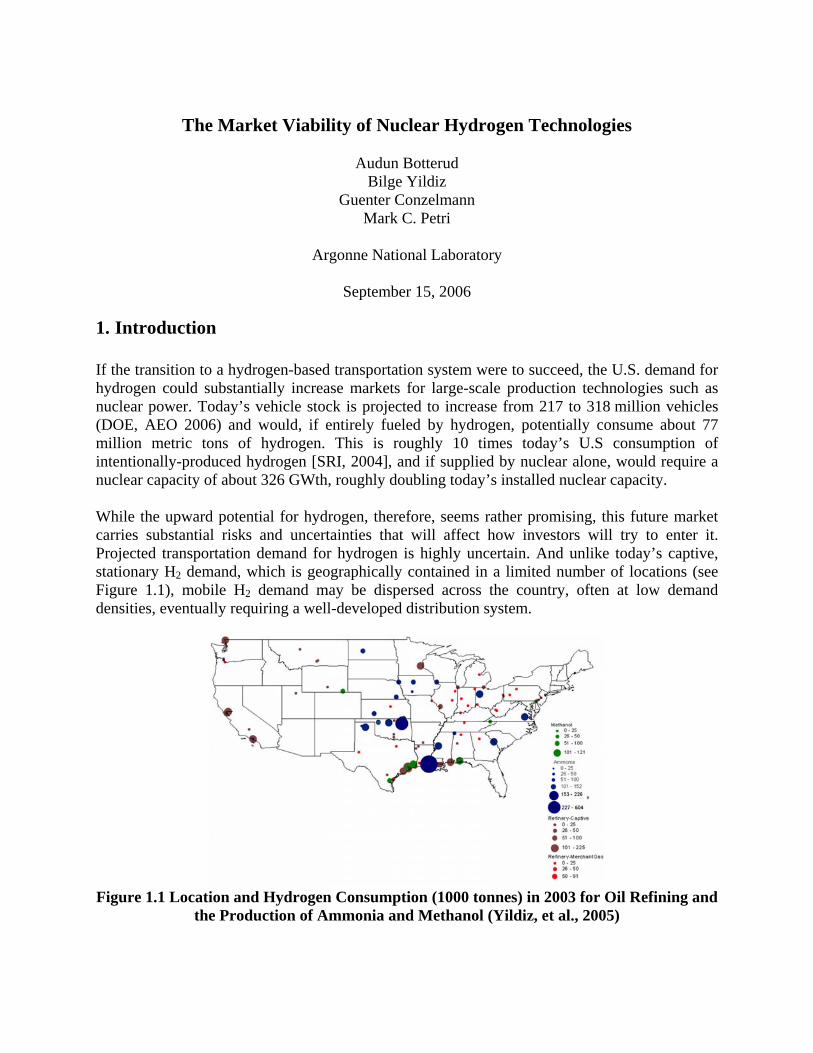
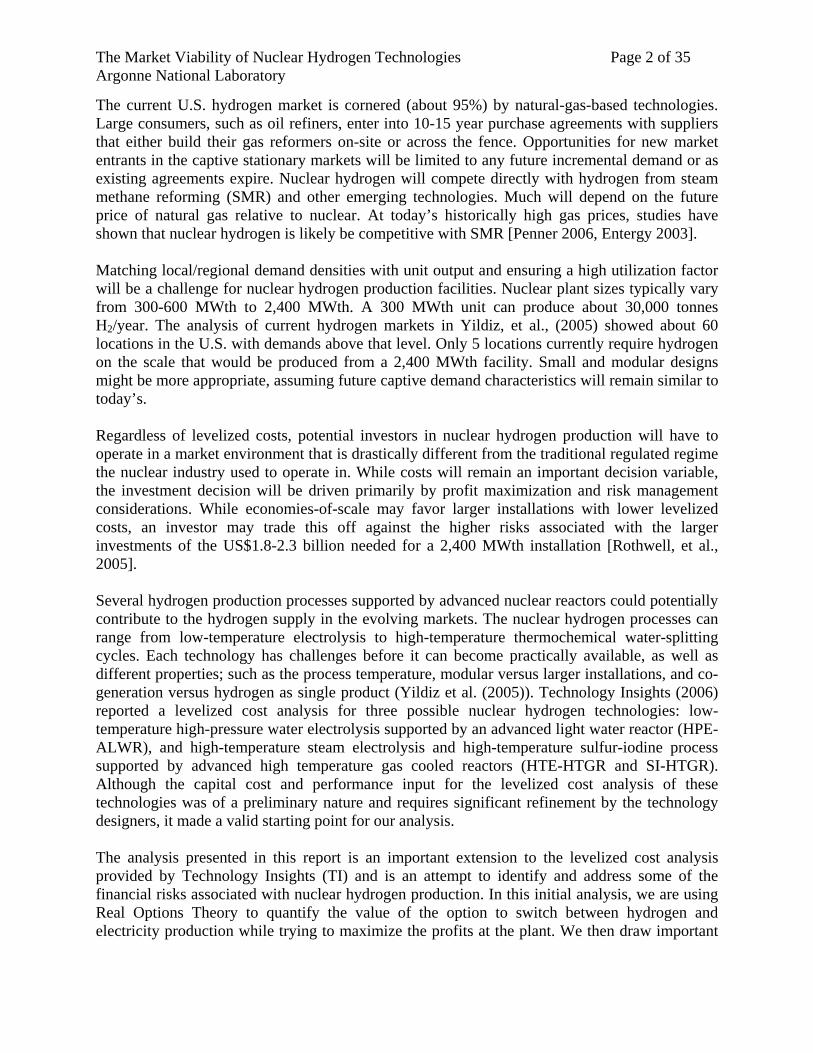
1. Introduction If the transition to a hydrogen-based transportation system were to succeed, the U.S. demand for hydrogen could substantially increase markets for large-scale production technologies such as nuclear power. Today’s vehicle stock is projected to increase from 217 to 318 million vehicles (DOE, AEO 2006) and would, if entirely fueled by hydrogen, potentially consume about 77 million metric tons of hydrogen. This is roughly 10 times today’s U.S consumption of intentionally-produced hydrogen [SRI, 2004], and if supplied by nuclear alone, would require a nuclear capacity of about 326 GWth, roughly doubling today’s installed nuclear capacity. While the upward potential for hydrogen, therefore, seems rather promising, this future market carries substantial risks and uncertainties that will affect how investors will try to enter it. Projected transportation demand for hydrogen is highly uncertain. And unlike today’s captive, stationary H2 demand, which is geographically contained in a limited number of locations (see Figure 1.1), mobile H2 demand may be dispersed across the country, often at low demand densities, eventually requiring a well-developed distribution system.
Figure 1.1 Location and Hydrogen Consumption (1000 tonnes) in 2003 for Oil Refining and
the Production of Ammonia and Methanol (Yildiz, et al., 2005)
The Market Viability of Nuclear Hydrogen Technologies Page 2 of 35 Argonne National Laboratory
The current U.S. hydrogen market is cornered (about 95%) by natural-gas-based technologies. Large consumers, such as oil refiners, enter into 10-15 year purchase agreements with suppliers that either build their gas reformers on-site or across the fence. Opportunities for new market entrants in the captive stationary markets will be limited to any future incremental demand or as existing agreements expire. Nuclear hydrogen will compete directly with hydrogen from steam methane reforming (SMR) and other emerging technologies. Much will depend on the future price of natural gas relative to nuclear. At today’s historically high gas prices, studies have shown that nuclear hydrogen is likely be competitive with SMR [Penner 2006, Entergy 2003]. Matching local/regional demand densities with unit output and ensuring a high utilization factor will be a challenge for nuclear hydrogen production facilities. Nuclear plant sizes typically vary from 300-600 MWth to 2,400 MWth. A 300 MWth unit can produce about 30,000 tonnes H2/year. The analysis of current hydrogen markets in Yildiz, et al., (2005) showed about 60 locations in the U.S. with demands above that level. Only 5 locations currently require hydrogen on the scale that would be produced from a 2,400 MWth facility. Small and modular designs might be more appropriate, assuming future captive demand characteristics will remain similar to today’s. Regardless of levelized costs, potential investors in nuclear hydrogen production will have to operate in a market environment that is drastically different from the traditional regulated regime the nuclear industry used to operate in. While costs will remain an important decision variable, the investment decision will be driven primarily by profit maximization and risk management considerations. While economies-of-scale may favor larger installations with lower levelized costs, an investor may trade this off against the higher risks associated with the larger investments of the US$1.8-2.3 billion needed for a 2,400 MWth installation [Rothwell, et al., 2005]. Several hydrogen production processes supported by advanced nuclear reactors could potentially contribute to the hydrogen supply in the evolving markets. The nuclear hydrogen processes can range from low-temperature electrolysis to high-temperature thermochemical water-splitting cycles. Each technology has challenges before it can become practically available, as well as different properties; such as the process temperature, modular versus larger installations, and co-generation versus hydrogen as single product (Yildiz et al. (2005)). Technology Insights (2006) reported a levelized cost analysis for three possible nuclear hydrogen technologies: low-temperature high-pressure water electrolysis supported by an advanced light water reactor (HPE-ALWR), and high-temperature steam electrolysis and high-temperature sulfur-iodine process supported by advanced high temperature gas cooled reactors (HTE-HTGR and SI-HTGR). Although the capital cost and performance input for the levelized cost analysis of these technologies was of a preliminary nature and requires significant refinement by the technology designers, it made a valid starting point for our analysis. The analysis presented in this report is an important extension to the levelized cost analysis provided by Technology Insights (TI) and is an attempt to identify and address some of the financial risks associated with nuclear hydrogen production. In this initial analysis, we are using Real Options Theory to quantify the value of the option to switch between hydrogen and electricity production while trying to maximize the profits at the plant. We then draw important

The Market Viability of Nuclear Hydrogen Technologies Page 3 of 35 Argonne National Laboratory
conclusions regarding some design and configuration issues based on the profitability analysis. Future work will focus on the option value of modularity in addition to co-generation capability (i.e., a modular increase in the hydrogen production capacity of a plant in a given market with rising hydrogen demand). Our results offer insights into the question of market viability of nuclear hydrogen technologies and will be used in the larger DOE-EE systems analysis activities.
The Market Viability of Nuclear Hydrogen Technologies Page 4 of 35 Argonne National Laboratory
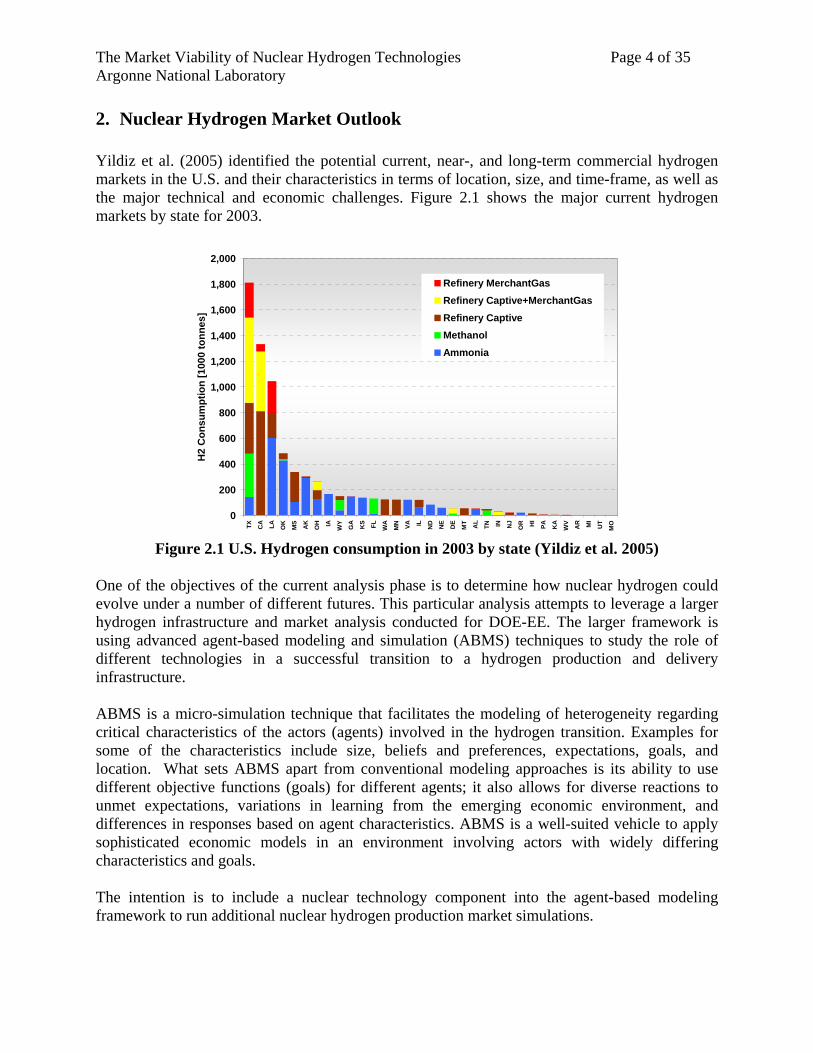
2. Nuclear Hydrogen Market Outlook Yildiz et al. (2005) identified the potential current, near-, and long-term commercial hydrogen markets in the U.S. and their characteristics in terms of location, size, and time-frame, as well as the major technical and economic challenges. Figure 2.1 shows the major current hydrogen markets by state for 2003.
0
200
400
600
800
1,000
1,200
1,400
1,600
1,800
2,000TX C
A LA OK
MS
AK
OH IA WY
GA
KS FL WA
MN VA IL ND NE
DE
MT AL
TN IN NJ
OR HI
PA KA
WV
AR MI
UT
MO
H2
Con
sum
ptio
n [1
000
tonn
es]
Refinery MerchantGasRefinery Captive+MerchantGasRefinery CaptiveMethanolAmmonia
Figure 2.1 U.S. Hydrogen consumption in 2003 by state (Yildiz et al. 2005)
One of the objectives of the current analysis phase is to determine how nuclear hydrogen could evolve under a number of different futures. This particular analysis attempts to leverage a larger hydrogen infrastructure and market analysis conducted for DOE-EE. The larger framework is using advanced agent-based modeling and simulation (ABMS) techniques to study the role of different technologies in a successful transition to a hydrogen production and delivery infrastructure. ABMS is a micro-simulation technique that facilitates the modeling of heterogeneity regarding critical characteristics of the actors (agents) involved in the hydrogen transition. Examples for some of the characteristics include size, beliefs and preferences, expectations, goals, and location. What sets ABMS apart from conventional modeling approaches is its ability to use different objective functions (goals) for different agents; it also allows for diverse reactions to unmet expectations, variations in learning from the emerging economic environment, and differences in responses based on agent characteristics. ABMS is a well-suited vehicle to apply sophisticated economic models in an environment involving actors with widely differing characteristics and goals. The intention is to include a nuclear technology component into the agent-based modeling framework to run additional nuclear hydrogen production market simulations.
The Market Viability of Nuclear Hydrogen Technologies Page 5 of 35 Argonne National Laboratory
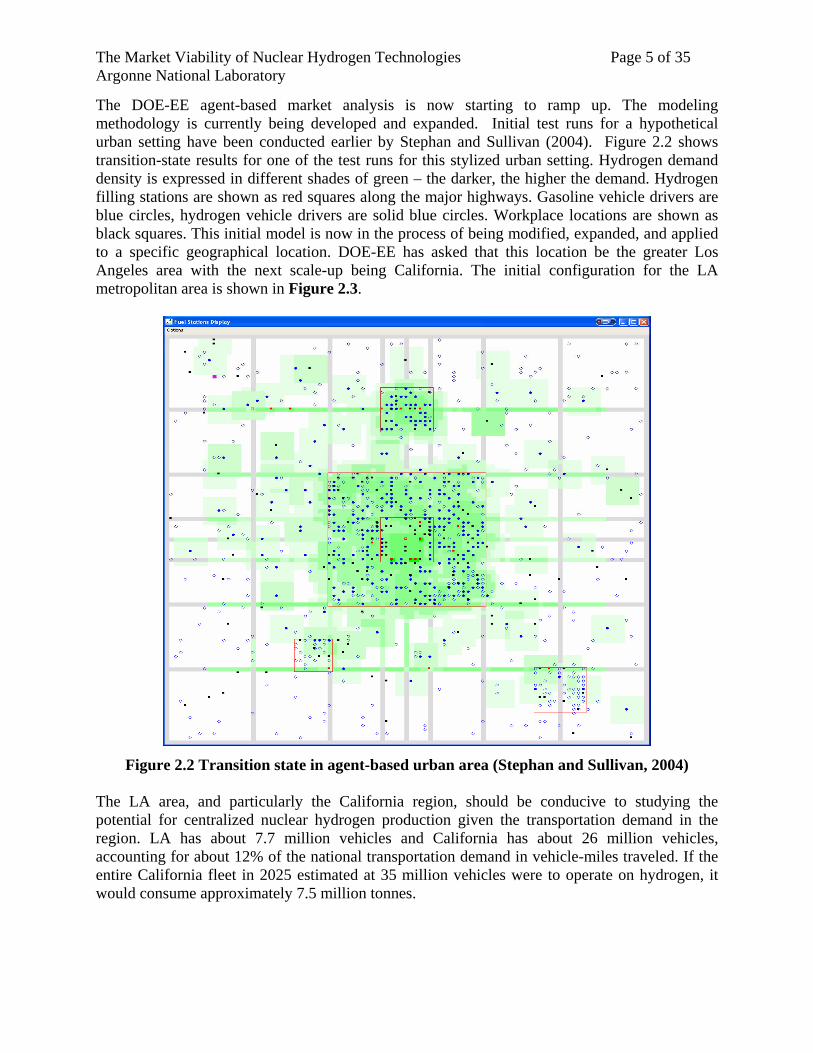
The DOE-EE agent-based market analysis is now starting to ramp up. The modeling methodology is currently being developed and expanded. Initial test runs for a hypothetical urban setting have been conducted earlier by Stephan and Sullivan (2004). Figure 2.2 shows transition-state results for one of the test runs for this stylized urban setting. Hydrogen demand density is expressed in different shades of green – the darker, the higher the demand. Hydrogen filling stations are shown as red squares along the major highways. Gasoline vehicle drivers are blue circles, hydrogen vehicle drivers are solid blue circles. Workplace locations are shown as black squares. This initial model is now in the process of being modified, expanded, and applied to a specific geographical location. DOE-EE has asked that this location be the greater Los Angeles area with the next scale-up being California. The initial configuration for the LA metropolitan area is shown in Figure 2.3.
Figure 2.2 Transition state in agent-based urban area (Stephan and Sullivan, 2004) The LA area, and particularly the California region, should be conducive to studying the potential for centralized nuclear hydrogen production given the transportation demand in the region. LA has about 7.7 million vehicles and California has about 26 million vehicles, accounting for about 12% of the national transportation demand in vehicle-miles traveled. If the entire California fleet in 2025 estimated at 35 million vehicles were to operate on hydrogen, it would consume approximately 7.5 million tonnes.

The Market Viability of Nuclear Hydrogen Technologies Page 6 of 35 Argonne National Laboratory
Figure 2.3 LA configuration in ABMS model
Hydrogen producer agents in the ABMS model make investment decisions at regular intervals (e.g., annually). Each agent goes through its own decision-making process by developing its business expectations regarding the demand for hydrogen and what competitors will do. Portfolio expansion strategies are evaluated and selected if they meet agent objectives. Decisions for all producer agents are aggregated and the model goes on to simulate the next time step. Consumer agents then respond to various signals including the availability of fuel at various locations. If consumers do not find sufficient refueling stations, demand will not grow as anticipated by the producer agents, which will then be used to update the agent expectations (learning) about future hydrogen demand. Producer agents announce their intended investments at which point other agents learn this information and take it into account in the next decision interval. Initially, these announcements will be modeled as given, that is, agents assume that competitors will act on their announcements. In a later stage, we will incorporate uncertainty and learning into the announcement process as not all competitors will follow through on their announced plans.
The Market Viability of Nuclear Hydrogen Technologies Page 7 of 35 Argonne National Laboratory
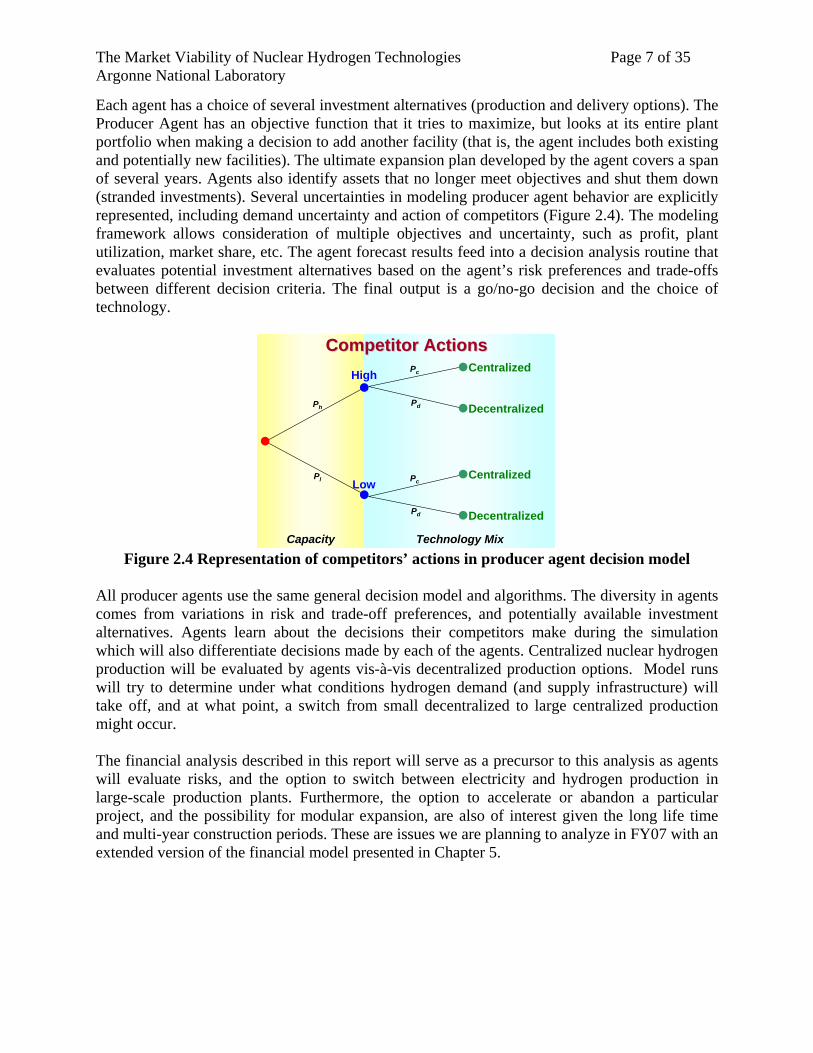
Each agent has a choice of several investment alternatives (production and delivery options). The Producer Agent has an objective function that it tries to maximize, but looks at its entire plant portfolio when making a decision to add another facility (that is, the agent includes both existing and potentially new facilities). The ultimate expansion plan developed by the agent covers a span of several years. Agents also identify assets that no longer meet objectives and shut them down (stranded investments). Several uncertainties in modeling producer agent behavior are explicitly represented, including demand uncertainty and action of competitors (Figure 2.4). The modeling framework allows consideration of multiple objectives and uncertainty, such as profit, plant utilization, market share, etc. The agent forecast results feed into a decision analysis routine that evaluates potential investment alternatives based on the agent’s risk preferences and trade-offs between different decision criteria. The final output is a go/no-go decision and the choice of technology.
CapacityCapacity Technology MixTechnology Mix
Centralized
Decentralized
High
Low
Ph
Pl
Pc
Pd
Pc
Pd
Centralized
Decentralized
Competitor ActionsCompetitor Actions
CapacityCapacity Technology MixTechnology Mix
Centralized
Decentralized
High
Low
Ph
Pl
Pc
Pd
Pc
Pd
Centralized
Decentralized
Competitor ActionsCompetitor Actions
Figure 2.4 Representation of competitors’ actions in producer agent decision model
All producer agents use the same general decision model and algorithms. The diversity in agents comes from variations in risk and trade-off preferences, and potentially available investment alternatives. Agents learn about the decisions their competitors make during the simulation which will also differentiate decisions made by each of the agents. Centralized nuclear hydrogen production will be evaluated by agents vis-à-vis decentralized production options. Model runs will try to determine under what conditions hydrogen demand (and supply infrastructure) will take off, and at what point, a switch from small decentralized to large centralized production might occur. The financial analysis described in this report will serve as a precursor to this analysis as agents will evaluate risks, and the option to switch between electricity and hydrogen production in large-scale production plants. Furthermore, the option to accelerate or abandon a particular project, and the possibility for modular expansion, are also of interest given the long life time and multi-year construction periods. These are issues we are planning to analyze in FY07 with an extended version of the financial model presented in Chapter 5.
The Market Viability of Nuclear Hydrogen Technologies Page 8 of 35 Argonne National Laboratory
3. Nuclear Hydrogen Production Technologies The objective of this section is to present the nuclear hydrogen production technologies and operation configurations for consideration in our analysis of their economic profitability under the uncertainties present in evolving hydrogen markets.
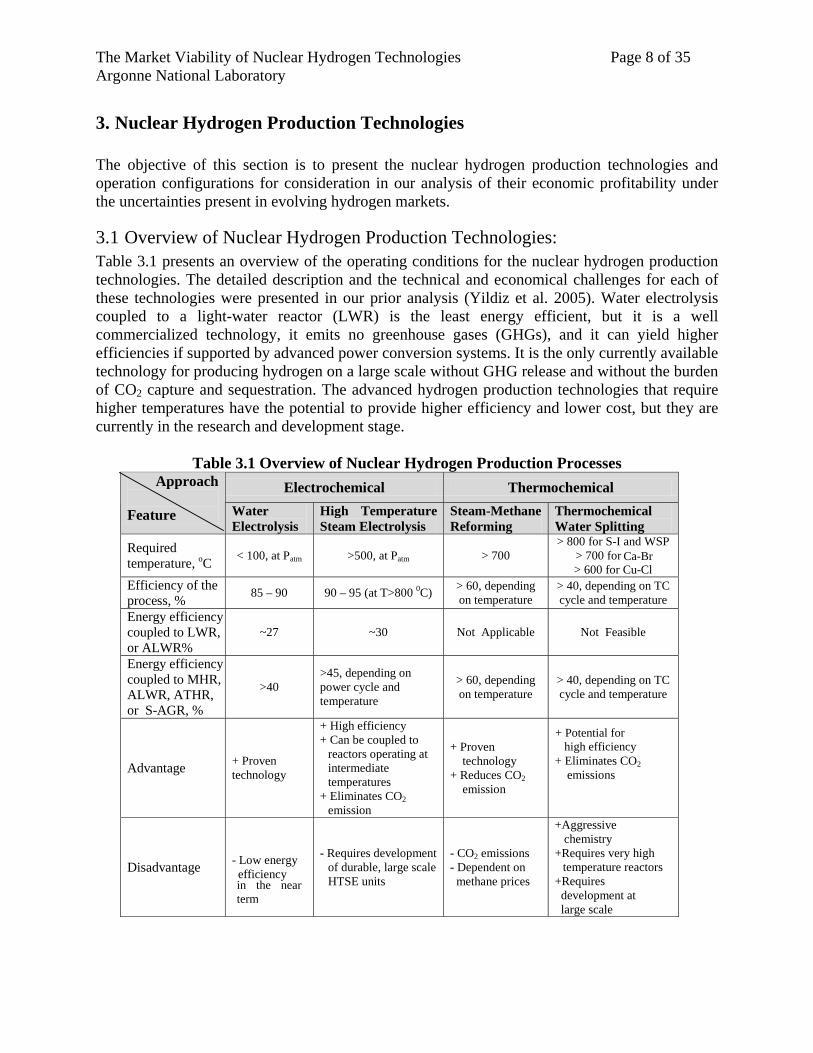
3.1 Overview of Nuclear Hydrogen Production Technologies: Table 3.1 presents an overview of the operating conditions for the nuclear hydrogen production technologies. The detailed description and the technical and economical challenges for each of these technologies were presented in our prior analysis (Yildiz et al. 2005). Water electrolysis coupled to a light-water reactor (LWR) is the least energy efficient, but it is a well commercialized technology, it emits no greenhouse gases (GHGs), and it can yield higher efficiencies if supported by advanced power conversion systems. It is the only currently available technology for producing hydrogen on a large scale without GHG release and without the burden of CO2 capture and sequestration. The advanced hydrogen production technologies that require higher temperatures have the potential to provide higher efficiency and lower cost, but they are currently in the research and development stage.
Table 3.1 Overview of Nuclear Hydrogen Production Processes
Electrochemical Thermochemical Approach Feature Water
Electrolysis High Temperature Steam Electrolysis
Steam-Methane Reforming
Thermochemical Water Splitting
Required temperature, oC < 100, at Patm >500, at Patm > 700
> 800 for S-I and WSP > 700 for UT-3 > 600 for Cu-Cl
Efficiency of the process, % 85 – 90 90 – 95 (at T>800 0C) > 60, depending
on temperature > 40, depending on TC cycle and temperature
Energy efficiency coupled to LWR, or ALWR%
~27 ~30 Not Applicable Not Feasible
Energy efficiency coupled to MHR, ALWR, ATHR, or S-AGR, %
>40 >45, depending on power cycle and temperature
> 60, depending on temperature
> 40, depending on TC cycle and temperature
Advantage + Proven technology
+ High efficiency + Can be coupled to
reactors operating at intermediate temperatures
+ Eliminates CO2 emission
+ Proven technology + Reduces CO2 emission
+ Eliminates CO2 emissions
Disadvantage - Low energy efficiency
- Requires development of durable, large scale HTSE units
- CO2 emissions - Dependent on methane prices
+Aggressive chemistry +Requires very high
temperature reactors +Requires development at large scale
in the near term
Ca-Br
+ Potential for high efficiency
The Market Viability of Nuclear Hydrogen Technologies Page 9 of 35 Argonne National Laboratory
Until now, no consensus has been reached on the efficiencies and costs of the advanced hydrogen production technologies. All candidate technologies, the leading ones being high-temperature steam electrolysis and the high-temperature sulfur-based thermochemical water-splitting cycles, have margins for improving their efficiencies and costs. Nevertheless, efficiency improvements may come at the price of higher complexity and capital cost.
3.1.1 Advanced Nuclear Reactors The possible nuclear heat sources to support the hydrogen production processes range from advanced light-water reactors to the advanced gas-cooled reactors. Intermediate- and high-temperature reactors would have higher electrical power generation efficiency and the capability to provide process heat for the hydrogen production process. The possible nuclear technologies include:
• Advanced light-water reactors (ALWR): a. Supercritical Water-Cooled Reactor (SCWR) b. Advanced Pressurized Water Reactor (APWR) c. Simplified Boiling Water Reactor (SBWR)
• Advanced liquid metal-cooled reactors: a. Sodium-Cooled Fast Reactor (SFR) b. Pb/Pb-Bi Cooled Fast Reactors (LFR)
• Advanced gas-cooled reactors: a. Pebble Bed or Prismatic Modular Helium Reactor (HTGR) b. Advanced High-Temperature Reactor (AHTR) c. Advanced Gas Reactor (AGR) d. Gas Fast Reactor (GFR)
A comprehensive evaluation of most of the advanced technologies, including their economic features such as the overnight cost distributions is found at the GenIV Roadmap website (http://gif.inel.gov/roadmap/). The configurations in which these reactors can support the hydrogen production processes and their achievable peak temperatures determine the performance of the processes.
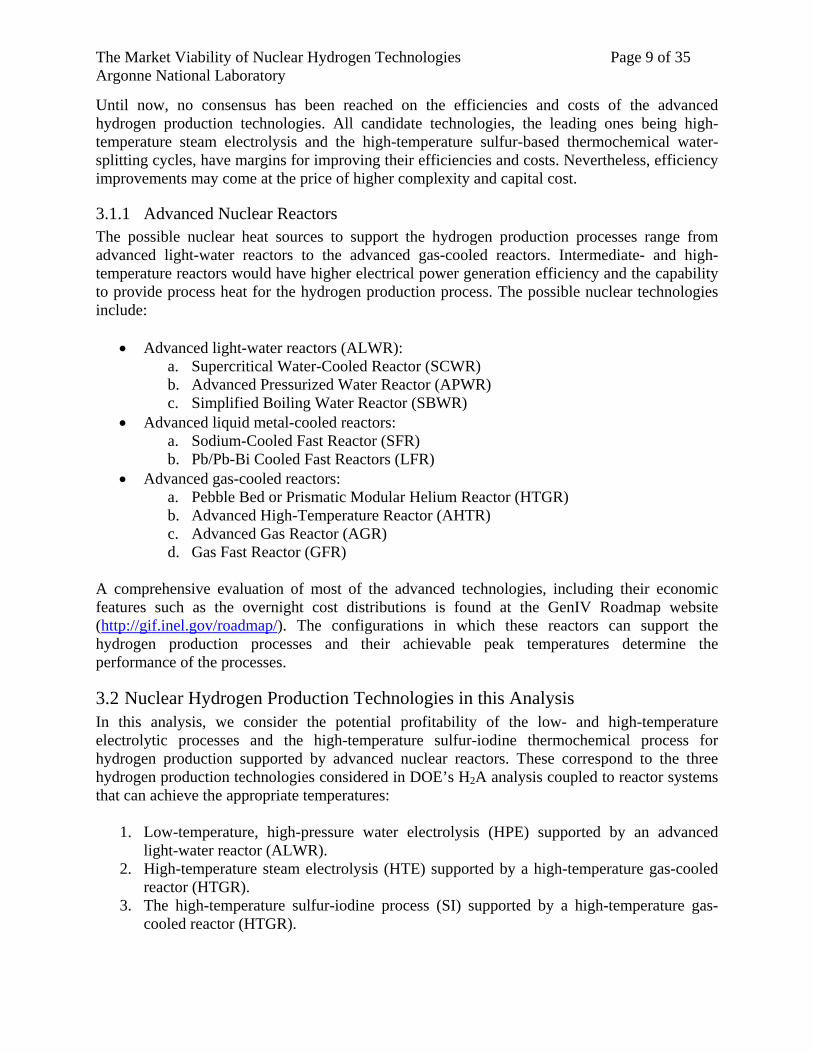
3.2 Nuclear Hydrogen Production Technologies in this Analysis In this analysis, we consider the potential profitability of the low- and high-temperature electrolytic processes and the high-temperature sulfur-iodine thermochemical process for hydrogen production supported by advanced nuclear reactors. These correspond to the three hydrogen production technologies considered in DOE’s H2A analysis coupled to reactor systems that can achieve the appropriate temperatures:
1. Low-temperature, high-pressure water electrolysis (HPE) supported by an advanced light-water reactor (ALWR).
2. High-temperature steam electrolysis (HTE) supported by a high-temperature gas-cooled reactor (HTGR).
3. The high-temperature sulfur-iodine process (SI) supported by a high-temperature gas-cooled reactor (HTGR).
The Market Viability of Nuclear Hydrogen Technologies Page 10 of 35 Argonne National Laboratory
HPE is an emerging technology for production of small amounts of highly pure hydrogen, but at a cost exceeding what is needed for large-scale hydrogen markets. Volume production of hydrogen by electrolysis today is by means of atmospheric or pressurized alkaline electrolysis. In this analysis, an ALWR is assumed to provide the electricity needed for the HPE process. The HTE and sulfur-based processes are currently in the R&D stage. In this analysis, we assume that both S-I and HTE use an HTGR as the primary energy source; the HTGR provides both the electricity and heat needed for the HTE, and only the heat needed for the S-I cycle. Although significant uncertainties exist, especially for the high-temperature processes, some information regarding the efficiency and cost of these technologies is available from prior analyses (Brown, et al., 2003, GRI96, Consol-Inam 2004). In addition, HPE, HTE and SI are technologies that are being evaluated by the Technology Insights (TI) researchers for levelized cost analysis and for providing input for our analysis.
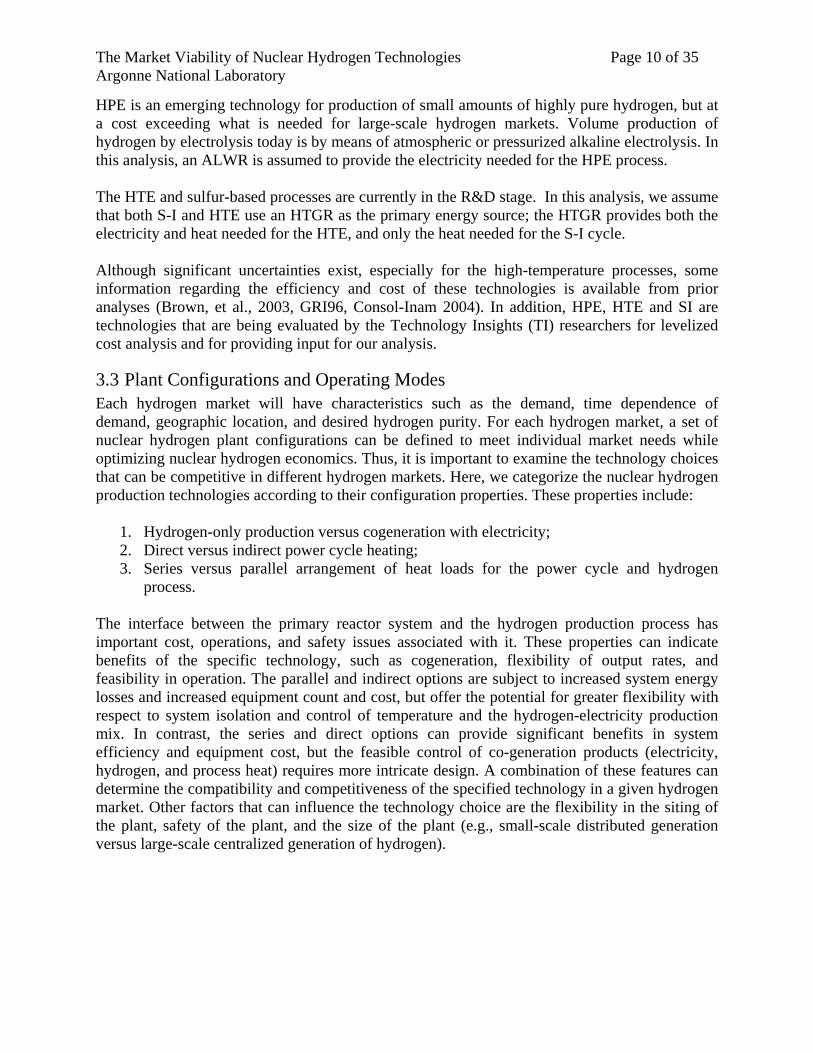
3.3 Plant Configurations and Operating Modes Each hydrogen market will have characteristics such as the demand, time dependence of demand, geographic location, and desired hydrogen purity. For each hydrogen market, a set of nuclear hydrogen plant configurations can be defined to meet individual market needs while optimizing nuclear hydrogen economics. Thus, it is important to examine the technology choices that can be competitive in different hydrogen markets. Here, we categorize the nuclear hydrogen production technologies according to their configuration properties. These properties include:
1. Hydrogen-only production versus cogeneration with electricity; 2. Direct versus indirect power cycle heating; 3. Series versus parallel arrangement of heat loads for the power cycle and hydrogen
process. The interface between the primary reactor system and the hydrogen production process has important cost, operations, and safety issues associated with it. These properties can indicate benefits of the specific technology, such as cogeneration, flexibility of output rates, and feasibility in operation. The parallel and indirect options are subject to increased system energy losses and increased equipment count and cost, but offer the potential for greater flexibility with respect to system isolation and control of temperature and the hydrogen-electricity production mix. In contrast, the series and direct options can provide significant benefits in system efficiency and equipment cost, but the feasible control of co-generation products (electricity, hydrogen, and process heat) requires more intricate design. A combination of these features can determine the compatibility and competitiveness of the specified technology in a given hydrogen market. Other factors that can influence the technology choice are the flexibility in the siting of the plant, safety of the plant, and the size of the plant (e.g., small-scale distributed generation versus large-scale centralized generation of hydrogen).
The Market Viability of Nuclear Hydrogen Technologies Page 11 of 35 Argonne National Laboratory
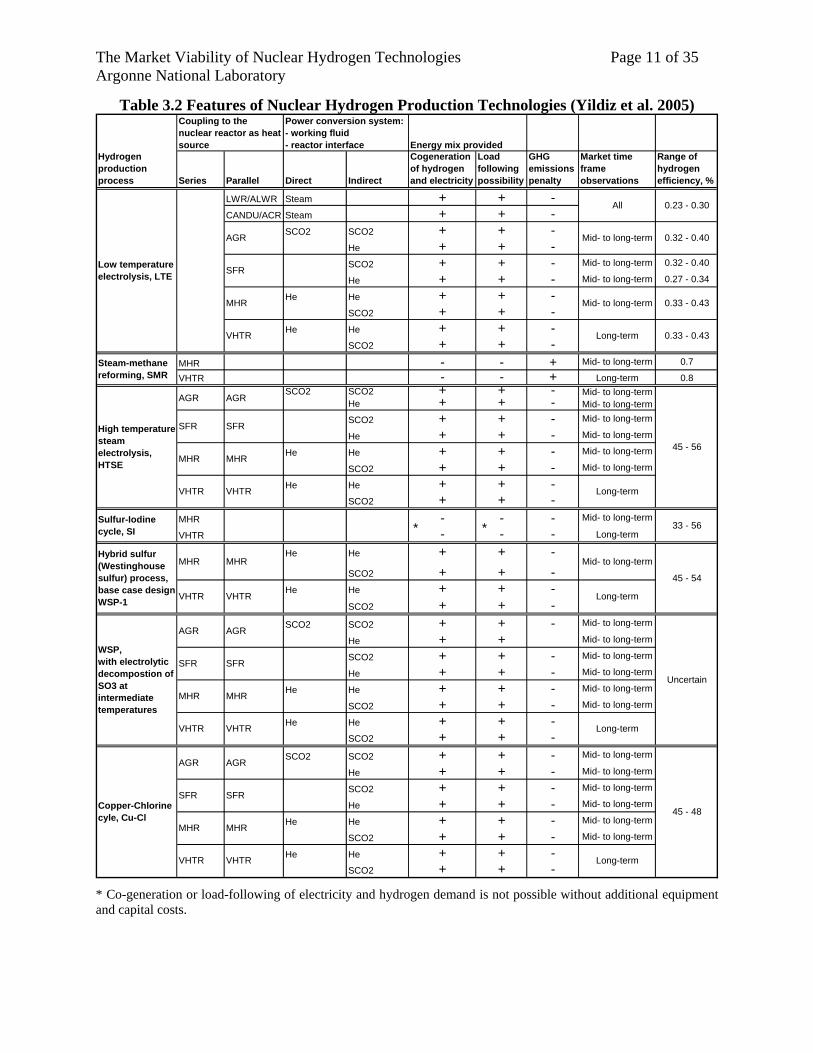
Table 3.2 Features of Nuclear Hydrogen Production Technologies (Yildiz et al. 2005)
Hydrogen production process Series Parallel Direct Indirect
Cogeneration of hydrogen and electricity
Load following possibility
GHG emissions penalty
Market time frame observations
Range of hydrogen efficiency, %
LWR/ALWR Steam + + -CANDU/ACR Steam + + -
SCO2 SCO2 + + -He + + -SCO2 + + - Mid- to long-term 0.32 - 0.40
He + + - Mid- to long-term 0.27 - 0.34
He He + + -SCO2 + + -
He He + + -SCO2 + + -
MHR - - + Mid- to long-term 0.7
VHTR - - + Long-term 0.8SCO2 SCO2 + + - Mid- to long-term
He + + - Mid- to long-term
SCO2 + + - Mid- to long-term
He + + - Mid- to long-term
He He + + - Mid- to long-term
SCO2 + + - Mid- to long-term
He He + + -SCO2 + + -
MHR - - - Mid- to long-term
VHTR - - - Long-term
He He + + -SCO2 + + -
He He + + -SCO2 + + -
SCO2 SCO2 + + - Mid- to long-term
He + + Mid- to long-term
SCO2 + + - Mid- to long-term
He + + - Mid- to long-term
He He + + - Mid- to long-term
SCO2 + + - Mid- to long-term
He He + + -SCO2 + + -
SCO2 SCO2 + + - Mid- to long-term
He + + - Mid- to long-term
SCO2 + + - Mid- to long-term
He + + - Mid- to long-term
He He + + - Mid- to long-term
SCO2 + + - Mid- to long-term
He He + + -SCO2 + + -
Long-term
Mid- to long-term
Long-term
Long-term
Long-term
All
Mid- to long-term
Mid- to long-term
Long-term
AGR
AGR AGR
SFR
Power conversion system: - working fluid - reactor interface
AGR
AGR AGR
VHTR
Steam-methane reforming, SMR
Low temperature electrolysis, LTE
MHR
High temperature steam electrolysis, HTSE
Sulfur-Iodine cycle, SI
VHTR VHTR
MHR
VHTR
SFR
MHR
VHTR
SFR
Hybrid sulfur (Westinghouse sulfur) process, base case design WSP-1
WSP, with electrolytic decompostion of SO3 at intermediate temperatures
MHR MHR
VHTR VHTR
VHTR VHTR
SFR
AGR
Copper-Chlorine cyle, Cu-Cl
Coupling to the nuclear reactor as heat source Energy mix provided
SFR
MHR
MHR MHR
SFR SFR
MHR
0.23 - 0.30
0.32 - 0.40
0.33 - 0.43
0.33 - 0.43
45 - 54
Uncertain
45 - 48
45 - 56
33 - 56* *
* Co-generation or load-following of electricity and hydrogen demand is not possible without additional equipment and capital costs.
The Market Viability of Nuclear Hydrogen Technologies Page 12 of 35 Argonne National Laboratory
The operating features of the various nuclear-hydrogen technologies, such as configuration options, co-generation possibilities, range of efficiency, and the potential markets that those technologies may be considered for, are presented in Table 3.2 (Yildiz et al. 2005).
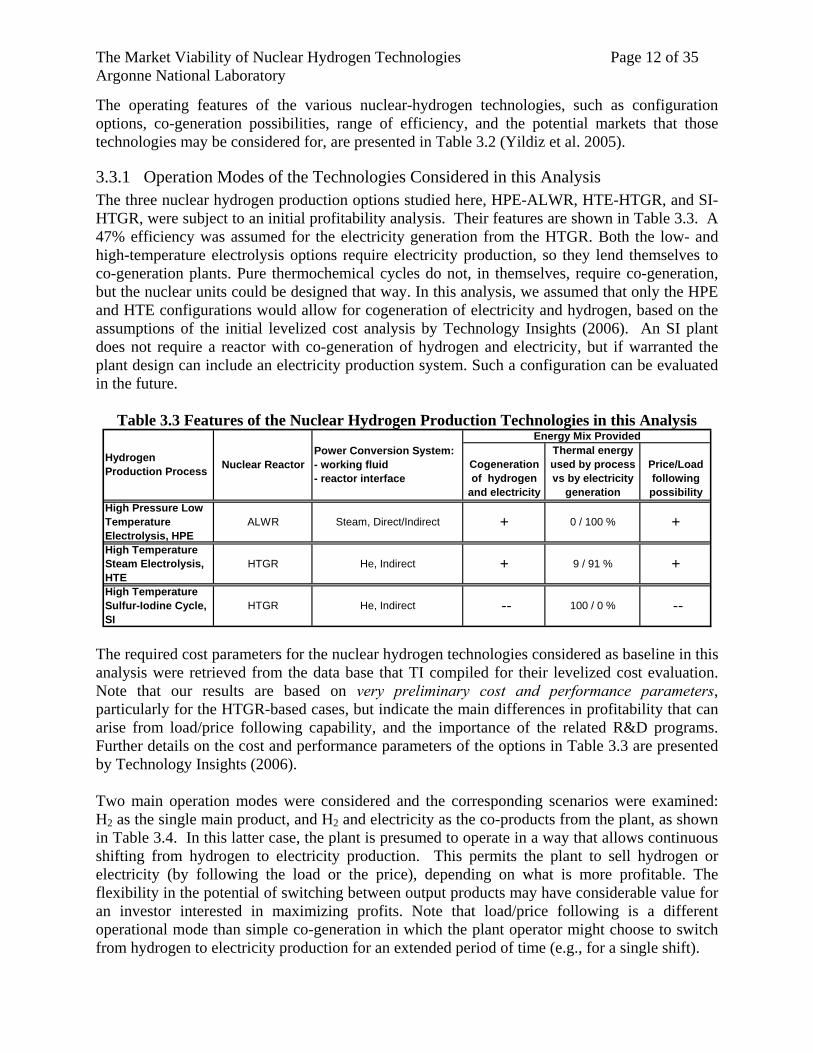
3.3.1 Operation Modes of the Technologies Considered in this Analysis The three nuclear hydrogen production options studied here, HPE-ALWR, HTE-HTGR, and SI-HTGR, were subject to an initial profitability analysis. Their features are shown in Table 3.3. A 47% efficiency was assumed for the electricity generation from the HTGR. Both the low- and high-temperature electrolysis options require electricity production, so they lend themselves to co-generation plants. Pure thermochemical cycles do not, in themselves, require co-generation, but the nuclear units could be designed that way. In this analysis, we assumed that only the HPE and HTE configurations would allow for cogeneration of electricity and hydrogen, based on the assumptions of the initial levelized cost analysis by Technology Insights (2006). An SI plant does not require a reactor with co-generation of hydrogen and electricity, but if warranted the plant design can include an electricity production system. Such a configuration can be evaluated in the future.
Table 3.3 Features of the Nuclear Hydrogen Production Technologies in this Analysis
Cogeneration of hydrogen
and electricity
Thermal energy used by process vs by electricity
generation
Price/Load following possibility
+High Pressure Low Temperature Electrolysis, HPE
ALWR Steam, Direct/Indirect +
Energy Mix Provided
0 / 100 %
Nuclear ReactorPower Conversion System: - working fluid - reactor interface
Hydrogen Production Process
HTGR He, Indirect + +
High Temperature Sulfur-Iodine Cycle, SI
HTGR He, Indirect -- --
9 / 91 %
100 / 0 %
High Temperature Steam Electrolysis, HTE
The required cost parameters for the nuclear hydrogen technologies considered as baseline in this analysis were retrieved from the data base that TI compiled for their levelized cost evaluation. Note that our results are based on very preliminary cost and performance parameters, particularly for the HTGR-based cases, but indicate the main differences in profitability that can arise from load/price following capability, and the importance of the related R&D programs. Further details on the cost and performance parameters of the options in Table 3.3 are presented by Technology Insights (2006). Two main operation modes were considered and the corresponding scenarios were examined: H2 as the single main product, and H2 and electricity as the co-products from the plant, as shown in Table 3.4. In this latter case, the plant is presumed to operate in a way that allows continuous shifting from hydrogen to electricity production. This permits the plant to sell hydrogen or electricity (by following the load or the price), depending on what is more profitable. The flexibility in the potential of switching between output products may have considerable value for an investor interested in maximizing profits. Note that load/price following is a different operational mode than simple co-generation in which the plant operator might choose to switch from hydrogen to electricity production for an extended period of time (e.g., for a single shift).
The Market Viability of Nuclear Hydrogen Technologies Page 13 of 35 Argonne National Laboratory
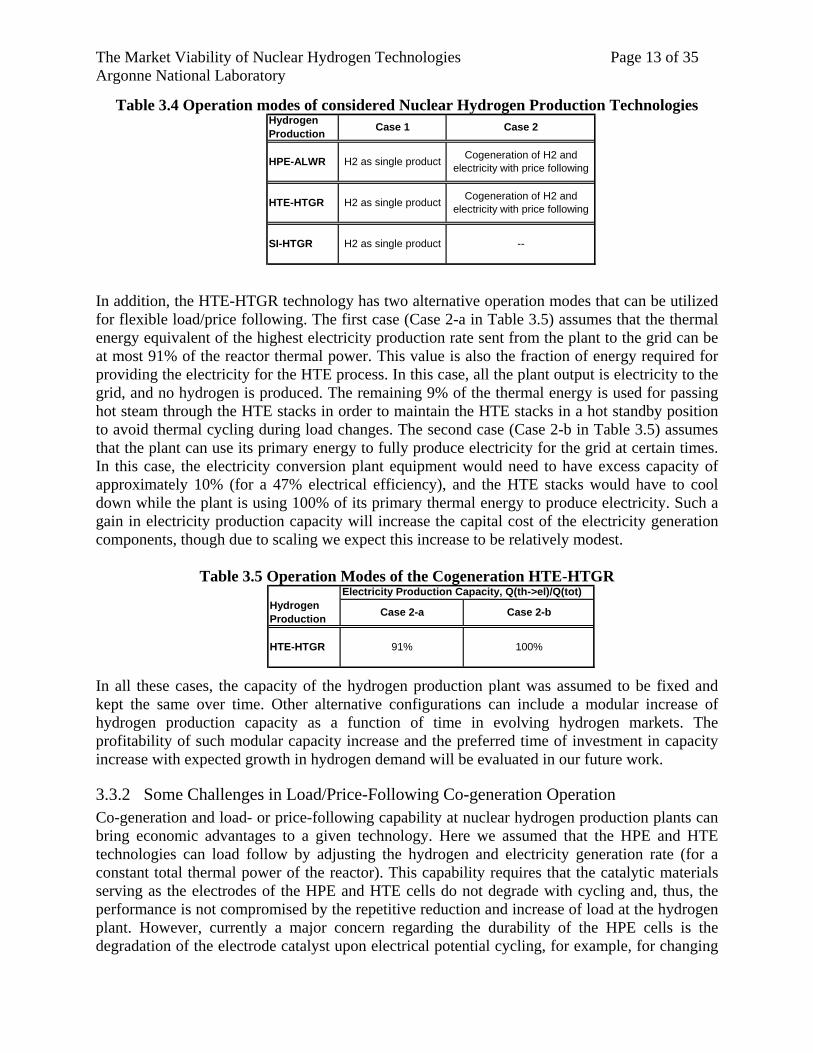
Table 3.4 Operation modes of considered Nuclear Hydrogen Production Technologies
--SI-HTGR H2 as single product
Cogeneration of H2 and electricity with price following HTE-HTGR H2 as single product
Cogeneration of H2 and electricity with price following
Hydrogen Production Case 1
HPE-ALWR H2 as single product
Case 2
In addition, the HTE-HTGR technology has two alternative operation modes that can be utilized for flexible load/price following. The first case (Case 2-a in Table 3.5) assumes that the thermal energy equivalent of the highest electricity production rate sent from the plant to the grid can be at most 91% of the reactor thermal power. This value is also the fraction of energy required for providing the electricity for the HTE process. In this case, all the plant output is electricity to the grid, and no hydrogen is produced. The remaining 9% of the thermal energy is used for passing hot steam through the HTE stacks in order to maintain the HTE stacks in a hot standby position to avoid thermal cycling during load changes. The second case (Case 2-b in Table 3.5) assumes that the plant can use its primary energy to fully produce electricity for the grid at certain times. In this case, the electricity conversion plant equipment would need to have excess capacity of approximately 10% (for a 47% electrical efficiency), and the HTE stacks would have to cool down while the plant is using 100% of its primary thermal energy to produce electricity. Such a gain in electricity production capacity will increase the capital cost of the electricity generation components, though due to scaling we expect this increase to be relatively modest.
Table 3.5 Operation Modes of the Cogeneration HTE-HTGR
Hydrogen Production Case 2-a Case 2-b
Electricity Production Capacity, Q(th->el)/Q(tot)
HTE-HTGR 91% 100%
In all these cases, the capacity of the hydrogen production plant was assumed to be fixed and kept the same over time. Other alternative configurations can include a modular increase of hydrogen production capacity as a function of time in evolving hydrogen markets. The profitability of such modular capacity increase and the preferred time of investment in capacity increase with expected growth in hydrogen demand will be evaluated in our future work.
3.3.2 Some Challenges in Load/Price-Following Co-generation Operation Co-generation and load- or price-following capability at nuclear hydrogen production plants can bring economic advantages to a given technology. Here we assumed that the HPE and HTE technologies can load follow by adjusting the hydrogen and electricity generation rate (for a constant total thermal power of the reactor). This capability requires that the catalytic materials serving as the electrodes of the HPE and HTE cells do not degrade with cycling and, thus, the performance is not compromised by the repetitive reduction and increase of load at the hydrogen plant. However, currently a major concern regarding the durability of the HPE cells is the degradation of the electrode catalyst upon electrical potential cycling, for example, for changing

The Market Viability of Nuclear Hydrogen Technologies Page 14 of 35 Argonne National Laboratory
the hydrogen production rate. Therefore, the presence of sufficiently durable HPE electrodes is necessary for profit maximization through load following of electricity and hydrogen at the plant. Similarly, one of the most important challenges of HTE cells is to ensure their durability against thermal cycling, for example due to start-up and shut-down that can arise when switching from one energy product (hydrogen) to another (electricity). One way to avoid this is by ensuring that the HTE cells are kept hot (Case 2-a in Table 3.5) by using some thermal power to heat the HTE stacks even when they are not under an electrical potential, and thus not producing hydrogen. On the other hand, developing durable HTE components that can operate at temperatures as low as 500oC while maintaining high efficiency would be an ultimate solution. The SI-HTGR technology, when the HTGR is coupled with an additional turbine-generator system, can also co-produce hydrogen and electricity for the grid. This would require a more substantial increase in the capital cost of the plant. Nevertheless, its profitability with the associated load/price following capability should be assessed. As with HTE, the catalytic materials that will be used in the SI process can also be subject to activity degradation under thermal gradients and upon thermal cycling. Therefore, the durability of the hydrogen production process materials during repetitive load cycling would also be of concern.
The Market Viability of Nuclear Hydrogen Technologies Page 15 of 35 Argonne National Laboratory
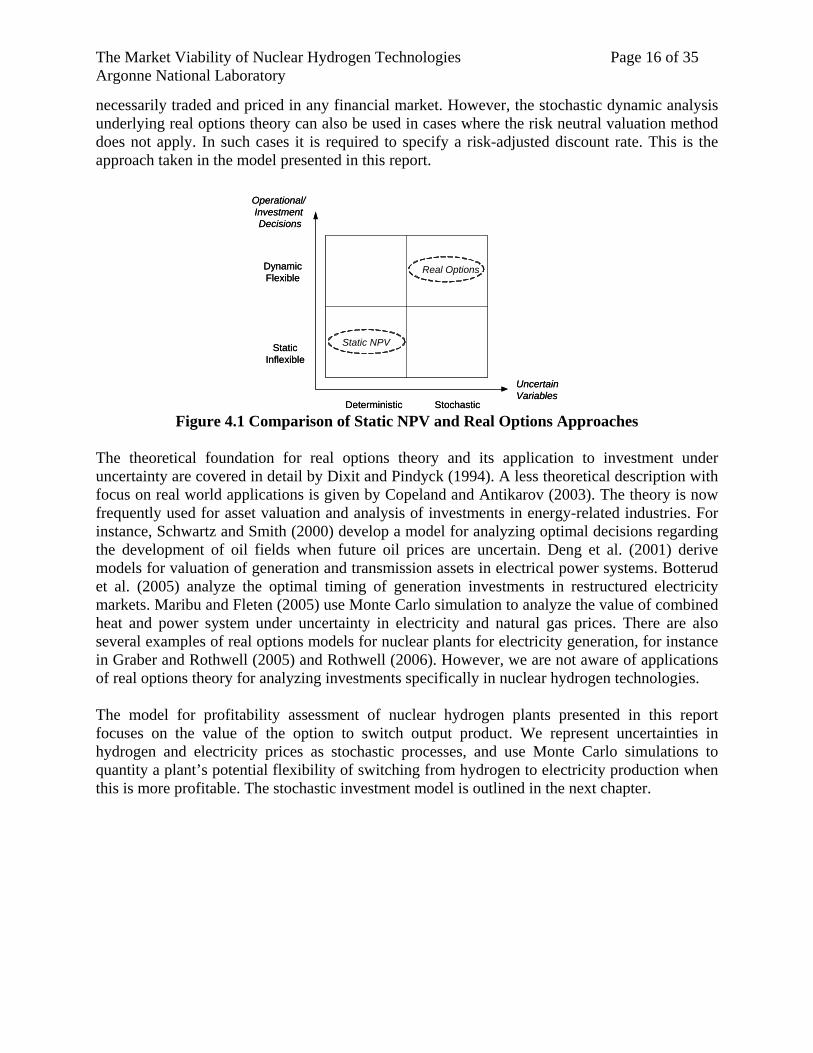
4. Investment under Uncertainty and Real Options According to traditional finance theory the net present value (NPV) is the best indicator and decision-aid for companies evaluating a new investment project. The static form of the NPV rule states that a project should be undertaken as long as the sum of discounted cash flows from the project (i.e. the NPV) is positive, while projects with a negative NPV should be rejected. However, it has become apparent that the traditional static discounted cash flow techniques have severe shortcomings, as discussed in Dixit and Pindyck (1994) and Brennan and Trigeorigis (2000). First of all, the static assessment compares the value of investing today with not investing at all. In most cases the decision maker has the choice of deferring an investment, and then to invest later in the event of favorable investment conditions. Furthermore, the investor has the flexibility to make investment and operational decisions in the future, depending on how uncertainties unfold. In addition, the result from applying the static NPV rule is heavily dependent on the discount rate applied in the calculation. At the same time we know that estimating an appropriate discount factor in many situations can be very difficult. A new direction within investment theory has emerged in the 1980s and 1990s, which is trying to mitigate the shortcomings of the static discounted cash flow techniques. The new approach, frequently referred to as real options theory, is based on a dynamic analysis of investment projects. In the real options theory a new invest project is regarded as an option. It is recognized that an investment project can have several embedded properties that can be viewed as options. The most common options for investment projects are listed by Trigeorgis (2001): the option to defer an investment, the time to build option (for staged investments), the option to alter operating scale, the option to abandon a project, the option to switch inputs or outputs from a process and different forms of growth options (e.g. investments in R&D). In some projects there are interacting effects between several of these options. In addition to the options embedded in the project itself there is always an uncertainty in future cost of capital. This will also contribute to the value of the option to invest in a new project. In mathematical terms, real options valuation is based on stochastic dynamic optimization. Compared to a simple static NPV evaluation of expected cash flow from an investment, the real options paradigm adds two important analytical dimensions to the problem. First, a flexible and dynamic representation of future managerial operational and investment decisions is used. Second, important uncertain factors are represented as stochastic processes (Figure 4.1). Under certain assumptions about the underlying stochastic processes, real options models may be solved analytically. However, for complex investment problems with several sources of uncertainty it is more common to use discrete mathematics or simulations to find the optimal investment strategy. The real options theory suggests the use of contingent claims analysis or risk-neutral valuation to bypass the problem of determining an appropriate risk-adjusted discount rate, as described by Dixit and Pindyck (1994). The advantage is that a risk-free interest rate can be used for discounting. These methods are based on the assumption that a portfolio can be constructed in the financial markets, which exactly replicate the uncertainties in the investment project. This is a strong assumption, since investment projects can involve a number of uncertainties that are not
The Market Viability of Nuclear Hydrogen Technologies Page 16 of 35 Argonne National Laboratory
necessarily traded and priced in any financial market. However, the stochastic dynamic analysis underlying real options theory can also be used in cases where the risk neutral valuation method does not apply. In such cases it is required to specify a risk-adjusted discount rate. This is the approach taken in the model presented in this report.
Operational/InvestmentDecisions
StochasticDeterministic
DynamicFlexible
StaticInflexible
Uncertain Variables
Real Options
Static NPV
Operational/InvestmentDecisions
StochasticDeterministic
DynamicFlexible
StaticInflexible
Uncertain Variables
Real Options
Static NPV
Figure 4.1 Comparison of Static NPV and Real Options Approaches
The theoretical foundation for real options theory and its application to investment under uncertainty are covered in detail by Dixit and Pindyck (1994). A less theoretical description with focus on real world applications is given by Copeland and Antikarov (2003). The theory is now frequently used for asset valuation and analysis of investments in energy-related industries. For instance, Schwartz and Smith (2000) develop a model for analyzing optimal decisions regarding the development of oil fields when future oil prices are uncertain. Deng et al. (2001) derive models for valuation of generation and transmission assets in electrical power systems. Botterud et al. (2005) analyze the optimal timing of generation investments in restructured electricity markets. Maribu and Fleten (2005) use Monte Carlo simulation to analyze the value of combined heat and power system under uncertainty in electricity and natural gas prices. There are also several examples of real options models for nuclear plants for electricity generation, for instance in Graber and Rothwell (2005) and Rothwell (2006). However, we are not aware of applications of real options theory for analyzing investments specifically in nuclear hydrogen technologies. The model for profitability assessment of nuclear hydrogen plants presented in this report focuses on the value of the option to switch output product. We represent uncertainties in hydrogen and electricity prices as stochastic processes, and use Monte Carlo simulations to quantity a plant’s potential flexibility of switching from hydrogen to electricity production when this is more profitable. The stochastic investment model is outlined in the next chapter.
The Market Viability of Nuclear Hydrogen Technologies Page 17 of 35 Argonne National Laboratory
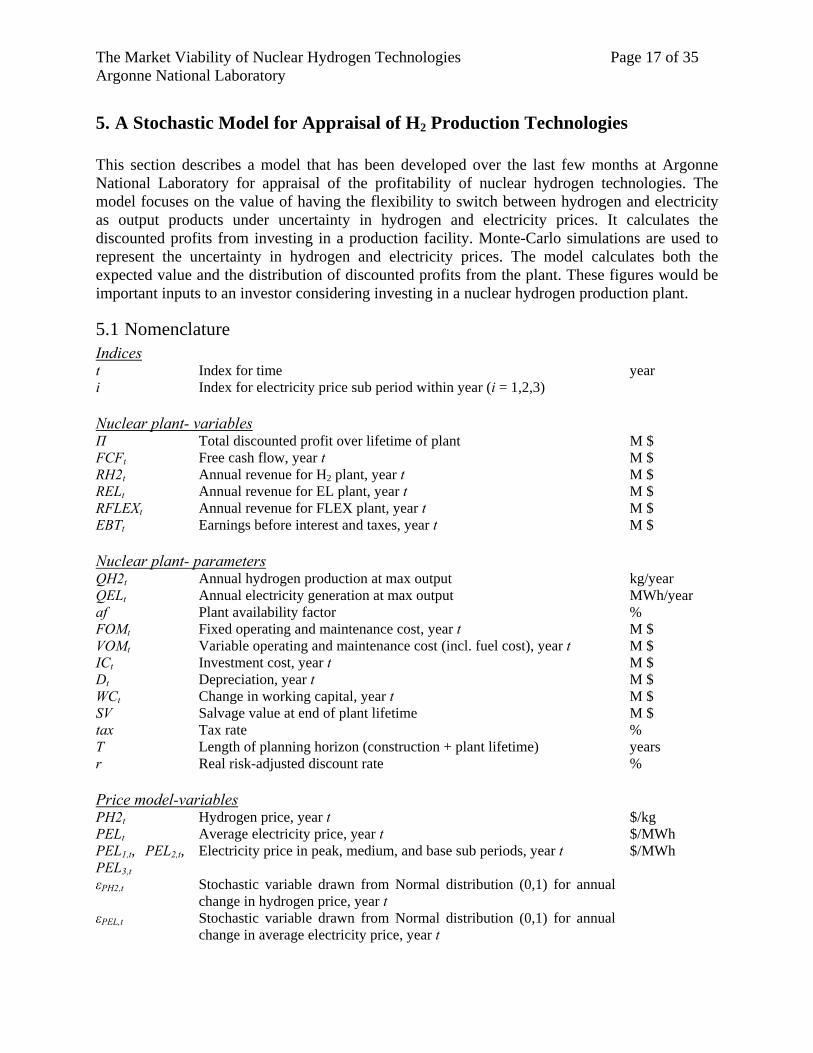
5. A Stochastic Model for Appraisal of H2 Production Technologies This section describes a model that has been developed over the last few months at Argonne National Laboratory for appraisal of the profitability of nuclear hydrogen technologies. The model focuses on the value of having the flexibility to switch between hydrogen and electricity as output products under uncertainty in hydrogen and electricity prices. It calculates the discounted profits from investing in a production facility. Monte-Carlo simulations are used to represent the uncertainty in hydrogen and electricity prices. The model calculates both the expected value and the distribution of discounted profits from the plant. These figures would be important inputs to an investor considering investing in a nuclear hydrogen production plant.
5.1 Nomenclature Indices t Index for time year i Index for electricity price sub period within year (i = 1,2,3) Nuclear plant- variables Π Total discounted profit over lifetime of plant M $ FCFt Free cash flow, year t M $ RH2t Annual revenue for H2 plant, year t M $ RELt Annual revenue for EL plant, year t M $ RFLEXt Annual revenue for FLEX plant, year t M $ EBTt Earnings before interest and taxes, year t M $ Nuclear plant- parameters QH2t Annual hydrogen production at max output kg/year QELt Annual electricity generation at max output MWh/year af Plant availability factor % FOMt Fixed operating and maintenance cost, year t M $ VOMt Variable operating and maintenance cost (incl. fuel cost), year t M $ ICt Investment cost, year t M $ Dt Depreciation, year t M $ WCt Change in working capital, year t M $ SV Salvage value at end of plant lifetime M $ tax Tax rate % T Length of planning horizon (construction + plant lifetime) years r Real risk-adjusted discount rate % Price model-variables PH2t Hydrogen price, year t $/kg PELt Average electricity price, year t $/MWh PEL1,t, PEL2,t, PEL3,t
Electricity price in peak, medium, and base sub periods, year t $/MWh
εPH2,t Stochastic variable drawn from Normal distribution (0,1) for annual change in hydrogen price, year t
εPEL,t Stochastic variable drawn from Normal distribution (0,1) for annual change in average electricity price, year t
The Market Viability of Nuclear Hydrogen Technologies Page 18 of 35 Argonne National Laboratory
Price model-parameters d1,d2,d3 Duration of peak, medium, and base price periods hours pf1,pf2, pf3 Relative price factor for peak, medium, and base price periods σPH2,GBM Hydrogen price volatility in GBM processes % αPH2,GBM Hydrogen price growth rate in GBM processes % σPH2,MR Hydrogen price volatility in MR processes $/kg/year αPH2,MR Hydrogen price mean growth rate in MR processes $/kg/year κPH2,MR Hydrogen price mean reversion rate in MR processes, [0,1] 1/year PH2 Hydrogen price initial mean level in MR process $/kg σPEL,GBM Electricity price volatility in GBM processes % αPEL,GBM Electricity price growth rate in GBM processes % σPEL,MR Electricity price volatility in MR processes $/MWh/year αPEL,MR Electricity price growth rate in MR processes $/MWh/year κPEL,MR Electricity price mean reversion rate in MR processes, [0,1] 1/year PEL Average electricity price initial mean level in MR process $/MWh ρ Correlation between hydrogen and electricity price, [-1,1]
5.2 Assumptions Three different types of nuclear plants can be evaluated with the investment model:
1) H2: Inflexible plant, producing hydrogen only 2) EL: Inflexible plant, producing electricity only 3) FLEX: Flexible price-following plant, which produces hydrogen or electricity, depending
on what is more profitable Other main assumptions for the model are:
• Costs and cash flows are in 2005 dollars, and the investment is assumed to take place at the beginning of that year;
• The timing of the investment is fixed; • A real discount rate is used: i.e., the discount rate is adjusted for inflation. Inflation in
costs and prices are, therefore, not explicitly modeled; • The time resolution is one year; • The planning horizon, T, equals the construction period plus the lifetime of the plant; • Free cash flows are calculated for each year in the planning horizon, and the profit equals
the discounted free cash flow over the planning horizon, including salvage value; • Three price sub-periods are assumed within the year for electricity: base, medium, and
peak. The price sub-periods have fixed duration and represent seasonal, daily, and weekly fluctuations in electricity price;
• Hydrogen has only one price within the year (i.e. the same price in all sub-periods); • Uncertainties are represented in future electricity and hydrogen prices. No other
uncertainties are considered. Hence, all costs are deterministic; • Flexible plants have the capability of switching from hydrogen to electricity production at
will with no additional cost or reduction in production levels; • There is no firm demand for hydrogen for flexible plants, so the plant can freely switch
between hydrogen and electricity depending on what is more profitable; • Prices are received at plant location. There are no distribution costs for investor.
The Market Viability of Nuclear Hydrogen Technologies Page 19 of 35 Argonne National Laboratory
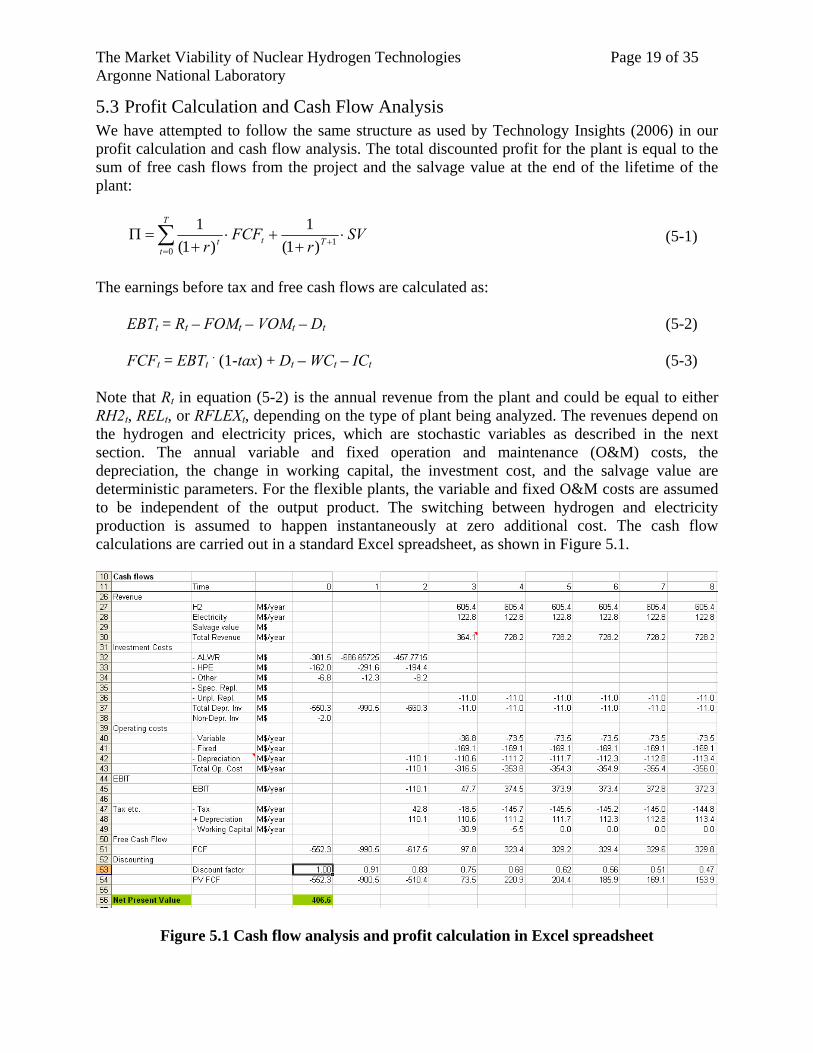
5.3 Profit Calculation and Cash Flow Analysis We have attempted to follow the same structure as used by Technology Insights (2006) in our profit calculation and cash flow analysis. The total discounted profit for the plant is equal to the sum of free cash flows from the project and the salvage value at the end of the lifetime of the plant:
SVr
FCFr T
T
ttt ⋅
++⋅
+=Π +
=∑ 1
0 )1(1
)1(1 (5-1)
The earnings before tax and free cash flows are calculated as: EBTt = Rt – FOMt – VOMt – Dt (5-2)
FCFt = EBTt . (1-tax) + Dt – WCt – ICt (5-3)
Note that Rt in equation (5-2) is the annual revenue from the plant and could be equal to either RH2t, RELt, or RFLEXt, depending on the type of plant being analyzed. The revenues depend on the hydrogen and electricity prices, which are stochastic variables as described in the next section. The annual variable and fixed operation and maintenance (O&M) costs, the depreciation, the change in working capital, the investment cost, and the salvage value are deterministic parameters. For the flexible plants, the variable and fixed O&M costs are assumed to be independent of the output product. The switching between hydrogen and electricity production is assumed to happen instantaneously at zero additional cost. The cash flow calculations are carried out in a standard Excel spreadsheet, as shown in Figure 5.1.
Figure 5.1 Cash flow analysis and profit calculation in Excel spreadsheet
The Market Viability of Nuclear Hydrogen Technologies Page 20 of 35 Argonne National Laboratory
A key part of the model is the representation of revenue from sales of hydrogen and electricity. The total annual revenue depends on the type of plant, as shown in equations (5-4) through (5-6). For the hydrogen plant the revenue is simply the annual hydrogen output times the hydrogen price. Likewise, for the electricity plant the revenue equals the sum of electricity generation times price over the three electricity price sub-periods. Finally, the flexible plant generates either hydrogen or electricity in each of the three price sub-periods, depending on what is more profitable. The option to switch between output products can have considerable value for the investors, especially when there is large uncertainty in electricity and hydrogen prices. ttt PH2QH2afRH2 ⋅⋅= (5-4)
8760
3
1
iit
itt
dpfPELQELafREL ⋅⋅⋅⋅= ∑=
(5-5)
8760
),(MAX3
1
ii
ittttt
dpfPELQELPH2QH2afRFLEX ⋅⋅⋅⋅⋅= ∑=
(5-6)
Note that the electricity price in each price period is equal to the average annual electricity price times the relative price factor, i.e. PELi,t = PELt
.pfi. Hence, the relative difference between electricity prices in high, medium, and base periods remain constant. The quantity of hydrogen and electricity being produced depends on the simulated realization of hydrogen and electricity prices.
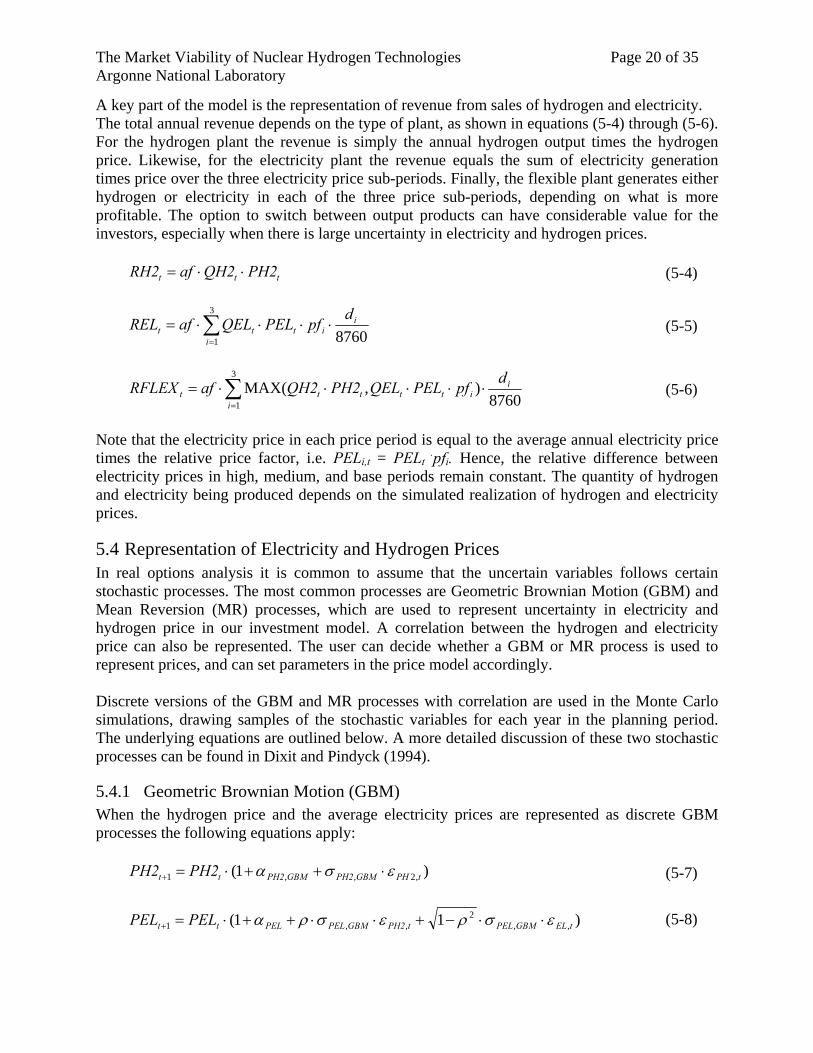
5.4 Representation of Electricity and Hydrogen Prices In real options analysis it is common to assume that the uncertain variables follows certain stochastic processes. The most common processes are Geometric Brownian Motion (GBM) and Mean Reversion (MR) processes, which are used to represent uncertainty in electricity and hydrogen price in our investment model. A correlation between the hydrogen and electricity price can also be represented. The user can decide whether a GBM or MR process is used to represent prices, and can set parameters in the price model accordingly. Discrete versions of the GBM and MR processes with correlation are used in the Monte Carlo simulations, drawing samples of the stochastic variables for each year in the planning period. The underlying equations are outlined below. A more detailed discussion of these two stochastic processes can be found in Dixit and Pindyck (1994).
5.4.1 Geometric Brownian Motion (GBM) When the hydrogen price and the average electricity prices are represented as discrete GBM processes the following equations apply: )1( ,2,,1 tPHGBMPH2GBMPH2tt PH2PH2 εσα ⋅++⋅=+ (5-7)
)11( ,,
2,,1 tELGBMPELtPH2GBMPELPELtt PELPEL εσρεσρα ⋅⋅−+⋅⋅++⋅=+ (5-8)
The Market Viability of Nuclear Hydrogen Technologies Page 21 of 35 Argonne National Laboratory
The GBM process is multiplicative. If the initial price is higher than zero, the future prices will also remain above zero. The simulated prices at a certain time period in the future will have a lognormal distribution, and the upper tail of the distribution tends to drift off to very high levels owing to the multiplicative effect. This is further illustrated and discussed in the analysis in Chapter 6.
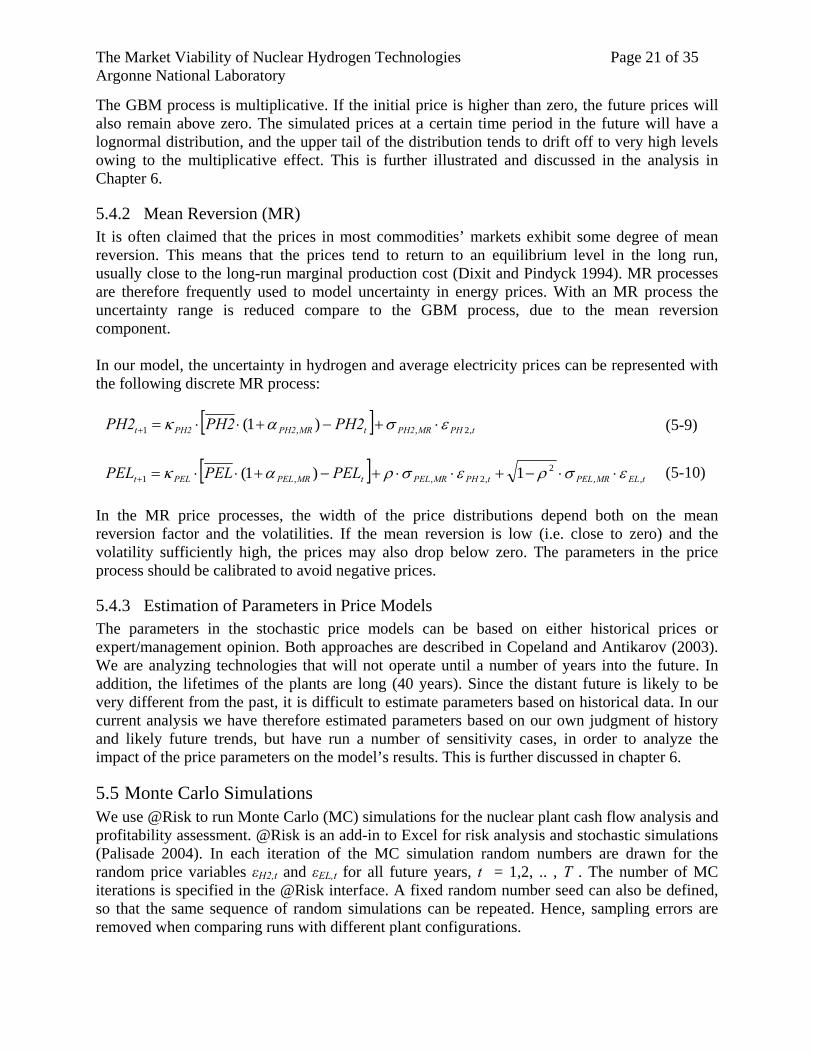
5.4.2 Mean Reversion (MR) It is often claimed that the prices in most commodities’ markets exhibit some degree of mean reversion. This means that the prices tend to return to an equilibrium level in the long run, usually close to the long-run marginal production cost (Dixit and Pindyck 1994). MR processes are therefore frequently used to model uncertainty in energy prices. With an MR process the uncertainty range is reduced compare to the GBM process, due to the mean reversion component. In our model, the uncertainty in hydrogen and average electricity prices can be represented with the following discrete MR process:
[ ] tPHMRPH2tMRPH2PH2t PH2PH2PH2 ,2,,1 )1( εσακ ⋅+−+⋅⋅=+ (5-9)
[ ] tELMRPELtPHMRPELtMRPELPELt PELPELPEL ,,2
,2,,1 1)1( εσρεσρακ ⋅⋅−+⋅⋅+−+⋅⋅=+ (5-10) In the MR price processes, the width of the price distributions depend both on the mean reversion factor and the volatilities. If the mean reversion is low (i.e. close to zero) and the volatility sufficiently high, the prices may also drop below zero. The parameters in the price process should be calibrated to avoid negative prices.
5.4.3 Estimation of Parameters in Price Models The parameters in the stochastic price models can be based on either historical prices or expert/management opinion. Both approaches are described in Copeland and Antikarov (2003). We are analyzing technologies that will not operate until a number of years into the future. In addition, the lifetimes of the plants are long (40 years). Since the distant future is likely to be very different from the past, it is difficult to estimate parameters based on historical data. In our current analysis we have therefore estimated parameters based on our own judgment of history and likely future trends, but have run a number of sensitivity cases, in order to analyze the impact of the price parameters on the model’s results. This is further discussed in chapter 6.
5.5 Monte Carlo Simulations We use @Risk to run Monte Carlo (MC) simulations for the nuclear plant cash flow analysis and profitability assessment. @Risk is an add-in to Excel for risk analysis and stochastic simulations (Palisade 2004). In each iteration of the MC simulation random numbers are drawn for the random price variables εH2,t and εEL,t for all future years, t = 1,2, .. , T . The number of MC iterations is specified in the @Risk interface. A fixed random number seed can also be defined, so that the same sequence of random simulations can be repeated. Hence, sampling errors are removed when comparing runs with different plant configurations.
The Market Viability of Nuclear Hydrogen Technologies Page 22 of 35 Argonne National Laboratory
6. Profitability Analysis of Three Nuclear H2 Production Technologies In this section we analyze the profitability of the three main nuclear hydrogen production technologies, as described in Chapter 3. The objective is to analyze the profitability of these technologies. In particular, we want to evaluate to what extent the option to switch between hydrogen and electricity production adds value to the investment.
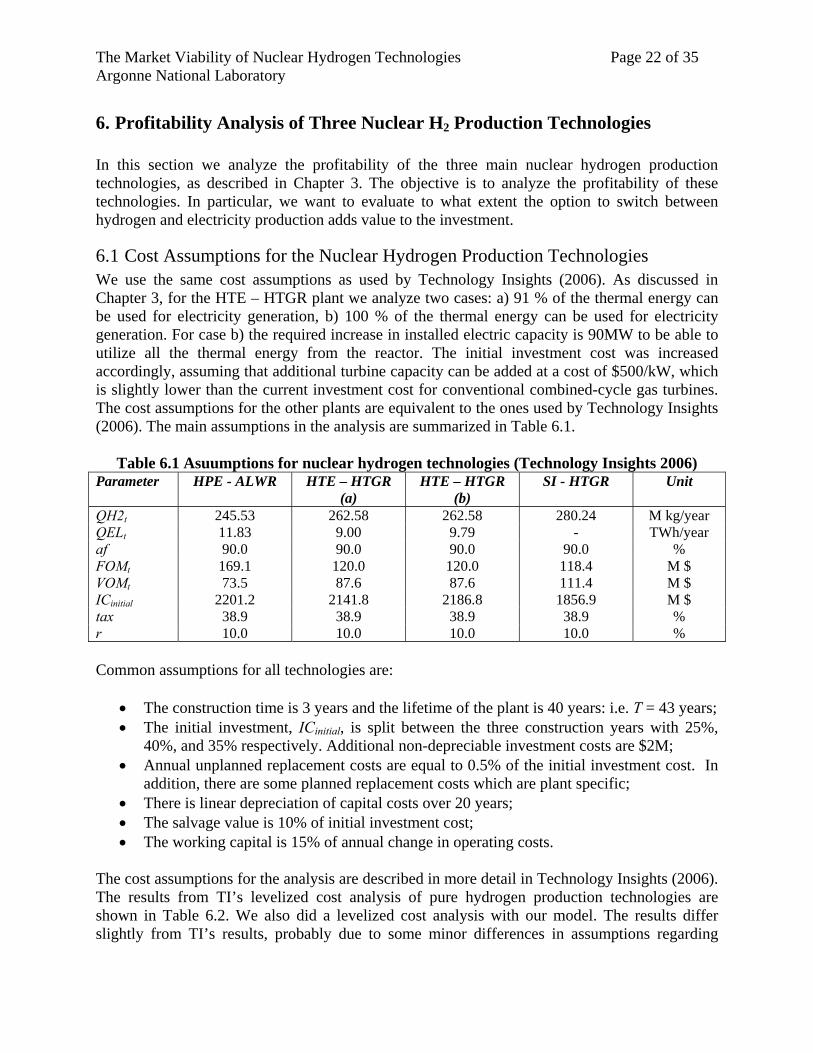
6.1 Cost Assumptions for the Nuclear Hydrogen Production Technologies We use the same cost assumptions as used by Technology Insights (2006). As discussed in Chapter 3, for the HTE – HTGR plant we analyze two cases: a) 91 % of the thermal energy can be used for electricity generation, b) 100 % of the thermal energy can be used for electricity generation. For case b) the required increase in installed electric capacity is 90MW to be able to utilize all the thermal energy from the reactor. The initial investment cost was increased accordingly, assuming that additional turbine capacity can be added at a cost of $500/kW, which is slightly lower than the current investment cost for conventional combined-cycle gas turbines. The cost assumptions for the other plants are equivalent to the ones used by Technology Insights (2006). The main assumptions in the analysis are summarized in Table 6.1.
Table 6.1 Asuumptions for nuclear hydrogen technologies (Technology Insights 2006) Parameter HPE - ALWR HTE – HTGR
(a) HTE – HTGR
(b) SI - HTGR Unit
QH2t 245.53 262.58 262.58 280.24 M kg/year QELt 11.83 9.00 9.79 - TWh/year af 90.0 90.0 90.0 90.0 % FOMt 169.1 120.0 120.0 118.4 M $ VOMt 73.5 87.6 87.6 111.4 M $ ICinitial 2201.2 2141.8 2186.8 1856.9 M $ tax 38.9 38.9 38.9 38.9 % r 10.0 10.0 10.0 10.0 % Common assumptions for all technologies are:
• The construction time is 3 years and the lifetime of the plant is 40 years: i.e. T = 43 years; • The initial investment, ICinitial, is split between the three construction years with 25%,
40%, and 35% respectively. Additional non-depreciable investment costs are $2M; • Annual unplanned replacement costs are equal to 0.5% of the initial investment cost. In
addition, there are some planned replacement costs which are plant specific; • There is linear depreciation of capital costs over 20 years; • The salvage value is 10% of initial investment cost; • The working capital is 15% of annual change in operating costs.
The cost assumptions for the analysis are described in more detail in Technology Insights (2006). The results from TI’s levelized cost analysis of pure hydrogen production technologies are shown in Table 6.2. We also did a levelized cost analysis with our model. The results differ slightly from TI’s results, probably due to some minor differences in assumptions regarding
The Market Viability of Nuclear Hydrogen Technologies Page 23 of 35 Argonne National Laboratory
depreciation and the handling of inflation. The levelized cost analysis clearly shows that the SI – HTGR plant has the lowest total cost for the given cost assumptions. One could therefore easily deduce that this plant is the more attractive one for potential investors. However, this type of analysis only looks at costs and does not take into account prices, revenues, and the possibility of switching between hydrogen and electricity production. Furthermore, it is deterministic and does not consider any uncertainties. Table 6.2 Levelized Cost Calculations for Pure Hydrogen Production Plants (TI and ANL)
Technology Insights
ANL model
HPE –ALWR 2.94 2.91 HTE – HTGR(a) 2.53 2.51 SI - HTGR 2.22 2.26
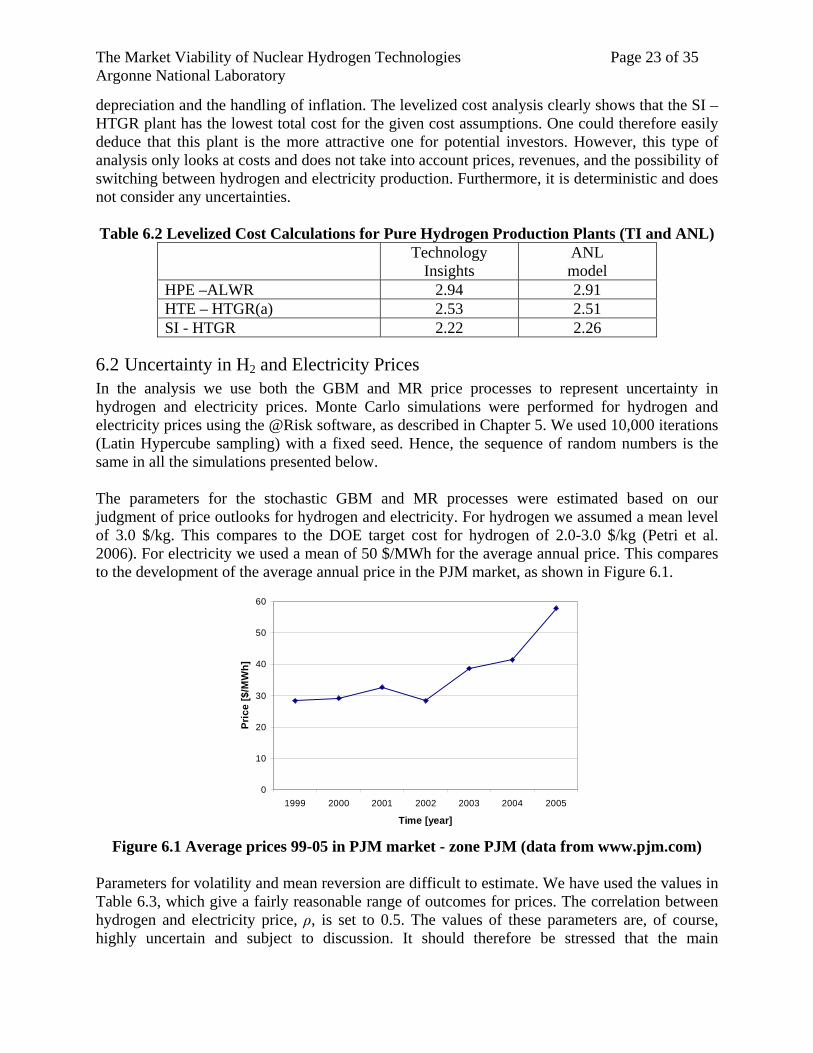
6.2 Uncertainty in H2 and Electricity Prices In the analysis we use both the GBM and MR price processes to represent uncertainty in hydrogen and electricity prices. Monte Carlo simulations were performed for hydrogen and electricity prices using the @Risk software, as described in Chapter 5. We used 10,000 iterations (Latin Hypercube sampling) with a fixed seed. Hence, the sequence of random numbers is the same in all the simulations presented below. The parameters for the stochastic GBM and MR processes were estimated based on our judgment of price outlooks for hydrogen and electricity. For hydrogen we assumed a mean level of 3.0 $/kg. This compares to the DOE target cost for hydrogen of 2.0-3.0 $/kg (Petri et al. 2006). For electricity we used a mean of 50 $/MWh for the average annual price. This compares to the development of the average annual price in the PJM market, as shown in Figure 6.1.
0
10
20
30
40
50
60
1999 2000 2001 2002 2003 2004 2005
Time [year]
Pric
e [$
/MW
h]
Figure 6.1 Average prices 99-05 in PJM market - zone PJM (data from www.pjm.com)
Parameters for volatility and mean reversion are difficult to estimate. We have used the values in Table 6.3, which give a fairly reasonable range of outcomes for prices. The correlation between hydrogen and electricity price, ρ, is set to 0.5. The values of these parameters are, of course, highly uncertain and subject to discussion. It should therefore be stressed that the main
The Market Viability of Nuclear Hydrogen Technologies Page 24 of 35 Argonne National Laboratory
conclusions from this report are of a qualitative rather than quantitative nature. We do a sensitivity analysis in section 6.6 for some of the price parameters.
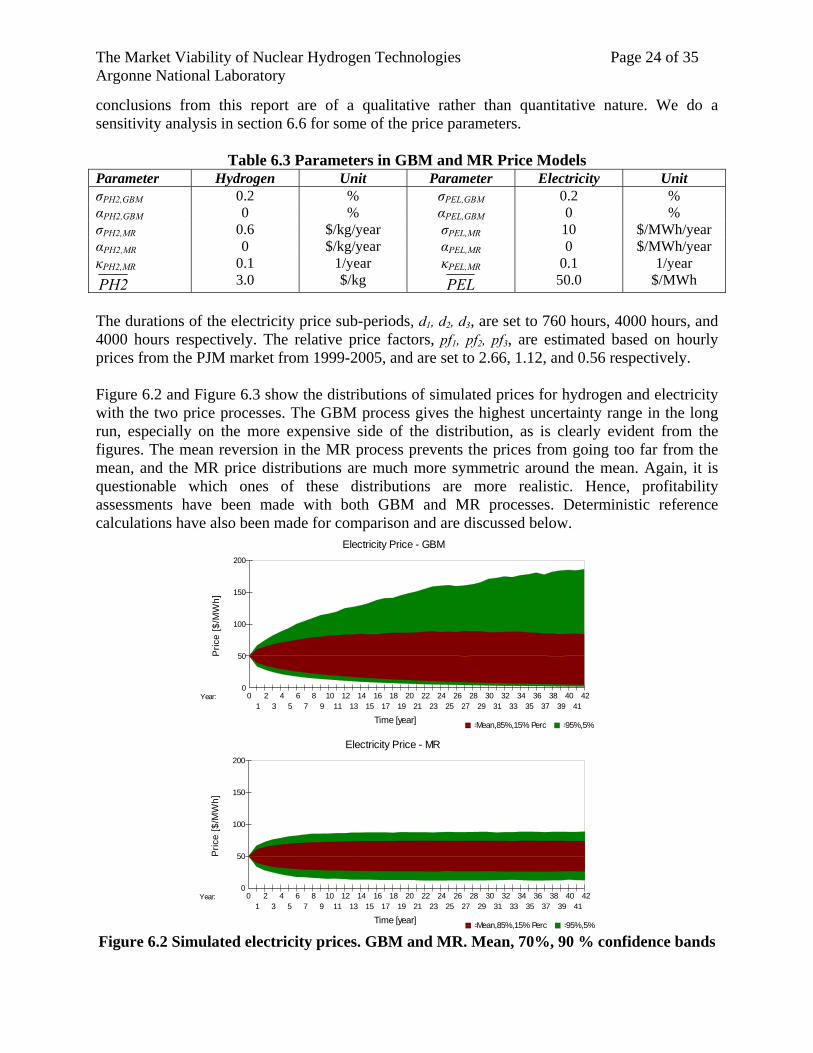
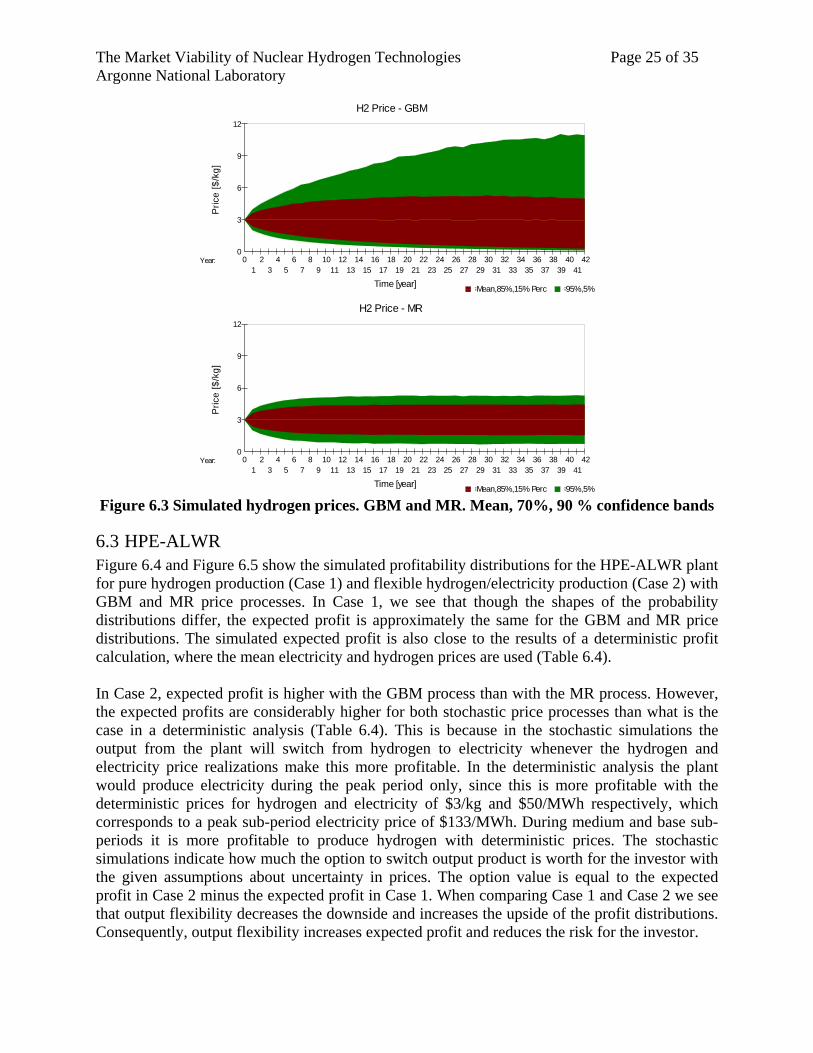
Table 6.3 Parameters in GBM and MR Price Models Parameter Hydrogen Unit Parameter Electricity Unit σPH2,GBM 0.2 % σPEL,GBM 0.2 % αPH2,GBM 0 % αPEL,GBM 0 % σPH2,MR 0.6 $/kg/year σPEL,MR 10 $/MWh/year αPH2,MR 0 $/kg/year αPEL,MR 0 $/MWh/year κPH2,MR 0.1 1/year κPEL,MR 0.1 1/year PH2 3.0 $/kg PEL 50.0 $/MWh The durations of the electricity price sub-periods, d1, d2, d3, are set to 760 hours, 4000 hours, and 4000 hours respectively. The relative price factors, pf1, pf2, pf3, are estimated based on hourly prices from the PJM market from 1999-2005, and are set to 2.66, 1.12, and 0.56 respectively. Figure 6.2 and Figure 6.3 show the distributions of simulated prices for hydrogen and electricity with the two price processes. The GBM process gives the highest uncertainty range in the long run, especially on the more expensive side of the distribution, as is clearly evident from the figures. The mean reversion in the MR process prevents the prices from going too far from the mean, and the MR price distributions are much more symmetric around the mean. Again, it is questionable which ones of these distributions are more realistic. Hence, profitability assessments have been made with both GBM and MR processes. Deterministic reference calculations have also been made for comparison and are discussed below.
Electricity Price - GBM
Pric
e [$
/MW
h]
Time [year]
0
50
100
150
200
0 2 4 6 8 10 12 14 16 18 20 22 24 26 28 30 32 34 36 38 40 42 1 3 5 7 9 11 13 15 17 19 21 23 25 27 29 31 33 35 37 39 41
Year:
=Mean,85%,15% Perc =95%,5% Electricity Price - MR
Pric
e [$
/MW
h]
Time [year]
0
50
100
150
200
0 2 4 6 8 10 12 14 16 18 20 22 24 26 28 30 32 34 36 38 40 42 1 3 5 7 9 11 13 15 17 19 21 23 25 27 29 31 33 35 37 39 41
Year:
=Mean,85%,15% Perc =95%,5% Figure 6.2 Simulated electricity prices. GBM and MR. Mean, 70%, 90 % confidence bands
The Market Viability of Nuclear Hydrogen Technologies Page 25 of 35 Argonne National Laboratory
H2 Price - GBM
Pric
e [$
/kg]
Time [year]
0
3
6
9
12
0 2 4 6 8 10 12 14 16 18 20 22 24 26 28 30 32 34 36 38 40 42 1 3 5 7 9 11 13 15 17 19 21 23 25 27 29 31 33 35 37 39 41
Year:
=Mean,85%,15% Perc =95%,5% H2 Price - MR
Pric
e [$
/kg]
Time [year]
0
3
6
9
12
0 2 4 6 8 10 12 14 16 18 20 22 24 26 28 30 32 34 36 38 40 42 1 3 5 7 9 11 13 15 17 19 21 23 25 27 29 31 33 35 37 39 41
Year:
=Mean,85%,15% Perc =95%,5% Figure 6.3 Simulated hydrogen prices. GBM and MR. Mean, 70%, 90 % confidence bands
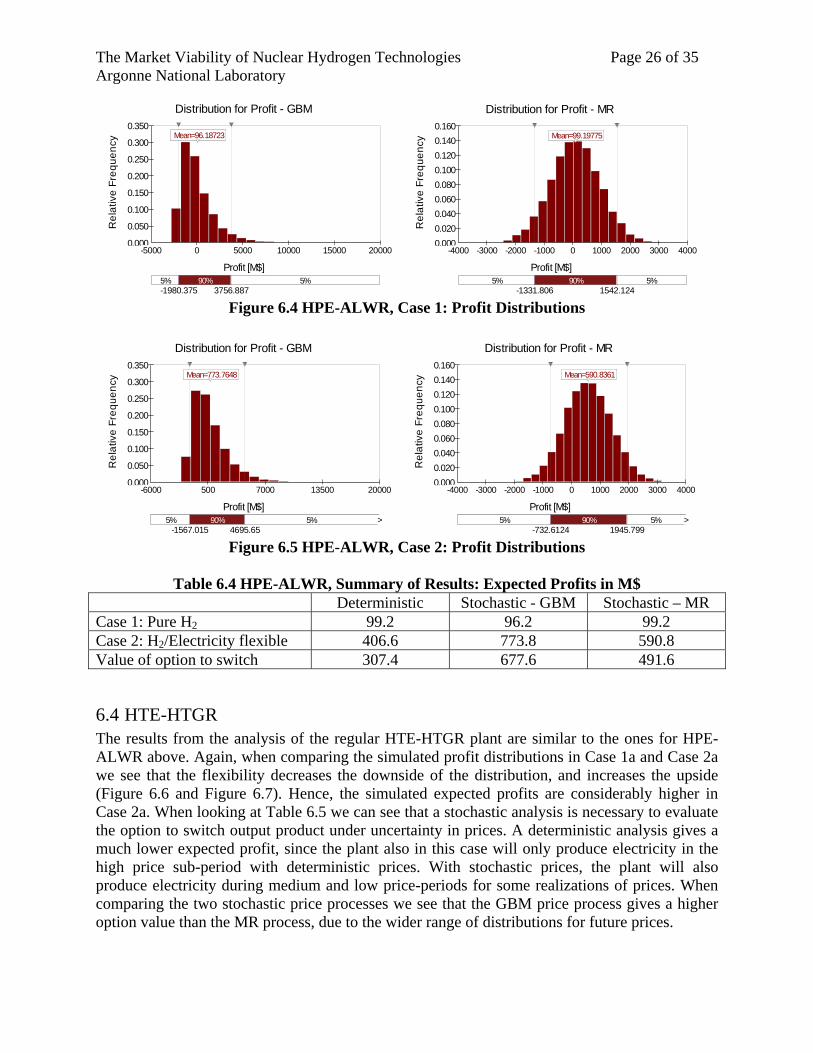
6.3 HPE-ALWR Figure 6.4 and Figure 6.5 show the simulated profitability distributions for the HPE-ALWR plant for pure hydrogen production (Case 1) and flexible hydrogen/electricity production (Case 2) with GBM and MR price processes. In Case 1, we see that though the shapes of the probability distributions differ, the expected profit is approximately the same for the GBM and MR price distributions. The simulated expected profit is also close to the results of a deterministic profit calculation, where the mean electricity and hydrogen prices are used (Table 6.4). In Case 2, expected profit is higher with the GBM process than with the MR process. However, the expected profits are considerably higher for both stochastic price processes than what is the case in a deterministic analysis (Table 6.4). This is because in the stochastic simulations the output from the plant will switch from hydrogen to electricity whenever the hydrogen and electricity price realizations make this more profitable. In the deterministic analysis the plant would produce electricity during the peak period only, since this is more profitable with the deterministic prices for hydrogen and electricity of $3/kg and $50/MWh respectively, which corresponds to a peak sub-period electricity price of $133/MWh. During medium and base sub-periods it is more profitable to produce hydrogen with deterministic prices. The stochastic simulations indicate how much the option to switch output product is worth for the investor with the given assumptions about uncertainty in prices. The option value is equal to the expected profit in Case 2 minus the expected profit in Case 1. When comparing Case 1 and Case 2 we see that output flexibility decreases the downside and increases the upside of the profit distributions. Consequently, output flexibility increases expected profit and reduces the risk for the investor.
The Market Viability of Nuclear Hydrogen Technologies Page 26 of 35 Argonne National Laboratory
Distribution for Profit - GBM
Rel
ativ
e Fr
eque
ncy
Profit [M$]
0.000
0.050
0.100
0.150
0.200
0.250
0.300
0.350
Mean=96.18723
-5000 0 5000 10000 15000 20000
-1980.3745-1980.3745
-5000 0 5000 10000 15000 20000
5% 90% 5% -1980.375 3756.887
Mean=96.18723
Distribution for Profit - MR
Rel
ativ
e Fr
eque
ncy
Profit [M$]
0.0000.0200.0400.0600.0800.1000.1200.1400.160
Mean=99.19775
-4000 -3000 -2000 -1000 0 1000 2000 3000 4000
-1980.3745-1980.3745
-4000 -3000 -2000 -1000 0 1000 2000 3000 4000
5% 90% 5% -1331.806 1542.124
Mean=99.19775
Figure 6.4 HPE-ALWR, Case 1: Profit Distributions
Distribution for Profit - GBM
Rel
ativ
e Fr
eque
ncy
Profit [M$]
0.000
0.050
0.100
0.150
0.200
0.250
0.300
0.350
Mean=773.7648
-6000 500 7000 13500 20000-6000 500 7000 13500 20000
5% 90% 5% > -1567.015 4695.65
Mean=773.7648
Distribution for Profit - MR
Rel
ativ
e Fr
eque
ncy
Profit [M$]
0.0000.0200.0400.0600.0800.1000.1200.1400.160
Mean=590.8361
-4000 -3000 -2000 -1000 0 1000 2000 3000 4000
-1980.3745-1980.3745
-4000 -3000 -2000 -1000 0 1000 2000 3000 4000
5% 90% 5% > -732.6124 1945.799
Mean=590.8361
Figure 6.5 HPE-ALWR, Case 2: Profit Distributions
Table 6.4 HPE-ALWR, Summary of Results: Expected Profits in M$
Deterministic Stochastic - GBM Stochastic – MR Case 1: Pure H2 99.2 96.2 99.2 Case 2: H2/Electricity flexible 406.6 773.8 590.8 Value of option to switch 307.4 677.6 491.6
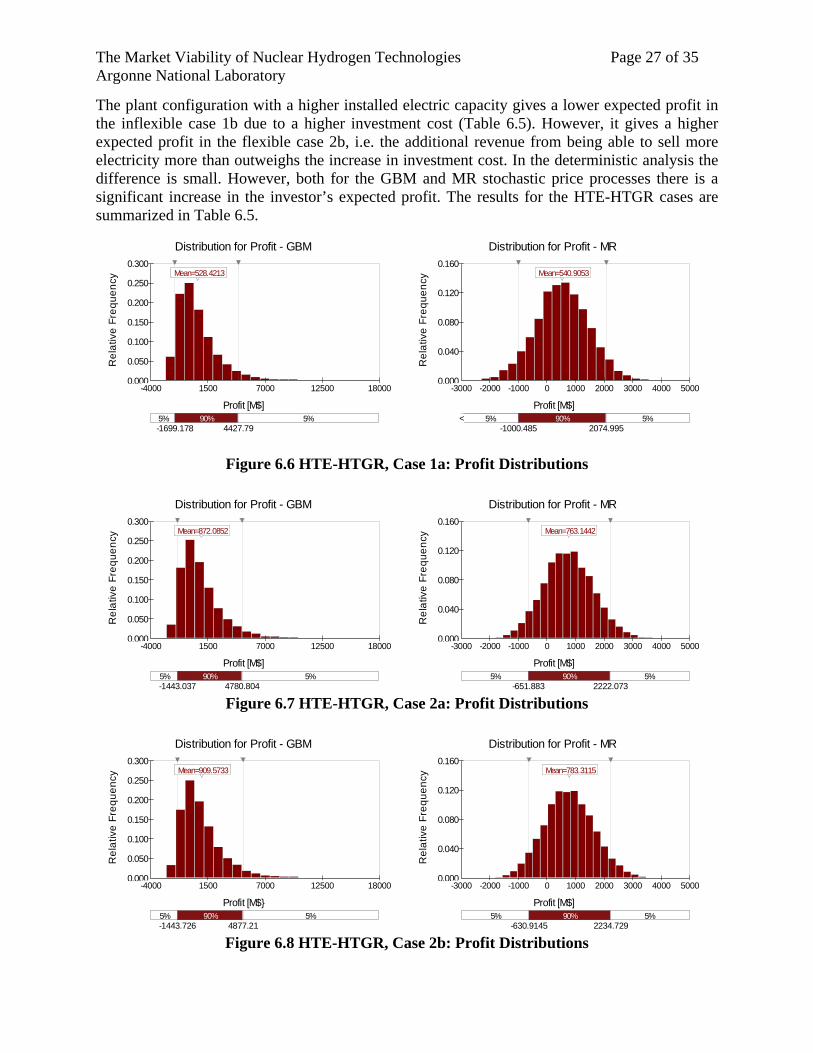
6.4 HTE-HTGR The results from the analysis of the regular HTE-HTGR plant are similar to the ones for HPE-ALWR above. Again, when comparing the simulated profit distributions in Case 1a and Case 2a we see that the flexibility decreases the downside of the distribution, and increases the upside (Figure 6.6 and Figure 6.7). Hence, the simulated expected profits are considerably higher in Case 2a. When looking at Table 6.5 we can see that a stochastic analysis is necessary to evaluate the option to switch output product under uncertainty in prices. A deterministic analysis gives a much lower expected profit, since the plant also in this case will only produce electricity in the high price sub-period with deterministic prices. With stochastic prices, the plant will also produce electricity during medium and low price-periods for some realizations of prices. When comparing the two stochastic price processes we see that the GBM price process gives a higher option value than the MR process, due to the wider range of distributions for future prices.
The Market Viability of Nuclear Hydrogen Technologies Page 27 of 35 Argonne National Laboratory
The plant configuration with a higher installed electric capacity gives a lower expected profit in the inflexible case 1b due to a higher investment cost (Table 6.5). However, it gives a higher expected profit in the flexible case 2b, i.e. the additional revenue from being able to sell more electricity more than outweighs the increase in investment cost. In the deterministic analysis the difference is small. However, both for the GBM and MR stochastic price processes there is a significant increase in the investor’s expected profit. The results for the HTE-HTGR cases are summarized in Table 6.5.
Distribution for Profit - GBM
Rel
ativ
e Fr
eque
ncy
Profit [M$]
0.000
0.050
0.100
0.150
0.200
0.250
0.300
Mean=528.4213
-4000 1500 7000 12500 18000-4000 1500 7000 12500 18000
5% 90% 5% -1699.178 4427.79
Mean=528.4213
Distribution for Profit - MR
R
elat
ive
Freq
uenc
y
Profit [M$]
0.000
0.040
0.080
0.120
0.160
Mean=540.9053
-3000 -2000 -1000 0 1000 2000 3000 4000 5000-3000 -2000 -1000 0 1000 2000 3000 4000 5000
5% 90% 5%< -1000.485 2074.995
Mean=540.9053
Figure 6.6 HTE-HTGR, Case 1a: Profit Distributions
Distribution for Profit - GBM
Rel
ativ
e Fr
eque
ncy
Profit [M$]
0.000
0.050
0.100
0.150
0.200
0.250
0.300
Mean=872.0852
-4000 1500 7000 12500 18000-4000 1500 7000 12500 18000
5% 90% 5% -1443.037 4780.804
Mean=872.0852
Distribution for Profit - MR
Rel
ativ
e Fr
eque
ncy
Profit [M$]
0.000
0.040
0.080
0.120
0.160
Mean=763.1442
-3000 -2000 -1000 0 1000 2000 3000 4000 5000-3000 -2000 -1000 0 1000 2000 3000 4000 5000
5% 90% 5% -651.883 2222.073
Mean=763.1442
Figure 6.7 HTE-HTGR, Case 2a: Profit Distributions
Distribution for Profit - GBM
Rel
ativ
e Fr
eque
ncy
Profit [M$}
0.000
0.050
0.100
0.150
0.200
0.250
0.300
Mean=909.5733
-4000 1500 7000 12500 18000-4000 1500 7000 12500 18000
5% 90% 5% -1443.726 4877.21
Mean=909.5733
Distribution for Profit - MR
Rel
ativ
e Fr
eque
ncy
Profit [M$]
0.000
0.040
0.080
0.120
0.160
Mean=783.3115
-3000 -2000 -1000 0 1000 2000 3000 4000 5000-3000 -2000 -1000 0 1000 2000 3000 4000 5000
5% 90% 5% -630.9145 2234.729
Mean=783.3115
Figure 6.8 HTE-HTGR, Case 2b: Profit Distributions
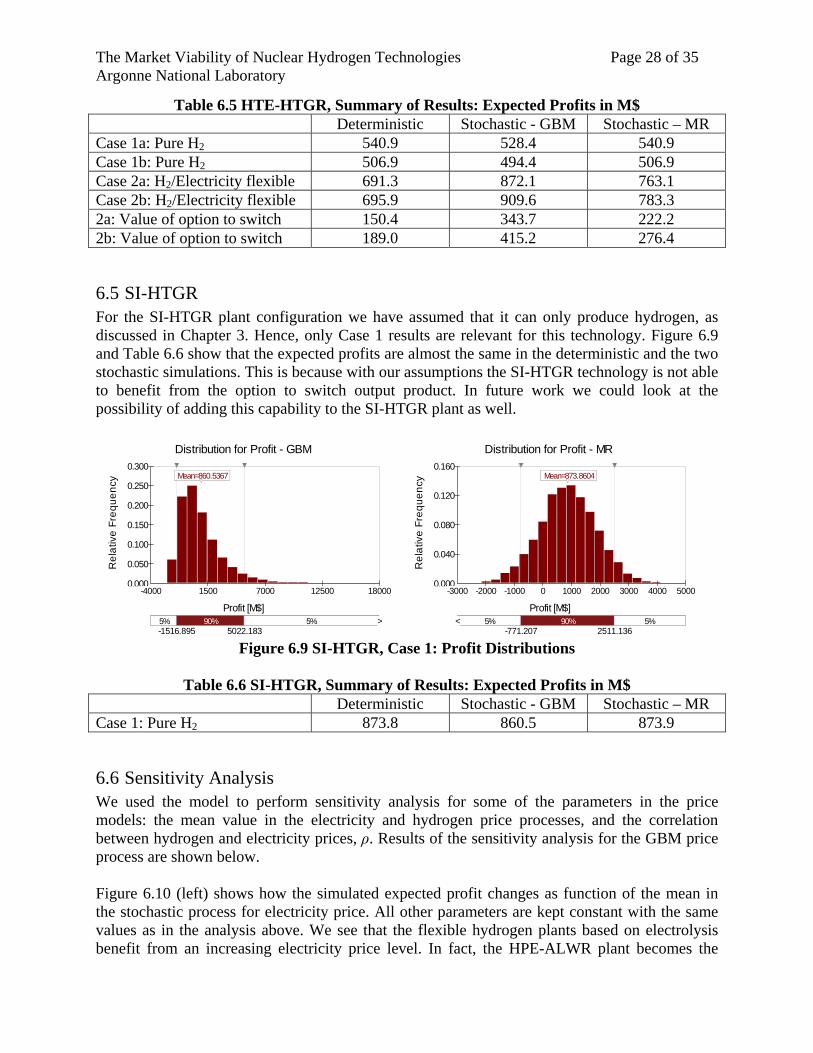
The Market Viability of Nuclear Hydrogen Technologies Page 28 of 35 Argonne National Laboratory
Table 6.5 HTE-HTGR, Summary of Results: Expected Profits in M$ Deterministic Stochastic - GBM Stochastic – MR Case 1a: Pure H2 540.9 528.4 540.9 Case 1b: Pure H2 506.9 494.4 506.9 Case 2a: H2/Electricity flexible 691.3 872.1 763.1 Case 2b: H2/Electricity flexible 695.9 909.6 783.3 2a: Value of option to switch 150.4 343.7 222.2 2b: Value of option to switch 189.0 415.2 276.4
6.5 SI-HTGR For the SI-HTGR plant configuration we have assumed that it can only produce hydrogen, as discussed in Chapter 3. Hence, only Case 1 results are relevant for this technology. Figure 6.9 and Table 6.6 show that the expected profits are almost the same in the deterministic and the two stochastic simulations. This is because with our assumptions the SI-HTGR technology is not able to benefit from the option to switch output product. In future work we could look at the possibility of adding this capability to the SI-HTGR plant as well.
Distribution for Profit - GBM
Rel
ativ
e Fr
eque
ncy
Profit [M$]
0.000
0.050
0.100
0.150
0.200
0.250
0.300
Mean=860.5367
-4000 1500 7000 12500 18000-4000 1500 7000 12500 18000
5% 90% 5% > -1516.895 5022.183
Mean=860.5367
Distribution for Profit - MR
Rel
ativ
e Fr
eque
ncy
Profit [M$]
0.000
0.040
0.080
0.120
0.160
Mean=873.8604
-3000 -2000 -1000 0 1000 2000 3000 4000 5000-3000 -2000 -1000 0 1000 2000 3000 4000 5000
5% 90% 5%< -771.207 2511.136
Mean=873.8604
Figure 6.9 SI-HTGR, Case 1: Profit Distributions
Table 6.6 SI-HTGR, Summary of Results: Expected Profits in M$
Deterministic Stochastic - GBM Stochastic – MR Case 1: Pure H2 873.8 860.5 873.9
6.6 Sensitivity Analysis We used the model to perform sensitivity analysis for some of the parameters in the price models: the mean value in the electricity and hydrogen price processes, and the correlation between hydrogen and electricity prices, ρ. Results of the sensitivity analysis for the GBM price process are shown below. Figure 6.10 (left) shows how the simulated expected profit changes as function of the mean in the stochastic process for electricity price. All other parameters are kept constant with the same values as in the analysis above. We see that the flexible hydrogen plants based on electrolysis benefit from an increasing electricity price level. In fact, the HPE-ALWR plant becomes the

The Market Viability of Nuclear Hydrogen Technologies Page 29 of 35 Argonne National Laboratory
most profitable technology when the electricity price level reaches 70 $/MWh. The electrolysis based technologies take advantage of the higher electricity price level by producing less hydrogen and more electricity, as shown in Figure 6.10 (right). The expected profits from the SI-HTGR plant does not change as a function of electricity price, since it produces hydrogen only. When doing the same type of sensitivity analysis for the mean hydrogen price (Figure 6.11), we see that the SI-HTGR plant benefits the most from increasing hydrogen price. However, also the electrolysis plants increase their profits as a function of higher hydrogen prices, since the amount of hydrogen production also goes up.
0.0
200.0
400.0
600.0
800.0
1000.0
1200.0
1400.0
1600.0
30.0 40.0 50.0 60.0 70.0
Mean Electricity Price [$/MWh]
Expe
cted
Pro
fit [M
$]
HPE-ALWR2HTE-HTGR2aHTE-HTGR2bSI-HTGR1
0.0
20.0
40.0
60.0
80.0
100.0
120.0
30.0 40.0 50.0 60.0 70.0
Mean Electricity Price [$/MWh]
Rel
ativ
e H
ydro
gen
Prod
uctio
n [%
]
HPE-ALWR2HTE-HTGR2aHTE-HTGR2bSI-HTGR1
Figure 6.10 Sensitivity Analysis for Mean Electricity Price
-500.0
0.0
500.0
1000.0
1500.0
2000.0
2500.0
2.0 2.5 3.0 3.5 4.0
Mean Hydrogen Price [$/kg]
Expe
cted
Pro
fit [M
$]
HPE-ALWR2HTE-HTGR2aHTE-HTGR2bSI-HTGR1
0.0
20.0
40.0
60.0
80.0
100.0
120.0
2.0 2.5 3.0 3.5 4.0
Mean Hydrogen Price [$/kg]
Rel
ativ
e H
ydro
gen
Prod
uctio
n [%
]
HPE-ALWR2HTE-HTGR2aHTE-HTGR2bSI-HTGR1
Figure 6.11 Sensitivity Analysis for Mean Hydrogen Price
The correlation between hydrogen and electricity price also has an important impact on the profitability of the two electrolysis technologies (Figure 6.12). For the HPE-ALWR and HTE-HTGR plants it is clearly an advantage with a low or negative correlation between hydrogen and electricity price. This is because with low correlation it is more likely that electricity prices are high when hydrogen prices are low, and these plants can take advantage of these situations, by switching from hydrogen to electricity production. In contrast, if the correlation is high this advantage disappears, since high electricity prices will only occur when hydrogen prices are also high. In fact, with a correlation factor of 1 the expected profit for the HPE-ALWR and HTE-HTGR plants drop down to the same level as in the deterministic analysis. The amount of hydrogen production increases as a function higher correlation, and with a correlation of 1 the plant only produces electricity in the peak price sub-period, equivalent to the deterministic case.
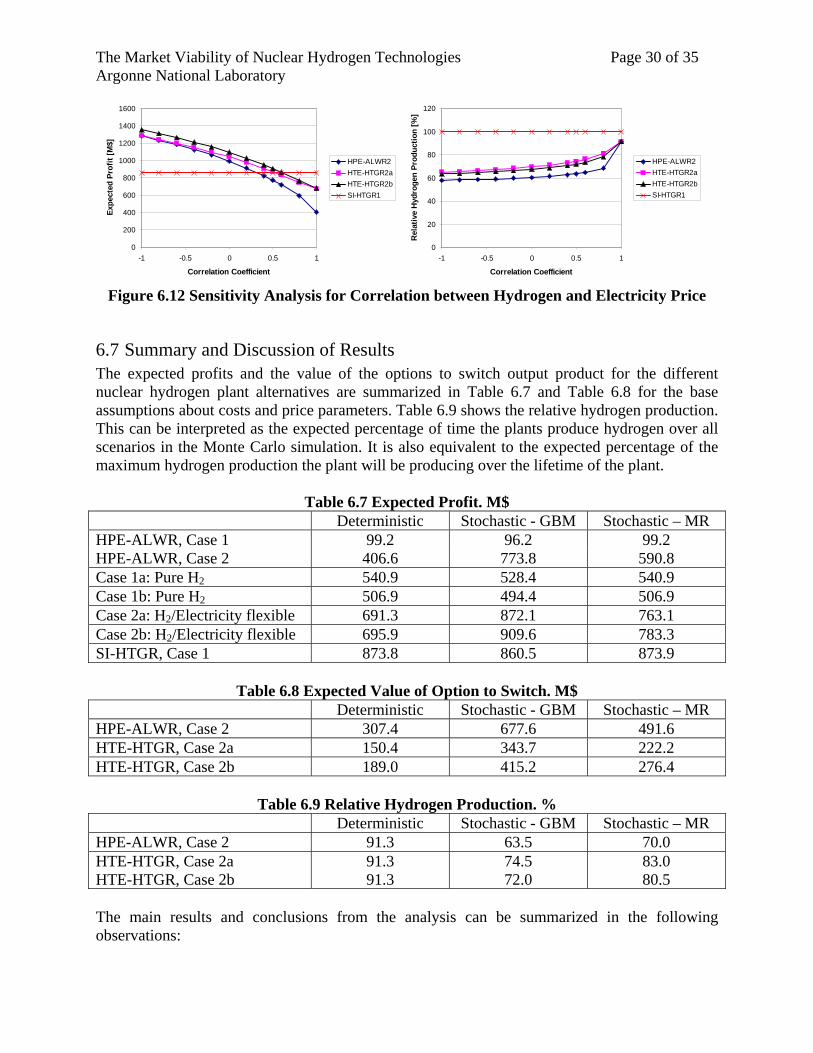
The Market Viability of Nuclear Hydrogen Technologies Page 30 of 35 Argonne National Laboratory
0
200
400
600
800
1000
1200
1400
1600
-1 -0.5 0 0.5 1
Correlation Coefficient
Expe
cted
Pro
fit [M
$]
HPE-ALWR2HTE-HTGR2aHTE-HTGR2bSI-HTGR1
0
20
40
60
80
100
120
-1 -0.5 0 0.5 1
Correlation Coefficient
Rel
ativ
e H
ydro
gen
Prod
uctio
n [%
]
HPE-ALWR2HTE-HTGR2aHTE-HTGR2bSI-HTGR1
Figure 6.12 Sensitivity Analysis for Correlation between Hydrogen and Electricity Price
6.7 Summary and Discussion of Results The expected profits and the value of the options to switch output product for the different nuclear hydrogen plant alternatives are summarized in Table 6.7 and Table 6.8 for the base assumptions about costs and price parameters. Table 6.9 shows the relative hydrogen production. This can be interpreted as the expected percentage of time the plants produce hydrogen over all scenarios in the Monte Carlo simulation. It is also equivalent to the expected percentage of the maximum hydrogen production the plant will be producing over the lifetime of the plant.
Table 6.7 Expected Profit. M$ Deterministic Stochastic - GBM Stochastic – MR HPE-ALWR, Case 1 99.2 96.2 99.2 HPE-ALWR, Case 2 406.6 773.8 590.8 Case 1a: Pure H2 540.9 528.4 540.9 Case 1b: Pure H2 506.9 494.4 506.9 Case 2a: H2/Electricity flexible 691.3 872.1 763.1 Case 2b: H2/Electricity flexible 695.9 909.6 783.3 SI-HTGR, Case 1 873.8 860.5 873.9
Table 6.8 Expected Value of Option to Switch. M$ Deterministic Stochastic - GBM Stochastic – MR HPE-ALWR, Case 2 307.4 677.6 491.6 HTE-HTGR, Case 2a 150.4 343.7 222.2 HTE-HTGR, Case 2b 189.0 415.2 276.4
Table 6.9 Relative Hydrogen Production. % Deterministic Stochastic - GBM Stochastic – MR HPE-ALWR, Case 2 91.3 63.5 70.0 HTE-HTGR, Case 2a 91.3 74.5 83.0 HTE-HTGR, Case 2b 91.3 72.0 80.5 The main results and conclusions from the analysis can be summarized in the following observations:
The Market Viability of Nuclear Hydrogen Technologies Page 31 of 35 Argonne National Laboratory
• The profitability analysis under uncertainty presented in this report can clearly give a different picture of the relative viability of the nuclear hydrogen production technologies when comparing to the standard levelized cost analysis.
• The HPE-ALWR and HTE-HTGR have an advantage in being able to switch between
hydrogen and electricity output, since this flexibility contributes to increase expected profit and reduce the economic risk for the investor. Our analysis indicates that the HTE-HTGR plant can be at least as attractive as the SI-HTGR plant, despite a considerably higher levelized cost. It also appears to be profitable to add additional electric generation capacity to the SI-HTGR plant configuration, in order to fully take advantage of the ability to switch to electricity output when this is more profitable.
• The option to switch output product adds value for the investor. The added value must be
weighed against potential increases in investment and operating costs. For the flexible plants we have assumed that they have full flexibility to switch their entire production from hydrogen to electricity instantaneously and frequently without additional cost. In reality, there may be both technical and contractual restrictions for how quickly and often plants can switch their output. The option values of flexibility calculated in this report may therefore be regarded as an upper limit for the given assumptions.
• Our findings suggest that R&D effort should be directed towards developing better and
more durable materials for the hydrogen production processes, which are better able to handle switching in product output.
• Future plant owners should carefully consider how much of its hydrogen production to
sell on long-term contracts, at the expense of losing the value of the option to switch between electricity and hydrogen production.
• There is high uncertainty concerning the assumptions for the analysis, both regarding
performance, cost, and price parameters. The conclusions are therefore qualitative rather than quantitative. Sensitivity analysis was performed for price parameters. However, sensitivity studies should also be carried out for the cost and performance assumptions used for the different technologies.
• The study also serves to illustrate the advantage of using a stochastic model for
analyzing investments and operational flexibility under uncertainty. A deterministic model is likely to underestimate the option value of flexibility.
• The GBM price processes gives higher option value of switching compared to the MR
processes, due to higher variability in prices. • We see a number of relevant extensions of the financial modeling framework presented
in this report, among them: 1) A more detailed representation of electricity and hydrogen price fluctuations within day, week, and season. 2) Representation of firm hydrogen demand, possibly as an uncertain variable. 3) Analysis of the value of modular expansions of hydrogen production capacity.
The Market Viability of Nuclear Hydrogen Technologies Page 32 of 35 Argonne National Laboratory
7. Conclusions and Future Work While the upward potential for hydrogen seems rather promising, there are also substantial downside risks and uncertainties that will affect how future investors will try to enter this market. Economic studies of nuclear hydrogen technologies have so far mostly been focused on levelized costs without accounting for any of the risks and uncertainties faced by potential investors. The analysis presented in this report is an important extension to the levelized cost calculations and attempts to identify and address some of the financial risks and opportunities associated with nuclear hydrogen production. We selected several technologies to evaluate with our model, including (1) low-temperature high-pressure water electrolysis, (2) high-temperature steam electrolysis, and (3) high-temperature sulfur-iodine processing. The cost and performance related input parameters were based on the initial estimates from the technology designers. However, we recognize that uncertainties still exist regarding the input parameters, and the cost and performance of these processes will be refined as more research and information become available. We used Real Options Theory to assess the profitability of these three nuclear hydrogen production technologies under price uncertainties in the newly emerging markets. Our model calculates the discounted profits from investing in a production facility. Monte-Carlo simulations are used to represent the uncertainty in hydrogen and electricity prices. The model computes both the expected value and the distribution of discounted profits from the production plant. It also quantifies the value of the option to switch between hydrogen and electricity production while trying to maximize facility profits. Under these assumptions, we conclude that investors will find significant value in the possibility to switch plant output between electricity and hydrogen. This value has to be traded-off against possible higher investment and operating costs. In some cases, we find that the value of flexibility to switch between hydrogen and electricity production is sufficient to offset the levelized cost disadvantages of some technologies. For example, a co-generation HTE-HTGR can potentially be more profitable than an SI-HTGR with no electricity production, even though the levelized cost of HTE-HTGR was predicted to be considerably higher than that of SI-HTGR. The flexibility to quickly react to market signals brings up technical challenges related to the durability of the catalytic materials in the hydrogen plant. This challenge is valid for both the electrolytic and thermochemical processes. However, given the potential significant economical benefit that can be brought from the co-generation with the flexibility to react to market signals to maximize profits, we conclude that DOE should consider R&D efforts towards developing durable materials and processes that can enable this type of operation. Our future work will focus on analyzing a range of hydrogen production technologies associated with an extension of the financial analysis framework presented here. We are planning to address a variety of additional risks and options, such as the value of modular expansion in addition to co-generation capability (i.e., a modular increase in the hydrogen production capacity of a plant

The Market Viability of Nuclear Hydrogen Technologies Page 33 of 35 Argonne National Laboratory
in a given market with rising hydrogen demand) and contrast that with economies-of-scale of large-unit designs. Our results will be incorporated into the larger DOE-EE systems analysis activities.
The Market Viability of Nuclear Hydrogen Technologies Page 34 of 35 Argonne National Laboratory
References Botterud A., Ilic M.D., Wangensteen I., “Optimal Investments in Power Generation under Centralized and Decentralized Decision Making,” IEEE Transactions on Power Systems, Vol. 20, No. 1, pp. 254-263, 2005. Brennan M.J., Trigeorigis L., “Real Options: Development and New Contributions,” in Project Flexibility, Agency and Competition, edited by Brennan M.J. and Trigeorgis L., Oxford University Press, 2000. Brown, L. C., Besenbruch, G. E., Lentsch, R. D., Schultz, K. R., Funk, J. F., Pickard, P. S., Marshall, A. C., Showalter S. K., “High Efficiency Generation of Hydrogen Fuels Using Nuclear Power,” General Atomics Technical Report GA-A24285, June 2003. Colson-Inam, S., “Solid Oxide Fuel Cells: Ready to Market?” Fuel Cell Today, 07 January 2004. Copeland T. and Antikarov V., Real Options: A Practitioner’s Guide, Thomson Texere, New York NY, 2003. Deng S-J., Johnson B., Sogomonian A, ”Exotic electricity options and the valuation of electricity generation and transmission assets,” Decision Support Systems, Vol. 30, pp. 383-392, 2001. Dixit A.K., Pindyck R.S., Investment under Uncertainty, Princeton University Press, Princeton, NJ, 1994. Entergy Corporation, Private Communication, Argonne National Laboratory, July 2003. Graber R. and Rothwell G., “Restoring the Nuclear Option in the US: A Real Options Approach,” Proceedings USAEE Annual Conference, Denver CO, 2005. GRI96, “The Value and Manufacturing Costs of Planar Solid Oxide Fuel Cell Stacks,” GRI-96/0210, Gas Research Institute, Chicago, July 96. Maribu K-M., Fleten S-E., “Combined Heat and Power in Commercial Buildings: Investment and Risk Analysis,” Proceedings of the 2005 INFORMS Annual Meeting, San Francisco CA, Nov. 2005. Palisade, “Guide to Using @Risk: Risk Analysis and Simulation Add-In for Microsoft® Excel,” Palisade Corporation, Newfield NY, 2004. Penner S.S., “Steps toward the Hydrogen Economy,” Energy, Vol. 31, pp.33-43, 2006. Petri M.C., Yildiz B., Klickman A.E., “US work on technical and economic aspects of electrolytic, thermochemical, and hybrid processes for hydrogen production at temperatures below 550°C,” International Journal of Nuclear Hydrogen Production and Applications, Vol.1, No. 1, pp. 79-91, 2006.

The Market Viability of Nuclear Hydrogen Technologies Page 35 of 35 Argonne National Laboratory
Rothwell G., “A Real Options Approach to Evaluating New Nuclear Power Plants,” The Energy Journal, Vol. 27, No. 1, pp. 37-53, 2006. Rothwell G., Bertel E., Williams K., “Can Nuclear Power Compete in the Hydrogen Economy?” Presentation to the Third Information Exchange Meeting on the Nuclear Production of Hydrogen, Oarai, Japan, 5-7 October 2005. Schwartz E.S., Smith J.E., “Short-Term Variations and Long-Term Dynamics in Commodity Prices,” Management Science Vol. 46, No.7, pp.893-911, July 2000. SRI Consulting (2004), “Chemical Economics Handbook (CEH) Marketing Research Report: Hydrogen,” 2004. Stephan C., Sullivan J., 2004, “An agent-based hydrogen vehicle/infrastructure model”, Proceedings of the 2004 IEEE Congress on Evolutionary Computation, Vol. 2, Portland OR, 2004. Technology Insights, “Nuclear Hydrogen Cost Projections for NHI Thermochemical and Electrolytic Production Options (Framework for Economic Evaluation of Nuclear Hydrogen Production Options),” Technology Insights Report, March 2006. Trigeorgis L., “Real Options: an Overview,” in Real Options and Investment under Uncertainty, edited by Schwartz E.S and Trigeorgis L., The MIT Press, 2001. Yildiz B., Petri M.C., Conzelmann G., Forsberg C., “Configuration and Technology Implications of Potential Nuclear Hydrogen System Applications,” Report ANL 05/30, Argonne National Laboratory, July 2005.

A U.S. Department of Energy laboratory managed by UChicago Argonne, LLC
Decision and Information Sciences DivisionArgonne National Laboratory9700 South Cass Avenue, Bldg. 900Argonne, IL 60439-4832
www.anl.gov