Embed Size (px)
Citation preview
1 1 S e p t e m b e r , 2 0 1 4 P a g e | 1
2014
The Market Conquest of Europe
Author:
Hanna Schaal
1 1 S e p t e m b e r , 2 0 1 4 P a g e | 2
The Market Conquest of Europe
It is, by now, common knowledge that Europe’s legacy carriers have largely lost out on the intracontinental
air travel success story to Ryanair and easyJet. However, in a new turn of events, these two budget carriers
are increasingly having to share the market with new rivals: By very effectively applying the hybrid carrier
model, both Norwegian Air Shuttle and IAG (International Airlines Group) member Vueling Airlines are
making great strides in the game of catch-up with the heavy-weights from Ireland and the UK – a
development that does not leave even gargantuan Ryanair unaffected.
Growth figures demonstrate that there are indeed more than just two big European budget carriers who
know how to win over customers and increase their market share; Norwegian and Vueling have joined
Ryanair and easyJet in conquering Europe’s strongest economies (by Gross Domestic Product - GDP) – to
the detriment of the European legacy carriers.
What is happening in Europe?
While Vueling and Norwegian are earning accolades for their recent success, such as “Regional Airline of
the year 2013” (Vueling) and “Europe’s Best Low-Cost Carrier of the Year 2014 and 2013” (Norwegian)1,
Ultra Low Cost Carrier (ULCC) Ryanair grabbed media attention at the end of 2013 by announcing profit
warnings. As a result, the ULCC is about to implement some strategic changes which are not quite in tune
with the ultra-low cost concept anymore. By offering allocated seating, revising its carry-on policy and
investing in big marketing campaigns, Ryanair is attempting to change its image to that of a more
customer-friendly carrier. The aim? To attract families, groups and business travelers. This is a clear
strategic move towards the hybrid carrier model which easyJet implemented a number of years ago.
Norwegian and Vueling have always put a high degree of emphasis on customer service. The Spanish
airline, for example, does not describe itself as “low-cost” but as “smart-cost”: 44% of its passengers are
travelling for business purposes.2 With 81.7 million passengers in 2013, Ryanair is still the largest airline in
Europe; however, its planned strategic re-orientation leads to the assumption that the carrier’s
management is taking the competition seriously and is willing to learn from its rivals.
Growth analysis 2009 vs. 2014
To highlight Europe’s most successful budget carriers’ strong growth over recent years, PROLOGIS has
conducted an analysis of destinations, frequencies and capacities, as well as fleet size for Ryanair, easyJet,
Norwegian and Vueling over sample weeks in June/July of 2009 and 2014. It is based on schedule data
from ch-aviation/Innovata and the ch-aviation fleet database.
1 CAPA Aviation Awards 2013 & Skytrax Awards 2014 and 2013 2 Vuelingnews.com (2014)
1 1 S e p t e m b e r , 2 0 1 4 P a g e | 3
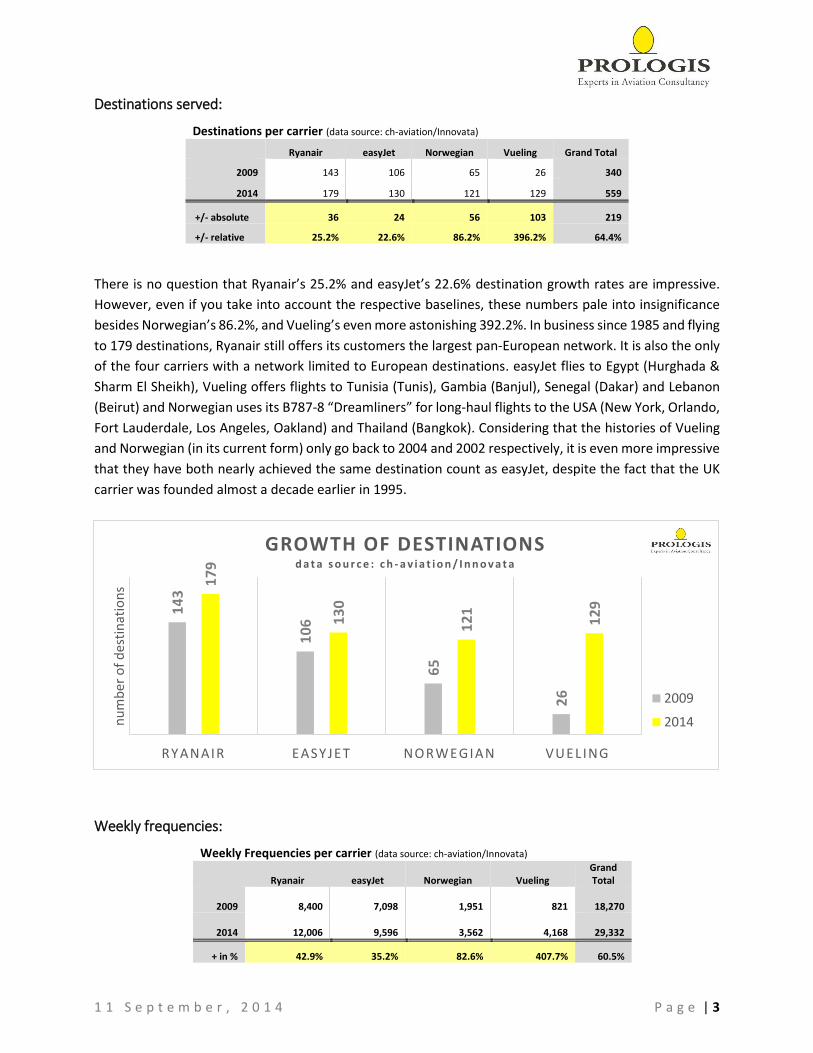
Destinations served:
Destinations per carrier (data source: ch-aviation/Innovata)
Ryanair easyJet Norwegian Vueling Grand Total
2009 143 106 65 26 340
2014 179 130 121 129 559
+/- absolute 36 24 56 103 219
+/- relative 25.2% 22.6% 86.2% 396.2% 64.4%
There is no question that Ryanair’s 25.2% and easyJet’s 22.6% destination growth rates are impressive.
However, even if you take into account the respective baselines, these numbers pale into insignificance
besides Norwegian’s 86.2%, and Vueling’s even more astonishing 392.2%. In business since 1985 and flying
to 179 destinations, Ryanair still offers its customers the largest pan-European network. It is also the only
of the four carriers with a network limited to European destinations. easyJet flies to Egypt (Hurghada &
Sharm El Sheikh), Vueling offers flights to Tunisia (Tunis), Gambia (Banjul), Senegal (Dakar) and Lebanon
(Beirut) and Norwegian uses its B787-8 “Dreamliners” for long-haul flights to the USA (New York, Orlando,
Fort Lauderdale, Los Angeles, Oakland) and Thailand (Bangkok). Considering that the histories of Vueling
and Norwegian (in its current form) only go back to 2004 and 2002 respectively, it is even more impressive
that they have both nearly achieved the same destination count as easyJet, despite the fact that the UK
carrier was founded almost a decade earlier in 1995.
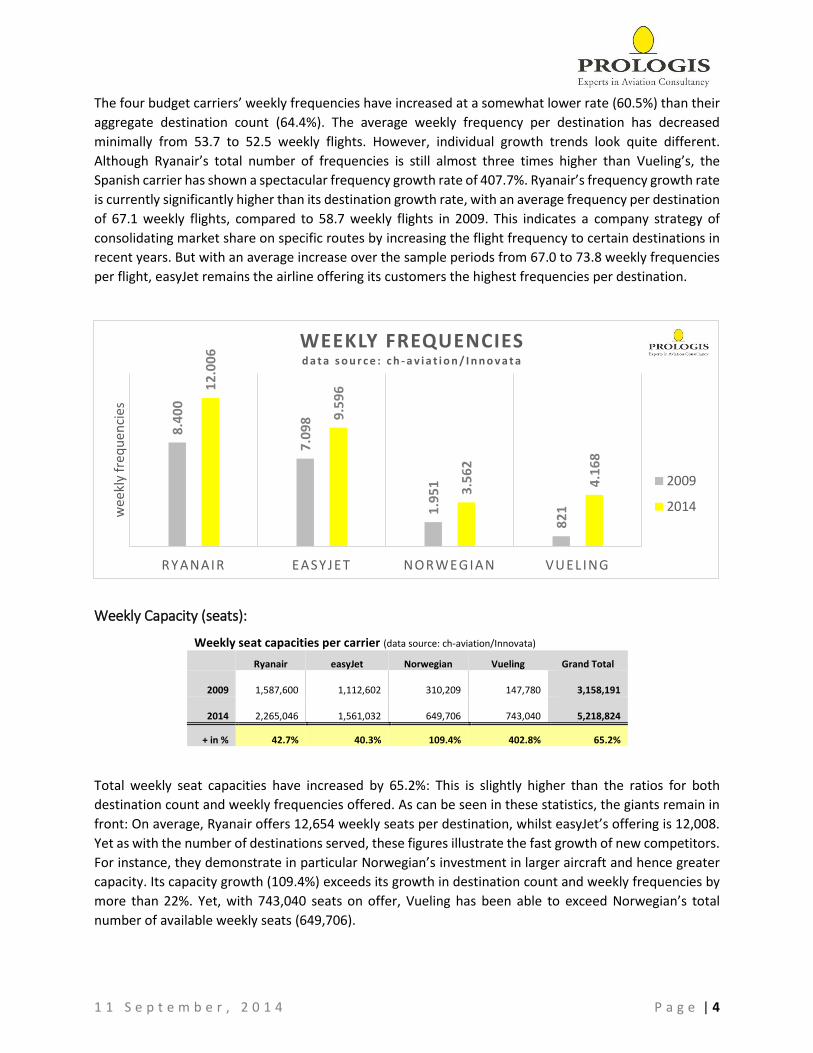
Weekly frequencies:
Weekly Frequencies per carrier (data source: ch-aviation/Innovata)
Ryanair easyJet Norwegian Vueling Grand Total
2009
8,400
7,098
1,951
821
18,270
2014
12,006
9,596
3,562
4,168
29,332
+ in % 42.9% 35.2% 82.6% 407.7% 60.5%
14
3
10
6
65
26
17
9
13
0
12
1
12
9
RYANAIR EASYJET NORWEGIAN VUEL ING
nu
mb
er o
f d
esti
nat
ion
s
GROWTH OF DESTINATIONSd a t a s o u r c e : c h - a v i a t i o n / I n n o v a t a
2009
2014
1 1 S e p t e m b e r , 2 0 1 4 P a g e | 4
The four budget carriers’ weekly frequencies have increased at a somewhat lower rate (60.5%) than their
aggregate destination count (64.4%). The average weekly frequency per destination has decreased
minimally from 53.7 to 52.5 weekly flights. However, individual growth trends look quite different.
Although Ryanair’s total number of frequencies is still almost three times higher than Vueling’s, the
Spanish carrier has shown a spectacular frequency growth rate of 407.7%. Ryanair’s frequency growth rate
is currently significantly higher than its destination growth rate, with an average frequency per destination
of 67.1 weekly flights, compared to 58.7 weekly flights in 2009. This indicates a company strategy of
consolidating market share on specific routes by increasing the flight frequency to certain destinations in
recent years. But with an average increase over the sample periods from 67.0 to 73.8 weekly frequencies
per flight, easyJet remains the airline offering its customers the highest frequencies per destination.
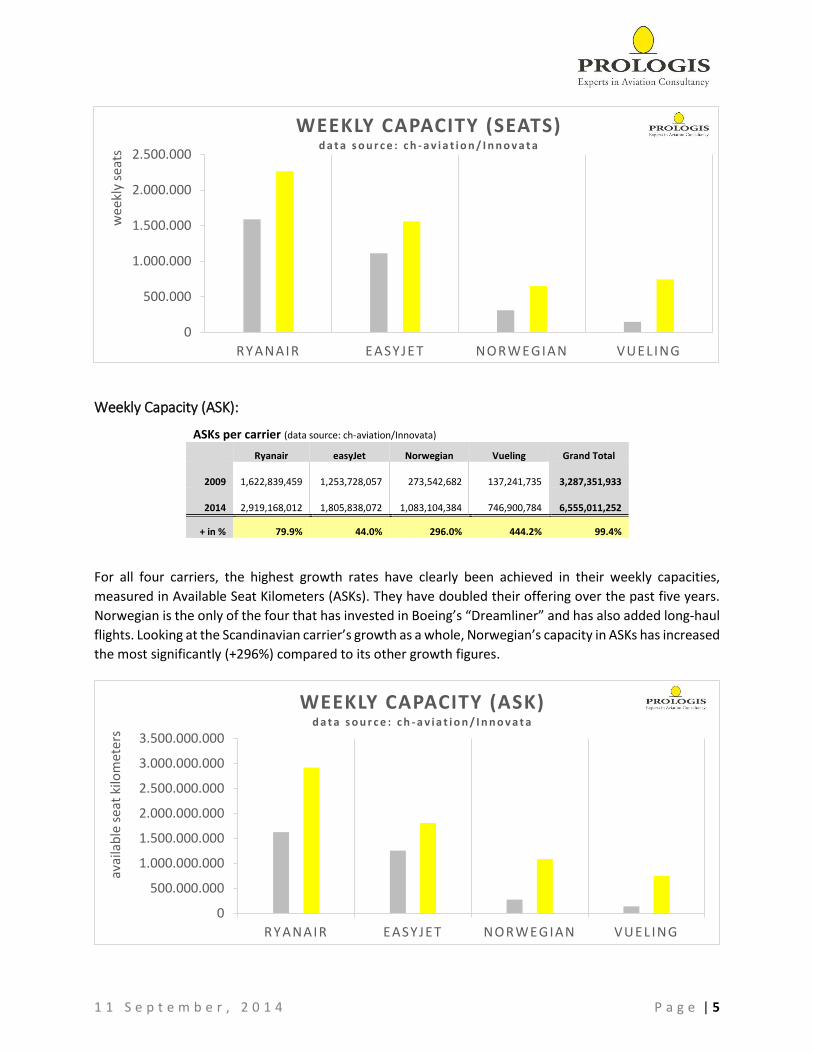
Weekly Capacity (seats):
Weekly seat capacities per carrier (data source: ch-aviation/Innovata)
Ryanair easyJet Norwegian Vueling Grand Total
2009
1,587,600
1,112,602
310,209
147,780
3,158,191
2014
2,265,046
1,561,032
649,706
743,040
5,218,824
+ in % 42.7% 40.3% 109.4% 402.8% 65.2%
Total weekly seat capacities have increased by 65.2%: This is slightly higher than the ratios for both
destination count and weekly frequencies offered. As can be seen in these statistics, the giants remain in
front: On average, Ryanair offers 12,654 weekly seats per destination, whilst easyJet’s offering is 12,008.
Yet as with the number of destinations served, these figures illustrate the fast growth of new competitors.
For instance, they demonstrate in particular Norwegian’s investment in larger aircraft and hence greater
capacity. Its capacity growth (109.4%) exceeds its growth in destination count and weekly frequencies by
more than 22%. Yet, with 743,040 seats on offer, Vueling has been able to exceed Norwegian’s total
number of available weekly seats (649,706).
8.4
00
7.0
98
1.9
51
82
1
12
.00
6
9.5
96
3.5
62
4.1
68
RYANAIR EASYJET NORWEGIAN VUEL ING
we
ekly
fre
qu
enci
es
WEEKLY FREQUENCIESd a t a s o u r c e : c h - a v i a t i o n / I n n o v a t a
2009
2014
1 1 S e p t e m b e r , 2 0 1 4 P a g e | 5
Weekly Capacity (ASK):
ASKs per carrier (data source: ch-aviation/Innovata)
Ryanair easyJet Norwegian Vueling Grand Total
2009
1,622,839,459
1,253,728,057
273,542,682
137,241,735
3,287,351,933
2014
2,919,168,012
1,805,838,072
1,083,104,384
746,900,784
6,555,011,252
+ in % 79.9% 44.0% 296.0% 444.2% 99.4%
For all four carriers, the highest growth rates have clearly been achieved in their weekly capacities,
measured in Available Seat Kilometers (ASKs). They have doubled their offering over the past five years.
Norwegian is the only of the four that has invested in Boeing’s “Dreamliner” and has also added long-haul
flights. Looking at the Scandinavian carrier’s growth as a whole, Norwegian’s capacity in ASKs has increased
the most significantly (+296%) compared to its other growth figures.
0
500.000
1.000.000
1.500.000
2.000.000
2.500.000
RYANAIR EASYJET NORWEGIAN VUELING
we
ekly
sea
tsWEEKLY CAPACITY (SEATS)
d a t a s o u r c e : c h - a v i a t i o n / I n n o v a t a
0
500.000.000
1.000.000.000
1.500.000.000
2.000.000.000
2.500.000.000
3.000.000.000
3.500.000.000
RYANAIR EASYJET NORWEGIAN VUEL ING
avai
lab
le s
eat
kilo
met
ers
WEEKLY CAPACITY (ASK)d a t a s o u r c e : c h - a v i a t i o n / I n n o v a t a
1 1 S e p t e m b e r , 2 0 1 4 P a g e | 6
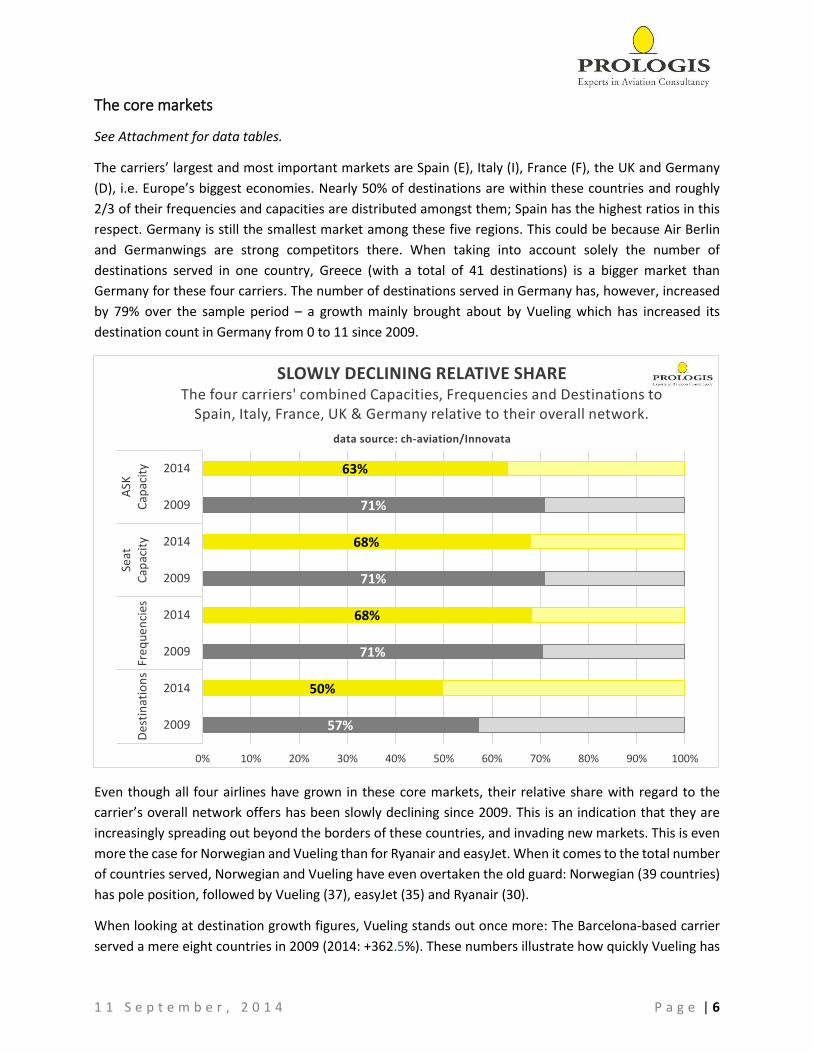
The core markets
See Attachment for data tables.
The carriers’ largest and most important markets are Spain (E), Italy (I), France (F), the UK and Germany
(D), i.e. Europe’s biggest economies. Nearly 50% of destinations are within these countries and roughly
2/3 of their frequencies and capacities are distributed amongst them; Spain has the highest ratios in this
respect. Germany is still the smallest market among these five regions. This could be because Air Berlin
and Germanwings are strong competitors there. When taking into account solely the number of
destinations served in one country, Greece (with a total of 41 destinations) is a bigger market than
Germany for these four carriers. The number of destinations served in Germany has, however, increased
by 79% over the sample period – a growth mainly brought about by Vueling which has increased its
destination count in Germany from 0 to 11 since 2009.
Even though all four airlines have grown in these core markets, their relative share with regard to the
carrier’s overall network offers has been slowly declining since 2009. This is an indication that they are
increasingly spreading out beyond the borders of these countries, and invading new markets. This is even
more the case for Norwegian and Vueling than for Ryanair and easyJet. When it comes to the total number
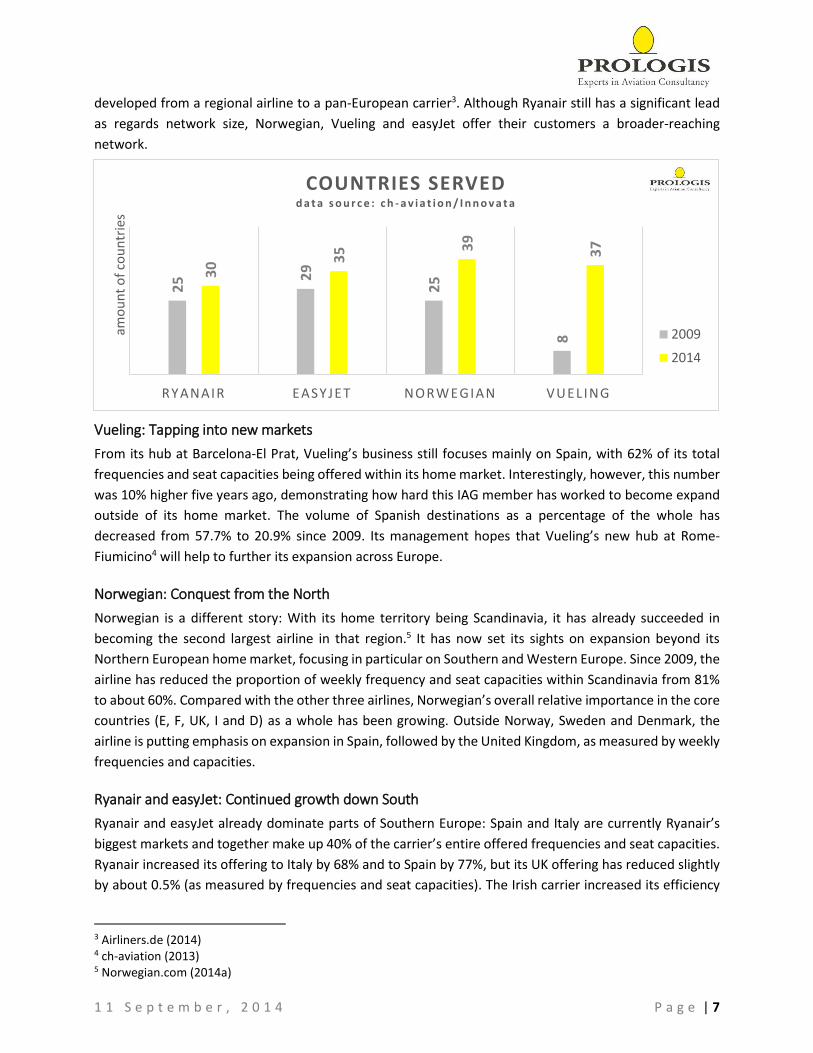
of countries served, Norwegian and Vueling have even overtaken the old guard: Norwegian (39 countries)
has pole position, followed by Vueling (37), easyJet (35) and Ryanair (30).
When looking at destination growth figures, Vueling stands out once more: The Barcelona-based carrier
served a mere eight countries in 2009 (2014: +362.5%). These numbers illustrate how quickly Vueling has
57%
71%
71%
71%
50%
68%
68%
63%
0% 10% 20% 30% 40% 50% 60% 70% 80% 90% 100%
2009
2014
2009
2014
2009
2014
2009
2014
De
stin
atio
ns
Fre
qu
en
cies
Seat
Cap
acit
yA
SKC
apac
ity
SLOWLY DECLINING RELATIVE SHAREThe four carriers' combined Capacities, Frequencies and Destinations to
Spain, Italy, France, UK & Germany relative to their overall network.
data source: ch-aviation/Innovata
1 1 S e p t e m b e r , 2 0 1 4 P a g e | 7
developed from a regional airline to a pan-European carrier3. Although Ryanair still has a significant lead
as regards network size, Norwegian, Vueling and easyJet offer their customers a broader-reaching
network.
Vueling: Tapping into new markets
From its hub at Barcelona-El Prat, Vueling’s business still focuses mainly on Spain, with 62% of its total
frequencies and seat capacities being offered within its home market. Interestingly, however, this number
was 10% higher five years ago, demonstrating how hard this IAG member has worked to become expand
outside of its home market. The volume of Spanish destinations as a percentage of the whole has
decreased from 57.7% to 20.9% since 2009. Its management hopes that Vueling’s new hub at Rome-
Fiumicino4 will help to further its expansion across Europe.
Norwegian: Conquest from the North
Norwegian is a different story: With its home territory being Scandinavia, it has already succeeded in
becoming the second largest airline in that region.5 It has now set its sights on expansion beyond its
Northern European home market, focusing in particular on Southern and Western Europe. Since 2009, the
airline has reduced the proportion of weekly frequency and seat capacities within Scandinavia from 81%
to about 60%. Compared with the other three airlines, Norwegian’s overall relative importance in the core
countries (E, F, UK, I and D) as a whole has been growing. Outside Norway, Sweden and Denmark, the
airline is putting emphasis on expansion in Spain, followed by the United Kingdom, as measured by weekly
frequencies and capacities.
Ryanair and easyJet: Continued growth down South
Ryanair and easyJet already dominate parts of Southern Europe: Spain and Italy are currently Ryanair’s
biggest markets and together make up 40% of the carrier’s entire offered frequencies and seat capacities.
Ryanair increased its offering to Italy by 68% and to Spain by 77%, but its UK offering has reduced slightly
by about 0.5% (as measured by frequencies and seat capacities). The Irish carrier increased its efficiency
3 Airliners.de (2014) 4 ch-aviation (2013) 5 Norwegian.com (2014a)
25 2
9
25
8
30 3
5 39
37
RYANAIR EASYJET NORWEGIAN VUEL ING
amo
un
t o
f co
un
trie
s
COUNTRIES SERVEDd a t a s o u r c e : c h - a v i a t i o n / I n n o v a t a
2009
2014
1 1 S e p t e m b e r , 2 0 1 4 P a g e | 8
in the UK market with an ASK capacity growth of 38% since 2009. Nevertheless, Ryanair’s focus on the UK
market has clearly declined since 2009, when the UK was its core market. This is partly as a reaction to the
UK’s raising of Air Passenger Duty. The same phenomenon, with an even stronger effect, can be seen with
regard to Ryanair’s interest in the German market. The German government has been asking passengers
departing from Germany for Air Passenger Duty since 2011. This has led to a decrease in Ryanair’s offered
frequencies and seat capacities to Germany since 2009 of 25%. easyJet’s largest market, however, is still
the UK. The airline has added two more destinations within its home market since 2009, and has managed
to increase offered UK frequencies by 18.6%, seat capacities by 22.9% and even ASK capacities by 27.3%.
In addition, the carrier – like its competitor, Ryanair – has continued to grow in Southern Europe. While
streamlining the total amount of Italian destinations served, easyJet has managed to focus more strongly
on its existing destinations by increasing frequencies and seat capacities to Italy by roughly 50%, and ASK
capacities by 70%. easyJet is also strongly positioned in France, where it has added another four
destinations since 2009, enhanced seat capacities and frequencies by about 50%, and ASK capacities by
about 60%.
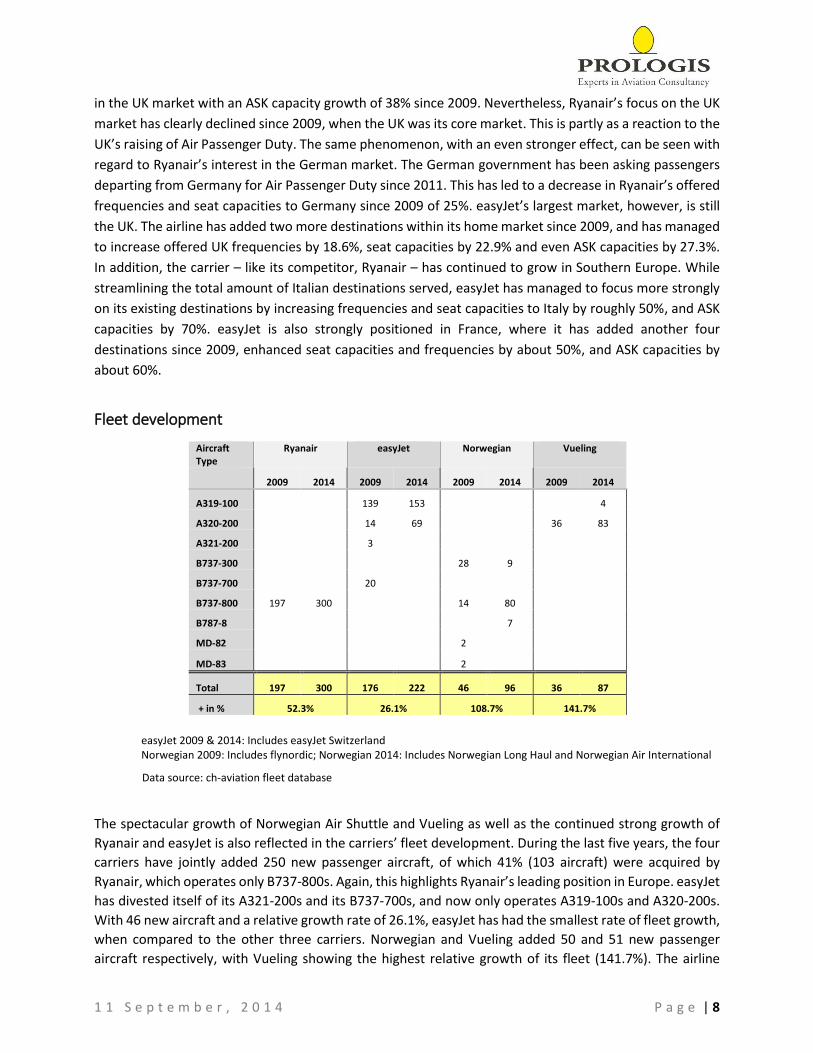
Fleet development
Aircraft Type
Ryanair easyJet Norwegian Vueling
2009 2014 2009 2014 2009 2014 2009 2014
A319-100 139 153 4
A320-200 14 69 36 83
A321-200 3
B737-300 28 9
B737-700 20
B737-800 197 300 14 80
B787-8 7
MD-82 2
MD-83 2
Total 197 300 176 222 46 96 36 87
+ in % 52.3% 26.1% 108.7% 141.7%
easyJet 2009 & 2014: Includes easyJet Switzerland Norwegian 2009: Includes flynordic; Norwegian 2014: Includes Norwegian Long Haul and Norwegian Air International
Data source: ch-aviation fleet database
The spectacular growth of Norwegian Air Shuttle and Vueling as well as the continued strong growth of
Ryanair and easyJet is also reflected in the carriers’ fleet development. During the last five years, the four
carriers have jointly added 250 new passenger aircraft, of which 41% (103 aircraft) were acquired by
Ryanair, which operates only B737-800s. Again, this highlights Ryanair’s leading position in Europe. easyJet
has divested itself of its A321-200s and its B737-700s, and now only operates A319-100s and A320-200s.
With 46 new aircraft and a relative growth rate of 26.1%, easyJet has had the smallest rate of fleet growth,
when compared to the other three carriers. Norwegian and Vueling added 50 and 51 new passenger
aircraft respectively, with Vueling showing the highest relative growth of its fleet (141.7%). The airline
1 1 S e p t e m b e r , 2 0 1 4 P a g e | 9
currently operates a fleet of 83 A320-200s and has also added four A319-100s. At Norwegian, there is a
noticeable trend towards larger aircraft. The airline has sold its Mc Donnell Douglas’ and has reduced its
fleet of B737-300s to 9 aircraft, whilst adding 66 new B737-800s and seven new B787-8 “Dreamliners”.
However, this rapid growth comes at a price: While Norwegian managed to increase total revenues by
20.8% in 2013, profit declined by 30%. One of the reasons that Norwegian’s management gave were
“Teething problems with the Dreamliner […]”6. Hence, despite the strong growth figures outlined in this
study, the rapid short- and medium-hall network growth is affecting the carrier’s profitability and it
remains to be seen how Norwegian will deal with this paradox in the coming months.
Conclusion
Despite of the ongoing Eurozone crisis, all four carriers looked at in this survey were able to widen their
networks and significantly increase their frequencies, capacities and fleet sizes since 2009. Europe’s two
largest LCCs, Ryanair and easyJet, are strongly positioned in Spain and Italy. And, despite their current hold
as well as the negative economic growth of -6.6% in Spain and -1.9% in Italy (GDP growth between 2009
and 2013)7, they are still expanding. With these economic figures in mind, it is even more impressive that
Spanish carrier Vueling has managed such a growth spurt over the last five years. This young and successful
airline is showing itself more and more to be IAG’s rising star and perhaps a driver of growth in the future.
Although Ryanair and easyJet clearly continue to be Europe’s largest airlines, our analysis shows that
Norwegian and Vueling are well on their way to approach the top leaders. Ryanair and easyJet seem set
to consolidate their strong market share in Spain and Italy and, as is the case with easyJet, also in France.
Norwegian and Vueling are, however, about to increasingly spread their wings beyond their home
markets. The two fledgling carriers’ rapid market growth will intensify competition in Southern Europe.
The market view is that there is considerable potential for growth in these leisure markets and these
carriers will strive to take a big piece of the action. This is most likely to result in a positive outcome for
passengers. The idea of adding free or low-cost enhancements to increase the product value is being
implemented more frequently and effectively. This is also true for Ryanair. The hybrid carrier model looks
increasingly strong. Legacy carriers, however, are feeling the pain of this; quality and service is their
mantra. Yet, in short- and medium-haul markets, hybrid carriers are increasingly entering the market for
business travelers at a reasonable minimum service, while at the same time profiting from a simplified and
more efficient business model. It is irrelevant if the carriers call themselves hybrid or low cost, the
combination of low prices and simple processes along with “an elevated quality of service, for which they
are renowned”8 currently seems to be the “holy grail” for carriers throughout Europe.
6 Norwegian.com (2014b) 7 The World Bank (2014) 8 Harrington et al. (2005), p. 453
1 1 S e p t e m b e r , 2 0 1 4 P a g e | 10
Attachment:
The tables below show the relative shares in the five core markets (Spain, Italy, France, UK, Germany) in
relation to the carriers’ total network.
Destinations:
Core Markets 2009: Destinations (data source: ch-aviation/Innovata)
Destinations
2009 2009 Total
Core Markets Ryanair easyJet Norwegian Vueling
Total network 143 100.0% 106 100.0% 65 100.0% 26 100.0%
Spain 18 12.6% 16 15.1% 6 9.2% 15 57.7% 55
Italy 23 16.1% 14 13.2% 2 3.1% 4 15.4% 43
France 23 16.1% 13 12.3% 3 4.6% 2 7.7% 41
GB 20 14.0% 13 12.3% 3 4.6% 36
Germany 10 7.0% 5 4.7% 4 6.2% 19
Grand Total 94 65.7% 61 57.5% 18 27.7% 21 80.8% 194
Core Markets 2014: Destinations (data source: ch-aviation/Innovata)
Destinations
2014 2014 Total
Core Markets Ryanair easyJet Norwegian Vueling
Total network 179 100.0% 130 100.0% 121 100.0% 129 100.0%
Spain 23 12.8% 18 13.8% 13 10.7% 27 20.9% 81
Italy 23 12.8% 16 12.3% 7 5.8% 16 12.4% 62
France 30 16.8% 17 13.1% 6 5.0% 12 9.3% 65
GB 14 7.8% 15 11.5% 3 2.5% 4 3.1% 36
Germany 12 6.7% 7 5.4% 4 3.3% 11 8.5% 34
Grand Total 102 57.0% 73 56.2% 33 27.3% 70 54.3% 278
Frequencies:
Core Markets 2009: Frequencies (data source: ch-aviation/Innovata)
Frequencies
2009 2009 Total
Core Markets Ryanair easyJet Norwegian Vueling
Total network 8,400 100.0%
7,098 100.0%
1,951 100.0%
821 100.0%
Spain 1,389 16.5%
948 13.4%
58 3.0%
591 72.0%
2,986
Italy 1,433 17.1%
882 12.4%
18 0.9%
91 11.1%
2,424
France 463 5.5%
836 11.8%
39 2.0%
67 8.2%
1,405
GB 2,181 26.0%
2,733 38.5%
59 3.0%
4,973
Germany 749 8.9%
312 4.4%
32 1.6%
1,093
Grand Total 6,215 74.0%
5,711 80.5%
206 10.6%
749 91.2%
12,881
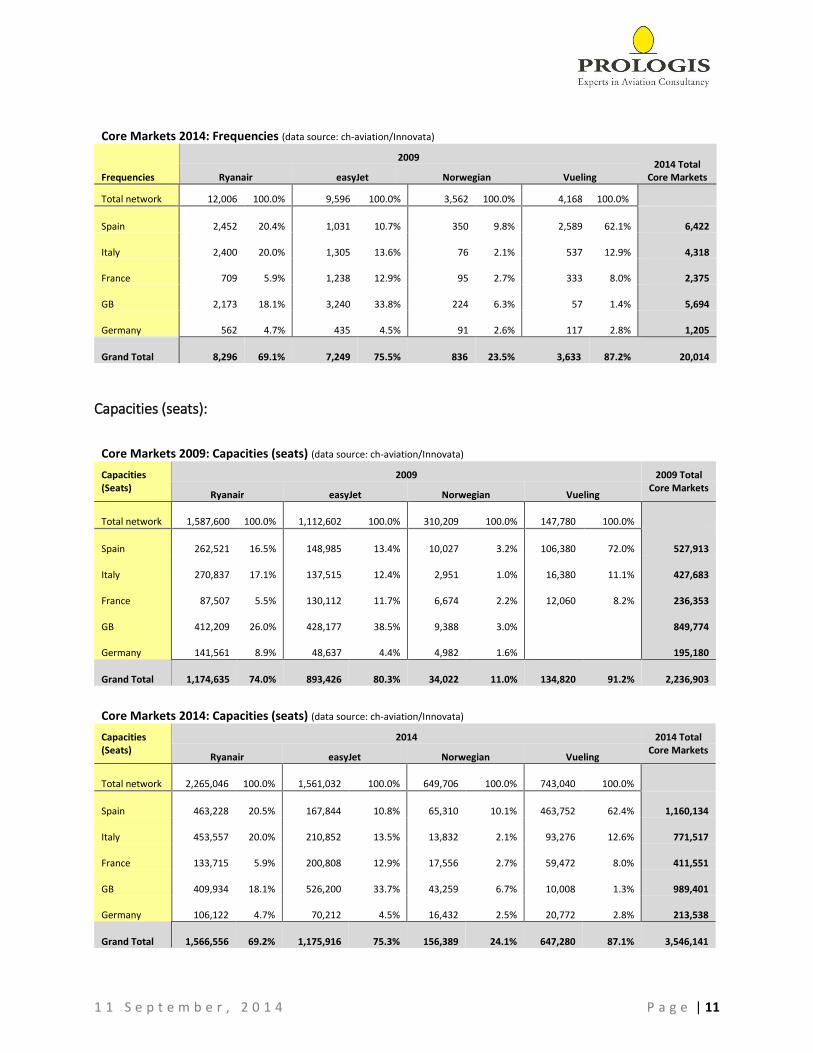
1 1 S e p t e m b e r , 2 0 1 4 P a g e | 11
Core Markets 2014: Frequencies (data source: ch-aviation/Innovata)
Frequencies
2009 2014 Total
Core Markets Ryanair easyJet Norwegian Vueling
Total network 12,006 100.0% 9,596 100.0% 3,562 100.0% 4,168 100.0%
Spain 2,452 20.4% 1,031 10.7% 350 9.8% 2,589 62.1%
6,422
Italy 2,400 20.0% 1,305 13.6%
76 2.1% 537 12.9%
4,318
France
709 5.9% 1,238 12.9%
95 2.7% 333 8.0%
2,375
GB 2,173 18.1% 3,240 33.8% 224 6.3%
57 1.4%
5,694
Germany
562 4.7%
435 4.5%
91 2.6% 117 2.8%
1,205
Grand Total 8,296 69.1% 7,249 75.5% 836 23.5% 3,633 87.2%
20,014
Capacities (seats):
Core Markets 2009: Capacities (seats) (data source: ch-aviation/Innovata)
Capacities (Seats)
2009 2009 Total
Ryanair easyJet Norwegian Vueling Core Markets
Total network 1,587,600 100.0% 1,112,602 100.0%
310,209 100.0%
147,780 100.0%
Spain 262,521 16.5% 148,985 13.4%
10,027 3.2%
106,380 72.0%
527,913
Italy 270,837 17.1% 137,515 12.4%
2,951 1.0%
16,380 11.1%
427,683
France 87,507 5.5% 130,112 11.7%
6,674 2.2%
12,060 8.2%
236,353
GB 412,209 26.0% 428,177 38.5%
9,388 3.0%
849,774
Germany 141,561 8.9% 48,637 4.4%
4,982 1.6%
195,180
Grand Total 1,174,635 74.0% 893,426 80.3%
34,022 11.0%
134,820 91.2%
2,236,903
Core Markets 2014: Capacities (seats) (data source: ch-aviation/Innovata)
Capacities (Seats)
2014 2014 Total
Ryanair easyJet Norwegian Vueling Core Markets
Total network 2,265,046 100.0% 1,561,032 100.0%
649,706 100.0%
743,040 100.0%
Spain 463,228 20.5% 167,844 10.8%
65,310 10.1%
463,752 62.4% 1,160,134
Italy 453,557 20.0% 210,852 13.5%
13,832 2.1%
93,276 12.6% 771,517
France 133,715 5.9% 200,808 12.9%
17,556 2.7%
59,472 8.0% 411,551
GB 409,934 18.1% 526,200 33.7%
43,259 6.7%
10,008 1.3% 989,401
Germany 106,122 4.7% 70,212 4.5%
16,432 2.5%
20,772 2.8% 213,538
Grand Total 1,566,556 69.2% 1,175,916 75.3%
156,389 24.1%
647,280 87.1%
3,546,141
1 1 S e p t e m b e r , 2 0 1 4 P a g e | 12
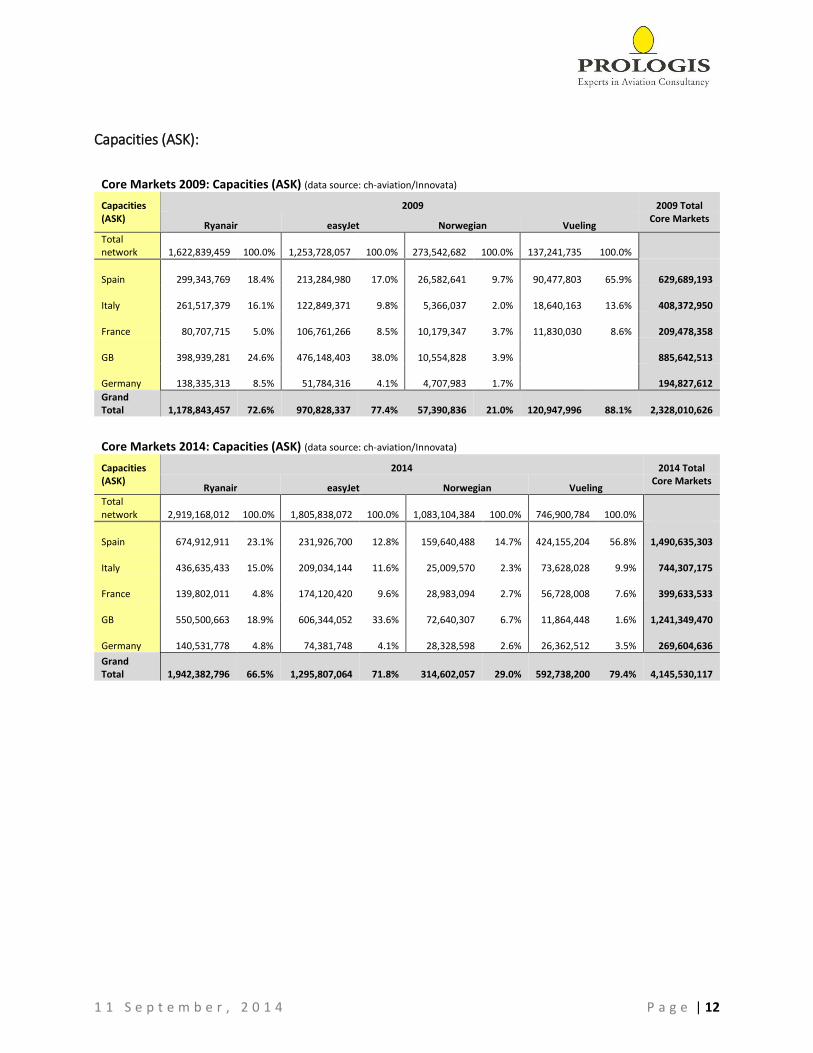
Capacities (ASK):
Core Markets 2009: Capacities (ASK) (data source: ch-aviation/Innovata)
Capacities (ASK)
2009 2009 Total
Ryanair easyJet Norwegian Vueling Core Markets
Total network
1,622,839,459 100.0%
1,253,728,057 100.0%
273,542,682 100.0%
137,241,735 100.0%
Spain
299,343,769 18.4%
213,284,980 17.0%
26,582,641 9.7%
90,477,803 65.9%
629,689,193
Italy
261,517,379 16.1%
122,849,371 9.8%
5,366,037 2.0%
18,640,163 13.6%
408,372,950
France
80,707,715 5.0%
106,761,266 8.5%
10,179,347 3.7%
11,830,030 8.6%
209,478,358
GB
398,939,281 24.6%
476,148,403 38.0%
10,554,828 3.9%
885,642,513
Germany
138,335,313 8.5%
51,784,316 4.1%
4,707,983 1.7%
194,827,612
Grand Total
1,178,843,457 72.6%
970,828,337 77.4%
57,390,836 21.0%
120,947,996 88.1% 2,328,010,626
Core Markets 2014: Capacities (ASK) (data source: ch-aviation/Innovata)
Capacities (ASK)
2014 2014 Total
Ryanair easyJet Norwegian Vueling Core Markets
Total network
2,919,168,012 100.0%
1,805,838,072 100.0%
1,083,104,384 100.0%
746,900,784 100.0%
Spain
674,912,911 23.1%
231,926,700 12.8%
159,640,488 14.7%
424,155,204 56.8%
1,490,635,303
Italy
436,635,433 15.0%
209,034,144 11.6%
25,009,570 2.3%
73,628,028 9.9%
744,307,175
France
139,802,011 4.8%
174,120,420 9.6%
28,983,094 2.7%
56,728,008 7.6%
399,633,533
GB
550,500,663 18.9%
606,344,052 33.6%
72,640,307 6.7%
11,864,448 1.6%
1,241,349,470
Germany
140,531,778 4.8%
74,381,748 4.1%
28,328,598 2.6%
26,362,512 3.5%
269,604,636
Grand Total
1,942,382,796 66.5%
1,295,807,064 71.8%
314,602,057 29.0%
592,738,200 79.4%
4,145,530,117
1 1 S e p t e m b e r , 2 0 1 4 P a g e | 13
References:
Airliners.de. (2014). http://www.airliners.de. http://www.airliners.de/vueling-sieht-sich-auf-dem-weg-
zu-einer-paneuropaeischen-airline/31758 (Retrieved: August 5, 2014)
Bloomberg Businessweek. (2014). Businessweek.com.
http://investing.businessweek.com/research/stocks/financials/financials.asp?ticker=NAS:NO
(Retrieved: August 29, 2014)
ch-aviation. (2013). http://www.ch-aviation.ch. http://www.ch-aviation.com/portal/news/23625-
vueling-to-develop-rome-fiumicino-into-a-major-hub-from-summer-2014 (Retrieved: August 05,
2014)
Harrington, D. G., Lawton, T. C., & Rajwani, T. (2005). Embracing and Exploiting Industry Turbulences:
The Strategic Transformation of Aer Lingus. European Management Journal, 23 (4), pp. 450-457.
Norwegian.com. (2014a). http://www.norwegian.com. http://www.norwegian.com/en/about-
norwegian/our-company/ (Retrieved August 6, 2014)
Norwegian.com. (2014b). Norwegian.com. http://annualreport.norwegian.com/2013/ceo-remarks
(Retrieved: August 29, 2014)
Norwegian.com. (2014c). Norwegian.com. http://annualreport.norwegian.com/2013/ (Retrieved: August
29, 2014)
The World Bank. (2009, 2013). World DataBank (2009 vs. 2013): http://databank.worldbank.org.
(Retrieved: August 7, 2014)
Vuelingnews.com. (2014). http://vuelingnews.com. http://vuelingnews.com/2014/05/16/vueling-10-
years-of-growth/?lang=en (Retrieved: August 12, 2014)