Embed Size (px)
Citation preview
www.elsevier.com/locate/trd
Transportation Research Part D 9 (2004) 373–385
The marginal values of noise disturbance from air traffic:does the time of the day matter?
Fredrik Carlsson a, Elina Lampi b,*, Peter Martinsson c
a Department of Economics, Goteborg University, SE-405 30 Goteborg, Swedenb Department of Economics, Umea University, SE-901 87 Umea, Sweden
c Department of Economics, Goteborg University, SE-405 30 Goteborg, Sweden
Abstract
This paper analyzes the marginal willingness to pay for changes in noise levels related to changes in the
volume of flight movements at a city airport in Stockholm, Sweden, by using a choice experiment. When
estimating marginal willingness to pay for different times of the day and days of the week, we find that thesevary with the temporal dimensions: mornings and evenings have higher marginal values. Interestingly, a
substantial proportion of the respondents prefer no changes in the current noise level. The paper concludes
with a policy discussion related to incentive-based pricing.
� 2004 Elsevier Ltd. All rights reserved.
Keywords: Choice experiment; Discrete choice; Aircraft; Noise; Airports
1. Introduction
Air traffic is now starting to pick up after September 11, and is expected to grow in the nearfuture. One important issue linked to growth is the location and the size of airports. Whereveran airport is located, residents nearby will be disturbed, and whenever an airport expands, the dis-turbance and the number of people disturbed will increase. How residents perceive disturbance
1361-9209/$ - see front matter � 2004 Elsevier Ltd. All rights reserved.
doi:10.1016/j.trd.2004.07.002
* Corresponding author.
E-mail address: [email protected] (E. Lampi).
374 F. Carlsson et al. / Transportation Research Part D 9 (2004) 373–385
from air traffic, and the welfare losses linked to this, is therefore an important issue for decisionsregarding both the location and the size of airports. Furthermore, the aviation sector is currentlymoving away from a command-and-control type of environmental regulation with engine stand-ards and a phasing out of engine types towards implementation of incentive-based pricing systems(Carlsson, 2003; Morrell and Lu, 2001). This is in line with the European Union (2001) recom-mendation of increased use of incentive-based pricing in the transport sector.A successful environmental regulation of externalities requires information about the marginal
damage. In this paper we focus on noise damages from air traffic. Noise externalities are ratherdifferent from other types of externalities caused by air traffic because the marginal damagecan vary with the time of the day and the day of the week, which is, for example, different fromexternalities caused by air pollution. For example, the external damage of one night-flight is pre-sumably more damaging than the same flight made during the day. There are also findings sug-gesting that noise from air traffic is considered more disturbing than the equivalent noisedisturbance from road traffic (Naturvardsverket, 2001).There are few studies on the aggregated marginal damage from air traffic noise. The majority of
work has applied a hedonic pricing approach (Levesque, 1994; Uyeno et al., 1993; Penningtonet al., 1990), but there are also studies using stated preference methods (Feitelson et al.,1996) 1. There are two main problems with hedonic pricing studies: it is difficult to estimate wel-fare measures from them, at least if one wants to obtain generic values of attributes (Haab andMcConnell, 2002), and it is almost impossible to estimate welfare measures for changes in noisefrom air traffic at different days of the week, as well as at different times of the day.Here a choice experiment is used to estimate the welfare effects via changes in the number of
take-offs and landings at a city-center airport in Stockholm, Sweden. 2 In a choice experiment,respondents are presented with a hypothetical situation, in our case that the number of landingsand take-offs at Bromma Airport will either increase or decrease depending on the survey versionassigned to them. The respondents are then asked to choose the preferred alternative among sev-eral alternatives in each choice set presented, and normally they are asked to perform a sequenceof choices containing 5–15 choice sets. In the case of an increase they would be compensated,while for a decrease there would be an extra payment. In our experiment the attributes relateto the number of take-offs and landings in one hour at different times of the day. Moreover, halfof the choice sets concern the stated situation during working days and half during weekends. Thestrength of a stated preference method is that we can estimate the welfare changes for changes inthe number of take-offs and landings at levels which do not exist today. It also provides us witheasily interpretable results.
2. Description of Bromma Airport
The study analyzes the aircraft noise from Bromma Airport. The airport is located in Stock-holm and is Sweden�s third largest in terms of the number of flight movements and the second
1 Nelson (2004) offers a recent overview and meta-analysis of the relationship between airport noise and hedonic
property values.2 See for example Alpizar et al. (2003) and Louviere et al. (2000) for overviews of choice experiments.
F. Carlsson et al. / Transportation Research Part D 9 (2004) 373–385 375
largest for domestic flights. It is located near highly population areas being only 8 km from Stock-holm city center. The environmental regulations for Bromma Airport are stricter than for airportslocated further away from the city centers (Luftfartsverket, 2002). Aircraft operations are com-pletely banned during the night; operations being allowed only 7 am–10 pm on weekdays,9 am–5 pm on Saturdays and 10 am–8 pm on Sundays. There is a limit on aircraft noise of89 EPN decibels. 3 There is also a maximal weight limit for aircraft of 50,000 kg, and take-offsand landings per year are restricted to 65,000.The existence and the size of Bromma Airport have been frequently debated. The current reg-
ulations and volume of air traffic at Bromma Airport are an outcome of a political process, whichhas evolved over many years. The latest agreement between the City Council, which is the su-preme decision making body of the City of Stockholm, and the Swedish Civil Aviation Adminis-tration states that Bromma Airport will be shut down by the end of 2011 (Luftfartsverket, 2003).The majority of the City Council wants to use the area to build a new residential area after theairport has been shut down. Building a new residential area will, however, result in other effectson the current residents such as increased road traffic and possibly changes in housing prices. Onthe other hand, some of those in opposition do not want the airport closed. The future of the air-port is a widely debated topic and people living close to the airport often have, for natural rea-sons, strong opinions about the existence of the airport (Blomqvist et al., 2000).Kristrom (1997) reports the results from a contingent valuation study on the size of Bromma
Airport in 1993. This has a bearing on methodological development since the spike models areintroduced. This type of model allows a proportion of the respondents to have a zero willing-ness-to-pay in a closed-ended contingent valuation survey, which is not the case when using ordi-nary parametric models such as a probit model. An expansion in the size of the airport wasdescribed as beneficial to local business and a decrease as yielding environmental benefits. Theconstruction of the survey allowed Kristrom to discover that slightly more than 70% are indiffer-ent between an increase and a decrease in the size of the airport. Kristrom reports these individ-uals as having a no willingness to pay for a change and thus these respondents do not see theairport as a major environmental problem.
3. Design of the choice experiment
There are small differences in noise levels among the types of aircrafts using Bromma Airport(Luftfartsverket, 2002). 4 It is likely, however, that the marginal damage caused by take-offs andlandings varies with time of the day and with the day of the week. Therefore we specify the flightmovements in the choice experiment to be the number of take-offs and landings by time of day(early mornings, mornings, afternoons and evenings) and by day of the week (weekdays andweekends). Furthermore, since there has been a discussion on both an increase and a decrease
3 EPNL, Effective Perceived Noise Level, is a value of certification for every type of aircraft when they take off or
land.4 The different types of aircrafts operating at Bromma Airport have a maximum noise level between 78 and 83 dB (A)
when landing. The maximum noise level is between 75 and 83 dB (A) when taking off.
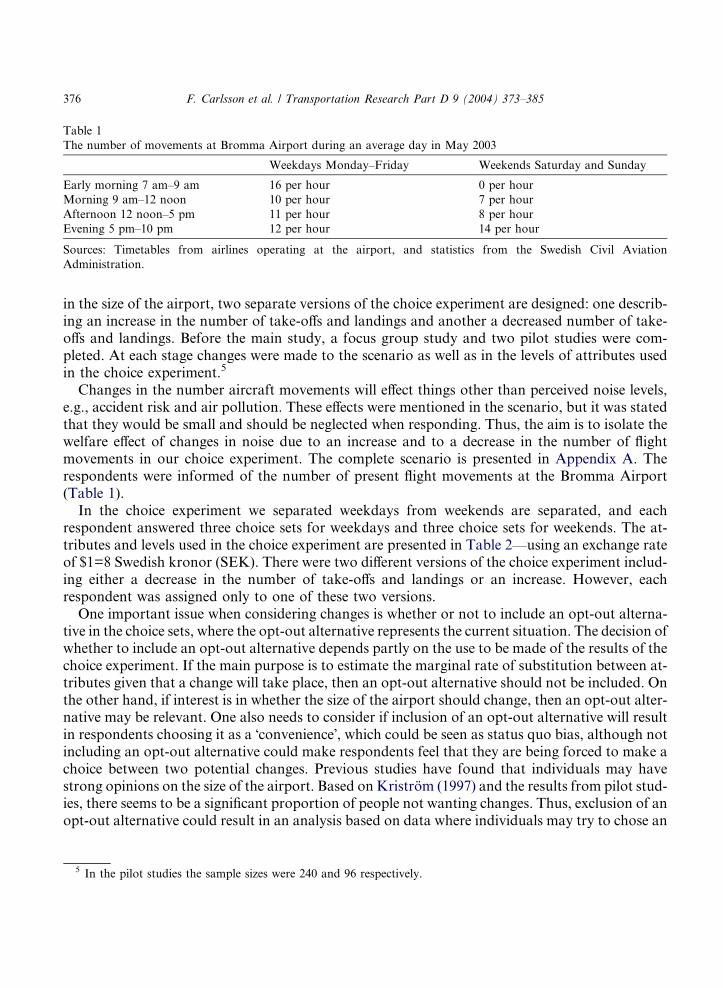
Table 1
The number of movements at Bromma Airport during an average day in May 2003
Weekdays Monday–Friday Weekends Saturday and Sunday
Early morning 7 am–9 am 16 per hour 0 per hour
Morning 9 am–12 noon 10 per hour 7 per hour
Afternoon 12 noon–5 pm 11 per hour 8 per hour
Evening 5 pm–10 pm 12 per hour 14 per hour
Sources: Timetables from airlines operating at the airport, and statistics from the Swedish Civil Aviation
Administration.
376 F. Carlsson et al. / Transportation Research Part D 9 (2004) 373–385
in the size of the airport, two separate versions of the choice experiment are designed: one describ-ing an increase in the number of take-offs and landings and another a decreased number of take-offs and landings. Before the main study, a focus group study and two pilot studies were com-pleted. At each stage changes were made to the scenario as well as in the levels of attributes usedin the choice experiment.5
Changes in the number aircraft movements will effect things other than perceived noise levels,e.g., accident risk and air pollution. These effects were mentioned in the scenario, but it was statedthat they would be small and should be neglected when responding. Thus, the aim is to isolate thewelfare effect of changes in noise due to an increase and to a decrease in the number of flightmovements in our choice experiment. The complete scenario is presented in Appendix A. Therespondents were informed of the number of present flight movements at the Bromma Airport(Table 1).In the choice experiment we separated weekdays from weekends are separated, and each
respondent answered three choice sets for weekdays and three choice sets for weekends. The at-tributes and levels used in the choice experiment are presented in Table 2––using an exchange rateof $1=8 Swedish kronor (SEK). There were two different versions of the choice experiment includ-ing either a decrease in the number of take-offs and landings or an increase. However, eachrespondent was assigned only to one of these two versions.One important issue when considering changes is whether or not to include an opt-out alterna-
tive in the choice sets, where the opt-out alternative represents the current situation. The decision ofwhether to include an opt-out alternative depends partly on the use to be made of the results of thechoice experiment. If the main purpose is to estimate the marginal rate of substitution between at-tributes given that a change will take place, then an opt-out alternative should not be included. Onthe other hand, if interest is in whether the size of the airport should change, then an opt-out alter-native may be relevant. One also needs to consider if inclusion of an opt-out alternative will resultin respondents choosing it as a �convenience�, which could be seen as status quo bias, although notincluding an opt-out alternative could make respondents feel that they are being forced to make achoice between two potential changes. Previous studies have found that individuals may havestrong opinions on the size of the airport. Based on Kristrom (1997) and the results from pilot stud-ies, there seems to be a significant proportion of people not wanting changes. Thus, exclusion of anopt-out alternative could result in an analysis based on data where individuals may try to chose an
5 In the pilot studies the sample sizes were 240 and 96 respectively.
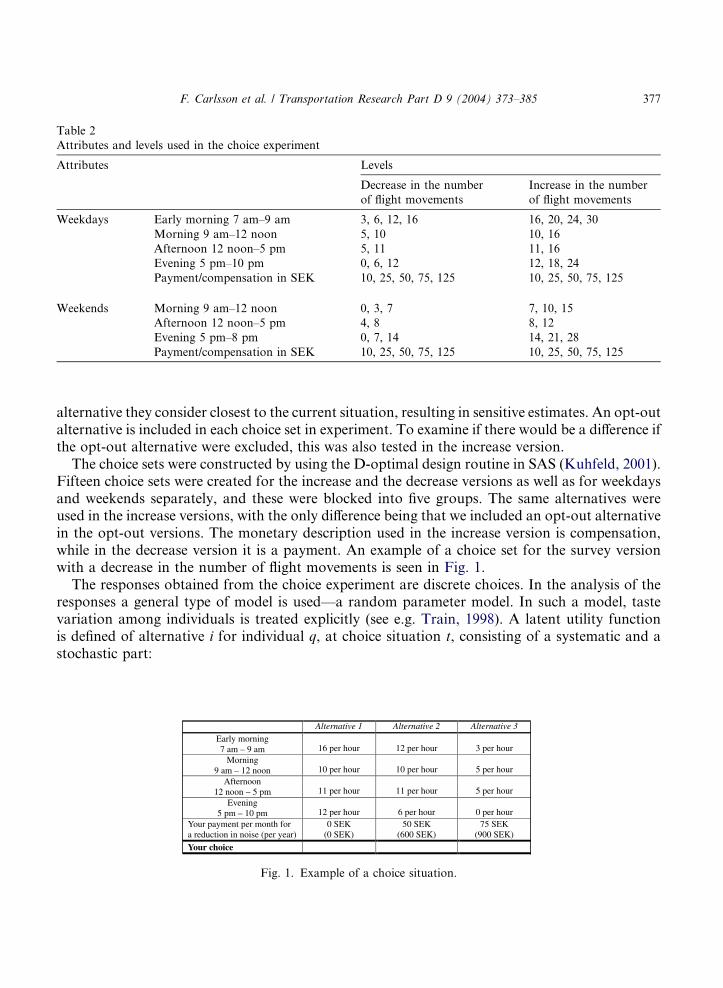
Table 2
Attributes and levels used in the choice experiment
Attributes Levels
Decrease in the number
of flight movements
Increase in the number
of flight movements
Weekdays Early morning 7 am–9 am 3, 6, 12, 16 16, 20, 24, 30
Morning 9 am–12 noon 5, 10 10, 16
Afternoon 12 noon–5 pm 5, 11 11, 16
Evening 5 pm–10 pm 0, 6, 12 12, 18, 24
Payment/compensation in SEK 10, 25, 50, 75, 125 10, 25, 50, 75, 125
Weekends Morning 9 am–12 noon 0, 3, 7 7, 10, 15
Afternoon 12 noon–5 pm 4, 8 8, 12
Evening 5 pm–8 pm 0, 7, 14 14, 21, 28
Payment/compensation in SEK 10, 25, 50, 75, 125 10, 25, 50, 75, 125
F. Carlsson et al. / Transportation Research Part D 9 (2004) 373–385 377
alternative they consider closest to the current situation, resulting in sensitive estimates. An opt-outalternative is included in each choice set in experiment. To examine if there would be a difference ifthe opt-out alternative were excluded, this was also tested in the increase version.The choice sets were constructed by using the D-optimal design routine in SAS (Kuhfeld, 2001).
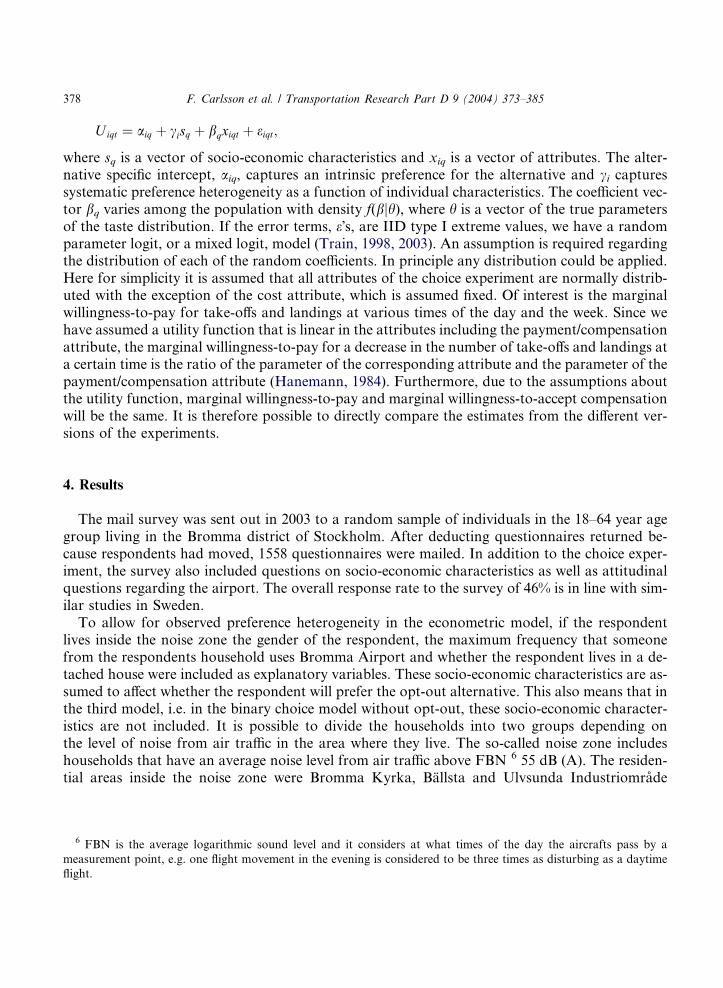
Fifteen choice sets were created for the increase and the decrease versions as well as for weekdaysand weekends separately, and these were blocked into five groups. The same alternatives wereused in the increase versions, with the only difference being that we included an opt-out alternativein the opt-out versions. The monetary description used in the increase version is compensation,while in the decrease version it is a payment. An example of a choice set for the survey versionwith a decrease in the number of flight movements is seen in Fig. 1.The responses obtained from the choice experiment are discrete choices. In the analysis of the
responses a general type of model is used––a random parameter model. In such a model, tastevariation among individuals is treated explicitly (see e.g. Train, 1998). A latent utility functionis defined of alternative i for individual q, at choice situation t, consisting of a systematic and astochastic part:
Alternative 1 Alternative 2 Alternative 3
Early morning7 am – 9 am 16 per hour 12 per hour 3 per hour
Morning9 am – 12 noon 10 per hour 10 per hour 5 per hour
Afternoon12 noon – 5 pm 11 per hour 11 per hour 5 per hour
Evening5 pm – 10 pm 12 per hour 6 per hour 0 per hour
Your payment per month for a reduction in noise (per year)
0 SEK(0 SEK)
50 SEK(600 SEK)
75 SEK(900 SEK)
Your choice
Fig. 1. Example of a choice situation.
6 F
measu
flight.
378 F. Carlsson et al. / Transportation Research Part D 9 (2004) 373–385
Uiqt ¼ aiq þ cisq þ bqxiqt þ eiqt;
where sq is a vector of socio-economic characteristics and xiq is a vector of attributes. The alter-native specific intercept, aiq, captures an intrinsic preference for the alternative and ci capturessystematic preference heterogeneity as a function of individual characteristics. The coefficient vec-tor bq varies among the population with density f(bjh), where h is a vector of the true parametersof the taste distribution. If the error terms, e�s, are IID type I extreme values, we have a randomparameter logit, or a mixed logit, model (Train, 1998, 2003). An assumption is required regardingthe distribution of each of the random coefficients. In principle any distribution could be applied.Here for simplicity it is assumed that all attributes of the choice experiment are normally distrib-uted with the exception of the cost attribute, which is assumed fixed. Of interest is the marginalwillingness-to-pay for take-offs and landings at various times of the day and the week. Since wehave assumed a utility function that is linear in the attributes including the payment/compensationattribute, the marginal willingness-to-pay for a decrease in the number of take-offs and landings ata certain time is the ratio of the parameter of the corresponding attribute and the parameter of thepayment/compensation attribute (Hanemann, 1984). Furthermore, due to the assumptions aboutthe utility function, marginal willingness-to-pay and marginal willingness-to-accept compensationwill be the same. It is therefore possible to directly compare the estimates from the different ver-sions of the experiments.
4. Results
The mail survey was sent out in 2003 to a random sample of individuals in the 18–64 year agegroup living in the Bromma district of Stockholm. After deducting questionnaires returned be-cause respondents had moved, 1558 questionnaires were mailed. In addition to the choice exper-iment, the survey also included questions on socio-economic characteristics as well as attitudinalquestions regarding the airport. The overall response rate to the survey of 46% is in line with sim-ilar studies in Sweden.To allow for observed preference heterogeneity in the econometric model, if the respondent
lives inside the noise zone the gender of the respondent, the maximum frequency that someonefrom the respondents household uses Bromma Airport and whether the respondent lives in a de-tached house were included as explanatory variables. These socio-economic characteristics are as-sumed to affect whether the respondent will prefer the opt-out alternative. This also means that inthe third model, i.e. in the binary choice model without opt-out, these socio-economic character-istics are not included. It is possible to divide the households into two groups depending onthe level of noise from air traffic in the area where they live. The so-called noise zone includeshouseholds that have an average noise level from air traffic above FBN 6 55 dB (A). The residen-tial areas inside the noise zone were Bromma Kyrka, Ballsta and Ulvsunda Industriomrade
BN is the average logarithmic sound level and it considers at what times of the day the aircrafts pass by a
rement point, e.g. one flight movement in the evening is considered to be three times as disturbing as a daytime
Table 3
Descriptive statistics
Variable Description Mean SD
Do not use Bromma =1 if no household member flies from Bromma 0.471 0.499
Fly often from Bromma =1 if at least one household member often flies from Bromma 0.053 0.224
Female =1 if respondent is a female 0.544 0.499
Detached house =1 if respondent lives in a detached house 0.453 0.498
Zone =1 if respondent lives inside the noise zone 0.122 0.327
F. Carlsson et al. / Transportation Research Part D 9 (2004) 373–385 379
(Luftfartsverket, 2002). Table 3 provides descriptive statistics for these socio-economic variablesbased on the surveys.Another issue is whether any household member is at home at the different times of the day spec-
ified in the choice set. Since there are reasons to believe that respondents do not care about thenumber of take-offs and landings at times when nobody is at home, they will not consider thoseattributes when answering the questions in the choice experiment. Therefore we set the numberof movements to zero for those attributes, i.e. time of day when no one in the household is at home.Table 4 presents the results from the estimations. There is no significant differences in willing-
ness to pay between respondents living inside the noise zone and outside this zone. Therefore weonly report the estimates without the noise zones. In columns three and four, the results of thechoice experiments without an opt-out alternative are presented, while we in columns five to eightpresent the results of the mixed logit model for decreases and increases in the number of take-offsand landings with an opt-out alternative. Finally, in columns nine to twelve, the results from theestimations without the respondents who always chose the opt-out alternative are presented. In allmodels we assume that the utility function is linear in the attributes, that also includes the pay-ment/compensation attribute.Most standard deviations of the random parameters are significant and the mixed logit models
have a substantially higher pseudo-R2 compared with the corresponding nested logit model (notreported here). Among the socio-economic characteristics, we find that if no one from a house-hold flies from the Bromma airport then the respondent is more likely to choose the opt-out alter-native in the version with increased numbers of take-offs and landings, and significantly less likelyto choose opt-out in the decrease version. The same effect is present for female respondents. Sur-prisingly, respondents from households where at least one household member often flies fromBromma are less likely to choose the opt-out alternative in the decrease survey versions. Thoseliving in detached houses are significantly more likely to choose the current situation, which mightbe a sign of being afraid of changes since this may, in an unknown way, affect the property values.In the versions including opt-out alternatives, i.e. the current situation, the monetary attributesare significant and of the expected sign. The higher the payment in the decrease version ceterisparibus the more likely a respondent is to opt-out and the increase version with compensationhas the opposite effect.In the binary model, the parameter of the monetary attribute, i.e. compensation, is highly insig-
nificant. It seems that excluding the opt-out alternative in the binary experiment resulted inrespondents not considering the cost attribute when making their choices, and rather havingadopted some other simplified decision strategy. This is supported in the survey versions with
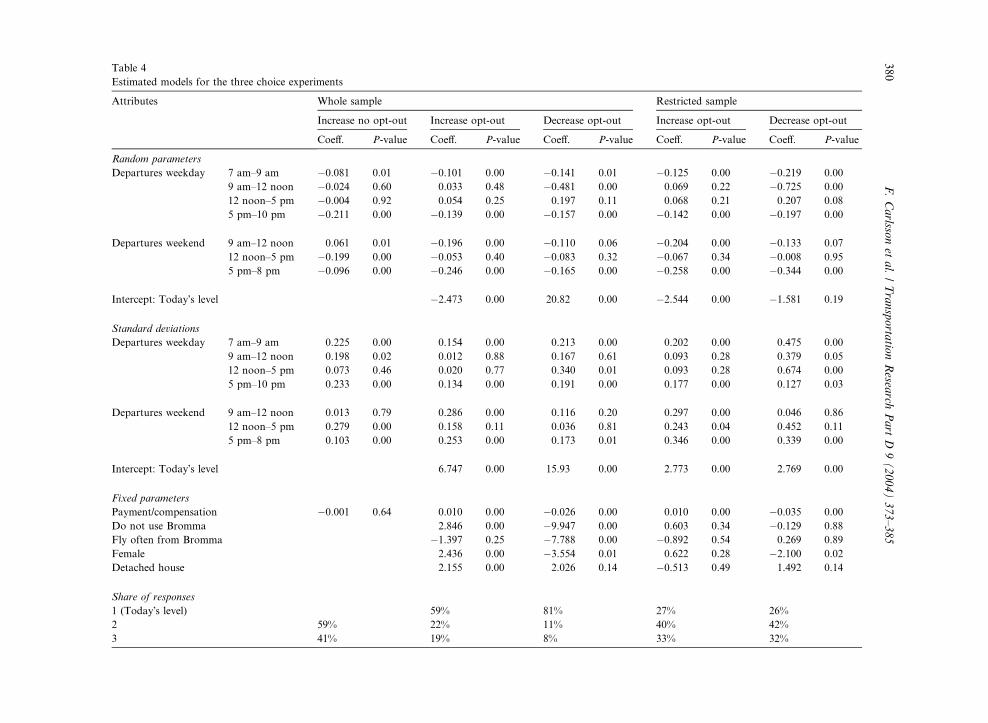
Table 4
Estimated models for the three choice experiments
Attributes Whole sample Restricted sample
Increase no opt-out Increase opt-out Decrease opt-out Increase opt-out Decrease opt-out
Coeff. P-value Coeff. P-value Coeff. P-value Coeff. P-value Coeff. P-value
Random parameters
Departures weekday 7 am–9 am �0.081 0.01 �0.101 0.00 �0.141 0.01 �0.125 0.00 �0.219 0.00
9 am–12 noon �0.024 0.60 0.033 0.48 �0.481 0.00 0.069 0.22 �0.725 0.00
12 noon–5 pm �0.004 0.92 0.054 0.25 0.197 0.11 0.068 0.21 0.207 0.08
5 pm–10 pm �0.211 0.00 �0.139 0.00 �0.157 0.00 �0.142 0.00 �0.197 0.00
Departures weekend 9 am–12 noon 0.061 0.01 �0.196 0.00 �0.110 0.06 �0.204 0.00 �0.133 0.07
12 noon–5 pm �0.199 0.00 �0.053 0.40 �0.083 0.32 �0.067 0.34 �0.008 0.95
5 pm–8 pm �0.096 0.00 �0.246 0.00 �0.165 0.00 �0.258 0.00 �0.344 0.00
Intercept: Today�s level �2.473 0.00 20.82 0.00 �2.544 0.00 �1.581 0.19
Standard deviations
Departures weekday 7 am–9 am 0.225 0.00 0.154 0.00 0.213 0.00 0.202 0.00 0.475 0.00
9 am–12 noon 0.198 0.02 0.012 0.88 0.167 0.61 0.093 0.28 0.379 0.05
12 noon–5 pm 0.073 0.46 0.020 0.77 0.340 0.01 0.093 0.28 0.674 0.00
5 pm–10 pm 0.233 0.00 0.134 0.00 0.191 0.00 0.177 0.00 0.127 0.03
Departures weekend 9 am–12 noon 0.013 0.79 0.286 0.00 0.116 0.20 0.297 0.00 0.046 0.86
12 noon–5 pm 0.279 0.00 0.158 0.11 0.036 0.81 0.243 0.04 0.452 0.11
5 pm–8 pm 0.103 0.00 0.253 0.00 0.173 0.01 0.346 0.00 0.339 0.00
Intercept: Today�s level 6.747 0.00 15.93 0.00 2.773 0.00 2.769 0.00
Fixed parameters
Payment/compensation �0.001 0.64 0.010 0.00 �0.026 0.00 0.010 0.00 �0.035 0.00
Do not use Bromma 2.846 0.00 �9.947 0.00 0.603 0.34 �0.129 0.88
Fly often from Bromma �1.397 0.25 �7.788 0.00 �0.892 0.54 0.269 0.89
Female 2.436 0.00 �3.554 0.01 0.622 0.28 �2.100 0.02
Detached house 2.155 0.00 2.026 0.14 �0.513 0.49 1.492 0.14
Share of responses
1 (Today�s level) 59% 81% 27% 26%
2 59% 22% 11% 40% 42%
3 41% 19% 8% 33% 32%
380
F.Carlsso
net
al./Transporta
tionResea
rchPart
D9(2004)373–385
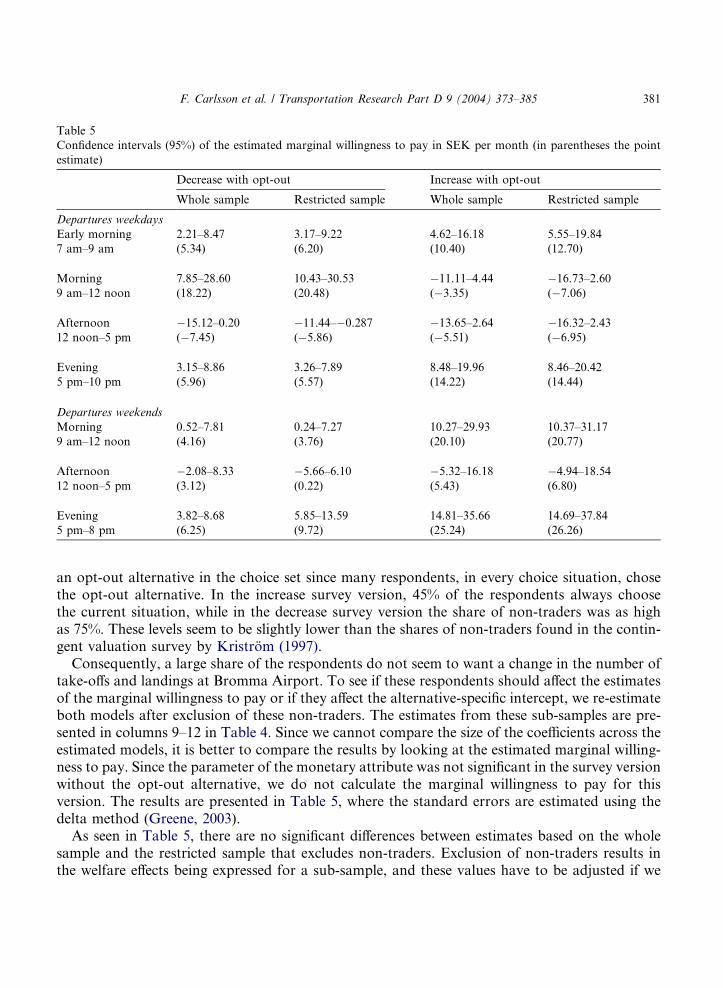
Table 5
Confidence intervals (95%) of the estimated marginal willingness to pay in SEK per month (in parentheses the point
estimate)
Decrease with opt-out Increase with opt-out
Whole sample Restricted sample Whole sample Restricted sample
Departures weekdays
Early morning 2.21–8.47 3.17–9.22 4.62–16.18 5.55–19.84
7 am–9 am (5.34) (6.20) (10.40) (12.70)
Morning 7.85–28.60 10.43–30.53 �11.11–4.44 �16.73–2.609 am–12 noon (18.22) (20.48) (�3.35) (�7.06)
Afternoon �15.12–0.20 �11.44–�0.287 �13.65–2.64 �16.32–2.4312 noon–5 pm (�7.45) (�5.86) (�5.51) (�6.95)
Evening 3.15–8.86 3.26–7.89 8.48–19.96 8.46–20.42
5 pm–10 pm (5.96) (5.57) (14.22) (14.44)
Departures weekends
Morning 0.52–7.81 0.24–7.27 10.27–29.93 10.37–31.17
9 am–12 noon (4.16) (3.76) (20.10) (20.77)
Afternoon �2.08–8.33 �5.66–6.10 �5.32–16.18 �4.94–18.5412 noon–5 pm (3.12) (0.22) (5.43) (6.80)
Evening 3.82–8.68 5.85–13.59 14.81–35.66 14.69–37.84
5 pm–8 pm (6.25) (9.72) (25.24) (26.26)
F. Carlsson et al. / Transportation Research Part D 9 (2004) 373–385 381
an opt-out alternative in the choice set since many respondents, in every choice situation, chosethe opt-out alternative. In the increase survey version, 45% of the respondents always choosethe current situation, while in the decrease survey version the share of non-traders was as highas 75%. These levels seem to be slightly lower than the shares of non-traders found in the contin-gent valuation survey by Kristrom (1997).Consequently, a large share of the respondents do not seem to want a change in the number of
take-offs and landings at Bromma Airport. To see if these respondents should affect the estimatesof the marginal willingness to pay or if they affect the alternative-specific intercept, we re-estimateboth models after exclusion of these non-traders. The estimates from these sub-samples are pre-sented in columns 9–12 in Table 4. Since we cannot compare the size of the coefficients across theestimated models, it is better to compare the results by looking at the estimated marginal willing-ness to pay. Since the parameter of the monetary attribute was not significant in the survey versionwithout the opt-out alternative, we do not calculate the marginal willingness to pay for thisversion. The results are presented in Table 5, where the standard errors are estimated using thedelta method (Greene, 2003).As seen in Table 5, there are no significant differences between estimates based on the whole
sample and the restricted sample that excludes non-traders. Exclusion of non-traders results inthe welfare effects being expressed for a sub-sample, and these values have to be adjusted if we
382 F. Carlsson et al. / Transportation Research Part D 9 (2004) 373–385
want to obtain values for the whole population. In turn this implies that one cannot use theseestimates directly for a welfare evaluation since the marginal willingness-to-pay is zero, or evennegative, for some respondents. In general the estimated marginal willingness to pay is higherfor the increase version with one exception: departures in the morning during weekdays. It isdifficult to know why this time of the day would be the exception. The major disturbancesaccording to our estimates are during the mornings and the evenings both for weekdaysand weekends. If we focus on the increase survey version, the marginal willingness to pay isabout 10 SEK per month for take-offs or landings in the early mornings during weekdaysand about 20 SEK in the mornings during weekends. Moreover, the willingness to pay is evenhigher in the evenings.
5. Discussions and conclusions
This paper provides some empirical evidence about the marginal willingness to pay for changesin noise from air traffic related to changes in aircraft movements at Bromma Airport. A substan-tial proportion of those surveyed favored the current situation in all choice sets, both in the in-crease (45%) and in the decrease (75%) versions. These figures are not surprising given thatKristrom (1997) found in a contingent valuation value survey that more than 70% were non-trad-ers. A high proportion of non-traders may also indicate that other, non-standard economic as-pects are important. There is also a tendency for a larger proportion of non-traders, and alower marginal willingness-to-pay in the decrease version. This is in line with evidence suggestingdivergence between willingness-to-pay and willingness-to-accept, that is particularly large for non-market goods (Horowitz and McConnell, 2002). One explanation is an endowment effect wherebyrespondents are reluctant to pay money for an improvement (Kahneman et al., 1990). Moreover,Kahneman et al. (1999) argue responses in surveys are more likely to be expressive than to rep-resent a value. In addition to psychological explanations, the size of Bromma Airport is a resultof past political debates, and hence individuals have at least indirectly affected the size of theairport.A large proportion of people are satisfied with the current level of flight operations at the air-
port and are not prepared to trade off any change for monetary compensation or payments. Thereare restrictions on aircraft noise levels and the weights of the aircrafts allowed to take off and landand it is a relatively quiet airport despite its size.However, people are sensitive to noise and the time of day matters. Some of the residents in the
Bromma area show a significant willingness-to-pay for a decrease in the number of aircraft move-ments in the morning and evening throughout the week. At the same time, many respondents arenot willing to pay anything for a change in the number of departures.
Acknowledgments
Financial support from the Swedish Agency for Innovation Systems (VINNOVA) and theSwedish Civil Aviation Administration is gratefully acknowledged. We have received valuable
F. Carlsson et al. / Transportation Research Part D 9 (2004) 373–385 383
comments from two anonymous referees and seminar participants at the Swedish University ofAgricultural Sciences in Umea.
Appendix A. Instructions to the respondents
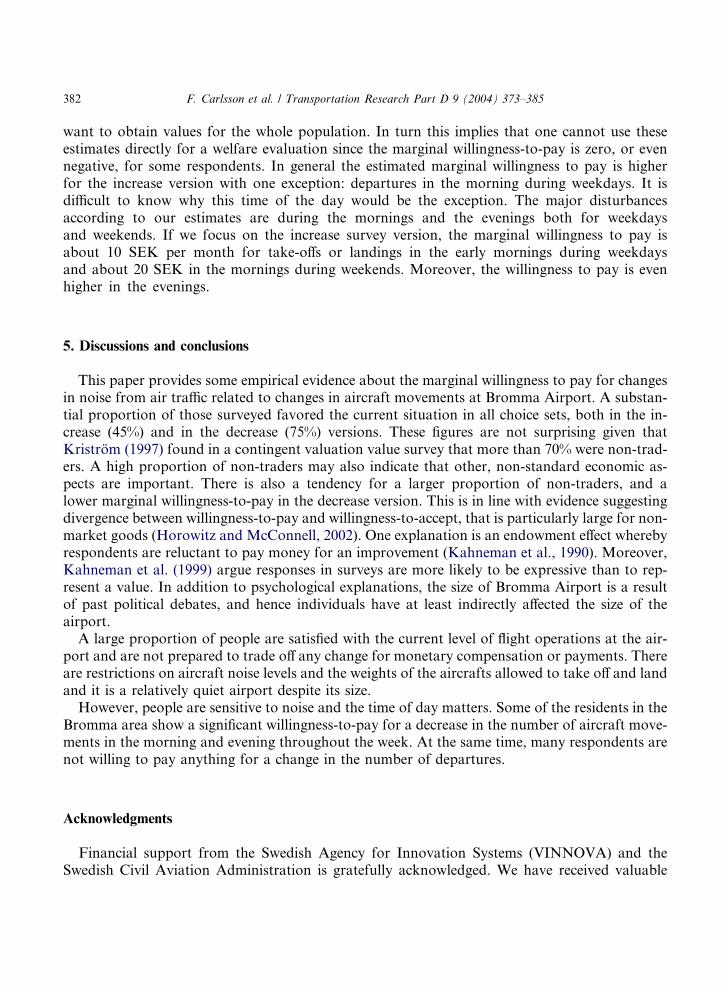
In this part of the survey we assume that Bromma Airport will not be shut down in the fore-seeable future. Flights to and from Bromma airport result in noise, and a number of measures canaffect this. The measures we are interested in are the number of take-offs and landings at varioustimes. By increasing the number of take-offs and landings the noise in the area you live in willincrease. An increase in take-offs and landings can also result in an increased risk of accidentsand increased emissions, even if these effects are small. In this part of the study we are only con-cerned with aircraft noise. We therefore ask you to only consider aircraft noise when answering thequestions.
An increase in aircraft noise can be a nuisance to your household. We are therefore inter-ested in knowing how much your household would require in compensation for this. We askyou to imagine that when the noise increases your household will receive an amount of moneyper month. These monies will be paid by the Bromma airport, which will increase their reve-nues from the increased air traffic. This means that you every month will have more money tospend.You will make six different choices. The first three ones concern air traffic during weekdays
and the last three concern air traffic during weekends. We ask you to mark the alternative yourhousehold prefers in each of the six cases. When choosing you should weigh the compensationagainst the increase in noise that occurs when the number of take-offs and landings increases.The composition of small and large aircrafts and the types of aircrafts will be the same astoday.The present situation at Bromma Airport is summarized below. This is for an ordinary day in
May.
Average number of take-offs and landings per hour
Weekdays Weekends
Early morning 7 am–9 am 16 per hour Early morning 7 am–9 am 0 per hourMorning 9 am–12 noon 10 per hour Morning 9 am–12 noon 7 per hourAfternoon 12 noon–5 pm 11 per hour Afternoon 12 noon–5 pm 8 per hourEvening 5 pm–10 pm 12 per hour Evening 5 pm–8 pm 14 per hour
Below is an example of a choice situation. As you can see you are supposed to compare thepresent situation with other possible alternatives.We want you to only consider aircraft noise and your compensation.Note: We are not investigating whether you think that Bromma airport should be shut down or
not.
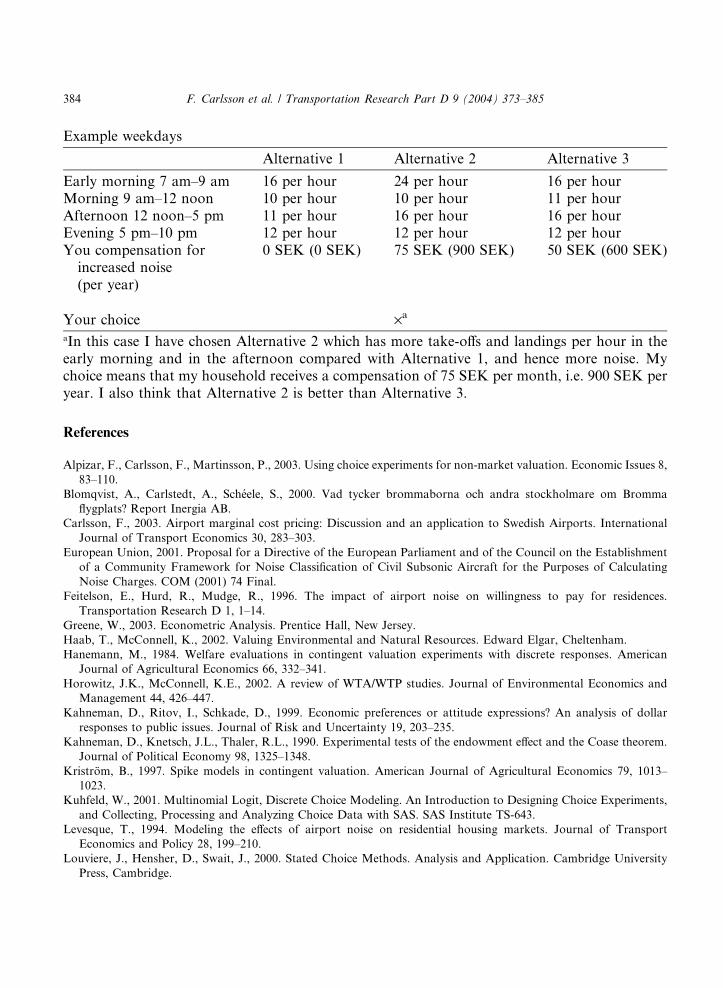
Example weekdays
Alternative 1 Alternative 2 Alternative 3
Early morning 7 am–9 am 16 per hour 24 per hour 16 per hourMorning 9 am–12 noon 10 per hour 10 per hour 11 per hourAfternoon 12 noon–5 pm 11 per hour 16 per hour 16 per hourEvening 5 pm–10 pm 12 per hour 12 per hour 12 per hourYou compensation forincreased noise(per year)
0 SEK (0 SEK) 75 SEK (900 SEK) 50 SEK (600 SEK)
Your choice ·aaIn this case I have chosen Alternative 2 which has more take-offs and landings per hour in theearly morning and in the afternoon compared with Alternative 1, and hence more noise. Mychoice means that my household receives a compensation of 75 SEK per month, i.e. 900 SEK peryear. I also think that Alternative 2 is better than Alternative 3.
384 F. Carlsson et al. / Transportation Research Part D 9 (2004) 373–385
References
Alpizar, F., Carlsson, F., Martinsson, P., 2003. Using choice experiments for non-market valuation. Economic Issues 8,
83–110.
Blomqvist, A., Carlstedt, A., Scheele, S., 2000. Vad tycker brommaborna och andra stockholmare om Bromma
flygplats? Report Inergia AB.
Carlsson, F., 2003. Airport marginal cost pricing: Discussion and an application to Swedish Airports. International
Journal of Transport Economics 30, 283–303.
European Union, 2001. Proposal for a Directive of the European Parliament and of the Council on the Establishment
of a Community Framework for Noise Classification of Civil Subsonic Aircraft for the Purposes of Calculating
Noise Charges. COM (2001) 74 Final.
Feitelson, E., Hurd, R., Mudge, R., 1996. The impact of airport noise on willingness to pay for residences.
Transportation Research D 1, 1–14.
Greene, W., 2003. Econometric Analysis. Prentice Hall, New Jersey.
Haab, T., McConnell, K., 2002. Valuing Environmental and Natural Resources. Edward Elgar, Cheltenham.
Hanemann, M., 1984. Welfare evaluations in contingent valuation experiments with discrete responses. American
Journal of Agricultural Economics 66, 332–341.
Horowitz, J.K., McConnell, K.E., 2002. A review of WTA/WTP studies. Journal of Environmental Economics and
Management 44, 426–447.
Kahneman, D., Ritov, I., Schkade, D., 1999. Economic preferences or attitude expressions? An analysis of dollar
responses to public issues. Journal of Risk and Uncertainty 19, 203–235.
Kahneman, D., Knetsch, J.L., Thaler, R.L., 1990. Experimental tests of the endowment effect and the Coase theorem.
Journal of Political Economy 98, 1325–1348.
Kristrom, B., 1997. Spike models in contingent valuation. American Journal of Agricultural Economics 79, 1013–
1023.
Kuhfeld, W., 2001. Multinomial Logit, Discrete Choice Modeling. An Introduction to Designing Choice Experiments,
and Collecting, Processing and Analyzing Choice Data with SAS. SAS Institute TS-643.
Levesque, T., 1994. Modeling the effects of airport noise on residential housing markets. Journal of Transport
Economics and Policy 28, 199–210.
Louviere, J., Hensher, D., Swait, J., 2000. Stated Choice Methods. Analysis and Application. Cambridge University
Press, Cambridge.
F. Carlsson et al. / Transportation Research Part D 9 (2004) 373–385 385
Luftfartsverket, 2002. Miljorapport 2001 Stockholm-Bromma flygplats. Norrkoping, Luftfartsverket.
Luftfartsverket, 2003. Miljorapport 2002 Stockholm-Bromma flygplats. Norrkoping, Luftfartsverket.
Morrell, P., Lu, C.H.Y., 2001. Aircraft noise social cost and charge mechanisms––a case study of Amsterdam Airport
Schiphol. Transportation Research D 5, 305–320.
Naturvardsverket, 2001. Riktvarden for trafikbuller vid nyanlaggning eller vasentlig ombyggnad av infrastuktur,
forslag till utveckling av definitioner. Dnr 540-355-01 Rv, Naturvardsverket, Stockholm.
Nelson, J.P., 2004. Meta-analysis of airport noise and hedonic property values. Journal of Transport Economics and
Policy 38, 1–28.
Pennington, G., Topham, N., Ward, R., 1990. Aircraft noise and residential property values adjacent to Manchester
international airport. Journal of Transport Economics and Policy 24, 49–59.
Train, K., 1998. Recreation demand models with taste differences over people. Land Economics 74, 230–239.
Train, K., 2003. Discrete Choice Methods with Simulation. Cambridge University Press, New York.
Uyeno, D., Hamilton, S., Biggs, A., 1993. Density of residential land use and the impact of airport noise. Journal of
Transport Economics and Policy 27, 3–18.


![Noise, nuisance and disturbance · {PAGE \* MERGEF ORMAT } NR/GN/ESD10 Draft @ 13 April 2018 Noise, nuisance and disturbance [Guidance Note |Environment] The Contractor shall seek](https://img.pdfslide.us/doc/110x75/5e811fdbb82b8a31ad0f2a8e/noise-nuisance-and-disturbance-page-mergef-ormat-nrgnesd10-draft-13-april.jpg)