Embed Size (px)
Citation preview

The Marginal Rate of Corruption in Public Programs:Evidence from India∗
Paul Niehaus†
UC San DiegoSandip Sukhtankar‡
Dartmouth College
May 16, 2013
Abstract
Optimal fiscal policy depends on the marginal benefits of public spending. In devel-oping countries corrupt officials often embezzle funds, so optimal policy should reflectmarginal corruption. We analyze marginal corruption in the context of a statutory wageincrease in India’s employment guarantee scheme. Strikingly, workers received none ofthe increase even though initially they were on average overpaid. The data are incon-sistent with theories of “voice” in which the threat of complaints limits corruption, butconsistent with theories of “exit” in which outside options in the private sector limit howmuch rent officials can extract.
JEL codes: D61, D73, H11, H53, I38, K42, O10
Keywords: Corruption, Leakage, Voice, Exit, Public Programs
∗We thank the editor, two anonymous referees, Prashant Bharadwaj, Raj Chetty, Julie Cullen, MelissaDell, Eric Edmonds, Roger Gordon, Gordon Hanson, Erzo Luttmer, Craig McIntosh, Sendhil Mullainathan,Andres Santos, Jon Skinner, Doug Staiger, and seminar participants at Columbia, Cornell, Dartmouth,IGIDR (Mumbai), the NBER Public Economics meetings (Stanford), NEUDC (MIT), Swarthmore, UCIrvine, UCSD, and UC Berkeley for helpful comments; Manoj Ahuja, Arti Ahuja, and Kartikian Pandianfor generous support and hospitality; and Sanchit Kumar for adept research assistance. We acknowledgefunding from the National Science Foundation (Grant SES-0752929), a Harvard Warburg Grant, a HarvardCID Grant, and a Harvard SAI Tata Summer Travel Grant. Niehaus acknowledges support from a NationalScience Foundation Graduate Student Research Fellowship; Sukhtankar acknowledges support from a Har-vard University Multidisciplinary Program in Inequality Fellowship. An earlier draft circulated with the title“Marginal Leakage in Public Programs.”†Department of Economics, University of California at San Diego, 9500 Gillman Drive #0508, San Diego,
CA 92093-0508. [email protected].‡Department of Economics, Dartmouth College, 326 Rockefeller Hall, Hanover, NH 03755.
1
1 Introduction
Public finance teaches us to equate the marginal costs and benefits of social spending.1
“Marginal benefits” here usually mean the marginal per-dollar benefits of the activity
being financed. This interpretation implicitly assumes, however, that money allocated
reaches its intended use. In many countries this is not the case, as substantial sums
“leak out” due to corruption.2 Research documenting leakage in Brazil, India, Indonesia,
Uganda, and elsewhere has estimated average rates of diversion ranging from 18%-87%.3
Olken (2006) argues that governments anticipating a high leakage rate may optimally
choose a low level of social spending. In practice this could play out in two ways. On the
extensive margin, policy-makers may simply shut down extremely “leaky” programs. On
the intensive margin, the optimal level of funding allocated to each program will depend
on the marginal rate of leakage: that is, the amount of the marginal dollar spent that
does not reach its intended use. For example, all else equal a planner will allocate less to
a program that loses 50% of every additional dollar to graft than one that loses 40%.
Implementing this idea raises a practical challenge: corruption is notoriously difficult
to measure, and even if a planner can measure average leakage rates it is unclear what
information these contain about marginal rates. For example, suppose an audit reveals
that 50% of a transfer is currently being diverted. Marginal leakage could be 50% if
transfers are shared proportionally with beneficiaries, or 0% if officials take a fixed cut,
or 100% if officials pocket all but a fixed amount. Distinguishing among such possibilities
is an open problem.
This paper presents what we believe to be the first empirical analysis of marginal rates
of corruption. We study India’s largest welfare program, the National Rural Employment
Guarantee Scheme (NREGS), which entitles every rural household to up to 100 days of
paid employment per year. The scheme covers roughly 11% of the world’s population
and costs roughly 1% of India’s GDP. State governments frequently revise the statutory
wages they offer via the NREGS; since implementing officials do not always pay workers
what they are due, however, it is unclear how these reforms influence wages actually paid.
We examine this question using data from an original survey of 1,938 households in
the eastern state of Orissa, who were listed in official records as having participated in
1The appropriate measure of marginal costs is actively debated; one tradition emphasizes the distortionarycosts of taxation while another sees these as a separable redistributive issue (Kaplow, 2004; Kreiner andVerdelin, 2012).
2We use “leakage” throughout to refer to theft of public funds as opposed to, for example, the dissipationof benefits through deadweight losses or mis-targeting of benefits to the non-poor.
3For example, Reinikka and Svensson (2004) estimate that on average 87% of a block grant intendedfor primary schools in Uganda was diverted by local officials. India’s Planning Commission estimates that58% of the subsidized grains allocated to the Targeted Public Distribution System are diverted (ProgrammeEvaluation Organization, 2005). Olken (2006) places a lower bound of 18% on the fraction of rice divertedfrom Indonesia’s OPK program. See also Chaudhury et al. (2006), Olken (2007), and Ferraz et al. (2012).
2
the NREGS between March and June of 2007. We collected data on all spells of NREGS
work done by these households and compared these to the corresponding official micro-
data. The statutory wage due to participants changed from Rs. 55 to Rs. 70 half-way
through this study period, allowing us to estimate marginal leakage along the program’s
main margin of adjustment.
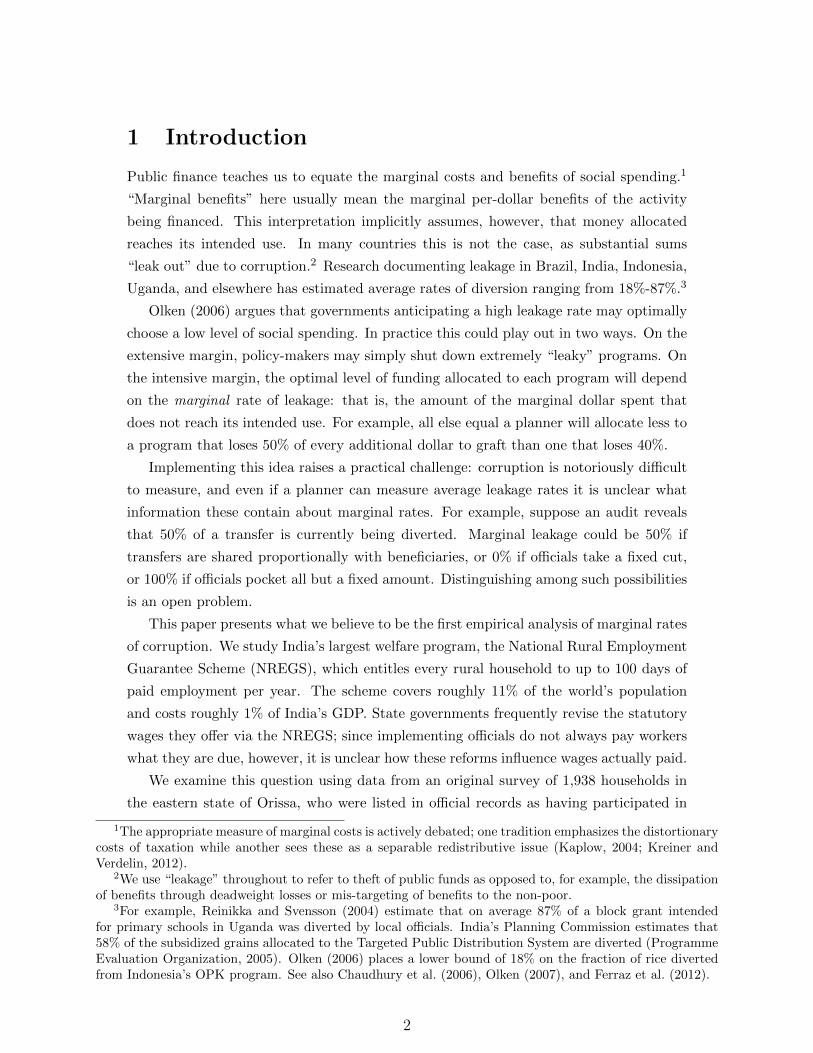
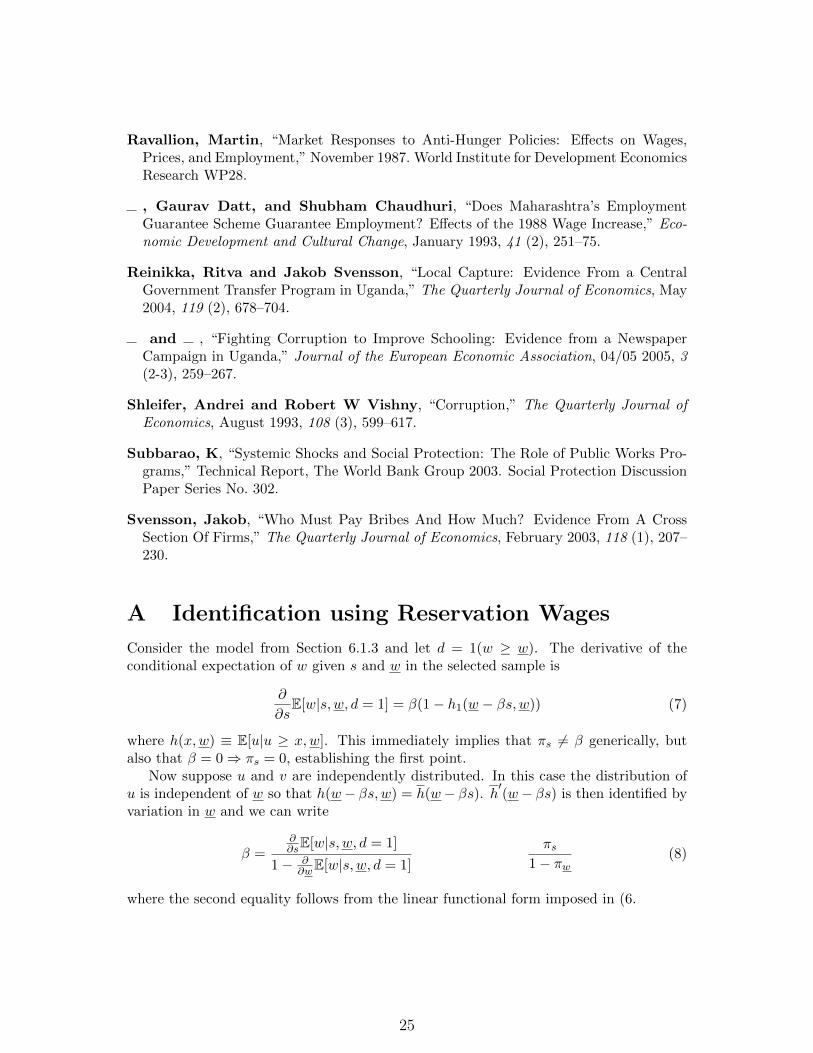
Figure 1 summarizes our main result. It plots the evolution of wages during our
study period, distinguishing between those reported in official records and by actual
participants. The official series clearly increases in response to the reform on 1 May.
What is striking is that none of the wage increase was passed through to workers. Thus
while average leakage from wage payments prior to the policy change was close to 0%,
marginal leakage was 100%.4
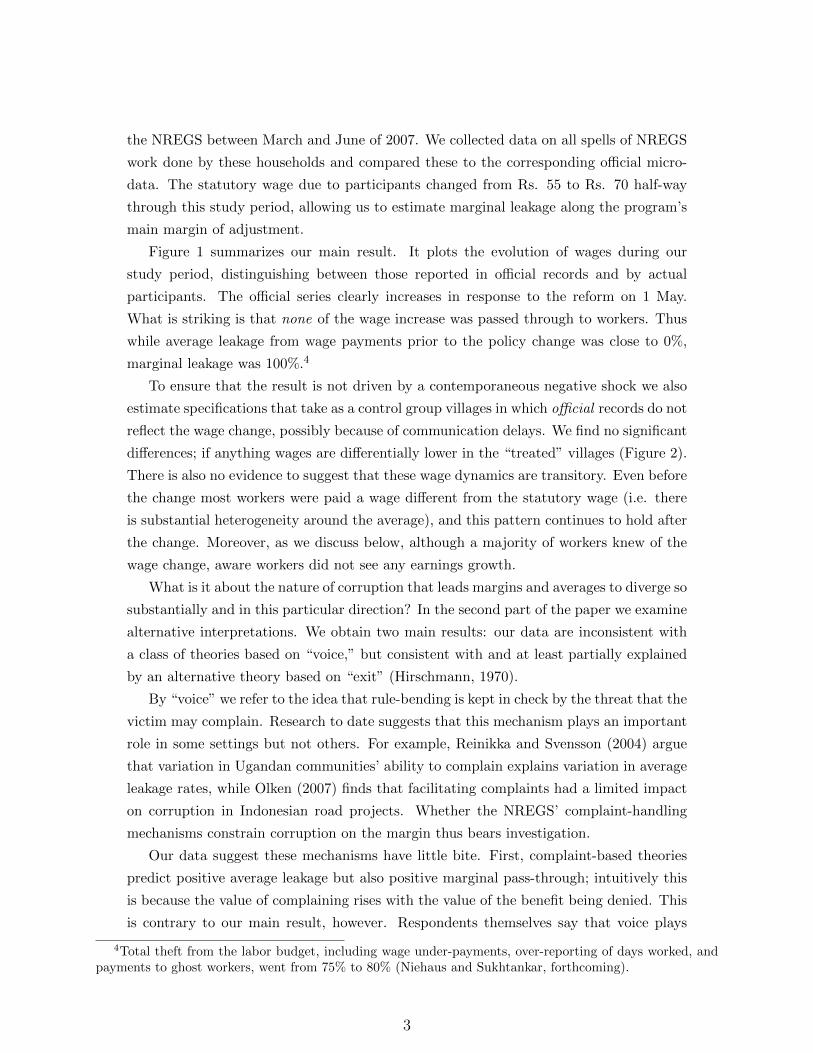
To ensure that the result is not driven by a contemporaneous negative shock we also
estimate specifications that take as a control group villages in which official records do not
reflect the wage change, possibly because of communication delays. We find no significant
differences; if anything wages are differentially lower in the “treated” villages (Figure 2).
There is also no evidence to suggest that these wage dynamics are transitory. Even before
the change most workers were paid a wage different from the statutory wage (i.e. there
is substantial heterogeneity around the average), and this pattern continues to hold after
the change. Moreover, as we discuss below, although a majority of workers knew of the
wage change, aware workers did not see any earnings growth.
What is it about the nature of corruption that leads margins and averages to diverge so
substantially and in this particular direction? In the second part of the paper we examine
alternative interpretations. We obtain two main results: our data are inconsistent with
a class of theories based on “voice,” but consistent with and at least partially explained
by an alternative theory based on “exit” (Hirschmann, 1970).
By “voice” we refer to the idea that rule-bending is kept in check by the threat that the
victim may complain. Research to date suggests that this mechanism plays an important
role in some settings but not others. For example, Reinikka and Svensson (2004) argue
that variation in Ugandan communities’ ability to complain explains variation in average
leakage rates, while Olken (2007) finds that facilitating complaints had a limited impact
on corruption in Indonesian road projects. Whether the NREGS’ complaint-handling
mechanisms constrain corruption on the margin thus bears investigation.
Our data suggest these mechanisms have little bite. First, complaint-based theories
predict positive average leakage but also positive marginal pass-through; intuitively this
is because the value of complaining rises with the value of the benefit being denied. This
is contrary to our main result, however. Respondents themselves say that voice plays
4Total theft from the labor budget, including wage under-payments, over-reporting of days worked, andpayments to ghost workers, went from 75% to 80% (Niehaus and Sukhtankar, forthcoming).
3
a limited role: while 36% of participants reported having experienced problems while
working, only 7% said that they had or would deal with a problem by complaining to
higher-up authorities. Twenty-two percent said they would do nothing at all, citing the
costs of complaining (53%) and the low probability of success (37%).
It could be that while complaints are ineffective for the typical worker, they do matter
for some. In particular, lack of awareness of the wage change could be a constraint. We do
not find any evidence, however, of higher pass-through among workers who knew about
the change (72% of work spells in our sample). This is not consistent with a story in
which wages converge to the statutory ones once people learn about the policy change in
the long run. We also find no evidence of higher pass-through among workers who live
closer to the government offices where complaints are (ostensibly) heard, suggesting that
travel costs are not the limiting factor. Interestingly, we do find some evidence of positive
pass-through in the 36% of villages in which an NGO is active. This suggests that NGOs
(or factors correlated with their presence) may facilitate voice, though not enough to be
detectable in the aggregate.
The difficulty of reconciling voice-based models with our data raises a puzzling ques-
tion: if officials are not afraid of getting in trouble for underpaying, then why do they pay
at all? A variety of forces could be at work. We test one interpretation based on the idea
that market forces provide an important check on corruption. If officials value worker
participation in the scheme, but workers have outside options in the private sector, then
the private sector wage will limit underpayment. In short, this “exit” hypothesis predicts
that program wages are determined not by laws but by the market.5
We test this conjecture using data on workers’ outside options. Ninety-six percent
of respondents said that the private labor market was the outside option relevant for
them, which suggests that local labor market conditions should influence program wages.
To minimize concerns over reverse casuality we test this prediction using variation in
villages’ relative endowments of land and labor. Although de jure wages should be the
same everywhere, we find that de facto they are substantially and significantly higher
in villages that are land-abundant and labor-scarce. This suggests that outside options
in the private sector at least partly explain NREGS wages. Interestingly, these results
imply the fact that workers were paid the statutory wage on average before the shock
is misleading, masking the fact that workers in some areas were paid more than the
statutory wage (“overpaid”) while others were paid less (“underpaid”).6
5This idea is related to papers that emphasize participation constraints as a determining factor of equi-librium bribe levels, such as Svensson (2003) and Hunt (2007). It also parallels the thesis of Leff (1964)and Huntington (1968) that corruption undoes distortionary policies and thus “greases the wheels” of theeconomy. In our context, the NREGS is designed to act as a distortionary wage floor, but corruption pullsprogram wages (and hence, labor allocations) back towards their competitive values.
6We use “underpaid” and “overpaid” throughout to refer to the relationship between what workers re-ceived and what they were legally entitled to.
4
A potential caveat to this result is that factor endowments might affect not wage offers
but who accepts these offers and thus appear in our sample (Heckman, 1979). We present
three pieces of evidence to rule this out. First and most importantly, participation rates
and wages are correlated with factor endowments in the same direction, inconsistent with
selection. Second, while selection models predict that factor endowments shift the lower
end of the NREGS wage distribution, we find that they shift the upper end. Third,
we use survey data on respondents’ reservation wages to obtain selection-corrected point
estimates; these turn out to be essentially identical to the uncorrected ones.
We see our analysis of marginal leakage as part of recent efforts to adapt public eco-
nomic theory for use in developing countries where, as Mullainathan et al. (Forthcoming)
argue, “it is impossible to understand policy without understanding corruption.”7 Our
findings apply most directly to the analysis of workfare schemes, which are common
worldwide (Subbarao, 2003) and frequently studied (Ravallion, 1987; Ravallion et al.,
1993; Basu et al., 2009). More broadly, our analysis underscores the value of identify-
ing which constraints on rent extraction bind. Shleifer and Vishny (1993) have argued
persuasively that competition within government can play an important role; our results
suggest that outside options in the private sector may be similarly important.
The rest of the paper is organized as follows: Section 2 describes the NREGS setting,
and Section 3 describes the data collected. Section 4 presents our main empirical results
on marginal leakage; Section 5 examines the voice hypothesis in greater depth, and Section
6 the exit hypothesis. Section 7 concludes.
2 Contextual Background
India’s National Rural Employment Guarantee Scheme is a central pillar of welfare policy
in rural India. Launched in 2005, it entitles every rural household to up to 100 days of paid
employment on government projects per year.8 The rationale for the work requirement is
to induce self-selection of the poor into program participation (Besley and Coate, 1992).
The NREGS is a fiscal behemoth; the central government’s budget allocation for fiscal
year 2010-2011 was Rs. 401 billion ($8.9 billion), 3.6% of government expenditures, or
0.73% of 2008 GDP.9 Including state expenditures (25% of the cost of materials) the total
outlay is yet higher.
Participation in the program takes place in discrete “spells” of employment. Program
7Work in this genre includes Keen (2008), Gordon and Li (2009), Olken and Singhal (2010) and Pomeranz(2012) on taxation and Niehaus et al. (forthcoming) on poverty-targeting.
8This 100-day limit is rarely binding; almost no one in our sample reached it, and our understanding fromwork in Orissa and Andhra Pradesh is that in practice no one is denied work for having attained the limit.
9Costs: http://indiabudget.nic.in/ub2010-11/bh/bh1.pdf. Expenditures: http://indiabudget.
nic.in/ub2010-11/bag/bag3.htm. GDP: GDP:http://mospi.nic.in/4_gdpind_cur.pdf.
5
guidelines state that adult members of registered households can apply for spells up of to
15 days of work at any time. Applications are submitted to the local Gram Panchayat or
block office, the lowest and next-lowest units in the administrative hierarchy. Officials are
legally obligated to provide the applicant with employment on a project located within
5 km of the worker’s home. The projects undertaken through the NREGS are typical
of rural employment generation schemes – road construction and irrigation earthworks
predominate. The administration of these projects is the responsibility of the Gram
Panchayat (GP), whose key figures are the elected Sarpanch and the appointed Panchayat
Secretary. The day-to-day supervision of projects is typically delegated to a Village Labor
Leader (a GP employee), a Junior/Assistant Engineer in the relevant state department,
or – contrary to program guidelines – to a private contractor.
Depending on how feasible it is to measure output, workers receive either a fixed wage
per day or a piece rate per unit of output (e.g. per cubic foot of soil excavated). In
either case participation and compensation are recorded on a paper muster roll. These
documents are periodically delivered to the local block office where the data are entered
into an electronic database. The state and national governments advance funds to the
panchayats to compensate workers and replenish these funds on the basis of the records
entered into the database. Most of the workers in our study received their wages in cash
from panchayat officials, though a few were paid through a bank or post office account
and efforts are underway to increase the use of banks for wage payment.
Because eligibility for the NREGS is already universal in rural areas, wages are the
principle margin for adjustment. We therefore focus on marginal leakage with respect
to changes in the statutory wage. NREGS wages have changed frequently since the
program’s inception because of the way in which the scheme is financed: the wage bill is
paid by the central government, but wage rates are state-specific and determined by state
governments. This gave state politicians strong incentives to raise statutory wages, and
most did so repeatedly. This paper examines the impacts of an increase in the minimum
daily wage in the eastern state of Orissa from Rs. 55/day to Rs. 70/day on 1 May, 2007.
We focus on impacts on leakage from the labor budget, which by law must be at least
60% of total expenditure and in practice is often substantially higher. The officials who
implement the NREGS can steal from the labor budget in two ways: they can underpay
workers, and they can over-report the number of person-days of work done. For example,
if a worker works for 10 days and is owed Rs. 55 per day the official might report that he
worked for 20 days and pay him Rs. 50 per day, earning (20−10)×55 from over-reporting
and 10× (55− 50) from under-payment. Note that we define both of these behaviors as
corruption, in the sense that they violate the official program rules, regardless of what
the corrupt agents do with their illicit gains. The policy implications of corruption may
of course vary depending on how diverted funds are used. We discuss several specific
6
hypotheses below in concluding.
Under-payment and over-reporting are monitored in different ways. Underpaid work-
ers can in principle access a formal grievance redressal process. The first point of appeal
is the Program Officer, a block-level role typically filled by the Block Development Officer
(BDO); further appeals go to the district Programme Coordinator, a role played by the
District Collector. Both the BDO and the Collector are appointed bureaucrats from the
state or national administrative service. By rule these officials should accept grievances
on standardized forms and issue receipts so that petitioners can follow up. How effectively
this system functions in practice is an open question.
Workers have less incentive to monitor over-reporting because the program’s budget
is not fixed; a rupee stolen through over-reporting does not mean a rupee less for them.
One potential check on over-reporting is the internal verification of works recommended
by program guidelines, which call for audits of 100% of projects by block officers, 10% by
district offiers, and 2% by state officers (Ministry of Rural Development, 2008). In practice
we found that block and district officials use the NREGS’s management information
system (MIS) to track aggregate quantities of work done and compare these to technical
estimates or to their own intuitions about how much work should be necessary. In some
cases we observed officials tracking work through periodic photographs of worksites. The
upshot is that implementing officials face a low but positive probability of being caught
and punished.10
3 Data Collection
NREGS micro-data are, by law, available online to the public (http://NREGS.nic.in).
Data available from jobcards include the roster of individuals within each household with
their names, genders, and ages. Data available from muster rolls include information on
each spell of work performed including the identity of the worker, the project worked on,
number of days worked, and amount earned. Muster rolls do not explicitly state whether
a spell was compensated on a daily wage or piece rate basis; we can infer this, however,
since the few allowed daily wage rates are round numbers unlikely to occur by chance
under a piece rate scheme.11
In order to construct a sample frame we downloaded (in January 2008) all muster
roll information for the period March-June 2007, i.e. two months before and after the
10For documentation see for example the reports of OREGS-Watch, a coalition of NGOS monitoringimplementation in Orissa (http://groups.google.co.in/group/oregs-watch).
11These are Rs. 55, 65, 75, and 85 prior to the wage change, and Rs. 70, 80, 90 and 100 afterwards. Thehigher rates are for skilled categories of laborers and are rarely applied; they appear in 6.5% of all spells inour official data in roughly equivalent proportions before and after 1 May.
7
statutory wage change on 1 May 2007.12 We sampled work spells from the official records
for Gajapati, Koraput, and Rayagada districts in Orissa.13 We then sampled 60% of
Gram Panchayats within our study blocks, stratified by whether or not the position of
GP chief executive was reserved for a woman or ethnic minority.14 Finally, we sampled
2.8% of work spells in these panchayats, stratifying by panchayat, implementing agency
(block or panchayat), payment scheme (wage or piece rate), and wage regime (pre or post
1 May 2007). We then set out to survey the 1, 938 households appearing in this sample.
Like much of central India, our study area experiences frequent conflict. Sources of
violence include the activity of the Naxals (armed Maoist insurgents), disputes between
mining conglomerates and the local tribal population, and tensions between evangelical
Christian missionaries and right-wing Hindu activists. We attempted to sample around
areas known to be experiencing conflict, but in the end were unable to send enumerators
into the villages of 439 households without exposing them to unacceptable risks. The
main issues were conflict between locals and a mining company in Rayagada and a polite
request by the Naxals to not enter parts of Koraput. Of the remaining 1, 499 households
we were able to either interview or confirm the non-existence/permanent migration/death
of 1408 households. To verify non-existence, death, or migration we required enumerators
to obtain the names of 3 neighbors willing to vouch for this fact. We exclude from the
analysis any households not meeting these stringent standards.
Given these omissions, an important issue is the extent to which the spells of work
we analyze are representative of the frame we sampled from. Table 1 provides summary
statistics from the official records for the universe of spells in our study region, our initial
sample, and the subset of spells included in our analysis. As one would expect, values
for the frame and the initial sample are essentially identical. Reassuringly, differences
between the initial sample and the analysis sample are also small and statistically in-
significant. The lone exception is that we interviewed the households associated with
slightly fewer spells performed by members of a Scheduled Caste or Scheduled Tribe
(79% of the intial sample, 77% of the analysis sampel, p = 0.05). This likely reflects the
fact that violence was concentrated in tribal areas. There is no evidence of differential
selection by the key spell characteristics (wage rate and date) we study below.
We interviewed respondents about their NREGS participation and in particular about
spells of work they did between March 1, 2007 and June 30, 2007. We also collected data
12We waited until January to ensure that all muster roll information had been digitized and uploaded; bylaw the data should be entered within two weeks after work is performed, but longer delays are common inpractice. As a consistency check we downloaded the same data again in March 2008 and confirmed that ithad not changed.
13We restricted ourselves to blocks (sub-districts) that border the neighbor state of Andhra Pradesh. Ourcompanion paper uses additional data from AP as a control for trends in Orissa, but since almost all workin AP is compensated on a piece rate basis we do not use it here.
14Chattopadhyay and Duflo (2004) find that such reservations affect perceived levels of corruption.
8

on household demographics, socio-economic status, awareness of NREGS rules and of
the wage change, labor market outcomes, and political participation. Table 2 provides
demographic information on the households in our sample. Notably, only 821 of 1, 408
households reported ever doing any work on the NREGS.
Given the lag between the study period and our survey we anticipated imperfect
recall. At the same time, the NREGS was a salient new program, and spells of work
were likely to be memorable and distinct relative to traditional employment. Moreover,
because NREGS payments are uncertain and often delayed, participants seem to keep
better track of what they are owed than, say, a US worker with direct deposit. To
further prompt respondents’ memory we asked about work on specific NREGS projects
with detailed descriptions, for example “Imp[rovement]. of Road from Brahmin street to
DP Camp at Therubali”. We also trained enumerators to use standard techniques for
enhancing recall, such as providing major holidays as reference points. Consequently, we
obtained information on wages received for 99% of the spells in our sample and data on
at least the month in which work was done for 93% of spells. We do not find significant
differential recall problems over time: in a variety of specifications including location fixed
effects and individual controls such as age and education, subjects’ estimated probability
of recalling exact dates increases by only 0.7%–2.2% per month and is not statistically
significant. We will return to the issue of recall after presenting our main results below.
Survey interviews were framed to minimize other potential threats to the accuracy
and veracity of respondents self-reports. We made clear that we were conducting aca-
demic research and did not work for the government, to discourage respondents from
claiming fictitious underpayment. None of the interviewed households have income close
to the taxable level and will have ever paid income taxes, so there are no tax motives for
underreporting.
4 Estimating Marginal Leakage
We turn now to estimating the proportion of the marginal dollar of program expenditure
that does not reach the intended beneficiaries.
Some notation may help clarify the nature of the exercise. Consider an NREGS worker
who is entitled by law to a statutory wage w but receives a (potentially distinct) wage
w. If w < w then there is leakage in the form of underpayment. Leakage may also occur
through over-reporting the number of days of work done; let B(w) represent the amount
of money stolen per work-day through this or other channels. Then the overall average
rate of leakage is
AL =w +B(w)− ww +B(w)
= 1− w
w +B(w)(1)
9
or total leakage divided by total expenditures. Marginal leakage with respect to an
increase in the statutory wage w is the change in leakage as a fraction of the change in
total expenditure, or
ML =1 +B′(w)− ∂w
∂w
1 +B′(w)= 1−
∂w∂w
1 +B′(w)(2)
Thus to estimate marginal leakage with respect to a change in w we generally need to
estimate two things: the effect on recipients’ actual earnings(∂w∂w
)and on total program
expenditures (1 + B′(w)).15 If wage pass-through is zero, however, then mechanically
marginal leakage can only be 100%.
Figure 1 illustrates our most important result: prior to 1 May wages paid are on
average similar to wages reported and to the statutory wage (Rs. 55), but none of
the wage increase passed through to workers. If anything actual wages received appear
to decline over time, though this pattern is largely compositional. Note also that during
March 2007 workers were on average overpaid ; we return to discuss this pattern in Section
5 below.16
Table 3 provides a more formal statistical analysis of pass-through. In columns I-IV
observations are spells of daily-wage work reported in the official records, while in columns
V-VIII they are spells of daily-wage work as reported by the corresponding households.
We categorize a spell of work as occurring on the day it began, so that a spell which
overlapped 1 May would be attributed to the “pre” period. As a robustness check we also
dropped overlapping spells (3% each of official and actual spells) and obtained essentially
identical results (not reported). Note that in order to obtain an unbiased measure of the
change in total program outlays in response to the policy reform we use a representative
sample of official spells, including fictitious spells attributed to worker, non-worker, and
“ghost” households. As a result the sample of official spells is substantially larger than
the sample of actual spells, the difference being attributable to over-reporting. As a
sensitivity check we also ran analogous regressions on the restricted set of official spells
associated with households that reported doing a strictly positive amount of work, and
obtained essentially identical results (not reported).17
Columns I-III show that the official wage jumps up significantly after 1 May and that
15This concept of marginal leakage would remain appropriate for policy callibration if changes in w affectedparticipation as well, since the marginal participant obtains zero surplus.
16See Section 6.1.1 for details on the construction of the time series in Figure 1. Note that official wagesvary both because of the 1 May policy change and also to a lesser degree because of variation in the proportionof workers reported as having received a “skilled” wage. The overall proportion of spells paid such wages islow (6.5% of all spells).
17Directly matching actual and official spells is infeasible because of the many fictitious official spells.For example, a worker may report having worked for one week sometime in May while the records statehe worked for the 1st, 2nd, and 4th weeks of May; in such cases any spell-to-spell mapping is inevitablysomewhat arbitrary.
10
this jump is abrupt enough to be distinguishable from a quadratic trend (Column II) and
widespread enough to be distinguishable from panchayat fixed effects (Column III).18
Note also that, consistent with Figure 1 is that while the average wage paid according to
official records increases sharply after 1 May, it does not increase all the way to Rs. 70,
the new minimum wage. The reason for this is that some panchayats (43% of panchayats
with daily wage projects) continued paying the older, lower wage rates even after 1 May.
The fact that some panchayats did not even claim to be paying higher wages is a
puzzle as it means they were leaving rents on the table. The most plausible explanation
is that some panchayats did not learn about the wage change immediately. Consistent
with this view, we show below that the post 1 May increase is substantially larger in
panchayats below median travel time from the block office and district office (Table 5).
This suggests that it may be informative to treat “unaware” panchayats as a control group
when we look at wages actually received by workers. Column IV of Table 3 differentiates
between panchayats that ever reported paying a new, higher wage during May or June
(the “aware” panchayats) from those that did not; tautologically, the increase in official
wages is concentrated in those that are aware.
Columns V-VIII mirror Columns I-IV but with wages actually paid to surveyed house-
holds as the outcome. If marginal leakage were equal to the pre-shock average leakage
rate we would expect to see actual wages increase by the same amount as official wages.
In contrast, and exactly as one would expect from Figure 1, wages are lower after 1 May
(Column V). This decrease simply reflects an overall downward trend in wages (Column
VI), and this trend is itself largely a compositional effect that disappears when we control
for village fixed effects (Column VII).
In Column VIII we differentiate between panchayats that did or did not ever imple-
ment the statutory wage change. This lets us test for the possibility that some other
factor determining wages changed discretely at the same time as the statutory wage did,
offsetting what would otherwise have been a positive effect. If this were the case we
would expect to see an increase in wages in panchayats that implemented the policy
change relative to those that did not. This is not the case, however: the differential effect
is negative and statistically insignificant. Figure 2 presents this difference-in-difference
graphically: it shows that the actual wages in implementing panchayats parallel those in
non-implementing panchayats, while official wages diverge sharply after 1 May. In sum
there is strong evidence of 0% pass-through, or 100% marginal leakage.19
18We use months as the time trend variable for comparability to the household-reported spells data, forwhich specific start days within months are not always available due to limited recall. Results for the officialdata using day-of-year trends are similar.
19An alternative explanation for non-implementation of the wage reform might be that some panchayatsfaced cash flow management problems. We believe this would if anything encourage them to claim to bepaying the higher wages, since reported wage payments are reimbursable claims. That said, regardless ofthe exact reason for non-implementation, the tests presented here are inconsistent with the view that the
11

Given that our survey was conducted well after our study period, it is worth investi-
gating whether recall problems might be attenuating the estimates in Table 3. Suppose
that the wage increase was in fact passed through, at least to some workers, but that
they misremembered how much they earned on different spells. Then we would expect
to see average actual wages between Rs. 55 and Rs. 70 both before and after the shock,
with some attenuated upward trend. None of our estimates match this pattern, however.
Going further, we can isolate workers who worked only after the shock, and thus could
not have confused their post-shock earnings with those from earlier spells. In fact these
workers report receiving slightly lower post-shock wages than those who worked both
before and after the shock (Rs. 52 vs Rs. 55). One might also worry that respondents
confuse NREGS wages with prevailing market wages, but in our data at least 76% of
workers report NREGS wages different from market wages, depending on the measure of
market wages used.20 Finally, we will see below that our wage data are strongly corre-
lated with cross-sectional variation in factor endowments and with time-series variation
in the statutory wage within villages with active NGOs. These results suggest that our
data are accurate enough to pick up effects where they do in fact exist.
Another potential measurement concern is that officials might pressure or bargain
with workers to report a rosy view to “outsiders.” If this were the case then we would
expect an upward bias in our measure of pass-through as workers report receiving the
new, higher wages when in fact they are not. The fact that we find no pass-through is
thus inconsistent with this hypothesis. On this point note also that the large gaps we find
between the quantities of work reported by officials and by workers imply that collusion
is limited, if present (see Niehaus and Sukhtankar (forthcoming)).
Finally, we can also test indirectly for wage pass-through by examining effects on
participation. If wages did in fact increase then, ceteris paribus, participation should
have increased as well; this test has the advantage that participation is presumably easier
to recall and less vulnerable to collusion than the details of payments. Consistent with the
direct evidence, Column IV of Table 7 reports that participation was weakly lower after
1 May even after controlling for a trend. (The construction of the dependent variable is
discussed in detail in Section 6.1.1 below.)
One final concern is that Figure 1 correctly summarizes the wage dynamics during
our study period, but that these are temporary. Might the fact that workers were on
average paid the statutory wage prior to 1 May suggest that they will eventually receive
apparent lack of pass-through is due to some offsetting negative shock affecting all panchayats similarly.20We asked about market wages separately for men and women and for particular tasks such as road
construction and planting/harvesting of rice. The average market wages for men for road construction arealmost exactly the same as the average daily wage for men on NREGA works (Rs. 58.6 vs Rs. 57.5), yet76% of work spells were paid NREGA daily wages distinct from the market wages for road constructionreported by the same respondents. Results using other categories of work or wages for women are even morediscrepant.
12
the new, higher wage? The argument is not this simple. The fact that the mean average
pre-period wage is very similar to the statutory pre-period wage appears to be something
of a coincidence since, as we will see below, there was substantial variation around that
mean. In short, our data are not consistent with the view that the equilibrium prior to 1
May was one of adherence to the statutory wage. This in itself suggests that we should
not necessarily expect the new equilibrium to converge to adherence.
We can also directly test for dynamics due to learning. In the aggregate wages continue
to fall, not rise towards their new statutory level, during our study period (Figure 1).
Our ability to measure dynamics over longer horizons is limited by the fact that most
NREGS work in Orissa stops once the kharif season begins; 82% of all work done in our
study area during 2007 was completed by the end of our study period. We can, however,
conduct two tests. First, we re-estimated the specifications in Table 3 on an augmented
sample of work spells including those conducted after the end of our study period. This
sample is representative of earnings trends among those reported as having worked during
our study period. The estimates are similar in all respects to those reported here (results
available on request). Second, we can test for differential changes in earnings during our
study period for workers better-informed about the wage change. We show below that
the 72% of workers who were aware of the wage change when we surveyed them earned
the same wages as their less-informed counterparts. Our data are thus hard to reconcile
with a model in which recipients receive their entitlements once information about the
policy change has disseminated.
The absence of wage pass-through implies that, regardless of the exact amount by
which expenditures increased, marginal leakage cannot be other than 100% (Equation
2). In earlier work we also estimated the increase in total outlays, and our best estimate
is that total expenditure per dollar received by recipients increased from $4.08 to $5.03.
(Niehaus and Sukhtankar, forthcoming) In short, expenditures increased substantially
without any apparent benefit for participants.
5 Is Voice a Binding Constraint?
The stark divergence between average and marginal under-payment is surprising. In
the following two sections we examine what it implies about the underlying model of
corruption, and in particular how well two different classes of theory fit the results.
We begin with theories in which corruption is constrained by the threat of victims
complaining, an idea we refer to as “voice.” Earlier work suggests that voice matters
in some contexts but not in others. For example, Reinikka and Svensson (2004) argue
that variation in communities’ ability to complain explains cross-sectional variation in
leakage from their school block grants, while Olken (2007) finds that providing community
13
members access to anonymous complaint boxes and inviting them to public audit meetings
had only limited effects on corruption in Indonesian road-building projects.
In our context, the lack of wage pass-through provides little prima facie support for
the voice hypothesis. The problem is that, holding fixed the wage w a worker is receiving,
the value of complaining increases with the statutory wage w he hopes to recover. The
amount an official must pay to forestall complaints thus increases with w as well. To make
this point concrete, suppose a worker can complain at expected cost c and the complaint
is successful with probability π then the official must pay at least w − cπ to prevent a
complain. In this simple model, a binding constraint complaint has the counterfactual
implication that the worker’s wage w should increase one-for-one with w.
To better understand how complaints work in practice we asked participants, “Do
you feel you were treated fairly at the job site? Or did you have any problems at work?”
(to which 36% responded that they had had problems) and then “If you did have any
problems, or if a problem were to arise in the future, what would you do about it?”
While this is a broad question that does not specifically refer to issues of under-payment,
it should shed some light on workers’ approach to dealing with wage issues.
The great majority of respondents told us that if they had problems they would
either do nothing (22%), or take up the issue with local panchayat officials or village
elders (74%), the same officials responsible for implementation of the NREGS to begin
with. Only 7% of all workers (and only 13% of workers who had actually experienced
problems) said they would appeal at the Block or District levels, which are the entities
designated by NREGS guidelines for dealing with grievances (Table 4). Among those
who said they would do nothing, the main reasons stated were that complaining would
be in vain (37%) and that complaining would be too time-consuming or take too much
effort (53%). Ten percent indicated fear of retribution as the main deterrent.
These responses are consistent with what Das and Pradhan (2007) report based on
their fieldwork in Orissa:
“One must apply to the BDO, then to the district collector, and then onlyto the state level authorities and the CM’s office. But, this is precisely wherepeople face a problem. Their applications are stone-walled, by the simpleabsence of any officials to receive these applications. If there are officialspresent, they refuse to give receipts, which makes it difficult for the applicantsto follow up. In any case the tribal villages are at least an hour’s walk away inmajority of the cases from the block head office. There are little [sic] options,with the poor public transport, which can cover only a partial distance becauseof the paucity of roads.”
This account is useful both because it underscores the difficulties facing a typical worker
and also because it suggests dimensions along which voice may vary. In particular, workers
14

who live closer to the relevant government offices should have more effective voice. To
test this conjecture we use data on distances and travel times from our survey of village
elders. The average village in our sample is 17km from the corresponding Block office and
38km from the District office, and average estimated round-trip travel times are 3 hours
and 5 hours, respectively.21 Panchayats located closer to block and district offices saw
larger increases in their officially reported wages (Table 5, Columns I and II). Columns V
and VI show, however, that the same is not true for wages actually received. Actual wage
changes are insignificantly different in panchayats close to block offices and if anything
significantly lower in those located close to district offices.
Another dimension along which voice might vary is information. The literature on
information and accountability has shown that information is a binding constraint in
some contexts. (Reinikka and Svensson, 2005; Besley and Prat, 2006; Ferraz and Finan,
2008) If this were true in our setting then we should see higher pass-through for better-
informed workers. Seventy-two percent of the work spells in our sample were done by
households that knew that there had been a change in the daily wage rate, and of these
81% were done by households that correctly identified the new wage as Rs. 70 per day.
Individual workers claimed to be underpaid relative to the statutory wage on 31% of
work spells but overpaid on only 3%.22 Yet Column IX of Table 5 shows that there
is no significant tendency for workers from households that learned of the wage change
to receive differentially higher wages after 1 May, as one would expect if awareness were
sufficient. Note that while awareness is clearly endogenous, the most natural biases (aware
individuals are also more influential in other ways) would tend to inflate this coefficient,
not bias it towards 0.
Finally, voice might vary with the likelihood that a given complaint succeeds. While
this is a difficult dimension to measure, one plausible proxy is the presence of an active
non-governmental organization (NGO) in a village. NGOs in Orissa have formed a loose
coalition devoted to monitoring NREGS implementation and ensuring that participants
obtain their entitlements; at least one NGO is active in 36% of the villages in our sample.
Columns III and VII examine whether the effects of the policy change were different
in these villages. Interestingly, while we find no differential effects on officially reported
wages, we do find a significant positive effect on wages actually received in villages with an
active NGO. This is consistent with the idea that NGOs help program participants hold
government accountable. This is not the only reasonable interpretation, since having an
NGO may be correlated with many other unobservable variables. At a minimum, however,
21These are times using whatever (possibly costly) means of transport the respondent would use. Ata typical walking speed of 3 mph the average round-trip travel times would be 7 hours and 16 hours,respectively.
22Claiming to be underpaid is strongly positively correlated with actually being underpaid.
15
the result establishes that there exists some such variable that improves accountability.2324
6 Is Exit a Binding Constraint?
That fact that voice does not appear to constrain corruption on the margin raises an
interesting question: if officials are not afraid of underpaying workers more, then why do
they pay them at all?
In principle a variety of forces could be at work. For example, elected officials such
as the sarpanch may pay attractive wages to improve their re-election prospects; more
generally, officials may employ workers in exchange for other favors. Wage rates would
then be determined by the value of votes or favors. In this section we test the hypothesis
that program wages are determined, at least in part, by workers outside options, and
in particular by market wages. This view seems consistent with our conversations with
NREGS participants, who openly discussed negotiating with program officials until they
received a satisfactory wage.25
Of course, this “exit” hypothesis does not explain why officials care about exit. Why
not simply let the worker leave, claim that he worked, and pocket his entire remuneration?
Some of this undoubtedly happens. One reason it may not always be an optimal strategy,
however, is that hiring a worker to do some work makes it less risky to over-report a good
deal more. For example, it may seem safer to claim that it took 150 person-days to dig a
hole in the ground when there actually is a hole in the ground that took 50 person-days
to dig than when there is no hole at all. More generally, paying a worker to do some
work may increase the amount one can safely over-report by more than enough to make
it profitable.
For a formal illustration, let w be the worker’s reservation wage, i.e. the least he would
be willing to accept in order to do NREGS work. (One naturally thinks of w as the wage
he could earn in the private sector, but in principle it could simply be his valuation of
leisure.) If the worker works then the official increases the amount of remuneration he
claims on the muster rolls by at least w and possibly by a further B(w) in additional over-
reporting, so that the pair’s total surplus from reaching agreement is w+B(w)−w. When
this is negative the worker will work in the private sector; when positive, the official hires
the worker at a wage of at least w. In this view the statutory wage may have little effect
on the worker’s realized wage w while the market conditions that determine w play a key
23We also tested for but did not find evidence of differentially higher pass-through in panchayats in whichthe position of sarpanch was reserved by law for a woman or ethnic minority.
24An additional caveat to this result is that, unlike the other results, it loses statistical significance oncewe control for district fixed effects.
25See also Svensson (2003), Bertrand et al. (2007), Hunt (2007), and Olken and Barron (2009) for evidenceon bargaining between citizens and corrupt officials in other contexts.
16
role. Note also that if w < w < w + B(w) then the equilibrium involves over -payment:
the official finds it profitable to hire workers even at wages above the statutory one.
One intruiging piece of circumstantial evidence consistent with this hypothesis is vis-
ible in Figure 1. During the first month of the study period the mean wage received by
households is actually higher than the mean wage reported in official records. This gap
is driven by a large number of observations from Gajapati district where both prevail-
ing market wages and households’ reported NREGS wages are relatively high. NGOs
working in this area have reported that officials do in fact overpay workers to induce
them to participate precisely because this creates scope for further theft in the form of
over-reporting.
More generally, if the exit constraint binds then variation in workers’ outside options
should be positively related to the NREGS wage realizations we observe. Implementing
this test requires a measure of variation in those outside options. Private-sector employ-
ment, rather than leisure, appears the be the relevant outside option: when asked what
they would have done if the NREGS wage were below their reservation wage, 96% of
respondents indicated some other form of work as opposed to only 4% who said they
would have waited for a better wage. Higher private sector wages should therefore lead
to higher NREGS wage realizations.
A naive approach to testing this hypothesis would be to regress NREGS wages and
participation on private sector wages. The direction of causality would be unclear, how-
ever; indeed the standard view of employment guarantee schemes is that they act as a
binding floor on private sector wages. To circumvent this simultaneity issue we exploit
variation in local factor endowments. If a village endowed with cultivatable land T and la-
bor L produces output Y = F (T, L) then the competitive real wage will be w = FL(T, L);
assuming decreasing returns to labor and land-labor complementarity this wage will be
decreasing in the labor endowment and increasing in the land endowment.
We matched our survey data to records from the 2001 Census on the stock of cultivat-
able land and the total population at the Gram Panchayat level.26 Unlike contemporane-
ous market wages these quantities were pre-determined prior to the launch of the NREGA
in 2005, so there is no concern about reverse causality. Relative factor endowments also
vary substantially in our data. This need not imply variation in reservation wages, since
the effects could be offset by variation in other unmeasured factors. Reservation wages
will vary, however, if there is variation in location-specific consumption amenities that
compensate for real wage differentials, or if labor mobility is limited. The chief concern
is that that factor endowments are correlated with other determinants of worker’s bar-
gaining power; we will check the sensitivity of our results to controlling for a battery of
26We define cultivatable land as the sum of “irrigated farmland”, “unirrigated farmland”, and “cultivatablewaste”.
17
variables that one would expect to capture such variation.
Table 6 reports estimates of the relationship between factor endowments and wages.
All specifications include month fixed effects and thus implicitly control for any effects of
the statutory wage change. As a preliminary we first examine in Column I the relationship
between factor endowments and workers’ reservation wages, i.e. the lowest wage for
which they would be willing to accept NREGS work (we describe this variable in more
detail below). Consistent with the hypothesis that factor endowments affect the marginal
product of labor, we find that reservation wages are significantly higher in relatively land-
abundant panchayats and lower in labor-abundant ones.
In Columns II-V we show that this also holds for NREGS wages, consistent with the
view that NREGS wages respond to variation in workers’ labor market opportunities.
A 10% increase in cultivatable land is associated with a Rs. 0.7 higher NREGS wage,
while a 10% increase in population is associated with a Rs. 0.9 lower NREGS wage. In
Column III we include worker-level proxies for bargaining power; we find that men, non-
minorities, and workers paid through banks receive significantly higher wages. We note
that, while only suggestive, the latter fact is consistent with the hypothesis that financial
sector development is critical for the design of fiscal policy (Gordon and Li, 2009). In
Column IV we control for village-level predictors of bargaining power such as the presence
of NGOs, and in Column V we include both control sets. The coefficients on land and
population remain strongly significant across all specifications and fall by at most 30%
relative to the uncontrolled model.27
Finally, in column VI we estimate an instrumental variables model based on the
exclusion restriction that factor endowments affect NREGS wages only through their
effect on reservation wages. We estimate that a Rs. 1 increase in a worker’s reservation
wage increases his NREGS wage by Rs. 0.84, and we cannot reject the null that this
coefficient is equal to 1.
6.1 Are Wages Selected or Affected?
One caveat to our factor endowment findings is that they could reflect either causal effects
on the wages offered to workers or selection effects on wages accepted. We provide three
tests to further distinguish these views. First and most importantly, NREGS participation
responds to factor endowments in the same direction as NREGS wages, opposite the
pattern that would generate selection bias. Second, the impacts of factor endowments on
the entire wage distribution are concentrated in the upper end, opposite what selection
stories predict. Finally, a new estimator that exploits participants’ reservation wages
27We we include district fixed effects in these regressions the factor endowment effects are smaller inmagnitude but remain strongly significant. The coefficient on bank payment remains positive but losessignificance, however, and should be interpreted with this caveat in mind.
18
within a selection-as-misspecification framework (Heckman, 1979) yields estimates very
similar to our baseline ones.
6.1.1 Impacts on Participation
We first test a necessary condition for selection bias: do factor endowments move NREGS
participation in the opposite direction as NREGS wages? To do so we shift from analyzing
the data at the spell level to analyzing it at the panchayat-day level. We construct
panchayat-day series on days of work done and average wage paid on daily wage spells as
follows: if a spell involved d days of work done and took place between a start date and
an end date that are D days apart then we attribute d/D of the spell to each day in that
interval. We then take for each day an average of the wages paid on spells that overlap
that day, weighted by these d/D ratios.
Columns I-III of Table 7 report the estimated impacts of factor endowments on
NREGS program outcomes using this method of aggregation. All specifications include
month fixed effects to absorb any impact of the statutory wage change, though columns
IV and VIII show little evidence of such effects.28 Column I shows that relative labor
scarcity is still associated with higher NREGS wages, as in Table 6, after restructuring
our data. Columns II and III show that this is unlikely to be due to selective partici-
pation, as participation moves in the same direction as wages. Concretely, it cannot be
the case that accepted NREGS wages are higher in land-abundant villages because fewer
people accept low values from a fixed distribution of wage offers. (The columns differ
only in that II restricts the sample to days on which we observe some work, making it
more comparable with Column I.)
One might worry that this test is under-powered since, with few sampled households
per panchayat, 48% of panchayat-days have no participation reported. Columns V-VIII
of Table 7 show that we obtain very similar results when we aggregate the data and
conduct the analysis at the panchayat-month level, for which fewer (37%) observations
have no participation reported.
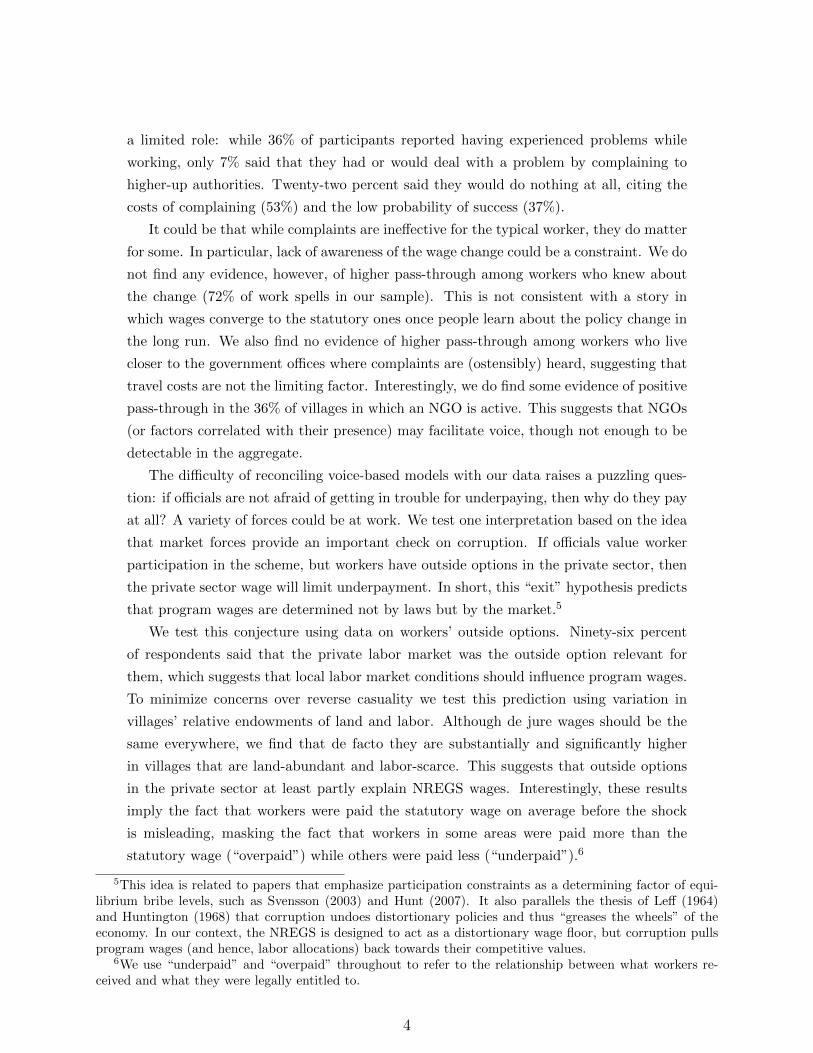
6.1.2 Distributional Impacts
As a second check on selection we estimated quantile-regression analogues of the models
in Table 6. We use these to test the null hypothesis that wage offers are drawn from
some fixed c.d.f. F that is invariant to factor endowments. One can show that if factor
endowments simply truncate the distribution of accepted offers then
28This is of independent interest as it suggests either that there were few workers whose reservation wagesw fell between the old wage (Rs. 55) and the new one (Rs. 70), or that officials face short-run quantityconstraints in hiring due to the nature of project planning.
19
(a) They strictly increase the lowest quantile, have no effect on the highest quantile,
and have a decreasing impact on average across quantiles of the accepted wage
distribution.
(b) If F is not too concave then they have a monotone decreasing effect on higher
quantiles of the accepted wage distribution.
A formal derivation is available on request. Figure 3 plots the estimated coefficients on
our two factor endowment measures from a series of quantile regressions at each decile,
including month dummies. The effects of both factors are concentrated in the upper, not
lower, end of the distribution.
6.1.3 A Test and Correction using Reservation Wages
Our third approach exploits data on workers’ reservation wages to achieve set or point
identification. Given our sample size we present the argument parametrical, though the
non-parametric extension is straightforward and available on request. Let s be any vari-
able predicted to affect program wage offers w; we will treat s as a scalar for expositional
purposes but in practice this will be a vector of factor endowments and other controls.
Following Heckman (1979), let wage offers and reservation wages be determined by
w = βs+ u (3)
w = γs+ v (4)
where s is independent of (u, v). We wish to estimate β but observe (w,w) only if w ≥ w.
The conditional expectation function in the selected sample is
E[w|s, w ≥ w] = βs+ E[u|u ≥ (γ − β)s+ v] (5)
which implies that OLS estimates of β are biased unless γ = β. We consider instead the
reduced-form augmented regression function
E[w|s, w,w ≥ w] = πss+ πww (6)
In Appendix A we establish two results concerning this specification. First, while πs 6= β
generally, β = 0 implies πs = 0. The practical implication is that we can reject the null
that s does not influence wage offers in the population if we find that it is a significant
predictor of offers in the selected sample, after controlling for w. Second, under the
structural assumption that u and v are independently distributed we can identify β as
β = πs1−πw . In other words, we can recover the effect of s on wage offers in the population
by running a regression of wage realizations in the selected sample on s and the reservation
20
wage, and then scaling up the former coefficient by one minus the later.29
Our empirical measure of reservation wages is subjects’ response to following question:
“Think about when you requested work. What is the lowest daily wage you would have
been willing to work on NREGS for at that point?”. Answers to this question correspond
to realizations of w in our model. Importantly, these are reservation wages and not market
wages: they should therefore serve as sufficient statistics for all factors driving selection
into NREGS participation, including both the attractiveness of other work and of leisure,
for example. Unfortunately we asked this question once per NREGS participant, not per
spell of work. To minimize measurement error in w we restrict ourselves to the sample
of workers who did exactly one spell of work, for whom there is no ambiguity. Results
are similar if we use the full sample and impute the same reservation wage for each spell
of work done by workers who worked more than once. In our restricted sample 89% of
workers report receiving a wage at least as high as their reservation wage; the other 11%
may represent measurement error or may have been subject to unanticipated hold-up.
Table 8 implements our approach. Panel A simply shows that the uncorrected results
reported in Table 6 do not change when we use our new, restricted estimation sample.
In Panel B we re-estimate the same models but include worker’s reservation wages as
an additional control. While biased, these estimates let us reject the null that factor
endowments do not influence wage offers (Equation 7). As expected the point estimates
are smaller than those in Panel A, but they remain economically meaningful and strongly
significant. In addition the estimated coefficient on the reservation wage is stable across
control sets, which suggests that factor endowments are the major determinants of wage
offers and hence that independence of the error terms in Equations 3 and 4 is a reason-
able approximation. Panel C presents selection-adjusted estimates under this maintained
assumption. The estimates are similar (and in the case of population somewhat larger)
than the uncorrected estimates in Panel A and are strongly significant. They corroborate
earlier pieces of evidence that labor market conditions have a causal effect not only on
wage realizations but on wage offers.30
29The independence assumption amounts to assuming that we have included in s all the variables thatinfluence both wage offers and reservation wages. We cannot test this directly, but can assess how reasonableit is by examining the sensitivity of our results to expanding the control set.
30Truncated Tobit models are often used to address selection. For a large proportion (60%) of the workspells in our data, however, the wage received exactly equalled the reservation wage. This mass point isexactly what our “exit” hypothesis predicts, but is inconsistent with a truncated model with a smoothlydistributed latent variable. We have also fit censored Tobit models and obtained strongly significant estimatesroughly 20% larger than those presented here.
21
7 Conclusion
Marginal rates of corruption or “leakage” are an important input into policy-making. We
provide the first empirical analysis of marginal leakage. We study India’s National Rural
Employment Guarantee Scheme, a large social protection scheme. We find that marginal
leakage with respect to an increase in the statutory daily wage due to workers was 100%:
none of the wage increase was passed through to workers, even though on average they
were slightly over-paid prior to the change. The policy implications of the analysis are
thus sharply different from those one might infer from examining averages.
These estimates, along with corroborating pieces of evidence, are inconsistent with
theories of corruption in which the threat of complaints, or “voice,” is binding at the
margin. The data are consistent with theories in which officials price jobs to reflect the
value of workers’ outside options in the private labor market. Of course, this “exit”
threat need not be workers’ only source of bargaining power vis-a-vis officials, and a
deeper understanding of their negotiations would be valuable.
Our analysis was motivated by the question of optimal redistribution. While it is
intuitive to think that wage increases are never optimal in the face of 100% marginal
leakage, we do not know the ultimately incidence of the rents extracted by NREGS
officials. Some may find their way into the pockets of political superiors in the form of
payments for plum jobs or collusive bribes to prevent exposure; some may be returned to
local voters as campaign spending.31 Understanding the distribution of rents in political
and bureaucratic hierarchies is another frontier for research in the political economy of
developing countries and complementary to work on marginal leakage.
There are two bright points in the otherwise gloomy picture we present. First, NGOs
may lower marginal leakage. There could be many mechanisms – they may provide lit-
erate advocates who better understand how to navigate the bureaucracy, or may serve
a coordinating function among workers. Understanding what NGOs do in this sort of
environment may help us understand accountability in local government more generally.
Second, workers paid through bank accounts earn more. In ongoing work we are evalu-
ating the causal impact of electronic payment technologies on NREGS corruption.
31Ferraz and Finan (2011) show that political incentives matter for corrupt behavior.
22
References
Basu, Arnab K., Nancy H. Chau, and Ravi Kanbur, “A Theory of EmploymentGuarantees: Contestability, Credibility and Distributional Concerns,” Journal of Pub-lic Economics, April 2009, 93 (3-4), 482–497.
Bertrand, Marianne, Simeon Djankov, Rema Hanna, and Sendhil Mul-lainathan, “Obtaining a Driver’s License in India: An Experimental Approach toStudying Corruption,” The Quarterly Journal of Economics, November 2007, 122 (4),1639–1676.
Besley, Timothy and Andrea Prat, “Handcuffs for the Grabbing Hand? MediaCapture and Government Accountability,” American Economic Review, June 2006, 96(3), 720–736.
and Stephen Coate, “Workfare versus Welfare: Incentive Arguments for Work Re-quirements in Poverty-Alleviation Programs,” The American Economic Review, 1992,82 (1), 249–261.
Chattopadhyay, Raghabendra and Esther Duflo, “Women as Policy Makers: Evi-dence from a Randomized Policy Experiment in India,” Econometrica, 09 2004, 72 (5),1409–1443.
Chaudhury, Nazmul, Jeffrey Hammer, Michael Kremer, Karthik Muralid-haran, and F. Halsey Rogers, “Missing in Action: Teacher and Health WorkerAbsence in Developing Countries,” Journal of Economic Perspectives, Winter 2006, 20(1), 91–116.
Das, Vidhya and Pramod Pradhan, “Illusions of Change,” Economic and PoliticalWeekly, August 2007, 42 (32).
Ferraz, Claudio and Frederico Finan, “Exposing Corrupt Politicians: The Effects ofBrazil’s Publicly Released Audits on Electoral Outcomes,” The Quarterly Journal ofEconomics, 05 2008, 123 (2), 703–745.
and , “Electoral Accountability and Corruption: Evidence from the Audits of LocalGovernments,” American Economic Review, June 2011, 101 (4), 1274–1311.
, , and Diana B. Moreira, “Corrupting Learning: Evidence from Missing Fed-eral Education Funds in Brazil,” Working Paper 18150, National Bureau of EconomicResearch June 2012.
Gordon, Roger and Wei Li, “Tax Structures in Developing Countries: Many Puzzlesand a Possible Explanation,” Journal of Public Economics, August 2009, 93 (7-8),855–866.
Heckman, James J, “Sample Selection Bias as a Specification Error,” Econometrica,January 1979, 47 (1), 153–61.
Hirschmann, Albert, Exit, Voice, and Loyalty: Responses to Declines in Firms, Orga-nizations, and States, Cambridge, MA: Harvard University, 1970.
23
Hunt, Jennifer, “How Corruption Hits People When they are Down,” Journal of De-velopment Economics, November 2007, 84 (2), 574–589.
Huntington, Samuel, “Modernisation and Corruption,” in “Political Order in ChangingSocieties,” New Haven: Yale University Press, 1968.
Kaplow, Louis, “On the (Ir)Relevance of Distribution and Labor Supply Distortion toGovernment Policy,” Journal of Economic Perspectives, Fall 2004, 18 (4), 159–175.
Keen, Michael, “VAT, Tariffs, and Withholding: Border Taxes and Informality inDeveloping Countries,” Journal of Public Economics, October 2008, 92 (10-11), 1892–1906.
Kreiner, Claus Thustrup and Nicolaj Verdelin, “Optimal Provision of PublicGoods: A Synthesis*,” The Scandinavian Journal of Economics, 2012, 114 (2), 384–408.
Leff, Nathaniel, “Economic Development through Bureaucratic Corruption,” AmericanBehavioural Scientist, 1964, 8, 8–14.
Ministry of Rural Development, The National Rural Employment Guarantee Act2005: Operation Guidelines 2008, 3rd ed. 2008.
Mullainathan, Sendhil, Abhijit V. Banerjee, and Rema Hanna, CorruptionForthcoming.
Niehaus, Paul and Sandip Sukhtankar, “Corruption Dynamics: the Golden GooseEffect,” American Economic Journal: Economic Policy, forthcoming.
, Antonia Attanassova, Mariane Bertrand, and Sendhil Mullainathan, “Tar-geting with Agents,” American Economic Journal: Economic Policy, forthcoming.
Olken, Benjamin A., “Corruption and the Costs of Redistribution: Micro Evidencefrom Indonesia,” Journal of Public Economics, May 2006, 90 (4-5), 853–870.
, “Monitoring Corruption: Evidence from a Field Experiment in Indonesia,” Journalof Political Economy, April 2007, 115 (2), 200–249.
and Monica Singhal, “Informal Taxation,” Technical Report, Harvard UniversityJanuary 2010.
and Patrick Barron, “The Simple Economics of Extortion: Evidence from Truckingin Aceh,” Journal of Political Economy, 06 2009, 117 (3), 417–452.
Pomeranz, Dina, “No Taxation without Information: Deterrence and Self-Enforcementin the Value Added Tax,” Technical Report 13-057, Harvard Business School WorkingPaper December 2012.
Programme Evaluation Organization, “Performance Evaluation of Targeted PublicDistribution System,” Technical Report, Planning Commission, Government of IndiaMarch 2005.
24
Ravallion, Martin, “Market Responses to Anti-Hunger Policies: Effects on Wages,Prices, and Employment,” November 1987. World Institute for Development EconomicsResearch WP28.
, Gaurav Datt, and Shubham Chaudhuri, “Does Maharashtra’s EmploymentGuarantee Scheme Guarantee Employment? Effects of the 1988 Wage Increase,” Eco-nomic Development and Cultural Change, January 1993, 41 (2), 251–75.
Reinikka, Ritva and Jakob Svensson, “Local Capture: Evidence From a CentralGovernment Transfer Program in Uganda,” The Quarterly Journal of Economics, May2004, 119 (2), 678–704.
and , “Fighting Corruption to Improve Schooling: Evidence from a NewspaperCampaign in Uganda,” Journal of the European Economic Association, 04/05 2005, 3(2-3), 259–267.
Shleifer, Andrei and Robert W Vishny, “Corruption,” The Quarterly Journal ofEconomics, August 1993, 108 (3), 599–617.
Subbarao, K, “Systemic Shocks and Social Protection: The Role of Public Works Pro-grams,” Technical Report, The World Bank Group 2003. Social Protection DiscussionPaper Series No. 302.
Svensson, Jakob, “Who Must Pay Bribes And How Much? Evidence From A CrossSection Of Firms,” The Quarterly Journal of Economics, February 2003, 118 (1), 207–230.
A Identification using Reservation Wages
Consider the model from Section 6.1.3 and let d = 1(w ≥ w). The derivative of theconditional expectation of w given s and w in the selected sample is
∂
∂sE[w|s, w, d = 1] = β(1− h1(w − βs,w)) (7)
where h(x,w) ≡ E[u|u ≥ x,w]. This immediately implies that πs 6= β generically, butalso that β = 0⇒ πs = 0, establishing the first point.
Now suppose u and v are independently distributed. In this case the distribution ofu is independent of w so that h(w− βs,w) = h(w− βs). h′(w− βs) is then identified byvariation in w and we can write
β =∂∂sE[w|s, w, d = 1]
1− ∂∂wE[w|s, w, d = 1]
πs1− πw
(8)
where the second equality follows from the linear functional form imposed in (6.
25
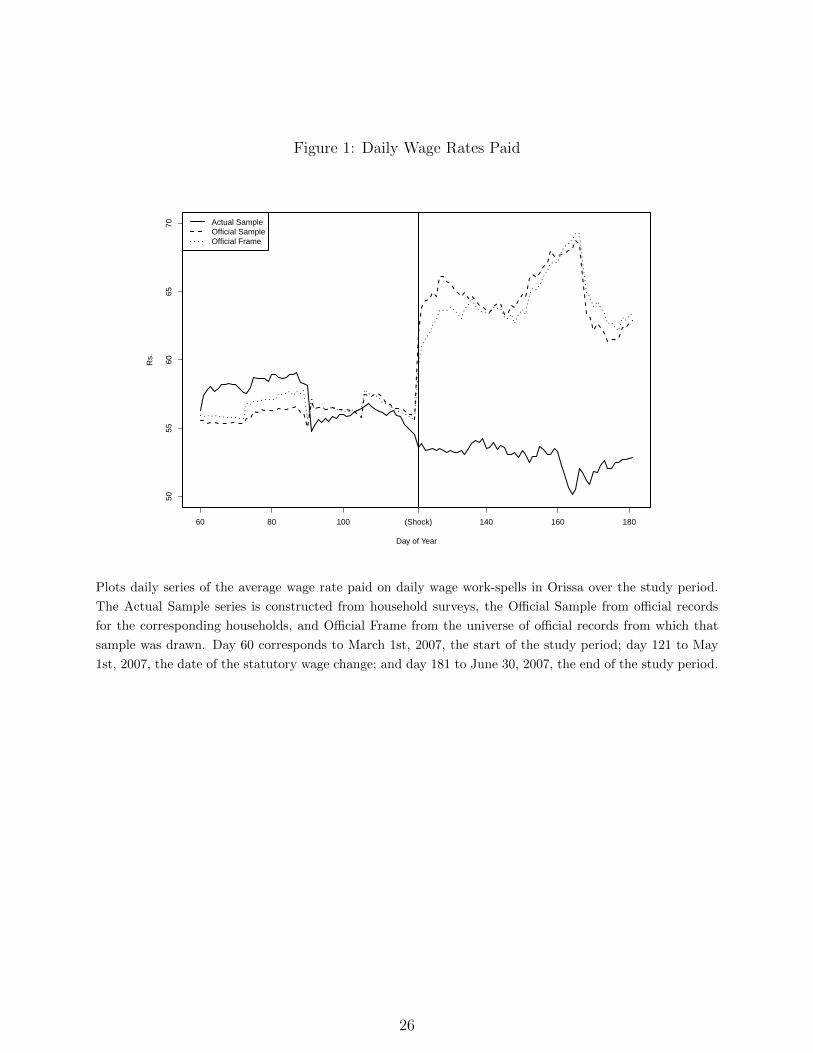
Figure 1: Daily Wage Rates Paid50
5560
6570
Day of Year
Rs.
Actual SampleOfficial SampleOfficial Frame
60 80 100 140 160 180(Shock)
Plots daily series of the average wage rate paid on daily wage work-spells in Orissa over the study period.
The Actual Sample series is constructed from household surveys, the Official Sample from official records
for the corresponding households, and Official Frame from the universe of official records from which that
sample was drawn. Day 60 corresponds to March 1st, 2007, the start of the study period; day 121 to May
1st, 2007, the date of the statutory wage change; and day 181 to June 30, 2007, the end of the study period.
26
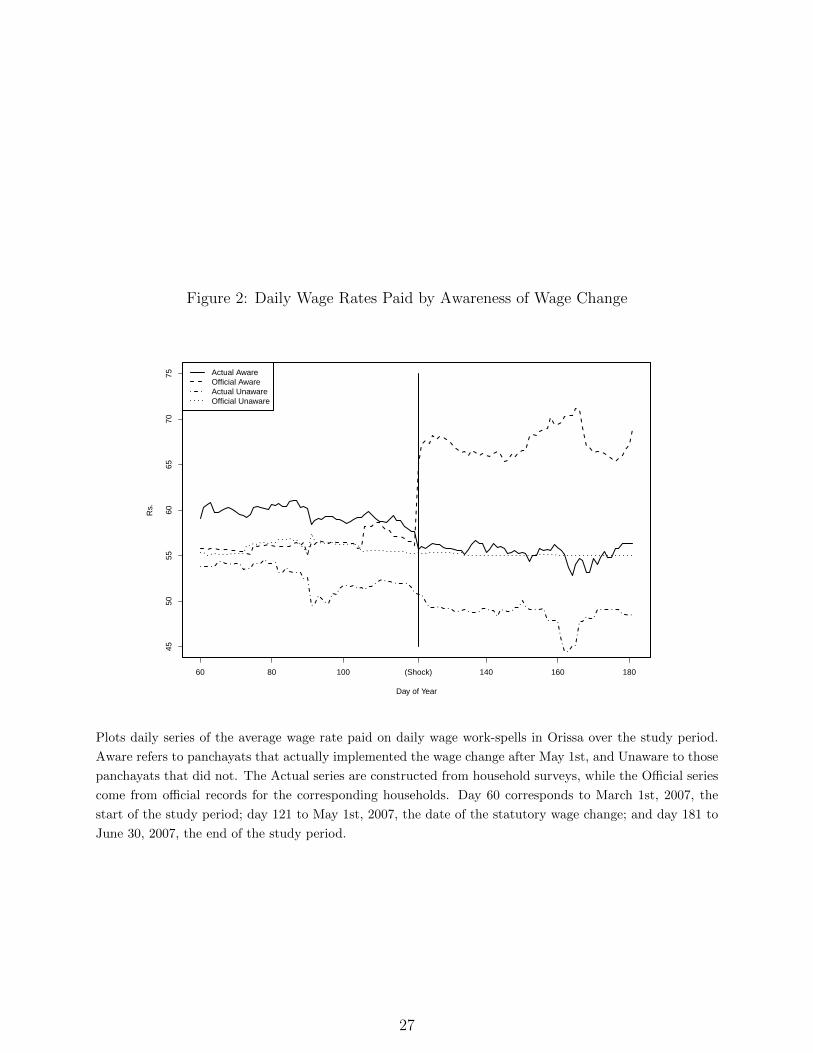
Figure 2: Daily Wage Rates Paid by Awareness of Wage Change
4550
5560
6570
75
Day of Year
Rs.
Actual AwareOfficial AwareActual UnawareOfficial Unaware
60 80 100 140 160 180(Shock)
Plots daily series of the average wage rate paid on daily wage work-spells in Orissa over the study period.
Aware refers to panchayats that actually implemented the wage change after May 1st, and Unaware to those
panchayats that did not. The Actual series are constructed from household surveys, while the Official series
come from official records for the corresponding households. Day 60 corresponds to March 1st, 2007, the
start of the study period; day 121 to May 1st, 2007, the date of the statutory wage change; and day 181 to
June 30, 2007, the end of the study period.
27
Figure 3: Factor Endowments Shift the Upper Portion of the Wage Distribution
0.2 0.4 0.6 0.8
−10
−5
05
10
Quantile
Coe
ffici
ent
●
●
●
●
●
●
●
●
●
●
●
●
●●
●
●
●
●
●
●
●●
●
●
●●
●
●
Log(Farmland)Log(Pop)
Plots coefficients from quantile regressions of NREGS wage received on factor endowments, controlling for
month dummies. For example, the points at x = 0.5 correspond to the coefficients from a median regression
of wages on log cultivatable land, log population, and month dummies. The dotted lines denote quantile-wise
95% confidence intervals.
28

Table 1: Characteristics of Spells in Universe, Sample, and Reached Sample
All Spells Sampled Spells Reached SpellsVariable N Mean SD N Mean SD N Mean SD p-valueAge 111,109 37.60 14.93 7,123 37.37 13.60 4,791 37.55 13.28 0.33Male 111,057 0.54 0.50 7,123 0.54 0.50 4,791 0.54 0.50 0.67SC/ST 111,109 0.78 0.41 7,123 0.79 0.41 4,791 0.77 0.42 0.05Post 111,172 0.40 0.49 7,126 0.43 0.49 4,794 0.42 0.49 0.57Spell Length 111,172 11.13 2.92 7,126 11.14 3.01 4,794 11.09 3.14 0.33Wage Spell 111,172 0.83 0.37 7,126 0.83 0.38 4,794 0.84 0.36 0.20Daily Rate 111,172 63.48 17.24 7,126 64.37 20.34 4,794 63.90 18.92 0.30
Notes:
1. Reports summary statistics at the work spell level using official records for (a) the universe of spellssampled from, (b) the initial sample of work spells we drew, and (c) the work spells done by householdswe were ultimately able to interview.
2. The last column reports the p-value from a regression of the variable in question on an indicator forwhether or not the observation is in our analysis sample (conditional on being in our initial sample),with standard errors clustered at the panchayat level.
3. “SC/ST” stands for “Scheduled Caste/ Scheduled Tribe”, historically discriminated minorities. “Post”is an indicator equal to 1 for the period after May 1, 2007, the date of the wage change. “Wage Spell”refers to a spell done on a daily wage project (as opposed to a piece rate project).
29
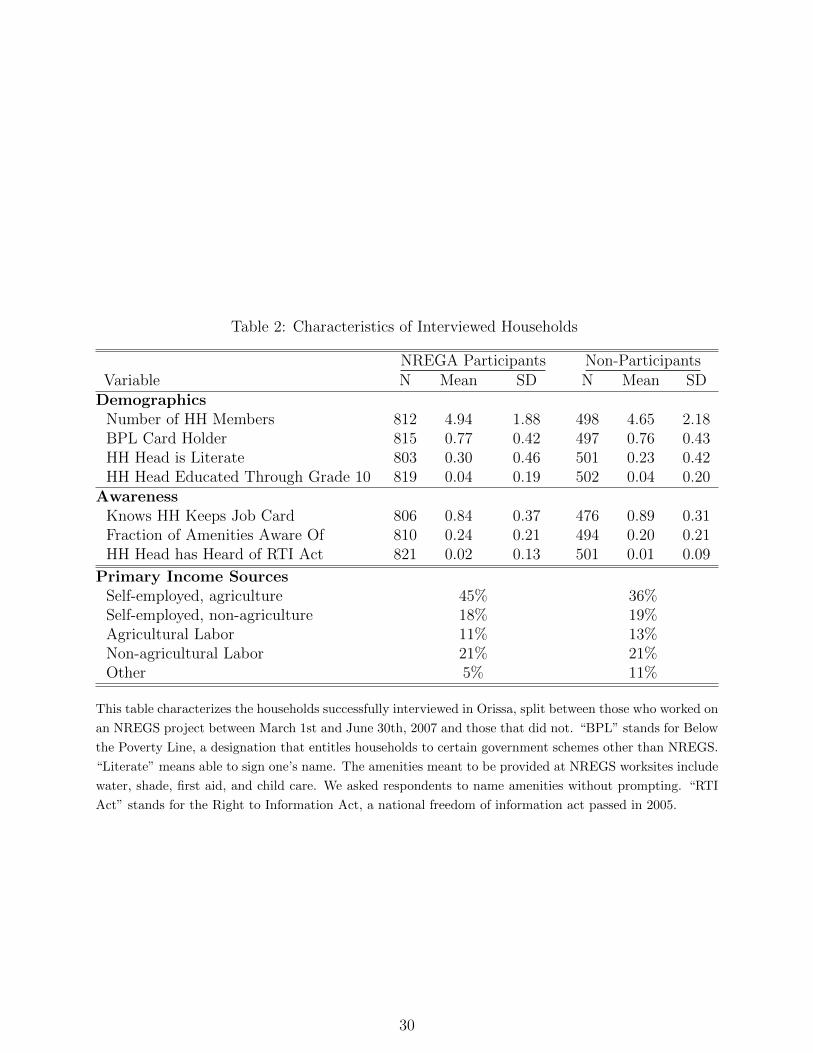
Table 2: Characteristics of Interviewed Households
NREGA Participants Non-ParticipantsVariable N Mean SD N Mean SD
DemographicsNumber of HH Members 812 4.94 1.88 498 4.65 2.18BPL Card Holder 815 0.77 0.42 497 0.76 0.43HH Head is Literate 803 0.30 0.46 501 0.23 0.42HH Head Educated Through Grade 10 819 0.04 0.19 502 0.04 0.20
AwarenessKnows HH Keeps Job Card 806 0.84 0.37 476 0.89 0.31Fraction of Amenities Aware Of 810 0.24 0.21 494 0.20 0.21HH Head has Heard of RTI Act 821 0.02 0.13 501 0.01 0.09
Primary Income SourcesSelf-employed, agriculture 45% 36%Self-employed, non-agriculture 18% 19%Agricultural Labor 11% 13%Non-agricultural Labor 21% 21%Other 5% 11%
This table characterizes the households successfully interviewed in Orissa, split between those who worked on
an NREGS project between March 1st and June 30th, 2007 and those that did not. “BPL” stands for Below
the Poverty Line, a designation that entitles households to certain government schemes other than NREGS.
“Literate” means able to sign one’s name. The amenities meant to be provided at NREGS worksites include
water, shade, first aid, and child care. We asked respondents to name amenities without prompting. “RTI
Act” stands for the Right to Information Act, a national freedom of information act passed in 2005.
30
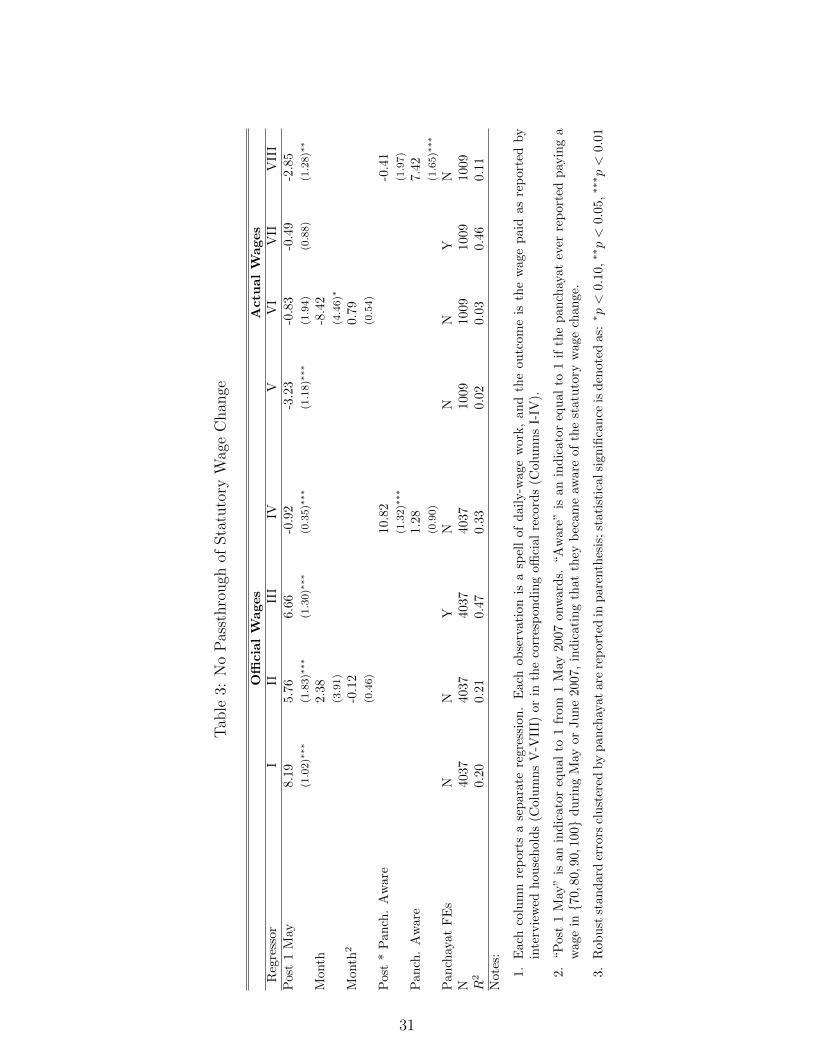
Tab
le3:
No
Pas
sthro
ugh
ofSta
tuto
ryW
age
Chan
ge
Offi
cia
lW
ages
Actu
al
Wages
Reg
ress
orI
IIII
IIV
VV
IV
IIV
III
Pos
t1
May
8.19
5.76
6.6
6-0
.92
-3.2
3-0
.83
-0.4
9-2
.85
(1.02)∗
∗∗(1.83)∗
∗∗(1.30)∗
∗∗(0.35)∗
∗∗(1.18)∗
∗∗(1.94)
(0.88)
(1.28)∗
∗
Mon
th2.
38-8
.42
(3.91)
(4.46)∗
Mon
th2
-0.1
20.7
9(0.46)
(0.54)
Pos
t*
Pan
ch.
Aw
are
10.8
2-0
.41
(1.32)∗
∗∗(1.97)
Pan
ch.
Aw
are
1.2
87.4
2(0.90)
(1.65)∗
∗∗
Pan
chay
atF
Es
NN
YN
NN
YN
N40
3740
374037
4037
1009
1009
1009
1009
R2
0.20
0.21
0.4
70.3
30.0
20.0
30.4
60.1
1N
otes
:
1.E
ach
colu
mn
rep
orts
ase
par
ate
regr
essi
on.
Eac
hob
serv
ati
on
isa
spel
lof
dail
y-w
age
work
,an
dth
eou
tcom
eis
the
wage
paid
as
rep
ort
edby
inte
rvie
wed
hou
seh
old
s(C
olu
mn
sV
-VII
I)or
inth
eco
rres
pon
din
goffi
cial
reco
rds
(Colu
mn
sI-
IV).
2.“P
ost
1M
ay”
isan
ind
icat
oreq
ual
to1
from
1M
ay2007
onw
ard
s.“A
ware
”is
an
ind
icato
req
ual
to1
ifth
ep
an
chay
at
ever
rep
ort
edp
ayin
ga
wag
ein{7
0,8
0,90,1
00}
du
rin
gM
ayor
Ju
ne
2007,
ind
icati
ng
that
they
bec
am
eaw
are
of
the
statu
tory
wage
chan
ge.
3.R
obu
stst
and
ard
erro
rscl
ust
ered
by
pan
chay
atar
ere
port
edin
pare
nth
esis
;st
ati
stic
alsi
gn
ifica
nce
isd
enote
das:∗ p<
0.10,∗∗p<
0.05,∗∗∗ p<
0.01
31
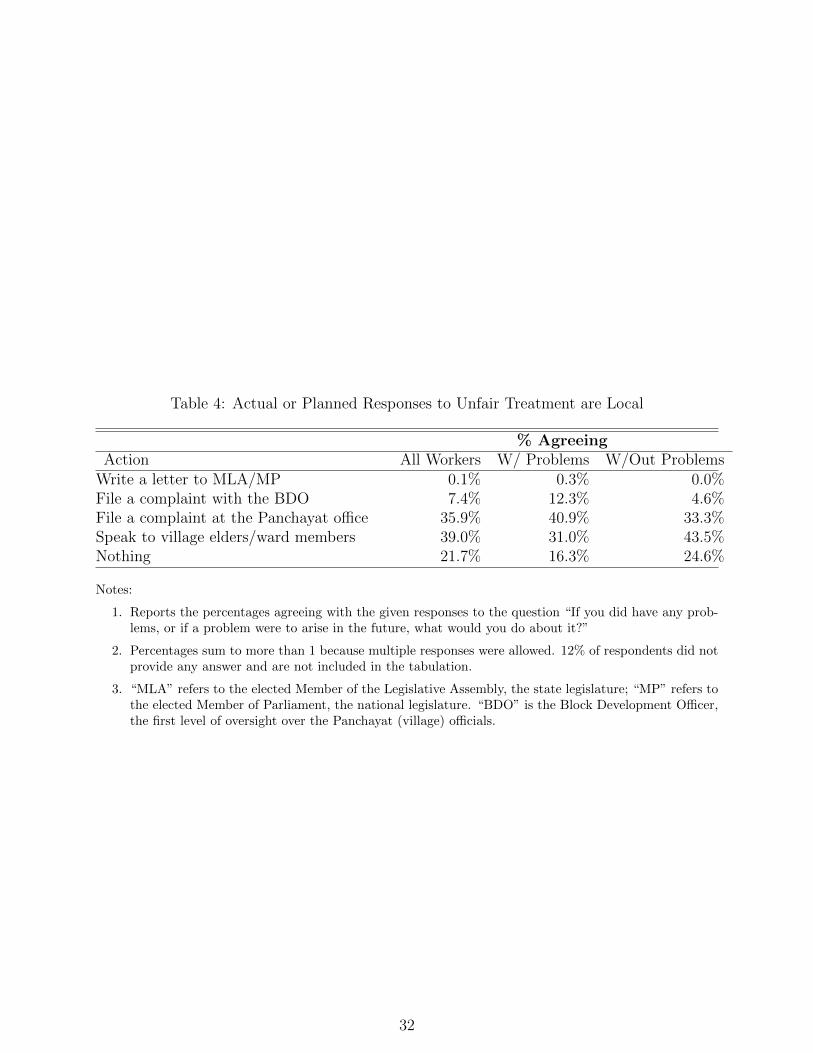
Table 4: Actual or Planned Responses to Unfair Treatment are Local
% AgreeingAction All Workers W/ Problems W/Out Problems
Write a letter to MLA/MP 0.1% 0.3% 0.0%File a complaint with the BDO 7.4% 12.3% 4.6%File a complaint at the Panchayat office 35.9% 40.9% 33.3%Speak to village elders/ward members 39.0% 31.0% 43.5%Nothing 21.7% 16.3% 24.6%
Notes:
1. Reports the percentages agreeing with the given responses to the question “If you did have any prob-lems, or if a problem were to arise in the future, what would you do about it?”
2. Percentages sum to more than 1 because multiple responses were allowed. 12% of respondents did notprovide any answer and are not included in the tabulation.
3. “MLA” refers to the elected Member of the Legislative Assembly, the state legislature; “MP” refers tothe elected Member of Parliament, the national legislature. “BDO” is the Block Development Officer,the first level of oversight over the Panchayat (village) officials.
32
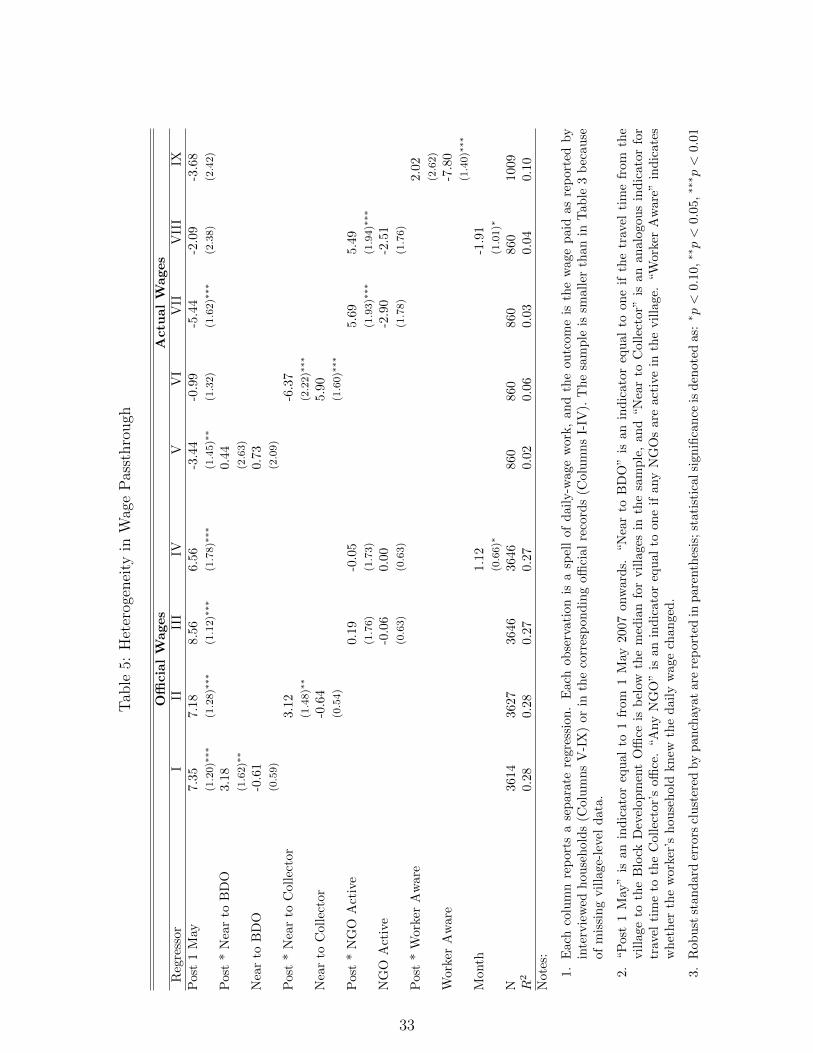
Tab
le5:
Het
erog
enei
tyin
Wag
eP
asst
hro
ugh
Offi
cia
lW
ages
Actu
al
Wages
Reg
ress
orI
IIII
IIV
VV
IV
IIV
III
IXP
ost
1M
ay7.
357.
188.5
66.5
6-3
.44
-0.9
9-5
.44
-2.0
9-3
.68
(1.20)∗
∗∗(1.28)∗
∗∗(1.12)∗
∗∗(1.78)∗
∗∗(1.45)∗
∗(1.32)
(1.62)∗
∗∗(2.38)
(2.42)
Pos
t*
Nea
rto
BD
O3.
180.4
4(1.62)∗
∗(2.63)
Nea
rto
BD
O-0
.61
0.7
3(0.59)
(2.09)
Pos
t*
Nea
rto
Col
lect
or3.
12-6
.37
(1.48)∗
∗(2.22)∗
∗∗
Nea
rto
Col
lect
or-0
.64
5.9
0(0.54)
(1.60)∗
∗∗
Pos
t*
NG
OA
ctiv
e0.1
9-0
.05
5.6
95.4
9(1.76)
(1.73)
(1.93)∗
∗∗(1.94)∗
∗∗
NG
OA
ctiv
e-0
.06
0.0
0-2
.90
-2.5
1(0.63)
(0.63)
(1.78)
(1.76)
Pos
t*
Wor
ker
Aw
are
2.0
2(2.62)
Wor
ker
Aw
are
-7.8
0(1.40)∗
∗∗
Mon
th1.1
2-1
.91
(0.66)∗
(1.01)∗
N36
1436
273646
3646
860
860
860
860
1009
R2
0.28
0.28
0.2
70.2
70.0
20.0
60.0
30.0
40.1
0N
otes
:
1.E
ach
colu
mn
rep
orts
ase
par
ate
regr
essi
on.
Eac
hob
serv
ati
on
isa
spel
lof
dail
y-w
age
work
,an
dth
eou
tcom
eis
the
wage
paid
as
rep
ort
edby
inte
rvie
wed
hou
seh
old
s(C
olu
mn
sV
-IX
)or
inth
eco
rres
pon
din
goffi
cial
reco
rds
(Colu
mn
sI-
IV).
Th
esa
mp
leis
small
erth
an
inT
ab
le3
bec
au
seof
mis
sin
gvil
lage
-lev
eld
ata.
2.“P
ost
1M
ay”
isan
ind
icat
oreq
ual
to1
from
1M
ay2007
onw
ard
s.“N
ear
toB
DO
”is
an
ind
icato
req
ual
toon
eif
the
trav
elti
me
from
the
vil
lage
toth
eB
lock
Dev
elop
men
tO
ffice
isb
elow
the
med
ian
for
vil
lages
inth
esa
mp
le,
an
d“N
ear
toC
oll
ecto
r”is
an
an
alo
gou
sin
dic
ato
rfo
rtr
avel
tim
eto
the
Col
lect
or’s
office
.“A
ny
NG
O”
isan
ind
icato
req
ual
toon
eif
any
NG
Os
are
act
ive
inth
evil
lage.
“W
ork
erA
ware
”in
dic
ate
sw
het
her
the
wor
ker’
sh
ouse
hol
dkn
ewth
ed
aily
wage
chan
ged
.
3.R
obu
stst
and
ard
erro
rscl
ust
ered
by
pan
chay
atar
ere
port
edin
pare
nth
esis
;st
ati
stic
alsi
gn
ifica
nce
isd
enote
das:∗ p<
0.10,∗∗p<
0.05,∗∗∗ p<
0.01
33
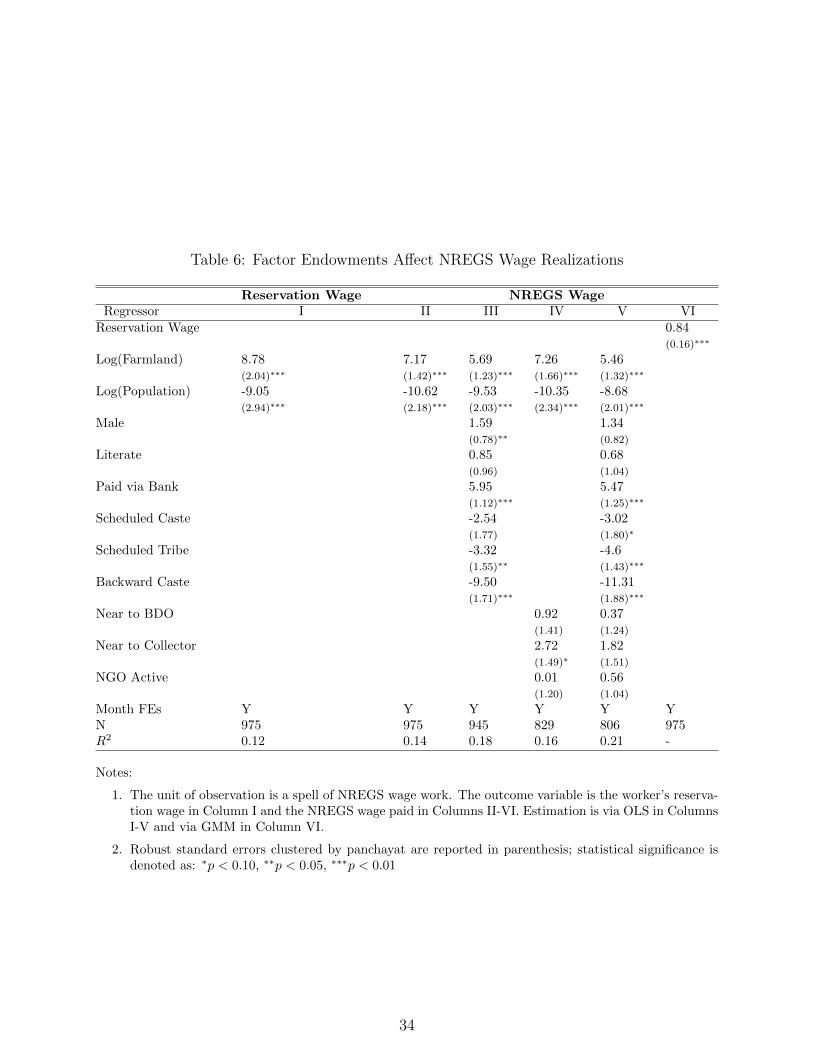
Table 6: Factor Endowments Affect NREGS Wage Realizations
Reservation Wage NREGS WageRegressor I II III IV V VI
Reservation Wage 0.84(0.16)∗∗∗
Log(Farmland) 8.78 7.17 5.69 7.26 5.46(2.04)∗∗∗ (1.42)∗∗∗ (1.23)∗∗∗ (1.66)∗∗∗ (1.32)∗∗∗
Log(Population) -9.05 -10.62 -9.53 -10.35 -8.68(2.94)∗∗∗ (2.18)∗∗∗ (2.03)∗∗∗ (2.34)∗∗∗ (2.01)∗∗∗
Male 1.59 1.34(0.78)∗∗ (0.82)
Literate 0.85 0.68(0.96) (1.04)
Paid via Bank 5.95 5.47(1.12)∗∗∗ (1.25)∗∗∗
Scheduled Caste -2.54 -3.02(1.77) (1.80)∗
Scheduled Tribe -3.32 -4.6(1.55)∗∗ (1.43)∗∗∗
Backward Caste -9.50 -11.31(1.71)∗∗∗ (1.88)∗∗∗
Near to BDO 0.92 0.37(1.41) (1.24)
Near to Collector 2.72 1.82(1.49)∗ (1.51)
NGO Active 0.01 0.56(1.20) (1.04)
Month FEs Y Y Y Y Y YN 975 975 945 829 806 975R2 0.12 0.14 0.18 0.16 0.21 -
Notes:
1. The unit of observation is a spell of NREGS wage work. The outcome variable is the worker’s reserva-tion wage in Column I and the NREGS wage paid in Columns II-VI. Estimation is via OLS in ColumnsI-V and via GMM in Column VI.
2. Robust standard errors clustered by panchayat are reported in parenthesis; statistical significance isdenoted as: ∗p < 0.10, ∗∗p < 0.05, ∗∗∗p < 0.01
34
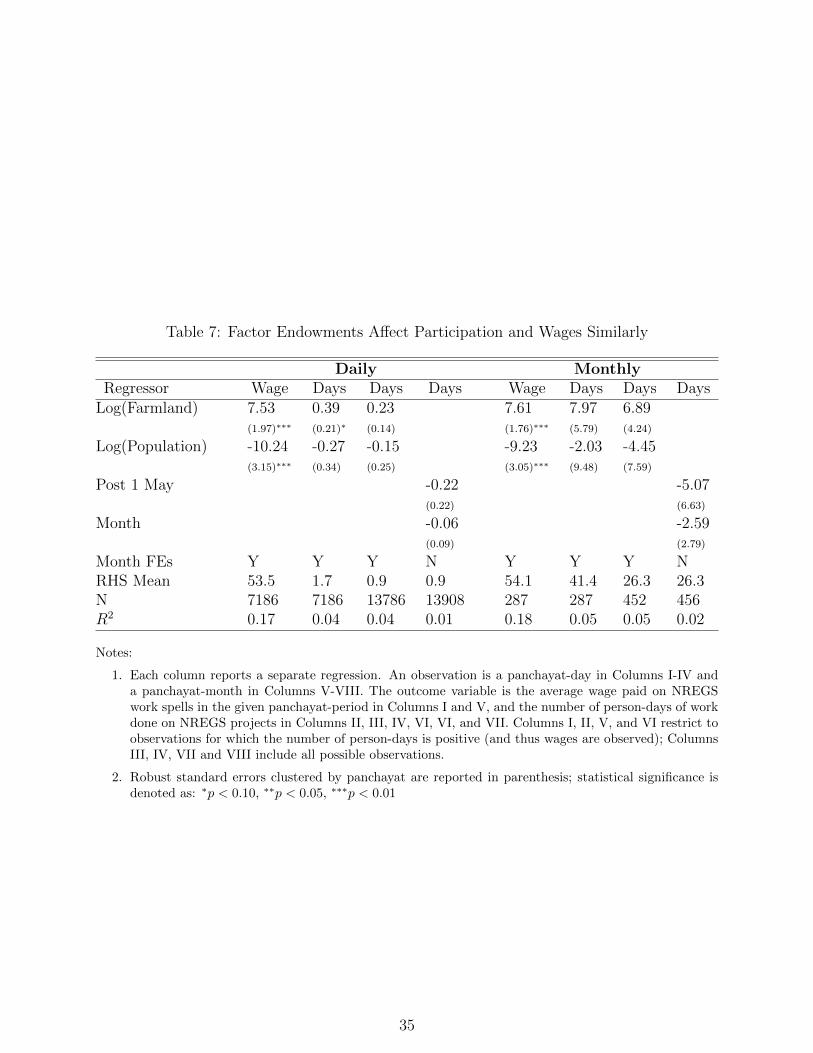
Table 7: Factor Endowments Affect Participation and Wages Similarly
Daily MonthlyRegressor Wage Days Days Days Wage Days Days Days
Log(Farmland) 7.53 0.39 0.23 7.61 7.97 6.89(1.97)∗∗∗ (0.21)∗ (0.14) (1.76)∗∗∗ (5.79) (4.24)
Log(Population) -10.24 -0.27 -0.15 -9.23 -2.03 -4.45(3.15)∗∗∗ (0.34) (0.25) (3.05)∗∗∗ (9.48) (7.59)
Post 1 May -0.22 -5.07(0.22) (6.63)
Month -0.06 -2.59(0.09) (2.79)
Month FEs Y Y Y N Y Y Y NRHS Mean 53.5 1.7 0.9 0.9 54.1 41.4 26.3 26.3N 7186 7186 13786 13908 287 287 452 456R2 0.17 0.04 0.04 0.01 0.18 0.05 0.05 0.02
Notes:
1. Each column reports a separate regression. An observation is a panchayat-day in Columns I-IV anda panchayat-month in Columns V-VIII. The outcome variable is the average wage paid on NREGSwork spells in the given panchayat-period in Columns I and V, and the number of person-days of workdone on NREGS projects in Columns II, III, IV, VI, VI, and VII. Columns I, II, V, and VI restrict toobservations for which the number of person-days is positive (and thus wages are observed); ColumnsIII, IV, VII and VIII include all possible observations.
2. Robust standard errors clustered by panchayat are reported in parenthesis; statistical significance isdenoted as: ∗p < 0.10, ∗∗p < 0.05, ∗∗∗p < 0.01
35
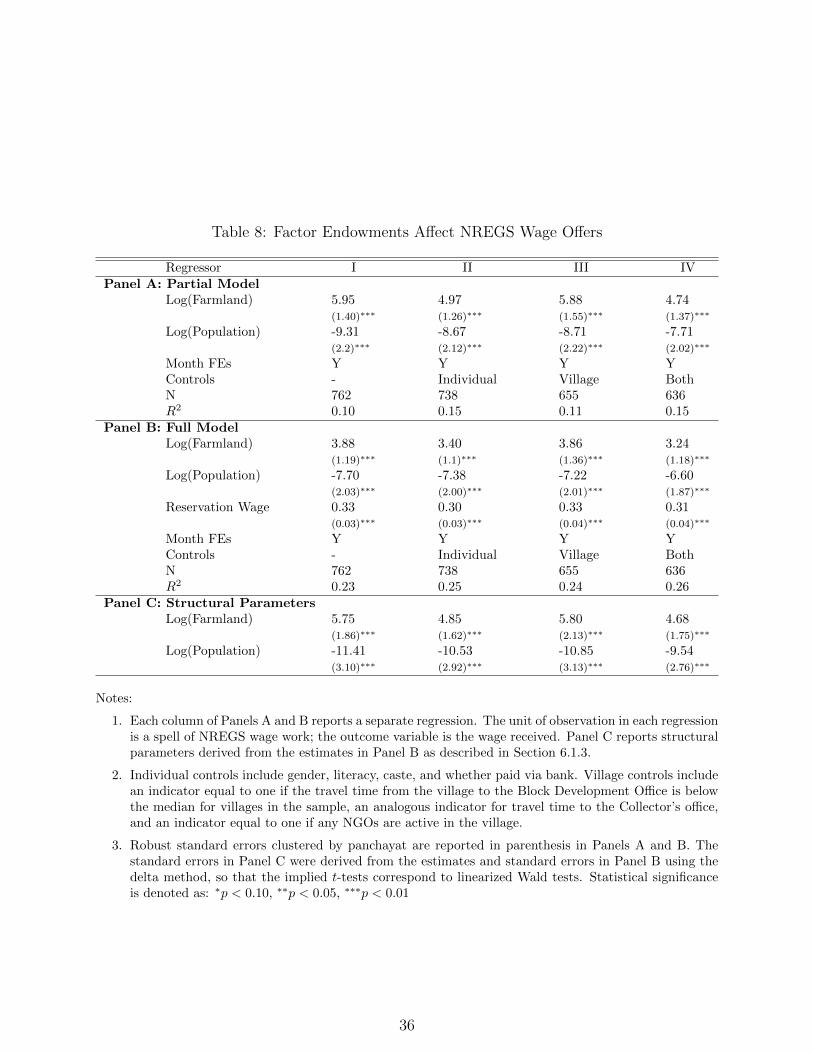
Table 8: Factor Endowments Affect NREGS Wage Offers
Regressor I II III IVPanel A: Partial Model
Log(Farmland) 5.95 4.97 5.88 4.74(1.40)∗∗∗ (1.26)∗∗∗ (1.55)∗∗∗ (1.37)∗∗∗
Log(Population) -9.31 -8.67 -8.71 -7.71(2.2)∗∗∗ (2.12)∗∗∗ (2.22)∗∗∗ (2.02)∗∗∗
Month FEs Y Y Y YControls - Individual Village BothN 762 738 655 636R2 0.10 0.15 0.11 0.15
Panel B: Full ModelLog(Farmland) 3.88 3.40 3.86 3.24
(1.19)∗∗∗ (1.1)∗∗∗ (1.36)∗∗∗ (1.18)∗∗∗
Log(Population) -7.70 -7.38 -7.22 -6.60(2.03)∗∗∗ (2.00)∗∗∗ (2.01)∗∗∗ (1.87)∗∗∗
Reservation Wage 0.33 0.30 0.33 0.31(0.03)∗∗∗ (0.03)∗∗∗ (0.04)∗∗∗ (0.04)∗∗∗
Month FEs Y Y Y YControls - Individual Village BothN 762 738 655 636R2 0.23 0.25 0.24 0.26
Panel C: Structural ParametersLog(Farmland) 5.75 4.85 5.80 4.68
(1.86)∗∗∗ (1.62)∗∗∗ (2.13)∗∗∗ (1.75)∗∗∗
Log(Population) -11.41 -10.53 -10.85 -9.54(3.10)∗∗∗ (2.92)∗∗∗ (3.13)∗∗∗ (2.76)∗∗∗
Notes:
1. Each column of Panels A and B reports a separate regression. The unit of observation in each regressionis a spell of NREGS wage work; the outcome variable is the wage received. Panel C reports structuralparameters derived from the estimates in Panel B as described in Section 6.1.3.
2. Individual controls include gender, literacy, caste, and whether paid via bank. Village controls includean indicator equal to one if the travel time from the village to the Block Development Office is belowthe median for villages in the sample, an analogous indicator for travel time to the Collector’s office,and an indicator equal to one if any NGOs are active in the village.
3. Robust standard errors clustered by panchayat are reported in parenthesis in Panels A and B. Thestandard errors in Panel C were derived from the estimates and standard errors in Panel B using thedelta method, so that the implied t-tests correspond to linearized Wald tests. Statistical significanceis denoted as: ∗p < 0.10, ∗∗p < 0.05, ∗∗∗p < 0.01
36