Embed Size (px)
Citation preview
THE MANUFACTURING ECONOMIC UPDATE
Dr. Chad Moutray
Chief Economist National Association of Manufacturers
Revised July 24, 2014
Manufacturing Output
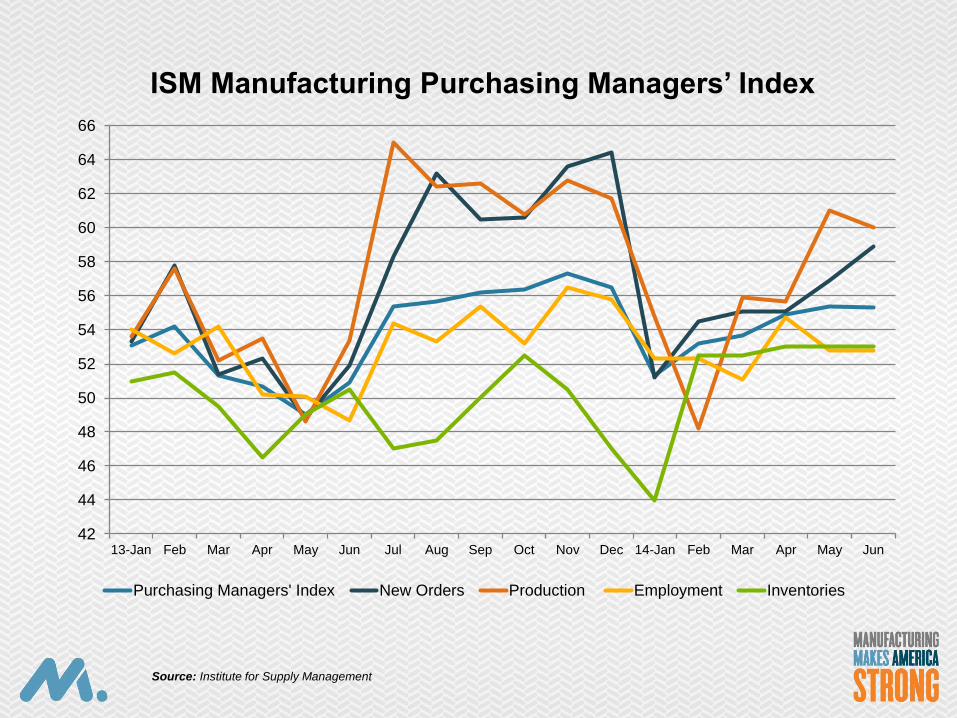
42
44
46
48
50
52
54
56
58
60
62
64
66
13-Jan Feb Mar Apr May Jun Jul Aug Sep Oct Nov Dec 14-Jan Feb Mar Apr May Jun
ISM Manufacturing Purchasing Managers’ Index
Purchasing Managers' Index New Orders Production Employment Inventories
Source: Institute for Supply Management
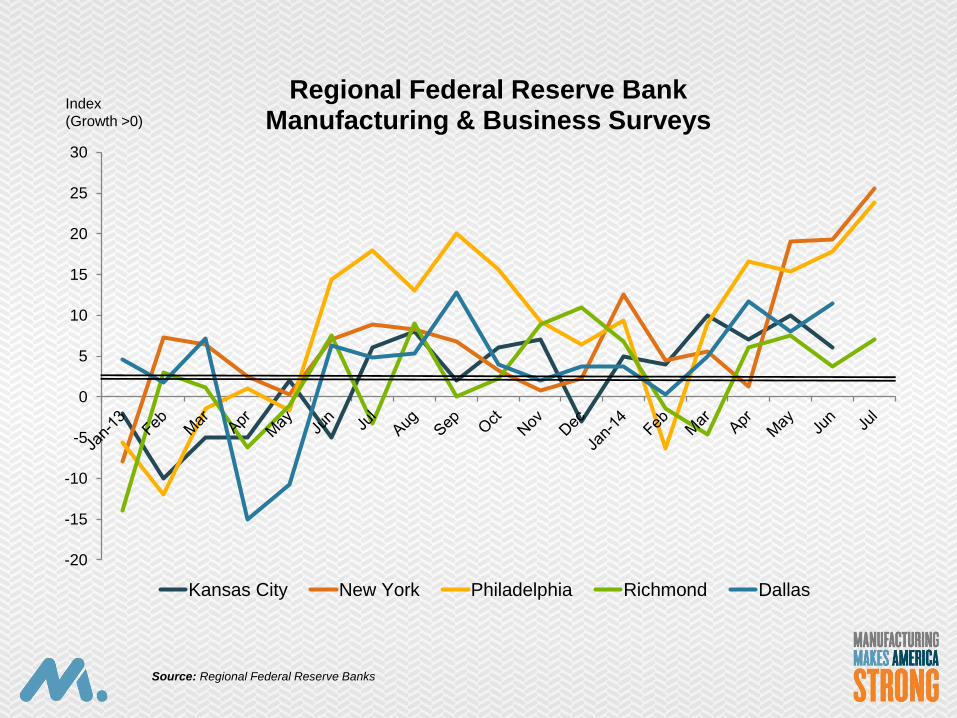
-20
-15
-10
-5
0
5
10
15
20
25
30
Regional Federal Reserve Bank Manufacturing & Business Surveys
Kansas City New York Philadelphia Richmond Dallas
Index
(Growth >0)
Source: Regional Federal Reserve Banks
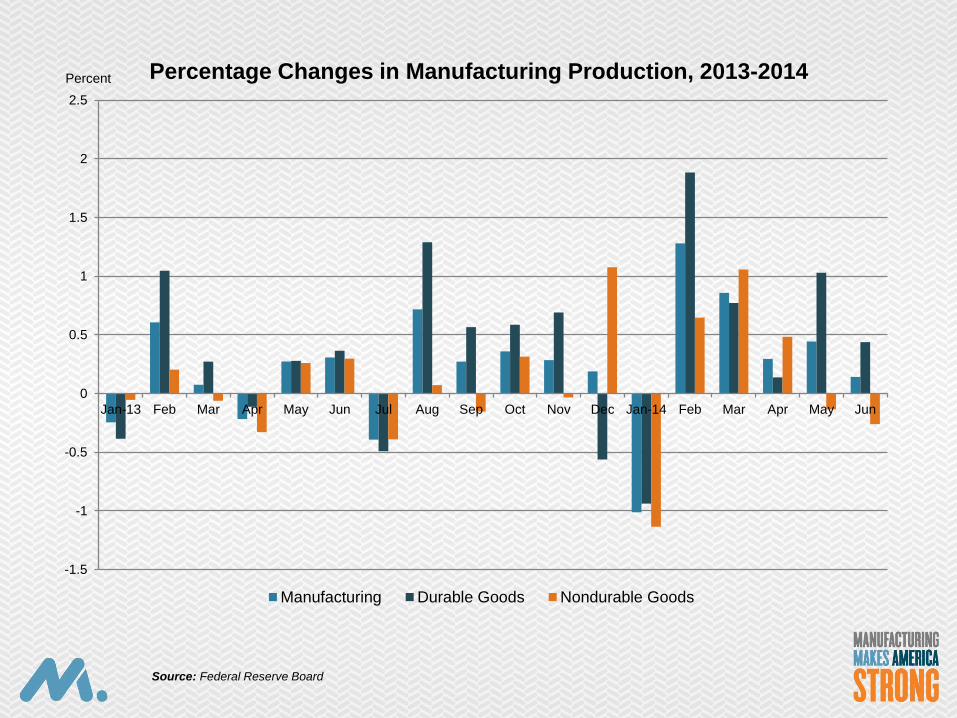
-1.5
-1
-0.5
0
0.5
1
1.5
2
2.5
Jan-13 Feb Mar Apr May Jun Jul Aug Sep Oct Nov Dec Jan-14 Feb Mar Apr May Jun
Percentage Changes in Manufacturing Production, 2013-2014
Manufacturing Durable Goods Nondurable Goods
Percent
Source: Federal Reserve Board
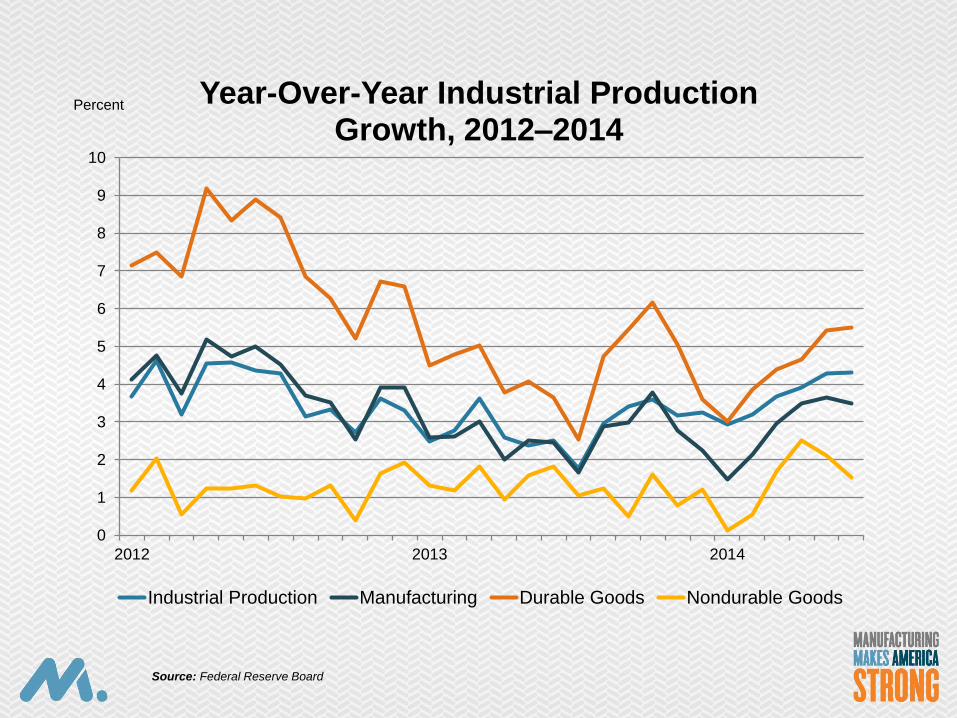
0
1
2
3
4
5
6
7
8
9
10
2012 2013 2014
Year-Over-Year Industrial Production Growth, 2012–2014
Industrial Production Manufacturing Durable Goods Nondurable Goods
Percent
Source: Federal Reserve Board

Economic Outlook
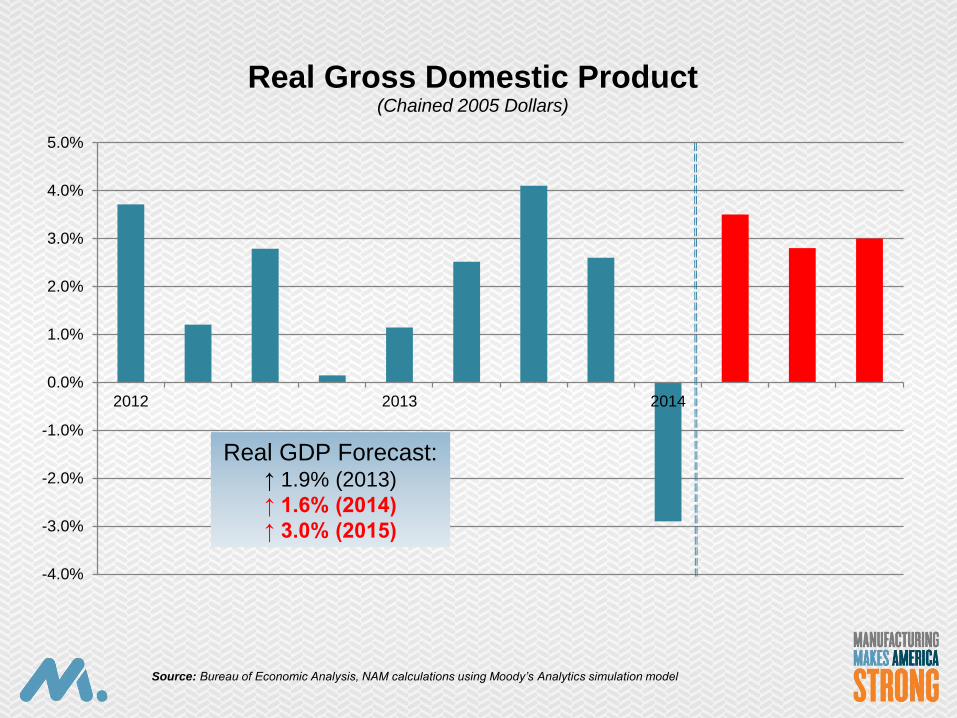
-4.0%
-3.0%
-2.0%
-1.0%
0.0%
1.0%
2.0%
3.0%
4.0%
5.0%
2012 2013 2014
Real Gross Domestic Product (Chained 2005 Dollars)
Real GDP Forecast: ↑ 1.9% (2013)
↑ 1.6% (2014)
↑ 3.0% (2015)
Source: Bureau of Economic Analysis, NAM calculations using Moody’s Analytics simulation model
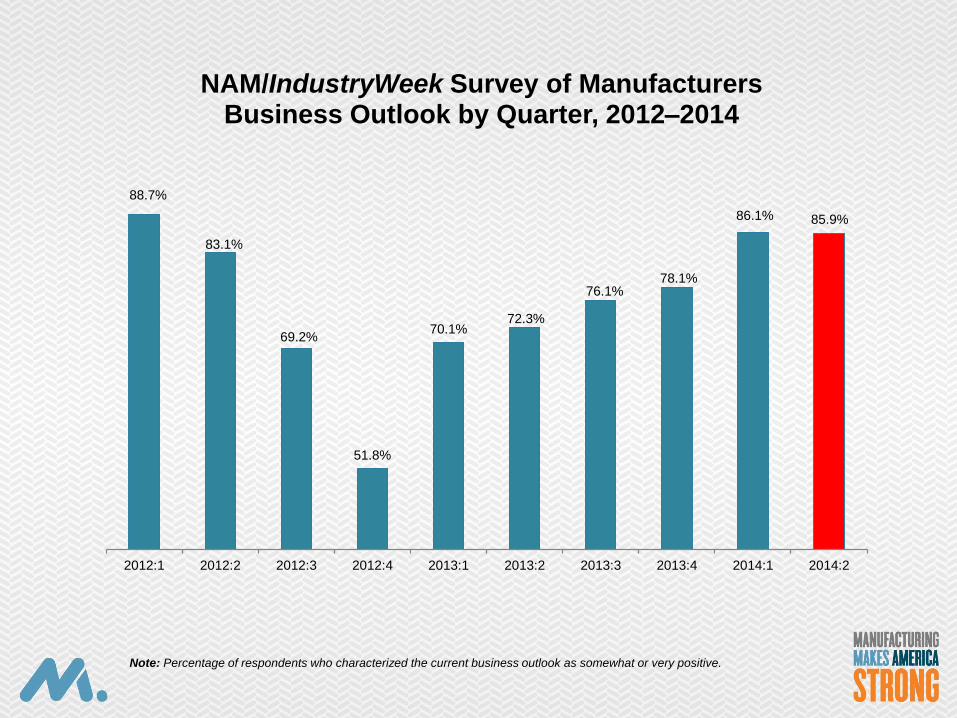
88.7%
83.1%
69.2%
51.8%
70.1% 72.3%
76.1% 78.1%
86.1% 85.9%
2012:1 2012:2 2012:3 2012:4 2013:1 2013:2 2013:3 2013:4 2014:1 2014:2
NAM/IndustryWeek Survey of Manufacturers Business Outlook by Quarter, 2012–2014
Note: Percentage of respondents who characterized the current business outlook as somewhat or very positive.
0.0
1.0
2.0
3.0
4.0
5.0
2010 2011 2012 2013 Q1:14 Q2:14
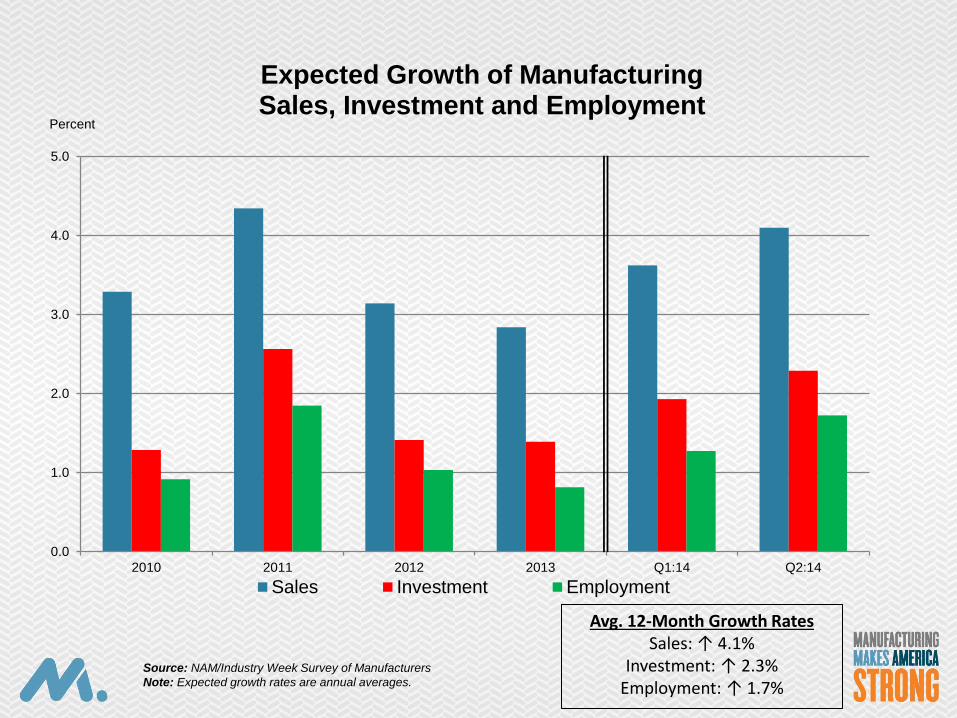
Expected Growth of Manufacturing Sales, Investment and Employment
Sales Investment Employment
Percent
Avg. 12-Month Growth Rates Sales: ↑ 4.1%
Investment: ↑ 2.3% Employment: ↑ 1.7%
Source: NAM/Industry Week Survey of Manufacturers
Note: Expected growth rates are annual averages.
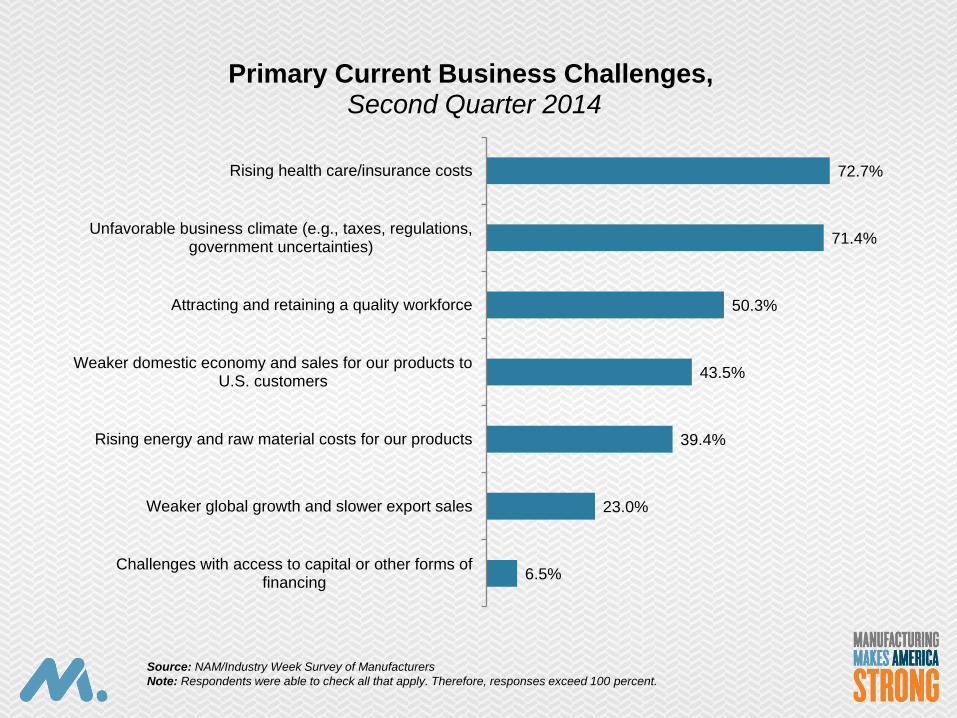
6.5%
23.0%
39.4%
43.5%
50.3%
71.4%
72.7%
Challenges with access to capital or other forms offinancing
Weaker global growth and slower export sales
Rising energy and raw material costs for our products
Weaker domestic economy and sales for our products toU.S. customers
Attracting and retaining a quality workforce
Unfavorable business climate (e.g., taxes, regulations,government uncertainties)
Rising health care/insurance costs
Primary Current Business Challenges, Second Quarter 2014
Source: NAM/Industry Week Survey of Manufacturers
Note: Respondents were able to check all that apply. Therefore, responses exceed 100 percent.

International Economic Update, including Exports
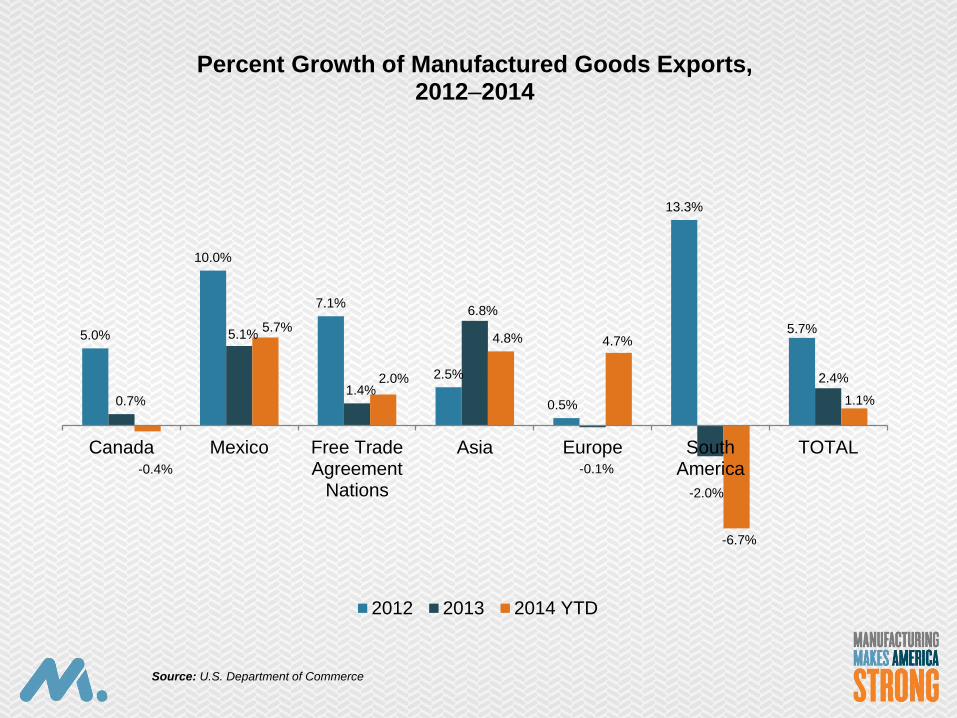
5.0%
10.0%
7.1%
2.5%
0.5%
13.3%
5.7%
0.7%
5.1%
1.4%
6.8%
-0.1%
-2.0%
2.4%
-0.4%
5.7%
2.0%
4.8% 4.7%
-6.7%
1.1%
Canada Mexico Free TradeAgreement
Nations
Asia Europe SouthAmerica
TOTAL
Percent Growth of Manufactured Goods Exports, 2012–2014
2012 2013 2014 YTD
Source: U.S. Department of Commerce
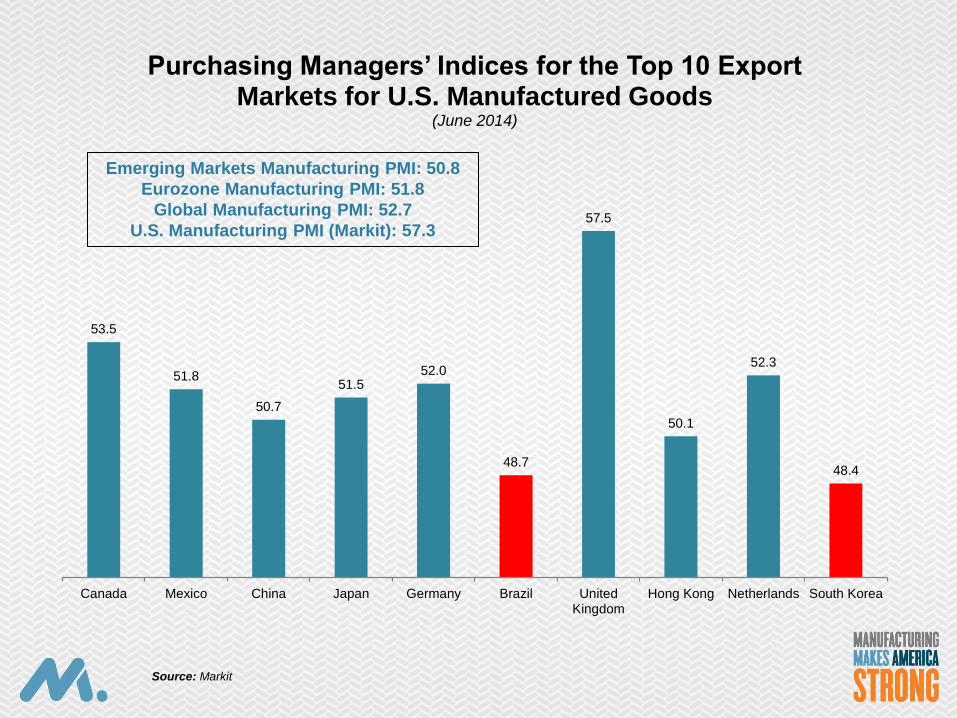
53.5
51.8
50.7
51.5 52.0
48.7
57.5
50.1
52.3
48.4
Canada Mexico China Japan Germany Brazil UnitedKingdom
Hong Kong Netherlands South Korea
Purchasing Managers’ Indices for the Top 10 Export Markets for U.S. Manufactured Goods
(June 2014)
Emerging Markets Manufacturing PMI: 50.8
Eurozone Manufacturing PMI: 51.8
Global Manufacturing PMI: 52.7
U.S. Manufacturing PMI (Markit): 57.3
Source: Markit
Manufacturing Employment
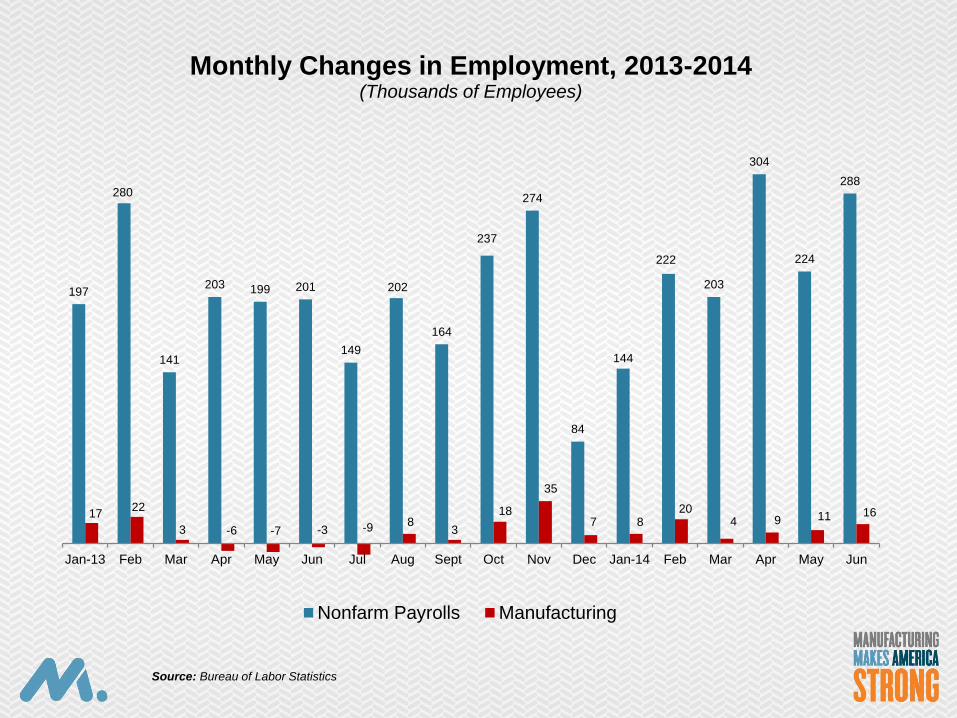
197
280
141
203 199 201
149
202
164
237
274
84
144
222
203
304
224
288
17 22
3 -6 -7 -3 -9 8 3
18
35
7 8 20
4 9 11 16
Jan-13 Feb Mar Apr May Jun Jul Aug Sept Oct Nov Dec Jan-14 Feb Mar Apr May Jun
Monthly Changes in Employment, 2013-2014 (Thousands of Employees)
Nonfarm Payrolls Manufacturing
Source: Bureau of Labor Statistics
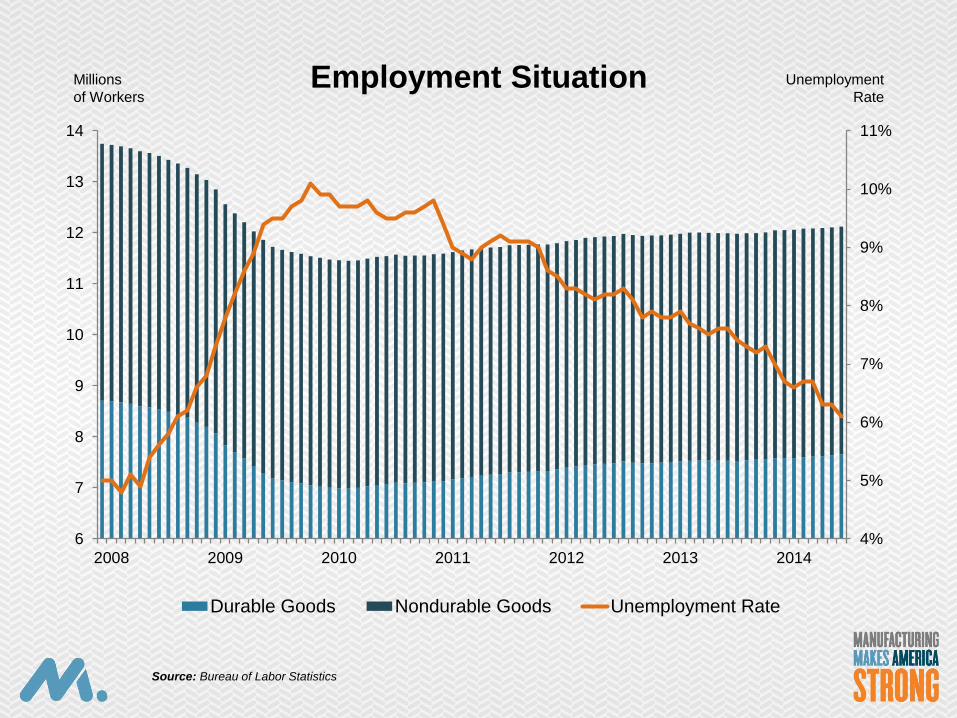
4%
5%
6%
7%
8%
9%
10%
11%
6
7
8
9
10
11
12
13
14
2008 2009 2010 2011 2012 2013 2014
Employment Situation
Durable Goods Nondurable Goods Unemployment Rate
Millions
of Workers
Unemployment
Rate
Source: Bureau of Labor Statistics
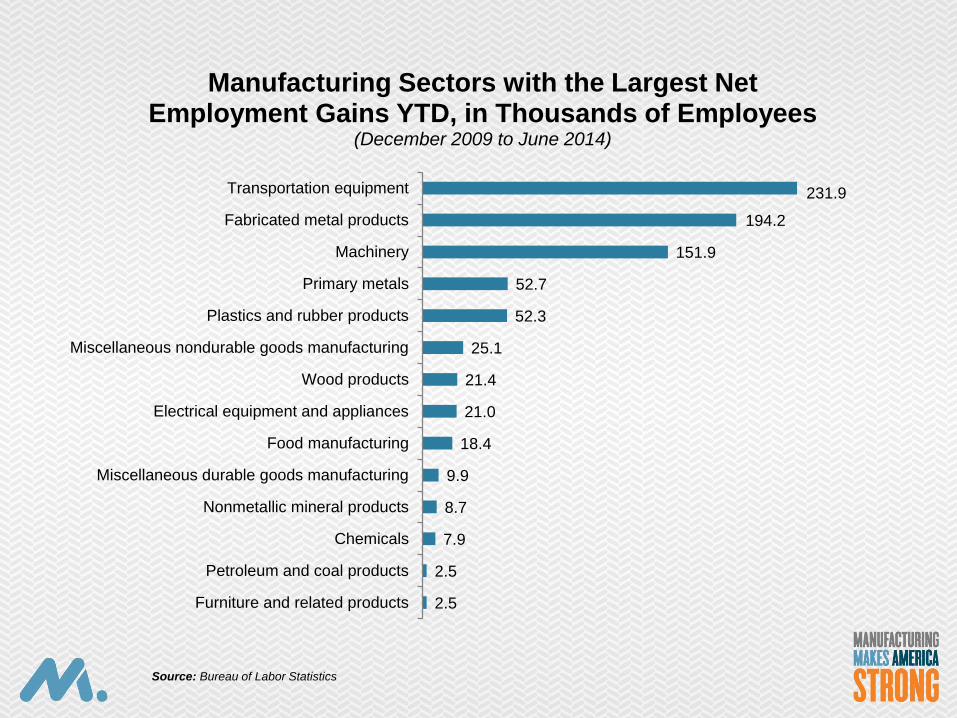
2.5
2.5
7.9
8.7
9.9
18.4
21.0
21.4
25.1
52.3
52.7
151.9
194.2
231.9
Furniture and related products
Petroleum and coal products
Chemicals
Nonmetallic mineral products
Miscellaneous durable goods manufacturing
Food manufacturing
Electrical equipment and appliances
Wood products
Miscellaneous nondurable goods manufacturing
Plastics and rubber products
Primary metals
Machinery
Fabricated metal products
Transportation equipment
Manufacturing Sectors with the Largest Net Employment Gains YTD, in Thousands of Employees
(December 2009 to June 2014)
Source: Bureau of Labor Statistics
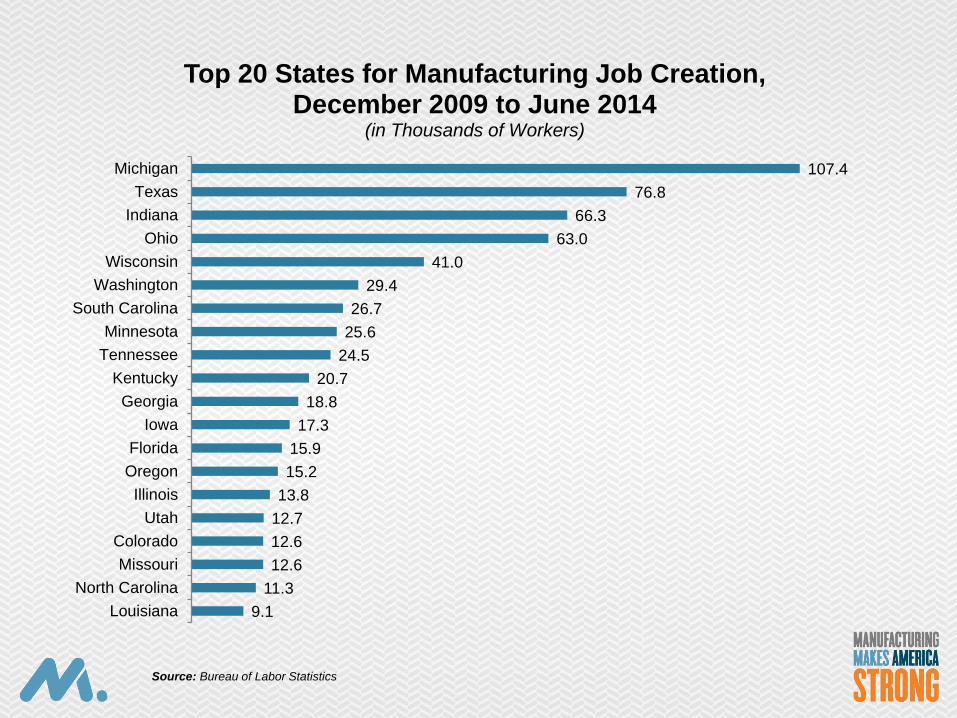
9.1
11.3
12.6
12.6
12.7
13.8
15.2
15.9
17.3
18.8
20.7
24.5
25.6
26.7
29.4
41.0
63.0
66.3
76.8
107.4
Louisiana
North Carolina
Missouri
Colorado
Utah
Illinois
Oregon
Florida
Iowa
Georgia
Kentucky
Tennessee
Minnesota
South Carolina
Washington
Wisconsin
Ohio
Indiana
Texas
Michigan
Top 20 States for Manufacturing Job Creation, December 2009 to June 2014
(in Thousands of Workers)
Source: Bureau of Labor Statistics
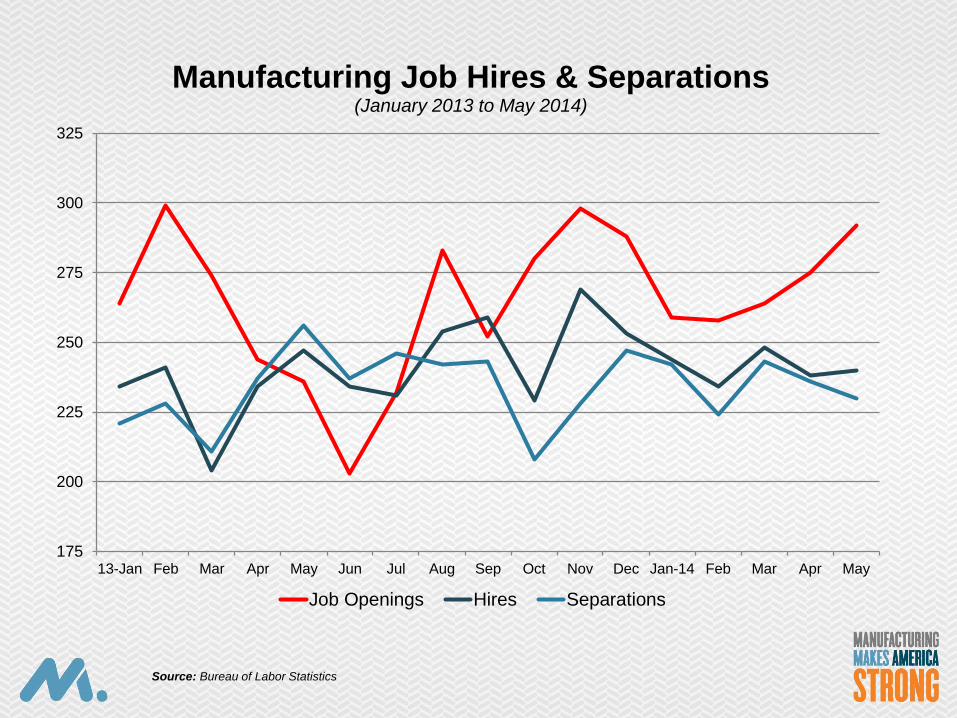
175
200
225
250
275
300
325
13-Jan Feb Mar Apr May Jun Jul Aug Sep Oct Nov Dec Jan-14 Feb Mar Apr May
Manufacturing Job Hires & Separations (January 2013 to May 2014)
Job Openings Hires Separations
Source: Bureau of Labor Statistics

Other Topics:
Consumer spending, housing and pricing pressures
0
1
2
3
4
5
6
7
8
9
10
-2
-1
0
1
2
3
4
5
6
7
8
9
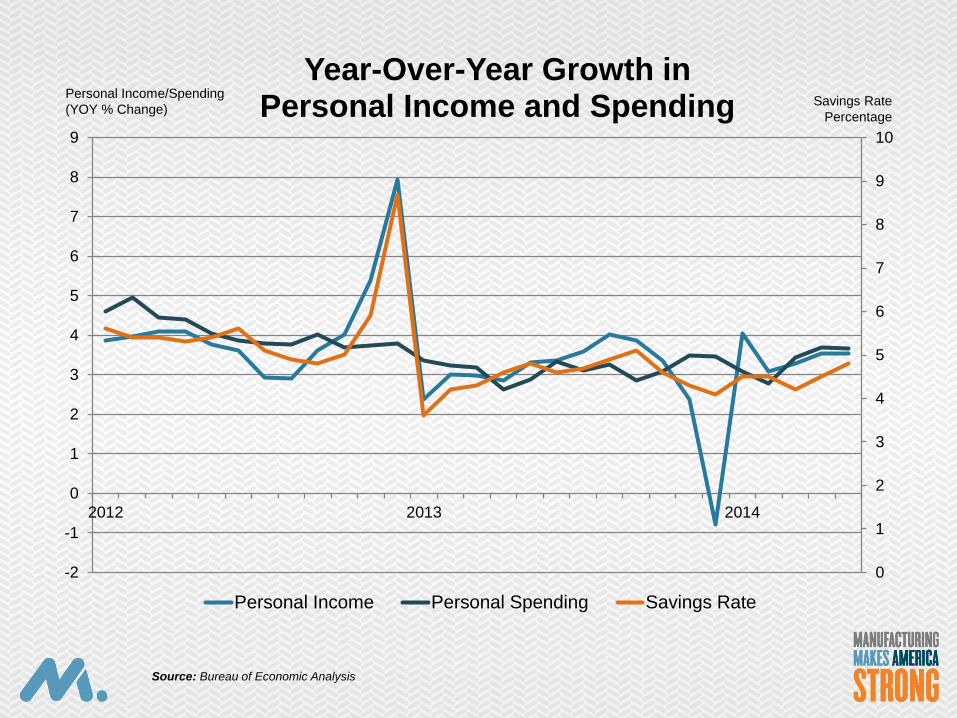
2012 2013 2014
Year-Over-Year Growth in Personal Income and Spending
Personal Income Personal Spending Savings Rate
Personal Income/Spending
(YOY % Change)
Source: Bureau of Economic Analysis
Savings Rate
Percentage
0%
1%
2%
3%
4%
5%
6%
7%
8%
2012 2013 2014
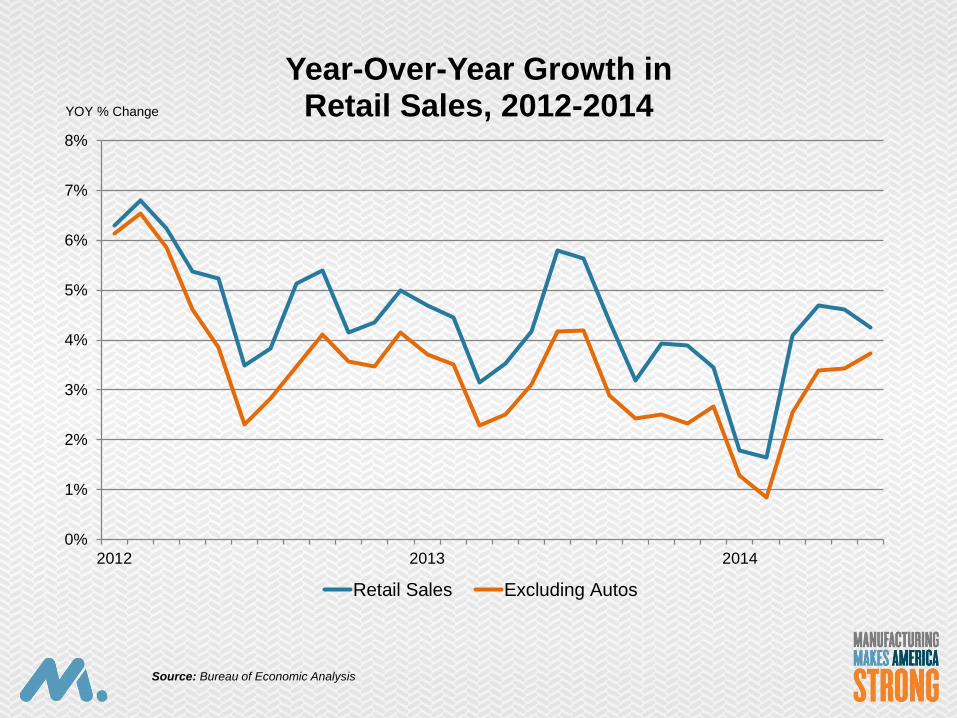
Year-Over-Year Growth in Retail Sales, 2012-2014
Retail Sales Excluding Autos
YOY % Change
Source: Bureau of Economic Analysis
70
75
80
85
90
95
100
105
110
20
30
40
50
60
70
80
90
100
110
120
2005 2006 2007 2008 2009 2010 2011 2012 2013 2014
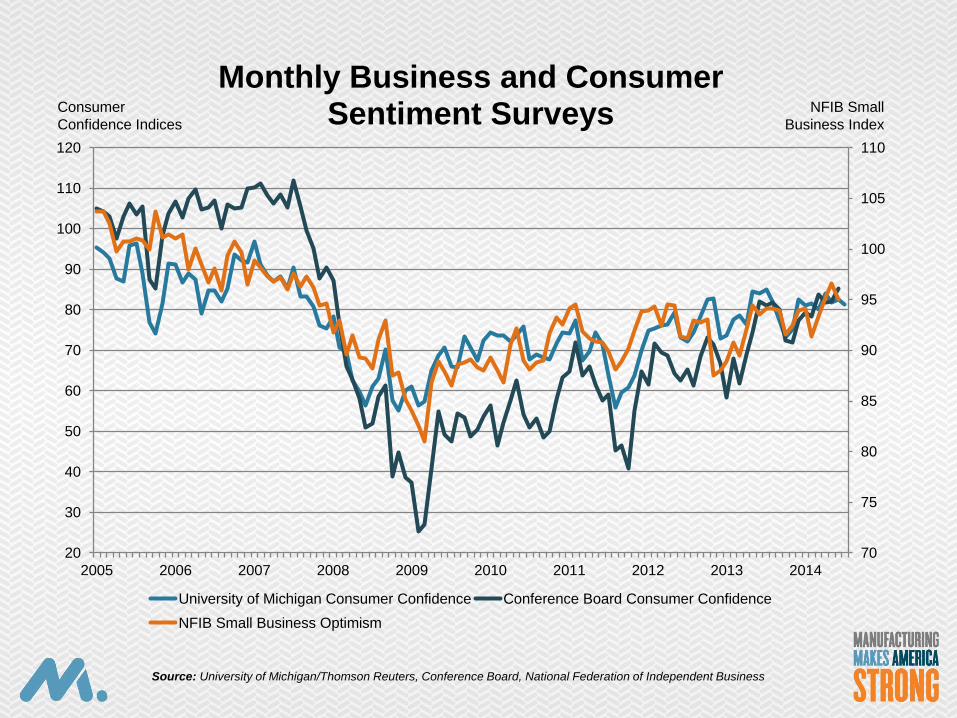
Monthly Business and Consumer Sentiment Surveys
University of Michigan Consumer Confidence Conference Board Consumer Confidence
NFIB Small Business Optimism
Consumer
Confidence Indices
NFIB Small
Business Index
Source: University of Michigan/Thomson Reuters, Conference Board, National Federation of Independent Business
8
10
12
14
16
18
20
22
2005 2006 2007 2008 2009 2010 2011 2012 2013 2014
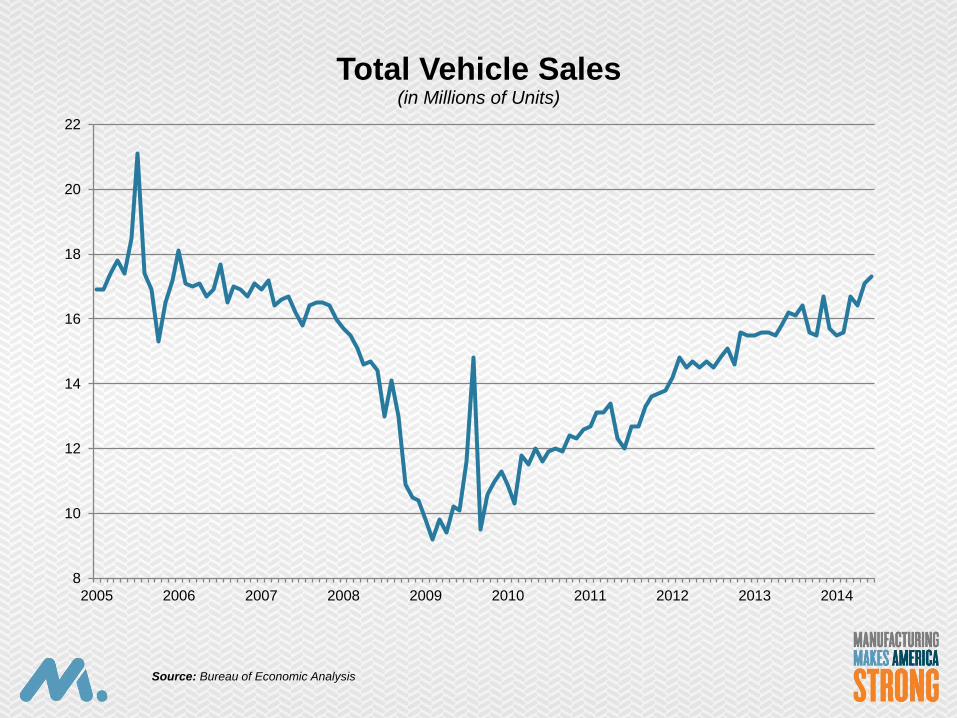
Total Vehicle Sales (in Millions of Units)
Source: Bureau of Economic Analysis
0
10
20
30
40
50
60
70
80
0
500
1,000
1,500
2,000
2,500
2005 2006 2007 2008 2009 2010 2011 2012 2013 2014
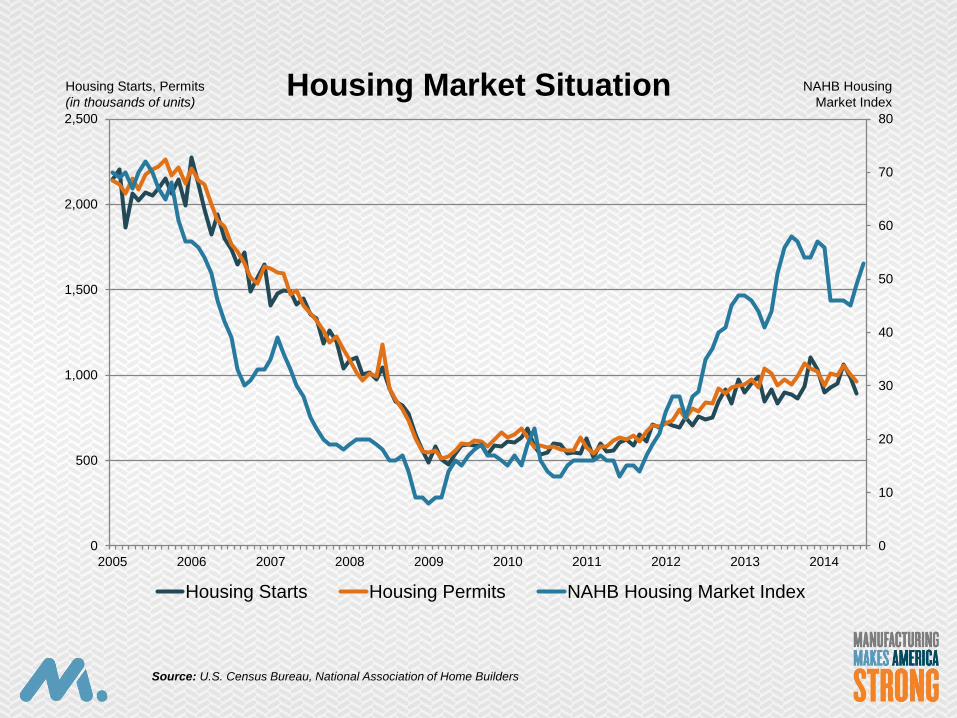
Housing Market Situation
Housing Starts Housing Permits NAHB Housing Market Index
NAHB Housing
Market Index
Housing Starts, Permits
(in thousands of units)
Source: U.S. Census Bureau, National Association of Home Builders
2
3
4
5
6
7
8
9
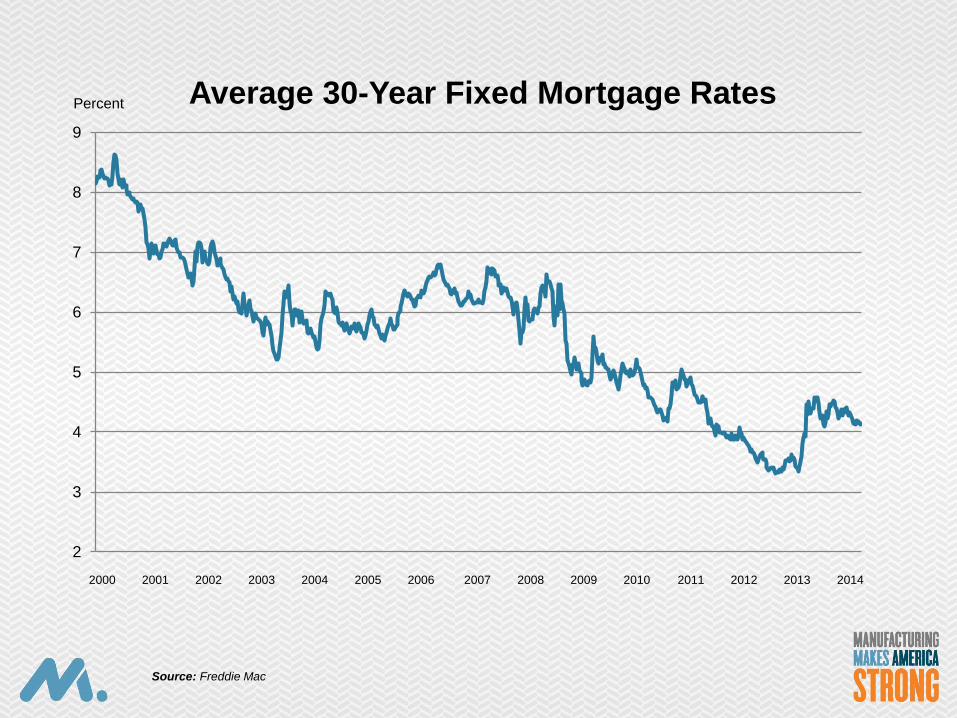
Average 30-Year Fixed Mortgage Rates
2000 2001 2002 2003 2004 2005 2006 2007 2008 2009 2010 2011 2012 2013 2014
Percent
Source: Freddie Mac
$20
$30
$40
$50
$60
$70
2005 2006 2007 2008 2009 2010 2011 2012 2013 2014
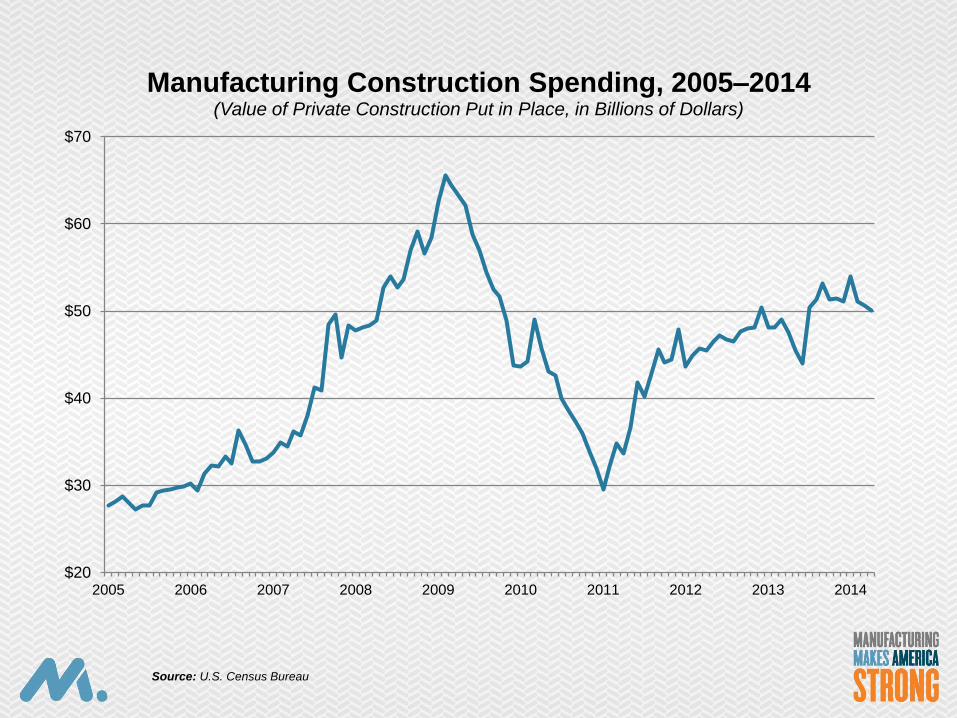
Manufacturing Construction Spending, 2005–2014 (Value of Private Construction Put in Place, in Billions of Dollars)
Source: U.S. Census Bureau
0%
1%
2%
3%
4%
2012 2013 2014
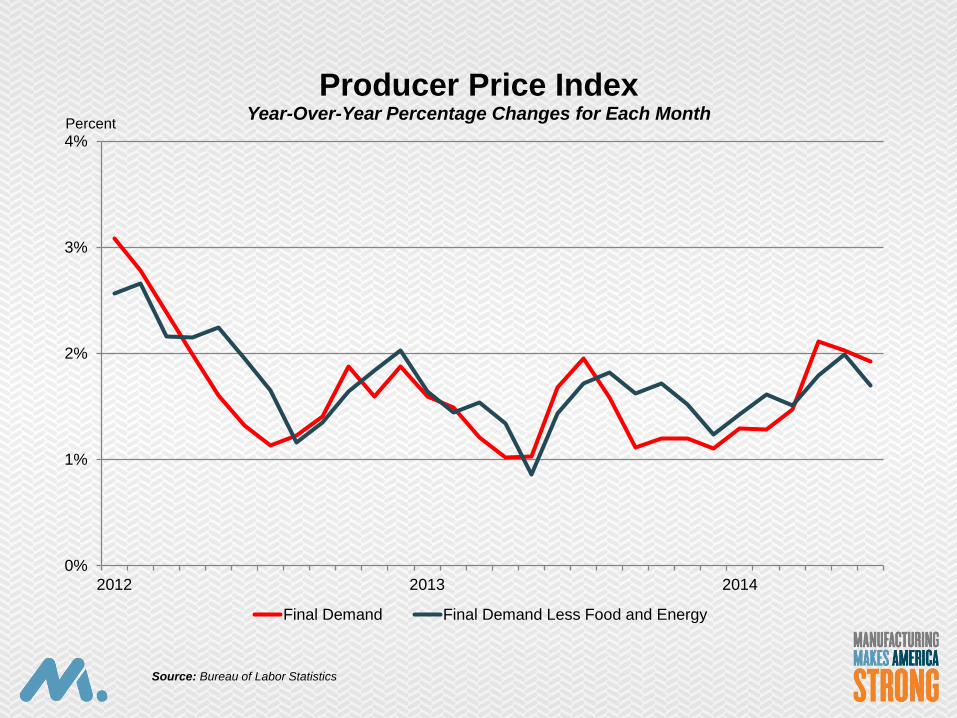
Producer Price Index Year-Over-Year Percentage Changes for Each Month
Final Demand Final Demand Less Food and Energy
Percent
Source: Bureau of Labor Statistics
Increased Investments in U.S. Manufacturing
25%
27%
29%
31%
33%
35%
37%
39%
41%
43%
45%
$200
$300
$400
$500
$600
$700
$800
$900
$1,000
1997 1998 1999 2000 2001 2002 2003 2004 2005 2006 2007 2008 2009 2010 2011 2012 2013
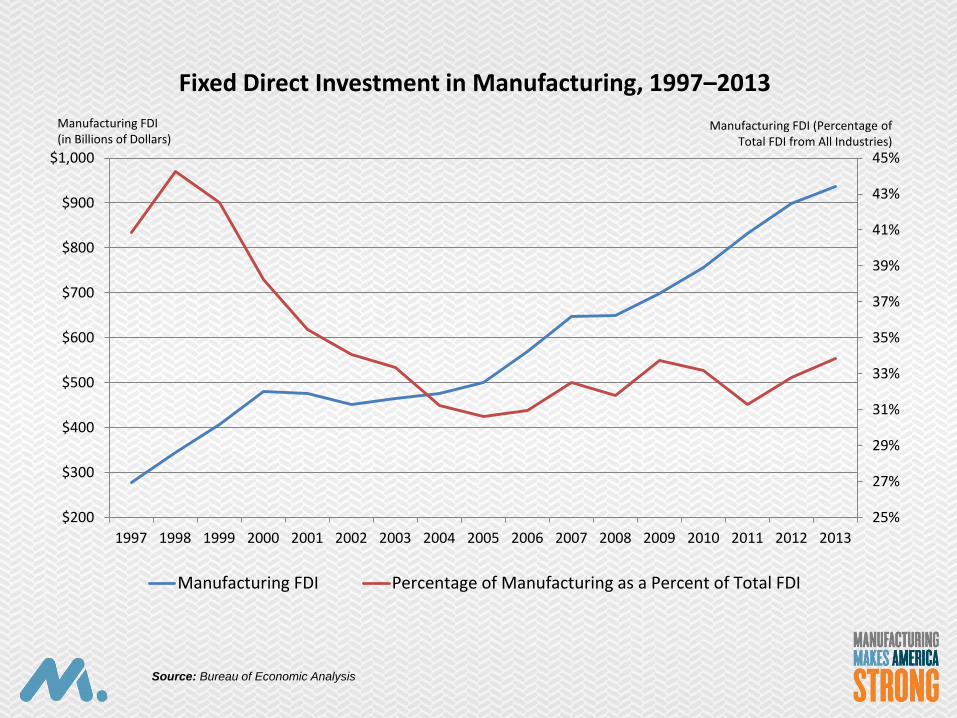
Fixed Direct Investment in Manufacturing, 1997–2013
Manufacturing FDI Percentage of Manufacturing as a Percent of Total FDI
Manufacturing FDI (in Billions of Dollars)
Manufacturing FDI (Percentage of Total FDI from All Industries)
Source: Bureau of Economic Analysis
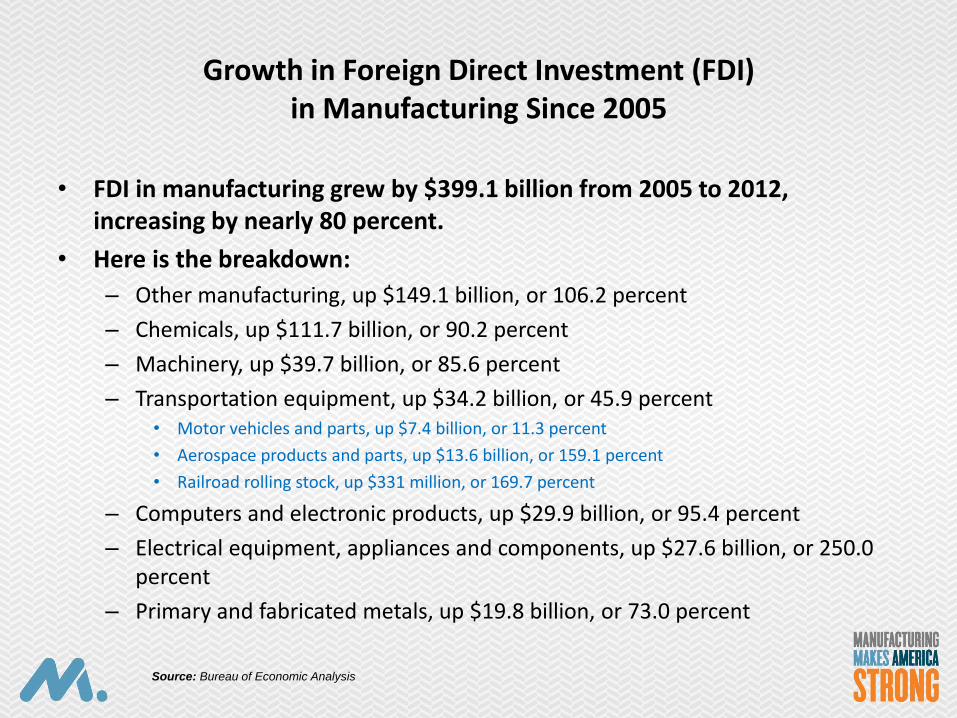
Growth in Foreign Direct Investment (FDI) in Manufacturing Since 2005
• FDI in manufacturing grew by $399.1 billion from 2005 to 2012, increasing by nearly 80 percent.
• Here is the breakdown:
– Other manufacturing, up $149.1 billion, or 106.2 percent
– Chemicals, up $111.7 billion, or 90.2 percent
– Machinery, up $39.7 billion, or 85.6 percent
– Transportation equipment, up $34.2 billion, or 45.9 percent • Motor vehicles and parts, up $7.4 billion, or 11.3 percent
• Aerospace products and parts, up $13.6 billion, or 159.1 percent
• Railroad rolling stock, up $331 million, or 169.7 percent
– Computers and electronic products, up $29.9 billion, or 95.4 percent
– Electrical equipment, appliances and components, up $27.6 billion, or 250.0 percent
– Primary and fabricated metals, up $19.8 billion, or 73.0 percent
Source: Bureau of Economic Analysis
$0
$100
$200
$300
$400
$500
$600
$700
$800
1997 1998 1999 2000 2001 2002 2003 2004 2005 2006 2007 2008 2009 2010 2011 2012
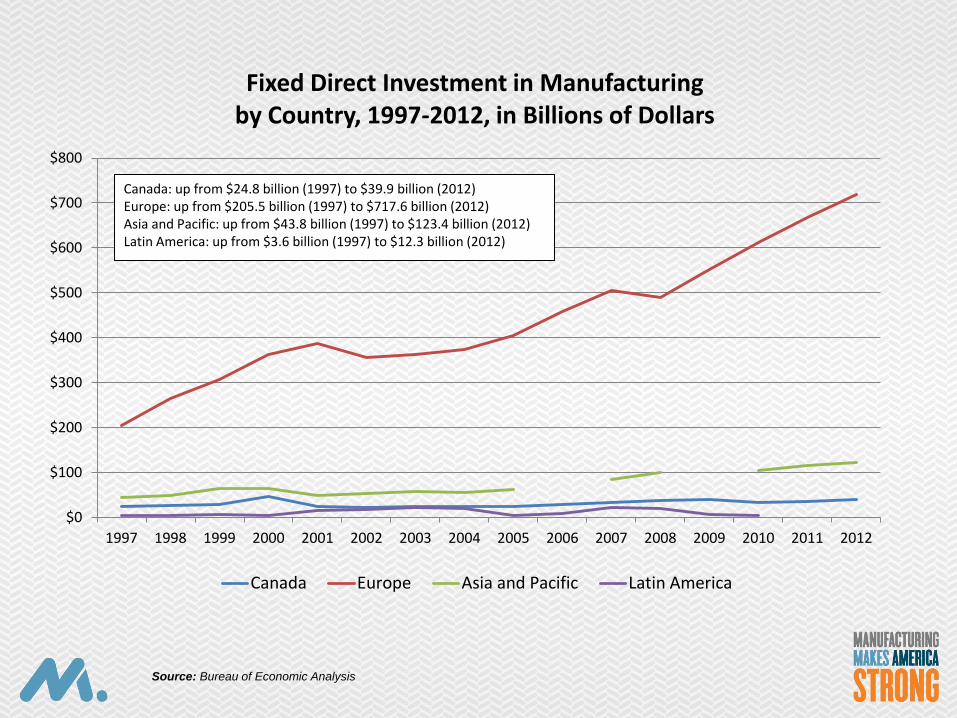
Fixed Direct Investment in Manufacturing by Country, 1997-2012, in Billions of Dollars
Canada Europe Asia and Pacific Latin America
Canada: up from $24.8 billion (1997) to $39.9 billion (2012) Europe: up from $205.5 billion (1997) to $717.6 billion (2012) Asia and Pacific: up from $43.8 billion (1997) to $123.4 billion (2012) Latin America: up from $3.6 billion (1997) to $12.3 billion (2012)
Source: Bureau of Economic Analysis
Boston Consulting Group Study (August 2013)
• Manufacturing activity could lead to 600,000 to 1.2 million additional manufacturing jobs by 2020.
• Another 1.9 million to 3.5 million in service-related indirect jobs might also be generated.
Source: Bureau of Economic Analysis
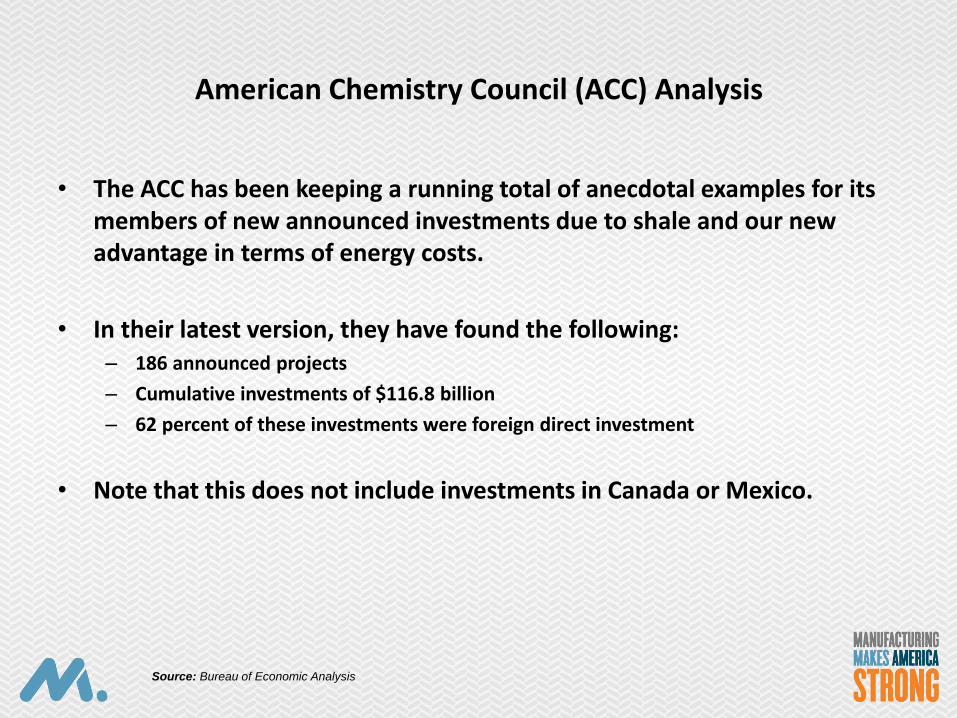
American Chemistry Council (ACC) Analysis
• The ACC has been keeping a running total of anecdotal examples for its members of new announced investments due to shale and our new advantage in terms of energy costs.
• In their latest version, they have found the following: – 186 announced projects
– Cumulative investments of $116.8 billion
– 62 percent of these investments were foreign direct investment
• Note that this does not include investments in Canada or Mexico.
Source: Bureau of Economic Analysis
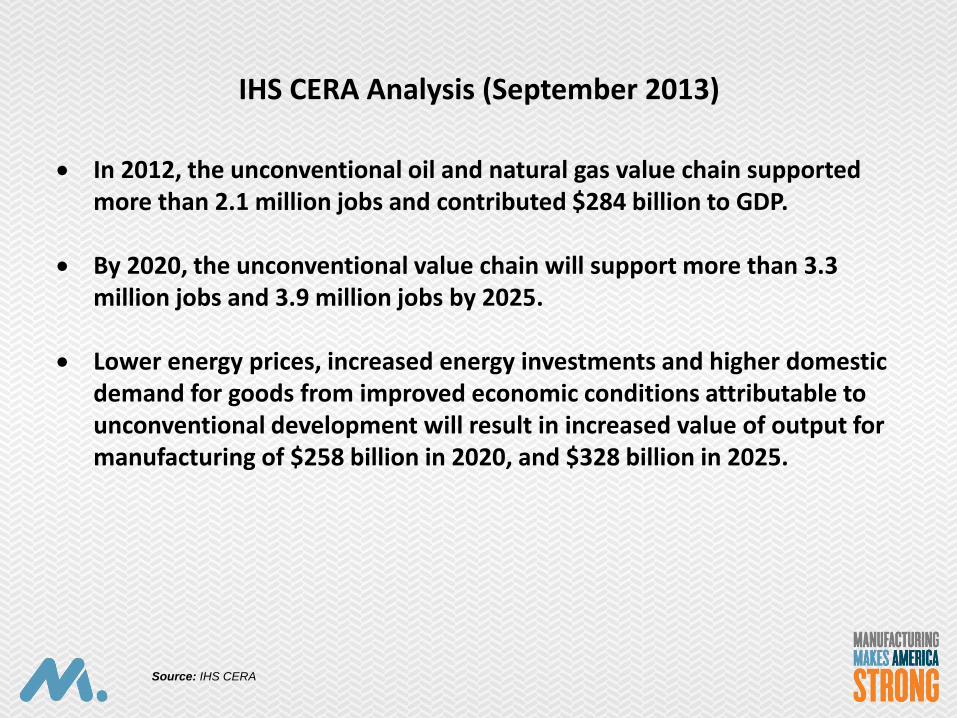
IHS CERA Analysis (September 2013)
In 2012, the unconventional oil and natural gas value chain supported more than 2.1 million jobs and contributed $284 billion to GDP.
By 2020, the unconventional value chain will support more than 3.3 million jobs and 3.9 million jobs by 2025.
Lower energy prices, increased energy investments and higher domestic
demand for goods from improved economic conditions attributable to unconventional development will result in increased value of output for manufacturing of $258 billion in 2020, and $328 billion in 2025.
Source: IHS CERA
100
120
140
160
180
200
220
240
260
280
300
1987 1988 1989 1990 1991 1992 1993 1994 1995 1996 1997 1998 1999 2000 2001 2002 2003 2004 2005 2006 2007 2008 2009 2010 2011 2012 2013
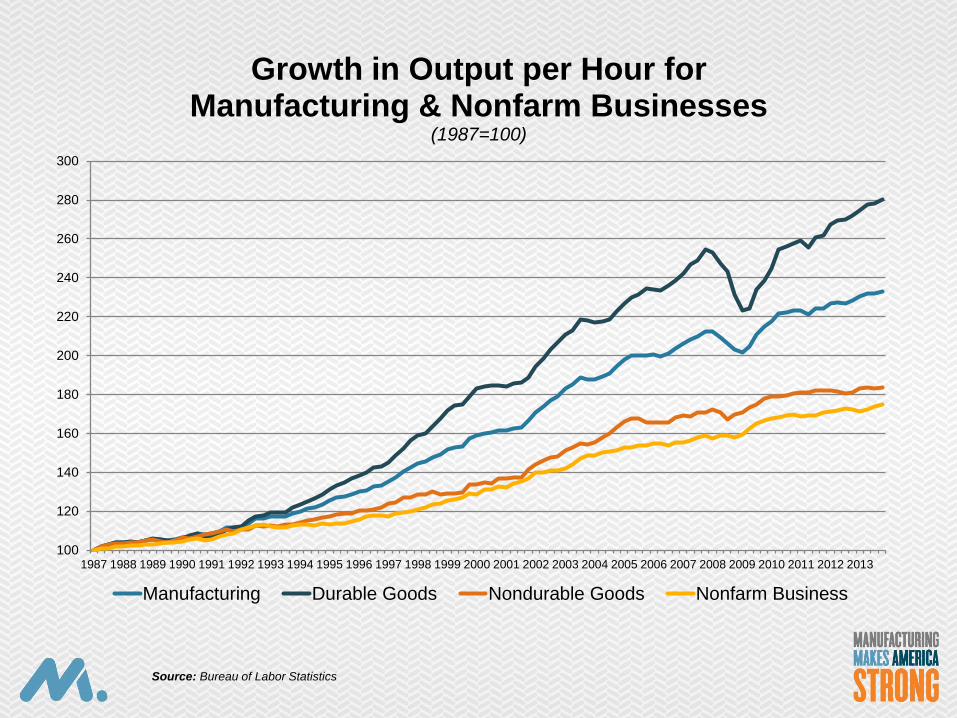
Growth in Output per Hour for Manufacturing & Nonfarm Businesses
(1987=100)
Manufacturing Durable Goods Nondurable Goods Nonfarm Business
Source: Bureau of Labor Statistics
85
87
89
91
93
95
97
99
101
103
105
2000 2001 2002 2003 2004 2005 2006 2007 2008 2009 2010 2011 2012 2013 2014
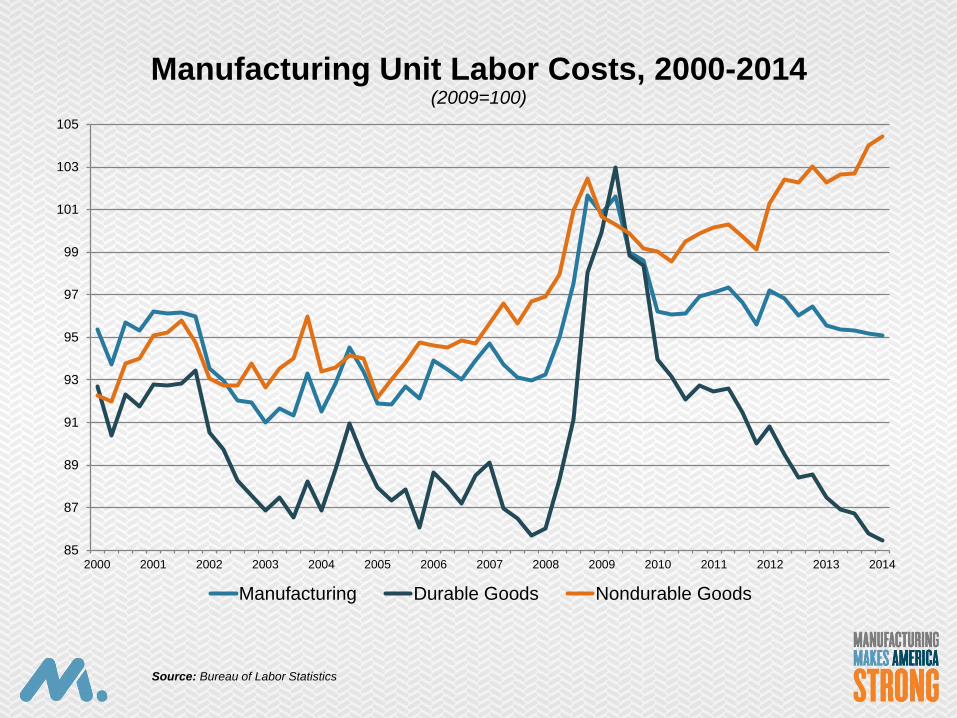
Manufacturing Unit Labor Costs, 2000-2014 (2009=100)
Manufacturing Durable Goods Nondurable Goods
Source: Bureau of Labor Statistics
Questions?
Dr. Chad Moutray Chief Economist
National Association of Manufacturers
[email protected] (202) 637-3148
@chadmoutray