Embed Size (px)
Citation preview
Budget Paper D
THEManiToBa
aDvanTagE

THE ManiToBa aDvanTagE
Contents
THE MANITOBA ADVANTAGE ........................................................................................................................................................................ 1
THE MANITOBA ArTs AND CulTurE ADVANTAGE ................................................................................................................................ 7
Appendix 1: 2008 INTErprOVINCIAl COMpArIsON Of pErsONAl COsTs AND TAxEs .................................................................................... 12
Appendix 2: MANITOBA’s COMpETITIVE ENVIrONMENT fOr MANufACTurING ............................................................................................... 25
B u D g E T 2 0 0 8 T h e M a n i t o b a A d v a n t a g e / D 1
n THE ManiToBa aDvanTagEAsk any Manitoban what’s important to them about their province and you’ll likely hear about a strong sense of community, easy access to parks, cottages and other outdoor recreational options, quality public services or an affordable, quality lifestyle.
But Manitoba is more than these things. Manitoba is also recognized for a strong and stable economy. And despite growing international instability, a weaker U.S. economy and continued challenges posed by the rising Canadian currency, Manitoba’s total economy grew by a robust 3.0% in 2007, bettering Canada’s increase for the second consecutive year.
Manitoba Finance’s survey of independent forecasters shows that, in both 2008 and 2009, the provincial economy will again surpass Canada’s economic expansion.
One of the principal indicators of confidence in the economy is capital investment. Investment helps drive economic growth, and Manitoba’s capital investment grew faster than any other province in Canada last year. For 2008, Statistics Canada estimates that Manitoba will again be the country’s investment growth leader with a 18.8% gain, Manitoba’s third consecutive double-digit increase in capital spending.
Strong growth in Manitobans’ incomes was again a key feature of the province’s success story. Average weekly earnings increased 4.2% in 2007, the strongest annual increase since 1989. Manitoba’s real average earnings growth has been second strongest in Canada over the past five years.
Employment and the labour force grew at 1.6% and 1.7%, respectively, the best performance in five years. Unemployment at 4.4% was well below the national rate of 6.0%. With increased opportunities in the province’s labour markets, the labour force participation rate and employment rate both reached all-time highs.
Growing incomes translated into buoyant consumer confidence in 2007, as retail sales rose 9%, the best growth in a decade, and housing starts increased 14% to the highest level recorded in 20 years.
While these measures of economic performance underscored Manitoba’s strong and stable economy last year, perhaps the most important one is the fact that more people chose to make Manitoba their home than at any time in at least the past thirty-five years. Strong immigration propelled Manitoba’s population in the year by 1.1%, bettering the national increase.
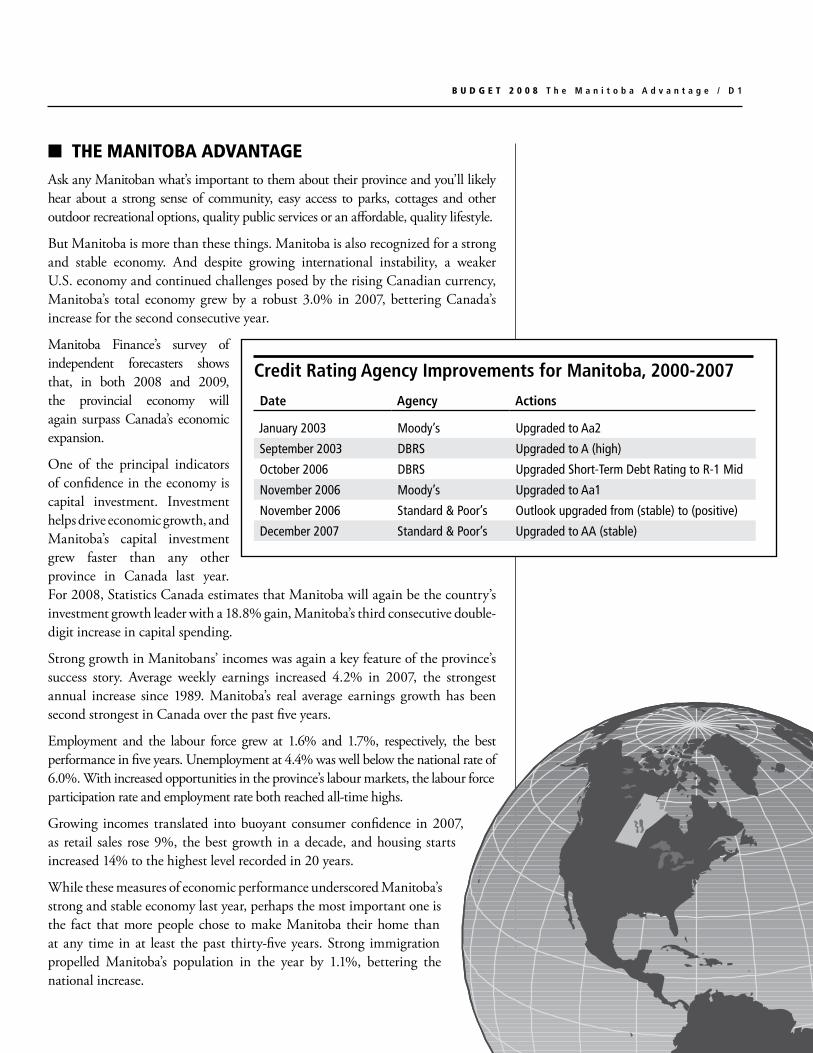
Credit rating Agency Improvements for Manitoba, 2000-2007
Date Agency Actions
January 2003 Moody’s Upgraded to Aa2
September 2003 DBRS Upgraded to A (high)
October 2006 DBRS Upgraded Short-Term Debt Rating to R-1 Mid
November 2006 Moody’s Upgraded to Aa1
November 2006 Standard & Poor’s Outlook upgraded from (stable) to (positive)
December 2007 Standard & Poor’s Upgraded to AA (stable)
D 2 / T h e M a n i t o b a A d v a n t a g e B u D g E T 2 0 0 8
Manitoba provides businesses and residents with a unique set of benefits that we call The Manitoba Advantage:
a productive, well-educated and multilingual labour force•
a favourable business cost environment, including competitive office and •land costs, reasonable construction costs and affordable taxes
modern and extensive communications infrastructure•
an extensive network of research and development (R&D) facilities, •supporting innovation and productivity
a convenient mid-continent location in the North American central time •zone
cost-effective transportation links and intermodal facilities providing •shipping by road, rail, air and sea
an extremely favourable cost of living, including some of North America’s •lowest electricity costs
reliable and accessible public services, including quality universal public •health care and education
safe communities, a dynamic cultural and artistic community, and an •attractive natural environment – all of which contribute to an unsurpassed quality of life.
This budget paper provides details on The Manitoba Advantage, including business and personal costs and taxes, facts on Manitoba’s quality of life and Manitoba’s Arts and Culture Advantage.
What is The Manitoba Advantage?
Manitoba has posted Canada’s most stable growth over the last ten years. Diversity is the key to this stability, as the province is home to many industries producing a wide range of industrial and consumer goods and services. These include firms
in aerospace and bus manufacturing, food processing, pharmaceuticals, financial services, entertainment, electricity, chemicals, agriculture and transportation. Manitoba’s consistent economic performance contributes to a more stable workforce and a predictable local business environment.
Manitoba Hydro is one of North America’s major electricity companies and the lowest-cost electricity provider in Canada. About 98% of the province’s electricity is generated by clean, reliable and environmentally desirable water power. In Manitoba this is a plentiful resource, with about 13% of Canada’s fresh water entering Manitoba and draining into Hudson Bay. Manitoba Hydro currently has a generating capacity of almost 5,500 megawatts (MW) in the province and tremendous potential for future growth with over 5,000 MW more of
Manitoba’s Top Exports are a Diverse Mix of Consumer and Industrial Goods including:
• Primary Metals• Machinery• Aerospace• Buses• Fertilizers• Pharmaceuticals• Hydro-electricity• Grains and Oilseeds• Processed and Frozen Foods• Cattle and Hogs
Manitoba’s Top Exports Destinations:
1. United States2. China3. Japan4. Hong Kong5. Taiwan6. Mexico7. Belgium8. United Kingdom9. South Korea10. South Africa
B u D g E T 2 0 0 8 T h e M a n i t o b a A d v a n t a g e / D 3
hydro resources identified for possible development. The utility has initiated construction on the new 200 MW Wuskwatim hydro-electric generating facility. In 2006, Manitoba became home to a new 99 MW wind farm, adding even more clean energy supply to Manitoba’s electricity portfolio, and is currently considering proposals for the addition of a further 300 MW of wind generation.
Manitoba’s central location in North America has long made the province a transportation hub. Together, Manitoba’s intermodal transportation facilities offer substantial flexibility and cost savings to business, with ready access to the United States. Winnipeg is the largest distribution centre between the Pacific coast and Toronto, and the only major city between Vancouver and Thunder Bay with direct U.S. rail connections. Winnipeg’s extensive and modern rail car marshalling facilities for both national railway systems, Canadian Pacific Railway and Canadian National Railway, can handle over 5,000 rail cars per day. Manitoba is a central nexus for truck cargo, with several of Canada’s top for-hire trucking carriers headquartered in Winnipeg. The rapid increase in Manitoba’s exports has vaulted the Emerson-U.S. border crossing facility into top spot in the value of truck trade among Western Canada’s border crossings; with $13.7 billion in trade traffic, Emerson is fifth largest among all Canadian border crossings.
A flexible and convenient air transportation system is vital to business success. Winnipeg James Armstrong Richardson International Airport is one of the few major North American airports that operates 24 hours a day. It offers a broad range of services, including international carriers, commuter airlines, jet freight, and extensive cargo and courier facilities. In 2007, it served a record-high 3.6 million passengers, an increase of five per cent from 2006, and moved over 150 million kilograms of air cargo. The Airport is currently undergoing an extensive, multi-year capital program with total investment of $585 million, including the construction of a new air terminal building. The project will be completed by the end of 2009.
Manitoba is home to the only deep-sea port in the Prairie Region. The Port of Churchill, owned by OmniTRAX Inc., offers shippers cost advantages for ocean shipping to and from major overseas trading markets through Hudson Bay. The Port has four deep-sea berths to allow loading and unloading of cargo and grain from vessels with up to 60,000-tonne capacity. Last year, Churchill saw over 620,000 tonnes of grain go through the Port, the best shipping volume in seven years, with products destined for customers in South America, Europe and Africa. OmniTRAX and the provincial and federal governments have announced that almost $70 million will be invested in rail line and Port improvements over the next several years to enhance Churchill’s role in international trade.
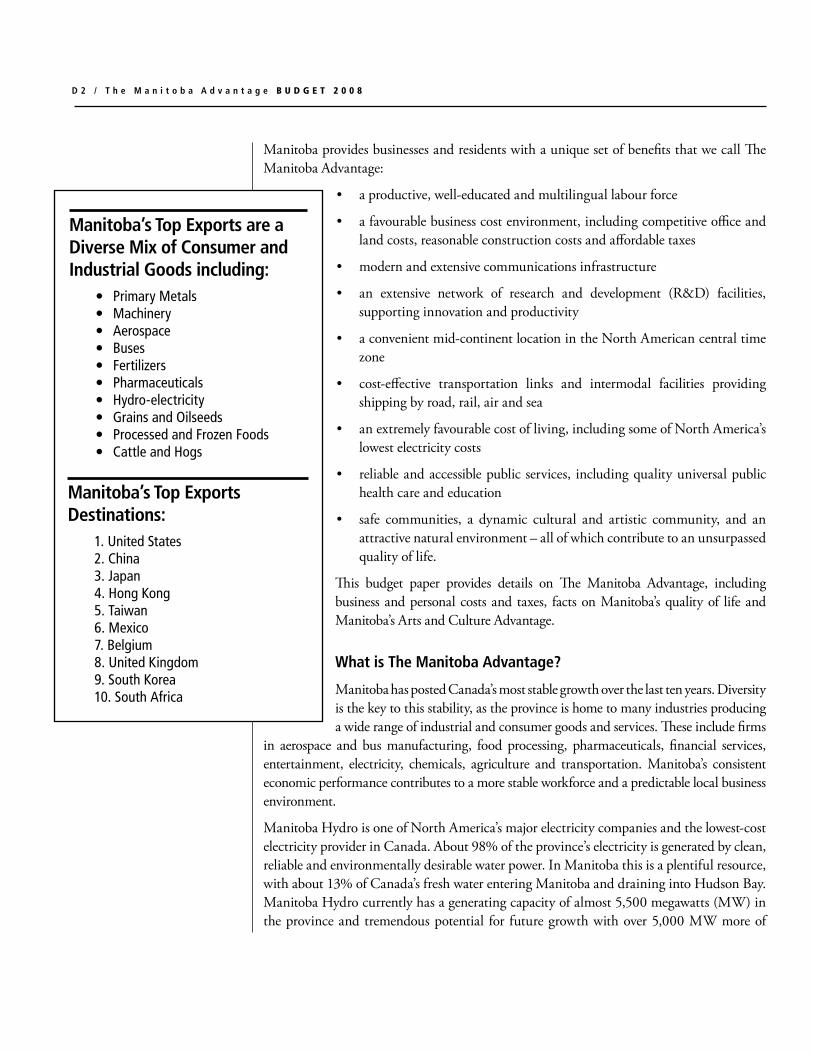
Monthly Electricity CostCommercial/Industrial Customer50 MW and 30,600 MWh, 2007
Thousands of Canadian Dollars
New York
Boston
San Francisco
Miami
Toronto
Ottawa
Nashville
Detroit
Houston
Chicago
Halifax
St. John's
Seattle
Edmonton
Regina
Moncton
Portland
Montréal
Vancouver
Winnipeg
Charlottetown
File: Electric_Indust_Lrg_08.epsCreated: Mon, 17 March, 2008Revised:Fixed:
Source: Hydro-Québec
0 2,000 4,000 6,000

D 4 / T h e M a n i t o b a A d v a n t a g e B u D g E T 2 0 0 8
With an extensive natural resource base, Manitoba is a major producer of primary goods. The mining industry processes a wide variety of minerals, including nickel, copper, zinc, gold, cesium, tantalum and oil. Together, the value of these products was a record-high $3.1 billion in 2007. Manitoba has a large and long-established forestry industry that produces paper, newsprint and lumber. The inland commercial fishing industry is one of Canada’s largest, accounting for one-quarter of Canada’s commercial freshwater catch. A temperate climate, rich soil, fresh water and a large arable land base have made Manitoba a key agriculture producer. Careful management of Manitoba’s natural endowments ensures the sustainable development of these resources now and in the future.
Manitobans enjoy advanced connectivity through a comprehensive telecommunications infrastructure. Broadband services are widely available and the extensive cellular network covers virtually all of the province’s population. High-speed internet is available to the substantial majority of Manitoba households, making Manitoba one of the most broadband-enabled provinces in the country.
Average House PriceStandard Townhouse
Thousands of Dollars
Calgary
MontréalHalifax
Saint John
Regina
Winnipeg
CharlottetownSt.John's
Source: Royal LePage Survey of CanadianHouse Prices, Fourth Quarter 2007
0 100 200 300 400 600500
Vancouver
Toronto
File: 00_House_Price_Townhouse_08.epsCreated: Sat, Mar 15, 2008Revised: 1/Tues, March 18, 2008Fixed:
Manitoba Capital Investment
Manitoba is projected to be the growth leader among provinces in capital investment in both 2007 and 2008.
Statistics Canada’s Survey of Private and Public Investment estimates that 2008 capital spending in Manitoba will reach a record high of $10.9 billion, up 18.8% from 2007. In 2007, the survey shows Manitoba’s investment increased 16.8%. In both years, Manitoba’s increase is the strongest in Canada and three times the national increase.
Manitoba’s private capital investment is estimated to increase 22.4% this year, the third consecutive year that Manitoba’s private investment will exceed Canada’s increase. Over the last three years, growth in private capital investment in the province is 53%, the highest among provinces and more than double the national increase.
While Manitoba’s private investment growth has been very strong over the last several years, Manitoba is unique among provinces insofar as private capital spending has increased in the province each year for the last 17 years. This consistent growth underscores Manitoba’s overall stability through business cycles.
Manitoba’s public capital investment is estimated to increase 10.6% in 2008, fifth among provinces and in line with the national average increase of 11.8%.
Capital Investment Growth,2006-2008i
Per cent
NLNS
PEQCSK
ON
CABC
NB
AB
MB
File: Capitl_Investment_Growth_08.epsCreated: Sat, Mar 15, 2008Revised: 1/18 March, 2008Fixed:
i - Intentions
Source: Statistics Canada
0 10 20 30 5040
B u D g E T 2 0 0 8 T h e M a n i t o b a A d v a n t a g e / D 5
Research and innovation continue to play an important role in Manitoba’s economic growth and diversification. The province has a strong and growing knowledge cluster in a number of fields, although the R&D presence is most notable in life sciences. Private industry, government and post-secondary institutions contribute to the province’s growing R&D infrastructure.
Manitoba remains committed to providing quality public services such as health care. There are no premiums or personal charges for medical services in Manitoba for either employers or individual Manitobans. This is a major advantage over U.S. locations for both businesses and residents. In the U.S., premiums for employer-sponsored health insurance averaged over US$12,100 per employee for family coverage in 2007.
Having the skills and knowledge to meet the challenges of the 21st century is a prerequisite for a prosperous and growing economy. Manitobans enjoy a quality public education system, including affordable, high-quality post-secondary education opportunities in several universities and colleges. Higher education continues to be affordable in Manitoba, with undergraduate tuition among the most affordable in Canada. Approximately 27,000 students attend the University of Manitoba on a full-time or part-time basis. The University offers a wide range of post-secondary programs, including a wide range of graduate programs, sciences, arts, medicine, law, architecture, fine arts, engineering and agriculture. Another 14,000 students are enrolled in study at Manitoba’s other four universities. As well as university study, over 15,000 students are enrolled at Manitoba’s three community colleges.
Competitive operating costs and taxes make Manitoba one of the best provinces in Canada for business. More details on Manitoba’s business cost advantage can be found in Appendix 2, Manitoba’s Competitive Environment for Manufacturing (see p. 25).
Manitoba’s Quality of life Advantage
Manitoba’s capital, Winnipeg, is a growing cosmopolitan centre of 700,000, and workers enjoy the benefits of convenient and community-minded living. The average commuting distance to work in Winnipeg is 6.1 kilometres, the shortest of any Canadian city with a population over 500,000.
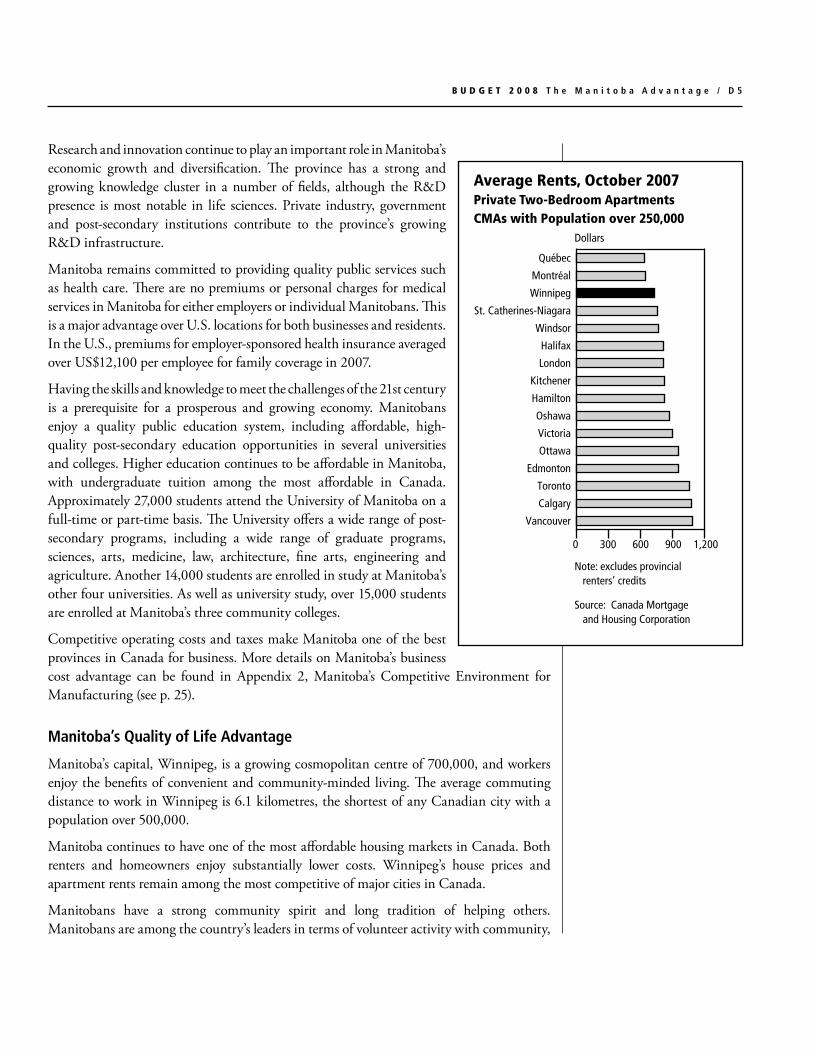
Manitoba continues to have one of the most affordable housing markets in Canada. Both renters and homeowners enjoy substantially lower costs. Winnipeg’s house prices and apartment rents remain among the most competitive of major cities in Canada.
Manitobans have a strong community spirit and long tradition of helping others. Manitobans are among the country’s leaders in terms of volunteer activity with community,
Average Rents, October 2007Private Two-Bedroom ApartmentsCMAs with Population over 250,000
Dollars
Calgary
Kitchener
Edmonton
Halifax
Hamilton
London
Windsor
Winnipeg
Québec
Montréal
Source: Canada Mortgage and Housing Corporation
Note: excludes provincial renters’ credits
0 1,200300 600 900
Vancouver
Toronto
Ottawa
Victoria
Oshawa
St. Catherines-Niagara
File: Average_Rent_08.epsCreated: Fri, Mar 14, 2008Revised: 1/Tues, Mar 25, 2008Fixed:

D 6 / T h e M a n i t o b a A d v a n t a g e B u D g E T 2 0 0 8
social and charitable groups, with half of the province’s population reporting voluntary service. Similarly, Manitobans are more likely to donate to charity than residents of any other province or territory in Canada. Moreover, Manitobans donated a higher proportion of their income to charity than residents of any other province in Canada.
The Government of Manitoba also provides indirect contributions to charities through tax credits on charitable donations. In 2005, over $755 million was donated to all registered charities in the province, including $385 million from individual taxpayers. Through
charitable donations tax deductions, Manitoba contributed $106 million in 2005, including $50 million in tax credits to individual taxpayers.
Winnipeg has an active and vibrant artistic and cultural scene, including the Winnipeg Art Gallery, the Manitoba Museum, the Royal Winnipeg Ballet, the Winnipeg Symphony Orchestra, the Manitoba Theatre Centre and many other live theatre groups. Manitobans love to celebrate their heritage and the arts, so Manitoba boasts 100 festivals held throughout the year.
Manitoba’s diverse population has created a rich and rewarding fabric of cultural and artistic accomplishments. For more details, see The Manitoba Arts and Culture Advantage (see p. 7).
Manitoba has a long sporting tradition. There are professional sports teams in the Canadian Football League, American Hockey League and the Northern Baseball League. The sport of golf came to the province in the early 1800s and now, with more than 125 golf courses, Manitoba has one of the highest ratios of golf courses to golfers in Canada. Manitoba also has the second-highest golfing participation rate in Canada, with almost one in three Manitobans teeing off in the province last year.
Manitobans respect and enjoy their natural environment. Beaches, lakes, rivers and parks are integral parts of Manitoba’s quality of life. Manitoba is a province of 100,000 lakes, with almost 15% of the province covered by lakes and rivers. In Manitoba, you’re never far from an opportunity to participate in water sports like canoeing, kayaking or swimming, or to just relax at one of Manitoba’s world-class beaches. Proximity to lakes and affordable vacation homes has given Manitobans one of the highest rates of vacation homeownership in the country. Winters offer extensive family recreation opportunities for skiing, curling, snowmobiling and (of course) hockey!
Conclusion
Budget 2008 builds on Manitoba’s considerable advantages. To show Manitoba’s cost competitiveness in more detail, two appendices are attached. The 2008 Interprovincial Comparison of Personal Costs and Taxes (see p. 12), compares provinces’ living costs and tax levels for a variety of family types.
Appendix 2, Manitoba’s Competitive Environment for Manufacturing, provides a detailed comparison of the taxes and costs faced by representative manufacturers in various Canadian and U.S. cities (see p. 25).
Index of Retail Prices,October 2006
Average = 100.0
Halifax
Edmonton
Charlottetown
Montréal
Saint John
Regina
Winnipeg
Source: Statistics Canada
0 90 100 110 120
St. John's
Vancouver
Ottawa
Toronto
File: Retail_Price_Diff_08.epsCreated: Fri, Mar 14, 2008Revised: Fixed:
B u D g E T 2 0 0 8 T h e M a n i t o b a A d v a n t a g e / D 7
n THE ManiToBa aRTS anD CuLTuRE aDvanTagECulture and the arts are an integral part of the Manitoba way of life and the economy. Our strong cultural scene enriches our lives, and is built on our diverse ethnic fabric, world-class attractions, and the imagination and creativity of our citizens. As an economic sector, culture stimulates creativity and growth. It is for all of these reasons that the Manitoba Government actively supports and promotes arts and culture in the province.
The Diversity of Manitoba Arts and Culture
Manitoba has one of the most diverse cultural environments in Canada. This diversity, combined with our love of the arts and culture, provides the nurturing environment for artistic and cultural expression to blossom.
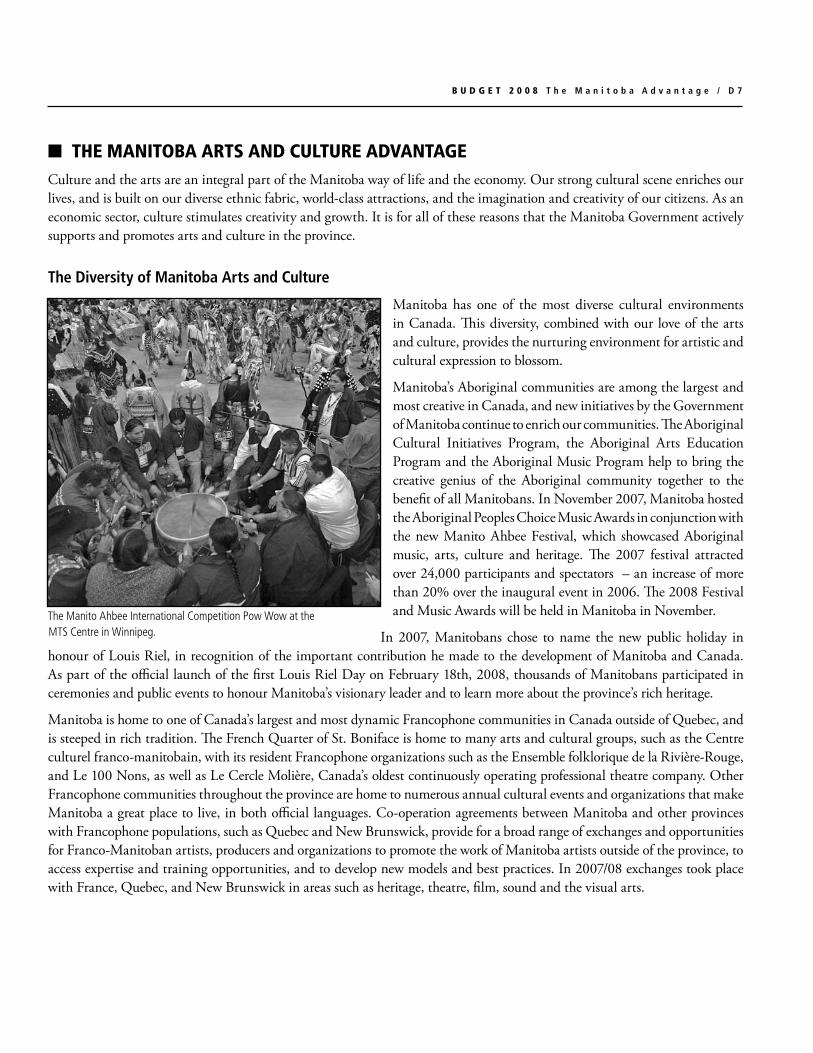
Manitoba’s Aboriginal communities are among the largest and most creative in Canada, and new initiatives by the Government of Manitoba continue to enrich our communities. The Aboriginal Cultural Initiatives Program, the Aboriginal Arts Education Program and the Aboriginal Music Program help to bring the creative genius of the Aboriginal community together to the benefit of all Manitobans. In November 2007, Manitoba hosted the Aboriginal Peoples Choice Music Awards in conjunction with the new Manito Ahbee Festival, which showcased Aboriginal music, arts, culture and heritage. The 2007 festival attracted over 24,000 participants and spectators – an increase of more than 20% over the inaugural event in 2006. The 2008 Festival and Music Awards will be held in Manitoba in November.
In 2007, Manitobans chose to name the new public holiday in honour of Louis Riel, in recognition of the important contribution he made to the development of Manitoba and Canada. As part of the official launch of the first Louis Riel Day on February 18th, 2008, thousands of Manitobans participated in ceremonies and public events to honour Manitoba’s visionary leader and to learn more about the province’s rich heritage.
Manitoba is home to one of Canada’s largest and most dynamic Francophone communities in Canada outside of Quebec, and is steeped in rich tradition. The French Quarter of St. Boniface is home to many arts and cultural groups, such as the Centre culturel franco-manitobain, with its resident Francophone organizations such as the Ensemble folklorique de la Rivière-Rouge, and Le 100 Nons, as well as Le Cercle Molière, Canada’s oldest continuously operating professional theatre company. Other Francophone communities throughout the province are home to numerous annual cultural events and organizations that make Manitoba a great place to live, in both official languages. Co-operation agreements between Manitoba and other provinces with Francophone populations, such as Quebec and New Brunswick, provide for a broad range of exchanges and opportunities for Franco-Manitoban artists, producers and organizations to promote the work of Manitoba artists outside of the province, to access expertise and training opportunities, and to develop new models and best practices. In 2007/08 exchanges took place with France, Quebec, and New Brunswick in areas such as heritage, theatre, film, sound and the visual arts.
The Manito Ahbee International Competition Pow Wow at the MTS Centre in Winnipeg.

D 8 / T h e M a n i t o b a A d v a n t a g e B u D g E T 2 0 0 8
Manitoba supports a number of diverse cultural organizations and activities throughout the year that enrich the lives of Manitobans and attract many visitors to a province that embraces diversity. Manitoba is home to the largest Icelandic settlement in the world outside Iceland, one of North America’s most vibrant Métis communities, one of the largest Filipino communities in Canada and many dynmic Ukrainian and Mennonite communities throughout the province.
Manitoba’s Cultural Industries flourish
Manitoba’s cultural industries continue to enjoy a high degree of profile, success and recognition on national and international stages. The Manitoba Writers’ Guild celebrated its 25th anniversary in 2007 by publishing a 400-page anthology of Manitoba writing featuring the work of 90 Manitoba writers including Giller prize-winning novelist David Bergen and Governor General award-winning author Miriam Toews.
Manitoba’s 14 book publishers generated over $3.1 million in sales in 2006. Manitoba publishers continued to produce books in all genres, which included the comprehensive Encyclopedia of Manitoba published by Great Plains Publications. Scirocco Drama is Canada’s second-largest publisher of plays, many of which have won literary awards. Scirocco winners of the Governor General’s Award for Drama include Manitoba playwright Ian Ross for fareWel. Budget 2008 introduces the Book Publishing Tax Credit, a 40% refundable income tax credit for Manitoba publishers.
Manitoba’s sound recording industry continues to be one of our most dynamic cultural industries. In December 2005, the Manitoba Audio Recording Industry Association released its Music is Working Economic Impact Study that revealed an industry producing economic results on a level similar to Manitoba’s film industry. In 2004, total music industry expenditures reached $108 million and the net positive impact on Manitoba’s Gross Domestic Product (GDP) was $87 million. In 2006/07, Manitoba artists released an incredible 205 albums and Manitoba artists received over 131 nominations for national and international music awards. This list includes the Grammy Awards, Canadian Country Music Awards, Aboriginal Peoples Choice Music Awards, Western Canadian Music Awards, Canadian Independent Music Awards and the Juno Awards. For the 2008 Juno Awards in Calgary, four Manitoba acts have been nominated. Following successful hosting ventures such as the 2005 Juno Awards, Winnipeg will host the Canadian Country Music Awards in September 2008.
The television and film production industry is continuing to perform at a high rate. Although slightly below the record-high level of $124 million set in 2005/06, production volumes for 2006/07 reached $114 million on 55 projects. As of January 1, 2008, over 40 films have been shot and production activity for the year already stands at $117 million. This year’s figures include the $25 million feature film Chilled in Miami, starring Renée Zellweger. Given other projects slated for shooting before year end the industry may surpass the industry-high benchmark set in 2005/06. The industry has now met or exceeded $100 million
The classic musical Fiddler on the Roof was presented by the Manitoba Theatre Centre in celebration of its 50th anniversary season.

B u D g E T 2 0 0 8 T h e M a n i t o b a A d v a n t a g e / D 9
in annual production activity for five straight years. Through the Manitoba Film and Video Production Tax Credit, direct equity financing and other programs, the Manitoba Government provided an estimated $18 million in support for this industry in 2006/07.
Manitoba Attractions and festivals
Many of Canada’s premier cultural attractions are found in Manitoba. The world famous Royal Winnipeg Ballet was the first dance company to be established in Canada and brings Winnipeg to the world through touring performances. The Manitoba Museum is a highlight for visitors to the province, and is one of only three Canadian attractions to achieve the Michelin Guide three-star rating. The Winnipeg Art Gallery has the world’s largest collection of contemporary Inuit art, including over 10,000 sculptures, prints, paintings and textiles. The Manitoba Theatre Centre, The Winnipeg Symphony Orchestra, the Manitoba Opera, the Costume Museum of Canada, and sites like Lower Fort Garry and The Forks, are only a small sample of the hundreds of attractions found throughout the province.
Manitoba also features many contemporary cultural attractions such as the Plug-In Institute for Contemporary Art, the Winnipeg Film Group, the Manitoba Printmakers Association and Urban Shaman, an Aboriginal artist-operated centre that presents contemporary visual art exhibitions.
Manitoba film and Video production Tax Credit
Since 1999, the Manitoba Government has continued to improve the Manitoba Film and Video Production Tax Credit. When it was introduced in 1997, the basic rate was 35%. Since 2000, the tax credit has been built up with a number of novel innovations. In 2004, a 5% Frequent Filming Bonus for returning producers was introduced. Also, to expand film production activity throughout the province, a 5% Rural and Northern Manitoba Incentive was added. In response to the increasing competitiveness of filming incentives offered by other jurisdictions, the basic credit was increased from 35% to 45% in 2005. This Budget goes even further. It doubles the Frequent Filming Bonus from 5% to 10%, in recognition of the need to address the impact of the higher Canadian dollar on Manitoba’s ability to attract feature film productions. It introduces a 5% Manitoba Producer Bonus to promote the use of Manitobans as producers on offshore and co-production film projects, as well as benefiting films shot by local producers. Since 2000, the Manitoba Government has almost doubled the tax credit, from 35% to 65%, the highest among provinces.
The merits of the film tax credit have been realized in the increase in film activity since 1997. In 1997, production budgets for films shot in Manitoba totalled $17 million. Since 2003, that figure has exceeded $100 million annually, a five-fold increase. Since the film tax credit was introduced in Manitoba, film productions costing over $758 million have been made in Manitoba.
Canada’s premier ballet company, the world renowned Royal Winnipeg Ballet in Mauricio Wainrot’s Carmen, The Passion.

D 1 0 / T h e M a n i t o b a A d v a n t a g e B u D g E T 2 0 0 8
Manitoba is also home to the Hudson’s Bay Company Archives, a world-renowned documentary heritage collection. In 2007, UNESCO recognized the HBC Archives by including them in their Memory of the World Registry. This collection reflects the heritage of Canada’s west and north and its peoples, and contributes to understanding our land as it is today. It is a rich resource for researchers worldwide who have created books, films, television productions, websites and exhibitions from its documents, images and maps.
There are also exceptional venues across the province, ranging from the newly expanded Keystone Centre and the Western Centennial Auditorium in Brandon, to Prairie Theatre Exchange, Rainbow Stage and the Manitoba Theatre for Young People. In 2004, Manitobans saw the opening of the
MTS Centre, the new 15,000-seat, $135 million entertainment centre and arena. According to industry surveys, the MTS Centre is the third-busiest ticket venue in Canada and among the top-thirty busiest facilities in the world.
Manitoba celebrates many world-class festivals throughout the year. In winter, the Festival du Voyageur, the largest winter festival in Western Canada, attracts thousands of visitors to Winnipeg’s French Quarter. Further north, the Northern Manitoba Trappers’ Festival in The Pas brings the frontier spirit of the north to life. In Brandon, the Royal Manitoba Winter Fair attracts people from across Canada. St. Laurent hosts the Manipogo Festival, a celebration of ice fishing and of Métis culture.
People from around the world are also drawn to Winnipeg’s summer festivals, such as Folklorama, one of the world’s largest and longest-running cultural festivals. Folklorama attracted almost 460,000 visits to 45 pavilions during its two-week run in 2007. The Winnipeg Fringe Festival, the second-largest festival of its kind in North America, boasted a total paid attendance of 72,000 in the summer of 2007. The Winnipeg Folk Festival has been providing folk music lovers with great entertainment since 1974 and attracts over 45,000 people each season. The Festival also contributes more than $16 million to the provincial economy. Other important festivals include the Jazz Winnipeg Festival, Canada’s National Ukrainian Festival in Dauphin and the Islendingadagurinn Festival in Gimli. Vibrant community fairs and exhibitions can be found in every corner of the province. Several festivals are also geared for young people, including Freeze Frame, a film festival for children and young people, and the Winnipeg International Children’s Festival, which builds on first-rate children’s attractions such as the Manitoba Theatre for Young People and the Manitoba Children’s Museum.
One of North America’s premier outdoor music festivals, the Winnipeg Folk Festival attracts an attendance over 40,000 every July.

B u D g E T 2 0 0 8 T h e M a n i t o b a A d v a n t a g e / D 1 1
provincial support for Arts and Culture
Culture and the arts are actively supported by the Manitoba government. The Manitoba government directly spent over $112 million on culture during the 2003/04 fiscal year, the latest period for which Statistics Canada’s data on culture funding is available. At $96 per person, Manitoba had the second-highest provincial per capita spending on culture. Manitoba also has the second-highest per capita provincial funding of the performing arts among provinces. The Province also provides substantial support to cultural organizations in Manitoba through tax credits on charitable contributions to these organizations.
Arts and culture play a key role in enhancing our economy and economic competitiveness. Manitoba has one of the highest per capita revenue and attendance levels for arts and culture in Canada, and the sector employs over 14,000 people. A recent study by the Canada West Foundation, Culture and Economic Competitiveness, highlights the social benefits that cultural industries can provide. These include improving health and well-being, enhancing community identity and social cohesion, and facilitating community revitalization.
Provincial Government Per CapitaExpenditures on Culture, 2003/04
File: Culture_07.epsCreated: Feb 20, 2006Revised: March 29, 2007Fixed:
Dollars per capita
Source: Statistics Canada
QC MB SK PE NL NB BC AB NS ON0
25
50
75
125
100

D 1 2 / T h e M a n i t o b a A d v a n t a g e B u D g E T 2 0 0 8
n appendix 1: 2008 inTERPRovinCiaL CoMPaRiSon of PERSonaL CoSTS anD TaxES
Since 1999, Manitoba’s overall provincial rankings for personal costs and taxes have been among the best in Canada. For 2008, Manitoba ranks among the best three in total costs among the six representative families.
The following charts show that Manitoba remains one of the most affordable provinces in which to live, with among the lowest costs for child care, gasoline tax, automobile insurance, electricity and housing costs.
A superior quality of living with lower personal costs and taxes – that is The Manitoba Advantage.
File: single_earner_30000_08.epsCreated: Fri, Apr 4, 2008Revised:Fixed:
* includes income tax, retail sales tax, healthpremiums, rent, public transit costs, telephoneservice, electricity and heating
0 5 10 15
ON
BC
NS
AB
NL
NB
QC
PE
MB
SK
Single Person Earning $30,000*Thousands of Dollars
0 5 10 15 20 3025
ON
BC
NS
NL
NB
AB
PE
MB
SK
QC
Single Parent Earning $30,000*Thousands of Dollars
File: single_parent_30000_08.epsCreated: Fri, Apr 4, 2008Revised: Fixed:
Annual personal Costs and Taxes single person Earning $30,000• third-lowestcombinedtaxesandliving
costs in the country• fifth-lowestprovinciallevies
Annual personal Costs and Taxes single parent Earning $30,000
• third-lowestcombinedtaxesandlivingcosts in the country
• fourth-lowestprovinciallevies
B u D g E T 2 0 0 8 T h e M a n i t o b a A d v a n t a g e / D 1 3
Two-Earner Family of FourEarning $60,000*
Thousands of Dollars
ON
BC
AB
NL
NS
NB
QC
MB
PE
SK
0 10 20 30 40 50
File: two_earner_fam4_60000_08.epsCreated: Fri, Apr 4, 2008Revised: 1/Sun, Apr 6, 2008Fixed:
Two-Earner Family of FiveEarning $75,000*
Thousands of Dollars
ON
BC
AB
NL
NS
NB
PE
MB
QC
SK
* includes income tax, retail sales and gasolinetaxes, health premiums, mortgage costs, childcare, auto insurance, telephone service,electricity, heating and property taxes
0 10 20 30 40 50 60 70
File: two_earner_fam5_75000_08.epsCreated: Fri, Apr 4, 2008Revised:Fixed:
100 20 30 40* Includes income tax, retail sales tax and gasoline
taxes, health premiums, child benefits, mortgagecosts, auto insurance, telephone service,electricity, heating and property taxes.
Single-Earner FEarning $40,000*
BC
ON
AB
NS
QC
NB
NL
SK
PE
MB
amily of Four
Thousands of Dollars
File: one_earner_fam4_40000_08.epsCreated: Fri, Apr 4, 2008Revised:Fixed:
* Includes income tax, retail sales tax andgasoline taxes, health premiums, mortgagecosts, auto insurance, telephone service,electricity, heating and property taxes.
0 10 20 30 40
Single-Earner FEarning $60,000*
BC
ON
AB
QC
NL
NB
NS
PE
MB
SK
amily of Four
Thousands of Dollars
File: one_earner_fam4_60000_08.epsCreated: Fri, Apr 4, 2008Revised:Fixed:
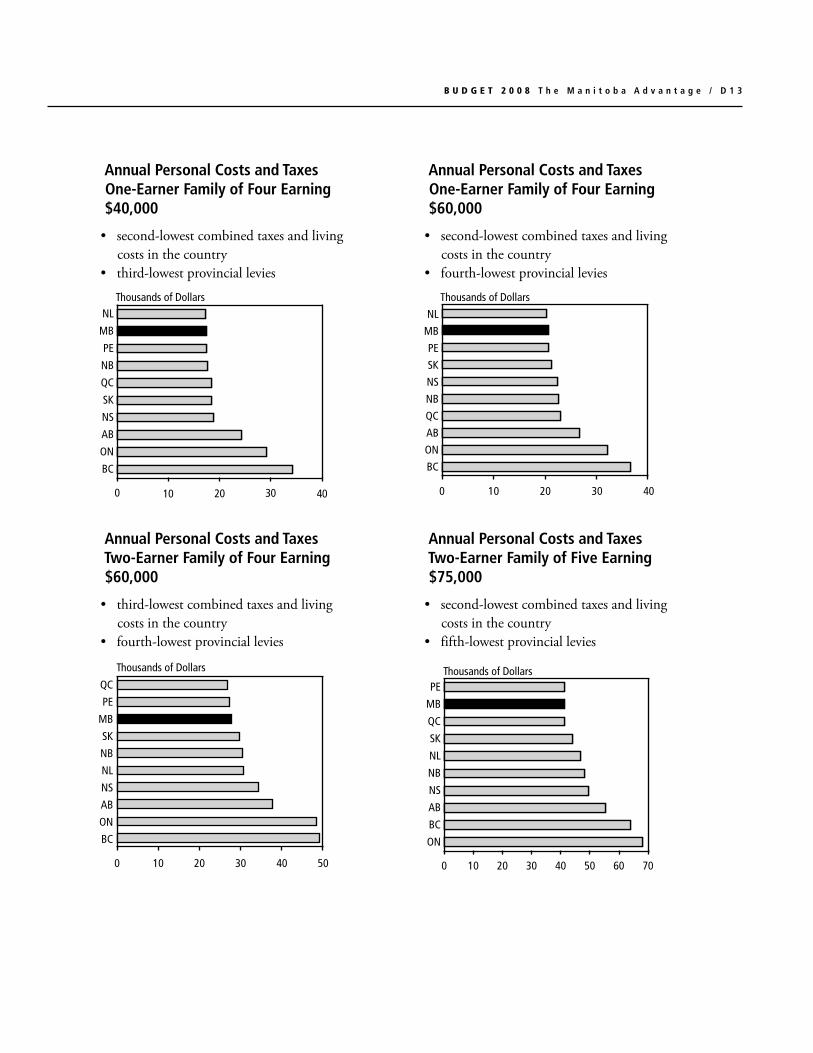
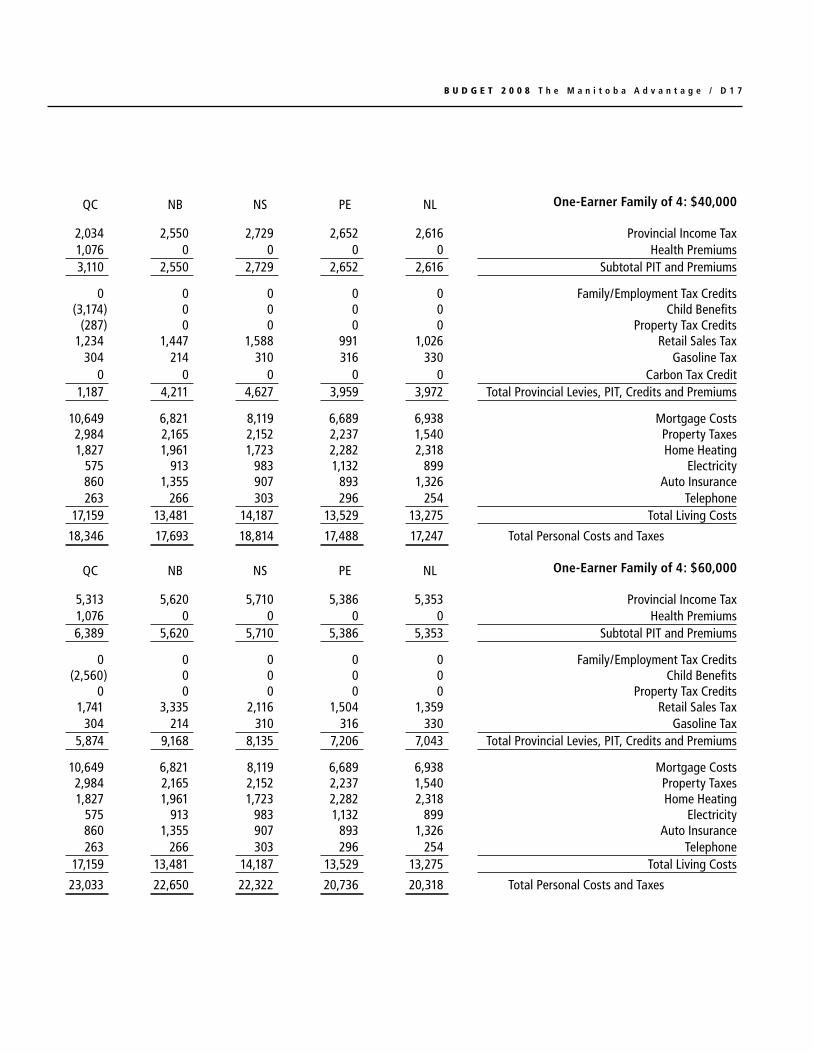
Annual personal Costs and Taxes One-Earner family of four Earning $40,000
• second-lowestcombinedtaxesandlivingcosts in the country
• third-lowestprovinciallevies
Annual personal Costs and Taxes One-Earner family of four Earning $60,000
• second-lowestcombinedtaxesandlivingcosts in the country
• fourth-lowestprovinciallevies
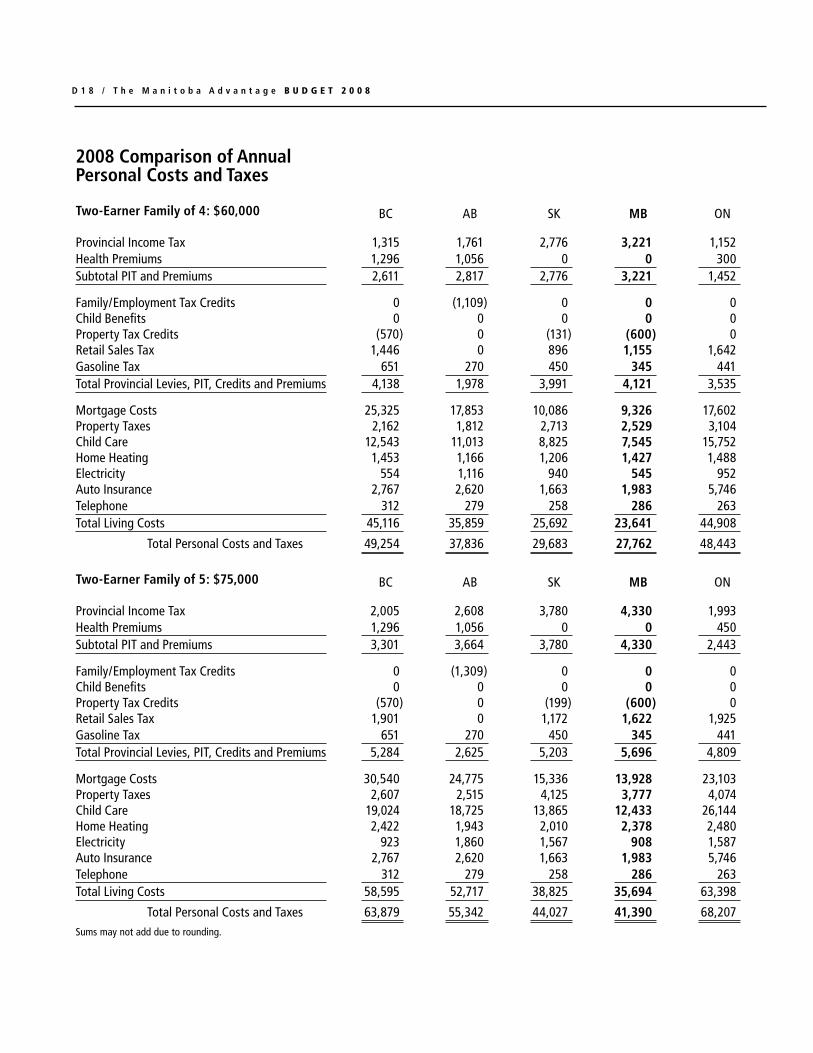
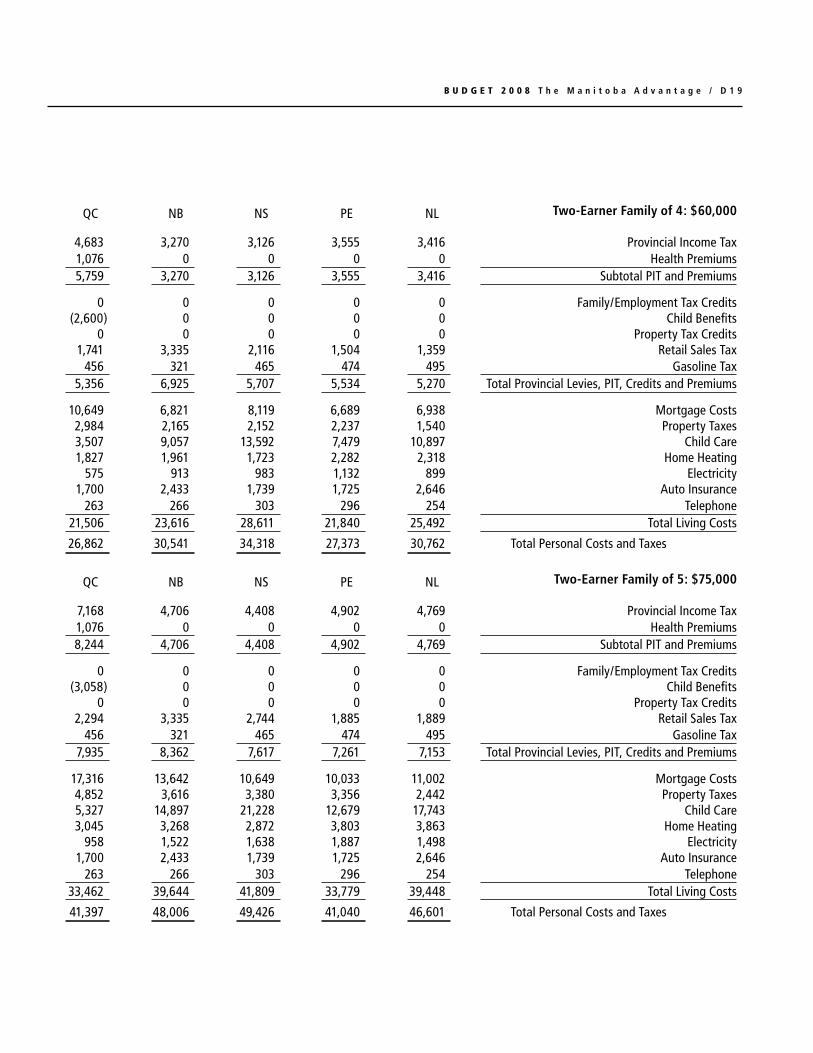
Annual personal Costs and Taxes Two-Earner family of four Earning $60,000
• third-lowestcombinedtaxesandlivingcosts in the country
• fourth-lowestprovinciallevies
Annual personal Costs and Taxes Two-Earner family of five Earning $75,000
• second-lowestcombinedtaxesandlivingcosts in the country
• fifth-lowestprovinciallevies

D 1 4 / T h e M a n i t o b a A d v a n t a g e B u D g E T 2 0 0 8
2008 Comparison of Annual personal Costs and Taxes
single person: $30,000 BC AB SK MB ON
Provincial Income Tax 920 1,201 2,011 1,595 1,133 Health Premiums 648 528 0 0 300 Subtotal PIT and Premiums 1,568 1,729 2,011 1,595 1,433
Retail Sales Tax 411 0 211 299 415 Carbon Tax Credit (100) 0 0 0 0 Total Provincial Levies, PIT, Credits and Premiums 1,879 1,729 2,222 1,893 1,848
Rent 10,152 10,764 6,648 6,936 10,800 Electricity 308 620 522 303 529 Public Transit 748 900 684 855 1,180 Telephone 312 279 258 286 263 Total Living Costs 11,519 12,563 8,113 8,380 12,772
Total Personal Costs and Taxes 13,398 14,292 10,334 10,273 14,620
single parent One Child: $30,000 BC AB SK MB ON
Provincial Income Tax 54 0 701 8 (225)Health Premiums 691 0 0 0 252 Subtotal PIT and Premiums 746 0 701 8 27
Family/Employment Tax Credits 0 (581) 0 0 0 Child Benefits 0 0 0 0 (1,238)Retail Sales Tax 534 0 274 388 539 Carbon Tax Credit (200) 0 0 0 0 Total Provincial Levies, PIT, Credits and Premiums 1,080 (581) 975 396 (671)
Rent 13,008 13,068 7,932 8,880 12,732 Child Care 7,446 7,435 4,944 4,888 10,392 Electricity 410 827 696 404 705 Transit 748 900 684 855 1,180 Telephone 312 279 258 286 263 Total Living Costs 21,924 22,508 14,515 15,313 25,272
Total Personal Costs and Taxes 23,004 21,927 15,490 15,709 24,601 Sums may not add due to rounding.

B u D g E T 2 0 0 8 T h e M a n i t o b a A d v a n t a g e / D 1 5
QC NB NS PE NL single person: $30,000
1,110 2,001 1,822 2,005 1,792 Provincial Income Tax538 0 0 0 0 Health Premiums
1,648 2,001 1,822 2,005 1,792 Subtotal PIT and Premiums
189 559 603 396 364 Retail Sales Tax0 0 0 0 0 Carbon Tax Credit
1,837 2,560 2,424 2,402 2,156 Total Provincial Levies, PIT, Credits and Premiums
6,972 7,032 7,908 6,288 6,540 Rent319 507 546 629 499 Electricity795 780 720 816 780 Public Transit263 266 303 296 254 Telephone
8,350 8,586 9,477 8,029 8,073 Total Living Costs
10,187 11,146 11,901 10,431 10,230 Total Personal Costs and Taxes
QC NB NS PE NL single parent One Child: $30,000
1,591 243 570 972 800 Provincial Income Tax538 0 0 0 0 Health Premiums
2,129 243 570 972 800 Subtotal PIT and Premiums
0 0 0 0 0 Family/Employment Tax Credits(2,857) (116) 0 0 0 Child Benefits
362 727 783 515 473 Retail Sales Tax0 0 0 0 0 Carbon Tax Credit
(366) 855 1,353 1,487 1,273 Total Provincial Levies, PIT, Credits and Premiums
7,764 8,412 9,780 7,908 7,368 Rent1,820 5,823 7,636 5,200 6,422 Child Care
426 676 728 839 666 Electricity795 780 720 816 780 Transit263 266 303 296 254 Telephone
11,068 15,958 19,167 15,059 15,489 Total Living Costs
10,702 16,812 20,520 16,546 16,763 Total Personal Costs and Taxes
D 1 6 / T h e M a n i t o b a A d v a n t a g e B u D g E T 2 0 0 8
2008 Comparison of Annual personal Costs and Taxes
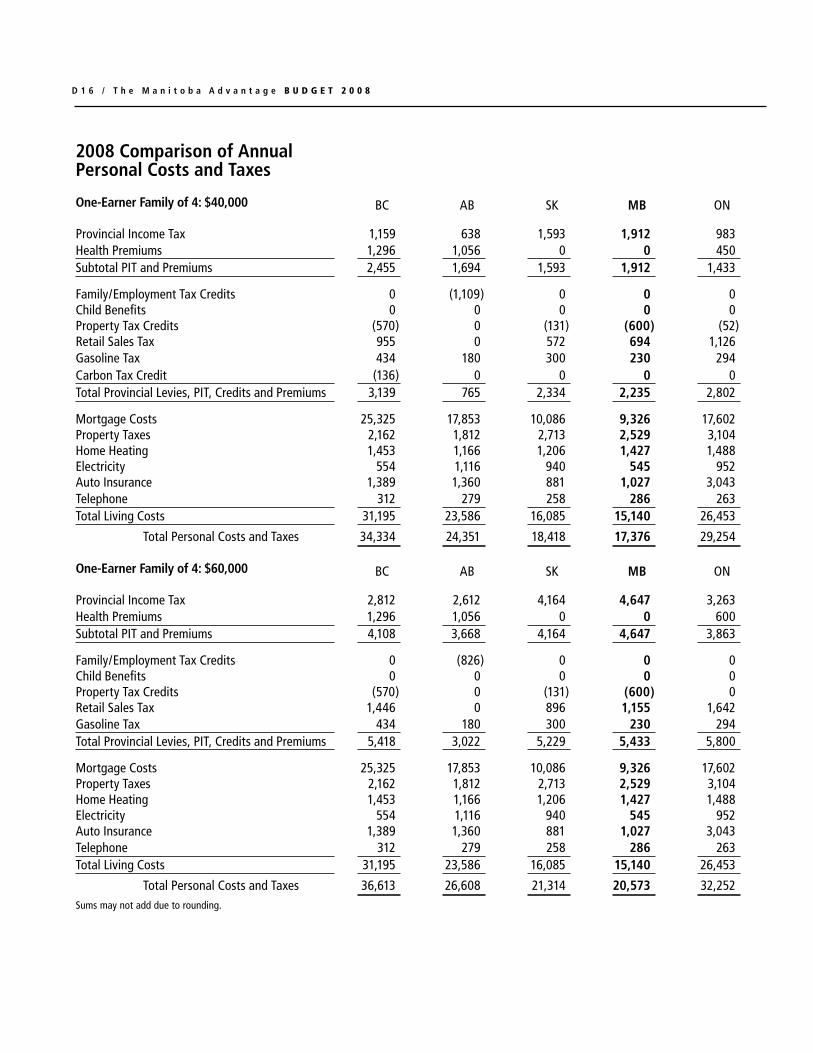
One-Earner family of 4: $40,000 BC AB SK MB ON
Provincial Income Tax 1,159 638 1,593 1,912 983 Health Premiums 1,296 1,056 0 0 450 Subtotal PIT and Premiums 2,455 1,694 1,593 1,912 1,433
Family/Employment Tax Credits 0 (1,109) 0 0 0 Child Benefits 0 0 0 0 0 Property Tax Credits (570) 0 (131) (600) (52)Retail Sales Tax 955 0 572 694 1,126 Gasoline Tax 434 180 300 230 294 Carbon Tax Credit (136) 0 0 0 0 Total Provincial Levies, PIT, Credits and Premiums 3,139 765 2,334 2,235 2,802
Mortgage Costs 25,325 17,853 10,086 9,326 17,602 Property Taxes 2,162 1,812 2,713 2,529 3,104 Home Heating 1,453 1,166 1,206 1,427 1,488 Electricity 554 1,116 940 545 952 Auto Insurance 1,389 1,360 881 1,027 3,043 Telephone 312 279 258 286 263 Total Living Costs 31,195 23,586 16,085 15,140 26,453
Total Personal Costs and Taxes 34,334 24,351 18,418 17,376 29,254
One-Earner family of 4: $60,000 BC AB SK MB ON
Provincial Income Tax 2,812 2,612 4,164 4,647 3,263 Health Premiums 1,296 1,056 0 0 600 Subtotal PIT and Premiums 4,108 3,668 4,164 4,647 3,863
Family/Employment Tax Credits 0 (826) 0 0 0 Child Benefits 0 0 0 0 0 Property Tax Credits (570) 0 (131) (600) 0 Retail Sales Tax 1,446 0 896 1,155 1,642 Gasoline Tax 434 180 300 230 294 Total Provincial Levies, PIT, Credits and Premiums 5,418 3,022 5,229 5,433 5,800
Mortgage Costs 25,325 17,853 10,086 9,326 17,602 Property Taxes 2,162 1,812 2,713 2,529 3,104 Home Heating 1,453 1,166 1,206 1,427 1,488 Electricity 554 1,116 940 545 952 Auto Insurance 1,389 1,360 881 1,027 3,043 Telephone 312 279 258 286 263 Total Living Costs 31,195 23,586 16,085 15,140 26,453
Total Personal Costs and Taxes 36,613 26,608 21,314 20,573 32,252 Sums may not add due to rounding.
B u D g E T 2 0 0 8 T h e M a n i t o b a A d v a n t a g e / D 1 7
QC NB NS PE NL One-Earner family of 4: $40,000
2,034 2,550 2,729 2,652 2,616 Provincial Income Tax1,076 0 0 0 0 Health Premiums3,110 2,550 2,729 2,652 2,616 Subtotal PIT and Premiums
0 0 0 0 0 Family/Employment Tax Credits(3,174) 0 0 0 0 Child Benefits
(287) 0 0 0 0 Property Tax Credits1,234 1,447 1,588 991 1,026 Retail Sales Tax
304 214 310 316 330 Gasoline Tax0 0 0 0 0 Carbon Tax Credit
1,187 4,211 4,627 3,959 3,972 Total Provincial Levies, PIT, Credits and Premiums
10,649 6,821 8,119 6,689 6,938 Mortgage Costs2,984 2,165 2,152 2,237 1,540 Property Taxes1,827 1,961 1,723 2,282 2,318 Home Heating
575 913 983 1,132 899 Electricity860 1,355 907 893 1,326 Auto Insurance263 266 303 296 254 Telephone
17,159 13,481 14,187 13,529 13,275 Total Living Costs
18,346 17,693 18,814 17,488 17,247 Total Personal Costs and Taxes
QC NB NS PE NL One-Earner family of 4: $60,000
5,313 5,620 5,710 5,386 5,353 Provincial Income Tax1,076 0 0 0 0 Health Premiums6,389 5,620 5,710 5,386 5,353 Subtotal PIT and Premiums
0 0 0 0 0 Family/Employment Tax Credits(2,560) 0 0 0 0 Child Benefits
0 0 0 0 0 Property Tax Credits1,741 3,335 2,116 1,504 1,359 Retail Sales Tax
304 214 310 316 330 Gasoline Tax5,874 9,168 8,135 7,206 7,043 Total Provincial Levies, PIT, Credits and Premiums
10,649 6,821 8,119 6,689 6,938 Mortgage Costs2,984 2,165 2,152 2,237 1,540 Property Taxes1,827 1,961 1,723 2,282 2,318 Home Heating
575 913 983 1,132 899 Electricity860 1,355 907 893 1,326 Auto Insurance263 266 303 296 254 Telephone
17,159 13,481 14,187 13,529 13,275 Total Living Costs
23,033 22,650 22,322 20,736 20,318 Total Personal Costs and Taxes
D 1 8 / T h e M a n i t o b a A d v a n t a g e B u D g E T 2 0 0 8
2008 Comparison of Annual personal Costs and Taxes
Two-Earner family of 4: $60,000 BC AB SK MB ON
Provincial Income Tax 1,315 1,761 2,776 3,221 1,152 Health Premiums 1,296 1,056 0 0 300 Subtotal PIT and Premiums 2,611 2,817 2,776 3,221 1,452
Family/Employment Tax Credits 0 (1,109) 0 0 0 Child Benefits 0 0 0 0 0 Property Tax Credits (570) 0 (131) (600) 0 Retail Sales Tax 1,446 0 896 1,155 1,642 Gasoline Tax 651 270 450 345 441 Total Provincial Levies, PIT, Credits and Premiums 4,138 1,978 3,991 4,121 3,535
Mortgage Costs 25,325 17,853 10,086 9,326 17,602 Property Taxes 2,162 1,812 2,713 2,529 3,104 Child Care 12,543 11,013 8,825 7,545 15,752 Home Heating 1,453 1,166 1,206 1,427 1,488 Electricity 554 1,116 940 545 952 Auto Insurance 2,767 2,620 1,663 1,983 5,746 Telephone 312 279 258 286 263 Total Living Costs 45,116 35,859 25,692 23,641 44,908
Total Personal Costs and Taxes 49,254 37,836 29,683 27,762 48,443
Two-Earner family of 5: $75,000 BC AB SK MB ON
Provincial Income Tax 2,005 2,608 3,780 4,330 1,993 Health Premiums 1,296 1,056 0 0 450 Subtotal PIT and Premiums 3,301 3,664 3,780 4,330 2,443
Family/Employment Tax Credits 0 (1,309) 0 0 0 Child Benefits 0 0 0 0 0 Property Tax Credits (570) 0 (199) (600) 0 Retail Sales Tax 1,901 0 1,172 1,622 1,925 Gasoline Tax 651 270 450 345 441 Total Provincial Levies, PIT, Credits and Premiums 5,284 2,625 5,203 5,696 4,809
Mortgage Costs 30,540 24,775 15,336 13,928 23,103 Property Taxes 2,607 2,515 4,125 3,777 4,074 Child Care 19,024 18,725 13,865 12,433 26,144 Home Heating 2,422 1,943 2,010 2,378 2,480 Electricity 923 1,860 1,567 908 1,587 Auto Insurance 2,767 2,620 1,663 1,983 5,746 Telephone 312 279 258 286 263 Total Living Costs 58,595 52,717 38,825 35,694 63,398
Total Personal Costs and Taxes 63,879 55,342 44,027 41,390 68,207 Sums may not add due to rounding.
B u D g E T 2 0 0 8 T h e M a n i t o b a A d v a n t a g e / D 1 9
QC NB NS PE NL Two-Earner family of 4: $60,000
4,683 3,270 3,126 3,555 3,416 Provincial Income Tax1,076 0 0 0 0 Health Premiums5,759 3,270 3,126 3,555 3,416 Subtotal PIT and Premiums
0 0 0 0 0 Family/Employment Tax Credits(2,600) 0 0 0 0 Child Benefits
0 0 0 0 0 Property Tax Credits1,741 3,335 2,116 1,504 1,359 Retail Sales Tax
456 321 465 474 495 Gasoline Tax5,356 6,925 5,707 5,534 5,270 Total Provincial Levies, PIT, Credits and Premiums
10,649 6,821 8,119 6,689 6,938 Mortgage Costs2,984 2,165 2,152 2,237 1,540 Property Taxes3,507 9,057 13,592 7,479 10,897 Child Care1,827 1,961 1,723 2,282 2,318 Home Heating
575 913 983 1,132 899 Electricity1,700 2,433 1,739 1,725 2,646 Auto Insurance
263 266 303 296 254 Telephone21,506 23,616 28,611 21,840 25,492 Total Living Costs
26,862 30,541 34,318 27,373 30,762 Total Personal Costs and Taxes
QC NB NS PE NL Two-Earner family of 5: $75,000
7,168 4,706 4,408 4,902 4,769 Provincial Income Tax1,076 0 0 0 0 Health Premiums8,244 4,706 4,408 4,902 4,769 Subtotal PIT and Premiums
0 0 0 0 0 Family/Employment Tax Credits(3,058) 0 0 0 0 Child Benefits
0 0 0 0 0 Property Tax Credits2,294 3,335 2,744 1,885 1,889 Retail Sales Tax
456 321 465 474 495 Gasoline Tax7,935 8,362 7,617 7,261 7,153 Total Provincial Levies, PIT, Credits and Premiums
17,316 13,642 10,649 10,033 11,002 Mortgage Costs4,852 3,616 3,380 3,356 2,442 Property Taxes5,327 14,897 21,228 12,679 17,743 Child Care3,045 3,268 2,872 3,803 3,863 Home Heating
958 1,522 1,638 1,887 1,498 Electricity1,700 2,433 1,739 1,725 2,646 Auto Insurance
263 266 303 296 254 Telephone33,462 39,644 41,809 33,779 39,448 Total Living Costs
41,397 48,006 49,426 41,040 46,601 Total Personal Costs and Taxes

D 2 0 / T h e M a n i t o b a A d v a n t a g e B u D g E T 2 0 0 8
MB BC NS NB ON AB SK NF PE QC0
1,000
2,000
3,000
4,000
5,000
6,000
Net Taxes - Graduate Earning $50,000
File: Net_Tax_Grad_50k.epsCreated: Friday, 4 April, 2008Revised:Fixed:
Dollars
Source:Manitoba Finance
Personal Costs and Net Taxes - Graduate Earning $50,000
File: PerCosts_Net_Tax_Grad_50k.epsCreated: Friday, 4 April, 2008Revised:Fixed:
Dollars
Source: Manitoba Finance
MB NB NS PE NF SK QC AB ON BC0
5,000
10,000
15,000
20,000
25,000
30,000
35,000
40,000
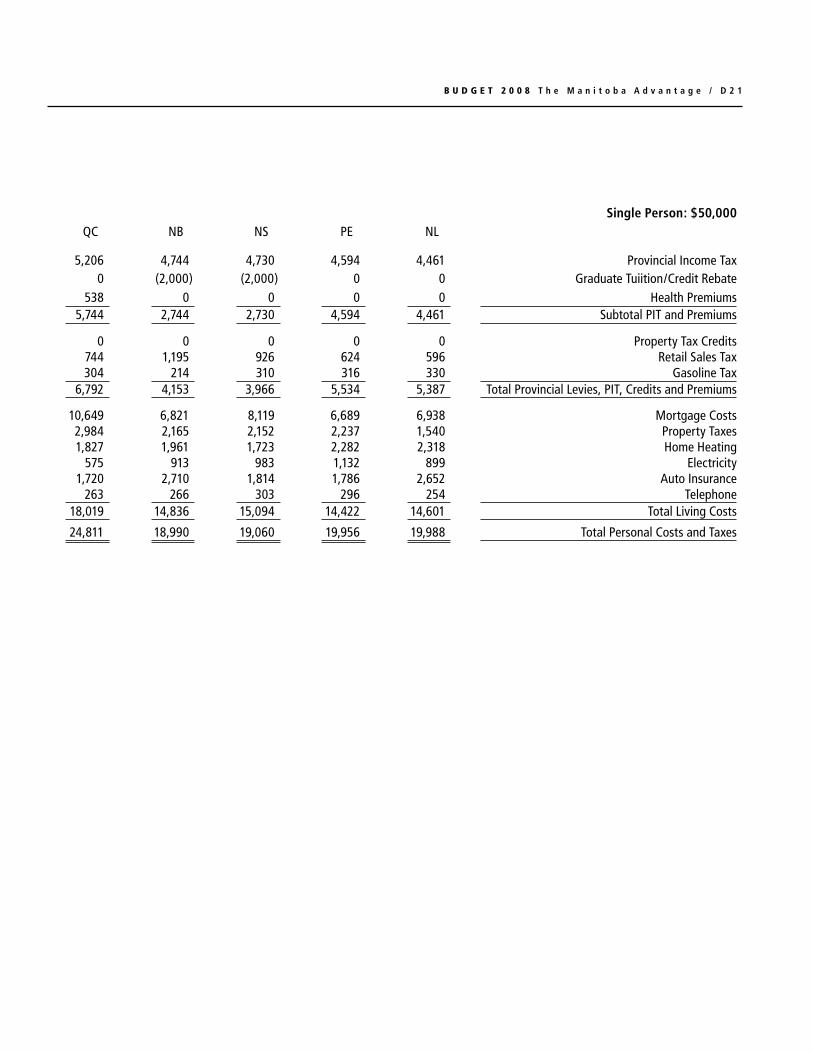
Interprovincial Comparison of Taxes Net of Graduate Credits and Tuition rebates and of personal Costs and Taxes
single person: $50,000 BC AB SK MB ON
Provincial Income Tax 2,404 3,108 4,430 4,633 2,766 Graduate Tuition/Credit Rebate 0 0 (1,000) (2,500) 0Health Premiums 648 528 0 0 600 Subtotal PIT and Premiums 3,052 3,636 3,430 2,133 3,366
Property Tax Credits (570) 0 (131) (600) 0 Retail Sales Tax 600 0 367 462 692 Gasoline Tax 434 180 300 230 294 Total Provincial Levies, PIT, Credits and Premiums 3,517 3,816 3,966 2,226 4,352
Mortgage Costs 25,325 17,853 10,086 9,326 17,602 Property Taxes 2,162 1,812 2,713 2,529 3,104 Home Heating 1,453 1,166 1,206 1,427 1,488 Electricity 554 1,116 940 545 952 Auto Insurance 2,778 2,720 1,762 2,054 6,086 Telephone 312 279 258 286 263 Total Living Costs 32,584 24,946 16,966 16,167 29,496
Total Personal Costs and Taxes 36,101 28,762 20,931 18,393 33,848 Sums may not add due to rounding.
B u D g E T 2 0 0 8 T h e M a n i t o b a A d v a n t a g e / D 2 1
single person: $50,000QC NB NS PE NL
5,206 4,744 4,730 4,594 4,461 Provincial Income Tax0 (2,000) (2,000) 0 0 Graduate Tuiition/Credit Rebate
538 0 0 0 0 Health Premiums5,744 2,744 2,730 4,594 4,461 Subtotal PIT and Premiums
0 0 0 0 0 Property Tax Credits744 1,195 926 624 596 Retail Sales Tax304 214 310 316 330 Gasoline Tax
6,792 4,153 3,966 5,534 5,387 Total Provincial Levies, PIT, Credits and Premiums
10,649 6,821 8,119 6,689 6,938 Mortgage Costs2,984 2,165 2,152 2,237 1,540 Property Taxes1,827 1,961 1,723 2,282 2,318 Home Heating
575 913 983 1,132 899 Electricity1,720 2,710 1,814 1,786 2,652 Auto Insurance
263 266 303 296 254 Telephone18,019 14,836 15,094 14,422 14,601 Total Living Costs
24,811 18,990 19,060 19,956 19,988 Total Personal Costs and Taxes

D 2 2 / T h e M a n i t o b a A d v a n t a g e B u D g E T 2 0 0 8
NOTEs
Personal income taxes1, charges and living costs are based on information available on March 31, 2008, for the following major urban centres in each province: Vancouver, Calgary, Regina, Winnipeg, Toronto, Montréal, Fredericton, Halifax, Charlottetown and St. John’s. The methods used to calculate Mortgage Costs, Property Taxes, Retail Sales Tax, Home Heating and Electricity have changed from prior years’ methods. As a result, these costs and taxes are not comparable to other years.
Auto Insurance coverage includes $2 million Third Party Liability, a $500 All Perils Deductible, accident benefit and $2 million Standard Policy Form #44 family protection coverage for those jurisdictions without no-fault injury coverage, and SAAQ (La Societé de l’assurance automobile du Québec) injury protection in Montréal. The driver is married, age 35, has been accident- and conviction-free for 15 or more years; the auto is driven to work (a distance of 15 km one way was used when required by insurers). Rates were provided by The Insurance Corporation of British Columbia (BC), SGI Canada (SK), and Manitoba Public Insurance (MB) for those provinces. Rates from other urban centres are the average of the quotes from 10 private insurers available in those provinces. Discounts for second or multiple vehicles are not included in the auto insurance calculations. Auto insurance for the 2002 Chevrolet Cavalier and the 2000 Dodge Caravan are used in these examples. The single earner families of four at $40,000 and $60,000 insure the Cavalier, while the two-earner family of four at $60,000 and the two-earner family of five at $75,000 insure both the Cavalier and the Caravan.
Child Care is based on average fees for full-time preschool care for a three year old and a five year old, before and after school care for a seven year old, and six weeks of summer day camp for a seven year old. Quebec figures are based on $7 per day for care. Average fees were based on Early Childhood Care and Education in Canada: Provinces and Territories, published by Childcare Resource and Research Unit, and were updated by a survey by Manitoba Finance of different cities.
Electricity charges are based on an annual consumption of 8,100 kWh for a detached bungalow for families with $40,000 and $60,000 of income, as per the 2007 Basic Utility Bundle Review (Crown Investments Corporation of Saskatchewan). Annual consumption for the detached bungalow has been proportionally adjusted for the other families: 4,500 kWh for the single person at $30,000; 6,000 kWh for the single parent at $30,000; and 13,500 kWh for the family at $75,000. Rates do not include municipal taxes or charges.
Gasoline Tax is based on annual consumption of 2,000 litres for the single-vehicle families and 3,000 litres for the two-vehicle families; this includes the 6 cents and 1.5 cents per litre levies applied by Vancouver and Montréal, respectively. Provincial sales tax has been applied to the wholesale price in Prince Edward Island and the BC Carbon Tax, which comes into effect July 1, 2008, has been included in the amount for Vancouver.
Health premiums are annual premiums for hospital insurance and medical services in provinces which levy them. Quebec’s Prescription Drug Plan is included.
Home Heating charges are based on an annual consumption of 3,200 cubic metres for a detached bungalow for families with $40,000 and $60,000 of income, as per the 2007 Basic Utility Bundle Review (Crown Investments Corporation of Saskatchewan). Annual consumption for the detached bungalow has been proportionally adjusted for a family with $75,000 of income to reflect the consumption for an executive detached two storey. For the Atlantic provinces, the figures represent the BTU equivalent consumption of fuel oil. Refundable home-heating benefits have been deducted from home-heating costs in Alberta, Nova Scotia, and Newfoundland and Labrador.
B u D g E T 2 0 0 8 T h e M a n i t o b a A d v a n t a g e / D 2 3
Mortgage Costs are based on one-half the average home prices for a detached bungalow for families with $40,000 and $60,000 of income, and for the graduate with $50,000, and on an executive detached two storey for a family with $75,000 of income, per the Royal LePage Survey of Canadian House Prices, Fourth Quarter 2007, assuming a 25-year term, amortized at a five-year interest rate of 7.283%.
Net Child Benefits represent provincial programs comparable to the Canada Child Tax Benefit for families with children. Provincial child benefit measures are available in British Columbia (BC Family Bonus), Alberta (Family Employment Credit), Ontario (Child Care Supplement for Working Families), Quebec (Child Assistance Payments), New Brunswick (Child Tax Benefit), Nova Scotia (Child Benefit), and Newfoundland and Labrador (Child Benefit).
property Taxes are based on the assessed values for a detached bungalow for families with $40,000 and $60,000 of income, as per the 2007 Residential Property Taxes and Utility Charges Survey (City of Edmonton). Property taxes for the detached bungalow have been proportionally adjusted for a family with $75,000 of income to reflect the taxes paid for an executive detached two storey.
provincial Income Tax is calculated for a single renter with $30,000 earned income, a single parent with one child who rents and has $30,000 in earned income2, and three homeowners with $40,000, $60,000 and $75,000 of earned income2, respectively. Families include one income earner, a spouse and two dependent children (ages 3 and 7), two income earners and two dependent children (ages 3 and 7), or two income earners and three dependent children (ages 3, 5 and 7). For two-earner families, one spouse is assumed to earn 60% of the family income while the other spouse earns 40%. Personal non-refundable credits used include the CPP/QPP and EI contribution credits. For the single parent, child-care costs unique to each province have been deducted from income. For two-earner families, child-care costs have been deducted from the income of the spouse with the lower income. Gross Quebec personal income tax has been reduced by the 16.5% abatement from federal income tax. Refundable sales tax credits and provincial tax reductions and rebates have been deducted from income tax payable. Rental credits are included in income tax, but property tax credits are shown separately.
rent is from Canada Mortgage and Housing Corporation’s Rental Market Survey, October 2007, and is based on the average one-bedroom apartment rent for each urban centre for the single person, and the average two-bedroom apartment rent for the single-parent family.
retail sales Tax is based upon an average expenditure basket at the selected gross income levels from the 2006 Survey of Household Spending (Statistics Canada), inflated to 2008 values and adjusted for family size.
Transit fares are based on adult (single zone) monthly pass rates in effect in February 2008. The Charlottetown fare is based on adult tickets for 240 working days. The full impact of the federal non-refundable public transit tax credit has reduced the cost of transit fees shown for the single individual and single parent with one child examples.
Telephone charges are the basic service rates for individual residences.
1 Tables reflect 2008 budget changes for British Columbia, Saskatchewan, Ontario, Quebec and New Brunswick, as well as the federal budget.2 Earned income is net of the Universal Child Care Benefit. However, the Universal Child Care Benefit has been used in the calculation of taxable
income.

D 2 4 / T h e M a n i t o b a A d v a n t a g e B u D g E T 2 0 0 8
B u D g E T 2 0 0 8 T h e M a n i t o b a A d v a n t a g e / D 2 5
n appendix 2: ManiToBa’S CoMPETiTivE EnviRonMEnT foR ManufaCTuRing
In 2007, manufacturing firms in Manitoba employed 70,000 people, the highest level of manufacturing employment ever recorded in the province. Manufacturing jobs equal about 12% of Manitoba’s total employment, and only in Quebec and Ontario do manufacturing jobs account for a greater proportion of workers (about 14%). Many more Manitobans work in other industries that directly or indirectly depend on manufacturing activities.
Manufacturing is the largest economic sector in the province, accounting for approximately 12% of provincial GDP, about 70% of total foreign merchandise exports and 71% of Manitoba’s merchandise exports to the United States.
Manitoba’s manufacturing sales grew over 8% in 2007, second strongest among provinces and well above the national increase of only 0.3%. Manitoba’s manufacturing sales have equalled or bettered Canada’s growth for seven consecutive years.
Manitoba’s manufacturing sector is highly diversified, producing a broad range of industrial and consumer goods. Major manufactured goods include urban and intercity buses, aerospace equipment, primary metals, industrial chemicals, machinery, pharmaceuticals, processed meats, processed vegetables and grain products, furniture, plastic products, manufactured windows and fabricated metals. Manitoba is North America’s largest manufacturer of buses. Canada’s largest furniture factory, owned by Palliser Furniture Ltd., is located in Manitoba. Maple Leaf Foods operates one of the world’s largest and most technologically advanced meat processing plants in Brandon, Manitoba’s second-largest city.
Manitoba’s competitive business environment continues to attract manufacturing investment. Manufacturers are taking advantage of the province’s central location and its excellent transportation links to the rest of North America. Industrial and commercial land costs are lower than in many other major metropolitan centres, and Manitoba’s electricity costs are among the lowest in North America. Manitoba has a skilled and well-educated work force ready to take advantage of the opportunities provided by the province’s growing manufacturing sector.
Manitoba Finance’s competitiveness model is used to compare the tax structure and cost environment for representative small and larger manufacturing firms. The model is used to assess Manitoba’s competitive position relative to several other North American cities.
The model simulates start-up costs, operating costs, and financial and taxation profiles over a period of 20 years. It incorporates future changes in taxes that have been announced by the federal and provincial or state governments as of April 1, 2008. Manitoba measures that have been announced but are subject to budget balancing requirements have not been incorporated in the model. The representative firms’ profiles have been updated using the most recent data available from Statistics Canada, local economic development boards and other public information sources.

D 2 6 / T h e M a n i t o b a A d v a n t a g e B u D g E T 2 0 0 8
Interjurisdiction Competitiveness
The following indicators are used to assess cost and tax competitiveness for both a small and a larger manufacturing firm over a 20-year period:
net cost of investment, or start-up costs (including applicable taxes)•
pre-tax net income•
effective tax rates•
internal rates of return•
The model assumes actual costs for each city and calculates net revenue and cash flow, including start-up costs, based on the operating costs in each location. The results for each city are compared to the overall average of all cities for each of the indicators and presented in the charts that follow.
Net Cost of Investment
The costs of starting a manufacturing plant (land, buildings, and machinery and equipment) are lower in Manitoba than the average for all cities. Taxes have a negligible impact on net start-up costs. Investment tax credits on capital asset purchases reduce the net cost of investment. The net cost of investment for larger metropolitan centres tends to be higher than the overall average, primarily because of the cost of land and construction labour costs. Construction wages in Manitoba cities have increased at a higher rate than the average, but investment tax credits on capital assets have mitigated the increased construction costs.
File: NetCostSM_08.epsCreated: Fri, April 4, 2008Revised:Fixed:
Net Cost of InvestmentSmall Manufacturing Firm
Average = 100.0
Vancouver
TorontoCalgary
Chicago
Minneapolis
Montréal
Winnipeg
Regina
Fargo
BrandonHalifax
Moncton
0 25 50 75 100 125 150
Net Cost of InvestmentLarger Manufacturing Firm
Average = 100.0
Vancouver
TorontoChicagoCalgary
MinneapolisMontréal
Regina
FargoWinnipeg
BrandonHalifax
Moncton
0 25 50 75 100 125 150
File: NetCostLG_08.epsCreated: Fri, 4 April, 2008Revised:Fixed:

B u D g E T 2 0 0 8 T h e M a n i t o b a A d v a n t a g e / D 2 7
pre-Tax Net Income
The model calculates pre-tax net income by subtracting from a common level of revenue the following location-sensitive operating costs:
average manufacturing wages•
local utility charges (electricity and telephone)•
interest costs•
capital depreciation•
Pre-tax net income is used to compare Manitoba’s cost competitiveness to the other locations. A higher pre-tax income indicates lower operating costs in a given jurisdiction. The sales figures used in the simulation model are fixed across the cities, $4 million for the small firm and $45 million for the larger firm, for years five through 20. Production material costs are expressed as a percentage of sales and are also fixed across jurisdictions.
Brandon yields the highest pre-tax net income for both the small and larger manufacturing firms, while Winnipeg has the third-highest pre-tax net income for both model firms. A talented, well-educated and productive labour force, low utility costs and lower than average start-up costs contribute to the cost advantages of operating a manufacturing plant in Manitoba.
File: PreTaxNetSM_08.epsCreated: Fri, April 4, 2008Revised:Fixed:
0 25 50 75 100 125
Pre-Tax Net IncomeSmall Manufacturing Firm
TorontoCalgary
VancouverMinneapolis
ReginaMontréalChicago
HalifaxMoncton
FargoWinnipeg
Brandon
Average = 100.0
Pre-Tax Net IncomeLarger Manufacturing Firm
File: PreTaxNetLG_08.epsCreated: Fri, 4 April, 2008Revised:Fixed:
Average = 100.0
TorontoCalgary
VancouverMinneapolis
Regina
Montréal
Halifax
Chicago
Moncton
FargoWinnipeg
Brandon
0 25 50 75 100 125

D 2 8 / T h e M a n i t o b a A d v a n t a g e B u D g E T 2 0 0 8
Effective Tax rates
Effective tax rates are generated by computing gross taxes as a proportion of pre-tax net income over the 20-year period. The following operating taxes are included in the analysis:
corporation income taxes•
local property and business taxes•
corporation capital and U.S. franchise taxes•
payroll taxes•
workers’ compensation premiums•
statutory pension and unemployment insurance premiums•
employer-paid health premiums•
The following tax expenditures that benefit the manufacturing sector are also taken into account:
investment tax credits•
tax holidays•
accelerated capital cost allowances•
preferential tax rates•
Not included in the model are enterprise zones, grants, and other forms of governmental and third-party financial assistance programs.
For both the small and larger manufacturing firms, Winnipeg’s effective tax rates are lower than both the overall average and the Canadian city average, and Brandon has the lowest effective tax rate. This is consistent with calculations on marginal effective tax rates (METRs) by the C.D. Howe Institute and Finance Canada, which both show that Manitoba has the lowest METR for manufacturing west of New Brunswick. The METR is lower in the Atlantic region because of the federal investment tax credit, which is available only in that region. These studies do not take into account the elimination of capital tax and reductions in Corporation Income Tax rates announced in the 2008 Manitoba Budget.
Overall Competitiveness
Overall competitiveness is compared by calculating internal rates of return. The internal rate of return is commonly used for business investment and location decision making. The model calculates the internal rate of return for each city using start-up costs and cash flow over the 20-year period, discounted using commercial interest rates specific to a small and a larger manufacturing firm. The following charts illustrate the combined effect of taxes and costs on the internal rates of return for the representative small and larger manufacturing firms in the selected jurisdictions.
The internal rates of return for both Winnipeg and Brandon are above the overall average of the cities included in the study. Brandon has the highest internal rate of return and Winnipeg has the third-highest internal rate of return for both the small and larger manufacturing firms. Among cities with populations over 500,000, Winnipeg has the highest internal rate of return for both small and larger manufacturing firms.

B u D g E T 2 0 0 8 T h e M a n i t o b a A d v a n t a g e / D 2 9
0 50 100 12525 75 150
Effective Tax RatesSmall Manufacturing Firm
Average = 100.0
File: EffectiveSM_08.epsCreated: April 4, 2008Revised:Fixed:
MinneapolisChicagoToronto
FargoMontréal
HalifaxVancouver
MonctonCalgary
WinnipegRegina
Brandon
Effective Tax RatesLarger Manufacturing Firm
Average = 100.0
File: EffectiveLG_08.epsCreated: Fri, 4 April, 2008Revised:Fixed:
0 50 100 12525 75 150
MinneapolisToronto
ChicagoHalifax
Fargo
MontréalVancouver
WinnipegMoncton
Calgary
BrandonRegina
Effective Tax RatesSmall Manufacturing FirmCanadian Cities
File: EffectiveSM/CANADIAN_08.epsCreated: Fri, April 4, 2008Revised:Fixed:
Average = 100.0
Toronto
Montréal
Halifax
Vancouver
Moncton
Calgary
Winnipeg
Regina
Brandon
0 25 50 75 100 125 150
Effective Tax RatesLarger Manufacturing FirmCanadian Cities
File: EffectiveLG/CANADIAN_08.epsCreated: Fri, 4 April, 2008 Revised:Fixed:
0 25 50 75 100 125
Average = 100.0
150
Toronto
Halifax
Montréal
Vancouver
Winnipeg
Moncton
Calgary
Brandon
Regina

D 3 0 / T h e M a n i t o b a A d v a n t a g e B u D g E T 2 0 0 8
Internal Rates of ReturnSmall Manufacturing Firm
Average = 100.0
Toronto
Vancouver
Calgary
Chicago
MinneapolisMontréal
Halifax
Regina
WinnipegMoncton
Fargo
Brandon
0 25 50 75 100 125
File: Internal_rates/SM_08.epsCreated: Friday, 4 April, 2008Revised:Fixed:
Internal Rates of ReturnLarger Manufacturing Firm
File: Internal_rates/LG_08.epsCreated: Fri, 4 April, 2008Revised:Fixed:
Average = 100.0
0 25 50 75 100 125
Toronto
VancouverCalgary
Minneapolis
Chicago
Montréal
HalifaxRegina
WinnipegMoncton
Fargo
Brandon
Internal Rates of ReturnSmall Manufacturing Firmin Cities over 500,000
File: Internal_SM/over_08.epsCreated: Fri, April 4, 2008Revised:Fixed:
Average = 100.0
Toronto
Vancouver
Calgary
Chicago
Minneapolis
Montréal
Winnipeg
0 25 50 75 100 125
Internal Rates of ReturnLarger Manufacturing Firmin Cities over 500,000
File: Internal_LG/over_08.epsCreated: Fri, 4 April. 2008Revised:Fixed:
0 25 50 75 100 125
Average = 100.0
Toronto
Vancouver
Calgary
Minneapolis
Chicago
Montréal
Winnipeg
n ConCLuSionManitoba continues to maintain a highly competitive cost and taxation environment for both small and larger firms engaged in manufacturing and processing.