Embed Size (px)
Citation preview
The Mandelbrot Set
1
The Mandelbrot Set
2
Three Exciting Educational Journals
Published by:
autoSOCRATIC PRESS
(913) 515-3911
www.rationalsys.com
Copyright 2010 Michael Lee Round
All rights reserved. No part of this book may be reproduced or utilized in any
form or by any means, electronic or mechanical, including photocopying, recording, or any information storage retrieval system, without permission in
writing from the publisher.
Center forauto SOCRATIC EXCELLENCE
The Mandelbrot Set
3
table of contents
“Welcome – to the real world”. Morpheus, in The Matrix
The Mandelbrot Set
4
TTHHEE MMAANNDDEELLBBRROOTT SSEETT 2
1n nZ Z c TTHHEE SSIIMMPPLLEESSTT EEQQUUAATTIIOONN IINN TTHHEE WWOORRLLDD
What comes to mind when I say the word “geometry”? Triangles?
Spheres? Generally, shapes – and maybe proofs regarding the
similarity of triangles, distance formulas, and the Pythagorean
Theorem?
What shape is a basketball? Sphere. What shape is a football field
or basketball court? Rectangle. How do planets orbit the sun?
Elliptically. The answers come so quickly I‟m certain I know a lot
about geometry.
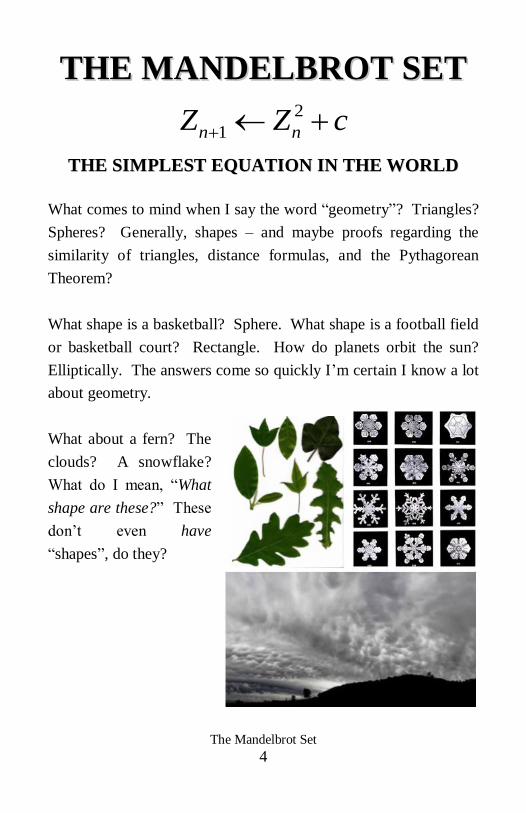
What about a fern? The
clouds? A snowflake?
What do I mean, “What
shape are these?” These
don‟t even have
“shapes”, do they?
The Mandelbrot Set
5
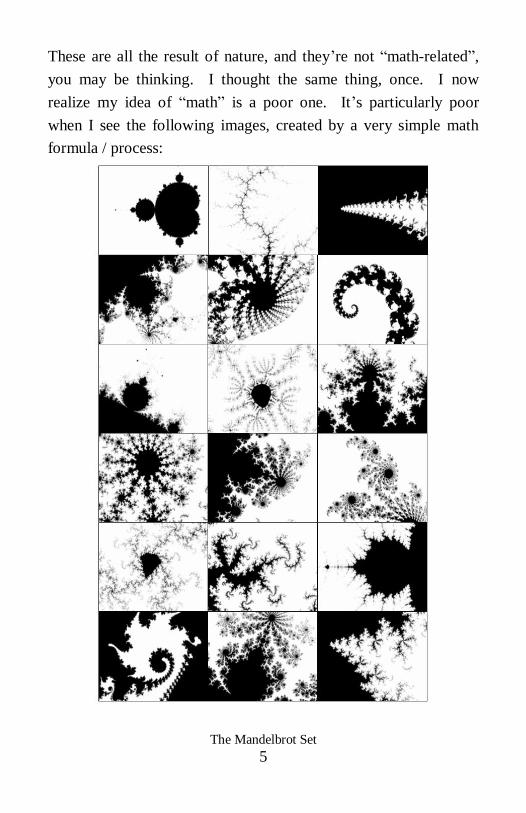
These are all the result of nature, and they‟re not “math-related”,
you may be thinking. I thought the same thing, once. I now
realize my idea of “math” is a poor one. It‟s particularly poor
when I see the following images, created by a very simple math
formula / process:
The Mandelbrot Set
6
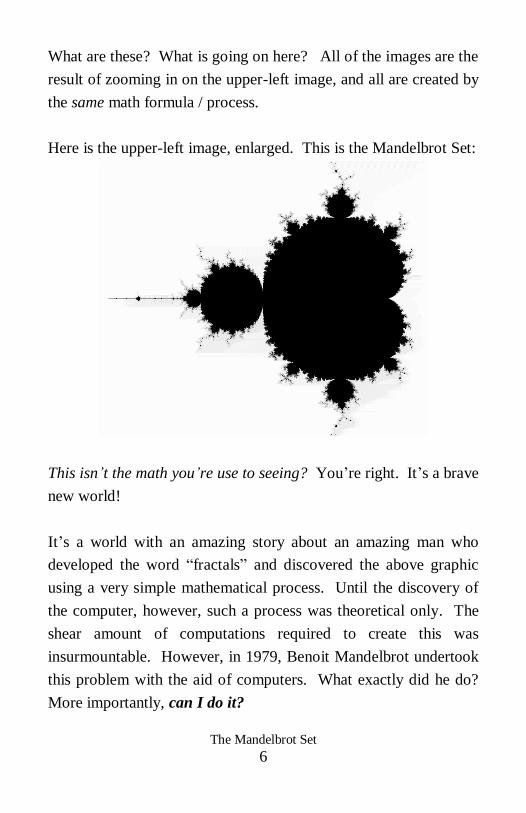
What are these? What is going on here? All of the images are the
result of zooming in on the upper-left image, and all are created by
the same math formula / process.
Here is the upper-left image, enlarged. This is the Mandelbrot Set:
This isn’t the math you’re use to seeing? You‟re right. It‟s a brave
new world!
It‟s a world with an amazing story about an amazing man who
developed the word “fractals” and discovered the above graphic
using a very simple mathematical process. Until the discovery of
the computer, however, such a process was theoretical only. The
shear amount of computations required to create this was
insurmountable. However, in 1979, Benoit Mandelbrot undertook
this problem with the aid of computers. What exactly did he do?
More importantly, can I do it?
The Mandelbrot Set
7
A NOTE TO THE READER
I suggest – at this point – the reader go to “Additional Resources”,
Page 71, to look at a neat book / DVD (which is also available on
YouTube). Also, there is a great downloadable software program
titled “Ultra Fractal 5”, easy to use. Play with it. Have fun!
Then – and only then – return here to answer the question, “What
is going on?”
GETTING STARTED
HOW CAN I CREATE “The Mandelbrot Set”
Where do I start? As Sister Maria said in The Sound of Music,
“Let‟s start at the very beginning – a very good place to start”. But
what is the beginning? Complex numbers. Say what? What are
“complex numbers”?
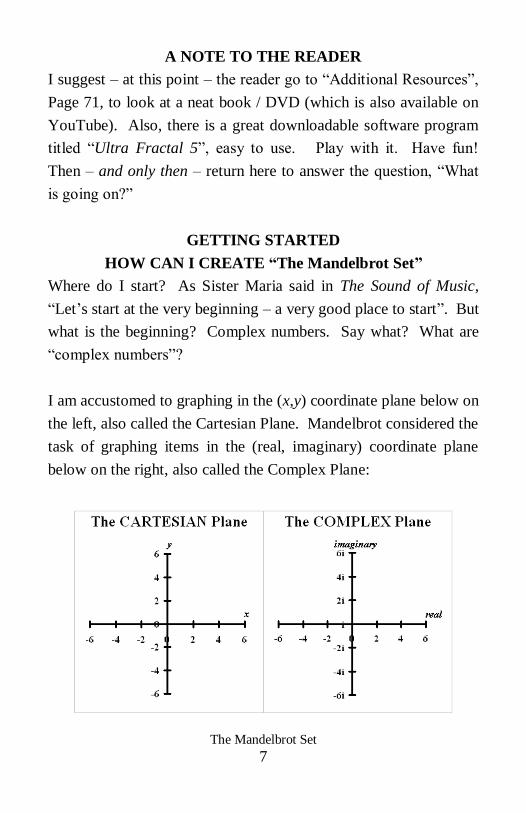
I am accustomed to graphing in the (x,y) coordinate plane below on
the left, also called the Cartesian Plane. Mandelbrot considered the
task of graphing items in the (real, imaginary) coordinate plane
below on the right, also called the Complex Plane:
The Mandelbrot Set
8
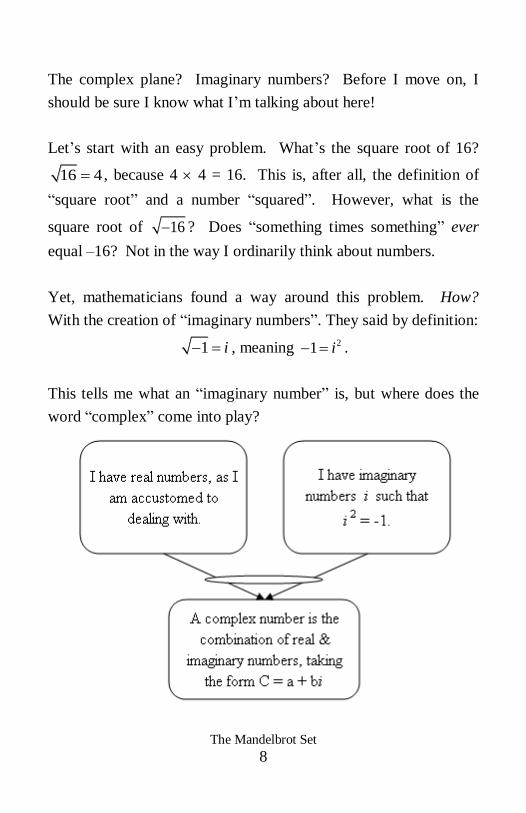
The complex plane? Imaginary numbers? Before I move on, I
should be sure I know what I‟m talking about here!
Let‟s start with an easy problem. What‟s the square root of 16?
16 4 , because 4 4 = 16. This is, after all, the definition of
“square root” and a number “squared”. However, what is the
square root of 16 ? Does “something times something” ever
equal –16? Not in the way I ordinarily think about numbers.
Yet, mathematicians found a way around this problem. How?
With the creation of “imaginary numbers”. They said by definition:
1 i , meaning 21 i .
This tells me what an “imaginary number” is, but where does the
word “complex” come into play?
The Mandelbrot Set
9
The Complex Numbers, then, are a combination of:
Real Numbers (a)
Imaginary Numbers (bi)
and are a new way of looking at numbers – and very useful in the
solving of algebraic equations, among many things. What
Mandelbrot did, however, was consider this from a geometric point
of view. What exactly did he plan on graphing? And how does
this relate to our general formula above: 2Z Z c ?
COMPLEX NUMBERS
AN INTERESTING PROPERTY
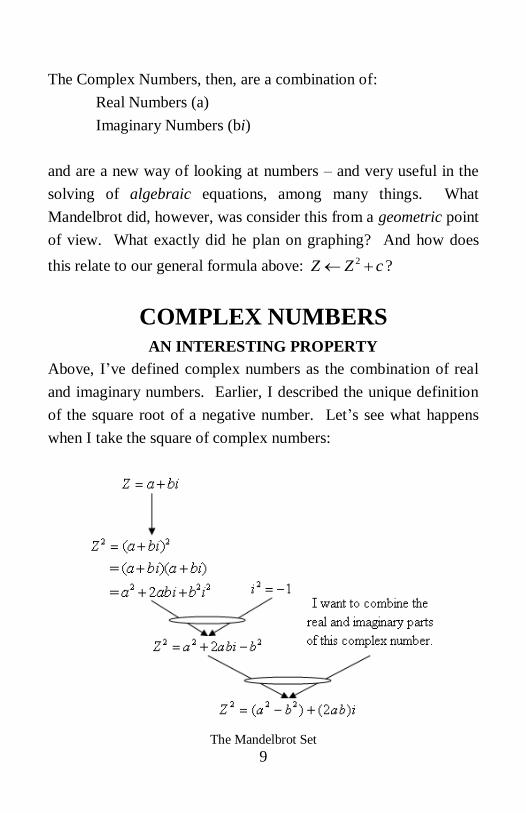
Above, I‟ve defined complex numbers as the combination of real
and imaginary numbers. Earlier, I described the unique definition
of the square root of a negative number. Let‟s see what happens
when I take the square of complex numbers:
The Mandelbrot Set
10
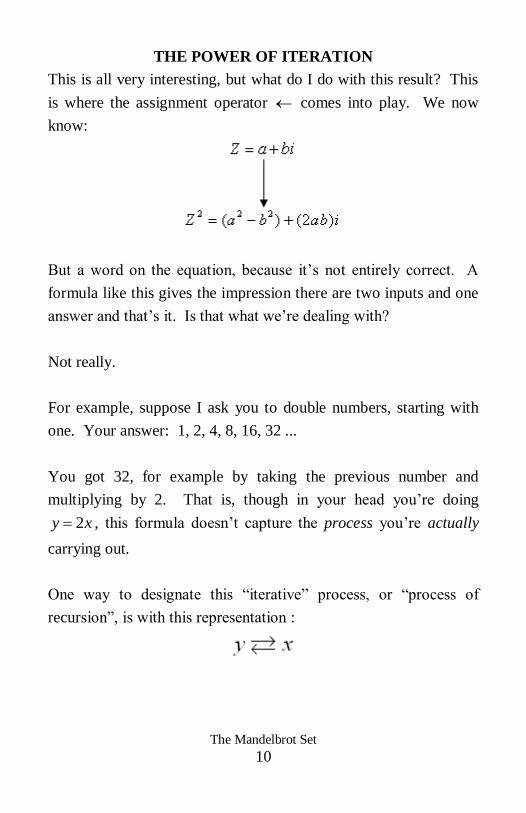
THE POWER OF ITERATION
This is all very interesting, but what do I do with this result? This
is where the assignment operator comes into play. We now
know:
But a word on the equation, because it‟s not entirely correct. A
formula like this gives the impression there are two inputs and one
answer and that‟s it. Is that what we‟re dealing with?
Not really.
For example, suppose I ask you to double numbers, starting with
one. Your answer: 1, 2, 4, 8, 16, 32 ...
You got 32, for example by taking the previous number and
multiplying by 2. That is, though in your head you‟re doing
2y x , this formula doesn‟t capture the process you‟re actually
carrying out.
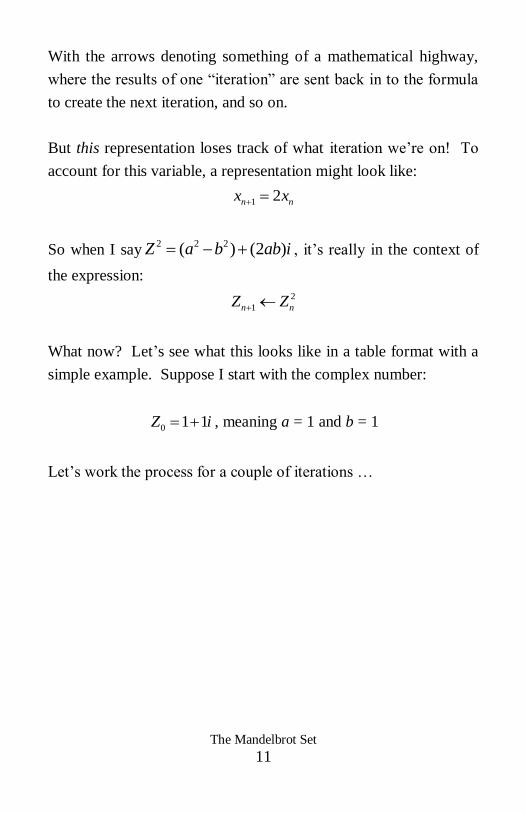
One way to designate this “iterative” process, or “process of
recursion”, is with this representation :
The Mandelbrot Set
11
With the arrows denoting something of a mathematical highway,
where the results of one “iteration” are sent back in to the formula
to create the next iteration, and so on.
But this representation loses track of what iteration we‟re on! To
account for this variable, a representation might look like:
1 2n nx x
So when I say2 2 2( ) (2 )Z a b ab i , it‟s really in the context of
the expression:
2
1n nZ Z
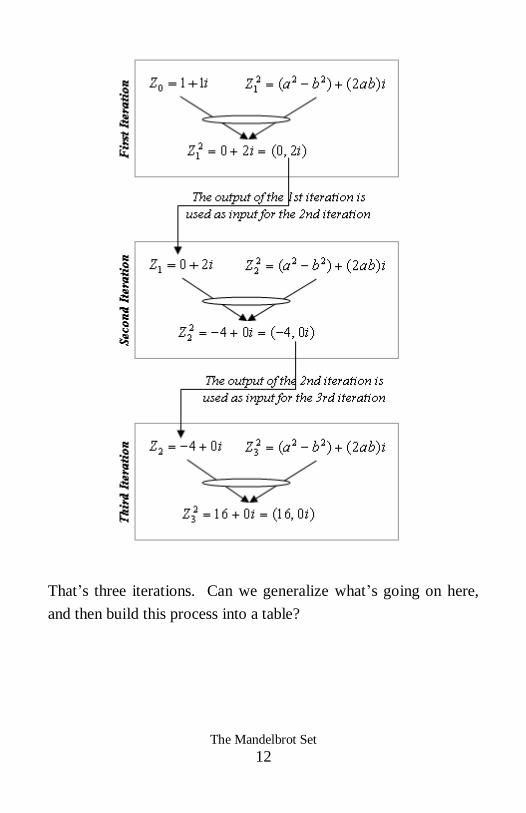
What now? Let‟s see what this looks like in a table format with a
simple example. Suppose I start with the complex number:
0 1 1Z i , meaning a = 1 and b = 1
Let‟s work the process for a couple of iterations …
The Mandelbrot Set
12
That‟s three iterations. Can we generalize what‟s going on here,
and then build this process into a table?
The Mandelbrot Set
13
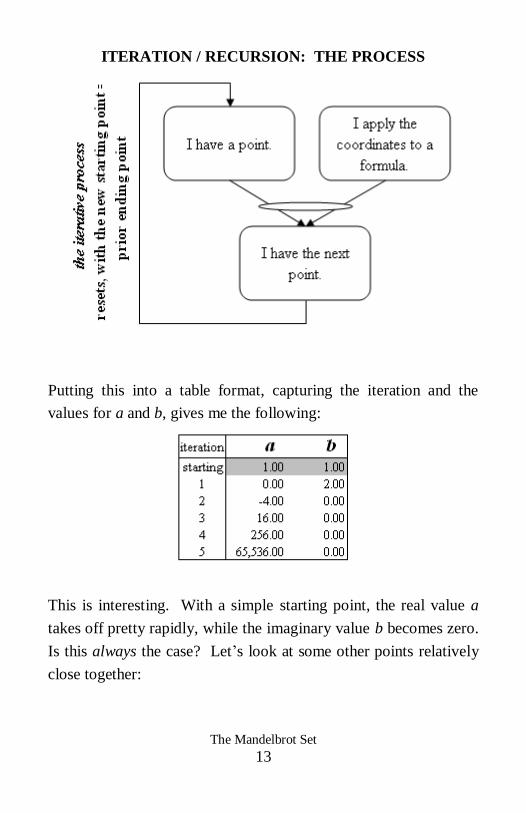
ITERATION / RECURSION: THE PROCESS
Putting this into a table format, capturing the iteration and the
values for a and b, gives me the following:
This is interesting. With a simple starting point, the real value a
takes off pretty rapidly, while the imaginary value b becomes zero.
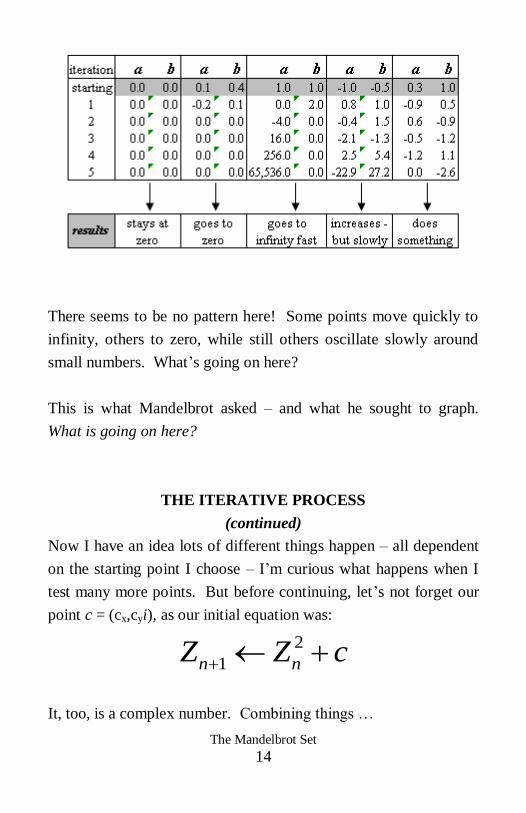
Is this always the case? Let‟s look at some other points relatively
close together:
The Mandelbrot Set
14
There seems to be no pattern here! Some points move quickly to
infinity, others to zero, while still others oscillate slowly around
small numbers. What‟s going on here?
This is what Mandelbrot asked – and what he sought to graph.
What is going on here?
THE ITERATIVE PROCESS
(continued)
Now I have an idea lots of different things happen – all dependent
on the starting point I choose – I‟m curious what happens when I
test many more points. But before continuing, let‟s not forget our
point c = (cx,cyi), as our initial equation was:
2
1n nZ Z c
It, too, is a complex number. Combining things …
The Mandelbrot Set
15
Above are just points, which I, of course, need to graph. But what
do I graph at each point?
Our goal is to graph the results of the following: 2
1n nZ Z c
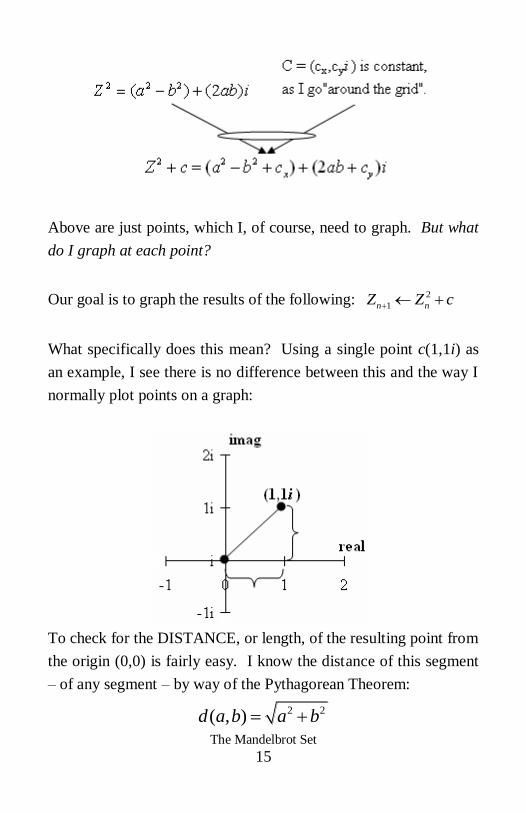
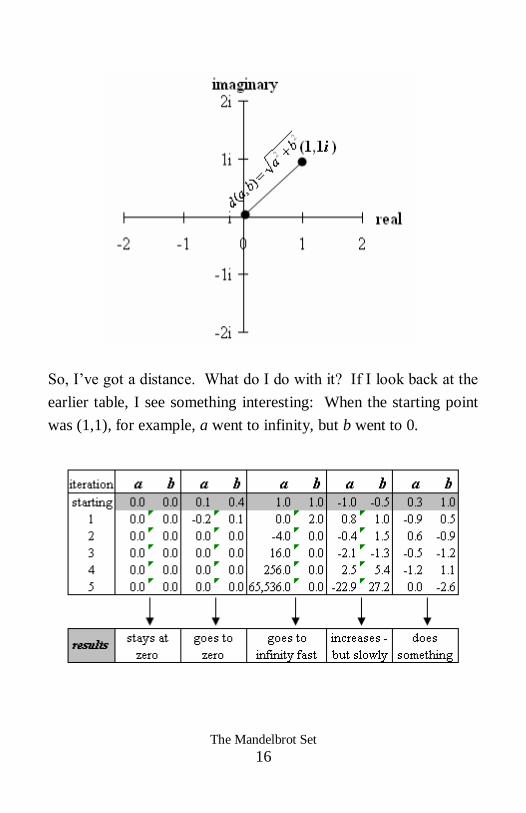
What specifically does this mean? Using a single point c(1,1i) as
an example, I see there is no difference between this and the way I
normally plot points on a graph:
To check for the DISTANCE, or length, of the resulting point from
the origin (0,0) is fairly easy. I know the distance of this segment
– of any segment – by way of the Pythagorean Theorem:
2 2( , )d a b a b
The Mandelbrot Set
16
So, I‟ve got a distance. What do I do with it? If I look back at the
earlier table, I see something interesting: When the starting point
was (1,1), for example, a went to infinity, but b went to 0.
The Mandelbrot Set
17
So, I want to check, not just a or b, but somehow a combination of
the two. What might this combination look like? Distance!
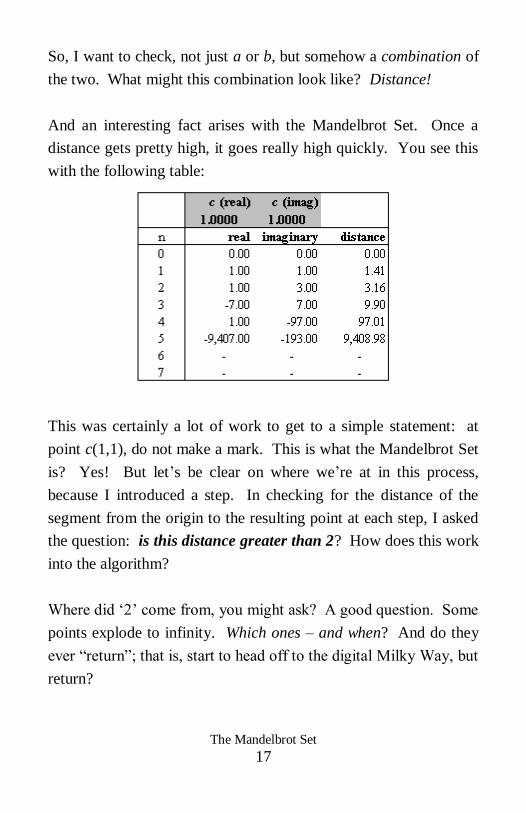
And an interesting fact arises with the Mandelbrot Set. Once a
distance gets pretty high, it goes really high quickly. You see this
with the following table:
This was certainly a lot of work to get to a simple statement: at
point c(1,1), do not make a mark. This is what the Mandelbrot Set
is? Yes! But let‟s be clear on where we‟re at in this process,
because I introduced a step. In checking for the distance of the
segment from the origin to the resulting point at each step, I asked
the question: is this distance greater than 2? How does this work
into the algorithm?
Where did „2‟ come from, you might ask? A good question. Some
points explode to infinity. Which ones – and when? And do they
ever “return”; that is, start to head off to the digital Milky Way, but
return?
The Mandelbrot Set
18
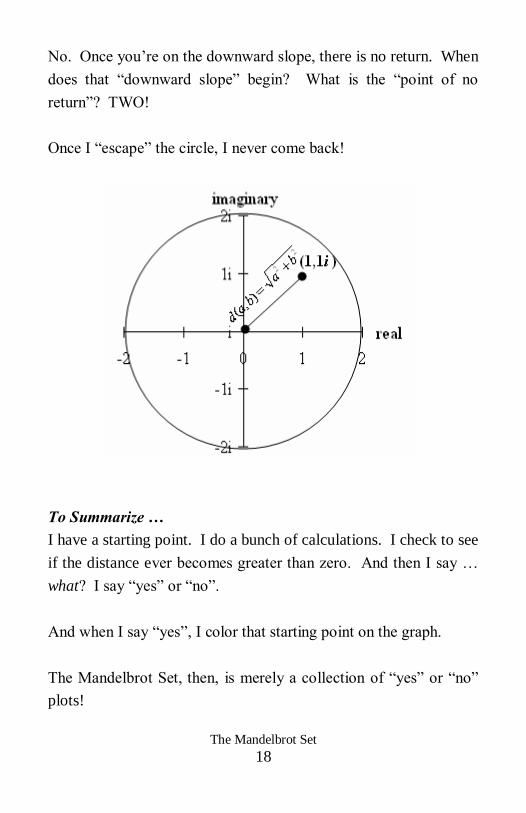
No. Once you‟re on the downward slope, there is no return. When
does that “downward slope” begin? What is the “point of no
return”? TWO!
Once I “escape” the circle, I never come back!
To Summarize …
I have a starting point. I do a bunch of calculations. I check to see
if the distance ever becomes greater than zero. And then I say …
what? I say “yes” or “no”.
And when I say “yes”, I color that starting point on the graph.
The Mandelbrot Set, then, is merely a collection of “yes” or “no”
plots!
The Mandelbrot Set
19
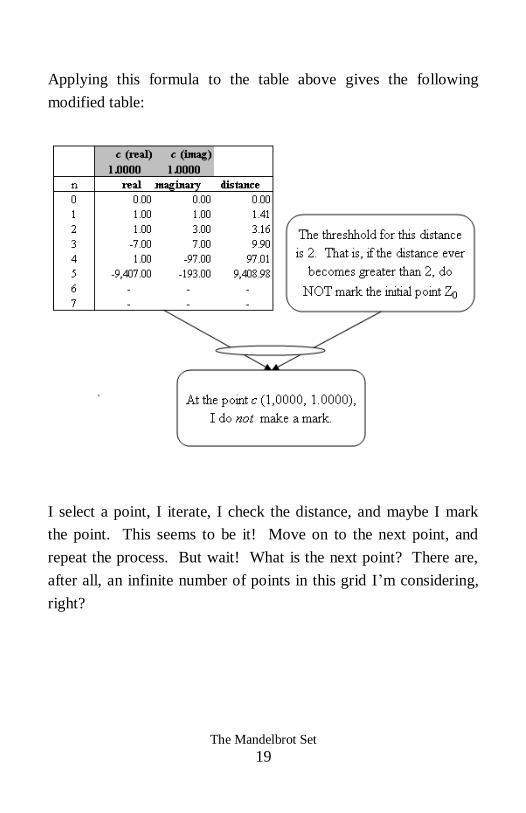
Applying this formula to the table above gives the following
modified table:
I select a point, I iterate, I check the distance, and maybe I mark
the point. This seems to be it! Move on to the next point, and
repeat the process. But wait! What is the next point? There are,
after all, an infinite number of points in this grid I‟m considering,
right?
The Mandelbrot Set
20
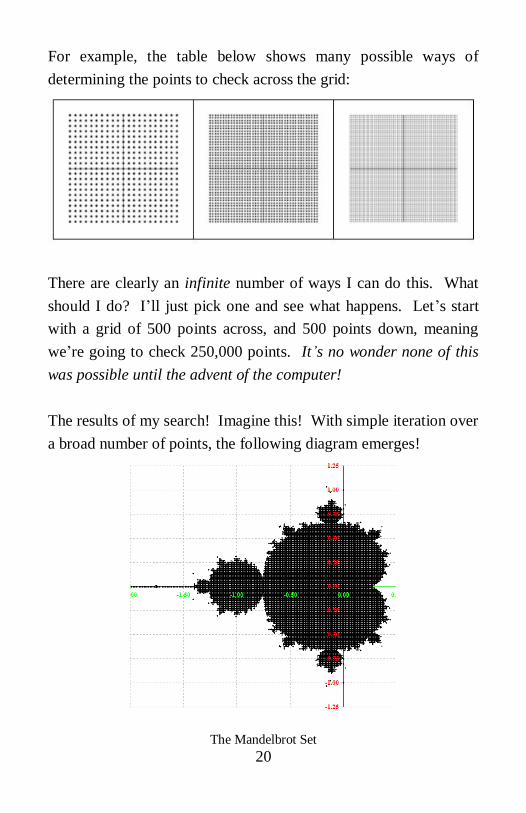
For example, the table below shows many possible ways of
determining the points to check across the grid:
There are clearly an infinite number of ways I can do this. What
should I do? I‟ll just pick one and see what happens. Let‟s start
with a grid of 500 points across, and 500 points down, meaning
we‟re going to check 250,000 points. It’s no wonder none of this
was possible until the advent of the computer!
The results of my search! Imagine this! With simple iteration over
a broad number of points, the following diagram emerges!
The Mandelbrot Set
21
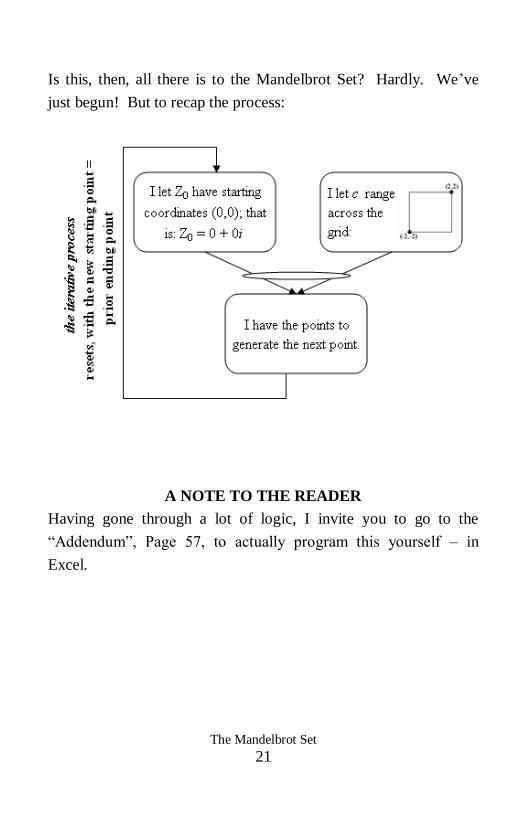
Is this, then, all there is to the Mandelbrot Set? Hardly. We‟ve
just begun! But to recap the process:
A NOTE TO THE READER
Having gone through a lot of logic, I invite you to go to the
“Addendum”, Page 57, to actually program this yourself – in
Excel.
The Mandelbrot Set
22
PPaarrtt IIII TTHHEE BBEEHHAAVVIIOORR OOFF TTHHEE SSYYSSTTEEMM
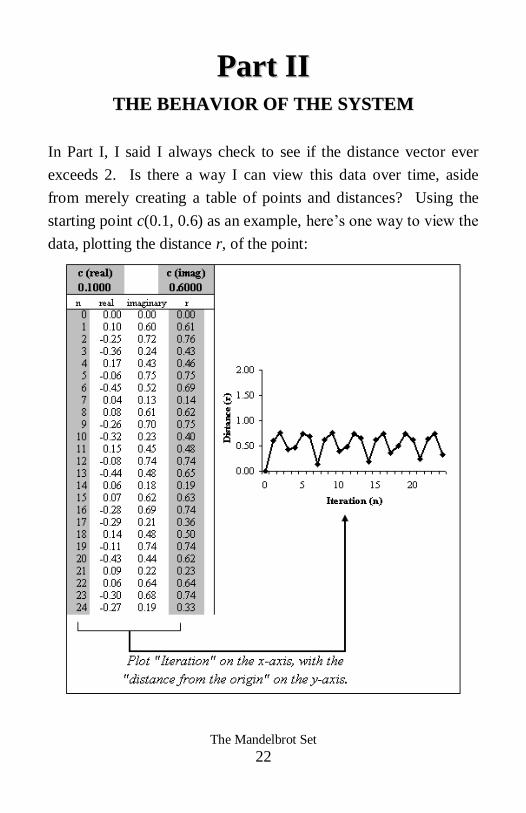
In Part I, I said I always check to see if the distance vector ever
exceeds 2. Is there a way I can view this data over time, aside
from merely creating a table of points and distances? Using the
starting point c(0.1, 0.6) as an example, here‟s one way to view the
data, plotting the distance r, of the point:
The Mandelbrot Set
23
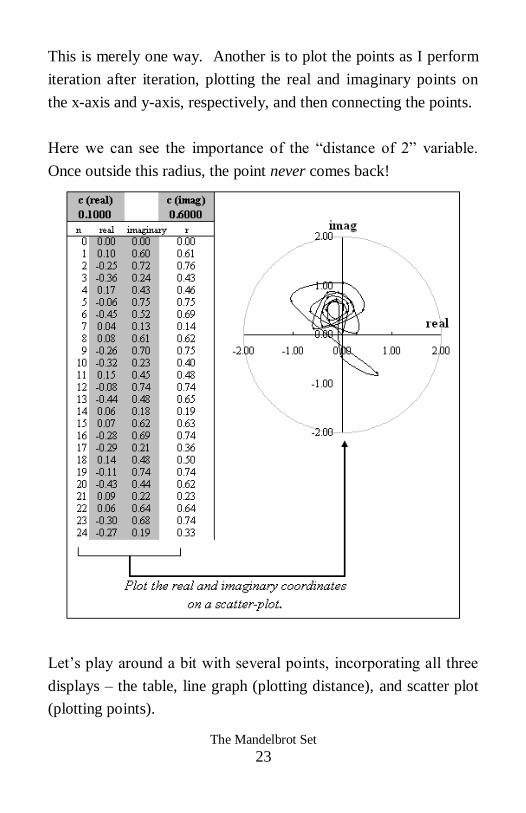
This is merely one way. Another is to plot the points as I perform
iteration after iteration, plotting the real and imaginary points on
the x-axis and y-axis, respectively, and then connecting the points.
Here we can see the importance of the “distance of 2” variable.
Once outside this radius, the point never comes back!
Let‟s play around a bit with several points, incorporating all three
displays – the table, line graph (plotting distance), and scatter plot
(plotting points).
The Mandelbrot Set
24
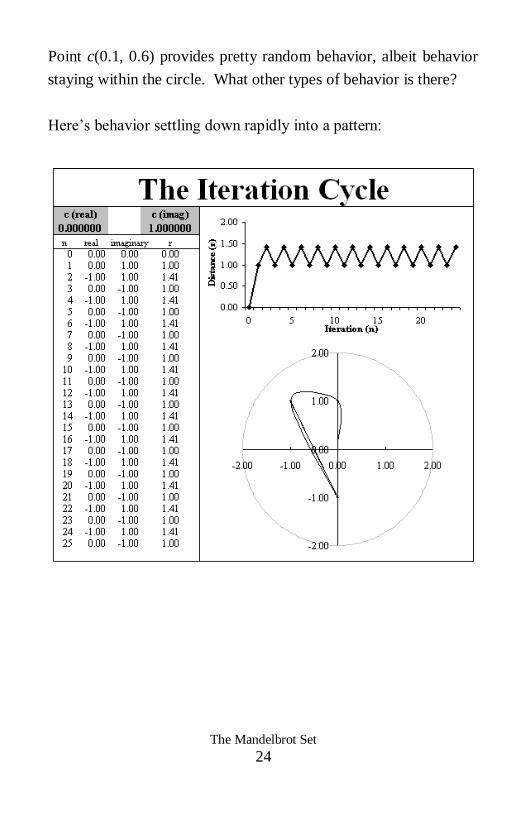
Point c(0.1, 0.6) provides pretty random behavior, albeit behavior
staying within the circle. What other types of behavior is there?
Here‟s behavior settling down rapidly into a pattern:
The Mandelbrot Set
25
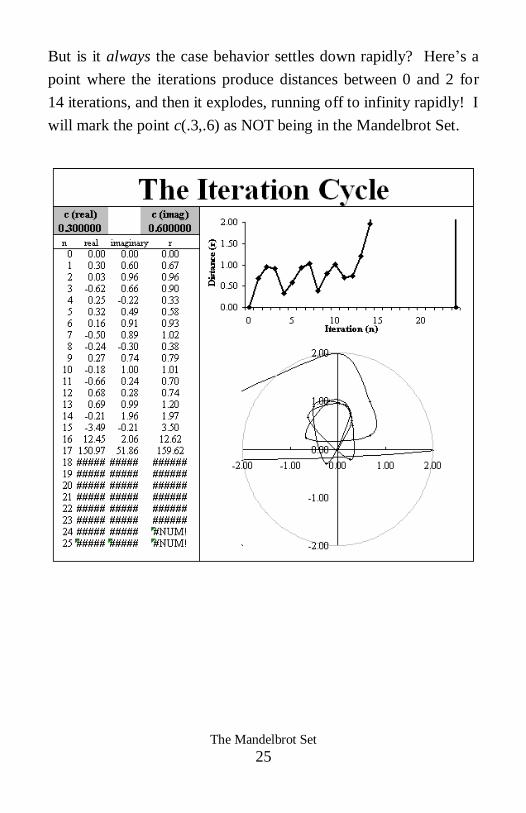
But is it always the case behavior settles down rapidly? Here‟s a
point where the iterations produce distances between 0 and 2 for
14 iterations, and then it explodes, running off to infinity rapidly! I
will mark the point c(.3,.6) as NOT being in the Mandelbrot Set.
The Mandelbrot Set
26
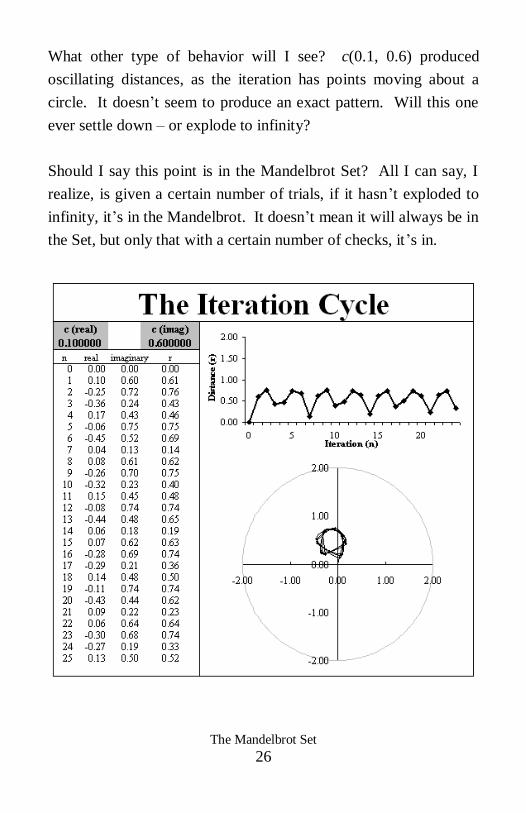
What other type of behavior will I see? c(0.1, 0.6) produced
oscillating distances, as the iteration has points moving about a
circle. It doesn‟t seem to produce an exact pattern. Will this one
ever settle down – or explode to infinity?
Should I say this point is in the Mandelbrot Set? All I can say, I
realize, is given a certain number of trials, if it hasn‟t exploded to
infinity, it‟s in the Mandelbrot. It doesn‟t mean it will always be in
the Set, but only that with a certain number of checks, it‟s in.
The Mandelbrot Set
27
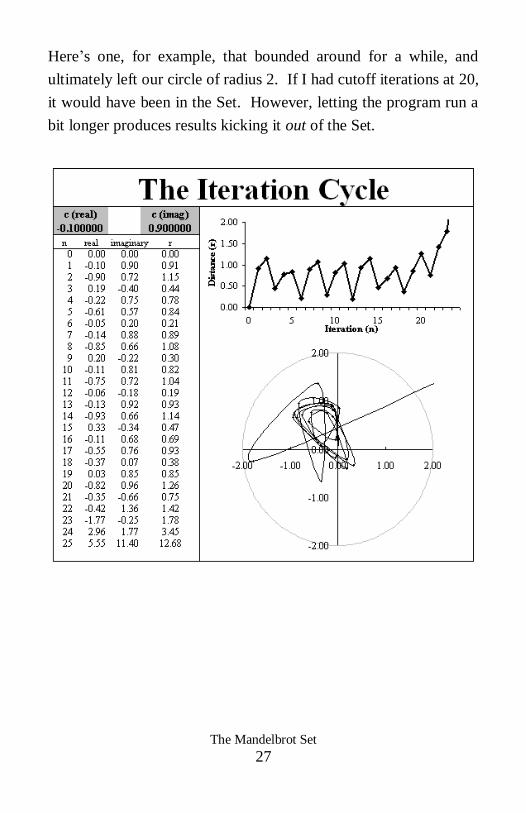
Here‟s one, for example, that bounded around for a while, and
ultimately left our circle of radius 2. If I had cutoff iterations at 20,
it would have been in the Set. However, letting the program run a
bit longer produces results kicking it out of the Set.
The Mandelbrot Set
28
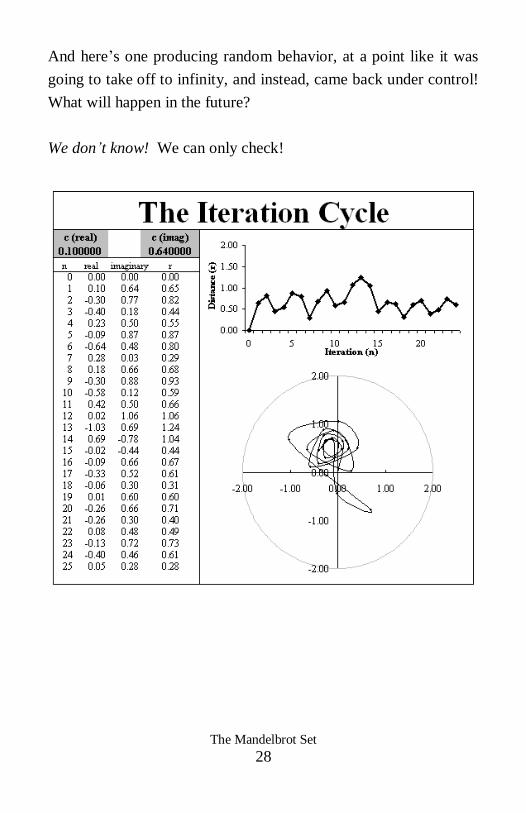
And here‟s one producing random behavior, at a point like it was
going to take off to infinity, and instead, came back under control!
What will happen in the future?
We don’t know! We can only check!
The Mandelbrot Set
29
TTHHEE MMAANNDDEELLBBRROOTT SSEETT
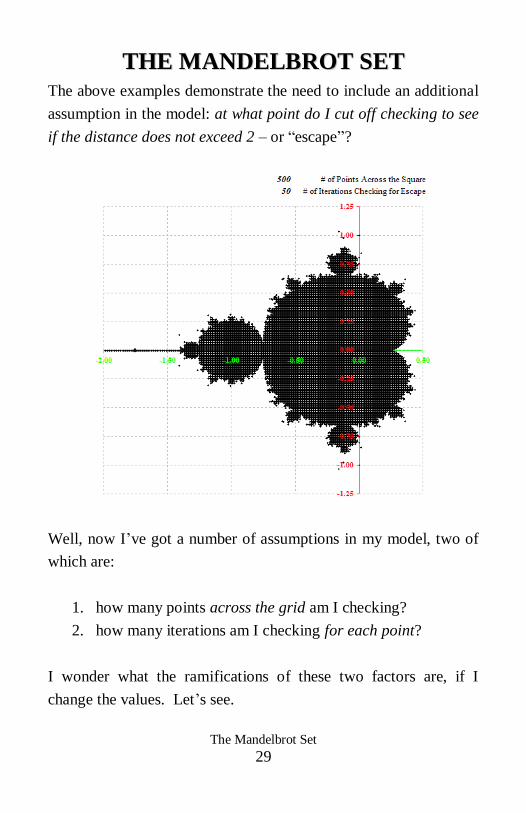
The above examples demonstrate the need to include an additional
assumption in the model: at what point do I cut off checking to see
if the distance does not exceed 2 – or “escape”?
Well, now I‟ve got a number of assumptions in my model, two of
which are:
1. how many points across the grid am I checking?
2. how many iterations am I checking for each point?
I wonder what the ramifications of these two factors are, if I
change the values. Let‟s see.
The Mandelbrot Set
30
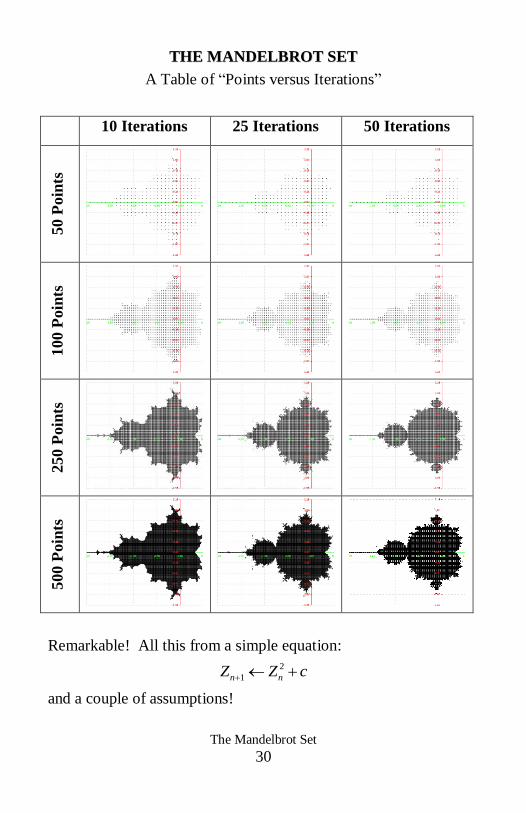
TTHHEE MMAANNDDEELLBBRROOTT SSEETT
A Table of “Points versus Iterations”
10 Iterations 25 Iterations 50 Iterations
50 P
oin
ts
100 P
oin
ts
250 P
oin
ts
500 P
oin
ts
Remarkable! All this from a simple equation:
2
1n nZ Z c
and a couple of assumptions!
The Mandelbrot Set
31
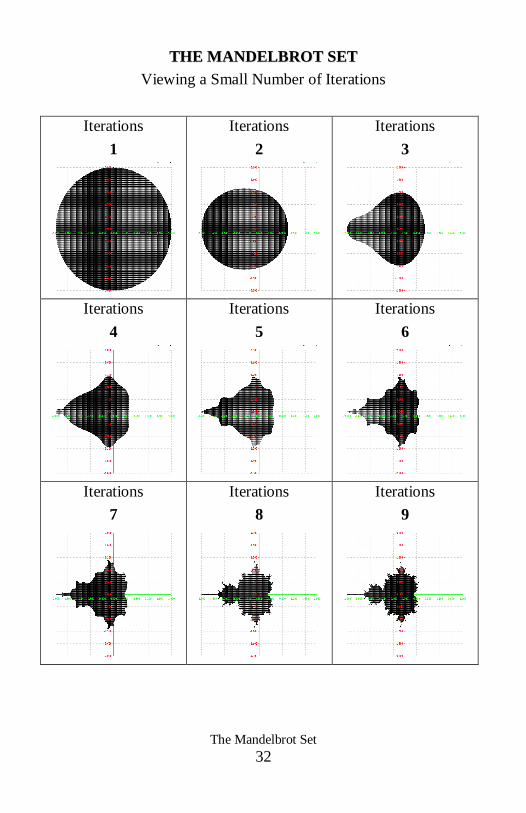
A FURTHER NOTE ABOUT THE NUMBER OF
ITERATIONS
As I think about the number of iterations above, I wonder what
happens when I check a very low number of iterations. What
would I expect?
At the extreme case, where I‟m checking the
first iteration, I‟m checking points within the
plane:
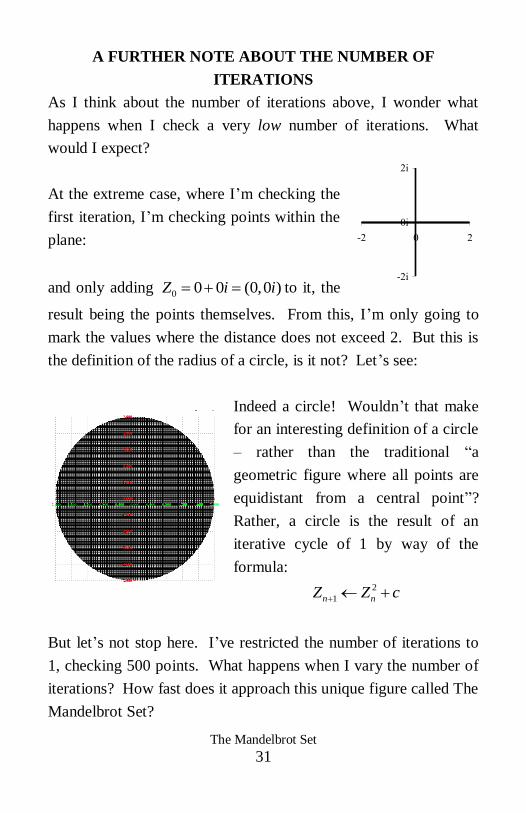
and only adding 0 0 0 (0,0 )Z i i to it, the
result being the points themselves. From this, I‟m only going to
mark the values where the distance does not exceed 2. But this is
the definition of the radius of a circle, is it not? Let‟s see:
Indeed a circle! Wouldn‟t that make
for an interesting definition of a circle
– rather than the traditional “a
geometric figure where all points are
equidistant from a central point”?
Rather, a circle is the result of an
iterative cycle of 1 by way of the
formula:
2
1n nZ Z c
But let‟s not stop here. I‟ve restricted the number of iterations to
1, checking 500 points. What happens when I vary the number of
iterations? How fast does it approach this unique figure called The
Mandelbrot Set?
-2i
0i
2i
-2 0 2
The Mandelbrot Set
32
TTHHEE MMAANNDDEELLBBRROOTT SSEETT
Viewing a Small Number of Iterations
Iterations
1
Iterations
2
Iterations
3
Iterations
4
Iterations
5
Iterations
6
Iterations
7
Iterations
8
Iterations
9

The Mandelbrot Set
33
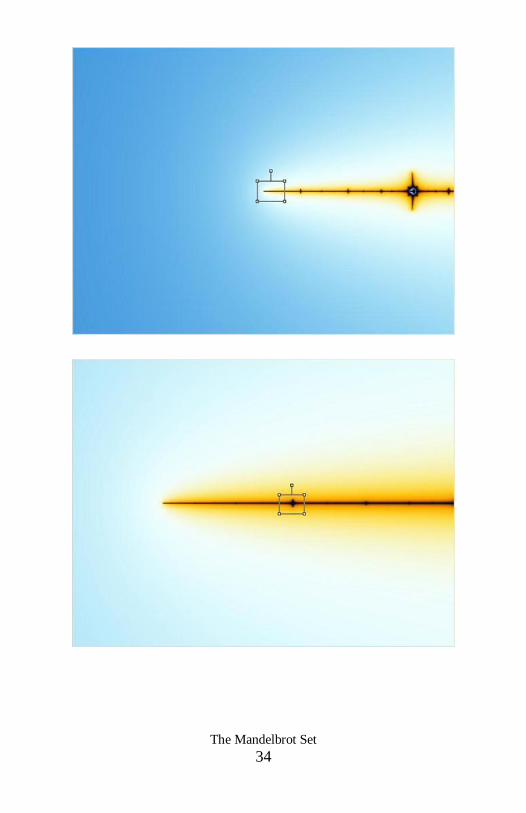
PPaarrtt IIIIII ZOOMING IN TO SEE A PICTURE OF YOURSELF
We‟ve spent a good deal of time analyzing the Mandelbrot Set, up
to this point. We have a good idea what‟s going on. Let‟s play
around a bit now. Using the powerful program – Ultra Fractal 5 –
I‟m going to zoom in on different aspects of the Set and see what
happens.
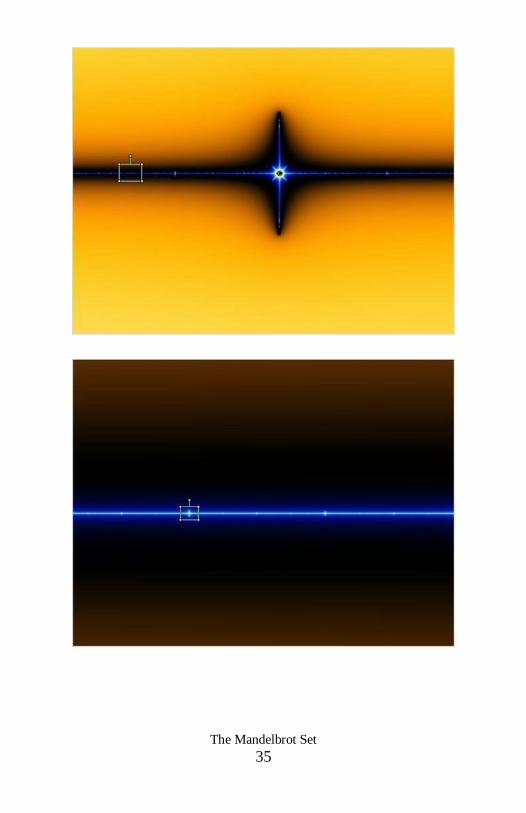
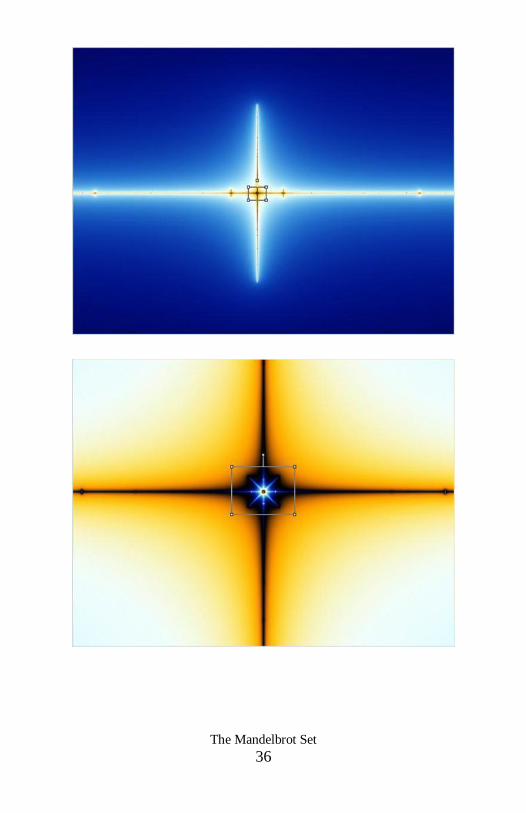
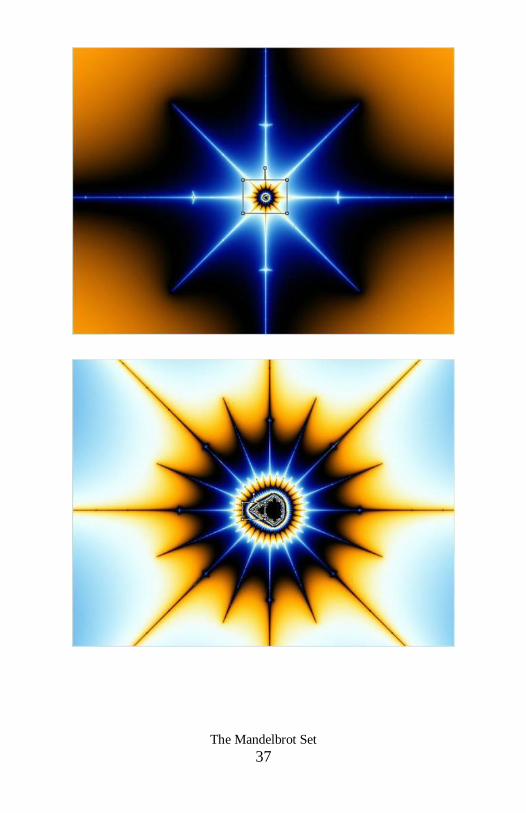
As I capture each image below, there is also a small grey grid
which represents where I‟ll be zooming in for the next image.
Starting with the Mandelbrot Set itself, let‟s zoom in on the
middle-left section …
The Mandelbrot Set
34
The Mandelbrot Set
35
The Mandelbrot Set
36
The Mandelbrot Set
37
The Mandelbrot Set
38
The Mandelbrot Set
39
The Mandelbrot Set
40
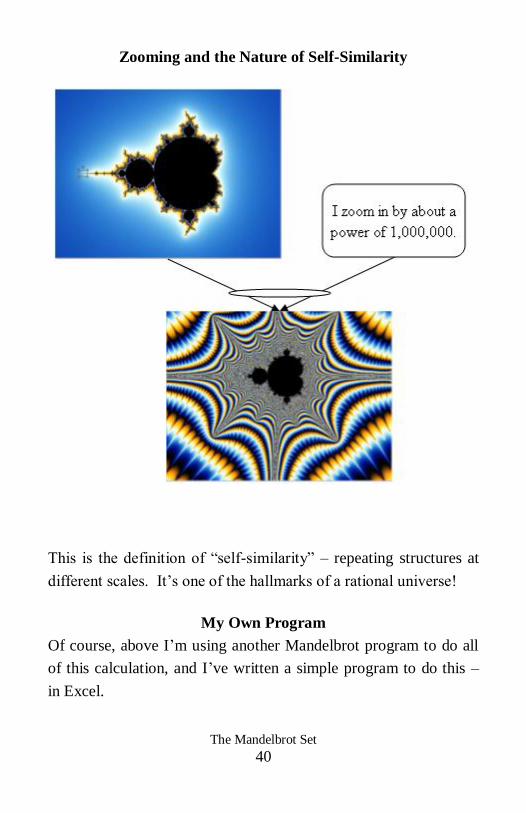
Zooming and the Nature of Self-Similarity
This is the definition of “self-similarity” – repeating structures at
different scales. It‟s one of the hallmarks of a rational universe!
My Own Program
Of course, above I‟m using another Mandelbrot program to do all
of this calculation, and I‟ve written a simple program to do this –
in Excel.
The Mandelbrot Set
41
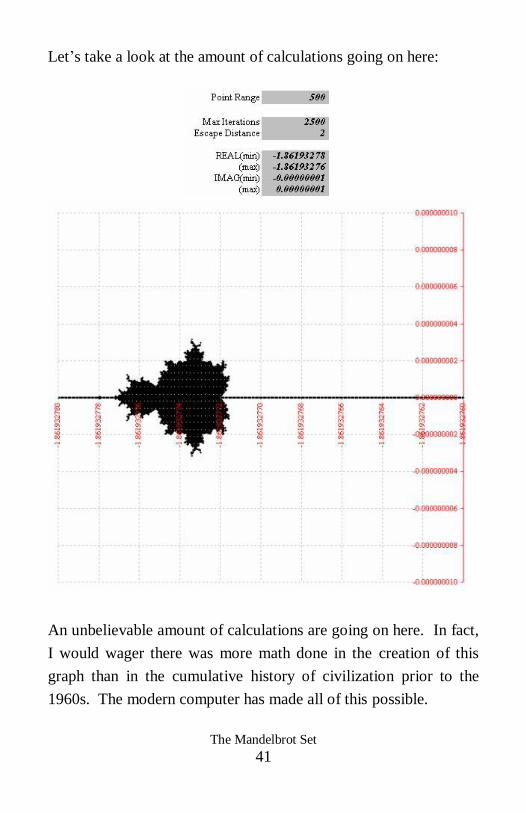
Let‟s take a look at the amount of calculations going on here:
An unbelievable amount of calculations are going on here. In fact,
I would wager there was more math done in the creation of this
graph than in the cumulative history of civilization prior to the
1960s. The modern computer has made all of this possible.
The Mandelbrot Set
42
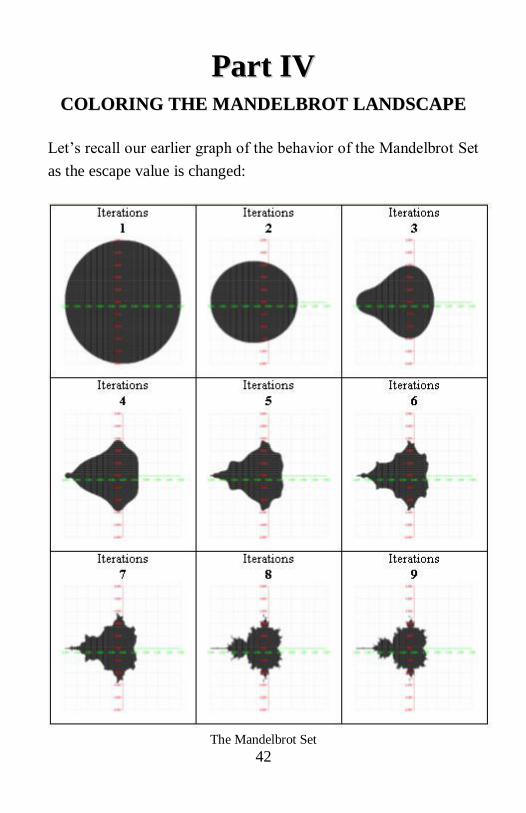
PPaarrtt IIVV CCOOLLOORRIINNGG TTHHEE MMAANNDDEELLBBRROOTT LLAANNDDSSCCAAPPEE
Let‟s recall our earlier graph of the behavior of the Mandelbrot Set
as the escape value is changed:
The Mandelbrot Set
43
Briefly, this “escape value” told us how long to check a point to
see if it‟s in the Mandelbrot Set. The idea was many patterns of
distances go like this: 1, 2,4, 8, and off to infinity quickly. Other
sequences cycle through a pattern like this: 1, 1.5, 1, 1.5, etc. In
both of these cases, we have an idea quickly about what‟s going to
happen.
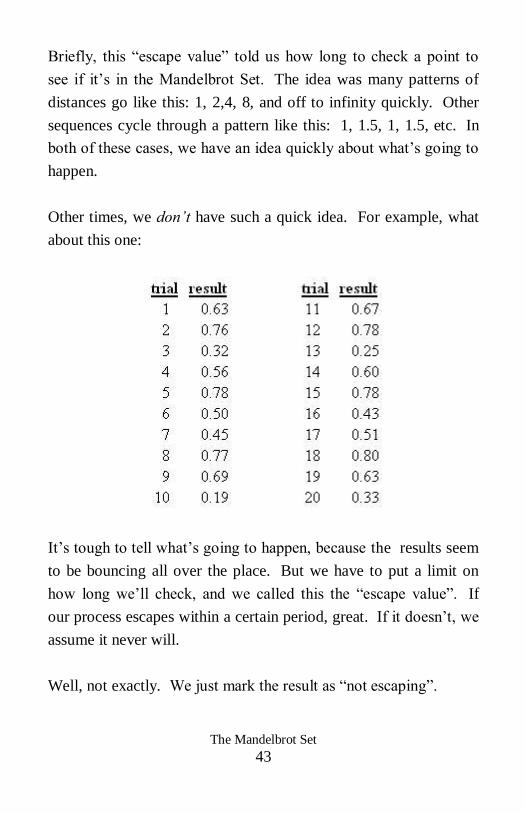
Other times, we don’t have such a quick idea. For example, what
about this one:
It‟s tough to tell what‟s going to happen, because the results seem
to be bouncing all over the place. But we have to put a limit on
how long we‟ll check, and we called this the “escape value”. If
our process escapes within a certain period, great. If it doesn‟t, we
assume it never will.
Well, not exactly. We just mark the result as “not escaping”.
The Mandelbrot Set
44
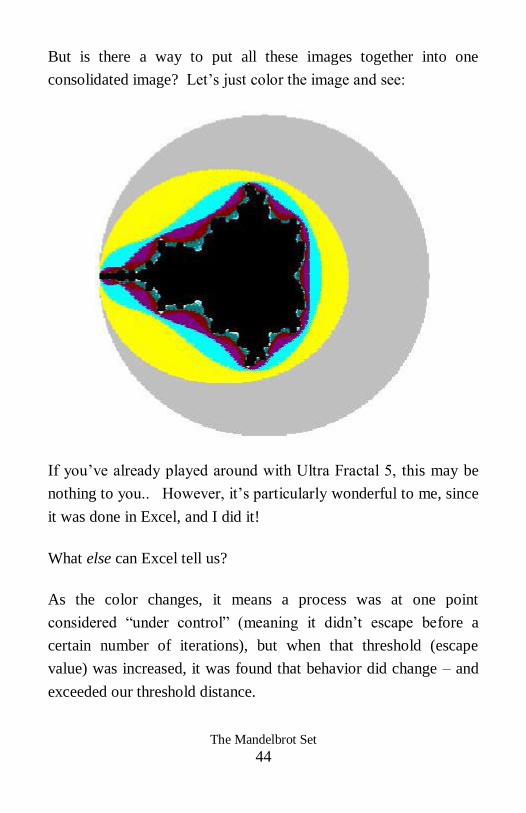
But is there a way to put all these images together into one
consolidated image? Let‟s just color the image and see:
If you‟ve already played around with Ultra Fractal 5, this may be
nothing to you.. However, it‟s particularly wonderful to me, since
it was done in Excel, and I did it!
What else can Excel tell us?
As the color changes, it means a process was at one point
considered “under control” (meaning it didn‟t escape before a
certain number of iterations), but when that threshold (escape
value) was increased, it was found that behavior did change – and
exceeded our threshold distance.
The Mandelbrot Set
45
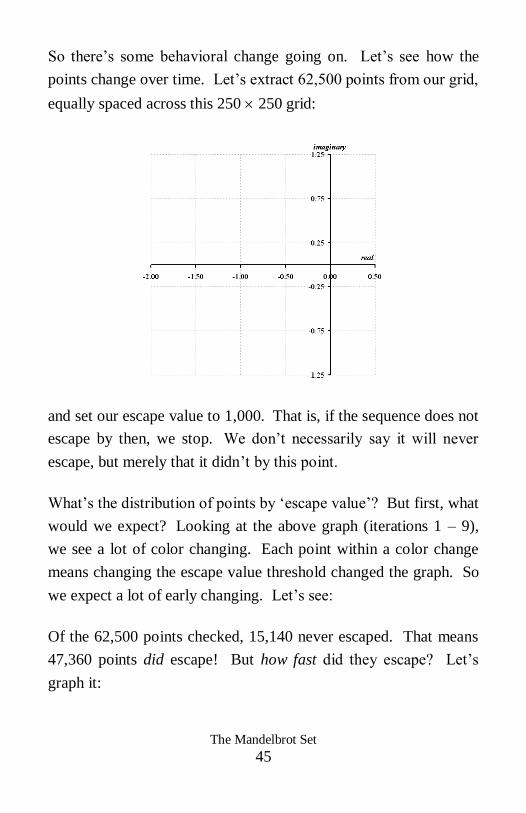
So there‟s some behavioral change going on. Let‟s see how the
points change over time. Let‟s extract 62,500 points from our grid,
equally spaced across this 250 250 grid:
and set our escape value to 1,000. That is, if the sequence does not
escape by then, we stop. We don‟t necessarily say it will never
escape, but merely that it didn‟t by this point.
What‟s the distribution of points by „escape value‟? But first, what
would we expect? Looking at the above graph (iterations 1 – 9),
we see a lot of color changing. Each point within a color change
means changing the escape value threshold changed the graph. So
we expect a lot of early changing. Let‟s see:
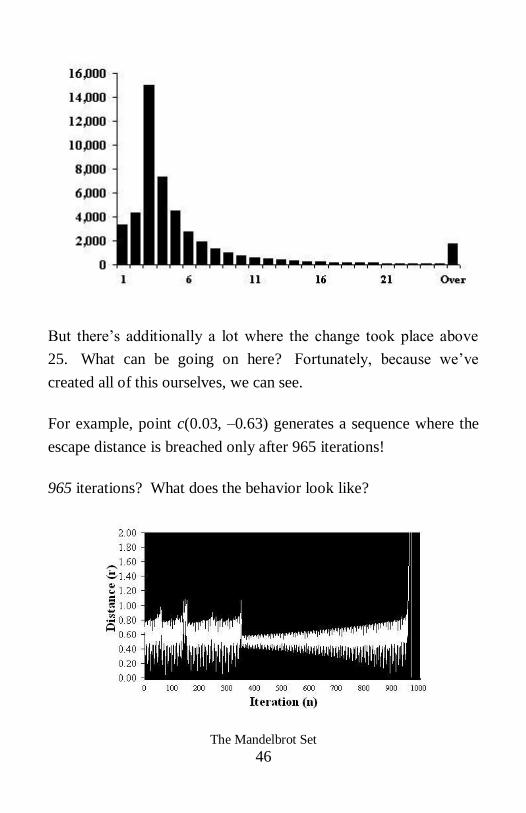
Of the 62,500 points checked, 15,140 never escaped. That means
47,360 points did escape! But how fast did they escape? Let‟s
graph it:
The Mandelbrot Set
46
But there‟s additionally a lot where the change took place above
25. What can be going on here? Fortunately, because we‟ve
created all of this ourselves, we can see.
For example, point c(0.03, –0.63) generates a sequence where the
escape distance is breached only after 965 iterations!
965 iterations? What does the behavior look like?
The Mandelbrot Set
47
PPaarrtt VV TTHHEE MMAANNDDEELLBBRROOTT SSEETT AANNDD TTHHEE JJUULLIIAA SSEETT
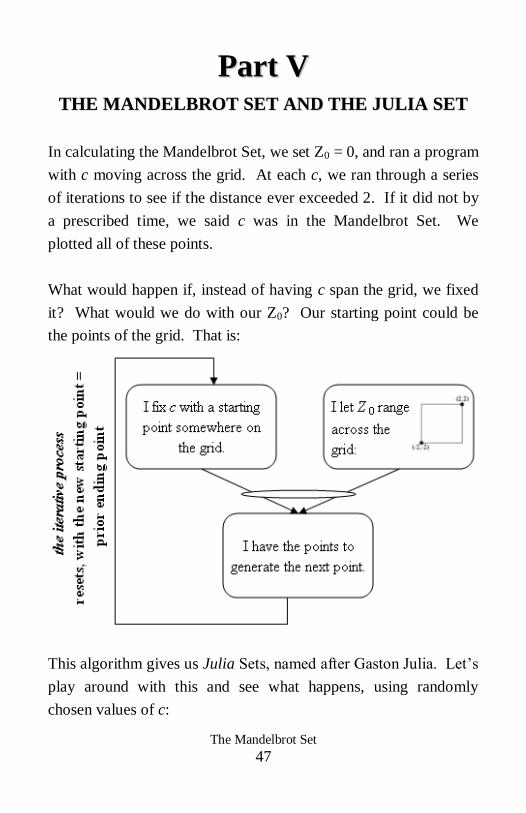
In calculating the Mandelbrot Set, we set Z0 = 0, and ran a program
with c moving across the grid. At each c, we ran through a series
of iterations to see if the distance ever exceeded 2. If it did not by
a prescribed time, we said c was in the Mandelbrot Set. We
plotted all of these points.
What would happen if, instead of having c span the grid, we fixed
it? What would we do with our Z0? Our starting point could be
the points of the grid. That is:
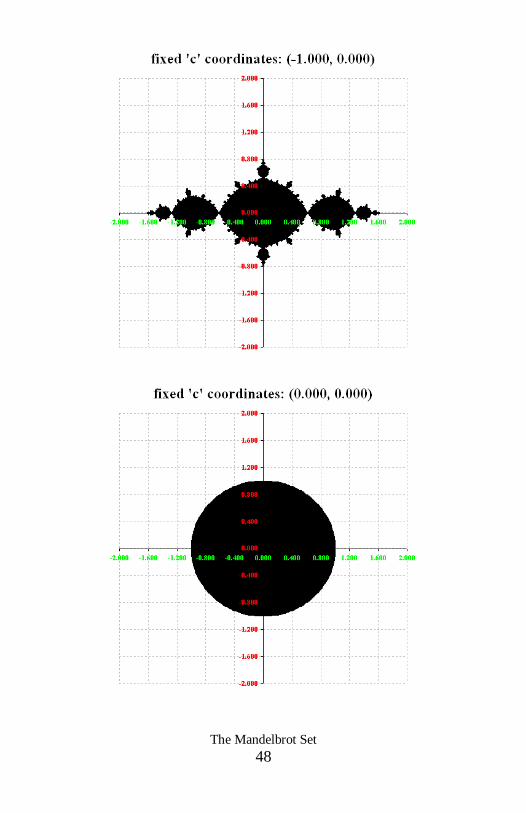
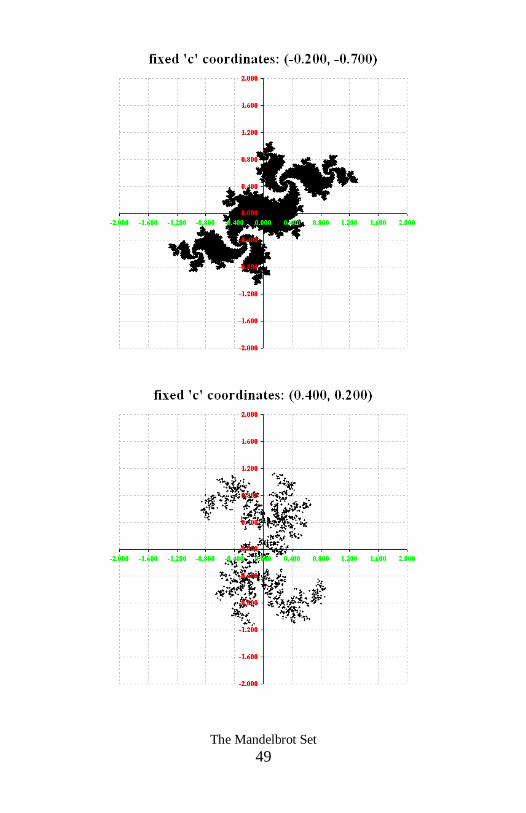
This algorithm gives us Julia Sets, named after Gaston Julia. Let‟s
play around with this and see what happens, using randomly
chosen values of c:
The Mandelbrot Set
48
The Mandelbrot Set
49
The Mandelbrot Set
50
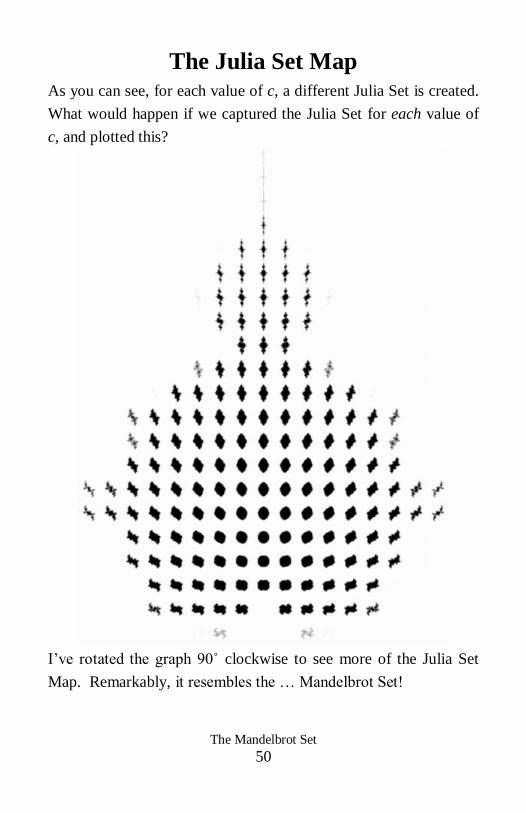
The Julia Set Map
As you can see, for each value of c, a different Julia Set is created.
What would happen if we captured the Julia Set for each value of
c, and plotted this?
I‟ve rotated the graph 90˚ clockwise to see more of the Julia Set
Map. Remarkably, it resembles the … Mandelbrot Set!
The Mandelbrot Set
51
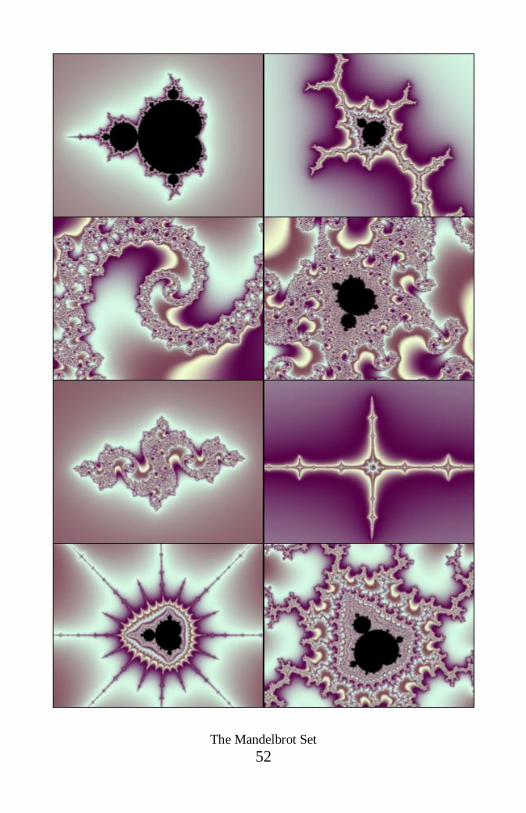
AA VVIISSUUAALL SSUUMMMMAARRYY
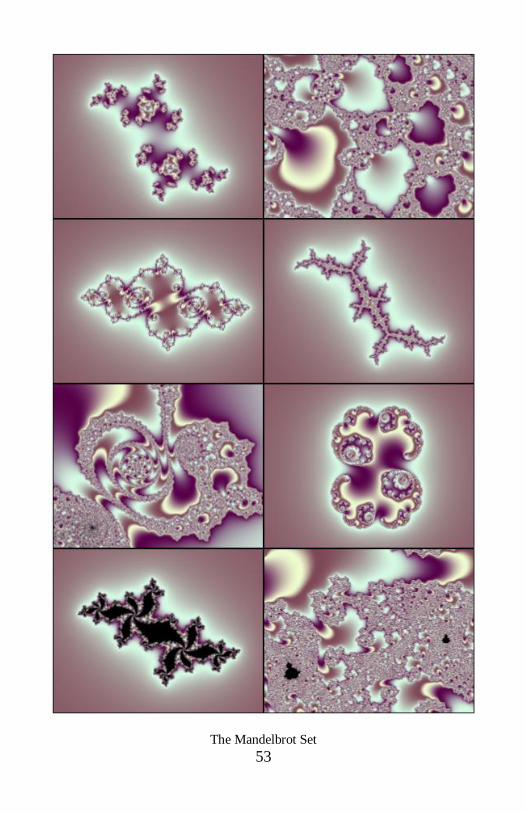
The Mandelbrot Set. Remarkable. So much there – from so little
formula.
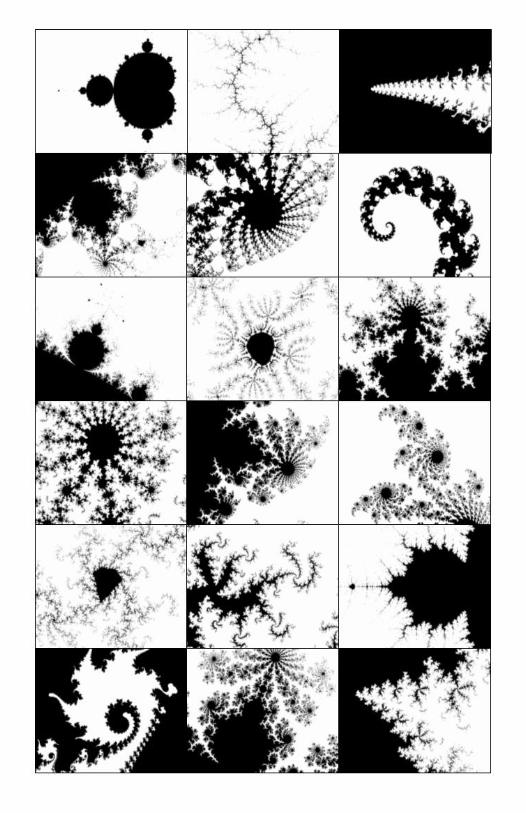
Here are a number of randomly chosen images from the
Mandelbrot and Julia Sets.
The Mandelbrot Set
52
The Mandelbrot Set
53
The Mandelbrot Set
54
TTHHEE MMAANNDDEELLBBRROOTT SSEETT 2
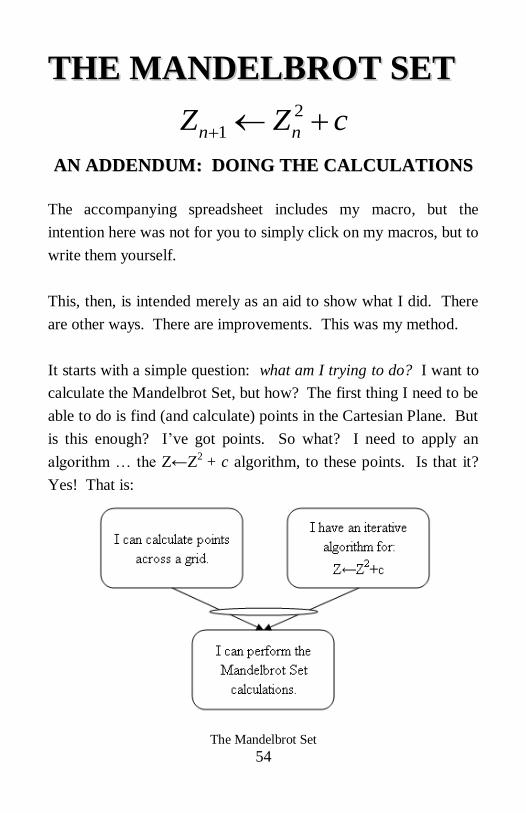
1n nZ Z c AANN AADDDDEENNDDUUMM:: DDOOIINNGG TTHHEE CCAALLCCUULLAATTIIOONNSS
The accompanying spreadsheet includes my macro, but the
intention here was not for you to simply click on my macros, but to
write them yourself.
This, then, is intended merely as an aid to show what I did. There
are other ways. There are improvements. This was my method.
It starts with a simple question: what am I trying to do? I want to
calculate the Mandelbrot Set, but how? The first thing I need to be
able to do is find (and calculate) points in the Cartesian Plane. But
is this enough? I‟ve got points. So what? I need to apply an
algorithm … the Z←Z2
+ c algorithm, to these points. Is that it?
Yes! That is:
The Mandelbrot Set
55
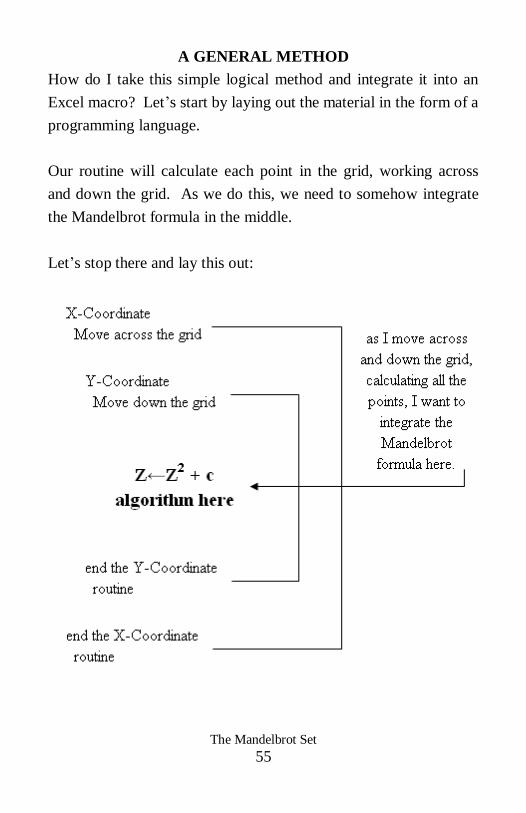
A GENERAL METHOD
How do I take this simple logical method and integrate it into an
Excel macro? Let‟s start by laying out the material in the form of a
programming language.
Our routine will calculate each point in the grid, working across
and down the grid. As we do this, we need to somehow integrate
the Mandelbrot formula in the middle.
Let‟s stop there and lay this out:
The Mandelbrot Set
56
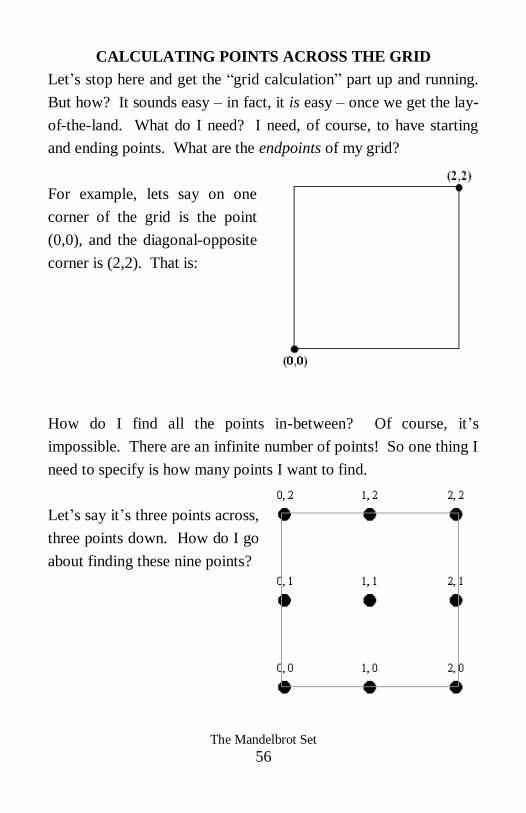
CALCULATING POINTS ACROSS THE GRID
Let‟s stop here and get the “grid calculation” part up and running.
But how? It sounds easy – in fact, it is easy – once we get the lay-
of-the-land. What do I need? I need, of course, to have starting
and ending points. What are the endpoints of my grid?
For example, lets say on one
corner of the grid is the point
(0,0), and the diagonal-opposite
corner is (2,2). That is:
How do I find all the points in-between? Of course, it‟s
impossible. There are an infinite number of points! So one thing I
need to specify is how many points I want to find.
Let‟s say it‟s three points across,
three points down. How do I go
about finding these nine points?
The Mandelbrot Set
57
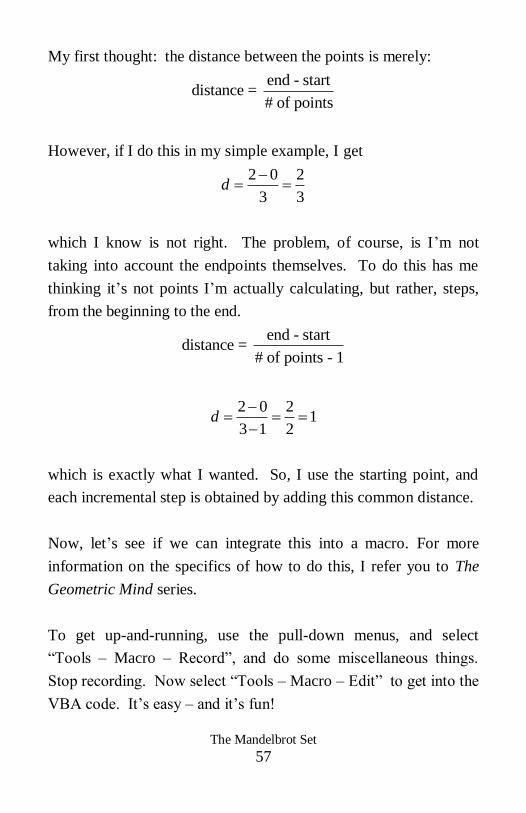
My first thought: the distance between the points is merely:
end - startdistance =
# of points
However, if I do this in my simple example, I get
2 0 2
3 3d
which I know is not right. The problem, of course, is I‟m not
taking into account the endpoints themselves. To do this has me
thinking it‟s not points I‟m actually calculating, but rather, steps,
from the beginning to the end.
end - startdistance =
# of points - 1
2 0 21
3 1 2d
which is exactly what I wanted. So, I use the starting point, and
each incremental step is obtained by adding this common distance.
Now, let‟s see if we can integrate this into a macro. For more
information on the specifics of how to do this, I refer you to The
Geometric Mind series.
To get up-and-running, use the pull-down menus, and select
“Tools – Macro – Record”, and do some miscellaneous things.
Stop recording. Now select “Tools – Macro – Edit” to get into the
VBA code. It‟s easy – and it‟s fun!
The Mandelbrot Set
58
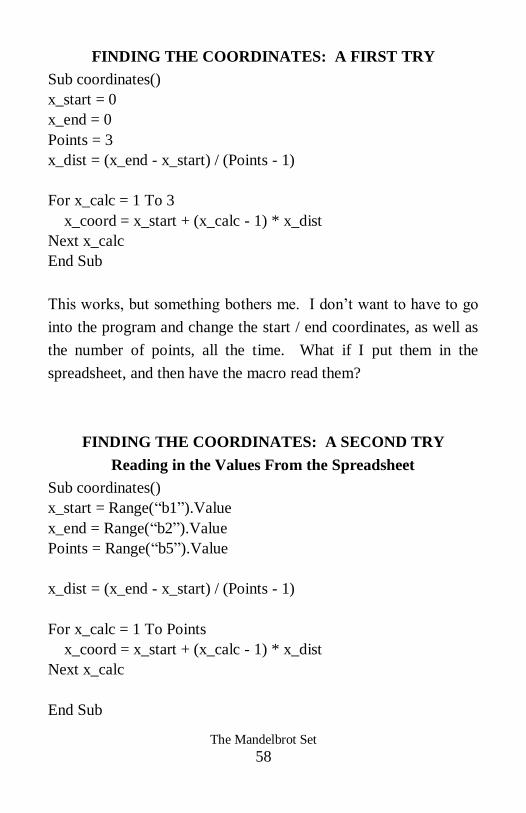
FINDING THE COORDINATES: A FIRST TRY
Sub coordinates()
x_start = 0
x_end = 0
Points = 3
x_dist = (x_end - x_start) / (Points - 1)
For x_calc = 1 To 3
x_coord = x_start + (x_calc - 1) * x_dist
Next x_calc
End Sub
This works, but something bothers me. I don‟t want to have to go
into the program and change the start / end coordinates, as well as
the number of points, all the time. What if I put them in the
spreadsheet, and then have the macro read them?
FINDING THE COORDINATES: A SECOND TRY
Reading in the Values From the Spreadsheet
Sub coordinates()
x_start = Range(“b1”).Value
x_end = Range(“b2”).Value
Points = Range(“b5”).Value
x_dist = (x_end - x_start) / (Points - 1)
For x_calc = 1 To Points
x_coord = x_start + (x_calc - 1) * x_dist
Next x_calc
End Sub
The Mandelbrot Set
59
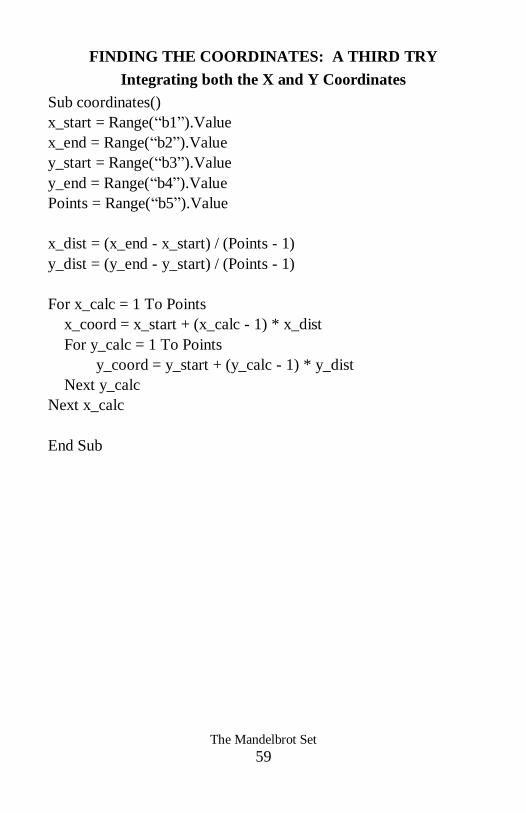
FINDING THE COORDINATES: A THIRD TRY
Integrating both the X and Y Coordinates
Sub coordinates()
x_start = Range(“b1”).Value
x_end = Range(“b2”).Value
y_start = Range(“b3”).Value
y_end = Range(“b4”).Value
Points = Range(“b5”).Value
x_dist = (x_end - x_start) / (Points - 1)
y_dist = (y_end - y_start) / (Points - 1)
For x_calc = 1 To Points
x_coord = x_start + (x_calc - 1) * x_dist
For y_calc = 1 To Points
y_coord = y_start + (y_calc - 1) * y_dist
Next y_calc
Next x_calc
End Sub
The Mandelbrot Set
60
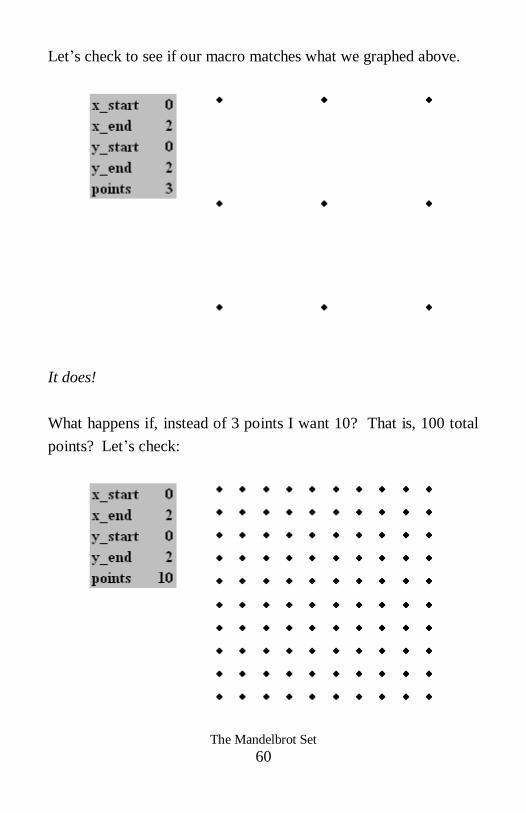
Let‟s check to see if our macro matches what we graphed above.
It does!
What happens if, instead of 3 points I want 10? That is, 100 total
points? Let‟s check:
The Mandelbrot Set
61
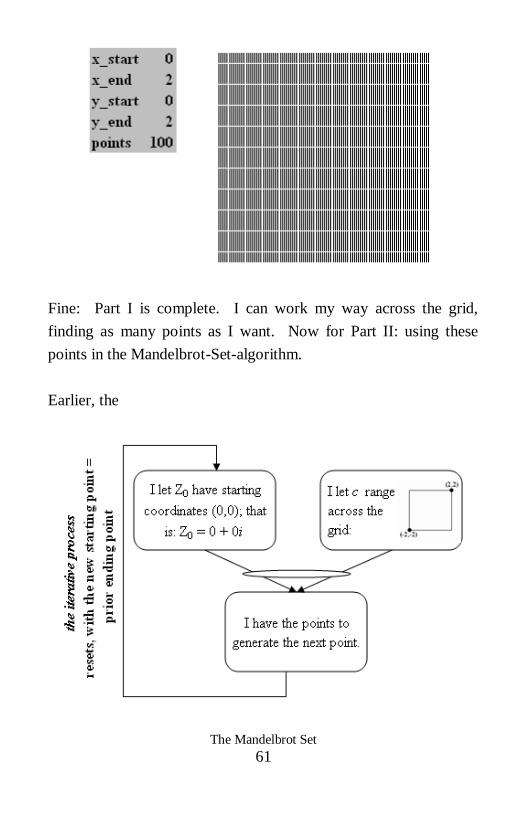
Fine: Part I is complete. I can work my way across the grid,
finding as many points as I want. Now for Part II: using these
points in the Mandelbrot-Set-algorithm.
Earlier, the
The Mandelbrot Set
62
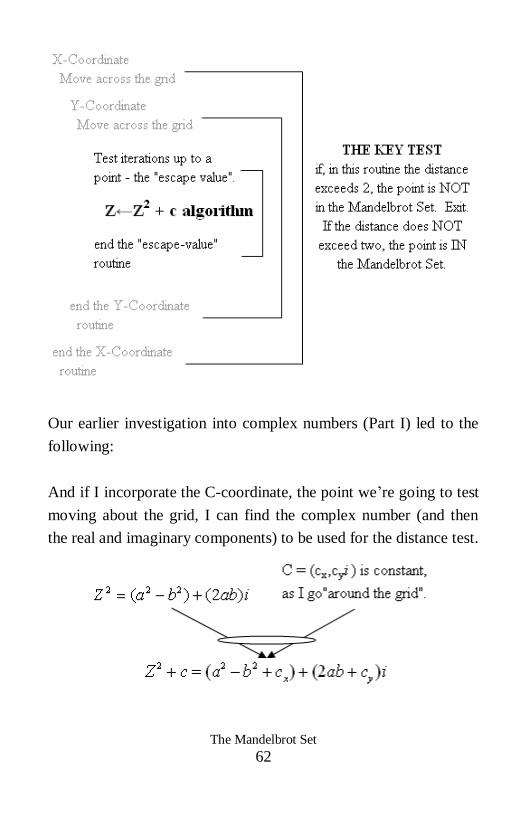
Our earlier investigation into complex numbers (Part I) led to the
following:
And if I incorporate the C-coordinate, the point we‟re going to test
moving about the grid, I can find the complex number (and then
the real and imaginary components) to be used for the distance test.
The Mandelbrot Set
63
THE MANDELBROT SET ALGORITHM
A FIRST TRY
For z = 1 To escapevalue
xsubn1 = xsubn ^ 2 - ysubn ^ 2 + x_coord
ysubn1 = 2 * xsubn * ysubn + y_coord
distance = xsubn1 ^ 2 + ysubn1 ^ 2
If distance > 4 Then GoTo here
xsubn = xsubn1
ysubn = ysubn1
Next z
THE MANDELBROT SET ALGORITHM
A SECOND TRY
Of course, there‟s a couple things missing here. If, in the escape-
value routine, the distance exceeds „4‟ (square of 2), there‟s no
need continuing. As we discussed in Part I, once this happens, the
point is off to the Milky Way. Therefore, get out of the routine,
and move on to the next point.
However, if I do make it to the end of the escape-value routine, it
means the point‟s distance was always less than 4, and therefore,
the point is IN the Mandelbrot Set. Therefore, there needs to be
some code having Excel put the point somewhere in the
spreadsheet.
The Mandelbrot Set
64
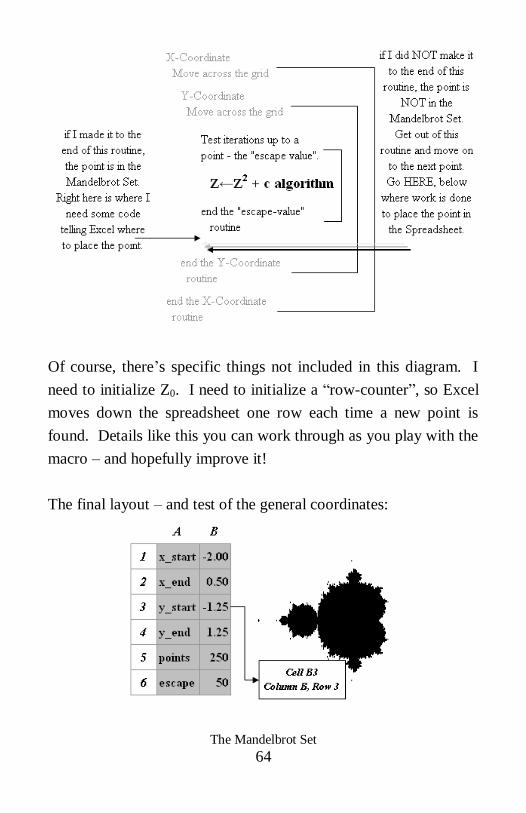
Of course, there‟s specific things not included in this diagram. I
need to initialize Z0. I need to initialize a “row-counter”, so Excel
moves down the spreadsheet one row each time a new point is
found. Details like this you can work through as you play with the
macro – and hopefully improve it!
The final layout – and test of the general coordinates:
The Mandelbrot Set
65
THE MANDELBROT SET
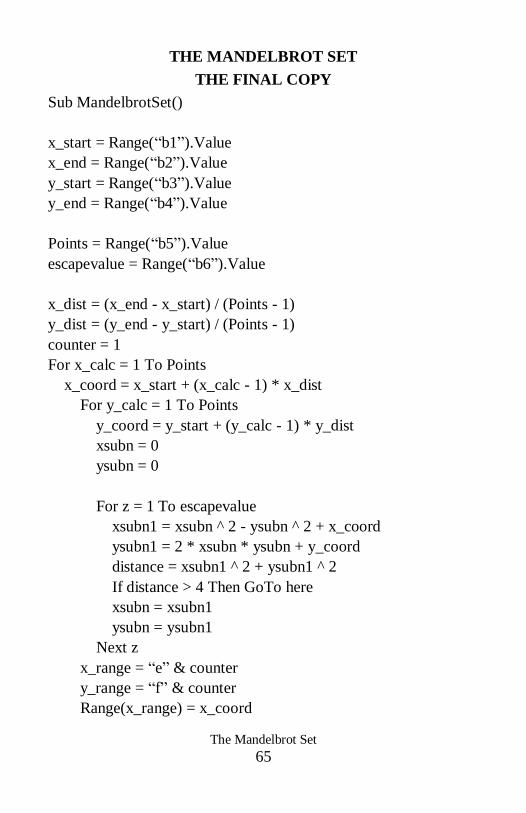
THE FINAL COPY
Sub MandelbrotSet()
x_start = Range(“b1”).Value
x_end = Range(“b2”).Value
y_start = Range(“b3”).Value
y_end = Range(“b4”).Value
Points = Range(“b5”).Value
escapevalue = Range(“b6”).Value
x_dist = (x_end - x_start) / (Points - 1)
y_dist = (y_end - y_start) / (Points - 1)
counter = 1
For x_calc = 1 To Points
x_coord = x_start + (x_calc - 1) * x_dist
For y_calc = 1 To Points
y_coord = y_start + (y_calc - 1) * y_dist
xsubn = 0
ysubn = 0
For z = 1 To escapevalue
xsubn1 = xsubn ^ 2 - ysubn ^ 2 + x_coord
ysubn1 = 2 * xsubn * ysubn + y_coord
distance = xsubn1 ^ 2 + ysubn1 ^ 2
If distance > 4 Then GoTo here
xsubn = xsubn1
ysubn = ysubn1
Next z
x_range = “e” & counter
y_range = “f” & counter
Range(x_range) = x_coord
The Mandelbrot Set
66
Range(y_range) = y_coord
counter = counter + 1
here:
Next y_calc
Next x_calc
End Sub
FINAL THOUGHTS
What‟s going on in columns “E” and “F”, you may be wondering,
and how does all of this calculating result in an image?
See “The Geometric Mind” in this regard.
What I‟ve done is create a column of the coordinates, and graphed
them using a Scatter Plot! Every time the program finds a new
coordinate in the Mandelbrot Set, it adds “1” to the “counter”, thus
moving to the next row.
Then, I set column “E” equal to the current x-coordinate, and
column “F” equal to the current y-coordinate!

The Mandelbrot Set
67
AADDDDIITTIIOONNAALL RREESSOOUURRCCEESS There‟s lots of great things on
the internet about the
Mandelbrot Set and fractals.
One of my favorite books is
The Colours of Infinity, which
comes with a beautiful DVD.
This is also available on
YouTube.
The software program I like
is called Ultra Fractal 5,
though there are many
other great programs
available as well!
It‟s available here:
www.ultrafractal.com
The Mandelbrot Set
68