Embed Size (px)
Citation preview

The Magnitude and Distribution of Fuel Subsidies
David Coady
PSIA GroupFiscal Affairs Department
International Monetary Fund

The views expressed in this presentation are those of the author and do not necessarily represent those of the IMF or
IMF policy

Structure of Presentation
Background to PSIA on fuel subsidies Objective of the PSIA studies Methodology, data, impacts (five steps) Mitigating measures plus pro-poor and pro-
growth expenditures Policy messages from PSIA

Background I: Market Structure
Most developing countries control the domestic pricing and distribution of petroleum products
Recent FAD survey found that from 48 countries
15 had fully liberalized systems8 had functioning automatic pricing formulae (+8
suspended recently)21 had ad hoc pricing

Background II: Prices and Subsidies(World prices have increased substantially since 2002)
Text Table A. Change in International Fuel Prices, 2003-061
US$ per liter Percent changeCrude oil prices 0.4 128.0Gasoline 0.6 140.7Kerosene 0.6 126.7Diesel 0.6 142.1
1/Increase during end-2003 to June 2006. Thecrude oil price is the average spot prices for Dated Brent,WTI, and the Dubai Fateh. The prices for the other fuelsare the average fob prices for Rotterdam, New York, Gulf Coast, Los Angeles and Singapore.

Major Events and Real Price of U. S. Oil Imports, 1970–2006
$-
$10
$20
$30
$40
$50
$60
$70
$80
1970 1972 1974 1976 1978 1980 1982 1984 1986 1988 1990 1992 1994 1996 1998 2000 2002 2004 2006
$2
00
5Q
2 p
er b
arre
l
1973 Oil Embargo
Iranian revolution; Shah deposed
Iran-Iraq War begins; oil prices peak
Saudi Arabia abandons "swing producer" role; oil prices collapse
Iraq invades Kuwait
Gulf War
Asian economic crisis; oil oversupply; prices fall sharply
Prices rise sharply on OPEC cutbacks, increased demand
Prices fall sharply on 9/11 attacks
Prices spike on Iraq war, rapid demand increases, constrained OPEC capacity, etc.

Text Table C. Gasoline Pricing Mechansims, Prices and Price Pass-Through
Pricing Number of Average price Price pass
mechanism countries (US$ per liter) though
2003 2006
Ad hoc 21 0.61 0.98 0.83
Automatic 8 0.56 0.84 1.00
Liberalized 15 0.70 1.03 1.13

Background II: Prices and Subsidies
Controlled prices have resulted in rising budget subsidies in many countries (% 2005 GDP, estimated)
– Yemen, 9.2; Jordan, 5.8; Indonesia, 4.2; Bolivia, 0.8– Subsidy rates typically higher for kerosene and diesel as well as
in exporting countries Countries often respond by decreasing taxation, so-
called tax expenditures (especially kerosene and diesel)– e.g. Bangladesh, India, Sri Lanka, Kenya, Zambia
Implicit subsidies also often substantial and take form of quasi-fiscal deficit financed by debt (%GDP2005, estimated)
– Azerbaijan, 13.9 (2.8ex); Egypt, 4.1; Ecuador, 3.6; Bolivia, 5.2

Explicit Subsidies (%GDP)
Est. Proj.2003 2005 2006
(a) Explicit subsidies
Argentina 0.0 0.2 0.2Azerbaijan 5.1 2.8 1.9Bolivia 0.6 0.8 1.3Cameroon 0.0 0.2 0.3Congo, Republic of 0.8 1.0 1.0Dominican Republic ... 0.5 0.4Ghana 0.2 0.9 0.7Honduras ... ... 0.6Indonesia 1.5 4.2 2.5Jordan 0.0 5.8 1.2Lebanon ... 0.1 0.1Nigeria 0.0 0.0 1.0Pakistan 0.1 0.2 ...Senegal ... 0.6 0.8Sri Lanka ... 0.8 ...Yemen, Republic of 5.0 9.2 8.5

Implicit Subsidies (%GDP)
Est. Proj.2003 2005 2006
(b) Implicit subsidies
Armenia 0 0 1.0Azerbaijan 10.0 13.9 10.4Bangladesh ... 1.0 ...Bolivia 1.7 5.2 6.6Cameroon 0.1 0.0Colombia 1.2 1.6Congo, Republic of ... ... …Dominican Republic ... 0.2 0.3Ecuador 1.4 3.6 ...Egypt 3.9 4.1 6.2Ethiopia ... 0.7Gabon 0.4 1.6 2.8Indonesia ... ... 0.3Nigeria 1.6 2.2 ...Sri Lanka ... 1 ...

Text Table B. The Average Price Pass Through, 2003-2006 1
Gasoline Kerosene Diesel
Net oil importers 1.09 0.91 1.15Net oil exporters 0.46 0.43 0.70
AFR 1.06 1.07 1.11APD 1.05 0.37 0.83EUR 1.25 ... 1.54MCD 0.56 0.78 0.78WHD 1.00 0.92 1.30G-7 countries 1.11
of which : USA 0.89
Average 2 0.96 0.83 1.07
Countries in sample 2 44 29 39
1/ Post-tax retail prices; latest observation for the fisrt half of 2006. A number lower than one indicates less than full pass-through. 2/ excluding G7 countries
Pricing Regime (Selected Countries)
Retail fuel price (US$ per liter) Price pass-through
CountryPrice mechanism Gasoline Kerosene Diesel Gasoline Kerosene Diesel
Argentina Liberalized 0.65 0.47 0.64 0.09 0.08 0.83 46.4
Bolivia Ad hoc 0.46 0.34 ... 0.21 ... ... 36.4
Brazil Liberalized 1.27 ... 0.92 1.14 ... 2.92 ...
Colombia Automatic 0.64 ... 0.47 0.74 ... 0.65 38.4
Dominica Automatic ... ... ... ... ... ... ...
DominicanRep Liberalized 1.03 0.83 0.79 1.78 1.49 1.29 33.4
Ecuador Ad hoc ... ... ... ... ... ... ...
Honduras Ad hoc 3.33 2.27 ... ... ... ... ...
Peru Liberalized 1.25 0.91 0.85 1.64 1.28 0.99 42.0
Uruguay Ad hoc 1.45 0.89 0.95 1.40 0.84 1.14 43.9
Tax % Gas Retail Prices (2006)

Background III: Reform Agenda
Fuel subsidies seen as undesirable because– High fiscal cost with consequences elsewhere in budget
(Indonesia/Yemen: subsidies exceeded combined health and education budgets)
– Inefficient: leads to over-consumption Governments still reluctant to increase domestic prices
in line with world prices– Concerns about impact on poor and politically unpopular– PSIA can inform choice of appropriate policy response (so far:
Angola, Bangladesh, Bolivia, Ethiopia, Gabon, Ghana, Honduras, Jordan, Madagascar, Mali, Moldova, Sri Lanka, Sudan)
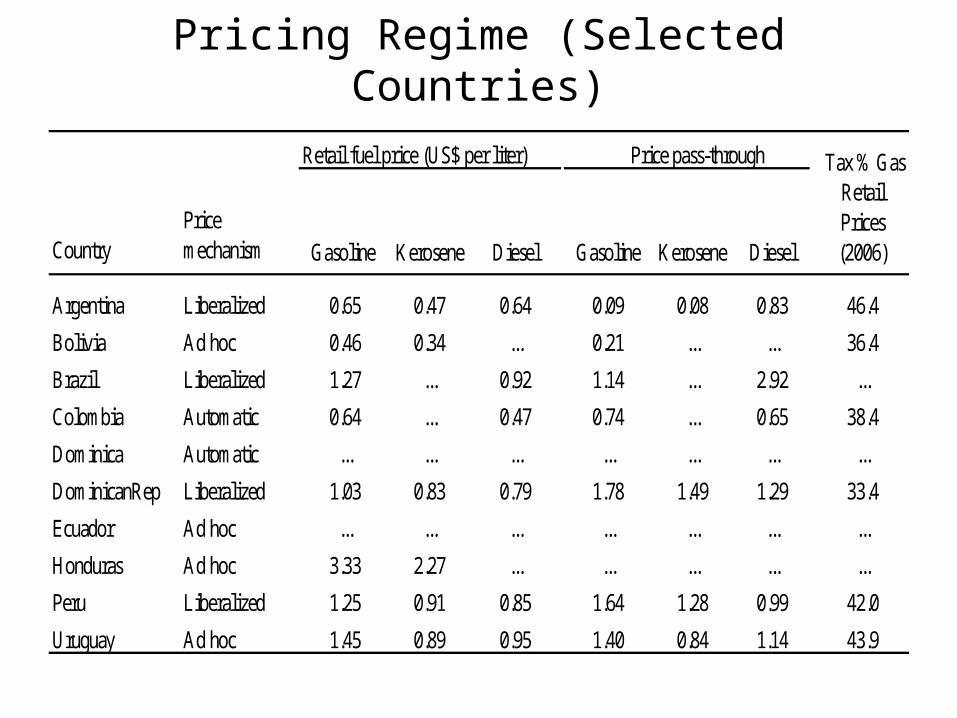
Objective of PSIA
To identify the magnitude and financing of consumer subsidies
To evaluate the aggregate and distributional incidence of their withdrawal on household real incomes
To identify appropriate mitigation measures to offset adverse impact on poorest households
To identify higher priority public expenditures (more pro-poor and pro-growth)

Methodology and Data
Higher domestic prices affect consumers through two channels– Direct effect from increase in price of fuels consumed
by households– Indirect effect from increase in prices of goods and
services that use fuel as inputs Indirect effect often substantial since over 50 percent of total
consumption of fuel is as intermediate product

Step I: Identify magnitude and financing
This requires a reference price for each product and required price increases– For most countries, border (cif,fob) price
(plus,minus) domestic trade and transport margins
– Often existing or desired tax levels included in reference price to allow for “tax expenditures”
Average price increase ranged from 34-68 percent (mostly including taxes)

Magnitude and Financing of Subsidies
P
Q
Pm
Pc
Pp
Ps
Qc Qs
Demand
A B C
D E
• Domestic refinery that imports product
• Import at P(m), produce at P(c)• Subsidized domestic price is P(s)• Produces Q(c), imports Q(s)-Q(c)• Total consumer subsidy =
(A+B+C)=Q(s)[P(m)-P(s)]• Where shows up depends on price
to producer. If taxes, P(p), P(s) – Explicit import subsidy=(B+C)
– Loss in profits=(A+D)+E
– Tax revenue=(D+E)
– Net fiscal position
• On budget: (D+E)-(B+C)
• Off budget: -(A+D+E)

Cameroon: More Transparent Formula
Petrol
300 300 300 300
107 98 98 98
30
6477 77 77
21
120 200120
157
33
595
0
100
200
300
400
500
600
700
800
Exisiting Reformed Effi ciency Equity Actual
Import Price Margins Customs VAT Input VAT Excise AE Actual Price

Sri Lanka: Eliminating subsidies required:
gas (12%), diesel (20%), kerosene (58%), average (23%)
104
93
79
43
84
61
02
04
06
08
01
00
Pri
ce (
Rp
/ L
r)
Gasoline Kerosene Diesel
Formula Actual Formula Actual Formula Actual
Landed Cost Value Added TaxDistribution Margins Consumer PriceExcise Taxes

Step II: Calculate direct effect
Need household survey with information on different fuel expenditures
For each household, calculate budget shares as expenditure on fuel divided by total household consumption
Multiply required price increases by budget share to get approx. real income impact
Look at distribution of percentage real income effect across income groups (regressive vs. progressive)

Example of fuel consumption patterns in Sri Lanka
3.02.7
2.5 2.6
3.7
5.3
02
46
Bu
dg
et S
hare
BottomDecile
SecondDecile
SecondQuintile
ThirdQuintile
FourthQuintile
TopQuintile
Kerosene Diesel and PetrolLPG Electricity

Magnitude of direct effect
Fuel budget shares varied from 2-4.3 percent (3.1-6.6 percent including electricity)
– Therefore, a 50 percent increase in average price implies a 1-2.1 percent (1.6-3.3 percent) decrease in real incomes
Fuel budget shares for lowest welfare quintile varied from 2-6 percent (2.7-7.1 percent)
– Therefore, a 50 percent increase in average price implies a 1-3 percent (1.4-3.6 percent) decrease in real incomes
Direct effect found to be either neutral of regressive– Reflects importance of kerosene, which is typically relatively
heavily subsidized

Step III: Calculate indirect effect
An input-output table and a simple model can be used to calculate the increase in prices for other goods and services from higher fuel costs
Aggregate household consumption data to get budget shares for input-output sectors
Multiply budget shares by percentage price increases to get percentage real income effect
Aggregate to get total indirect effect and look at distribution across different income groups
Add to direct effect to get total impact of fuel price increase on household real incomes and distribution

Example from Ghana
Sector Budget Share (BS)
Price Effect (dP)
Impact=BS*dP
Agriculture 0.452 0.066 0.030 Utilities and mining 0.021 0.116 0.002 Manufacturing 0.253 0.052 0.013 Construction 0.000 0.107 0.000 Trade 0.070 0.107 0.007 Transport 0.032 0.267 0.008 Business 0.025 0.025 0.001 Community 0.097 0.048 0.005 Electricity 0.008 0.000 0.000

Magnitude of indirect effect
Indirect effect at least as large as direct effect and approximately neutral incidence
A 50 percent average increase associated with a 3 percent decrease in real incomes
Most of indirect effect comes through higher food and transport costs

Magnitude of total effect
Total effect ranged from 2-8.5 percent A 50 percent increase associated on average
with a 4.6 percent decrease in real incomes Distribution typically regressive reflecting role
of higher kerosene price increases

Step IV: Evaluate targeting efficiency
Calculate the share of the total subsidy (or, equivalently, the burden of subsidy removal) accruing to each income group
Can do this separately for each product as well as the direct, indirect and total effects
Individual product shares useful later when comparing alternative approaches to protecting the real incomes of low-income households

Fuel subsidies are badly targeted
A relatively high share of total fuel subsidies go to higher income groups
– Share of bottom two quintiles varied from 15-25 percent (so 75-85 percent of subsidy benefit accrues to top three quintiles)
– So costs 4-6.7 units of income for every 1 unit transferred to bottom two quintiles
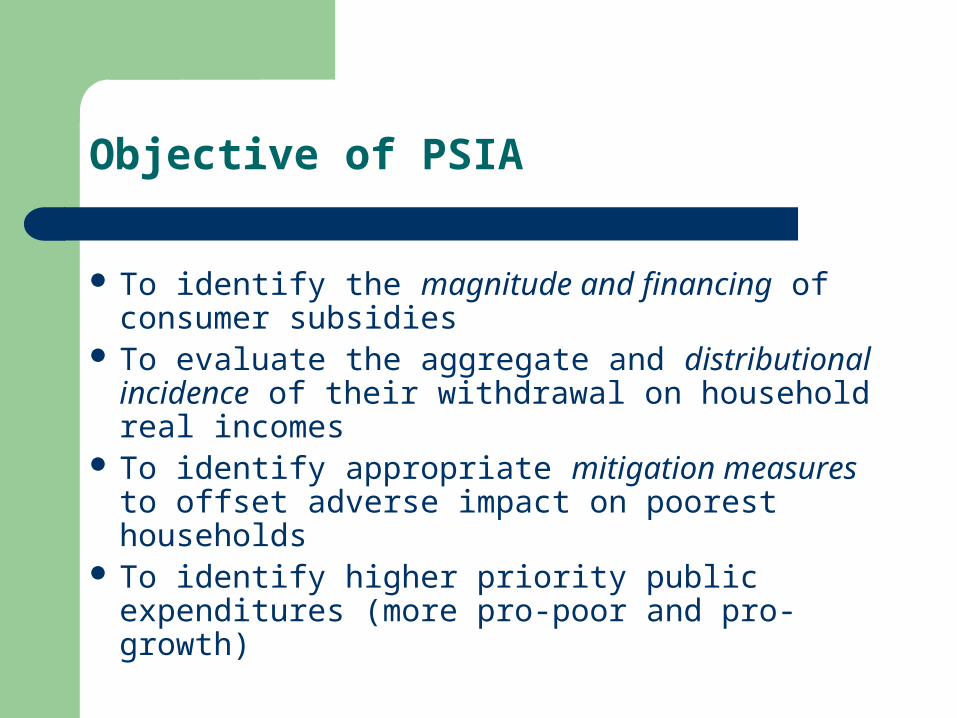
Even direct (mainly kerosene) subsidy is badly targeted
– Between 70-80 percent leaks to top three quintiles so costs 3.3-5 units of income for every unit transferred to bottom two quintiles

Step V: Identify mitigating measures
Although badly targeted, withdrawal of fuel subsidies can have substantial adverse effect on poor (c2-9%)
Can consider a number of alternatives and simulate using household-level data (budgetary cost minimized by better targeted transfers/expenditures)
– Gradual withdrawal of specific fuel subsidies (kerosene, LPG) to minimize revenue-poverty trade-off
– Using some of budgetary savings to finance targeted public expenditures (education, health, roads, transport, electricity)
– Restructure electricity tariff schedules to reduces cost for poor– Use savings to finance existing/reformed/new social safety net
for poorest households

Example from Ghana
Bottom 2nd
Quint 3rd
Quint 4th
Quint
Top
Benefit Shares
Education
Untargeted 0.215 0.225 0.219 0.187 0.154
Targeted 0.204 0.279 0.249 0.170 0.098
Health
Untargeted 0.149 0.193 0.208 0.207 0.244
Targeted 0.148 0.229 0.208 0.226 0.189
Rural electrification 0.329 0.251 0.212 0.135 0.074
Urban transport 0.299 0.128 0.185 0.280 0.108
Proxy-means targeting 0.373 0.277 0.205 0.111 0.035
Kerosene subsidy 0.178 0.211 0.227 0.209 0.174

Example from Sri Lanka
Kerosene subsidies Use of electricity lifeline rates
– Potential benefits from restructuring tariff schedule
Use of existing Samurdhi transfer program– Highlight performance level of existing program– Emphasize gains from reforming design and
implementation
Even kerosene subsidies involves substantial leakage to the non-poor
13.0%
10.7%
22.0%
20.2%
18.9%
15.2%
Bottom Decile Second Decile
Second Quintile Third QuintileFourth Quintile Top Quintile

Share of Gasoline Burden (Cameroon)
0.2%0.2%2.3%3.9%
10.3%
83.0%
Bottom Decile Second Decile
Second Quintile Third QuintileFourth Quintile Top Quintile
Share of Burden from Direct Effect--Gasoline

Share of LPG Burden (Cameroon)
0.7%1.9%6.0%
11.0%
22.4%58.1%
Bottom Decile Second Decile
Second Quintile Third QuintileFourth Quintile Top Quintile
Share of Burden from Direct Effect--LPG

Alternatively could subsidize electricity.......
0.2
.4.6
.81
Den
sity o
f E
lectr
icity C
on
sum
ption
01
23
45
67
Tari
ff (
Rs/k
Wh)
0 50 100 150 200 250Monthly Electricity Consumption (Kw/H)
Existing Tariffs Scaled TariffsRestructured Tariffs Cumulative Density

......but these appear badly structured.....
20thpercentile
40thpercentile
12
34
5
Ave
rag
e T
ariff (
Rp
/Kw
)
6 8 10Log Per Capita Consumption
Existing Tariffs Scaled TariffsRestructured Tariffs
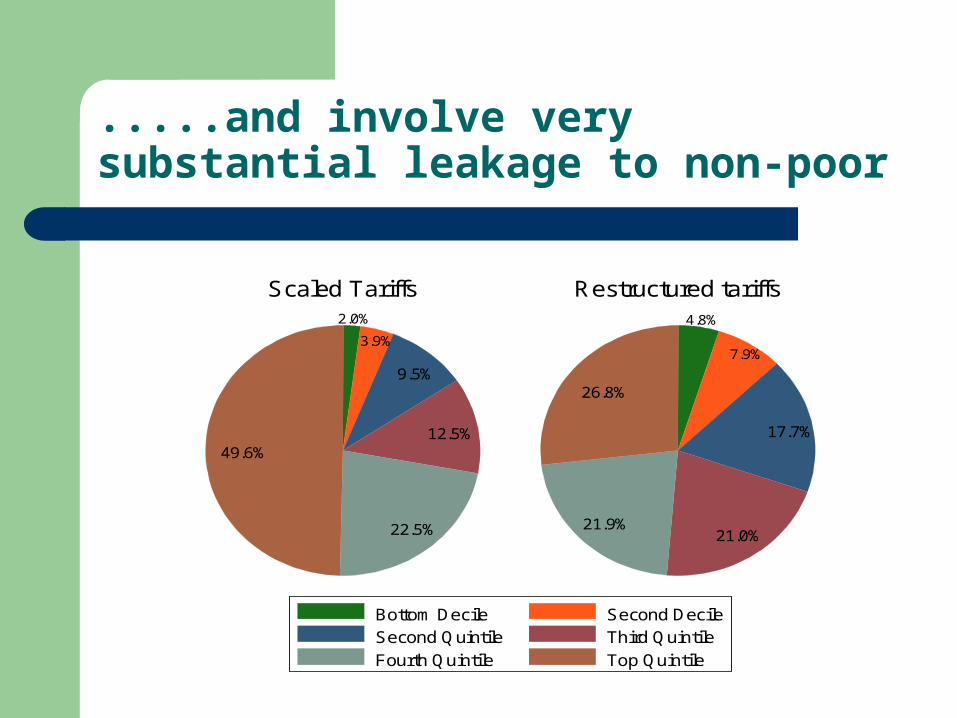
.....and involve very substantial leakage to non-poor
2.0%
3.9%
9.5%
12.5%
22.5%
49.6%
4.8%
7.9%
17.7%
21.0%21.9%
26.8%
Scaled Tariffs Restructured tariffs
Bottom Decile Second DecileSecond Quintile Third Quintile
Fourth Quintile Top Quintile

The Samurdhi program reduces leakage substantially.........
17.4%
14.8%
26.1%
22.4%
14.7%
4.6%
24.9%
18.9%
29.1%
18.1%
8.0%
1.0%
Samurdhi Food Stamps Reformed Samurdhi
Bottom Decile Second DecileSecond Quintile Third Quintile
Fourth Quintile Top Quintile

....and potentially provides a more cost-effective approach to social protection
16.9
7.97.3
4.2
3.12.3
05
10
15
20
Cost p
er
Rs. 1
for
bo
ttom
20
%
Scaled Electricity Restructured ElectricityFuel KeroseneExisting Samurdhi Restructured Samurdhi

Policy messages from PSIA
Fuel subsidies are often substantial fiscal drain, crowd-out priority expenditures and badly targeted
So should be able to identify alternative uses that are more pro-poor and pro-growth:
– Alternative approaches to social protection can provide same or better protection at substantially lower fiscal cost
– Higher priority public expenditures (nutrition, health, education, infrastructure) – e.g. based on PRSP
– Access to effective system for targeting expenditures can be a crucial component for promoting efficiency-enhancing structural reforms

Policy messages from PSIA
Important to announce reforms as part of a package: budgetary savings to finance better targeted, higher priority expenditures that benefit low- and middle-income households
Gradual reduction of better targeted fuel subsidies should be seen only as short term measure are developed since revenue-poverty trade off is large and efficiency cost from inter-fuel substitution large


![Welcome [psia-c.org]](https://img.pdfslide.us/doc/110x75/61fb046db4df580127531096/welcome-psia-corg.jpg)