Embed Size (px)
Citation preview
384 VOLUME 14W E A T H E R A N D F O R E C A S T I N G
q 1999 American Meteorological Society
The Madison County, Virginia, Flash Flood of 27 June 1995
MICHAEL D. PONTRELLI, GEORGE BRYAN, AND J. M. FRITSCH
Department of Meteorology, The Pennsylvania State University, University Park, Pennsylvania
(Manuscript received 19 February 1998, in final form 5 February 1999)
ABSTRACT
Between 25 and 27 June 1995, excessive rainfall and associated flash flooding across portions of westernVirginia resulted in three fatalities and millions of dollars in damage. Although many convective storms occurredover this region during this period, two particular mesoscale convective systems that occurred on 27 June wereprimarily responsible for the severe event. The first system (the Piedmont storm) developed over Madison County,Virginia (eastern slopes of the Blue Ridge Mountains), and propagated slowly southward producing 100–300mm of rain over a narrow swath of the Virginia foothills and Piedmont. The second system (the Madison storm)developed over the same area but remained quasi-stationary along the eastern slopes of the Blue Ridge fornearly 8 h producing more than 600 mm of rain.
Analysis of this event indicates that the synoptic conditions responsible for initiating and maintaining theMadison storm were very similar to the Big Thompson and Fort Collins floods along the Front Range of theRocky Mountains, as well as the Rapid City flood along the east slopes of the Black Hills of South Dakota. Inall four events, an approaching shortwave aloft coupled with high-level difluence/divergence signaled the presenceof local ascent and convective destabilization. A postfrontal ribbon of relatively fast-moving high-ue air, orientednearly perpendicular to the mountain range, provided a copious moisture supply and helped focus the convectionover a relatively small area. Weak middle- and upper-tropospheric steering currents favored slow-moving stormsthat further contributed to locally excessive rainfall.
A conceptual model for the Madison–Piedmont convective systems and their synoptic environment is presented,and the similarities and differences between the Madison County flood and the Big Thompson, Fort Collins,and Rapid City floods are highlighted.
1. Introduction
During the week of 25 June 1995 excessive rains fellover much of the mid-Atlantic region. Weak steeringcurrents and very moist air contributed to periodic,slow-moving thunderstorms. The heavy rainfall satu-rated the ground and set the stage for severe flash flood-ing. On 27 June, a weak cold front drifted slowly south-ward into the mid-Atlantic states, triggering additionalthunderstorms with heavy rain. Early in the morning, aconvective system developed over Madison County anddrifted southward over the Virginia Piedmont. Soon af-ter this first system exited the county, a second systemformed over northeastern Madison County, intensified,and propagated southwestward along the eastern slopesof the Blue Ridge (Fig. 1). This system remained quasi-stationary over the western portions of the county, feed-ing off moist, conditionally unstable air flowing west-ward from the Atlantic Ocean. Heavy downpours in-undated the Rapidan River’s watershed throughout the
Corresponding author address: J. M. Fritsch, Department of Me-teorology, 503 Walker Building, The Pennsylvania State University,University Park, PA 16802.E-mail: [email protected]
morning and early afternoon causing record flooding.According to Smith et al. (1996), basin-average rainfallreached 344 mm.
The flood waters receded slowly on 28 June, revealinga grim scene of devastation. Massive scars, visible formiles, highlighted the paths where mountainsides hadliquefied and flowed into the valleys. These ‘‘debrisflows,’’ which consisted of boulders, trees, mud, andwater, swept downhill and destroyed everything in theirpath. Over 400 roads were closed, and 80 bridges and2000 homes were damaged or destroyed (Virginia De-partment of Emergency Services 1998). There werethree fatalities, 20 people sustained injuries, and nearly800 residents were evacuated (NOAA 1995). The eco-nomic toll was equally staggering. Total losses in Vir-ginia, excluding cleanup costs, exceeded 200 milliondollars (Virginia Department of Emergency Services1998). The hardest hit area was Madison County wheredamage to property and agriculture was estimated at 93million dollars. Terrain scars and property damage werestill evident a full year later.
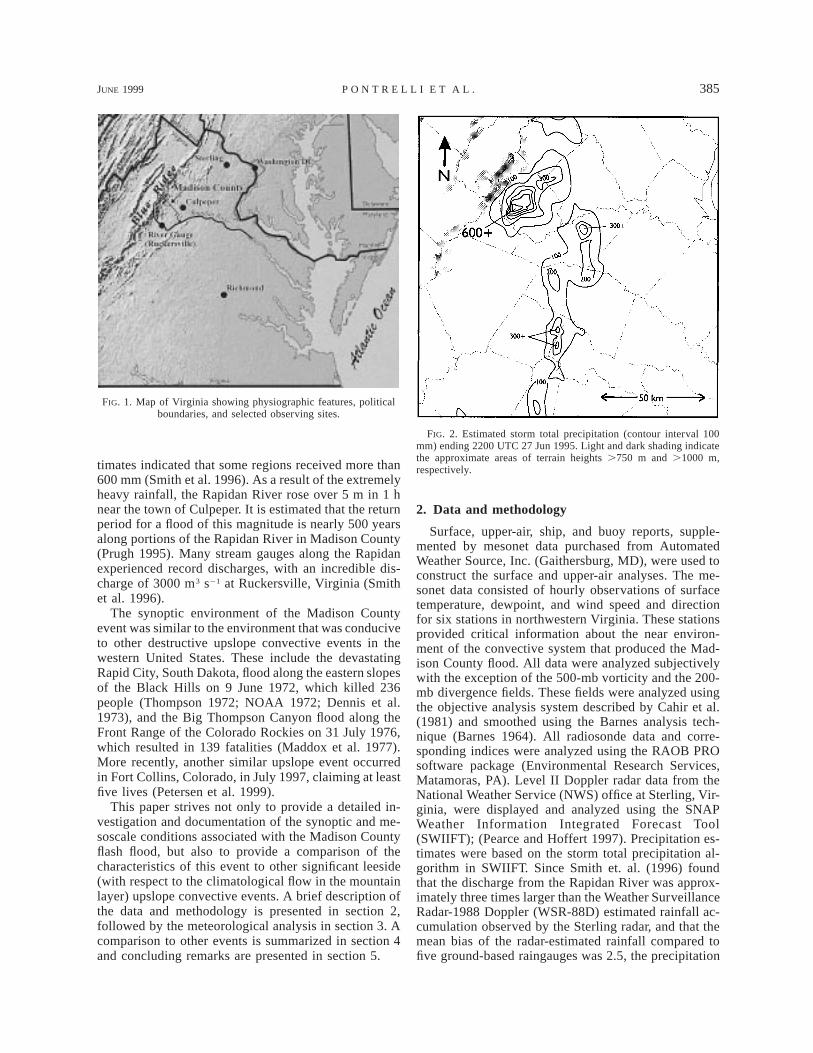
Figure 2 shows the precipitation amounts that fell inthe region of most severe flooding. Several observersrecorded total precipitation in excess of 500 mm, with250 mm falling in only 2 h (NOAA 1995). Radar es-
JUNE 1999 385P O N T R E L L I E T A L .
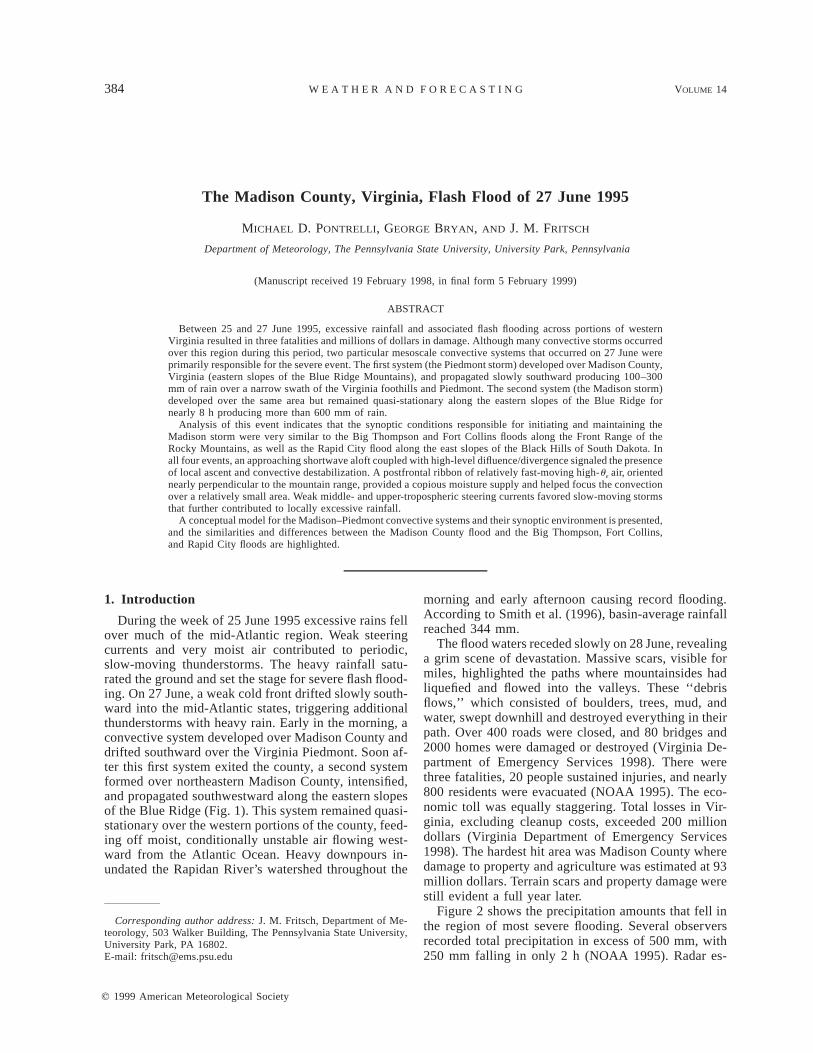
FIG. 1. Map of Virginia showing physiographic features, politicalboundaries, and selected observing sites.
FIG. 2. Estimated storm total precipitation (contour interval 100mm) ending 2200 UTC 27 Jun 1995. Light and dark shading indicatethe approximate areas of terrain heights .750 m and .1000 m,respectively.timates indicated that some regions received more than
600 mm (Smith et al. 1996). As a result of the extremelyheavy rainfall, the Rapidan River rose over 5 m in 1 hnear the town of Culpeper. It is estimated that the returnperiod for a flood of this magnitude is nearly 500 yearsalong portions of the Rapidan River in Madison County(Prugh 1995). Many stream gauges along the Rapidanexperienced record discharges, with an incredible dis-charge of 3000 m3 s21 at Ruckersville, Virginia (Smithet al. 1996).
The synoptic environment of the Madison Countyevent was similar to the environment that was conduciveto other destructive upslope convective events in thewestern United States. These include the devastatingRapid City, South Dakota, flood along the eastern slopesof the Black Hills on 9 June 1972, which killed 236people (Thompson 1972; NOAA 1972; Dennis et al.1973), and the Big Thompson Canyon flood along theFront Range of the Colorado Rockies on 31 July 1976,which resulted in 139 fatalities (Maddox et al. 1977).More recently, another similar upslope event occurredin Fort Collins, Colorado, in July 1997, claiming at leastfive lives (Petersen et al. 1999).
This paper strives not only to provide a detailed in-vestigation and documentation of the synoptic and me-soscale conditions associated with the Madison Countyflash flood, but also to provide a comparison of thecharacteristics of this event to other significant leeside(with respect to the climatological flow in the mountainlayer) upslope convective events. A brief description ofthe data and methodology is presented in section 2,followed by the meteorological analysis in section 3. Acomparison to other events is summarized in section 4and concluding remarks are presented in section 5.
2. Data and methodology
Surface, upper-air, ship, and buoy reports, supple-mented by mesonet data purchased from AutomatedWeather Source, Inc. (Gaithersburg, MD), were used toconstruct the surface and upper-air analyses. The me-sonet data consisted of hourly observations of surfacetemperature, dewpoint, and wind speed and directionfor six stations in northwestern Virginia. These stationsprovided critical information about the near environ-ment of the convective system that produced the Mad-ison County flood. All data were analyzed subjectivelywith the exception of the 500-mb vorticity and the 200-mb divergence fields. These fields were analyzed usingthe objective analysis system described by Cahir et al.(1981) and smoothed using the Barnes analysis tech-nique (Barnes 1964). All radiosonde data and corre-sponding indices were analyzed using the RAOB PROsoftware package (Environmental Research Services,Matamoras, PA). Level II Doppler radar data from theNational Weather Service (NWS) office at Sterling, Vir-ginia, were displayed and analyzed using the SNAPWeather Information Integrated Forecast Tool(SWIIFT); (Pearce and Hoffert 1997). Precipitation es-timates were based on the storm total precipitation al-gorithm in SWIIFT. Since Smith et. al. (1996) foundthat the discharge from the Rapidan River was approx-imately three times larger than the Weather SurveillanceRadar-1988 Doppler (WSR-88D) estimated rainfall ac-cumulation observed by the Sterling radar, and that themean bias of the radar-estimated rainfall compared tofive ground-based raingauges was 2.5, the precipitation
386 VOLUME 14W E A T H E R A N D F O R E C A S T I N G
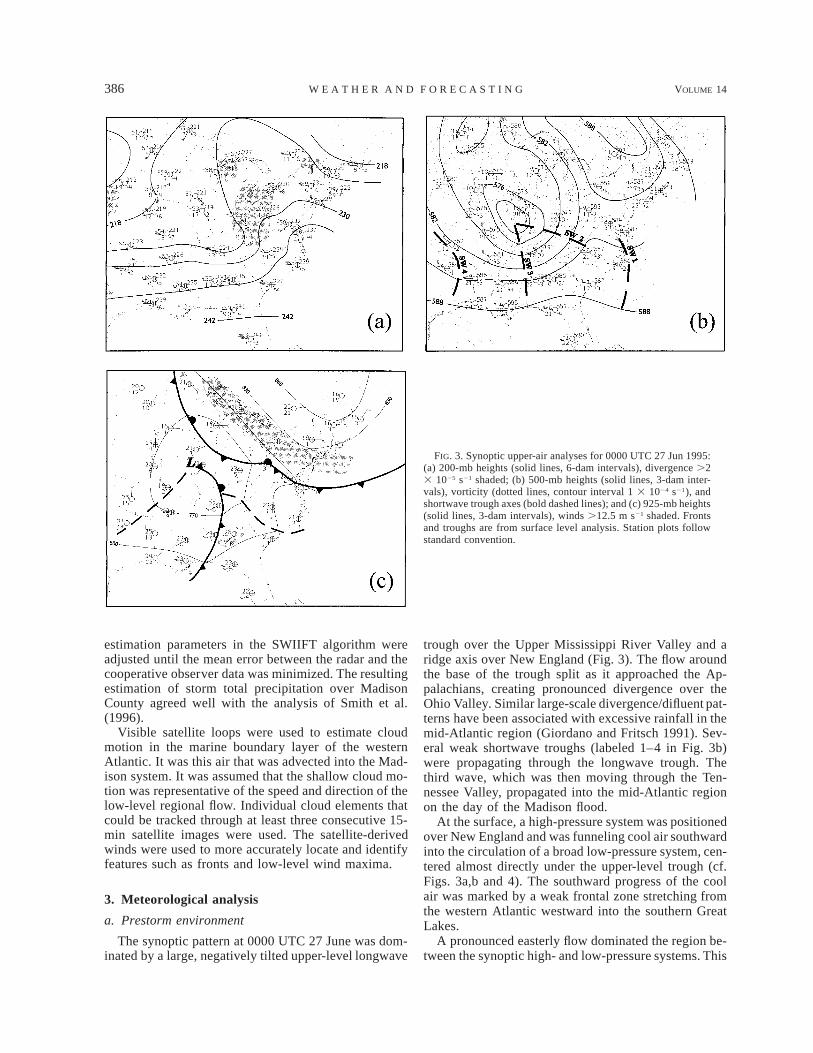
FIG. 3. Synoptic upper-air analyses for 0000 UTC 27 Jun 1995:(a) 200-mb heights (solid lines, 6-dam intervals), divergence .23 1025 s21 shaded; (b) 500-mb heights (solid lines, 3-dam inter-vals), vorticity (dotted lines, contour interval 1 3 1024 s21), andshortwave trough axes (bold dashed lines); and (c) 925-mb heights(solid lines, 3-dam intervals), winds .12.5 m s21 shaded. Frontsand troughs are from surface level analysis. Station plots followstandard convention.
estimation parameters in the SWIIFT algorithm wereadjusted until the mean error between the radar and thecooperative observer data was minimized. The resultingestimation of storm total precipitation over MadisonCounty agreed well with the analysis of Smith et al.(1996).
Visible satellite loops were used to estimate cloudmotion in the marine boundary layer of the westernAtlantic. It was this air that was advected into the Mad-ison system. It was assumed that the shallow cloud mo-tion was representative of the speed and direction of thelow-level regional flow. Individual cloud elements thatcould be tracked through at least three consecutive 15-min satellite images were used. The satellite-derivedwinds were used to more accurately locate and identifyfeatures such as fronts and low-level wind maxima.
3. Meteorological analysis
a. Prestorm environment
The synoptic pattern at 0000 UTC 27 June was dom-inated by a large, negatively tilted upper-level longwave
trough over the Upper Mississippi River Valley and aridge axis over New England (Fig. 3). The flow aroundthe base of the trough split as it approached the Ap-palachians, creating pronounced divergence over theOhio Valley. Similar large-scale divergence/difluent pat-terns have been associated with excessive rainfall in themid-Atlantic region (Giordano and Fritsch 1991). Sev-eral weak shortwave troughs (labeled 1–4 in Fig. 3b)were propagating through the longwave trough. Thethird wave, which was then moving through the Ten-nessee Valley, propagated into the mid-Atlantic regionon the day of the Madison flood.
At the surface, a high-pressure system was positionedover New England and was funneling cool air southwardinto the circulation of a broad low-pressure system, cen-tered almost directly under the upper-level trough (cf.Figs. 3a,b and 4). The southward progress of the coolair was marked by a weak frontal zone stretching fromthe western Atlantic westward into the southern GreatLakes.
A pronounced easterly flow dominated the region be-tween the synoptic high- and low-pressure systems. This

JUNE 1999 387P O N T R E L L I E T A L .
FIG. 4. Synoptic surface analysis for 0000 UTC 27 Jun 1995.Contour interval is 4 mb.
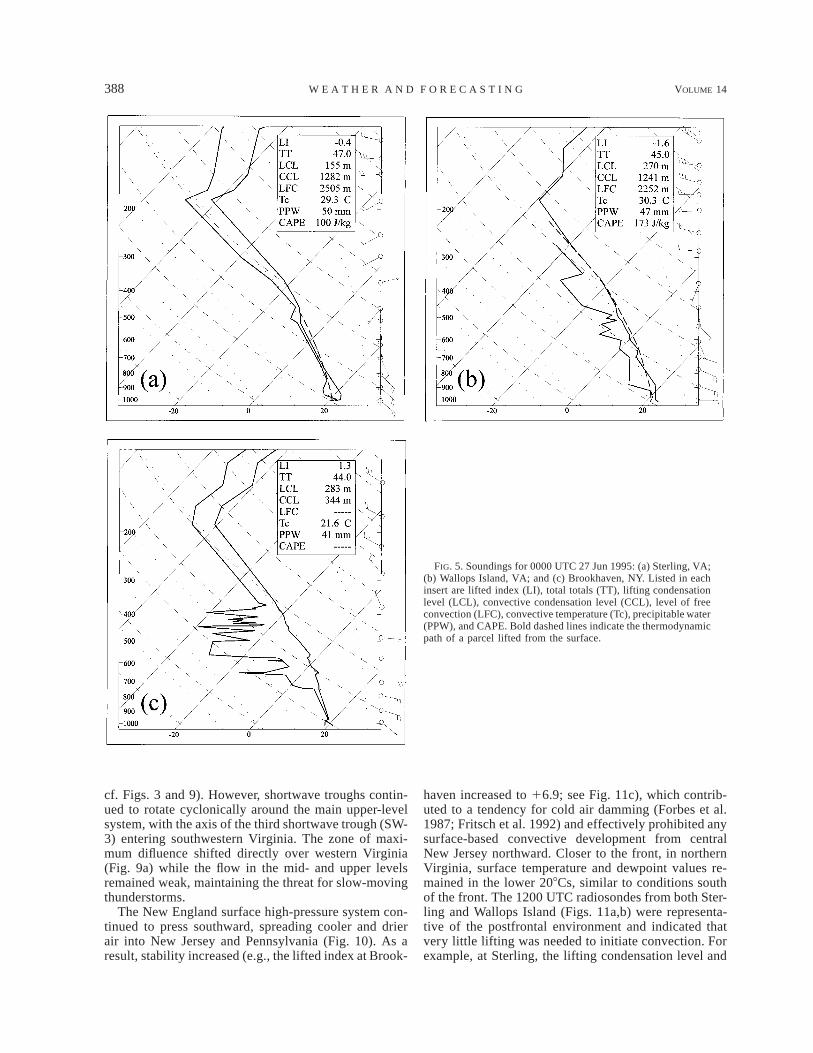
easterly flow was transporting cool, moist Atlantic airwestward into the east slopes of the Appalachians.Soundings taken at Sterling and Wallops Island, Virginia(Figs. 5a,b), just ahead of the frontal zone, show a deep,moist southeasterly flow with a weak stable layer be-tween 50 and 100 mb above the surface. The total totalsindex (Peppler and Lamb 1989) ranged between 44 and47, indicating favorable conditions for the developmentof thunderstorms if the inversion were broken. Liftedindex values (Peppler and Lamb 1989) for surface airwere only slightly negative (ø21) and convective avail-able potential energy (CAPE) was relatively small, onlyabout 150 J kg21 across the region. Wind speeds weregenerally light, particularly at midlevels, and weak ver-tical shear prevailed over most of the troposphere. Theair was very moist over the mid-Atlantic region, es-pecially in northern Virginia where the entire tropo-sphere was nearly saturated (Fig. 5a) and precipitablewater values (Fig. 6) were nearly 50 mm (over 160%of normal). These values exceeded the maximum pre-cipitable water values observed just prior to the Johns-town, Pennsylvania, flash flood of 1977 (Hoxit et al.1978). Moreover, the surface and 850-mb dewpointswere the same as the average values found for intenserainstorms in the mid-Atlantic region, that is, 238 and148C, respectively (Giordano and Fritsch 1991). Thelight winds, coupled with the nearly saturated condi-tionally unstable environment, favored the developmentof slow-moving convective systems capable of produc-ing prolonged heavy rainfall.
Farther north, in the postfrontal region, the atmo-sphere was slightly more stable and exhibited a midleveldry layer (e.g., see the Brookhaven, NY, sounding; Fig.5c). Nevertheless, precipitable water values were stillover 40 mm, which is well above normal (Fig. 6). Thelow-level layer of easterlies was stronger and deeper atBrookhaven than at Sterling and Wallops Island, re-flecting the stronger postfrontal pressure gradient (Fig.
4) and greater potential for orographic lift in the post-frontal zone. Analysis of the 925-mb winds (Fig. 3c)revealed a postfrontal area of relatively fast-movinglow-level easterlies with an overwater fetch.
Localized flooding had already occurred from Vir-ginia northward through Pennsylvania and New Jerseyduring the afternoon of 26 June as slow-moving thun-derstorms passed through the region. A rash of severeweather also accompanied the passage of the cold frontin Pennsylvania and New Jersey, with numerous reportsof wind damage and several confirmed F0 tornadoes.Showers and thunderstorms continued immediately be-hind the front in the low-level moist ribbon flowingwestward from the Atlantic Ocean. South of the front,locally heavy showers and thunderstorms formed duringthe overnight hours in the tropical-like air mass overVirginia, West Virginia, and Maryland. These stormsexhibited a slow northward drift, allowing some areasto experience heavy rainfall on already saturatedground. For example, Cumberland, Maryland, received63 mm of rain in the 1-h period ending at 0100 UTC27 June.
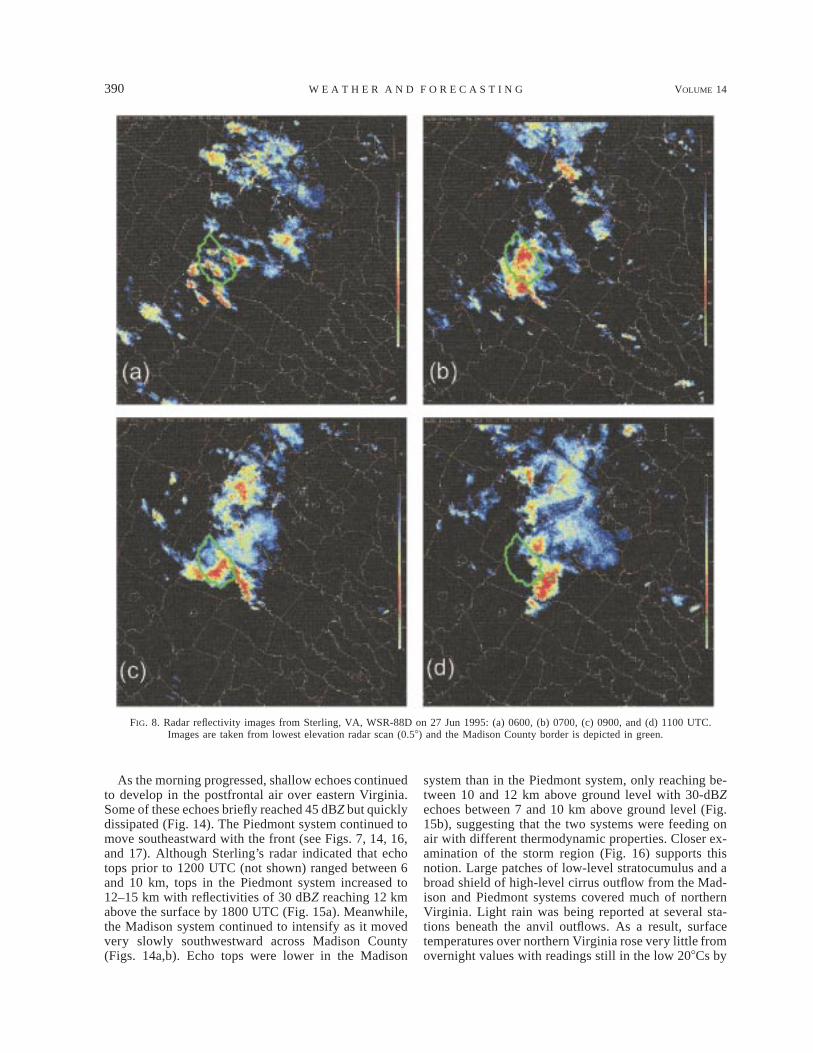
The high-pressure system over New England builtsouthward, pushing the cold front into northeastern Vir-ginia by 0600 UTC 27 June (Fig. 7a). Sterling, Virginia,radar indicated that a broken line of showers attendedthe front and that a convective system (hereafter termedthe Piedmont storm) initiated around 0700 UTC in theprefrontal air in Madison and Orange Counties, just eastof the Blue Ridge (Fig. 8). As evident from Figs. 1 and2, the Blue Ridge is the first significant orographic fea-ture west of the Piedmont plains and Madison Countyis near the midpoint of one of the tallest unbrokenstretches of the ridge. Because of Madison County’sgeographic position with respect to the Blue Ridge, itis situated in an area that should receive the maximumorographic forcing given an easterly wind component.Flooding was already occurring in Madison County by0815 UTC, prompting the NWS forecasters at Sterling,Virginia, to issue the day’s first flash flood warning forMadison County at 0833 UTC.
The front advanced steadily to the south and west,reaching extreme eastern Madison County around 1000UTC (not shown). Automated rain gauges and radarestimates indicated that over 75 mm of rain had alreadyfallen across the ridges by 1020 UTC. As the front over-took the Piedmont storm, the convection began movingsouthward with and along the frontal zone, leaving thecounty virtually rain free at 1100 UTC (Fig. 8d). Thiswould be a brief respite, however, as a new convectivesystem was forming just northeast of Madison Countyand was propagating southwestward into the county.This second system, hereafter referred to as the Madisonstorm, became the main flash-flood-producing convec-tive system.
b. Storm environmentThe position of the large upper-level longwave trough
changed very little overnight (0000–1200 UTC 27 June;
388 VOLUME 14W E A T H E R A N D F O R E C A S T I N G
FIG. 5. Soundings for 0000 UTC 27 Jun 1995: (a) Sterling, VA;(b) Wallops Island, VA; and (c) Brookhaven, NY. Listed in eachinsert are lifted index (LI), total totals (TT), lifting condensationlevel (LCL), convective condensation level (CCL), level of freeconvection (LFC), convective temperature (Tc), precipitable water(PPW), and CAPE. Bold dashed lines indicate the thermodynamicpath of a parcel lifted from the surface.
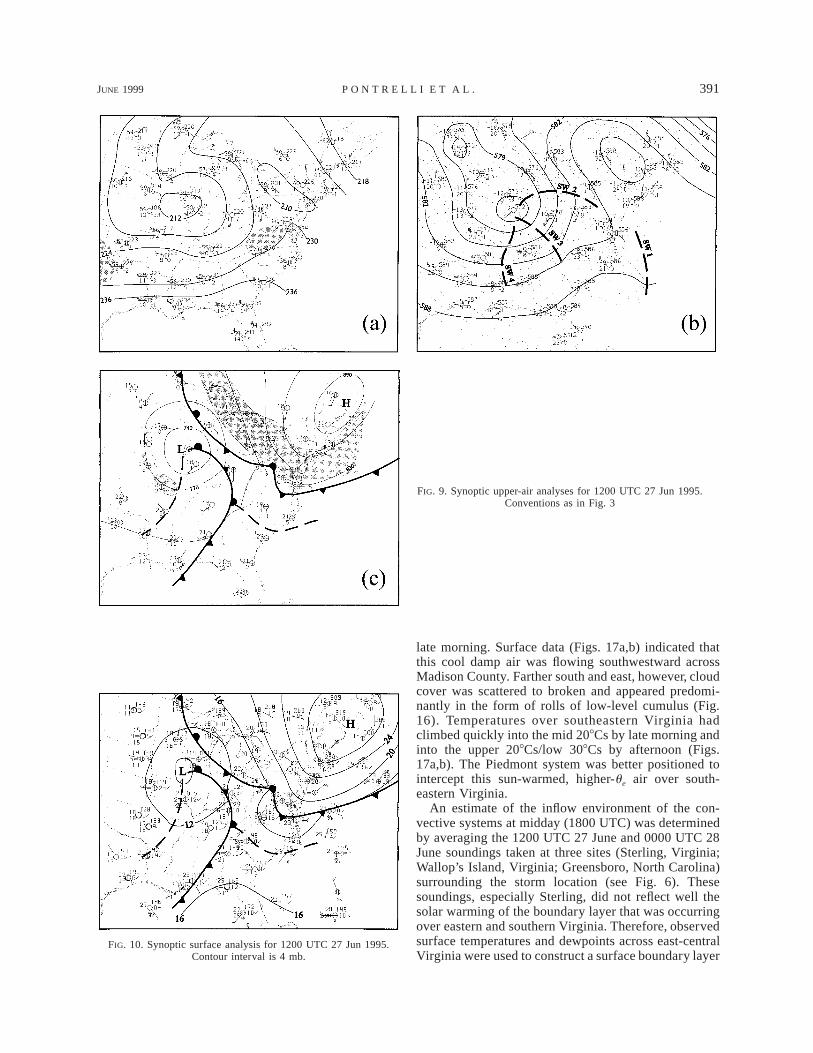
cf. Figs. 3 and 9). However, shortwave troughs contin-ued to rotate cyclonically around the main upper-levelsystem, with the axis of the third shortwave trough (SW-3) entering southwestern Virginia. The zone of maxi-mum difluence shifted directly over western Virginia(Fig. 9a) while the flow in the mid- and upper levelsremained weak, maintaining the threat for slow-movingthunderstorms.
The New England surface high-pressure system con-tinued to press southward, spreading cooler and drierair into New Jersey and Pennsylvania (Fig. 10). As aresult, stability increased (e.g., the lifted index at Brook-
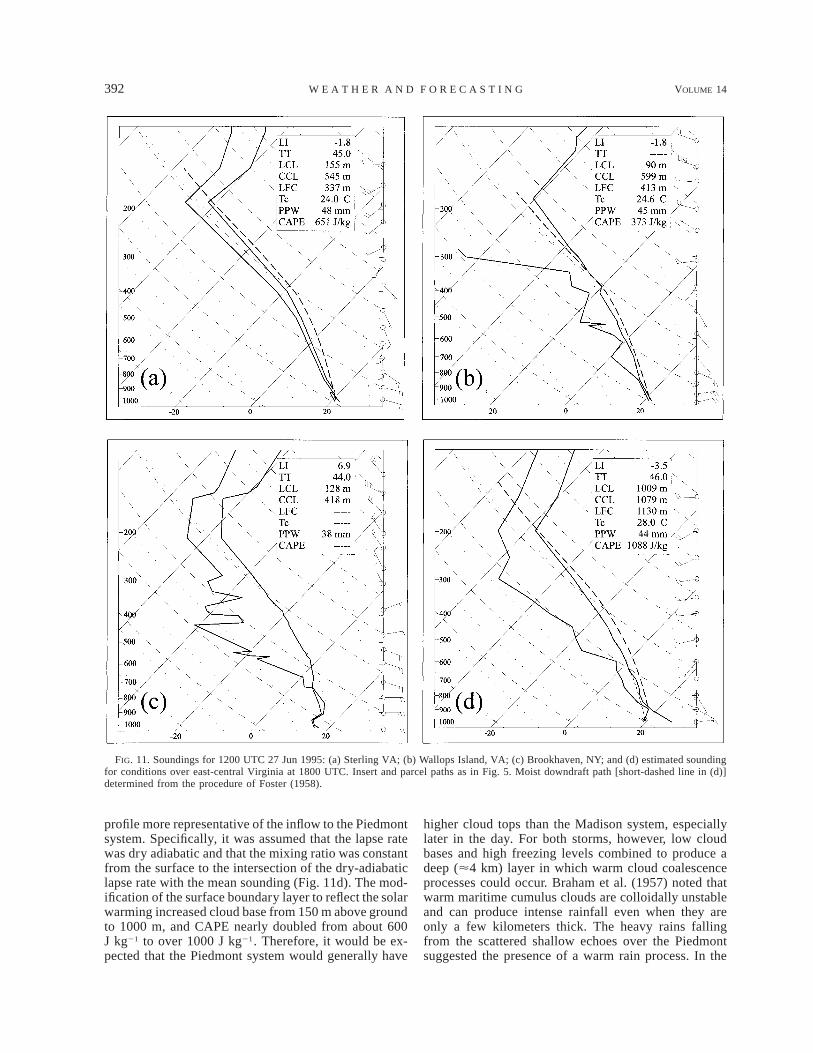
haven increased to 16.9; see Fig. 11c), which contrib-uted to a tendency for cold air damming (Forbes et al.1987; Fritsch et al. 1992) and effectively prohibited anysurface-based convective development from centralNew Jersey northward. Closer to the front, in northernVirginia, surface temperature and dewpoint values re-mained in the lower 208Cs, similar to conditions southof the front. The 1200 UTC radiosondes from both Ster-ling and Wallops Island (Figs. 11a,b) were representa-tive of the postfrontal environment and indicated thatvery little lifting was needed to initiate convection. Forexample, at Sterling, the lifting condensation level and

JUNE 1999 389P O N T R E L L I E T A L .
FIG. 6. Precipitable water (mm) for 0000 UTC 27 Jun 1995. Lo-cations of soundings used in the thermodynamic analyses are shownby bold dots. Asterisk indicates the location of the modified 1800UTC sounding (Fig. 11d later).
FIG. 7. Mesoscale analyses for 27 Jun 1995: (a) 0600 and (b) 1200 UTC. Convention for mesoscale boundaries is that used by Young andFritsch (1989). Radar echoes .30 dBZ shaded. Dotted square depicts the SWIIFT analysis domain for the Sterling, VA, WSR-88D data.
the level of free convection for a surface parcel wereonly 155 and 337 m above ground level, respectively.Moreover, with a convective temperature of 248C andsurface temperatures already in the low 208Cs, littleheating would be required to initiate deep convection.From 0000 to 1200 UTC, CAPE increased to about 600J kg21, the lifted index lowered slightly to 22, and theprecipitable water remained near 50 mm.
The soundings also indicate that the zone of relativelyfast-moving low-level easterlies evident in Fig. 3c werenow firmly entrenched in northern Virginia. Satellite-observed cloud motion vectors derived from the move-
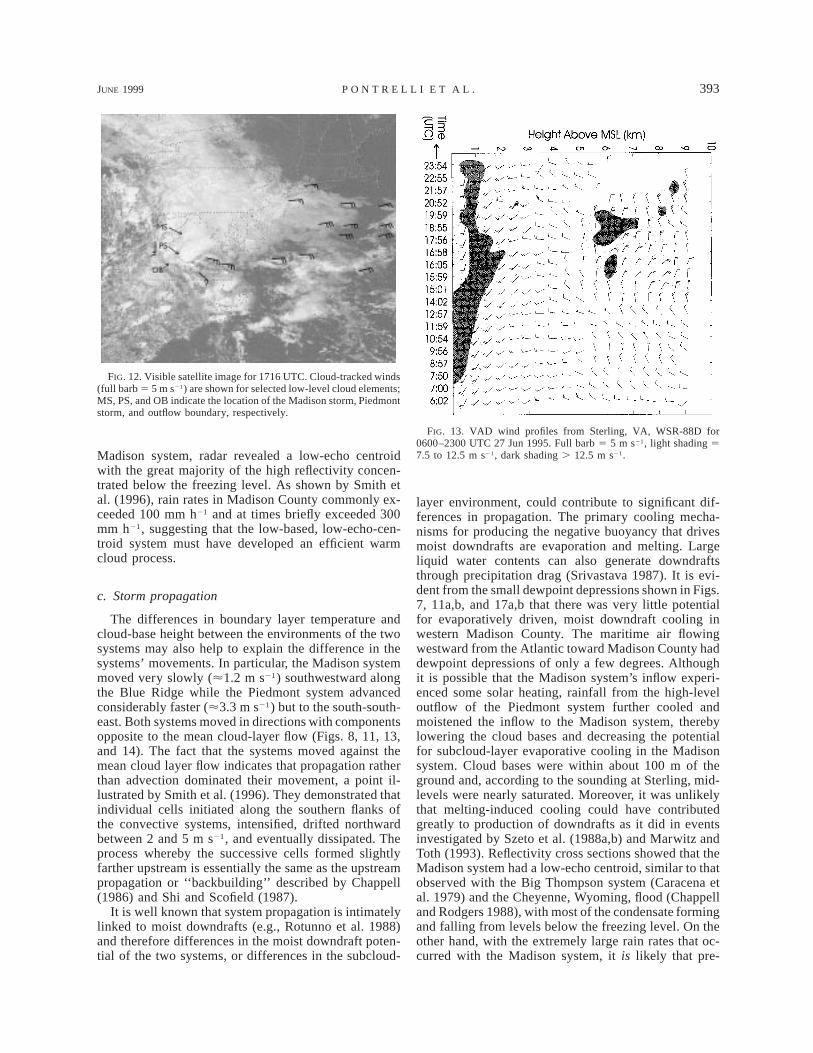
ment of low-level cumulus clouds reveal that the swathof high speed easterlies originated well out over theAtlantic Ocean and was advecting maritime air into thenorthern region (Fig. 12). Doppler radar velocity azi-muth display (VAD) wind profiles from Sterling (Fig.13) indicate that the depth and strength of the postfrontalhigh speed easterlies were increasing over northern Vir-ginia as the high-pressure system built southward.Moreover, the satellite and radar loops indicated that theeasterly flow was converging with a pronounced south-easterly flow over central Virginia. The combination ofhigh precipitable water, a deep layer of small CAPE,converging low-level inflow, and weak midlevel steer-ing currents was conducive to nonsevere, slow-movingthunderstorms with heavy rain.
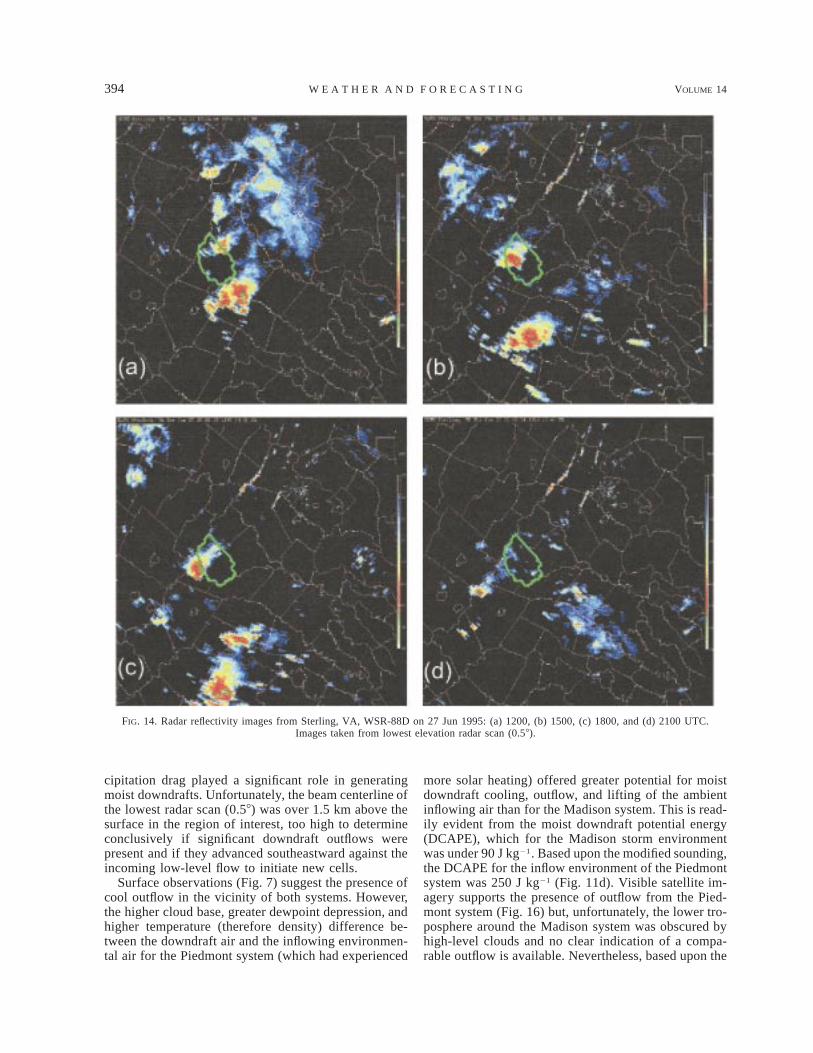
To explore further the convective potential, the Ster-ling sounding was introduced into the one-dimensionalcloud model developed by Anthes (1977). Without anymodification, the sounding did not generate a deep con-vective cloud. Analysis of the various physical terms inthe model indicate that deep cloud growth was preventedby the weak convective inhibition and by large waterloading [cloud droplets and rainwater; see Anthes(1977)] associated with the moist air mass. However, acloud over 10 km deep was able to form in the modelif the surface parcel was provided with an initial verticalvelocity of 2.0 m s21 or if the surface temperature waswarmed by 28C. These results suggest that, despite thesmall convective inhibition, deep clouds were possibleonly if either the surface air was heated or if some typeof feature such as a front, terrain, or an outflow bound-ary forced the air upward. The necessity for some typeof forcing mechanism for deep convection to developagreed with radar observations (Fig. 14), which showednumerous small echoes (typically about 2–4 km deep)in the postfrontal air over eastern Virginia but no deepmoist overturning.
390 VOLUME 14W E A T H E R A N D F O R E C A S T I N G
FIG. 8. Radar reflectivity images from Sterling, VA, WSR-88D on 27 Jun 1995: (a) 0600, (b) 0700, (c) 0900, and (d) 1100 UTC.Images are taken from lowest elevation radar scan (0.58) and the Madison County border is depicted in green.
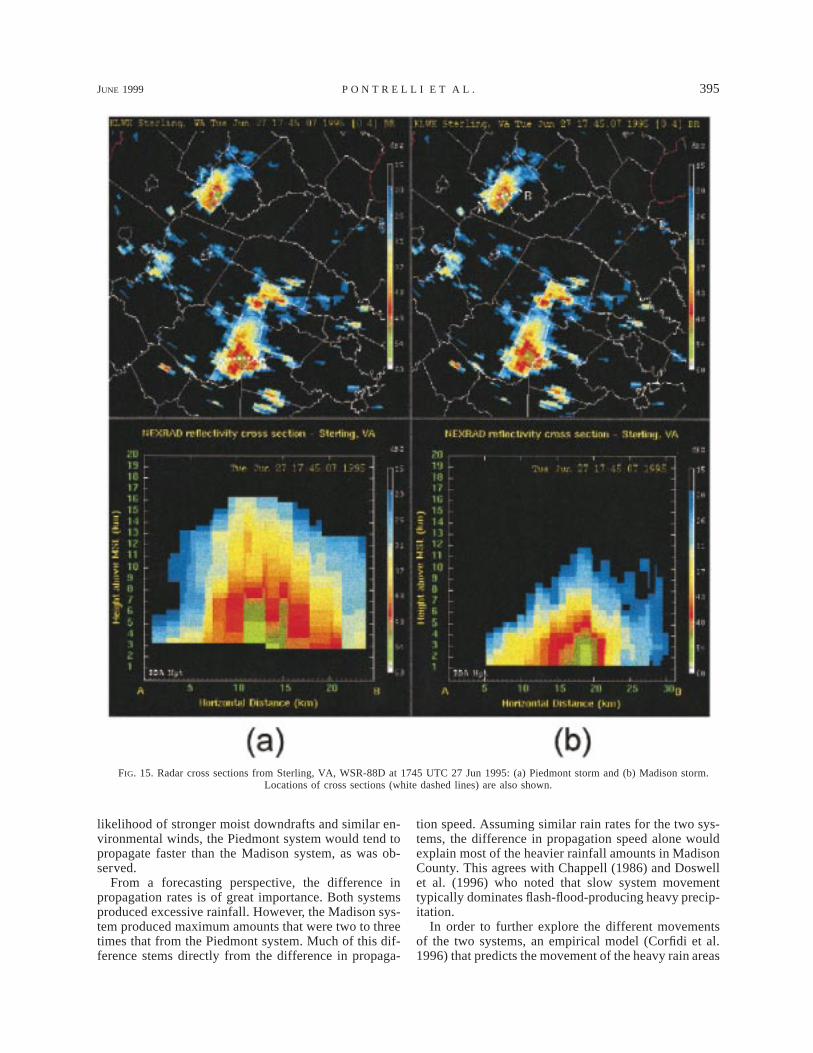
As the morning progressed, shallow echoes continuedto develop in the postfrontal air over eastern Virginia.Some of these echoes briefly reached 45 dBZ but quicklydissipated (Fig. 14). The Piedmont system continued tomove southeastward with the front (see Figs. 7, 14, 16,and 17). Although Sterling’s radar indicated that echotops prior to 1200 UTC (not shown) ranged between 6and 10 km, tops in the Piedmont system increased to12–15 km with reflectivities of 30 dBZ reaching 12 kmabove the surface by 1800 UTC (Fig. 15a). Meanwhile,the Madison system continued to intensify as it movedvery slowly southwestward across Madison County(Figs. 14a,b). Echo tops were lower in the Madison
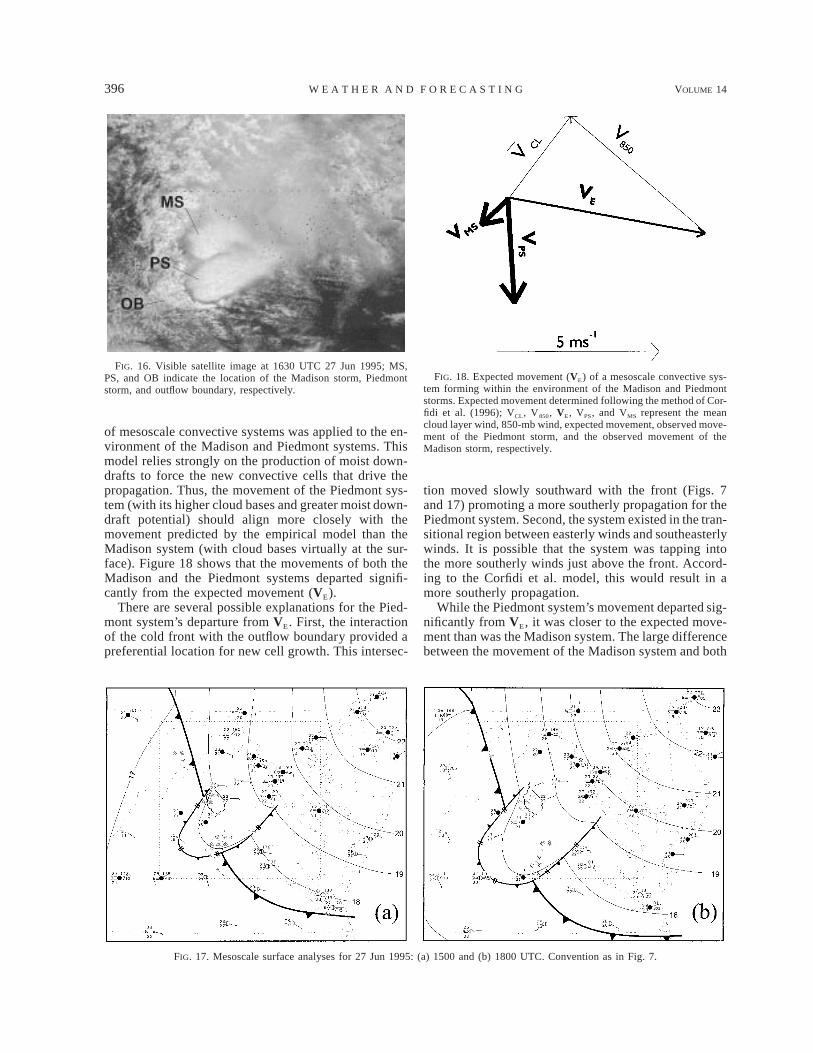
system than in the Piedmont system, only reaching be-tween 10 and 12 km above ground level with 30-dBZechoes between 7 and 10 km above ground level (Fig.15b), suggesting that the two systems were feeding onair with different thermodynamic properties. Closer ex-amination of the storm region (Fig. 16) supports thisnotion. Large patches of low-level stratocumulus and abroad shield of high-level cirrus outflow from the Mad-ison and Piedmont systems covered much of northernVirginia. Light rain was being reported at several sta-tions beneath the anvil outflows. As a result, surfacetemperatures over northern Virginia rose very little fromovernight values with readings still in the low 208Cs by
JUNE 1999 391P O N T R E L L I E T A L .
FIG. 9. Synoptic upper-air analyses for 1200 UTC 27 Jun 1995.Conventions as in Fig. 3
FIG. 10. Synoptic surface analysis for 1200 UTC 27 Jun 1995.Contour interval is 4 mb.
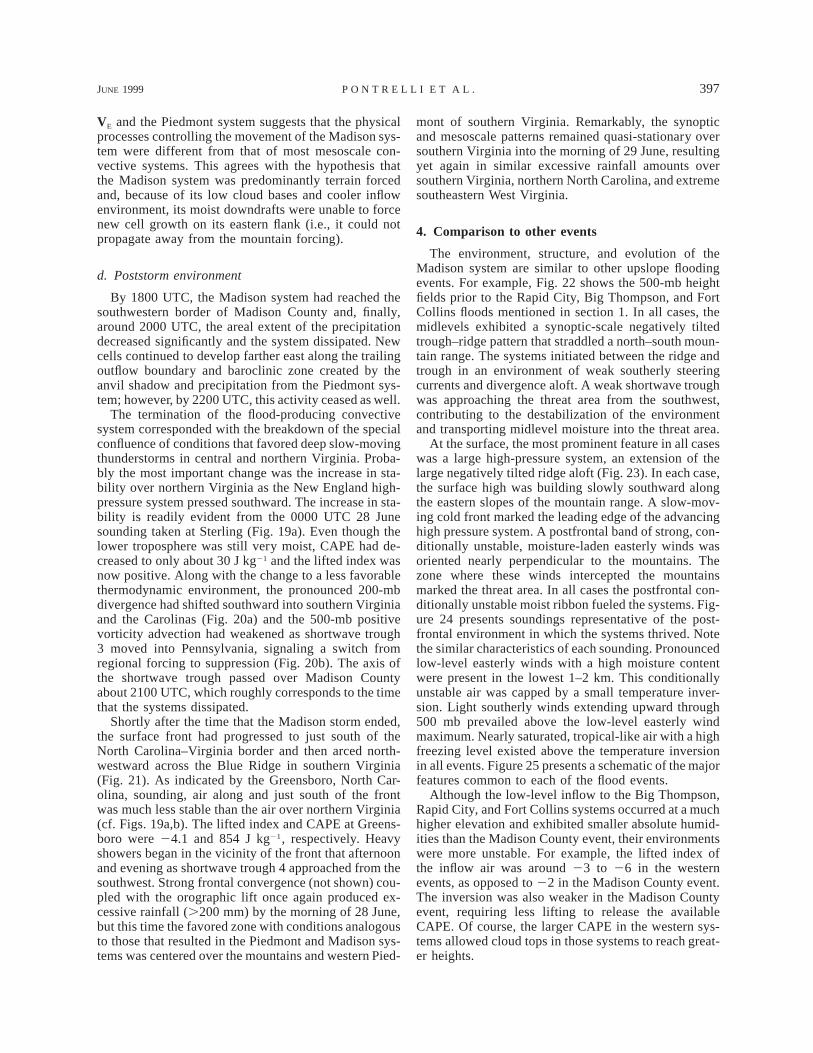
late morning. Surface data (Figs. 17a,b) indicated thatthis cool damp air was flowing southwestward acrossMadison County. Farther south and east, however, cloudcover was scattered to broken and appeared predomi-nantly in the form of rolls of low-level cumulus (Fig.16). Temperatures over southeastern Virginia hadclimbed quickly into the mid 208Cs by late morning andinto the upper 208Cs/low 308Cs by afternoon (Figs.17a,b). The Piedmont system was better positioned tointercept this sun-warmed, higher-ue air over south-eastern Virginia.
An estimate of the inflow environment of the con-vective systems at midday (1800 UTC) was determinedby averaging the 1200 UTC 27 June and 0000 UTC 28June soundings taken at three sites (Sterling, Virginia;Wallop’s Island, Virginia; Greensboro, North Carolina)surrounding the storm location (see Fig. 6). Thesesoundings, especially Sterling, did not reflect well thesolar warming of the boundary layer that was occurringover eastern and southern Virginia. Therefore, observedsurface temperatures and dewpoints across east-centralVirginia were used to construct a surface boundary layer
392 VOLUME 14W E A T H E R A N D F O R E C A S T I N G
FIG. 11. Soundings for 1200 UTC 27 Jun 1995: (a) Sterling VA; (b) Wallops Island, VA; (c) Brookhaven, NY; and (d) estimated soundingfor conditions over east-central Virginia at 1800 UTC. Insert and parcel paths as in Fig. 5. Moist downdraft path [short-dashed line in (d)]determined from the procedure of Foster (1958).
profile more representative of the inflow to the Piedmontsystem. Specifically, it was assumed that the lapse ratewas dry adiabatic and that the mixing ratio was constantfrom the surface to the intersection of the dry-adiabaticlapse rate with the mean sounding (Fig. 11d). The mod-ification of the surface boundary layer to reflect the solarwarming increased cloud base from 150 m above groundto 1000 m, and CAPE nearly doubled from about 600J kg21 to over 1000 J kg21. Therefore, it would be ex-pected that the Piedmont system would generally have
higher cloud tops than the Madison system, especiallylater in the day. For both storms, however, low cloudbases and high freezing levels combined to produce adeep (ø4 km) layer in which warm cloud coalescenceprocesses could occur. Braham et al. (1957) noted thatwarm maritime cumulus clouds are colloidally unstableand can produce intense rainfall even when they areonly a few kilometers thick. The heavy rains fallingfrom the scattered shallow echoes over the Piedmontsuggested the presence of a warm rain process. In the
JUNE 1999 393P O N T R E L L I E T A L .
FIG. 12. Visible satellite image for 1716 UTC. Cloud-tracked winds(full barb 5 5 m s21) are shown for selected low-level cloud elements;MS, PS, and OB indicate the location of the Madison storm, Piedmontstorm, and outflow boundary, respectively.
FIG. 13. VAD wind profiles from Sterling, VA, WSR-88D for0600–2300 UTC 27 Jun 1995. Full barb 5 5 m s21, light shading 57.5 to 12.5 m s21, dark shading . 12.5 m s21.Madison system, radar revealed a low-echo centroid
with the great majority of the high reflectivity concen-trated below the freezing level. As shown by Smith etal. (1996), rain rates in Madison County commonly ex-ceeded 100 mm h21 and at times briefly exceeded 300mm h21, suggesting that the low-based, low-echo-cen-troid system must have developed an efficient warmcloud process.
c. Storm propagation
The differences in boundary layer temperature andcloud-base height between the environments of the twosystems may also help to explain the difference in thesystems’ movements. In particular, the Madison systemmoved very slowly (ø1.2 m s21) southwestward alongthe Blue Ridge while the Piedmont system advancedconsiderably faster (ø3.3 m s21) but to the south-south-east. Both systems moved in directions with componentsopposite to the mean cloud-layer flow (Figs. 8, 11, 13,and 14). The fact that the systems moved against themean cloud layer flow indicates that propagation ratherthan advection dominated their movement, a point il-lustrated by Smith et al. (1996). They demonstrated thatindividual cells initiated along the southern flanks ofthe convective systems, intensified, drifted northwardbetween 2 and 5 m s21, and eventually dissipated. Theprocess whereby the successive cells formed slightlyfarther upstream is essentially the same as the upstreampropagation or ‘‘backbuilding’’ described by Chappell(1986) and Shi and Scofield (1987).
It is well known that system propagation is intimatelylinked to moist downdrafts (e.g., Rotunno et al. 1988)and therefore differences in the moist downdraft poten-tial of the two systems, or differences in the subcloud-
layer environment, could contribute to significant dif-ferences in propagation. The primary cooling mecha-nisms for producing the negative buoyancy that drivesmoist downdrafts are evaporation and melting. Largeliquid water contents can also generate downdraftsthrough precipitation drag (Srivastava 1987). It is evi-dent from the small dewpoint depressions shown in Figs.7, 11a,b, and 17a,b that there was very little potentialfor evaporatively driven, moist downdraft cooling inwestern Madison County. The maritime air flowingwestward from the Atlantic toward Madison County haddewpoint depressions of only a few degrees. Althoughit is possible that the Madison system’s inflow experi-enced some solar heating, rainfall from the high-leveloutflow of the Piedmont system further cooled andmoistened the inflow to the Madison system, therebylowering the cloud bases and decreasing the potentialfor subcloud-layer evaporative cooling in the Madisonsystem. Cloud bases were within about 100 m of theground and, according to the sounding at Sterling, mid-levels were nearly saturated. Moreover, it was unlikelythat melting-induced cooling could have contributedgreatly to production of downdrafts as it did in eventsinvestigated by Szeto et al. (1988a,b) and Marwitz andToth (1993). Reflectivity cross sections showed that theMadison system had a low-echo centroid, similar to thatobserved with the Big Thompson system (Caracena etal. 1979) and the Cheyenne, Wyoming, flood (Chappelland Rodgers 1988), with most of the condensate formingand falling from levels below the freezing level. On theother hand, with the extremely large rain rates that oc-curred with the Madison system, it is likely that pre-
394 VOLUME 14W E A T H E R A N D F O R E C A S T I N G
FIG. 14. Radar reflectivity images from Sterling, VA, WSR-88D on 27 Jun 1995: (a) 1200, (b) 1500, (c) 1800, and (d) 2100 UTC.Images taken from lowest elevation radar scan (0.58).
cipitation drag played a significant role in generatingmoist downdrafts. Unfortunately, the beam centerline ofthe lowest radar scan (0.58) was over 1.5 km above thesurface in the region of interest, too high to determineconclusively if significant downdraft outflows werepresent and if they advanced southeastward against theincoming low-level flow to initiate new cells.
Surface observations (Fig. 7) suggest the presence ofcool outflow in the vicinity of both systems. However,the higher cloud base, greater dewpoint depression, andhigher temperature (therefore density) difference be-tween the downdraft air and the inflowing environmen-tal air for the Piedmont system (which had experienced
more solar heating) offered greater potential for moistdowndraft cooling, outflow, and lifting of the ambientinflowing air than for the Madison system. This is read-ily evident from the moist downdraft potential energy(DCAPE), which for the Madison storm environmentwas under 90 J kg21. Based upon the modified sounding,the DCAPE for the inflow environment of the Piedmontsystem was 250 J kg21 (Fig. 11d). Visible satellite im-agery supports the presence of outflow from the Pied-mont system (Fig. 16) but, unfortunately, the lower tro-posphere around the Madison system was obscured byhigh-level clouds and no clear indication of a compa-rable outflow is available. Nevertheless, based upon the
JUNE 1999 395P O N T R E L L I E T A L .
FIG. 15. Radar cross sections from Sterling, VA, WSR-88D at 1745 UTC 27 Jun 1995: (a) Piedmont storm and (b) Madison storm.Locations of cross sections (white dashed lines) are also shown.
likelihood of stronger moist downdrafts and similar en-vironmental winds, the Piedmont system would tend topropagate faster than the Madison system, as was ob-served.
From a forecasting perspective, the difference inpropagation rates is of great importance. Both systemsproduced excessive rainfall. However, the Madison sys-tem produced maximum amounts that were two to threetimes that from the Piedmont system. Much of this dif-ference stems directly from the difference in propaga-
tion speed. Assuming similar rain rates for the two sys-tems, the difference in propagation speed alone wouldexplain most of the heavier rainfall amounts in MadisonCounty. This agrees with Chappell (1986) and Doswellet al. (1996) who noted that slow system movementtypically dominates flash-flood-producing heavy precip-itation.
In order to further explore the different movementsof the two systems, an empirical model (Corfidi et al.1996) that predicts the movement of the heavy rain areas
396 VOLUME 14W E A T H E R A N D F O R E C A S T I N G
FIG. 16. Visible satellite image at 1630 UTC 27 Jun 1995; MS,PS, and OB indicate the location of the Madison storm, Piedmontstorm, and outflow boundary, respectively.
FIG. 18. Expected movement (VE) of a mesoscale convective sys-tem forming within the environment of the Madison and Piedmontstorms. Expected movement determined following the method of Cor-fidi et al. (1996); VCL, V850, VE, VPS, and VMS represent the meancloud layer wind, 850-mb wind, expected movement, observed move-ment of the Piedmont storm, and the observed movement of theMadison storm, respectively.
FIG. 17. Mesoscale surface analyses for 27 Jun 1995: (a) 1500 and (b) 1800 UTC. Convention as in Fig. 7.
of mesoscale convective systems was applied to the en-vironment of the Madison and Piedmont systems. Thismodel relies strongly on the production of moist down-drafts to force the new convective cells that drive thepropagation. Thus, the movement of the Piedmont sys-tem (with its higher cloud bases and greater moist down-draft potential) should align more closely with themovement predicted by the empirical model than theMadison system (with cloud bases virtually at the sur-face). Figure 18 shows that the movements of both theMadison and the Piedmont systems departed signifi-cantly from the expected movement (VE).
There are several possible explanations for the Pied-mont system’s departure from VE. First, the interactionof the cold front with the outflow boundary provided apreferential location for new cell growth. This intersec-
tion moved slowly southward with the front (Figs. 7and 17) promoting a more southerly propagation for thePiedmont system. Second, the system existed in the tran-sitional region between easterly winds and southeasterlywinds. It is possible that the system was tapping intothe more southerly winds just above the front. Accord-ing to the Corfidi et al. model, this would result in amore southerly propagation.
While the Piedmont system’s movement departed sig-nificantly from VE, it was closer to the expected move-ment than was the Madison system. The large differencebetween the movement of the Madison system and both
JUNE 1999 397P O N T R E L L I E T A L .
VE and the Piedmont system suggests that the physicalprocesses controlling the movement of the Madison sys-tem were different from that of most mesoscale con-vective systems. This agrees with the hypothesis thatthe Madison system was predominantly terrain forcedand, because of its low cloud bases and cooler inflowenvironment, its moist downdrafts were unable to forcenew cell growth on its eastern flank (i.e., it could notpropagate away from the mountain forcing).
d. Poststorm environment
By 1800 UTC, the Madison system had reached thesouthwestern border of Madison County and, finally,around 2000 UTC, the areal extent of the precipitationdecreased significantly and the system dissipated. Newcells continued to develop farther east along the trailingoutflow boundary and baroclinic zone created by theanvil shadow and precipitation from the Piedmont sys-tem; however, by 2200 UTC, this activity ceased as well.
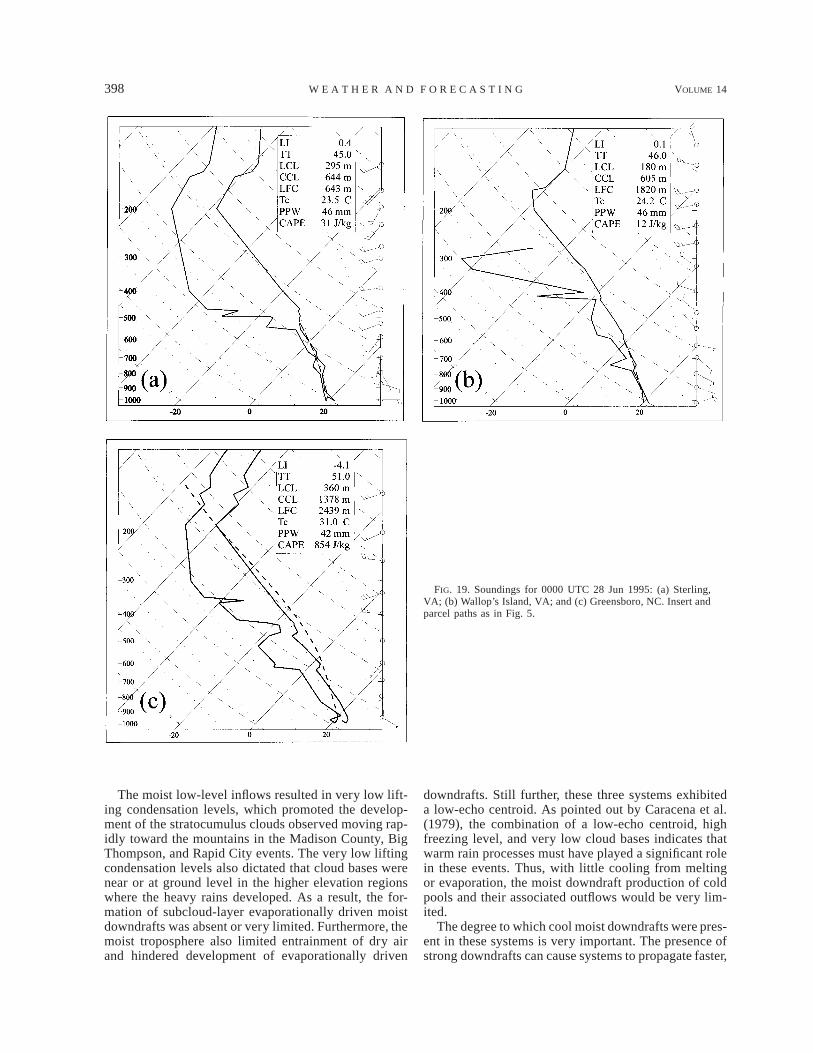
The termination of the flood-producing convectivesystem corresponded with the breakdown of the specialconfluence of conditions that favored deep slow-movingthunderstorms in central and northern Virginia. Proba-bly the most important change was the increase in sta-bility over northern Virginia as the New England high-pressure system pressed southward. The increase in sta-bility is readily evident from the 0000 UTC 28 Junesounding taken at Sterling (Fig. 19a). Even though thelower troposphere was still very moist, CAPE had de-creased to only about 30 J kg21 and the lifted index wasnow positive. Along with the change to a less favorablethermodynamic environment, the pronounced 200-mbdivergence had shifted southward into southern Virginiaand the Carolinas (Fig. 20a) and the 500-mb positivevorticity advection had weakened as shortwave trough3 moved into Pennsylvania, signaling a switch fromregional forcing to suppression (Fig. 20b). The axis ofthe shortwave trough passed over Madison Countyabout 2100 UTC, which roughly corresponds to the timethat the systems dissipated.
Shortly after the time that the Madison storm ended,the surface front had progressed to just south of theNorth Carolina–Virginia border and then arced north-westward across the Blue Ridge in southern Virginia(Fig. 21). As indicated by the Greensboro, North Car-olina, sounding, air along and just south of the frontwas much less stable than the air over northern Virginia(cf. Figs. 19a,b). The lifted index and CAPE at Greens-boro were 24.1 and 854 J kg21, respectively. Heavyshowers began in the vicinity of the front that afternoonand evening as shortwave trough 4 approached from thesouthwest. Strong frontal convergence (not shown) cou-pled with the orographic lift once again produced ex-cessive rainfall (.200 mm) by the morning of 28 June,but this time the favored zone with conditions analogousto those that resulted in the Piedmont and Madison sys-tems was centered over the mountains and western Pied-
mont of southern Virginia. Remarkably, the synopticand mesoscale patterns remained quasi-stationary oversouthern Virginia into the morning of 29 June, resultingyet again in similar excessive rainfall amounts oversouthern Virginia, northern North Carolina, and extremesoutheastern West Virginia.
4. Comparison to other events
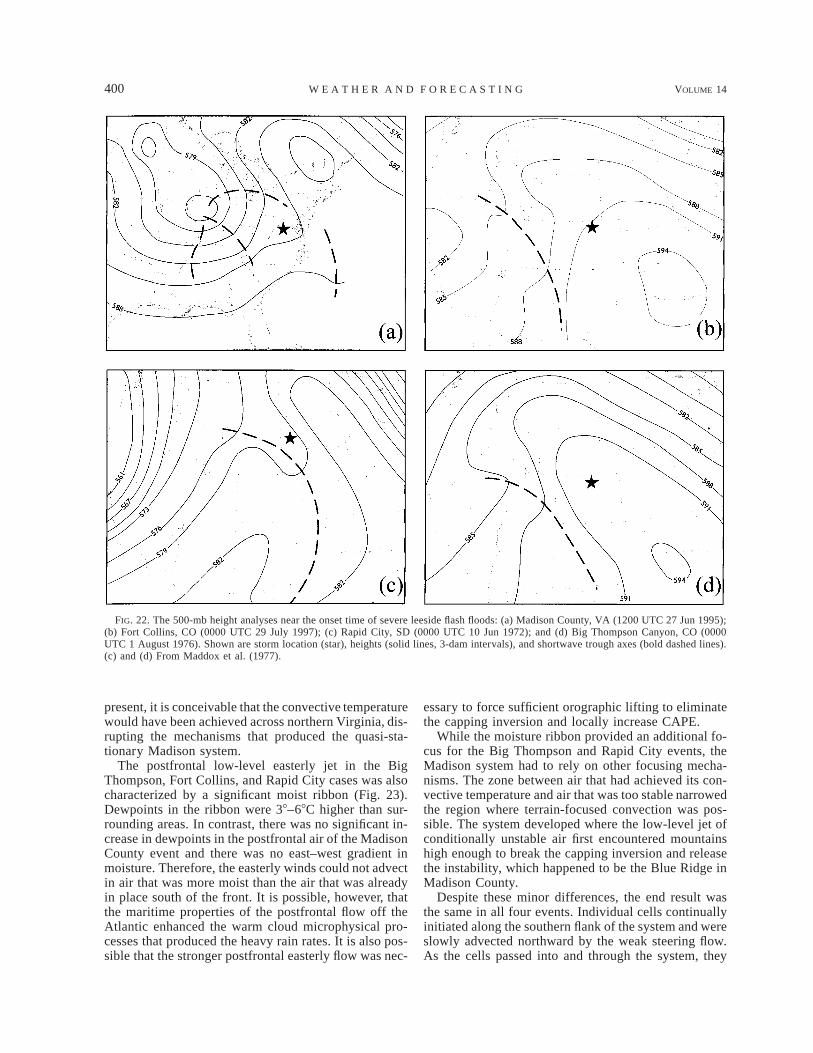
The environment, structure, and evolution of theMadison system are similar to other upslope floodingevents. For example, Fig. 22 shows the 500-mb heightfields prior to the Rapid City, Big Thompson, and FortCollins floods mentioned in section 1. In all cases, themidlevels exhibited a synoptic-scale negatively tiltedtrough–ridge pattern that straddled a north–south moun-tain range. The systems initiated between the ridge andtrough in an environment of weak southerly steeringcurrents and divergence aloft. A weak shortwave troughwas approaching the threat area from the southwest,contributing to the destabilization of the environmentand transporting midlevel moisture into the threat area.
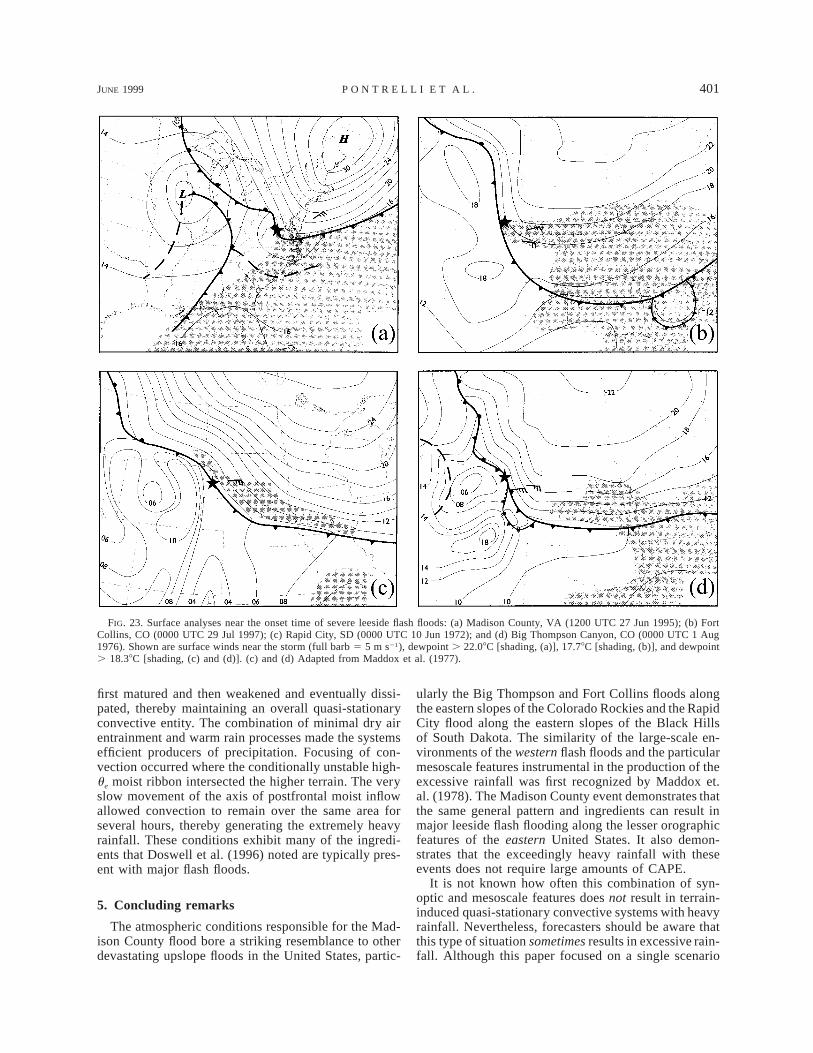
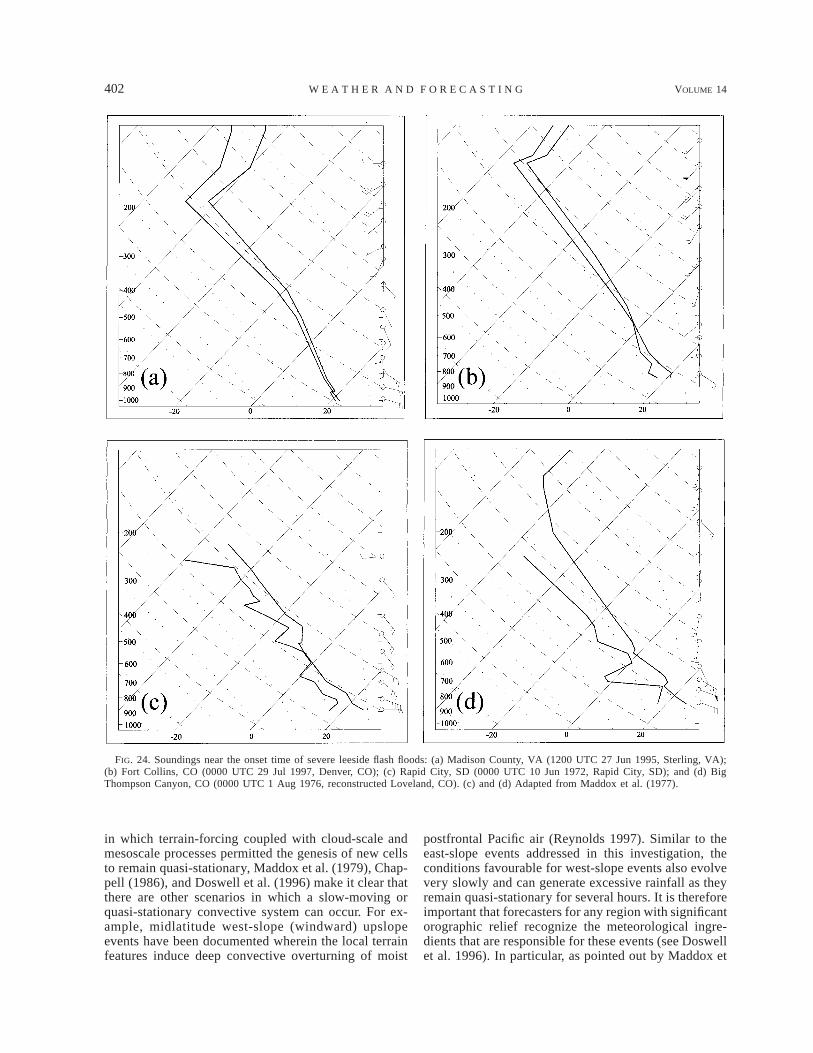
At the surface, the most prominent feature in all caseswas a large high-pressure system, an extension of thelarge negatively tilted ridge aloft (Fig. 23). In each case,the surface high was building slowly southward alongthe eastern slopes of the mountain range. A slow-mov-ing cold front marked the leading edge of the advancinghigh pressure system. A postfrontal band of strong, con-ditionally unstable, moisture-laden easterly winds wasoriented nearly perpendicular to the mountains. Thezone where these winds intercepted the mountainsmarked the threat area. In all cases the postfrontal con-ditionally unstable moist ribbon fueled the systems. Fig-ure 24 presents soundings representative of the post-frontal environment in which the systems thrived. Notethe similar characteristics of each sounding. Pronouncedlow-level easterly winds with a high moisture contentwere present in the lowest 1–2 km. This conditionallyunstable air was capped by a small temperature inver-sion. Light southerly winds extending upward through500 mb prevailed above the low-level easterly windmaximum. Nearly saturated, tropical-like air with a highfreezing level existed above the temperature inversionin all events. Figure 25 presents a schematic of the majorfeatures common to each of the flood events.
Although the low-level inflow to the Big Thompson,Rapid City, and Fort Collins systems occurred at a muchhigher elevation and exhibited smaller absolute humid-ities than the Madison County event, their environmentswere more unstable. For example, the lifted index ofthe inflow air was around 23 to 26 in the westernevents, as opposed to 22 in the Madison County event.The inversion was also weaker in the Madison Countyevent, requiring less lifting to release the availableCAPE. Of course, the larger CAPE in the western sys-tems allowed cloud tops in those systems to reach great-er heights.
398 VOLUME 14W E A T H E R A N D F O R E C A S T I N G
FIG. 19. Soundings for 0000 UTC 28 Jun 1995: (a) Sterling,VA; (b) Wallop’s Island, VA; and (c) Greensboro, NC. Insert andparcel paths as in Fig. 5.
The moist low-level inflows resulted in very low lift-ing condensation levels, which promoted the develop-ment of the stratocumulus clouds observed moving rap-idly toward the mountains in the Madison County, BigThompson, and Rapid City events. The very low liftingcondensation levels also dictated that cloud bases werenear or at ground level in the higher elevation regionswhere the heavy rains developed. As a result, the for-mation of subcloud-layer evaporationally driven moistdowndrafts was absent or very limited. Furthermore, themoist troposphere also limited entrainment of dry airand hindered development of evaporationally driven
downdrafts. Still further, these three systems exhibiteda low-echo centroid. As pointed out by Caracena et al.(1979), the combination of a low-echo centroid, highfreezing level, and very low cloud bases indicates thatwarm rain processes must have played a significant rolein these events. Thus, with little cooling from meltingor evaporation, the moist downdraft production of coldpools and their associated outflows would be very lim-ited.
The degree to which cool moist downdrafts were pres-ent in these systems is very important. The presence ofstrong downdrafts can cause systems to propagate faster,
JUNE 1999 399P O N T R E L L I E T A L .
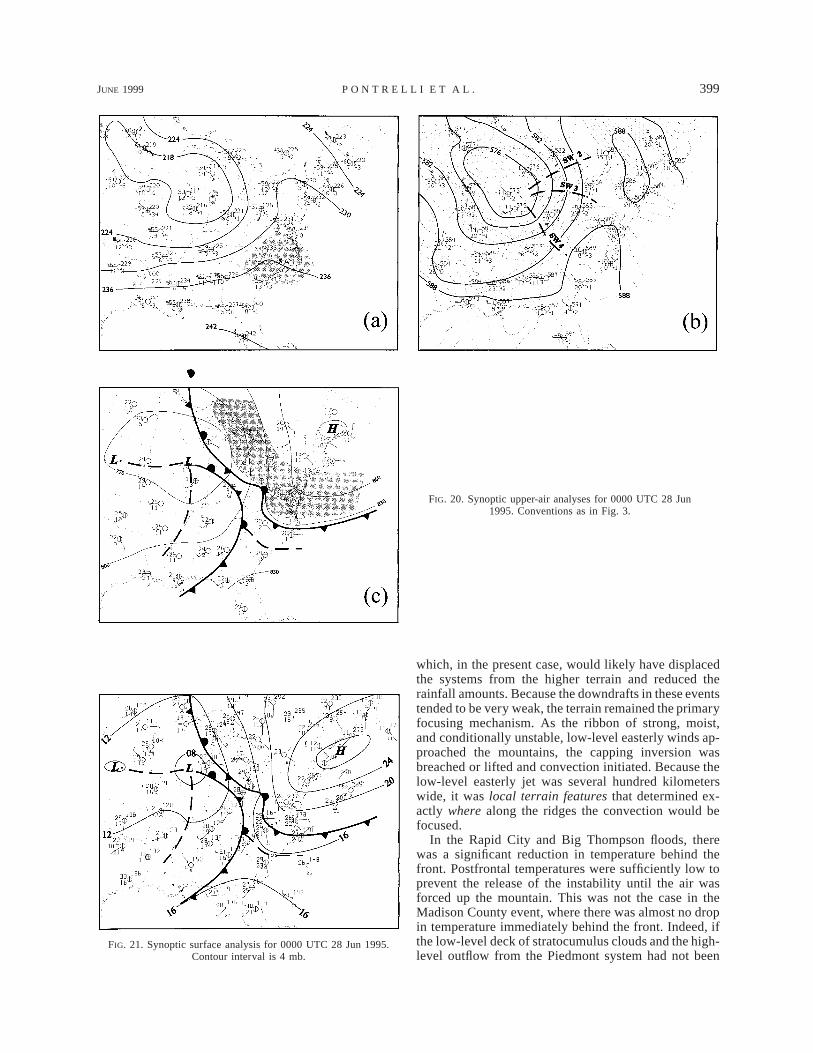
FIG. 20. Synoptic upper-air analyses for 0000 UTC 28 Jun1995. Conventions as in Fig. 3.
FIG. 21. Synoptic surface analysis for 0000 UTC 28 Jun 1995.Contour interval is 4 mb.
which, in the present case, would likely have displacedthe systems from the higher terrain and reduced therainfall amounts. Because the downdrafts in these eventstended to be very weak, the terrain remained the primaryfocusing mechanism. As the ribbon of strong, moist,and conditionally unstable, low-level easterly winds ap-proached the mountains, the capping inversion wasbreached or lifted and convection initiated. Because thelow-level easterly jet was several hundred kilometerswide, it was local terrain features that determined ex-actly where along the ridges the convection would befocused.
In the Rapid City and Big Thompson floods, therewas a significant reduction in temperature behind thefront. Postfrontal temperatures were sufficiently low toprevent the release of the instability until the air wasforced up the mountain. This was not the case in theMadison County event, where there was almost no dropin temperature immediately behind the front. Indeed, ifthe low-level deck of stratocumulus clouds and the high-level outflow from the Piedmont system had not been
400 VOLUME 14W E A T H E R A N D F O R E C A S T I N G
FIG. 22. The 500-mb height analyses near the onset time of severe leeside flash floods: (a) Madison County, VA (1200 UTC 27 Jun 1995);(b) Fort Collins, CO (0000 UTC 29 July 1997); (c) Rapid City, SD (0000 UTC 10 Jun 1972); and (d) Big Thompson Canyon, CO (0000UTC 1 August 1976). Shown are storm location (star), heights (solid lines, 3-dam intervals), and shortwave trough axes (bold dashed lines).(c) and (d) From Maddox et al. (1977).
present, it is conceivable that the convective temperaturewould have been achieved across northern Virginia, dis-rupting the mechanisms that produced the quasi-sta-tionary Madison system.
The postfrontal low-level easterly jet in the BigThompson, Fort Collins, and Rapid City cases was alsocharacterized by a significant moist ribbon (Fig. 23).Dewpoints in the ribbon were 38–68C higher than sur-rounding areas. In contrast, there was no significant in-crease in dewpoints in the postfrontal air of the MadisonCounty event and there was no east–west gradient inmoisture. Therefore, the easterly winds could not advectin air that was more moist than the air that was alreadyin place south of the front. It is possible, however, thatthe maritime properties of the postfrontal flow off theAtlantic enhanced the warm cloud microphysical pro-cesses that produced the heavy rain rates. It is also pos-sible that the stronger postfrontal easterly flow was nec-
essary to force sufficient orographic lifting to eliminatethe capping inversion and locally increase CAPE.
While the moisture ribbon provided an additional fo-cus for the Big Thompson and Rapid City events, theMadison system had to rely on other focusing mecha-nisms. The zone between air that had achieved its con-vective temperature and air that was too stable narrowedthe region where terrain-focused convection was pos-sible. The system developed where the low-level jet ofconditionally unstable air first encountered mountainshigh enough to break the capping inversion and releasethe instability, which happened to be the Blue Ridge inMadison County.
Despite these minor differences, the end result wasthe same in all four events. Individual cells continuallyinitiated along the southern flank of the system and wereslowly advected northward by the weak steering flow.As the cells passed into and through the system, they
JUNE 1999 401P O N T R E L L I E T A L .
FIG. 23. Surface analyses near the onset time of severe leeside flash floods: (a) Madison County, VA (1200 UTC 27 Jun 1995); (b) FortCollins, CO (0000 UTC 29 Jul 1997); (c) Rapid City, SD (0000 UTC 10 Jun 1972); and (d) Big Thompson Canyon, CO (0000 UTC 1 Aug1976). Shown are surface winds near the storm (full barb 5 5 m s21), dewpoint . 22.08C [shading, (a)], 17.78C [shading, (b)], and dewpoint. 18.38C [shading, (c) and (d)]. (c) and (d) Adapted from Maddox et al. (1977).
first matured and then weakened and eventually dissi-pated, thereby maintaining an overall quasi-stationaryconvective entity. The combination of minimal dry airentrainment and warm rain processes made the systemsefficient producers of precipitation. Focusing of con-vection occurred where the conditionally unstable high-ue moist ribbon intersected the higher terrain. The veryslow movement of the axis of postfrontal moist inflowallowed convection to remain over the same area forseveral hours, thereby generating the extremely heavyrainfall. These conditions exhibit many of the ingredi-ents that Doswell et al. (1996) noted are typically pres-ent with major flash floods.
5. Concluding remarks
The atmospheric conditions responsible for the Mad-ison County flood bore a striking resemblance to otherdevastating upslope floods in the United States, partic-
ularly the Big Thompson and Fort Collins floods alongthe eastern slopes of the Colorado Rockies and the RapidCity flood along the eastern slopes of the Black Hillsof South Dakota. The similarity of the large-scale en-vironments of the western flash floods and the particularmesoscale features instrumental in the production of theexcessive rainfall was first recognized by Maddox et.al. (1978). The Madison County event demonstrates thatthe same general pattern and ingredients can result inmajor leeside flash flooding along the lesser orographicfeatures of the eastern United States. It also demon-strates that the exceedingly heavy rainfall with theseevents does not require large amounts of CAPE.
It is not known how often this combination of syn-optic and mesoscale features does not result in terrain-induced quasi-stationary convective systems with heavyrainfall. Nevertheless, forecasters should be aware thatthis type of situation sometimes results in excessive rain-fall. Although this paper focused on a single scenario
402 VOLUME 14W E A T H E R A N D F O R E C A S T I N G
FIG. 24. Soundings near the onset time of severe leeside flash floods: (a) Madison County, VA (1200 UTC 27 Jun 1995, Sterling, VA);(b) Fort Collins, CO (0000 UTC 29 Jul 1997, Denver, CO); (c) Rapid City, SD (0000 UTC 10 Jun 1972, Rapid City, SD); and (d) BigThompson Canyon, CO (0000 UTC 1 Aug 1976, reconstructed Loveland, CO). (c) and (d) Adapted from Maddox et al. (1977).
in which terrain-forcing coupled with cloud-scale andmesoscale processes permitted the genesis of new cellsto remain quasi-stationary, Maddox et al. (1979), Chap-pell (1986), and Doswell et al. (1996) make it clear thatthere are other scenarios in which a slow-moving orquasi-stationary convective system can occur. For ex-ample, midlatitude west-slope (windward) upslopeevents have been documented wherein the local terrainfeatures induce deep convective overturning of moist
postfrontal Pacific air (Reynolds 1997). Similar to theeast-slope events addressed in this investigation, theconditions favourable for west-slope events also evolvevery slowly and can generate excessive rainfall as theyremain quasi-stationary for several hours. It is thereforeimportant that forecasters for any region with significantorographic relief recognize the meteorological ingre-dients that are responsible for these events (see Doswellet al. 1996). In particular, as pointed out by Maddox et
JUNE 1999 403P O N T R E L L I E T A L .
FIG. 25. Idealized schematic of the synoptic pattern associated withterrain-induced convective flooding events. Shown are the threat re-gion (star), 500-mb height pattern (dotted lines, Dh 5 3dam), moun-tains (shaded), and typical wind profile (full barb 5 5 m s21) abovethreat region.
al. (1979) and Schwartz et al. (1990), forecasters shouldbe wary any time a moist, conditionally unstable low-level jet is forced to rise over a stationary/slow-movingfront, boundary, or orographic feature, especially if thelow-level jet is expected to intersect the feature at thesame location for an extended period of time.
Acknowledgments. The authors would like to thankthe members of the mesoscale meteorology class thatcreated the embryo of this work: Ben Cash, Terry Faber,Perry Shafran, Sara Michelson, Paul Markowski, JohnRozbicki, and Dan Thomas. We also would like to thankMatt Pearce and Steve Hoffert for their help with theradar analysis; Dr. Gregory Forbes, Dr. George Young,Todd Miner, and Robert Hart for their help and insight;Barry Schwartz and Chuck Doswell for their construc-tive reviews of the manuscript; Rich Kane and the staffat the National Weather Service Office in Blacksburg,Virginia, for providing data, analyses, and many ex-cellent suggestions; Scott Pless and Sterling Software,Inc., for providing supplemental surface observations;the entire staff at the National Weather Service officesin Sterling, Virginia, and State College, Pennsylvania,for supporting and hosting the project; and Steve Zu-brick, Melody Hall, Barbara Watson, Barry Goldsmith,Richard Grumm, and James Smith for providing crucialdata, excellent advice, and wonderful enthusiasm. Fi-nally we would like to thank those who worked togetherto save hundreds of lives on 27 June 1995, includingthe Sterling National Weather Service Office, VirginiaDepartment of Emergency Services, United States Geo-logical Survey, United States Coast Guard, and every-one else involved with the rescue and cleanup efforts.This work was supported by the National Weather Ser-vice COMET program, UCAR Subaward 595-56772.
REFERENCES
Anthes, R. A., 1977: A cumulus parameterization scheme utilizing aone-dimensional cloud model. Mon. Wea. Rev., 105, 270–286.
Barnes, S. L., 1964: A technique for maximizing details in numericalweather map analysis. J. Appl. Meteor., 3, 396–409.
Braham, R. R., Jr., L. J. Battan, and H. R. Byers, 1957: Artificialnucleation of cumulus. Cloud and Weather Modification: AGroup of Field Experiments, Meteor. Monogr., No. 11, Amer.Meteor. Soc., 47–85.
Cahir, J. J., J. M. Norman, and D. A. Lowry, 1981: Use of a real-time computer graphics system in analysis and forecasting. Mon.Wea. Rev., 109, 485–500.
Caracena, F., R. A. Maddox. L. R. Hoxit, and C. F. Chappell, 1979:Mesoanalysis of the Big Thompson system. Mon. Wea. Rev.,107, 1–17.
Chappell, C. F., 1986: Quasi-stationary convective events. MesoscaleMeteorology and Forecasting, P. S. Ray, Ed., Amer. Meteor.Soc., 289–310., and D. M. Rodgers, 1988: Meteorological analysis of the Chey-enne, Wyoming flash flood and hailstorm of 1 August 1985.NOAA Tech. Rep. ERL 435-FSL 1, 51 pp.
Corfidi, S. F., J. H. Merritt, and J. M. Fritsch, 1996: Predicting themovement of mesoscale convective complexes. Wea. Forecast-ing, 11, 41–46.
Dennis, A. S., R. A. Schleusener, J. H. Hirsch, and A. Koscielski,1973: Meteorology of the Black Hills flood of 1972. Institute ofAtmospheric Sciences, Rep. 73-4, 41 pp. [Available from In-stitute of Atmospheric Sciences, South Dakota School of Minesand Technology, Rapid City, SD 57701.]
Doswell, C. A., H. E. Brooks, and R. A. Maddox, 1996: Flash floodforecasting: An ingredients-based methodology. Wea. Fore-casting, 11, 560–581.
Forbes, G. S., R. A. Anthes, and D. W. Thomson, 1987: Synopticand mesoscale aspects of an Appalachian ice storm associatedwith cold-air damming. Mon. Wea. Rev., 115, 564–591.
Foster, D. S., 1958: Thunderstorm gusts compared with computeddowndraft speeds. Mon. Wea. Rev., 86, 91–94.
Fritsch, J. M., J. Kapolka, and P. A. Hirschberg, 1992: The effectsof subcloud-layer diabatic processes on cold air damming. J.Atmos. Sci., 49, 49–70.
Giordano, L. A., and J. M. Fritsch, 1991: Strong tornadoes and flash-food producing rainstorms during the warm season in the mid-Atlantic region. Wea. Forecasting, 6, 437–455.
Hoxit, L. R., and Coauthors, 1978: Meteorological analysis of theJohnstown, Pennsylvania flash flood, 19–20 July 1977. NOAATech. Rep. ERL 401-APCL 43, 71 pp.
Maddox, R. A., F. Caracena, L. R. Hoxit, and C. F. Chappell, 1977:Meteorological aspects of the Big Thompson flash flood of 31July 1976. NOAA Tech. Rep. ERL 388-APCL 41, 83 pp., L. R. Hoxit, C. F. Chappell, and F. Caracena, 1978: Comparisonof meteorological aspects of the Big Thompson and Rapid Cityflash floods. Mon. Wea. Rev., 106, 375–389., C. F. Chappell, and L. R. Hoxit, 1979: Synoptic and meso-ascale aspects of flash flood events. Bull. Amer. Meteor. Soc., 60,115–123.
Marwitz, J., and J. Toth, 1993: The Front Range blizzard of 1990.Part I: Synoptic and mesoscale structure. Mon. Wea. Rev., 121,402–415.
National Oceanic and Atmospheric Administration, 1972: Black Hillsflood of June 9, 1972. Natural Disaster Survey Rep. 72-1, 20pp., 1995: Storm Data. Vol. 37, 200–215.
Pearce, M. L., and S. G. Hoffert, 1997: The SNAP Weather Infor-mation Integrated Forecast Tool (SWIIFT): Next generation soft-ware for research and operational meteorology. Preprints, 13thInt. Conf. on Interactive Information and Processing Systems(IIPS) for Meteorology, Oceanography, and Hydrology, LongBeach, CA, Amer. Meteor. Soc., 269–272.
Peppler, R. A., and P. J. Lamb, 1989: Tropospheric static stability

404 VOLUME 14W E A T H E R A N D F O R E C A S T I N G
and central North American growing season rainfall. Mon. Wea.Rev., 117, 1156–1180.
Peterson, W. A., and Coauthors, 1999: Mesoscale and radar obser-vations of the Fort Collins flash flood of 28 July 1997. Bull.Amer. Meteor. Soc., 80, 191–216.
Reynolds, D., 1997: Cool season mesoscale convective trains. West-ern Region Tech. Attachment 97-27, 5 pp.
Rotunno, R., J. B. Klemp, and M. L. Weisman, 1988: A theory forstrong, long-lived squall lines. J. Atmos. Sci., 45, 463–485.
Schwartz, B. E., C. F. Chappell, W. E. Togstad, and X.-P. Zhong,1990: The Minneapolis flash flood: Meteorological analysis andoperational response. Wea. Forecasting, 5, 3–21.
Shi, J., and R. A. Scofield, 1987: Satellite observed mesoscale con-vective system propagation characteristics and a 3–12 hourheavy precipitation forecast index. NOAA Tech. Memo. NESDIS20, Washington, DC, 43 pp.
Smith, J. A., M. L. Baeck., M. Steiner, and A. J. Miller, 1996: Cat-
astrophic rainfall from an upslope thunderstorm in the centralAppalachians: The Rapidan Storm of June 27, 1995. Water Re-sour. Res., 32, 3099–3113.
Srivastava, R. C., 1987: A model of intense downdrafts driven bythe melting and evaporation of precipitation. J. Atmos. Sci., 44,1752–1773.
Szeto, K. K., C. A. Lin, and R. E. Stewart, 1988a: Mesoscale cir-culations forced by melting snow. Part I: Basic simulations anddynamics. J. Atmos. Sci., 45, 1629–1641., R. E. Stewart, and C. A. Lin, 1988b: Mesoscale circulationsforced by melting snow. Part II: Application to meteorologicalfeatures. J. Atmos. Sci., 45, 1642–1650.
Thompson, H. J., 1972: The Black Hills flood. Weatherwise, 25, 162–167.
Young, G. S., and J. M. Fritsch, 1989: A proposal for general con-ventions in analyses of mesoscale boundaries. Bull. Amer. Me-teor. Soc., 70, 1412–1421.

![Flash Flood Risk Estimation of Wadi Yutum (Southern Jordan ...tional for flash flood risk assessment. El-Maghraby et al. [54] employed morphometric analysis to evaluate the flash flood](https://img.pdfslide.us/doc/110x75/5f63b02dfde39d7cc462b8d3/flash-flood-risk-estimation-of-wadi-yutum-southern-jordan-tional-for-flash.jpg)