Embed Size (px)
Citation preview
TECHNICAL UNIVERSITY OF DENMARK
Acoustic Technology
Ørsted●DTU
By Konstantinos Angelakis
The modern use of Ancient Greek and Roman Theatres from an acoustic point of view
Supervised by Jens Holger Rindel and Anders Christian Gade
October 2006
The modern use of Ancient Greek and Roman theaters from an acoustic point of view
2
Acknowledgements
At this point I would like to acknowledge the people who contributed in the
realization of this project;
• Jens Holger Rindel, for supervising the project
• Anders Christian Gade, for supervising the project, as well as providing
guiding and assistance during the measurements in Greece
• Paris Kerketsos, for all the help and support during the measurements, as well
as for modeling the theatres in ODEON
• Lazaridou Varvara (responsible for the performances at the Theatre of
Epidauros), for the smooth collaboration and assistance
• Kazolias Nikos (responsible engineer for both theatres), for the smooth
collaboration and assistance
• Jørgen Rasmussen, for the technical support whenever I needed it, in Denmark
• Periklis Mathiellis, for the technical support in Greece
• Torben Poulsen, for his advice on matters related to the listening tests
• My colleagues who voluntarily participated in the listening tests
• My colleagues Jorge Alvarez, Konca Saher and Shen Yi, for their advice and
friendship
• My housemates for supporting me through the whole process. Specifically,
Mihalis Kampanis for keeping me company during the long nights when I was
writing this report, as well as for proofreading the whole document!
• Candela Torres, for helping in the recordings.
This project is the epilogue of a two year effort in specializing in the world of
acoustics. Given the opportunity, apart from thanking the professors of the department
of Acoustic Technology at DTU, who guided me through the different paths of
acoustics, I would like to acknowledge my family for always providing a steady base
where I could psychologically rely on. I would like to express my gratitude to:
• My grandmother Eleftheria for her uncompromised love
• My sister Olga for sharing her philosophical worries with me, and my brother
Minas for his medical advice
• My mother Violetta for her support and affection
• My father Thanassis for purifying and strengthening my motivation to study
acoustics by being opposite to my decision, at least at the beginning.
The modern use of Ancient Greek and Roman theaters from an acoustic point of view
3
CONTENTS
1. INTRODUCTION AND OBJECTIVES.........................................................9
2. INFORMATION ON THE THEATRES UNDER INVESTIGATION...11
2.1. THE THEATRE OF EPIDAUROS .............................................................................................11 2.2. THE THEATRE OF ANCIENT EPIDAUROS.............................................................................12 2.3. CONTEMPORARY USE OF THE THEATRES ............................................................................12
3. DESCRIPTION OF ACOUSTIC MEASUREMENTS AND RECORDINGS .........................................................................................................14
3.1. ACOUSTIC MEASUREMENTS ................................................................................................14 3.1.1. Equipment ............................................................................................14
3.1.2. Calibration............................................................................................16
3.1.3. Procedure..............................................................................................17 3.2. RECORDINGS .......................................................................................................................21
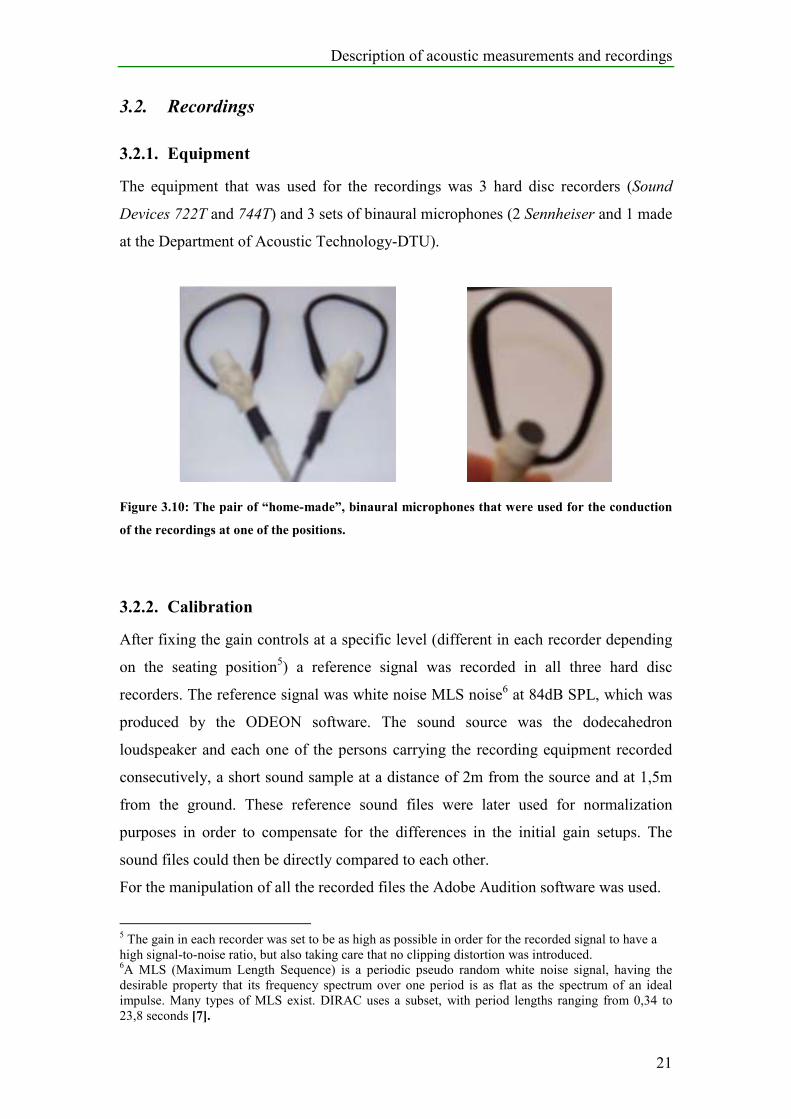
3.2.1. Equipment ............................................................................................21
3.2.2. Calibration............................................................................................21
3.2.3. Procedure..............................................................................................22
4. DESCRIPTION OF THE MODELS..............................................................25
5. MEASUREMENTS AND SIMULATIONS.................................................29
5.1. THEATRE OF EPIDAUROS-RESULTS AND DISCUSSION.........................................................29
5.1.1. Comparison of source positions ...........................................................29
5.1.2. Evaluation of the model .......................................................................35
5.1.3. Addition of a stage ...............................................................................44 5.2. THEATRE OF ANCIENT EPIDAUROS-RESULTS AND DISCUSSION ........................................48 5.2.1. Comparison of source positions ...........................................................48
5.2.2. Evaluation of the model .......................................................................53
5.2.3. Addition of a stage ...............................................................................62
6. LISTENING TESTS .........................................................................................66
6.1. RESULTS AND DISCUSSION ..................................................................................................67 6.1.1. Section 1...............................................................................................67
6.1.2. Section 2...............................................................................................73
7. CONCLUSIONS AND FUTURE WORK ....................................................76
7.1. CONCLUSIONS .....................................................................................................................76 7.2. FUTURE WORK .....................................................................................................................78
8. REFERENCES ...................................................................................................79
9. APPENDIX.........................................................................................................80
9.1. T30 VERSUS T20...................................................................................................................80 9.2. THE EFFECT OF THE GROUND ..............................................................................................83 9.3. THEATRE OF EPIDAUROS- GRID RESPONSE ODEON PLOTS..............................................90 9.4. THEATRE OF ANCIENT EPIDAUROS-GRID RESPONSE ODEON PLOTS ..............................95
10. GLOSSARY .................................................................................................100
The modern use of Ancient Greek and Roman theaters from an acoustic point of view
4
LIST OF FIGURES
Figure 2.1: A view of the Theatre of Epidauros......................................................................................11 Figure 2.2: A view of the Theatre of Ancient Epidauros ........................................................................12 Figure 3.1: The measuring equipment (except from the source and receiver). .......................................14 Figure 3.2: While recording an impulse response at the Theatre of Epidauros. The microphone and the
loudspeaker can be seen at the right and upper left of the photograph, respectively.....................15 Figure 3.3: The setup used for obtaining the data used for calibration of the measuring system. ..........16 Figure 3.4: Plan view of the Theatre of Epidauros. The receiver positions are marked with black dots.
The letters and numbers reveal the coding that was chosen for the receiver positions (eg. A5,
C15, U15 etc.). ..............................................................................................................................17 Figure 3.5: Plan view of the orchestra and skene of Theatre of Epidauros. The source positions are
marked with red dots. The letters and numbers reveal the coding that was chosen for the source
positions (S1, S2 and S3). .............................................................................................................18 Figure 3.6: Setting up source position S2. ..............................................................................................18 Figure 3.7: Plan view of the Theatre of Ancient Epidauros. The receiver positions are marked with
black dots. The letters and numbers reveal the coding that was chosen for the receiver positions
(eg. A2, C8, E14 etc.). ...................................................................................................................19 Figure 3.8: The wooden construction that was built on top of the orchestra and skene of the Theatre of
Ancient Epidauros during the time that the measurements were conducted. ................................20 Figure 3.9: Plan view of the orchestra and skene of Theatre of Epidauros. The source positions are
marked with red dots. The letters and numbers reveal the coding that was chosen for the source
positions (S1, S2 and S3). .............................................................................................................20 Figure 3.10: The pair of “home-made”, binaural microphones that were used for the conduction of the
recordings at one of the positions. .................................................................................................21 Figure 3.11: The red circles indicate the recording positions at the Theatre of Epidauros. ....................22 Figure 3.12: The red circles indicate the recording positions at the Theatre of Ancient Epidauros........23 Figure 3.13: Two very different stage setups at the Theatre of Epidauros; on the left picture the stage
setup for the “Persians” and on the right picture the stage setup for the “Suppliants”. .................24 Figure 4.1: The model of the Theatre of Epidauros. The surrounding box is totally absorbing, in an
effort to simulate “open-air” conditions. .......................................................................................25 Figure 4.2: The model of the Theatre of Ancient Epidauros...................................................................26 Figure 4.3: Rough sketches and the dimensions of the stage buildings. .................................................27 Figure 4.4: The model of the Theatre of Epidauros with the added stage building. ...............................28 Figure 4.5: The model of the Theatre of Ancient Epidauros with the added stage building. ..................28 Figure 5.1: Strength (G) versus distance at the Theatre of Epidauros. Each point represents the average
of the values at 500Hz and 1000Hz octave bands, for the specific source-receiver setup [8]. ......30 Figure 5.2: Early Decay Time (EDT) versus distance at the Theatre of Epidauros. Each point represents
the average of the values at 500Hz and 1000Hz octave bands, for the specific source-receiver
setup [8].........................................................................................................................................31 Figure 5.3: Speech Transmission Index (STI) versus distance at the Theatre of Epidauros. Each point
represents the average of the values at 500Hz and 1000Hz octave bands, for the specific source-
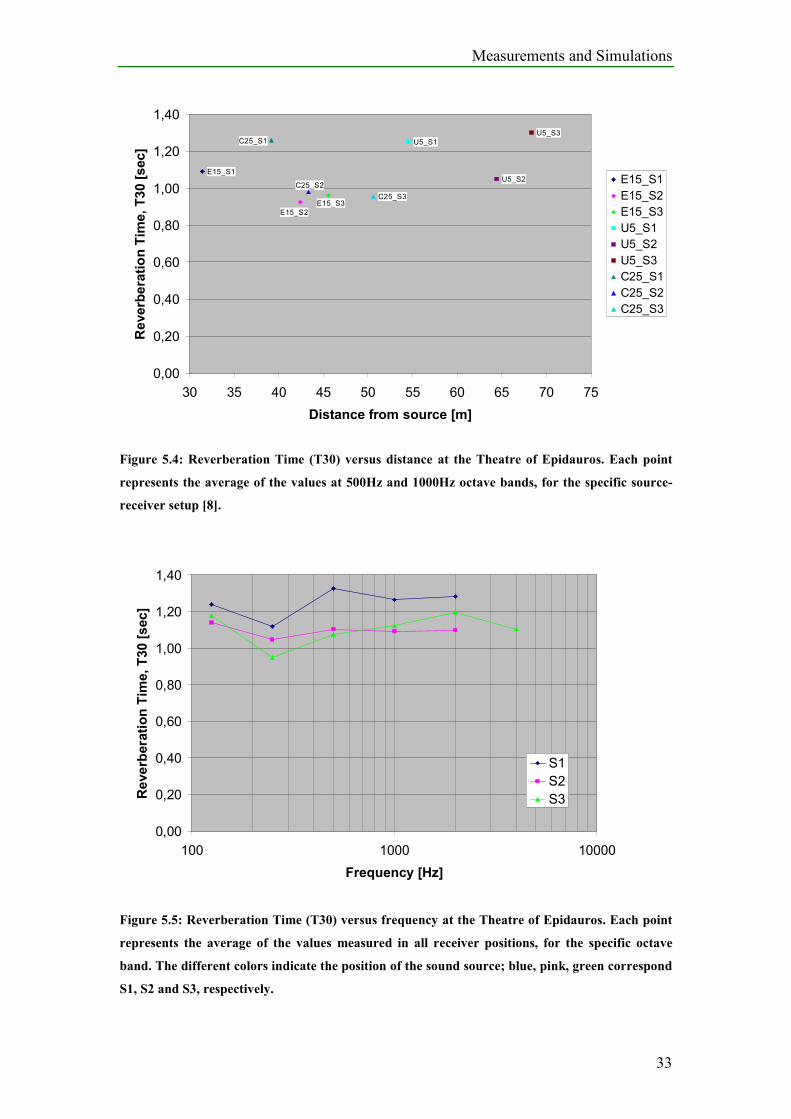
receiver setup [8]. ..........................................................................................................................32 Figure 5.4: Reverberation Time (T30) versus distance at the Theatre of Epidauros. Each point
represents the average of the values at 500Hz and 1000Hz octave bands, for the specific source-
receiver setup [8]. ..........................................................................................................................33 Figure 5.5: Reverberation Time (T30) versus frequency at the Theatre of Epidauros. Each point
represents the average of the values measured in all receiver positions, for the specific octave
band. The different colors indicate the position of the sound source; blue, pink, green correspond
S1, S2 and S3, respectively. ..........................................................................................................33 Figure 5.6: Reverberation Time (T30) versus frequency at the Theatre of Epidauros. The source is
positioned in the center of the orchestra. Each point represents the average of the values
measured in all receiver positions, for the specific octave band. The pink and blue line, indicate
the measured and simulated values, respectively. .........................................................................35 Figure 5.7: Strength (G) versus frequency for 3 different receiver positions at the Theatre of Epidauros.
The source is located in the center of the orchestra. The solid and dotted lines indicate measured
and simulated values, respectively. ...............................................................................................36 Figure 5.8: Reverberation Time (T30) versus distance at the Theatre of Epidauros. The source is
positioned in the center of the orchestra. Each point represents the average of the values at 500Hz
The modern use of Ancient Greek and Roman theaters from an acoustic point of view
5
and 1000Hz octave bands, for the specific receiver position [8]. The pink and blue dots indicate
the measured and simulated values, respectively. .........................................................................37 Figure 5.9: Strength (G) versus distance at the Theatre of Epidauros. The source is positioned in the
center of the orchestra. Each point represents the average of the values at 500Hz and 1000Hz
octave bands, for the specific receiver position [8]. The pink and blue dots indicate the measured
and simulated values, respectively. ...............................................................................................38 Figure 5.10: Early Decay Time (EDT) versus distance at the Theatre of Epidauros. The source is
positioned in the center of the orchestra. Each point represents the average of the values at 500Hz
and 1000Hz octave bands, for the specific receiver position [8]. The pink and blue dots indicate
the measured and simulated values, respectively. .........................................................................39 Figure 5.11: The simulated and integrated decay curves at 1000Hz produced by ODEON, for position
A25. ...............................................................................................................................................40 Figure 5.12: The simulated and integrated decay curves at 1000Hz produced by ODEON, for position
C25. ...............................................................................................................................................40 Figure 5.13: The direction of reflections responsible for the increase of the energy at 113msec at
position A25, according to ODEON..............................................................................................41 Figure 5.14: Clarity (C80) versus distance at the Theatre of Epidauros. The source is positioned in the
center of the orchestra. Each point represents the average of the values at 500Hz and 1000Hz
octave bands, for the specific receiver position [8]. The pink and blue dots indicate the measured
and simulated values, respectively. ...............................................................................................42 Figure 5.15: Speech Transmission Index (STI) versus distance at the Theatre of Epidauros. The source
is positioned in the center of the orchestra. Each point represents the average of the values at
500Hz and 1000Hz octave bands, for the specific receiver position [8]. The pink and blue dots
indicate the measured and simulated values, respectively.............................................................43 Figure 5.16: Reverberation Time (T30) versus distance at the Theatre of Epidauros. The source is
positioned in the center of the orchestra. Each point represents the average of the values at 500Hz
and 1000Hz octave bands, for the specific receiver position [8]. The pink and blue dots indicate
values obtained from the model of the theatre with and without stage, respectively. ...................44 Figure 5.17: Strength (G) versus distance at the Theatre of Epidauros. The source is positioned in the
center of the orchestra. Each point represents the average of the values at 500Hz and 1000Hz
octave bands, for the specific receiver position [8]. The pink and blue dots indicate values
obtained from the model of the theatre with and without stage, respectively. ..............................45 Figure 5.18: Early Decay Time (EDT) versus distance at the Theatre of Epidauros. The source is
positioned in the center of the orchestra. Each point represents the average of the values at 500Hz
and 1000Hz octave bands, for the specific receiver position [8]. The pink and blue dots indicate
values obtained from the model of the theatre with and without stage, respectively. ...................45 Figure 5.19: Clarity (C80) versus distance at the Theatre of Epidauros. The source is positioned in the
center of the orchestra. Each point represents the average of the values at 500Hz and 1000Hz
octave bands, for the specific receiver position [8]. The pink and blue dots indicate values
obtained from the model of the theatre with and without stage, respectively. ..............................46 Figure 5.20: Speech Transmission Index (STI) versus distance at the Theatre of Epidauros. The source
is positioned in the center of the orchestra. Each point represents the average of the values at
500Hz and 1000Hz octave bands, for the specific receiver position [8]. The pink and blue dots
indicate values obtained from the model of the theatre with and without stage, respectively.......46 Figure 5.21: Strength (G) versus distance at the Theatre of Ancient Epidauros. Each point represents
the average of the values at 500Hz and 1000Hz octave bands, for the specific source-receiver
setup [8].........................................................................................................................................48 Figure 5.22: Early Decay Time (EDT) versus distance at the Theatre of Ancient Epidauros. Each point
represents the average of the values at 500Hz and 1000Hz octave bands, for the specific source-
receiver setup [8]. ..........................................................................................................................49 Figure 5.23: Speech Transmission Index (STI) versus distance at the Theatre of Ancient Epidauros.
Each point represents the average of the values at 500Hz and 1000Hz octave bands, for the
specific source-receiver setup [8]. .................................................................................................50 Figure 5.24: Reverberation Time (T30) versus distance at the Theatre of Epidauros. Each point
represents the average of the values at 500Hz and 1000Hz octave bands, for the specific source-
receiver setup [8]. ..........................................................................................................................51 Figure 5.25: Reverberation Time (T30) versus frequency at the Theatre of Ancient Epidauros. Each
point represents the average of the values measured in all receiver positions, for the specific
octave band. The different colors indicate the position of the sound source; blue, pink, green
correspond S1, S2 and S3, respectively.........................................................................................51

The modern use of Ancient Greek and Roman theaters from an acoustic point of view
6
Figure 5.26: Reverberation Time (T30) versus frequency at the Theatre of Ancient Epidauros. The
source is positioned in the center of the orchestra. Each point represents the average of the values
measured in all receiver positions, for the specific octave band. The pink and blue line, indicate
the measured and simulated values, respectively. .........................................................................53 Figure 5.27: Strength (G) versus frequency at the Theatre of Ancient Epidauros. The source is
positioned in the center of the orchestra. The solid and dotted lines indicate the measured and
simulated values, respectively. ......................................................................................................54 Figure 5.28: Reverberation Time (T30) versus distance at the Theatre of Ancient Epidauros. The source
is positioned in the center of the orchestra. Each point represents the average of the values at
500Hz and 1000Hz octave bands, for the specific receiver position [8]. The pink and blue dots
indicate the measured and simulated values, respectively.............................................................55 Figure 5.29: Strength (G) versus distance at the Theatre of Ancient Epidauros. The source is positioned
in the center of the orchestra. Each point represents the average of the values at 500Hz and
1000Hz octave bands, for the specific receiver position [8]. The pink and blue dots indicate the
measured and simulated values, respectively. ...............................................................................56 Figure 5.30: Early Decay Time (EDT) versus distance at the Theatre of Ancient Epidauros. The source
is positioned in the center of the orchestra. Each point represents the average of the values at
500Hz and 1000Hz octave bands, for the specific receiver position [8]. The pink and blue dots
indicate the measured and simulated values, respectively.............................................................56 Figure 5.31: Early Decay Time (EDT) versus the number of the kerkida at the Theatre of Ancient
Epidauros (1 to 5 corresponds from A to E respectively). The source is positioned in the center of
the orchestra. Each point represents the average of the values at 500Hz and 1000Hz octave bands,
for the specific receiver position [8]. All points indicate measured values. ..................................57 Figure 5.32: View of the Theatre of Ancient Epidauros at the time of the measurements......................58 Figure 5.33: Early Decay Time (EDT) versus the number of the kerkida at the Theatre of Ancient
Epidauros (1 to 5 corresponds from A to E respectively). The source is positioned in the center of
the orchestra. Each point represents the average of the values at 500Hz and 1000Hz octave bands,
for the specific receiver position [8]. The solid and dotted lines indicate the measured and
simulated values, respectively. ......................................................................................................58 Figure 5.34: Clarity (C80) versus distance at the Theatre of Ancient Epidauros. The source is
positioned in the center of the orchestra. Each point represents the average of the values at 500Hz
and 1000Hz octave bands, for the specific receiver position [8]. The pink and blue dots indicate
the measured and simulated values, respectively. .........................................................................59 Figure 5.35: Clarity (C80) versus the number of the kerkida at the Theatre of Ancient Epidauros (1 to 5
corresponds from A to E respectively). The source is positioned in the center of the orchestra.
Each point represents the average of the values at 500Hz and 1000Hz octave bands, for the
specific receiver position [8]. The solid and dotted lines indicate the measured and simulated
values, respectively. ......................................................................................................................60 Figure 5.36: Speech Transmission Index (STI) versus distance at the Theatre of Ancient Epidauros. The
source is positioned in the center of the orchestra. Each point represents the average of the values
at 500Hz and 1000Hz octave bands, for the specific receiver position [8]. The pink and blue dots
indicate the measured and simulated values, respectively.............................................................61 Figure 5.37: Reverberation Time (T30) versus distance at the Theatre of Ancient Epidauros. The source
is positioned in the center of the orchestra. Each point represents the average of the values at
500Hz and 1000Hz octave bands, for the specific receiver position [8]. The pink and blue dots
indicate values obtained from the model of the theatre with and without stage, respectively.......62 Figure 5.38: Strength (G) versus distance at the Theatre of Ancient Epidauros. The source is positioned
in the center of the orchestra. Each point represents the average of the values at 500Hz and
1000Hz octave bands, for the specific receiver position [8]. The pink and blue dots indicate
values obtained from the model of the theatre with and without stage, respectively. ...................63 Figure 5.39: Early Decay Time (EDT) versus distance at the Theatre of Ancient Epidauros. The source
is positioned in the center of the orchestra. Each point represents the average of the values at
500Hz and 1000Hz octave bands, for the specific receiver position [8]. The pink and blue dots
indicate values obtained from the model of the theatre with and without stage, respectively.......63 Figure 5.40: Clarity (C80) versus distance at the Theatre of Ancient Epidauros. The source is
positioned in the center of the orchestra. Each point represents the average of the values at 500Hz
and 1000Hz octave bands, for the specific receiver position [8]. The pink and blue dots indicate
values obtained from the model of the theatre with and without stage, respectively. ...................64 Figure 5.41: Speech Transmission Index (STI) versus distance at the Theatre of Ancient Epidauros. The
source is positioned in the center of the orchestra. Each point represents the average of the values
The modern use of Ancient Greek and Roman theaters from an acoustic point of view
7
at 500Hz and 1000Hz octave bands, for the specific receiver position [8]. The pink and blue dots
indicate values obtained from the model of the theatre with and without stage, respectively.......64 Figure 6.1: The recording positions at the Theatre of Epidauros. The red characters indicate the code
letters of the positions chosen for the purpose of the listening tests. The black characters indicate
the exact position; the letter corresponds to the kerkida and the number to the row. The recording
position was chosen to be approximately in the middle of the respective row..............................67 Figure 6.2: The percentage of the test subjects versus their answers. The performance was not
amplified and it took place at the Theatre of Epidauros. ...............................................................68 Figure 6.3: The percentage of the test subjects versus their answers. The performance was amplified
and it took place at the Theatre of Epidauros. ...............................................................................69 Figure 6.4: The recording positions at the Theatre of Epidauros. The red characters indicate the code
letters of the positions chosen for the purpose of the listening tests. The black characters indicate
the exact position; the letter corresponds to the kerkida and the number to the row. The recording
position was chosen to be approximately in the middle of the respective row..............................70 Figure 6.5: The percentage of the test subjects versus their answers. The performance was not
amplified and it took place at the Theatre of Ancient Epidauros. .................................................71 Figure 6.6: The percentage of the test subjects versus their answers. The performance was amplified
and it took place at the Theatre of Ancient Epidauros...................................................................71 Figure 9.1: Reverberation Time versus distance at the Theatre of Epidauros. The source is positioned in
the center of the orchestra. Each point represents the average of the values at 500Hz and 1000Hz
octave bands, for the specific receiver position [8]. The pink and blue line, indicate the measured
values for T20 and T30, respectively. ...........................................................................................80 Figure 9.2: Reverberation Time versus frequency at the Theatre of Epidauros. The source is positioned
in the center of the orchestra. Each point represents the average of the values measured in all
receiver positions, for the specific octave band. The pink and blue line, indicate the measured
values for T20 and T30, respectively. ...........................................................................................81 Figure 9.3: Reverberation Time versus distance at the Theatre of Ancient Epidauros. The source is
positioned in the center of the orchestra. Each point represents the average of the values at 500Hz
and 1000Hz octave bands, for the specific receiver position [8]. The pink and blue line, indicate
the measured values for T20 and T30, respectively. .....................................................................81 Figure 9.4: Reverberation Time versus frequency at the Theatre of Ancient Epidauros. The source is
positioned in the center of the orchestra. Each point represents the average of the values
measured in all receiver positions, for the specific octave band. The pink and blue line, indicate
the measured values for T20 and T30, respectively. .....................................................................82 Figure 9.5: The receiver (red dot on black line) receives both the direct sound and the reflection coming
from the orchestra floor. The black dot on the solid black line and the black dot on the dashed
line indicate the real and the image source, respectively. The notations HS, HR and D stand for
“Height of Source from the ground”, “Height of Receiver from the ground” and “Horizontal
Distance between Source and Receiver”, respectively. .................................................................84 Figure 9.6: The effect of the interference of the direct sound and the reflection coming from the floor of
the orchestra, on the sound pressure measured at the 5th row of the Theatre of Epidauros. The
floor of the orchestra is considered totally reflecting. ...................................................................85 Figure 9.7: The effect of the interference of the direct sound and the reflection coming from the floor of
the orchestra, on the sound pressure measured at the 15th row of the Theatre of Epidauros. The
floor of the orchestra is considered totally reflecting. ...................................................................86 Figure 9.8: The effect of the interference of the direct sound and the reflection coming from the floor of
the orchestra, on the sound pressure measured at the 25th row of the Theatre of Epidauros. The
floor of the orchestra is considered totally reflecting. ...................................................................86 Figure 9.9: The effect of the interference of the direct sound and the reflection coming from the floor of
the orchestra, on the sound pressure measured at the 28th row of the Theatre of Epidauros. The
floor of the orchestra is considered totally reflecting. ...................................................................87 Figure 9.10: The effect of the interference of the direct sound and the reflection coming from the floor
of the orchestra, on the sound pressure measured at the 38th row of the Theatre of Epidauros. The
floor of the orchestra is considered totally reflecting. ...................................................................87 Figure 9.11: The effect of the interference of the direct sound and the reflection coming from the floor
of the orchestra, on the sound pressure measured at the 2nd row of the Theatre of Ancient
Epidauros. The floor of the orchestra is considered totally reflecting. ..........................................88 Figure 9.12: The effect of the interference of the direct sound and the reflection coming from the floor
of the orchestra, on the sound pressure measured at the 8th row of the Theatre of Ancient
Epidauros. The floor of the orchestra is considered totally reflecting. ..........................................89
The modern use of Ancient Greek and Roman theaters from an acoustic point of view
8
Figure 9.13: The effect of the interference of the direct sound and the reflection coming from the floor
of the orchestra, on the sound pressure measured at the 14th row of the Theatre of Ancient
Epidauros. The floor of the orchestra is considered totally reflecting. ..........................................89 Figure 9.14: Early Decay Time (EDT) at 1000Hz at the Theatre of Epidauros (without stage). ............90 Figure 9.15: Early Decay Time (EDT) at 1000Hz at the Theatre of Epidauros (with stage). .................90 Figure 9.16: Reverberation Time (T30) at 1000Hz at the Theatre of Epidauros (without stage). ..........91 Figure 9.17: Reverberation Time (T30) at 1000Hz at the Theatre of Epidauros (with stage).................91 Figure 9.18: Sound Pressure Level (SPL) at 1000Hz at the Theatre of Epidauros (without stage). .......92 Figure 9.19: Sound Pressure Level (SPL) at 1000Hz at the Theatre of Epidauros (with stage). ............92 Figure 9.20: Clarity (C80) at 1000Hz at the Theatre of Epidauros (without stage). ...............................93 Figure 9.21: Clarity (C80) at 1000Hz at the Theatre of Epidauros (with stage). ....................................93 Figure 9.22: Speech Transmission Index (STI) at 1000Hz at the Theatre of Epidauros (without stage).
.......................................................................................................................................................94 Figure 9.23: Speech Transmission Index (STI) at 1000Hz at the Theatre of Epidauros (with stage). ....94 Figure 9.24: Early Decay Time (EDT) at 1000Hz at the Theatre of Ancient Epidauros (without stage).
.......................................................................................................................................................95 Figure 9.25: Early Decay Time (EDT) at 1000Hz at the Theatre of Ancient Epidauros (with stage). ...95 Figure 9.26: Reverberation Time (T30) at 1000Hz at the Theatre of Ancient Epidauros (without stage).
.......................................................................................................................................................96 Figure 9.27: Reverberation Time (T30) at 1000Hz at the Theatre of Ancient Epidauros (with stage). ..96 Figure 9.28: Sound Pressure Level (SPL) at 1000Hz at the Theatre of Ancient Epidauros (without
stage). ............................................................................................................................................97 Figure 9.29: Sound Pressure Level (SPL) at 1000Hz at the Theatre of Ancient Epidauros (with stage).
.......................................................................................................................................................97 Figure 9.30: Clarity (C80) at 1000Hz at the Theatre of Ancient Epidauros (without stage)...................98 Figure 9.31: Clarity (C80) at 1000Hz at the Theatre of Ancient Epidauros (with stage)........................98 Figure 9.32: Speech Transmission Index (STI) at 1000Hz at the Theatre of Ancient Epidauros (without
stage). ............................................................................................................................................99 Figure 9.33: Speech Transmission Index (STI) at 1000Hz at the Theatre of Ancient Epidauros (with
stage). ............................................................................................................................................99
LIST OF TABLES
Table 6.1: General information for the performances.............................................................................67 Table 6.2: Pairs that were compared in Section 2 of the listening tests. The colors stress whether the
performance was amplified (light orange) or not (light yellow). Large = Theatre of Epidauros,
Small = Theatre of Ancient Epidauros. .........................................................................................74 Table 6.3: The values of the acoustic quantities measured in the receiver positions which are the closest
to the recording positions used for this part of the listening tests..................................................75 Table 9.1: Table of values for the Theatre of Epidauros.........................................................................84 Table 9.2: Table of values for the Theatre of Ancient Epidauros. ..........................................................88
Introduction and objectives
9
1. Introduction and objectives
Greek and Roman theatres have undoubtedly played an important role not only in the
society of their times but also today. In fact, many of those theatres are used
nowadays, if their present condition allows it. The intensive contemporary use of
ancient theatres has given rise to discussions -in national and international level- that
range from practical issues (e.g. maintenance and restoration of the theatres) to
theoretical aspects regarding their use (e.g. type and content of the performances that
take place in those spaces in respect to the protection and preservation of cultural
heritage). These topics have been addressed in several international charters ([1], [2],
[3]) related to world cultural heritage. The acoustic properties of open-air theatres are
also discussed in those charters, since they consist of functional characteristics of
those spaces and their investigation is by itself of great importance from a cultural and
educational point of view.
However, considering the intensive contemporary use of ancient theatres there is a
need for directing investigation efforts towards addressing specific issues related to
their acoustics; what can be done in order to restore the acoustical properties of the
theatres, if and how can they be improved, in which extent can amplification be used
in modern performances etc.
Part of the objectives of the “ERATO”1 project was to process and discuss some of
these topics. Under “ERATO”, acoustic measurements and computer simulations of
ancient Greek and Roman theatres were conducted. The theatres that were included
were located in Italy, Turkey and Jordan. In the outcomes of “ERATO” [4], specific
recommendations and guidelines have been proposed concerning the modern use of
the theatres [5].
For the purpose of evaluating these recommendations and more specifically the ones
that suggest “restoration of the stage” and “positioning of the sound sources on the
proscenium near the skene wall”, it was decided to study two cases of theatres, which
this time would be located in Greece.
1 “Identification, Evaluation and Revival of the Acoustical heritage of ancient Theatres and Odea”: An
EU funded program with a duration of 3 years, in which the Department of Acoustic Technology at
DTU was involved.
Introduction and objectives
10
The first theatre that was chosen was the Theater of the Sanctuary of Asklepios at
Epidauros (from now on referred to as “Theater of Epidauros”) since it is a typical
example of an ancient Greek theatre of the Hellenistic period2 and it is the best
preserved of its kind. The second theatre investigated was the, much smaller, Theatre
of Ancient Epidauros, the construction of which dates back to the 4th century BC;
however, it took its final form during the Roman era3 and it is preserved in this form
until today. Both theatres are used intensively nowadays and the types of
performances that they host vary from modern versions of Ancient Greek
tragedies/comedies to musical concerts.
In those theatres a set of in situ acoustic measurements were conducted in various
source-receiver configurations. The aim was to obtain data that would allow
comparisons among different source positions. Furthermore, those measurements
were compared to simulations of the theatres created with the use of the ODEON
software. After obtaining a satisfactory agreement between the measured and
simulated data the models were used in order to investigate the effect of the addition
of a stage in the acoustic behavior of the theatres. Finally, in an attempt to approach
the effect of amplification on subjective aspects of the acoustical character of the
theatres (e.g. the perception of space based only on auditory cues, intimacy) a series
of listening tests was conducted. The relation of the observations with objectively
measured acoustic parameters (e.g. Sound Pressure Level, Clarity) was also
investigated. The material (i.e. the audio tracks) used for the purpose of the tests was
obtained from binaural recordings of amplified and non amplified performances in
both theatres.
The outcomes of the present study are expected to give an insight to the acoustical
behavior of the theatres under investigation, as well as to expand the analysis already
carried out in the duration of the ERATO project. Last but not least, by combining the
use of “tools” like objective measurements, computer simulations and listening tests,
this study’s most ambitious goal is to point out a more complete way of approaching
the matter of contemporary use.
The terms written in italics are Greek (Hellenic) or Latin terms related to the theatres
and they are explained in the Glossary.
2 4th to 1
st century BC
3 Starting around the 2
nd or 1
st century BC
Information on the theatres under investigation
11
2. Information on the theatres under investigation
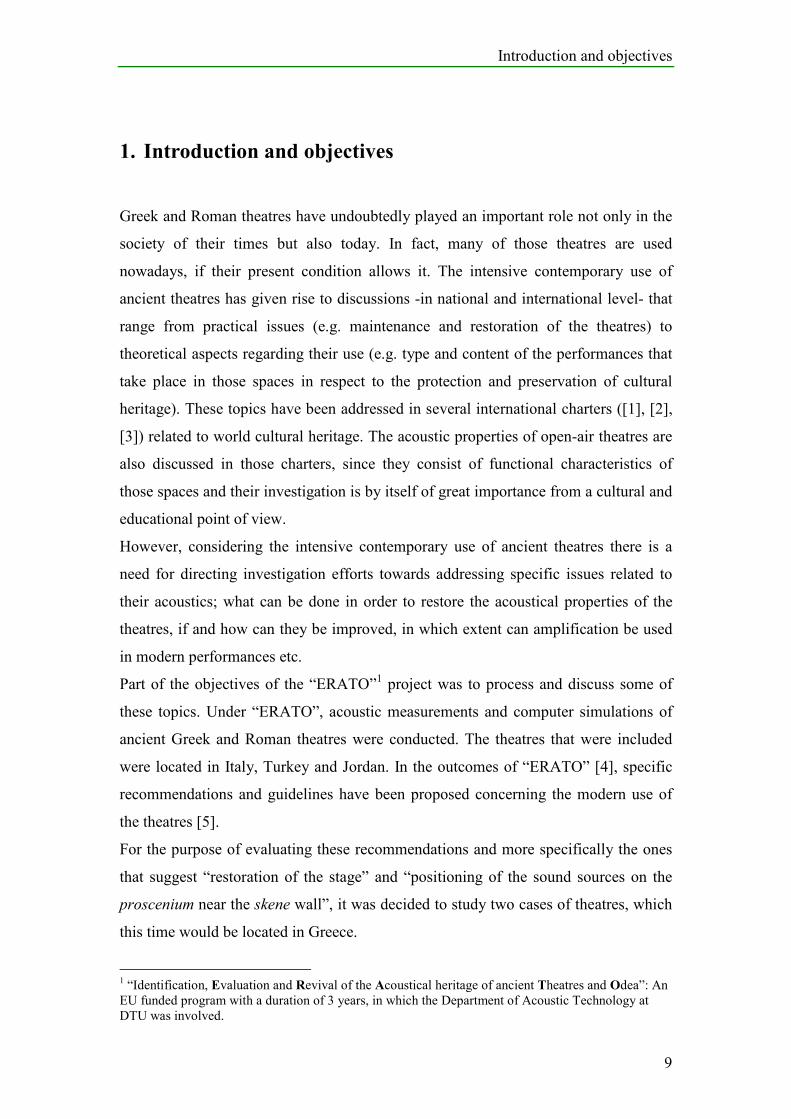
2.1. The Theatre of Epidauros
The Theatre of Epidauros is situated at the North-West part of Peloponnesos in
Greece. It is a typical example of a theatre of its time, consisting of the basic parts of
the ancient Greek theatre; the Koilon, the Orchestra, the Skene. It was built in two
stages; the lower part of the koilon (below the diazoma), the orchestra and the skene
were built around the 4th century B.C. The extension of the koilon was made around
the middle of the 2nd century B.C. An idea about the size of the construction can be
obtained if we take into account that the longest radius of the koilon is 58m and the
diameter of the orchestra is about 20m. The capacity of the theatre is about 13000
to14000 spectators
The theatre was used for solo singing, chanting, musical/poetical contests (mainly for
solo instruments) and theatrical performances of ancient tragedies and comedies.
Figure 2.1: A view of the Theatre of Epidauros
Information on the theatres under investigation
12
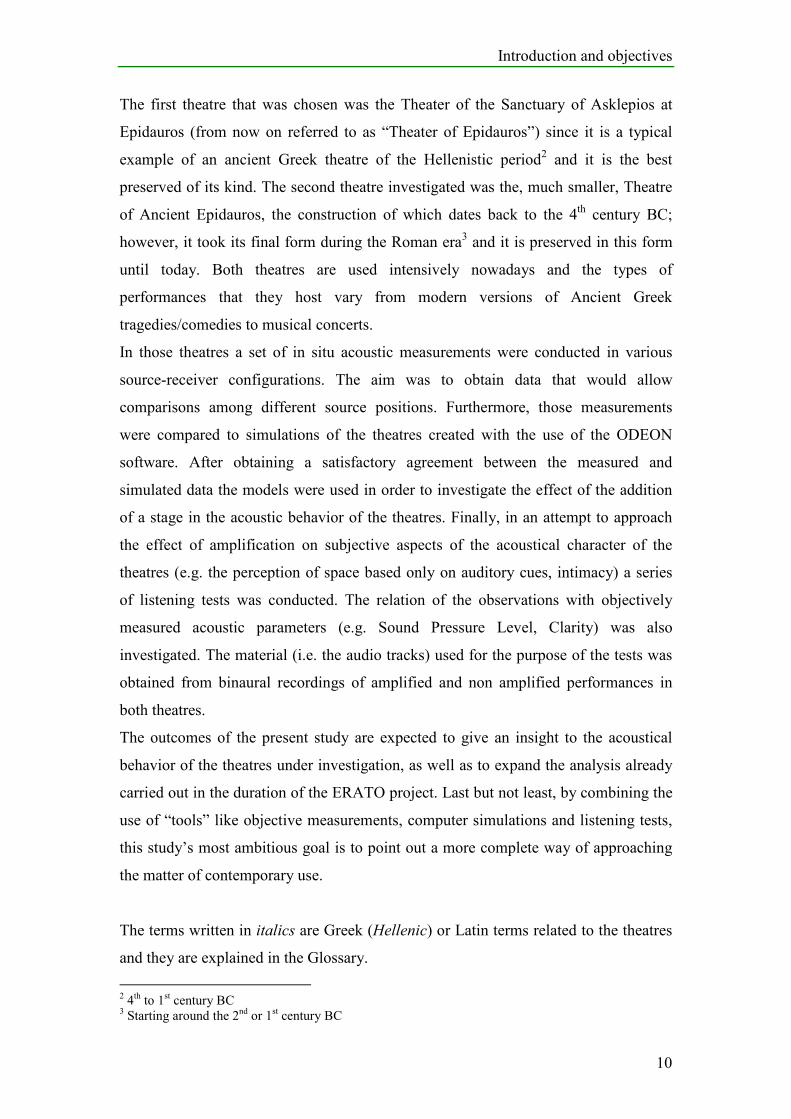
2.2. The Theatre of Ancient Epidauros
The Theatre of Ancient Epidauros is situated about 12 km further away from the
Theatre of Epidauros, in a small city called Ancient Epidauros. It was discovered
rather recently (1970) and the excavations are still in process nowadays. It was
constructed in sections and it is speculated that it had a simple initial form. The
theatre was built in the middle of the 4th century B.C. and the constructions continued
until the Hellenistic times, but later during the Roman period, the orchestra became
semi-circular with the erection of a stage nearer to the koilon, of which only the lower
part has survived until now. The theatre could host 2000 spectators, although today’s
capacity is around 500.
The Theatre of Ancient Epidauros had been in use for centuries along with the
Theatre of Epidauros.
Figure 2.2: A view of the Theatre of Ancient Epidauros
2.3. Contemporary use of the theatres
Nowadays, during the summer season both theatres host a variety of performances.
The performances usually relate in some way with the ancient Greek theatrical
heritage, especially in the case of the Theatre of Epidauros.
Since, in both theatres under investigation only the ruins of the skene survive until
today, the construction of a temporary stage building is often required. In the case of
the Theatre of Epidauros it depends on the production and the characteristics of the
Information on the theatres under investigation
13
construction can vary widely, from a simple wooden panel to a complicated and full
size skene. At the Theatre of Ancient Epidauros on the other hand a temporary
wooden platform covering the orchestra and the stage is installed every year for the
period that the performances take place.
Although there are still productions in which no artificial amplification of the voices
of the actors (or of musical instruments) is used, the number of productions that
experiment with the use artificial amplification is increasing. At the Theatre of
Ancient Epidauros most of the presented performances are amplified.
Description of acoustic measurements and recordings
14
3. Description of acoustic measurements and recordings
3.1. Acoustic measurements
3.1.1. Equipment
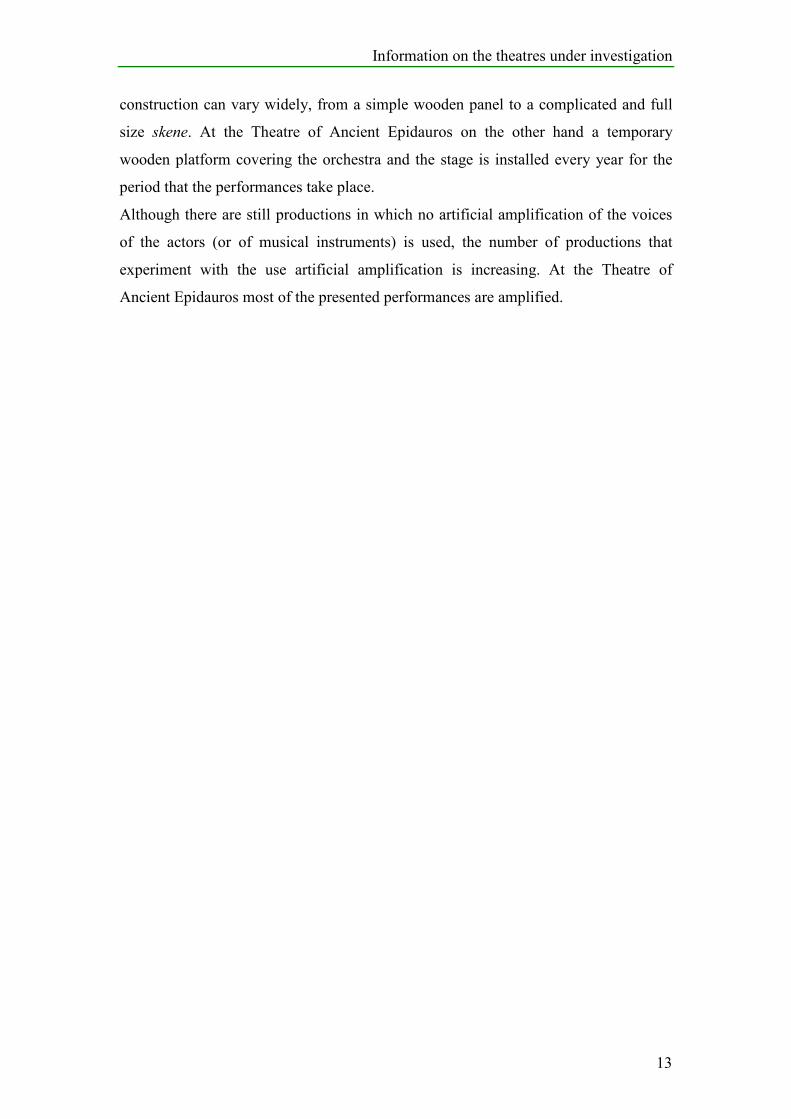
For the measurements the DIRAC software v3.0 was used, running on a portable
computer. The source was a dodecahedron loudspeaker and the receiver was an AKG
stereo microphone. A pre-amplifier, an amplifier and the necessary cabling between
the devices were used as well.
The signal that was used was an exponential sweep with a duration of 10,9 seconds.
The signal was produced by the DIRAC software and it was first fed to the pre-
amplifier and amplifier and then directed to the loudspeaker. The microphone was
also connected to the laptop and the impulse responses in different positions of the
theatres were recorded.
Figure 3.1: The measuring equipment (except from the source and receiver).
Description of acoustic measurements and recordings
15
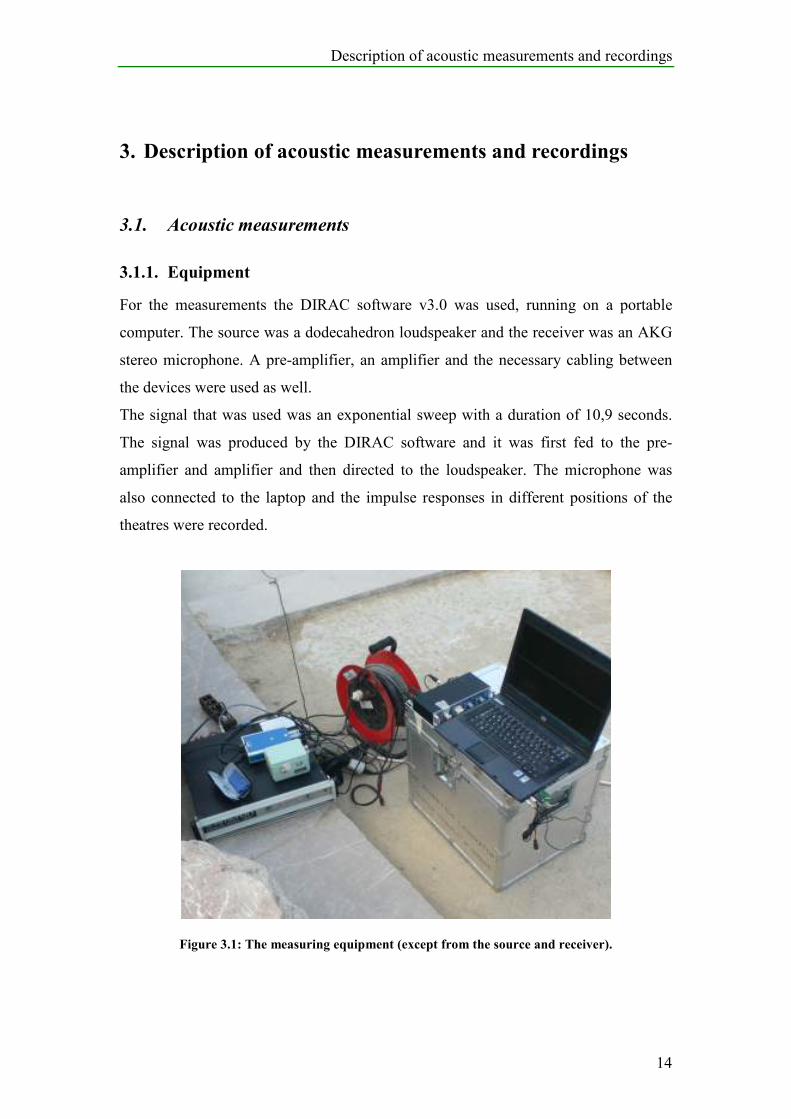
Figure 3.2: While recording an impulse response at the Theatre of Epidauros. The microphone
and the loudspeaker can be seen at the right and upper left of the photograph, respectively.
Description of acoustic measurements and recordings
16
3.1.2. Calibration
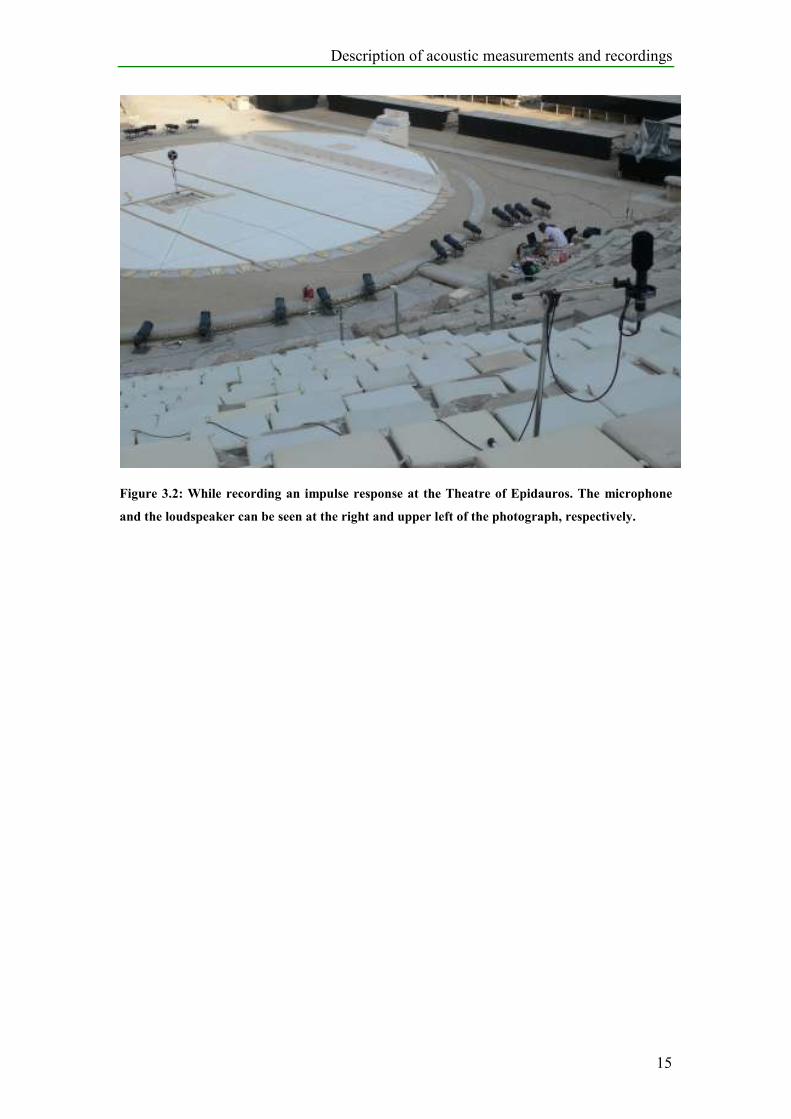
For the calibration of our measuring system the following setup was used. The source
(dodecahedron loudspeaker) and receiver (AKG microphone) were positioned at a
height of 1,5m and the distance between them was 2m4.
Mineral wool was placed between them (in parallel to the ground plain and covering a
surface of about 2m2) at a height of 0,4 m, in order to absorb the reflections coming
from the floor. The calibration setup can be seen in Figure 3.3. The signal used for the
calibration process was the same exponential sweep which was used for the
measurements. The microphone was then rotated in steps of 30-40 degrees. In every
position an impulse response was recorded and the obtained data set was used for the
system’s calibration.
Figure 3.3: The setup used for obtaining the data used for calibration of the measuring system.
4 For calculating Strength, G a correction value of 14dB was added in the results in order to compensate
for the fact that the sound source was positioned 2 and not 10m away.
Description of acoustic measurements and recordings
17
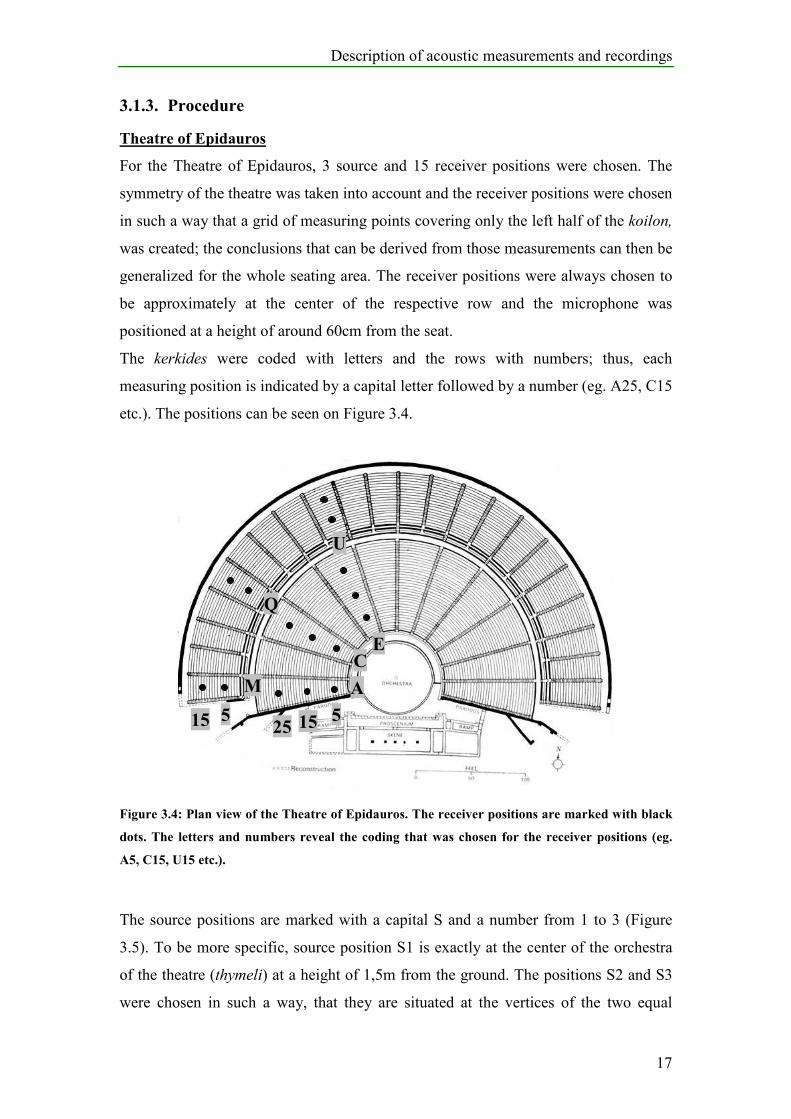
3.1.3. Procedure
Theatre of Epidauros
For the Theatre of Epidauros, 3 source and 15 receiver positions were chosen. The
symmetry of the theatre was taken into account and the receiver positions were chosen
in such a way that a grid of measuring points covering only the left half of the koilon,
was created; the conclusions that can be derived from those measurements can then be
generalized for the whole seating area. The receiver positions were always chosen to
be approximately at the center of the respective row and the microphone was
positioned at a height of around 60cm from the seat.
The kerkides were coded with letters and the rows with numbers; thus, each
measuring position is indicated by a capital letter followed by a number (eg. A25, C15
etc.). The positions can be seen on Figure 3.4.
Figure 3.4: Plan view of the Theatre of Epidauros. The receiver positions are marked with black
dots. The letters and numbers reveal the coding that was chosen for the receiver positions (eg.
A5, C15, U15 etc.).
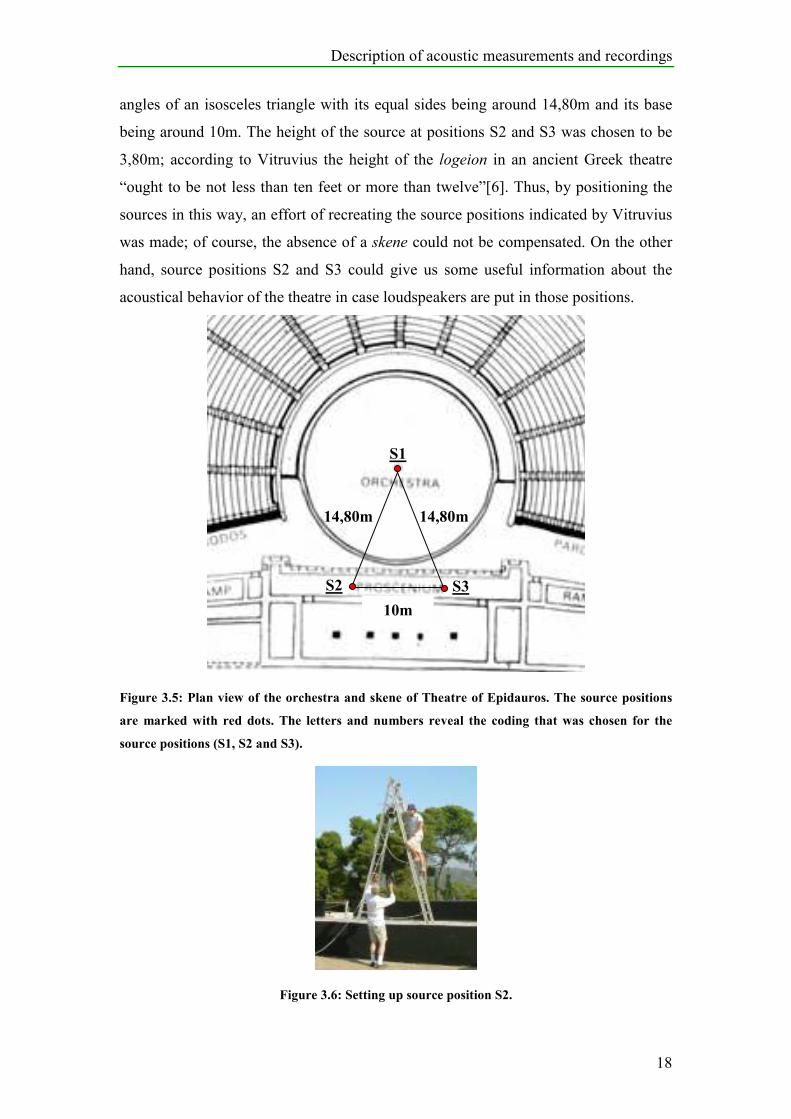
The source positions are marked with a capital S and a number from 1 to 3 (Figure
3.5). To be more specific, source position S1 is exactly at the center of the orchestra
of the theatre (thymeli) at a height of 1,5m from the ground. The positions S2 and S3
were chosen in such a way, that they are situated at the vertices of the two equal
C
A
E
M
Q
U
5 15 25 5 15
Description of acoustic measurements and recordings
18
angles of an isosceles triangle with its equal sides being around 14,80m and its base
being around 10m. The height of the source at positions S2 and S3 was chosen to be
3,80m; according to Vitruvius the height of the logeion in an ancient Greek theatre
“ought to be not less than ten feet or more than twelve”[6]. Thus, by positioning the
sources in this way, an effort of recreating the source positions indicated by Vitruvius
was made; of course, the absence of a skene could not be compensated. On the other
hand, source positions S2 and S3 could give us some useful information about the
acoustical behavior of the theatre in case loudspeakers are put in those positions.
Figure 3.5: Plan view of the orchestra and skene of Theatre of Epidauros. The source positions
are marked with red dots. The letters and numbers reveal the coding that was chosen for the
source positions (S1, S2 and S3).
Figure 3.6: Setting up source position S2.
S1
S2 S3
14,80m 14,80m
10m
Description of acoustic measurements and recordings
19
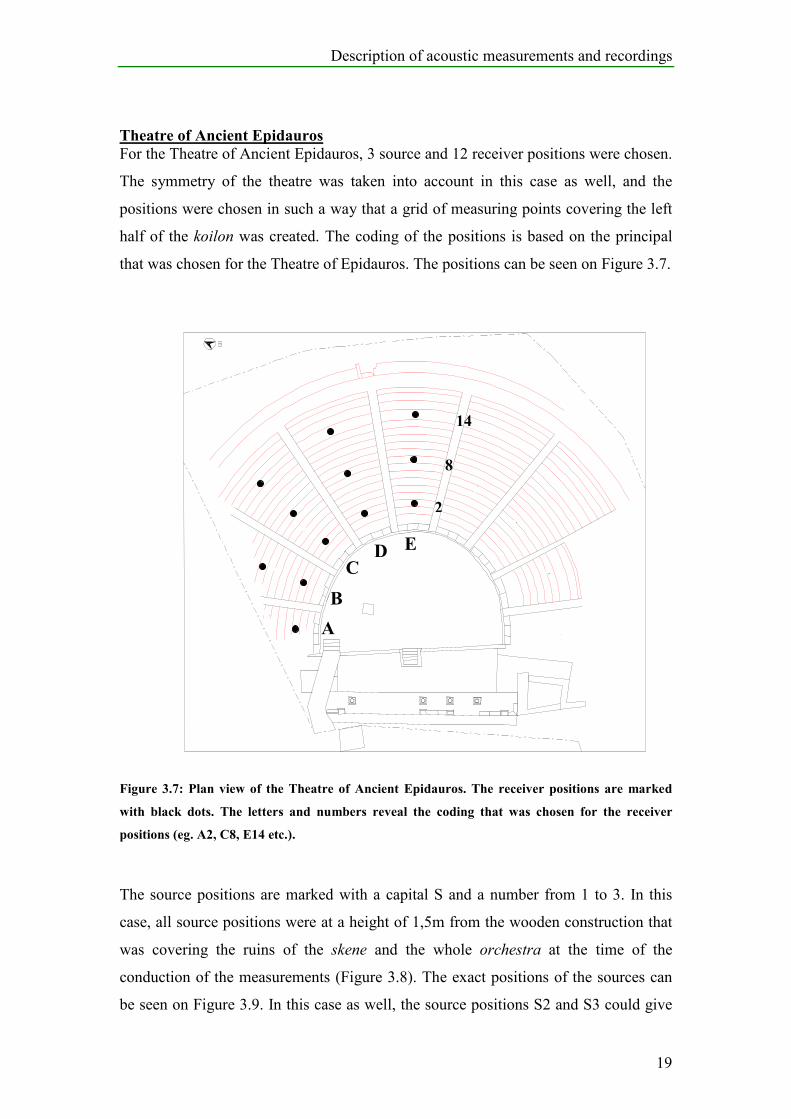
Theatre of Ancient Epidauros
For the Theatre of Ancient Epidauros, 3 source and 12 receiver positions were chosen.
The symmetry of the theatre was taken into account in this case as well, and the
positions were chosen in such a way that a grid of measuring points covering the left
half of the koilon was created. The coding of the positions is based on the principal
that was chosen for the Theatre of Epidauros. The positions can be seen on Figure 3.7.
A
?
G
?
??
?
T
?
Figure 3.7: Plan view of the Theatre of Ancient Epidauros. The receiver positions are marked
with black dots. The letters and numbers reveal the coding that was chosen for the receiver
positions (eg. A2, C8, E14 etc.).
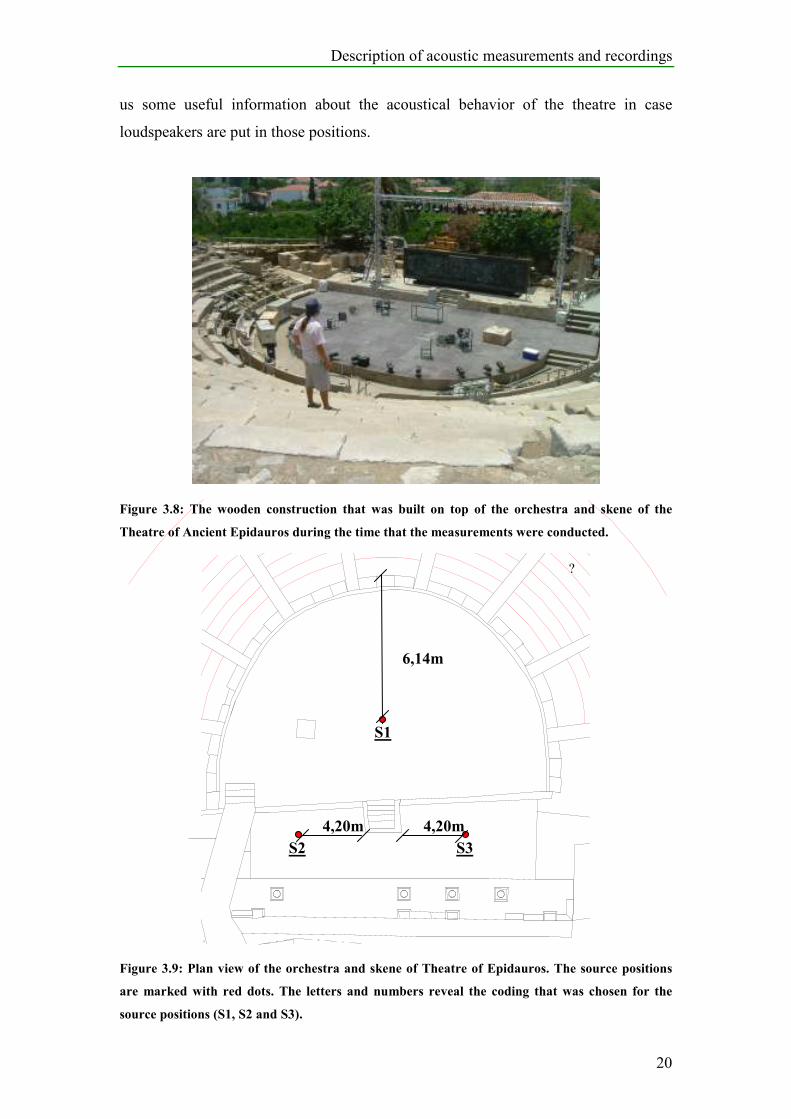
The source positions are marked with a capital S and a number from 1 to 3. In this
case, all source positions were at a height of 1,5m from the wooden construction that
was covering the ruins of the skene and the whole orchestra at the time of the
conduction of the measurements (Figure 3.8). The exact positions of the sources can
be seen on Figure 3.9. In this case as well, the source positions S2 and S3 could give
A
B
C D E
2
8
14
Description of acoustic measurements and recordings
20
us some useful information about the acoustical behavior of the theatre in case
loudspeakers are put in those positions.
Figure 3.8: The wooden construction that was built on top of the orchestra and skene of the
Theatre of Ancient Epidauros during the time that the measurements were conducted.
?
Figure 3.9: Plan view of the orchestra and skene of Theatre of Epidauros. The source positions
are marked with red dots. The letters and numbers reveal the coding that was chosen for the
source positions (S1, S2 and S3).
6,14m
4,20m 4,20m
S1
S2 S3
Description of acoustic measurements and recordings
21
3.2. Recordings
3.2.1. Equipment
The equipment that was used for the recordings was 3 hard disc recorders (Sound
Devices 722T and 744T) and 3 sets of binaural microphones (2 Sennheiser and 1 made
at the Department of Acoustic Technology-DTU).
Figure 3.10: The pair of “home-made”, binaural microphones that were used for the conduction
of the recordings at one of the positions.
3.2.2. Calibration
After fixing the gain controls at a specific level (different in each recorder depending
on the seating position5) a reference signal was recorded in all three hard disc
recorders. The reference signal was white noise MLS noise6 at 84dB SPL, which was
produced by the ODEON software. The sound source was the dodecahedron
loudspeaker and each one of the persons carrying the recording equipment recorded
consecutively, a short sound sample at a distance of 2m from the source and at 1,5m
from the ground. These reference sound files were later used for normalization
purposes in order to compensate for the differences in the initial gain setups. The
sound files could then be directly compared to each other.
For the manipulation of all the recorded files the Adobe Audition software was used.
5 The gain in each recorder was set to be as high as possible in order for the recorded signal to have a
high signal-to-noise ratio, but also taking care that no clipping distortion was introduced. 6A MLS (Maximum Length Sequence) is a periodic pseudo random white noise signal, having the
desirable property that its frequency spectrum over one period is as flat as the spectrum of an ideal
impulse. Many types of MLS exist. DIRAC uses a subset, with period lengths ranging from 0,34 to
23,8 seconds [7].
Description of acoustic measurements and recordings
22
3.2.3. Procedure
One amplified and one non-amplified performance was recorded in each theatre. Parts
of the performances were recorded simultaneously in 3 different positions in each
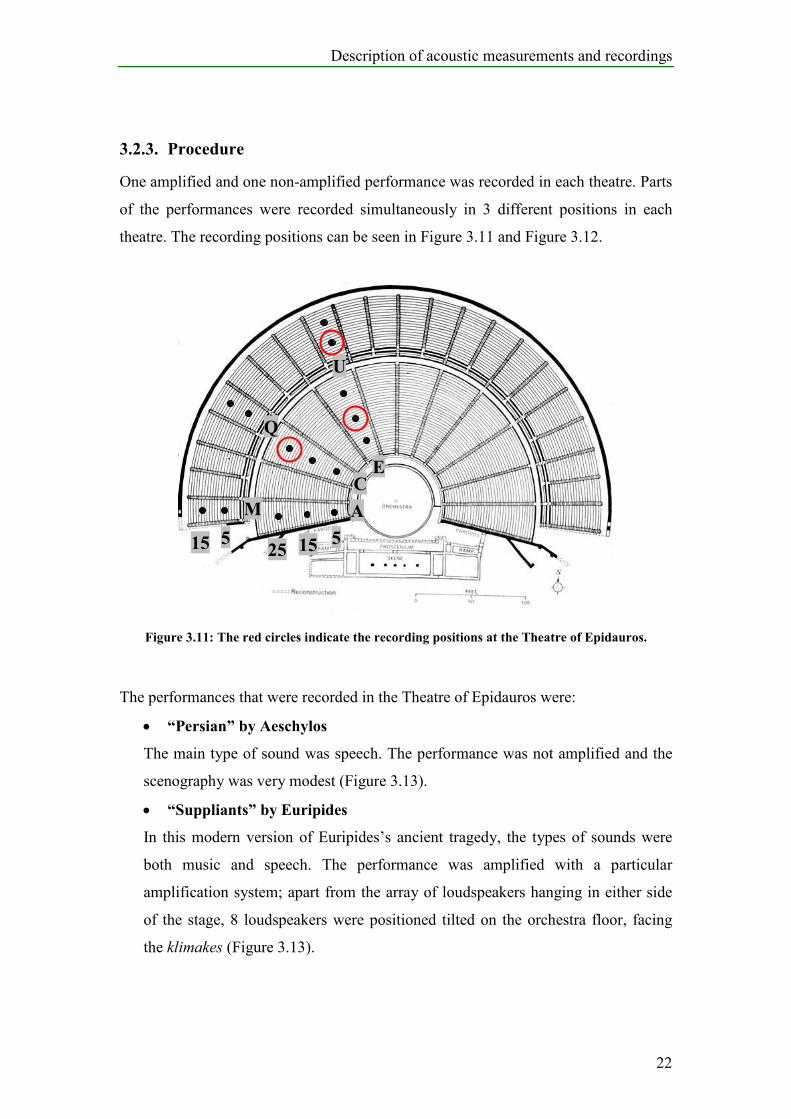
theatre. The recording positions can be seen in Figure 3.11 and Figure 3.12.
Figure 3.11: The red circles indicate the recording positions at the Theatre of Epidauros.
The performances that were recorded in the Theatre of Epidauros were:
• “Persian” by Aeschylos
The main type of sound was speech. The performance was not amplified and the
scenography was very modest (Figure 3.13).
• “Suppliants” by Euripides
In this modern version of Euripides’s ancient tragedy, the types of sounds were
both music and speech. The performance was amplified with a particular
amplification system; apart from the array of loudspeakers hanging in either side
of the stage, 8 loudspeakers were positioned tilted on the orchestra floor, facing
the klimakes (Figure 3.13).
C
A
E
M
Q
U
5 15 25 5 15
Description of acoustic measurements and recordings
23
A
?
G
?
??
?
T
?
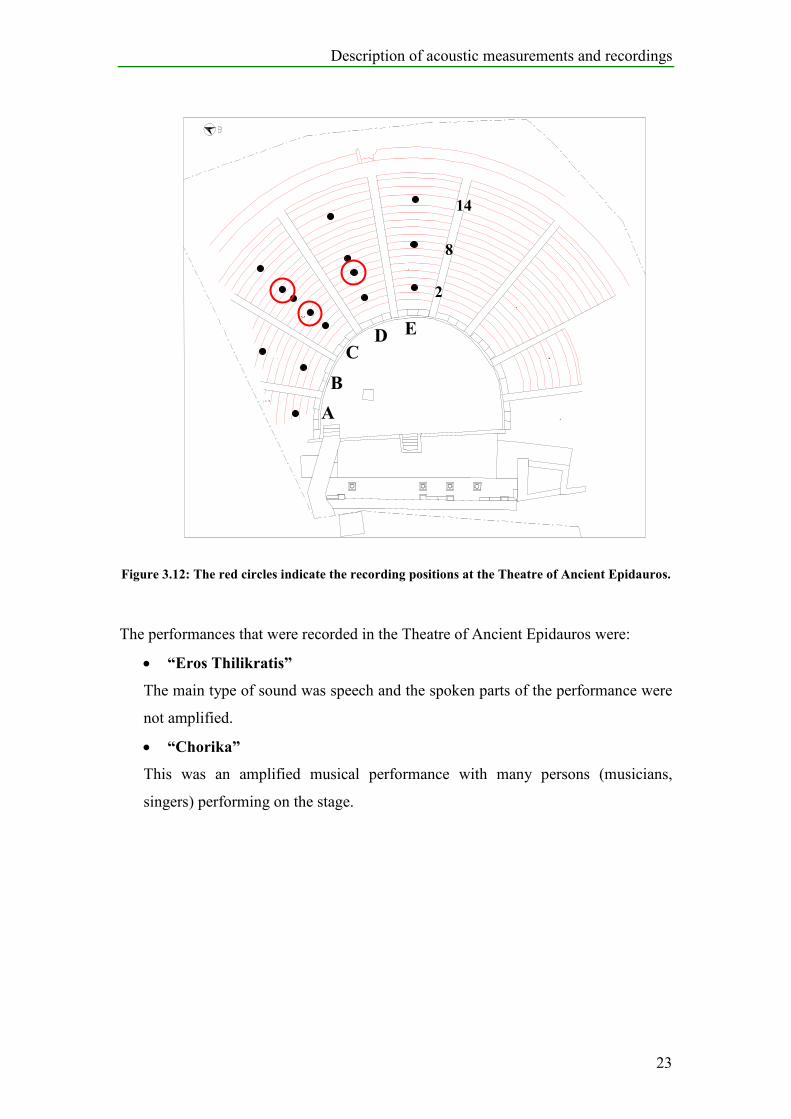
Figure 3.12: The red circles indicate the recording positions at the Theatre of Ancient Epidauros.
The performances that were recorded in the Theatre of Ancient Epidauros were:
• “Eros Thilikratis”
The main type of sound was speech and the spoken parts of the performance were
not amplified.
• “Chorika”
This was an amplified musical performance with many persons (musicians,
singers) performing on the stage.
A
B
C D E
2
8
14
Description of acoustic measurements and recordings
24
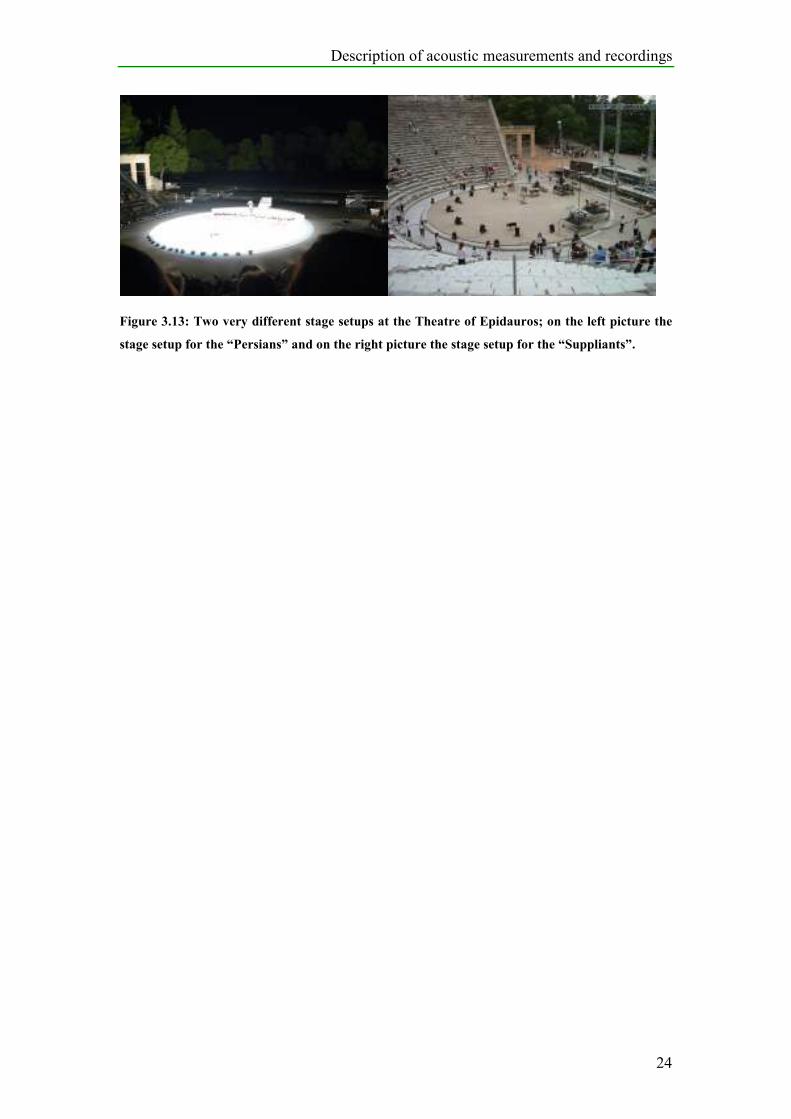
Figure 3.13: Two very different stage setups at the Theatre of Epidauros; on the left picture the
stage setup for the “Persians” and on the right picture the stage setup for the “Suppliants”.
Description of the models
25
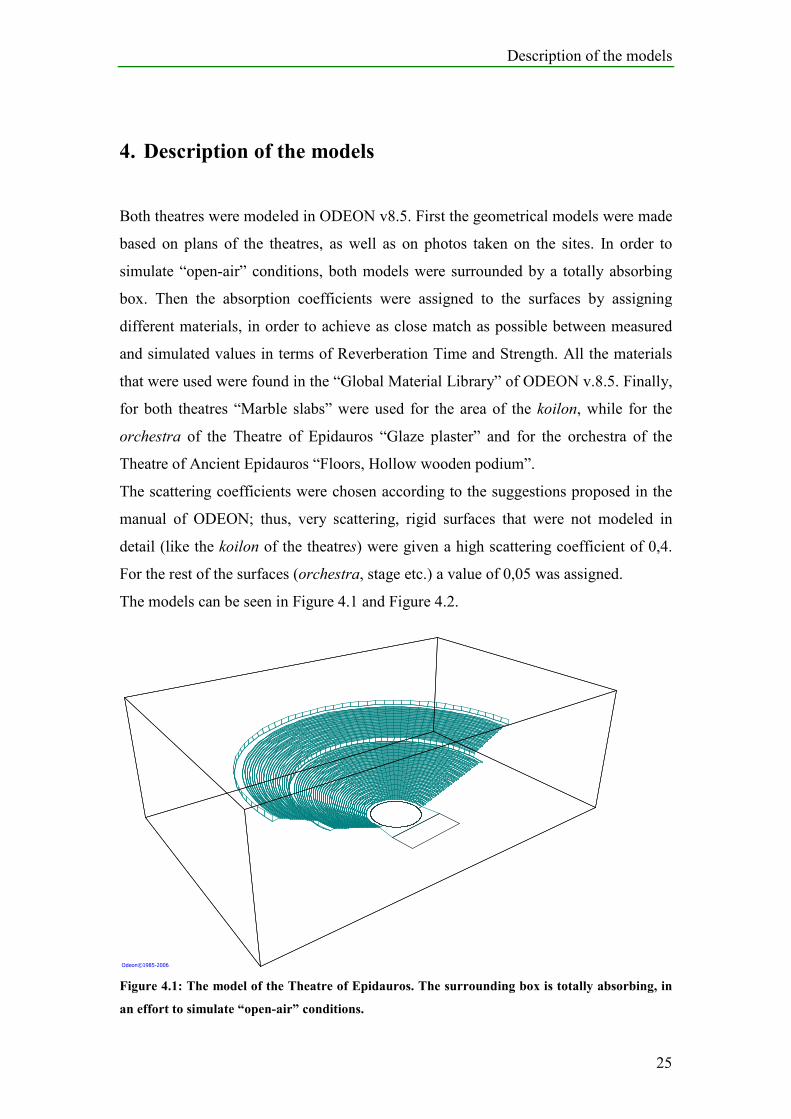
4. Description of the models
Both theatres were modeled in ODEON v8.5. First the geometrical models were made
based on plans of the theatres, as well as on photos taken on the sites. In order to
simulate “open-air” conditions, both models were surrounded by a totally absorbing
box. Then the absorption coefficients were assigned to the surfaces by assigning
different materials, in order to achieve as close match as possible between measured
and simulated values in terms of Reverberation Time and Strength. All the materials
that were used were found in the “Global Material Library” of ODEON v.8.5. Finally,
for both theatres “Marble slabs” were used for the area of the koilon, while for the
orchestra of the Theatre of Epidauros “Glaze plaster” and for the orchestra of the
Theatre of Ancient Epidauros “Floors, Hollow wooden podium”.
The scattering coefficients were chosen according to the suggestions proposed in the
manual of ODEON; thus, very scattering, rigid surfaces that were not modeled in
detail (like the koilon of the theatres) were given a high scattering coefficient of 0,4.
For the rest of the surfaces (orchestra, stage etc.) a value of 0,05 was assigned.
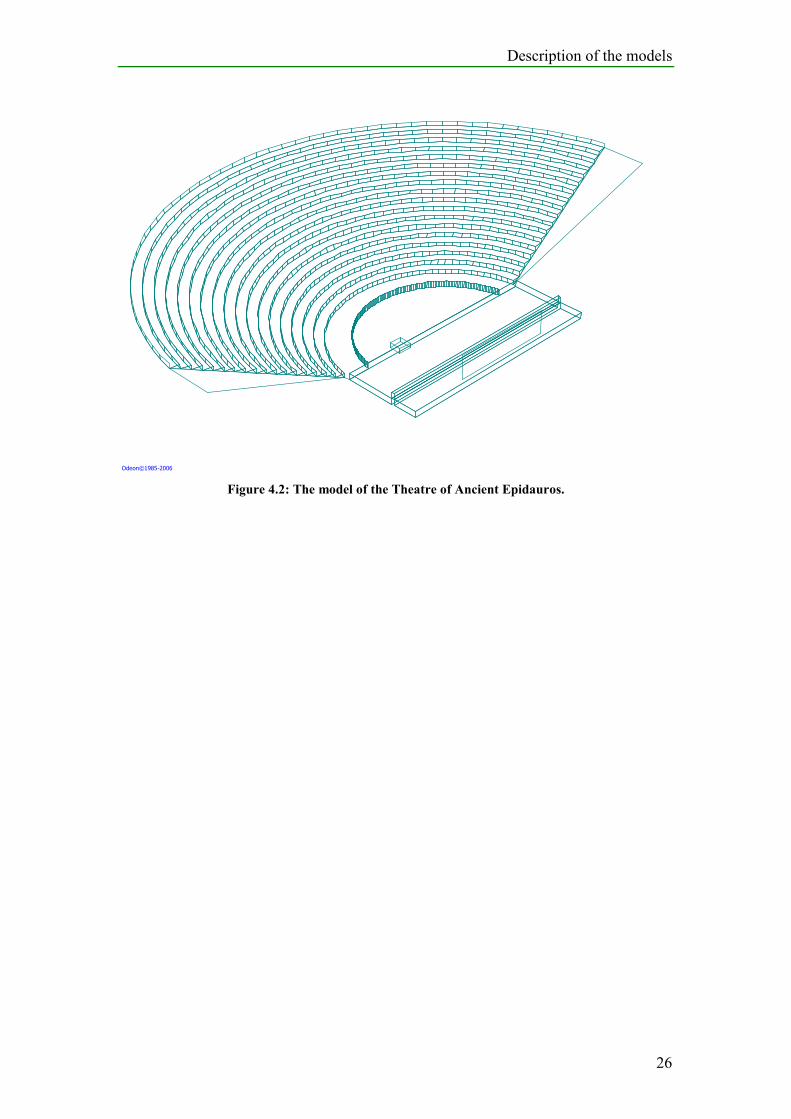
The models can be seen in Figure 4.1 and Figure 4.2.
Odeon©1985-2006
Figure 4.1: The model of the Theatre of Epidauros. The surrounding box is totally absorbing, in
an effort to simulate “open-air” conditions.
Description of the models
26
Odeon©1985-2006
Figure 4.2: The model of the Theatre of Ancient Epidauros.
Description of the models
27
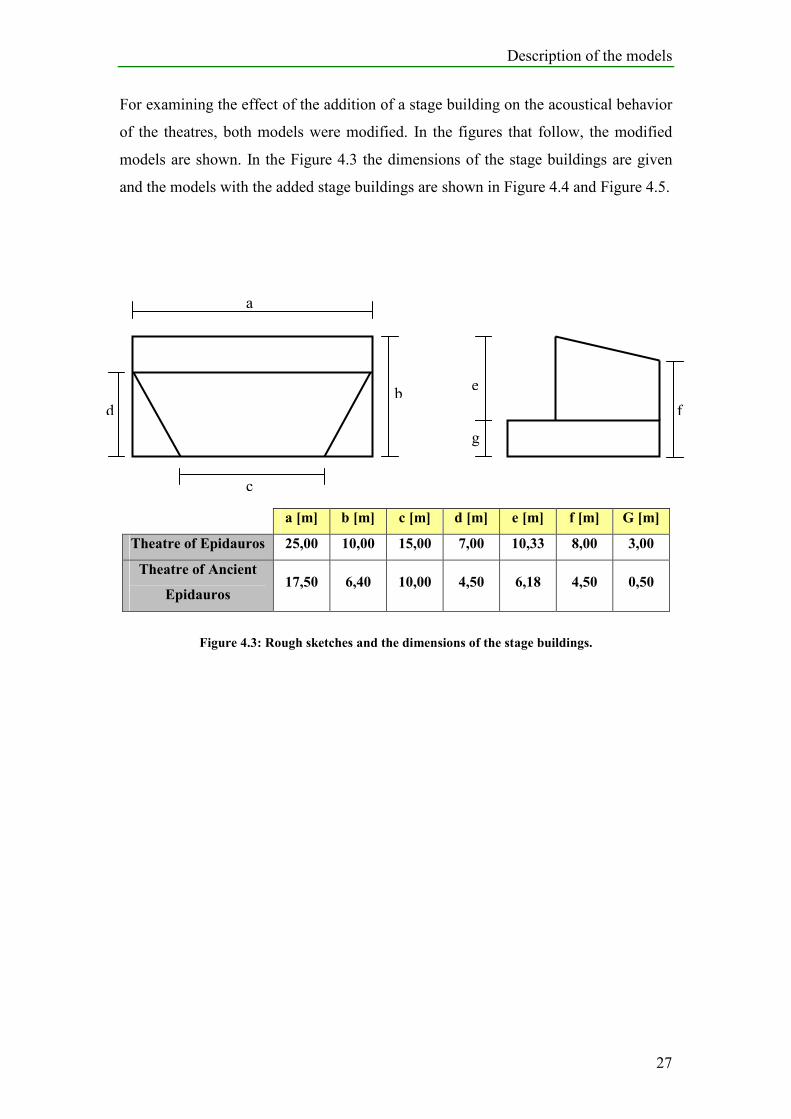
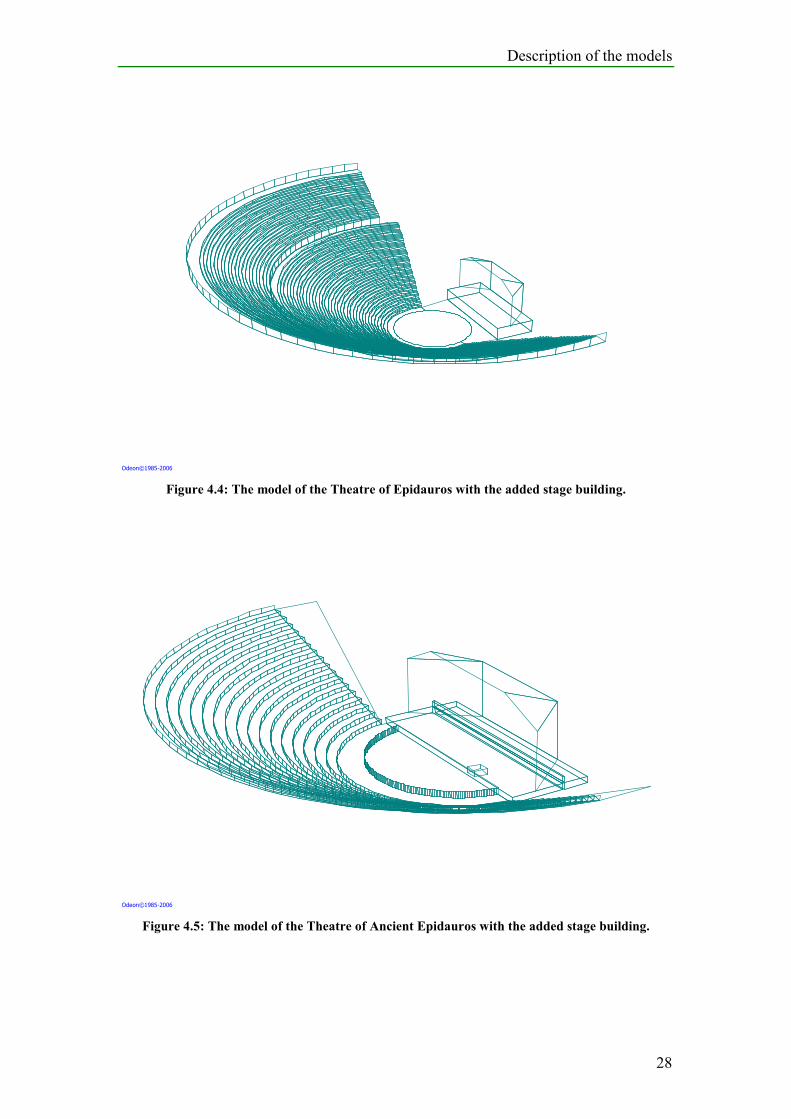
For examining the effect of the addition of a stage building on the acoustical behavior
of the theatres, both models were modified. In the figures that follow, the modified
models are shown. In the Figure 4.3 the dimensions of the stage buildings are given
and the models with the added stage buildings are shown in Figure 4.4 and Figure 4.5.
a [m] b [m] c [m] d [m] e [m] f [m] G [m]
Theatre of Epidauros 25,00 10,00 15,00 7,00 10,33 8,00 3,00
Theatre of Ancient
Epidauros 17,50 6,40 10,00 4,50 6,18 4,50 0,50
Figure 4.3: Rough sketches and the dimensions of the stage buildings.
a
b
c
d
e
f
g
Description of the models
28
Odeon©1985-2006
Figure 4.4: The model of the Theatre of Epidauros with the added stage building.
Odeon©1985-2006
Figure 4.5: The model of the Theatre of Ancient Epidauros with the added stage building.
Measurements and Simulations
29
5. Measurements and Simulations
In this chapter, the results from the acoustic measurements will be presented, as well
as data obtained from simulations in ODEON. The analysis of the data focuses on the
comparison of the following acoustic quantities:
• Sound Strength, G (in dB)
• Reverberation Time, T30 (in sec)7
• Early Decay Time, EDT (in sec)
• Clarity, C80 (in dB)
• Speech Transmission Index, STI
The detailed definitions of the quantities can be found in [8].
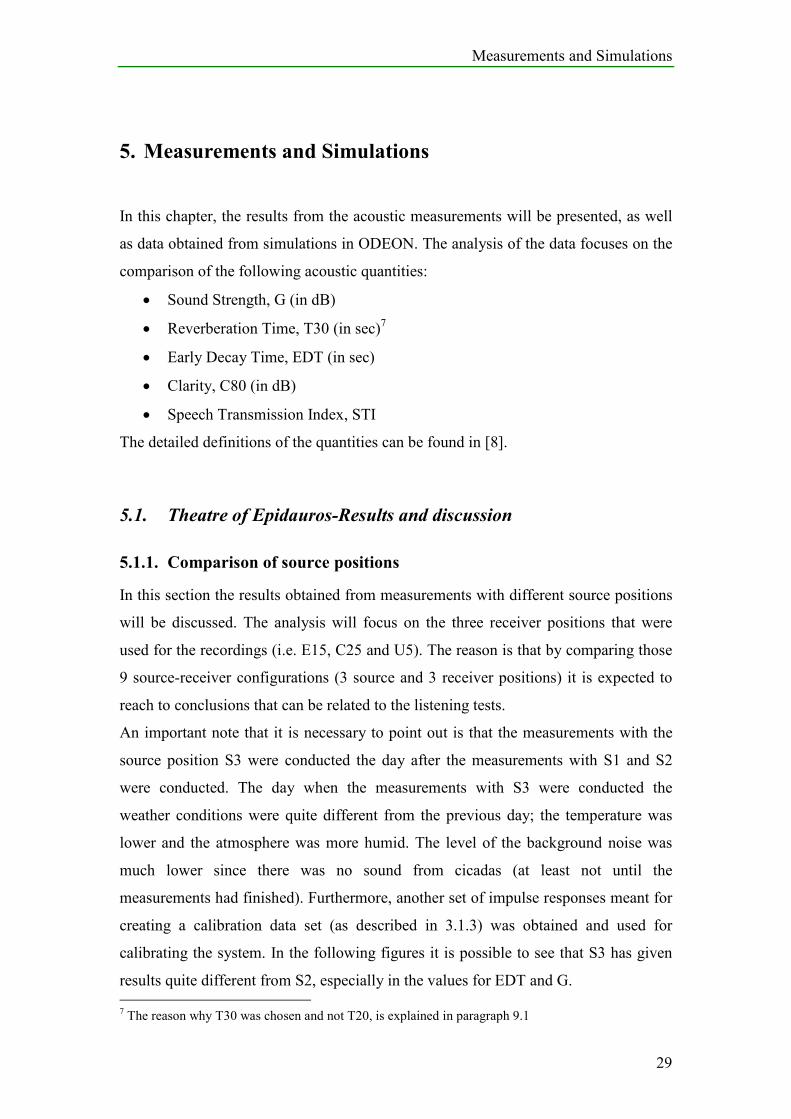
5.1. Theatre of Epidauros-Results and discussion
5.1.1. Comparison of source positions
In this section the results obtained from measurements with different source positions
will be discussed. The analysis will focus on the three receiver positions that were
used for the recordings (i.e. E15, C25 and U5). The reason is that by comparing those
9 source-receiver configurations (3 source and 3 receiver positions) it is expected to
reach to conclusions that can be related to the listening tests.
An important note that it is necessary to point out is that the measurements with the
source position S3 were conducted the day after the measurements with S1 and S2
were conducted. The day when the measurements with S3 were conducted the
weather conditions were quite different from the previous day; the temperature was
lower and the atmosphere was more humid. The level of the background noise was
much lower since there was no sound from cicadas (at least not until the
measurements had finished). Furthermore, another set of impulse responses meant for
creating a calibration data set (as described in 3.1.3) was obtained and used for
calibrating the system. In the following figures it is possible to see that S3 has given
results quite different from S2, especially in the values for EDT and G.
7 The reason why T30 was chosen and not T20, is explained in paragraph 9.1
Measurements and Simulations
30
E15_S1
E15_S2
E15_S3
U5_S1
U5_S2
U5_S3
C25_S1
C25_S2
C25_S3
-12,00
-10,00
-8,00
-6,00
-4,00
-2,00
0,00
30 35 40 45 50 55 60 65 70 75
Distance from source [m]
Strength, G [dB]
E15_S1
E15_S2
E15_S3
U5_S1
U5_S2
U5_S3
C25_S1
C25_S2
C25_S3
Figure 5.1: Strength (G) versus distance at the Theatre of Epidauros. Each point represents the
average of the values at 500Hz and 1000Hz octave bands, for the specific source-receiver setup
[8].
For the source positions S1 and S2, the Strength of sound is inversely proportional to
distance and with increasing distance strength seems to decrease with an almost
constant slope. In free-field conditions the sound pressure level drops 6dB per
doubling of distance. Due to the fact that the sound field in the space of the theatre is
not “free” at all a less steep drop would be expected. Nevertheless, by comparing
E15_S1 and U5_S1 it seems that this is not the case here.
Concerning S3, the values of G in all receiver positions are even higher than S1
(Figure 5.1); which is strange since S1 is almost 15m closer to the receiver points than
S3 (Figure 3.5). It could be argued that it is the different set of data that has been used
for calibration that creates this difference. If that was the case then particular data
would only be expected for the G values since among the quantities presented and
compared in this study, they are the only ones which are affected by the calibration of
the system.
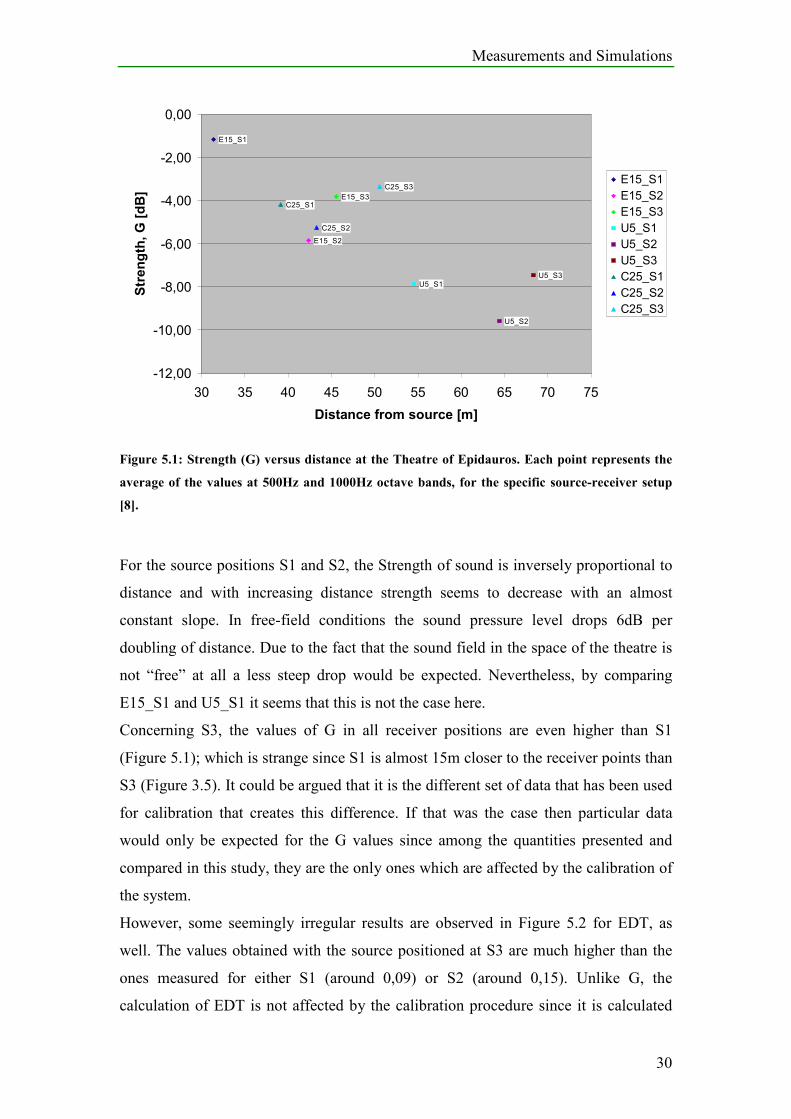
However, some seemingly irregular results are observed in Figure 5.2 for EDT, as
well. The values obtained with the source positioned at S3 are much higher than the
ones measured for either S1 (around 0,09) or S2 (around 0,15). Unlike G, the
calculation of EDT is not affected by the calibration procedure since it is calculated
Measurements and Simulations
31
directly from the slope of the integrated impulse response curves. Thus, the
explanation of a calibration error does not cover this case.
E15_S1
E15_S2
E15_S3
U5_S1
U5_S2
U5_S3
C25_S3
C25_S1
0,00
0,10
0,20
0,30
0,40
0,50
0,60
0,70
0,80
30 35 40 45 50 55 60 65 70 75
Distance from source [m]
Early Decay Tim
e, EDT [dB]
E15_S1
E15_S2
E15_S3
U5_S1
U5_S2
U5_S3
C25_S1
C25_S3
Figure 5.2: Early Decay Time (EDT) versus distance at the Theatre of Epidauros. Each point
represents the average of the values at 500Hz and 1000Hz octave bands, for the specific source-
receiver setup [8].
An alternate explanation could attribute these results to the effect of the weather
conditions on the acoustic properties of the theatre. Taking into account that the
measurements were conducted early in the morning under the conditions described
previously, it could be possible that the temperature gradient in the different layers of
air was such that could cause a “downward” bending of the sound rays. This is a
complicated phenomenon and its explanation is out of the scope of this investigation
but the occurrence of this phenomenon would mean that a bigger amount of sound
rays (comparing to the previous day) would reach the receiver positions. This could
explain the higher G values but also the higher EDT values. Nevertheless, this
assumption cannot be proven from the analysis undergone so far; in previous
investigations of this phenomenon at the Theatre of Epidauros no pronounced effect
on the acoustical properties of the theatre had been observed [9].
Measurements and Simulations
32
E15_S1E15_S2
E15_S3 U5_S1
C25_S1
C25_S3U5_S2 U5_S3
C25_S2
0,00
0,10
0,20
0,30
0,40
0,50
0,60
0,70
0,80
0,90
1,00
30 35 40 45 50 55 60 65 70
Distance from source [m]
STI
E15_S1
E15_S2
E15_S3
U5_S1
U5_S2
U5_S3
C25_S1
C25_S2
C25_S3
Figure 5.3: Speech Transmission Index (STI) versus distance at the Theatre of Epidauros. Each
point represents the average of the values at 500Hz and 1000Hz octave bands, for the specific
source-receiver setup [8].
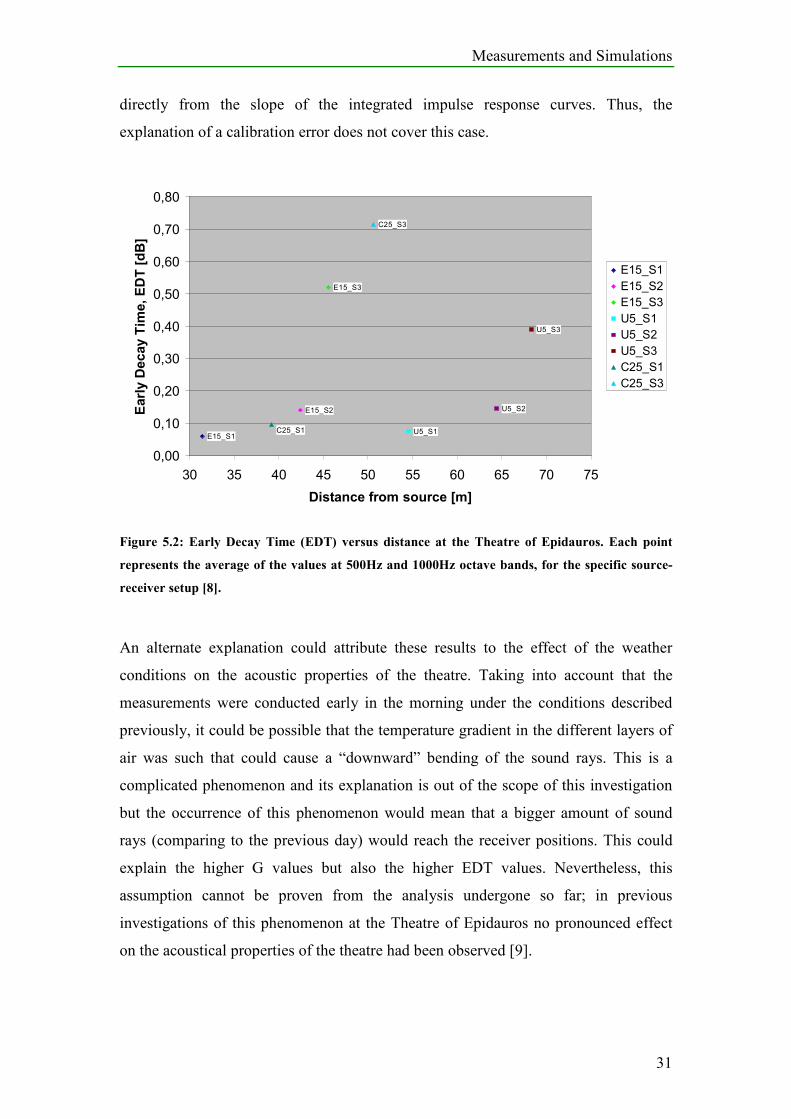
A safe observation that it is possible to point out is that STI (as shown in Figure 5.3)
is not affected by the source position and it is over 0,7 for every source-receiver
configuration. This observation justifies the fame of this theatre that a performance is
intelligible even at the most remote seats.
As far as Reverberation time is concerned, looking at Figure 5.4 it is possible to see
that there is no obvious dependency of T30 from the source-receiver distance.
Furthermore in Figure 5.5 it is shown that when the source is positioned on the
orchestra the values of T30 are higher comparing to the other source positions. This
could be explained by the fact that in the absence of a skene, when the source is
positioned in the back (where the skene used to be), more sound rays “escape” from
the space of the theatre. In Figure 5.5 the value that T30 takes at 4000Hz for S3 can
be seen. As said before, the day that measurements with source position S3 were
conducted was the only day where there was no background noise from cicadas; thus
it was possible to obtain reliable results for T30 at this octave band.
Measurements and Simulations
33
E15_S1
U5_S1
U5_S2
U5_S3
C25_S3
E15_S2
E15_S3
C25_S1
C25_S2
0,00
0,20
0,40
0,60
0,80
1,00
1,20
1,40
30 35 40 45 50 55 60 65 70 75
Distance from source [m]
Reverberation Tim
e, T30 [sec]
E15_S1
E15_S2
E15_S3
U5_S1
U5_S2
U5_S3
C25_S1
C25_S2
C25_S3
Figure 5.4: Reverberation Time (T30) versus distance at the Theatre of Epidauros. Each point
represents the average of the values at 500Hz and 1000Hz octave bands, for the specific source-
receiver setup [8].
0,00
0,20
0,40
0,60
0,80
1,00
1,20
1,40
100 1000 10000
Frequency [Hz]
Reverberation Tim
e, T30 [sec]
S1
S2
S3
Figure 5.5: Reverberation Time (T30) versus frequency at the Theatre of Epidauros. Each point
represents the average of the values measured in all receiver positions, for the specific octave
band. The different colors indicate the position of the sound source; blue, pink, green correspond
S1, S2 and S3, respectively.
Measurements and Simulations
34
The source positions S2 and S3 were chosen to be placed at the positions where
(according to Vitruvius) the actors were performing in the ancient times. It was
attempted to investigate whether by positioning the sound sources at the specific
positions would have a positive effect in the acoustical behavior of the theatre. Under
the present conditions of the theatre (absence of skene) this does not seem to be the
case. According to our data the source position does not affect the acoustical
properties of the Theatre of Epidauros, except from an increase in T30 values when
the source is positioned on the orchestra. However, this could be an improvement for
performing music (since T30 is already too low for musical performance) but as far as
speech is concerned any source position would be just as good in terms of
intelligibility.
Last but not least, taking into consideration the results obtained from source position
S3 it is clear that outdoor measurements depend on factors that apart from the fact that
they are frequently impossible to either predict or control, their effects are difficult to
be investigated.
Measurements and Simulations
35
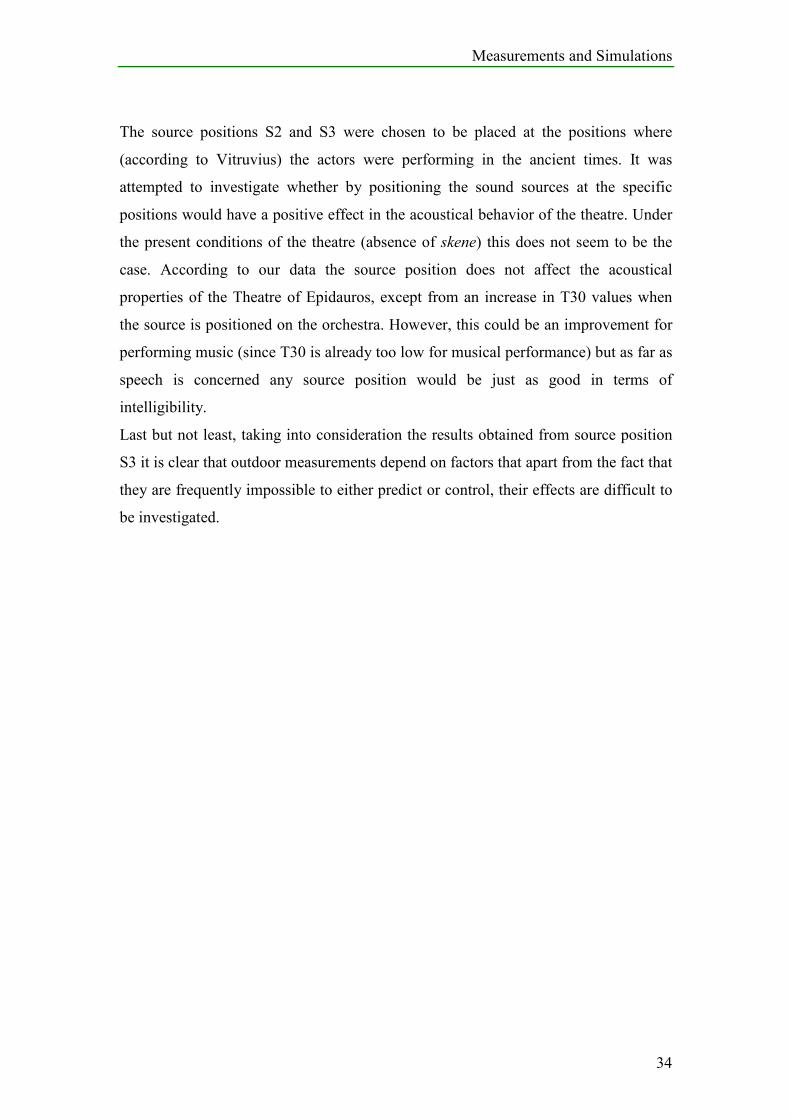
5.1.2. Evaluation of the model
Based on the previous analysis on the effect of source positions it was decided to
position the source on the orchestra, in the model of the Theatre of Epidauros. Thus,
in the analysis that follows the measured data that were obtained from this specific
source position will be presented and compared with the simulated results.
In order to evaluate the model, the receiver positions were chosen to be the same as in
the measurements. In the following graphs, it possible to compare the values given by
the ODEON model and the values obtained by the measurements.
0,00
0,20
0,40
0,60
0,80
1,00
1,20
1,40
1,60
100 1000 10000
Frequency [Hz]
Reverberation Tim
e, T30 [sec]
Figure 5.6: Reverberation Time (T30) versus frequency at the Theatre of Epidauros. The source
is positioned in the center of the orchestra. Each point represents the average of the values
measured in all receiver positions, for the specific octave band. The pink and blue line, indicate
the measured and simulated values, respectively.
According to the measurements, the Reverberation time of the theatre is around 1,3
seconds in all frequencies from 125Hz to 2000kHz. Background noise from cicadas
affected the measurements at 4000kHz, giving extremely high values (around 5-6 sec)
at this specific frequency band. Thus, those values where omitted from the presented
results.
The results from the model are in accordance to the ones of the measurements
especially in the frequency range from 500 to 2000Hz.
Measurements and Simulations
36
-20
-15
-10
-5
0
5
100 1000 10000
Frequency [Hz]
Strength, G [dB]
C5_measured C5_simulated C25_measured
C25_simulated Q15_measured Q15_simulated
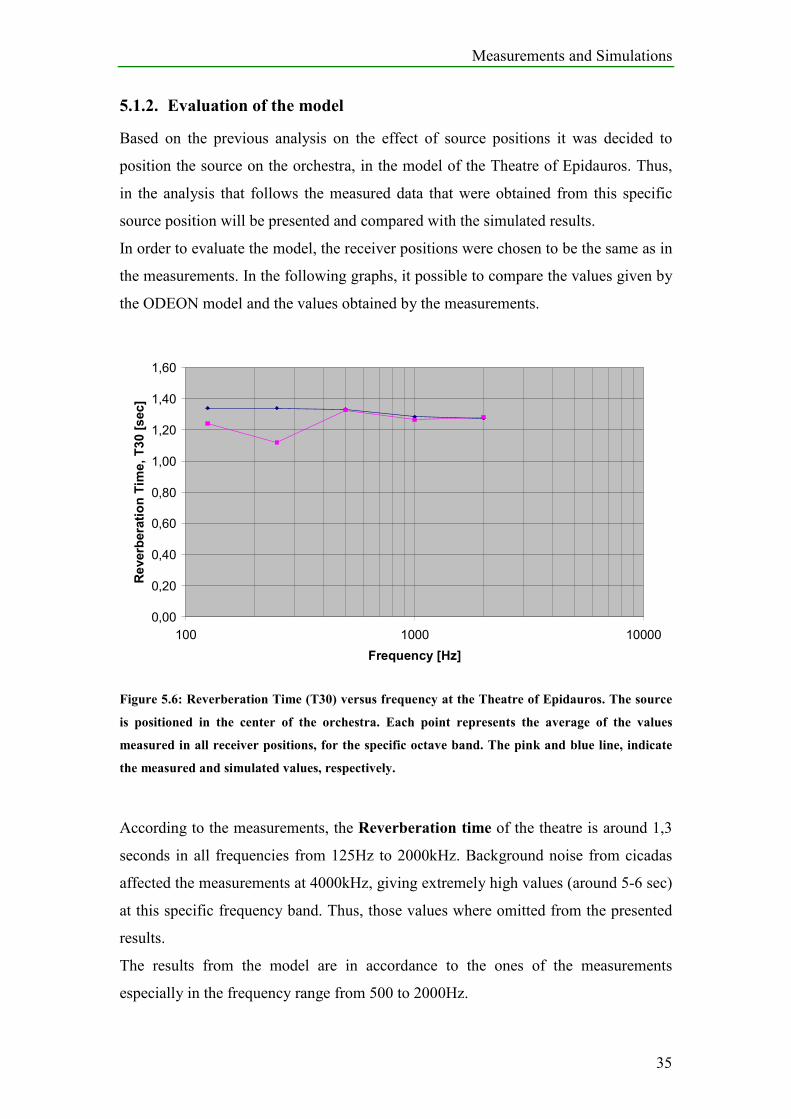
Figure 5.7: Strength (G) versus frequency for 3 different receiver positions at the Theatre of
Epidauros. The source is located in the center of the orchestra. The solid and dotted lines indicate
measured and simulated values, respectively.
In Figure 5.7 it possible to observe that the measured values for G at the 125Hz
octave band drop as the receiver moves to the upper rows. This could be due to the
fact that the phase shift between the direct sound and the orchestra floor reflections is
such that they interfere destructively when reaching the receiver positions. The sound
pressure level at those points (in the specific octave band) takes lower values than it
does in the other octave bands. A more detailed explanation of this phenomenon is
given in section 9.2 of the Appendix.
Above 500Hz, strength does not seem to depend strongly on frequency. According to
the measurements, in this frequency interval, strength is almost constant for a specific
receiver position. The values obtained from the simulation -with the exception of the
row which is closer to the source- are in general lower in the same interval. It is
possible to see that for C25 the computer simulation results and the measured data are
in quite good agreement.
Measurements and Simulations
37
0,00
0,20
0,40
0,60
0,80
1,00
1,20
1,40
1,60
1,80
0,00 10,00 20,00 30,00 40,00 50,00 60,00 70,00
Distance from source [m]
Reverberation Tim
e, T30 [sec]
Figure 5.8: Reverberation Time (T30) versus distance at the Theatre of Epidauros. The source is
positioned in the center of the orchestra. Each point represents the average of the values at
500Hz and 1000Hz octave bands, for the specific receiver position [8]. The pink and blue dots
indicate the measured and simulated values, respectively.
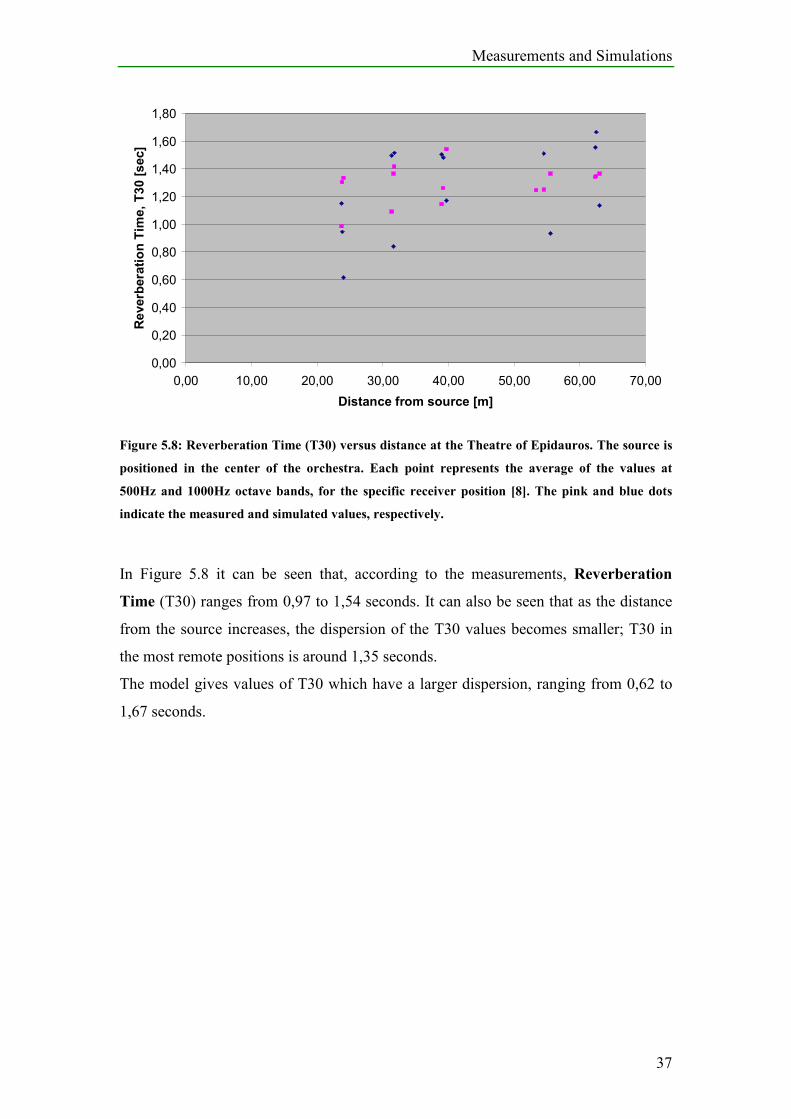
In Figure 5.8 it can be seen that, according to the measurements, Reverberation
Time (T30) ranges from 0,97 to 1,54 seconds. It can also be seen that as the distance
from the source increases, the dispersion of the T30 values becomes smaller; T30 in
the most remote positions is around 1,35 seconds.
The model gives values of T30 which have a larger dispersion, ranging from 0,62 to
1,67 seconds.
Measurements and Simulations
38
-14,00
-12,00
-10,00
-8,00
-6,00
-4,00
-2,00
0,00
2,00
4,00
0,00 10,00 20,00 30,00 40,00 50,00 60,00 70,00
Distance from source [m]
Strength, G [dB]
Figure 5.9: Strength (G) versus distance at the Theatre of Epidauros. The source is positioned in
the center of the orchestra. Each point represents the average of the values at 500Hz and 1000Hz
octave bands, for the specific receiver position [8]. The pink and blue dots indicate the measured
and simulated values, respectively.
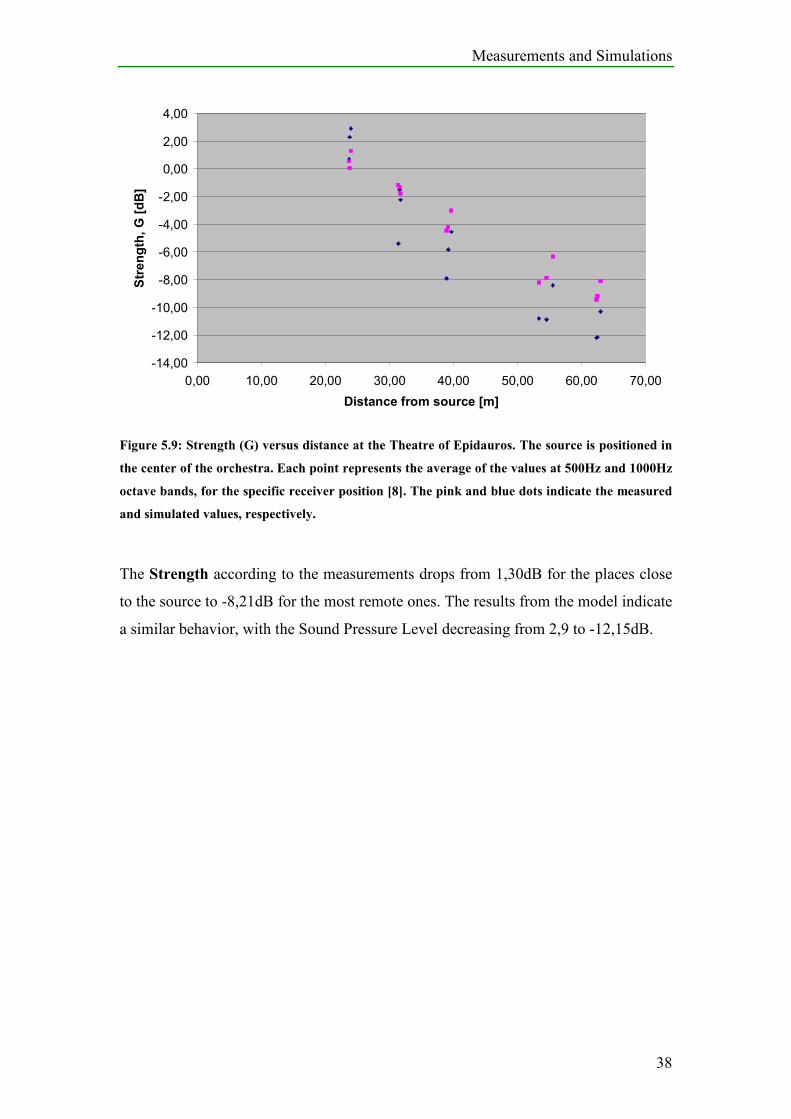
The Strength according to the measurements drops from 1,30dB for the places close
to the source to -8,21dB for the most remote ones. The results from the model indicate
a similar behavior, with the Sound Pressure Level decreasing from 2,9 to -12,15dB.
Measurements and Simulations
39
0,00
0,20
0,40
0,60
0,80
1,00
1,20
1,40
1,60
1,80
0,00 10,00 20,00 30,00 40,00 50,00 60,00 70,00
Distance from source [m]
Early Decay Tim
e, EDT [sec]
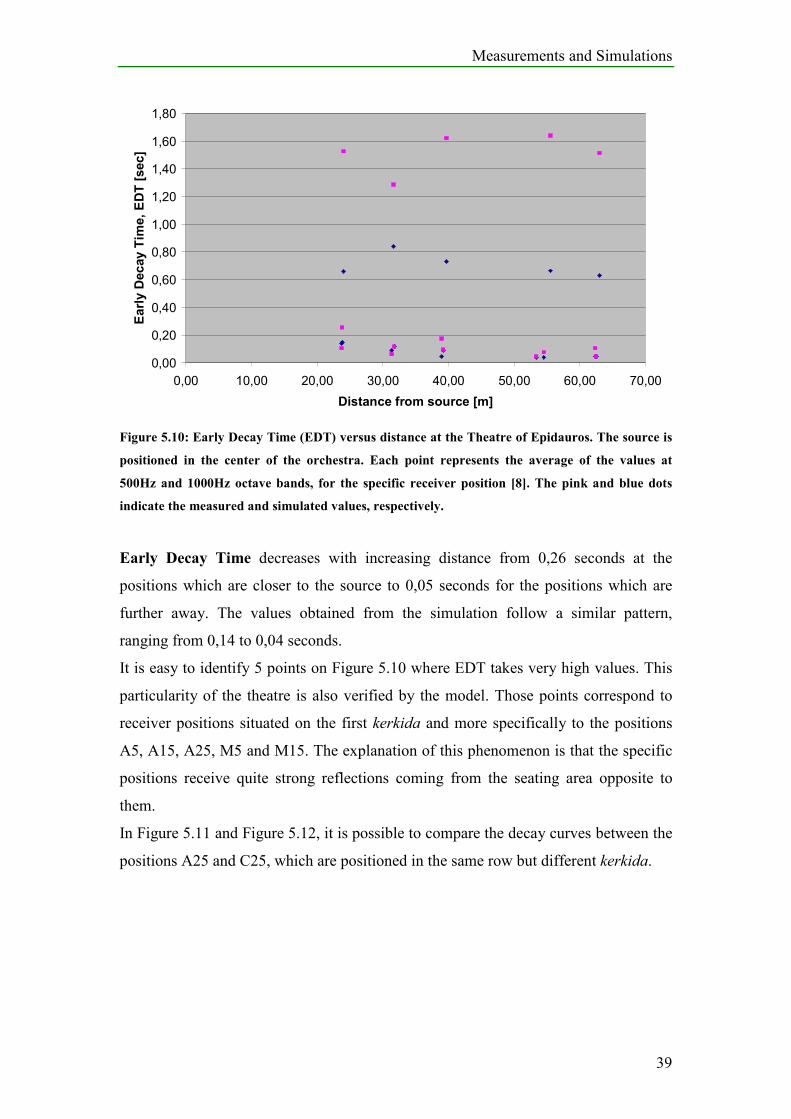
Figure 5.10: Early Decay Time (EDT) versus distance at the Theatre of Epidauros. The source is
positioned in the center of the orchestra. Each point represents the average of the values at
500Hz and 1000Hz octave bands, for the specific receiver position [8]. The pink and blue dots
indicate the measured and simulated values, respectively.
Early Decay Time decreases with increasing distance from 0,26 seconds at the
positions which are closer to the source to 0,05 seconds for the positions which are
further away. The values obtained from the simulation follow a similar pattern,
ranging from 0,14 to 0,04 seconds.
It is easy to identify 5 points on Figure 5.10 where EDT takes very high values. This
particularity of the theatre is also verified by the model. Those points correspond to
receiver positions situated on the first kerkida and more specifically to the positions
A5, A15, A25, M5 and M15. The explanation of this phenomenon is that the specific
positions receive quite strong reflections coming from the seating area opposite to
them.
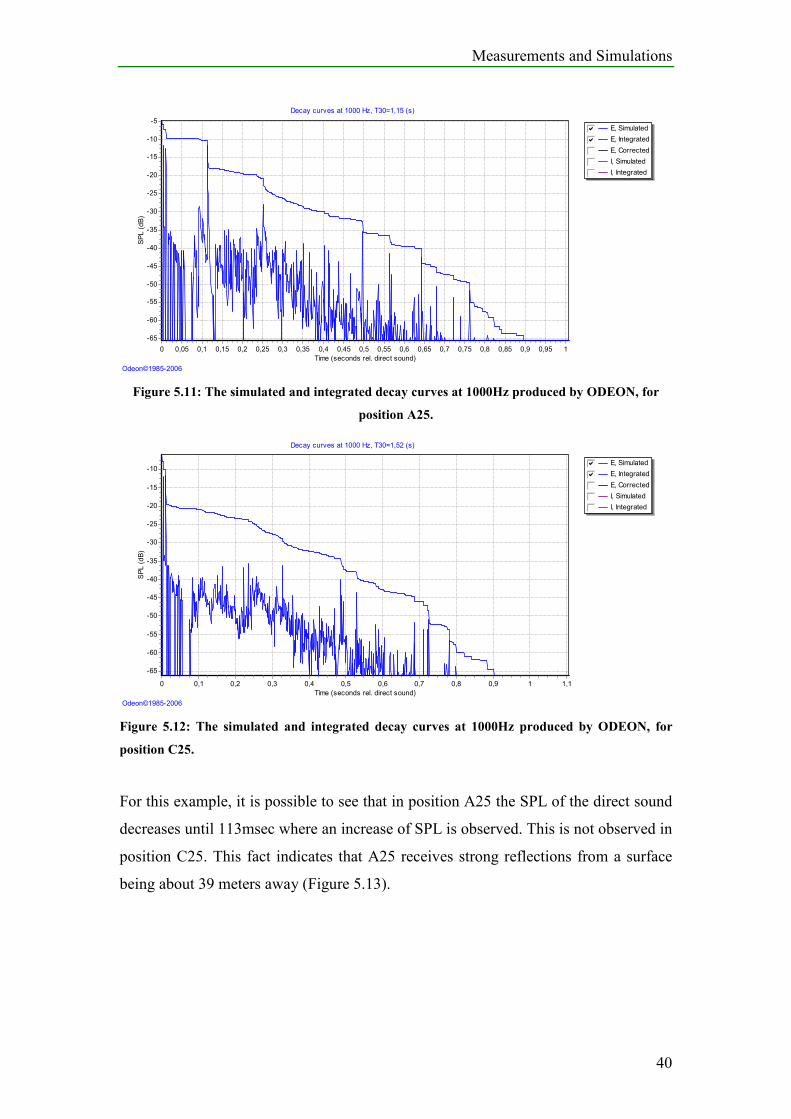
In Figure 5.11 and Figure 5.12, it is possible to compare the decay curves between the
positions A25 and C25, which are positioned in the same row but different kerkida.
Measurements and Simulations
40
E, SimulatedgfedcbE, IntegratedgfedcbE, CorrectedgfedcI, SimulatedgfedcI, Integratedgfedc
Decay curves at 1000 Hz, T30=1,15 (s)
Time (seconds rel. direct sound)
10,950,90,850,80,750,70,650,60,550,50,450,40,350,30,250,20,150,10,050
SPL (dB)
-5
-10
-15
-20
-25
-30
-35
-40
-45
-50
-55
-60
-65
Odeon©1985-2006
Figure 5.11: The simulated and integrated decay curves at 1000Hz produced by ODEON, for
position A25.
E, SimulatedgfedcbE, IntegratedgfedcbE, CorrectedgfedcI, SimulatedgfedcI, Integratedgfedc
Decay curves at 1000 Hz, T30=1,52 (s)
Time (seconds rel. direct sound)
1,110,90,80,70,60,50,40,30,20,10
SPL (dB)
-10
-15
-20
-25
-30
-35
-40
-45
-50
-55
-60
-65
Odeon©1985-2006
Figure 5.12: The simulated and integrated decay curves at 1000Hz produced by ODEON, for
position C25.
For this example, it is possible to see that in position A25 the SPL of the direct sound
decreases until 113msec where an increase of SPL is observed. This is not observed in
position C25. This fact indicates that A25 receives strong reflections from a surface
being about 39 meters away (Figure 5.13).
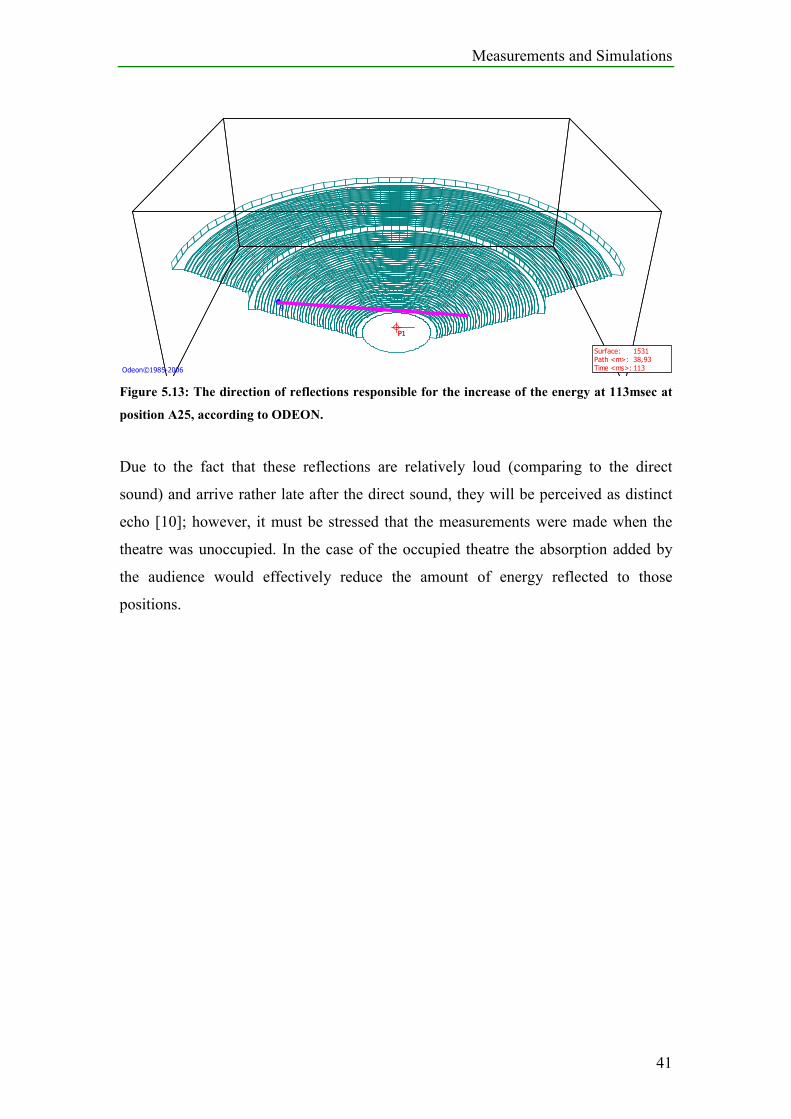
Measurements and Simulations
41
P1
9
P1
Surface: 1531
Path <m>: 38,93
Time <ms>: 113Odeon©1985-2006
Figure 5.13: The direction of reflections responsible for the increase of the energy at 113msec at
position A25, according to ODEON.
Due to the fact that these reflections are relatively loud (comparing to the direct
sound) and arrive rather late after the direct sound, they will be perceived as distinct
echo [10]; however, it must be stressed that the measurements were made when the
theatre was unoccupied. In the case of the occupied theatre the absorption added by
the audience would effectively reduce the amount of energy reflected to those
positions.
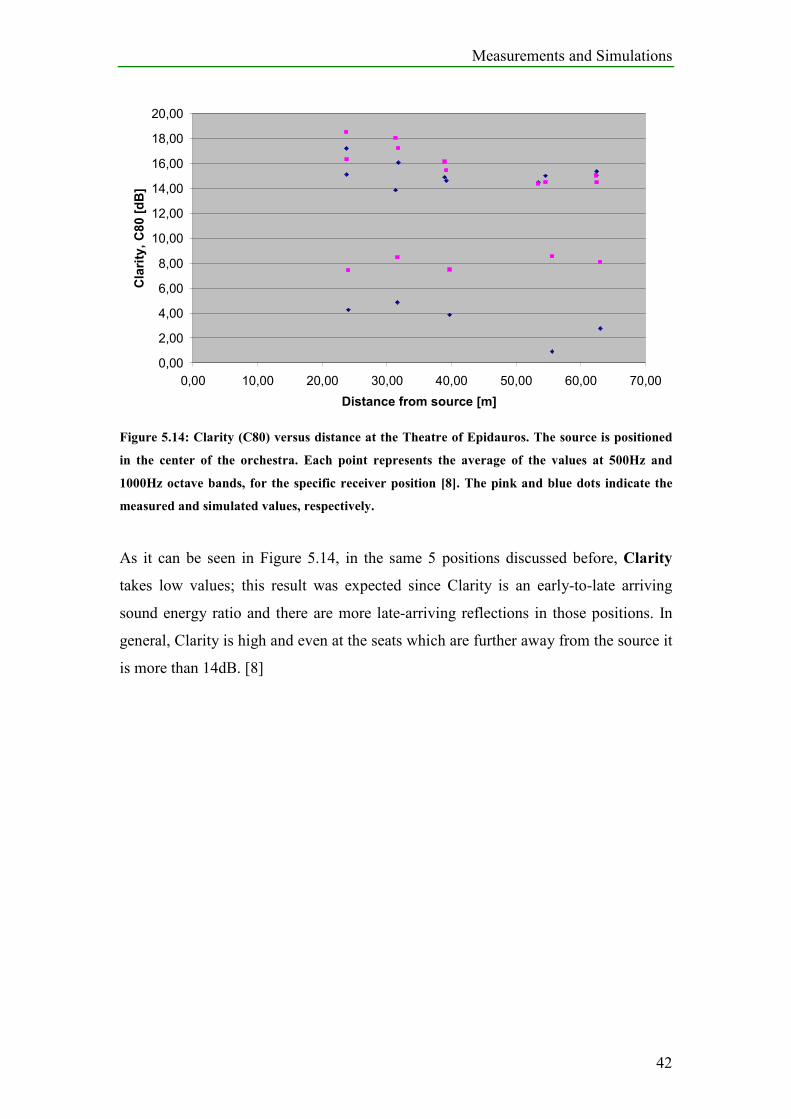
Measurements and Simulations
42
0,00
2,00
4,00
6,00
8,00
10,00
12,00
14,00
16,00
18,00
20,00
0,00 10,00 20,00 30,00 40,00 50,00 60,00 70,00
Distance from source [m]
Clarity, C80 [dB]
Figure 5.14: Clarity (C80) versus distance at the Theatre of Epidauros. The source is positioned
in the center of the orchestra. Each point represents the average of the values at 500Hz and
1000Hz octave bands, for the specific receiver position [8]. The pink and blue dots indicate the
measured and simulated values, respectively.
As it can be seen in Figure 5.14, in the same 5 positions discussed before, Clarity
takes low values; this result was expected since Clarity is an early-to-late arriving
sound energy ratio and there are more late-arriving reflections in those positions. In
general, Clarity is high and even at the seats which are further away from the source it
is more than 14dB. [8]
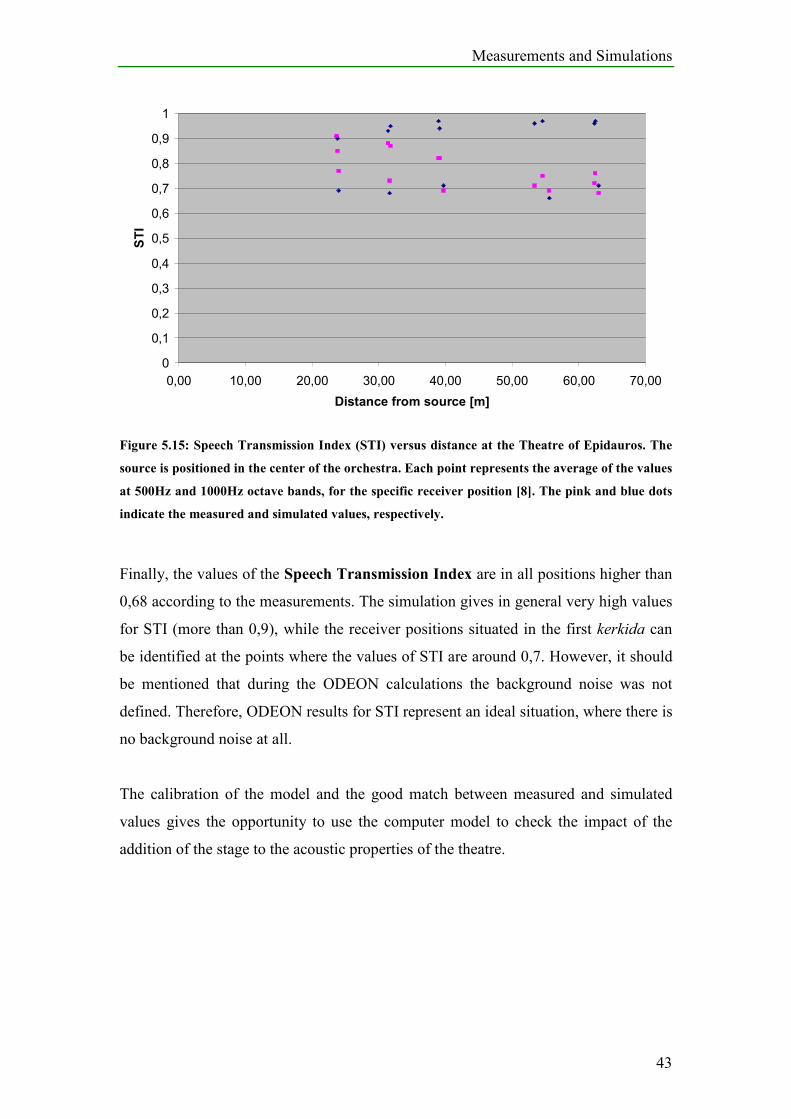
Measurements and Simulations
43
0
0,1
0,2
0,3
0,4
0,5
0,6
0,7
0,8
0,9
1
0,00 10,00 20,00 30,00 40,00 50,00 60,00 70,00
Distance from source [m]
STI
Figure 5.15: Speech Transmission Index (STI) versus distance at the Theatre of Epidauros. The
source is positioned in the center of the orchestra. Each point represents the average of the values
at 500Hz and 1000Hz octave bands, for the specific receiver position [8]. The pink and blue dots
indicate the measured and simulated values, respectively.
Finally, the values of the Speech Transmission Index are in all positions higher than
0,68 according to the measurements. The simulation gives in general very high values
for STI (more than 0,9), while the receiver positions situated in the first kerkida can
be identified at the points where the values of STI are around 0,7. However, it should
be mentioned that during the ODEON calculations the background noise was not
defined. Therefore, ODEON results for STI represent an ideal situation, where there is
no background noise at all.
The calibration of the model and the good match between measured and simulated
values gives the opportunity to use the computer model to check the impact of the
addition of the stage to the acoustic properties of the theatre.
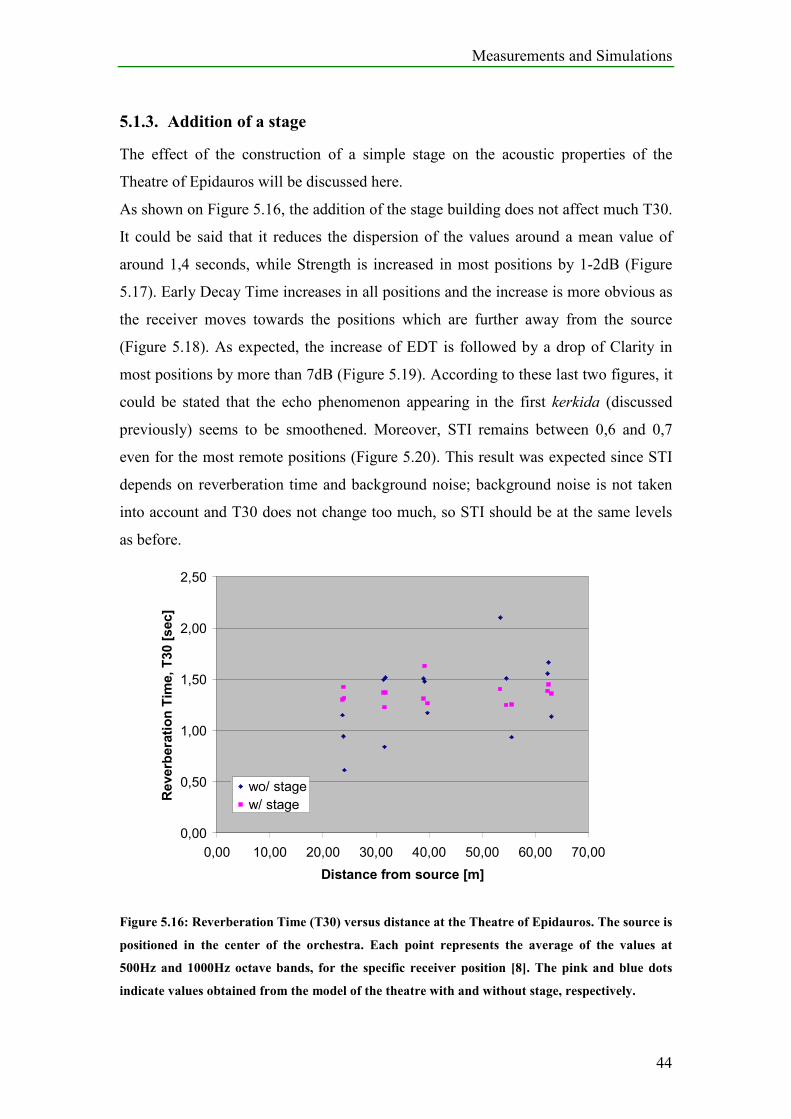
Measurements and Simulations
44
5.1.3. Addition of a stage
The effect of the construction of a simple stage on the acoustic properties of the
Theatre of Epidauros will be discussed here.
As shown on Figure 5.16, the addition of the stage building does not affect much T30.
It could be said that it reduces the dispersion of the values around a mean value of
around 1,4 seconds, while Strength is increased in most positions by 1-2dB (Figure
5.17). Early Decay Time increases in all positions and the increase is more obvious as
the receiver moves towards the positions which are further away from the source
(Figure 5.18). As expected, the increase of EDT is followed by a drop of Clarity in
most positions by more than 7dB (Figure 5.19). According to these last two figures, it
could be stated that the echo phenomenon appearing in the first kerkida (discussed
previously) seems to be smoothened. Moreover, STI remains between 0,6 and 0,7
even for the most remote positions (Figure 5.20). This result was expected since STI
depends on reverberation time and background noise; background noise is not taken
into account and T30 does not change too much, so STI should be at the same levels
as before.
0,00
0,50
1,00
1,50
2,00
2,50
0,00 10,00 20,00 30,00 40,00 50,00 60,00 70,00
Distance from source [m]
Reverberation Tim
e, T30 [sec]
wo/ stage
w/ stage
Figure 5.16: Reverberation Time (T30) versus distance at the Theatre of Epidauros. The source is
positioned in the center of the orchestra. Each point represents the average of the values at
500Hz and 1000Hz octave bands, for the specific receiver position [8]. The pink and blue dots
indicate values obtained from the model of the theatre with and without stage, respectively.
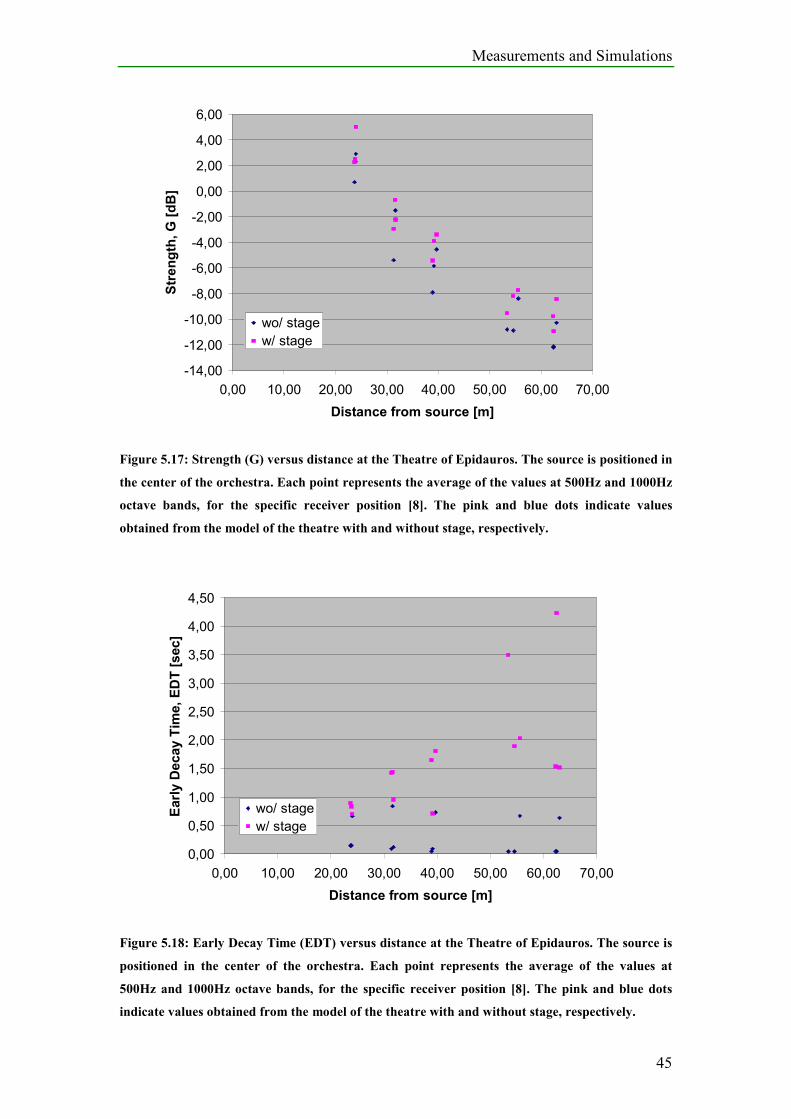
Measurements and Simulations
45
-14,00
-12,00
-10,00
-8,00
-6,00
-4,00
-2,00
0,00
2,00
4,00
6,00
0,00 10,00 20,00 30,00 40,00 50,00 60,00 70,00
Distance from source [m]
Strength, G [dB]
wo/ stage
w/ stage
Figure 5.17: Strength (G) versus distance at the Theatre of Epidauros. The source is positioned in
the center of the orchestra. Each point represents the average of the values at 500Hz and 1000Hz
octave bands, for the specific receiver position [8]. The pink and blue dots indicate values
obtained from the model of the theatre with and without stage, respectively.
0,00
0,50
1,00
1,50
2,00
2,50
3,00
3,50
4,00
4,50
0,00 10,00 20,00 30,00 40,00 50,00 60,00 70,00
Distance from source [m]
Early Decay Tim
e, EDT [sec]
wo/ stage
w/ stage
Figure 5.18: Early Decay Time (EDT) versus distance at the Theatre of Epidauros. The source is
positioned in the center of the orchestra. Each point represents the average of the values at
500Hz and 1000Hz octave bands, for the specific receiver position [8]. The pink and blue dots
indicate values obtained from the model of the theatre with and without stage, respectively.
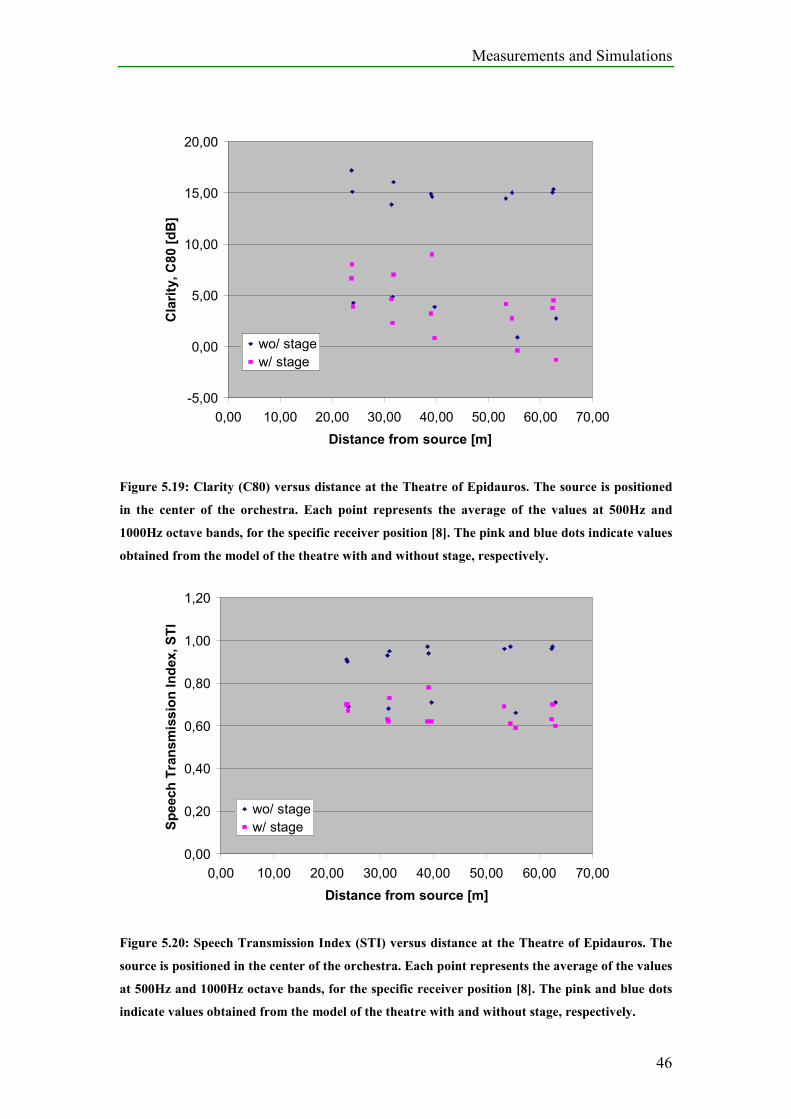
Measurements and Simulations
46
-5,00
0,00
5,00
10,00
15,00
20,00
0,00 10,00 20,00 30,00 40,00 50,00 60,00 70,00
Distance from source [m]
Clarity, C80 [dB]
wo/ stage
w/ stage
Figure 5.19: Clarity (C80) versus distance at the Theatre of Epidauros. The source is positioned
in the center of the orchestra. Each point represents the average of the values at 500Hz and
1000Hz octave bands, for the specific receiver position [8]. The pink and blue dots indicate values
obtained from the model of the theatre with and without stage, respectively.
0,00
0,20
0,40
0,60
0,80
1,00
1,20
0,00 10,00 20,00 30,00 40,00 50,00 60,00 70,00
Distance from source [m]
Speech Transmission Index, STI
wo/ stage
w/ stage
Figure 5.20: Speech Transmission Index (STI) versus distance at the Theatre of Epidauros. The
source is positioned in the center of the orchestra. Each point represents the average of the values
at 500Hz and 1000Hz octave bands, for the specific receiver position [8]. The pink and blue dots
indicate values obtained from the model of the theatre with and without stage, respectively.
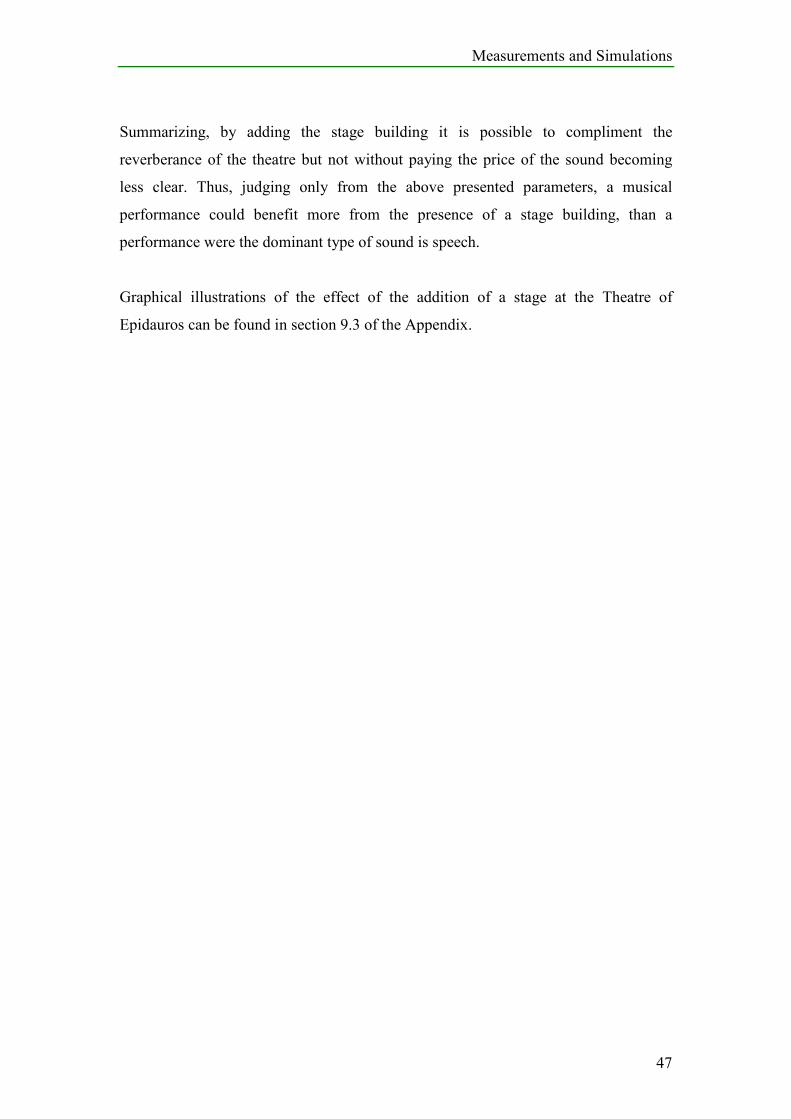
Measurements and Simulations
47
Summarizing, by adding the stage building it is possible to compliment the
reverberance of the theatre but not without paying the price of the sound becoming
less clear. Thus, judging only from the above presented parameters, a musical
performance could benefit more from the presence of a stage building, than a
performance were the dominant type of sound is speech.
Graphical illustrations of the effect of the addition of a stage at the Theatre of
Epidauros can be found in section 9.3 of the Appendix.
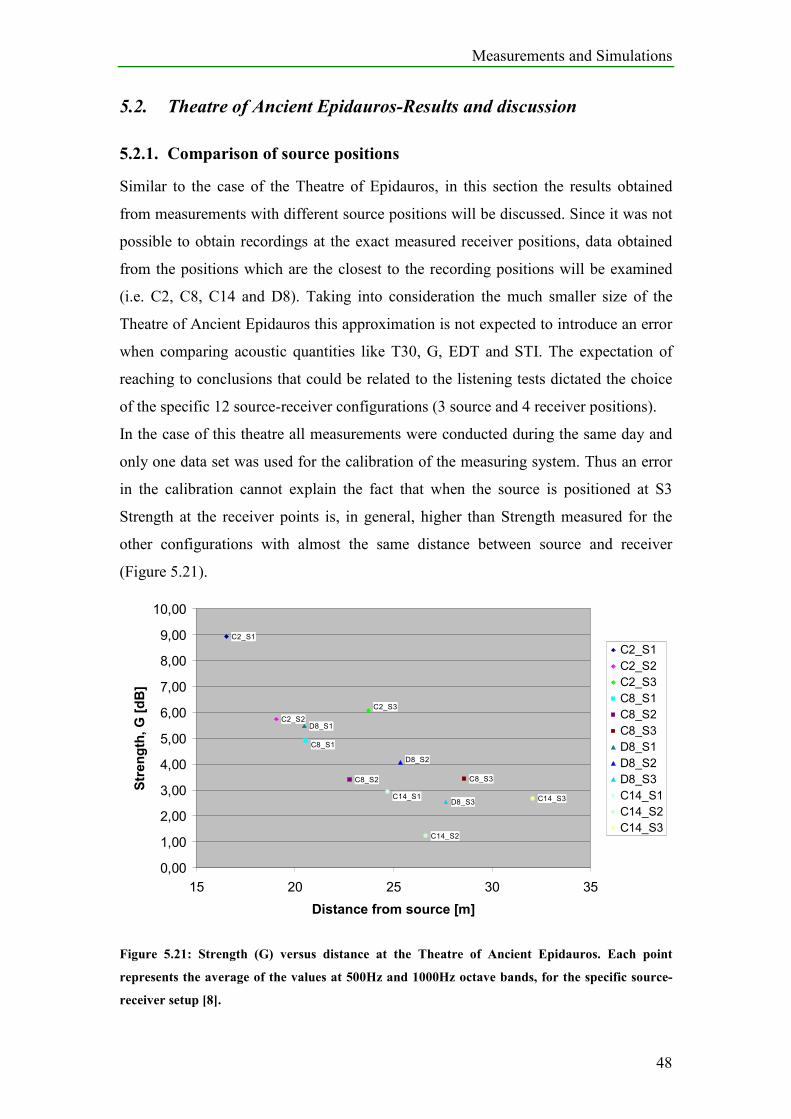
Measurements and Simulations
48
5.2. Theatre of Ancient Epidauros-Results and discussion
5.2.1. Comparison of source positions
Similar to the case of the Theatre of Epidauros, in this section the results obtained
from measurements with different source positions will be discussed. Since it was not
possible to obtain recordings at the exact measured receiver positions, data obtained
from the positions which are the closest to the recording positions will be examined
(i.e. C2, C8, C14 and D8). Taking into consideration the much smaller size of the
Theatre of Ancient Epidauros this approximation is not expected to introduce an error
when comparing acoustic quantities like T30, G, EDT and STI. The expectation of
reaching to conclusions that could be related to the listening tests dictated the choice
of the specific 12 source-receiver configurations (3 source and 4 receiver positions).
In the case of this theatre all measurements were conducted during the same day and
only one data set was used for the calibration of the measuring system. Thus an error
in the calibration cannot explain the fact that when the source is positioned at S3
Strength at the receiver points is, in general, higher than Strength measured for the
other configurations with almost the same distance between source and receiver
(Figure 5.21).
C2_S1
C2_S2
C8_S2 C8_S3
D8_S1
D8_S3
C14_S2
C14_S3
C2_S3
C8_S1
D8_S2
C14_S1
0,00
1,00
2,00
3,00
4,00
5,00
6,00
7,00
8,00
9,00
10,00
15 20 25 30 35
Distance from source [m]
Strength, G [dB]
C2_S1
C2_S2
C2_S3
C8_S1
C8_S2
C8_S3
D8_S1
D8_S2
D8_S3
C14_S1
C14_S2
C14_S3
Figure 5.21: Strength (G) versus distance at the Theatre of Ancient Epidauros. Each point
represents the average of the values at 500Hz and 1000Hz octave bands, for the specific source-
receiver setup [8].
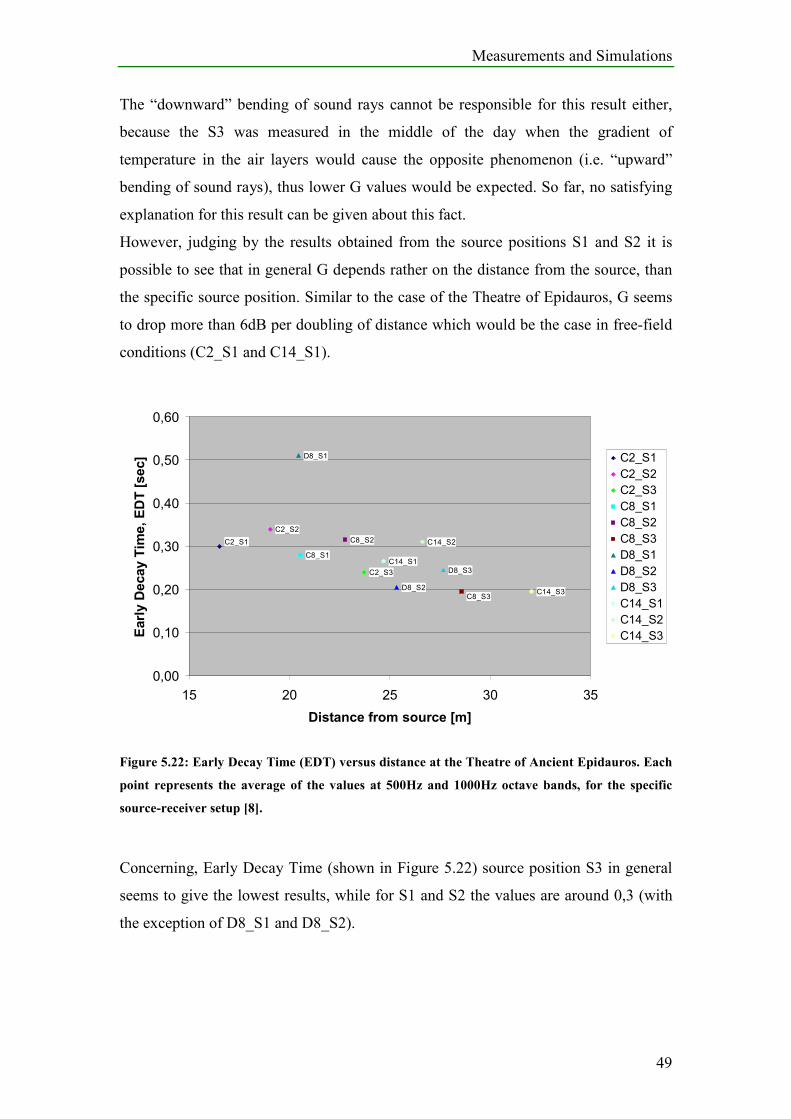
Measurements and Simulations
49
The “downward” bending of sound rays cannot be responsible for this result either,
because the S3 was measured in the middle of the day when the gradient of
temperature in the air layers would cause the opposite phenomenon (i.e. “upward”
bending of sound rays), thus lower G values would be expected. So far, no satisfying
explanation for this result can be given about this fact.
However, judging by the results obtained from the source positions S1 and S2 it is
possible to see that in general G depends rather on the distance from the source, than
the specific source position. Similar to the case of the Theatre of Epidauros, G seems
to drop more than 6dB per doubling of distance which would be the case in free-field
conditions (C2_S1 and C14_S1).
C2_S2
C2_S3
C8_S1
C8_S2
D8_S1
D8_S2
D8_S3
C14_S1
C14_S2
C14_S3
C2_S1
C8_S3
0,00
0,10
0,20
0,30
0,40
0,50
0,60
15 20 25 30 35
Distance from source [m]
Early Decay Tim
e, EDT [sec] C2_S1
C2_S2
C2_S3
C8_S1
C8_S2
C8_S3
D8_S1
D8_S2
D8_S3
C14_S1
C14_S2
C14_S3
Figure 5.22: Early Decay Time (EDT) versus distance at the Theatre of Ancient Epidauros. Each
point represents the average of the values at 500Hz and 1000Hz octave bands, for the specific
source-receiver setup [8].
Concerning, Early Decay Time (shown in Figure 5.22) source position S3 in general
seems to give the lowest results, while for S1 and S2 the values are around 0,3 (with
the exception of D8_S1 and D8_S2).
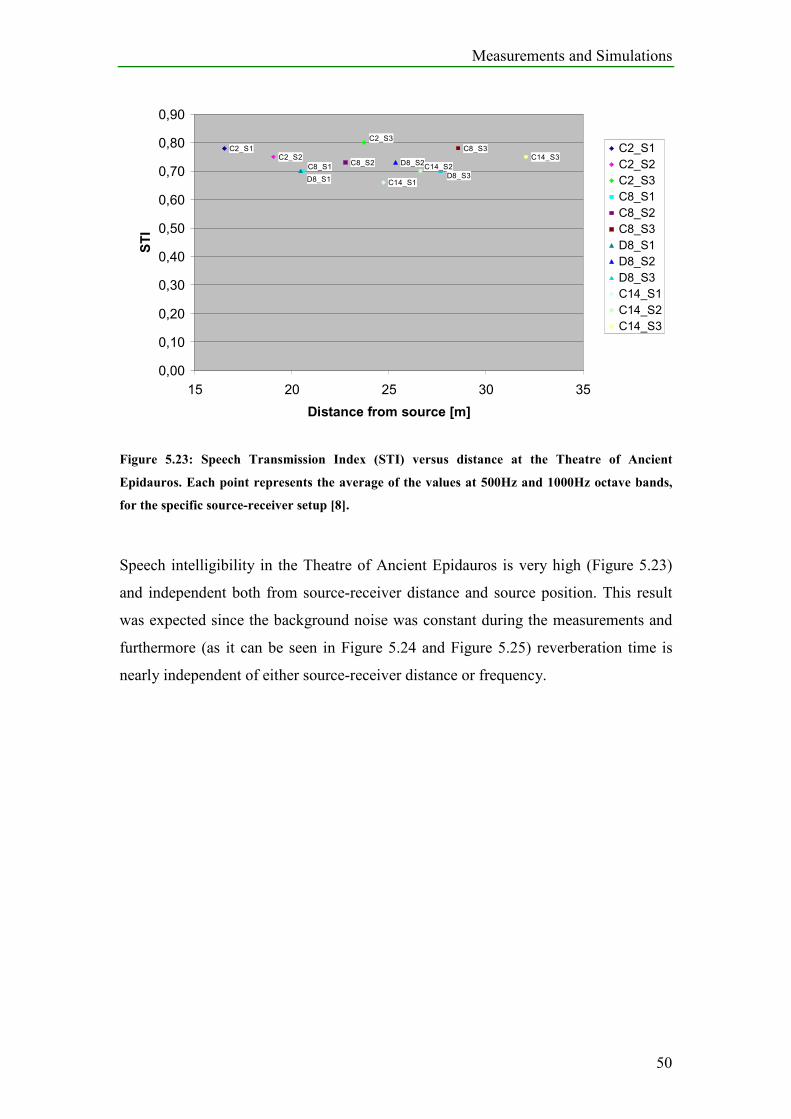
Measurements and Simulations
50
C2_S1C2_S2
C8_S2
C8_S3
D8_S2
C14_S1
C14_S3
C2_S3
C8_S1
D8_S1D8_S3
C14_S2
0,00
0,10
0,20
0,30
0,40
0,50
0,60
0,70
0,80
0,90
15 20 25 30 35
Distance from source [m]
STI
C2_S1
C2_S2
C2_S3
C8_S1
C8_S2
C8_S3
D8_S1
D8_S2
D8_S3
C14_S1
C14_S2
C14_S3
Figure 5.23: Speech Transmission Index (STI) versus distance at the Theatre of Ancient
Epidauros. Each point represents the average of the values at 500Hz and 1000Hz octave bands,
for the specific source-receiver setup [8].
Speech intelligibility in the Theatre of Ancient Epidauros is very high (Figure 5.23)
and independent both from source-receiver distance and source position. This result
was expected since the background noise was constant during the measurements and
furthermore (as it can be seen in Figure 5.24 and Figure 5.25) reverberation time is
nearly independent of either source-receiver distance or frequency.
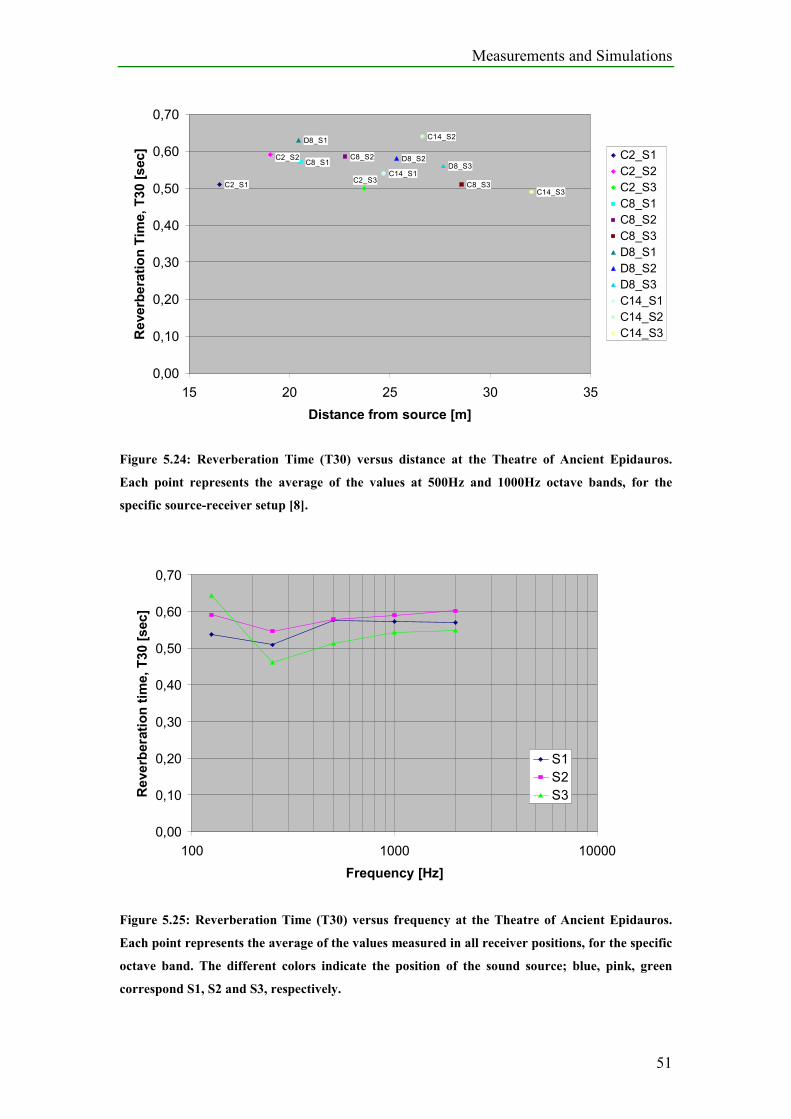
Measurements and Simulations
51
C2_S1
C8_S1C8_S2
C8_S3
D8_S1
D8_S2D8_S3
C14_S1
C14_S2
C14_S3
C2_S2
C2_S3
0,00
0,10
0,20
0,30
0,40
0,50
0,60
0,70
15 20 25 30 35
Distance from source [m]
Reverberation Tim
e, T30 [sec]
C2_S1
C2_S2
C2_S3
C8_S1
C8_S2
C8_S3
D8_S1
D8_S2
D8_S3
C14_S1
C14_S2
C14_S3
Figure 5.24: Reverberation Time (T30) versus distance at the Theatre of Ancient Epidauros.
Each point represents the average of the values at 500Hz and 1000Hz octave bands, for the
specific source-receiver setup [8].
0,00
0,10
0,20
0,30
0,40
0,50
0,60
0,70
100 1000 10000
Frequency [Hz]
Reverberation tim
e, T30 [sec]
S1
S2
S3
Figure 5.25: Reverberation Time (T30) versus frequency at the Theatre of Ancient Epidauros.
Each point represents the average of the values measured in all receiver positions, for the specific
octave band. The different colors indicate the position of the sound source; blue, pink, green
correspond S1, S2 and S3, respectively.
Measurements and Simulations
52
In this section it was attempted to investigate whether the source position could have
an effect in the acoustical behavior of the Theatre of Ancient Epidauros. Under the
present conditions of the theatre (absence of skene) this does not seem to be the case.
The Theatre of Ancient Epidauros is “dry”, in terms of reverberance, and taking into
account that both Strength and STI are high in all receiver positions, it is (in its
present conditions) more suitable for performances where the main type of sound is
speech.
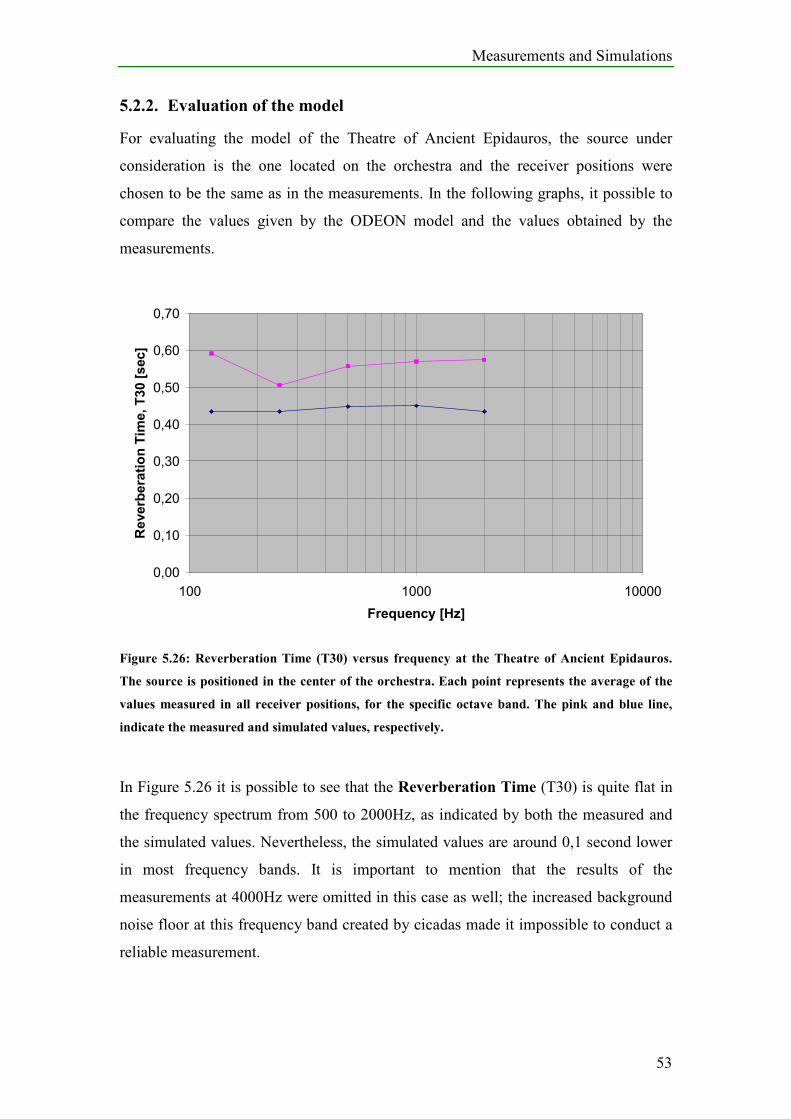
Measurements and Simulations
53
5.2.2. Evaluation of the model
For evaluating the model of the Theatre of Ancient Epidauros, the source under
consideration is the one located on the orchestra and the receiver positions were
chosen to be the same as in the measurements. In the following graphs, it possible to
compare the values given by the ODEON model and the values obtained by the
measurements.
0,00
0,10
0,20
0,30
0,40
0,50
0,60
0,70
100 1000 10000
Frequency [Hz]
Reverberation Tim
e, T30 [sec]
Figure 5.26: Reverberation Time (T30) versus frequency at the Theatre of Ancient Epidauros.
The source is positioned in the center of the orchestra. Each point represents the average of the
values measured in all receiver positions, for the specific octave band. The pink and blue line,
indicate the measured and simulated values, respectively.
In Figure 5.26 it is possible to see that the Reverberation Time (T30) is quite flat in
the frequency spectrum from 500 to 2000Hz, as indicated by both the measured and
the simulated values. Nevertheless, the simulated values are around 0,1 second lower
in most frequency bands. It is important to mention that the results of the
measurements at 4000Hz were omitted in this case as well; the increased background
noise floor at this frequency band created by cicadas made it impossible to conduct a
reliable measurement.
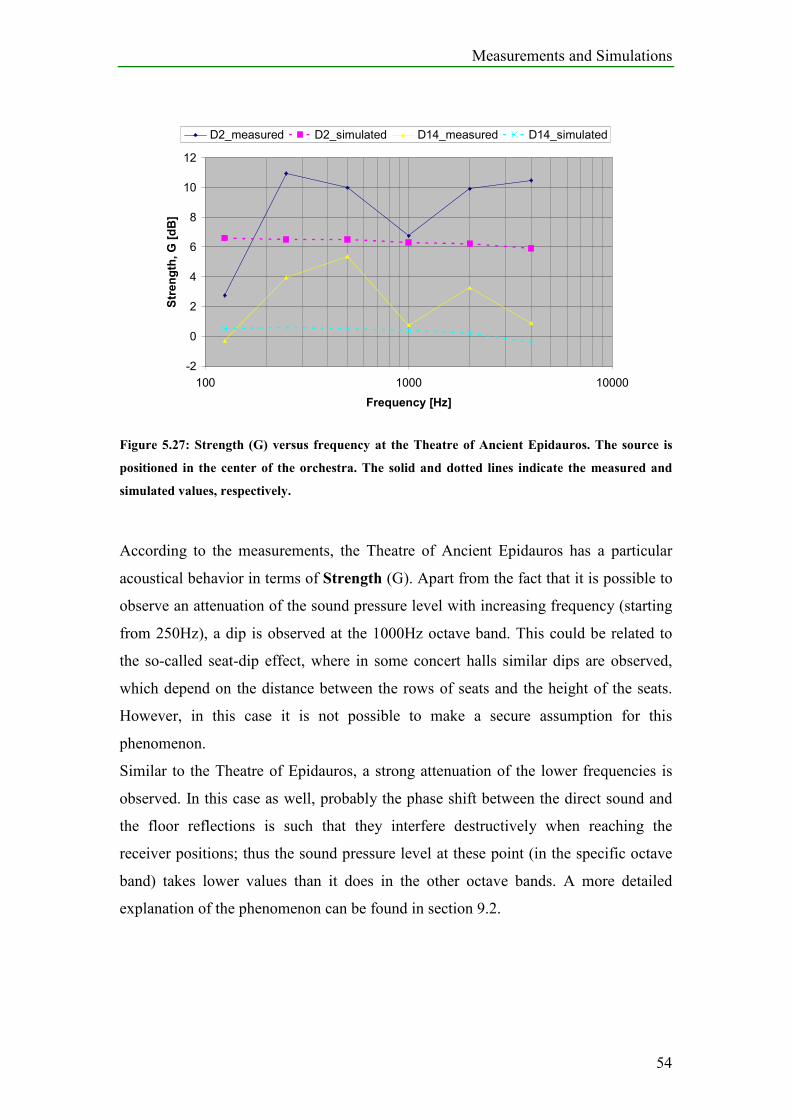
Measurements and Simulations
54
-2
0
2
4
6
8
10
12
100 1000 10000
Frequency [Hz]
Strength, G [dB]
D2_measured D2_simulated D14_measured D14_simulated
Figure 5.27: Strength (G) versus frequency at the Theatre of Ancient Epidauros. The source is
positioned in the center of the orchestra. The solid and dotted lines indicate the measured and
simulated values, respectively.
According to the measurements, the Theatre of Ancient Epidauros has a particular
acoustical behavior in terms of Strength (G). Apart from the fact that it is possible to
observe an attenuation of the sound pressure level with increasing frequency (starting
from 250Hz), a dip is observed at the 1000Hz octave band. This could be related to
the so-called seat-dip effect, where in some concert halls similar dips are observed,
which depend on the distance between the rows of seats and the height of the seats.
However, in this case it is not possible to make a secure assumption for this
phenomenon.
Similar to the Theatre of Epidauros, a strong attenuation of the lower frequencies is
observed. In this case as well, probably the phase shift between the direct sound and
the floor reflections is such that they interfere destructively when reaching the
receiver positions; thus the sound pressure level at these point (in the specific octave
band) takes lower values than it does in the other octave bands. A more detailed
explanation of the phenomenon can be found in section 9.2.
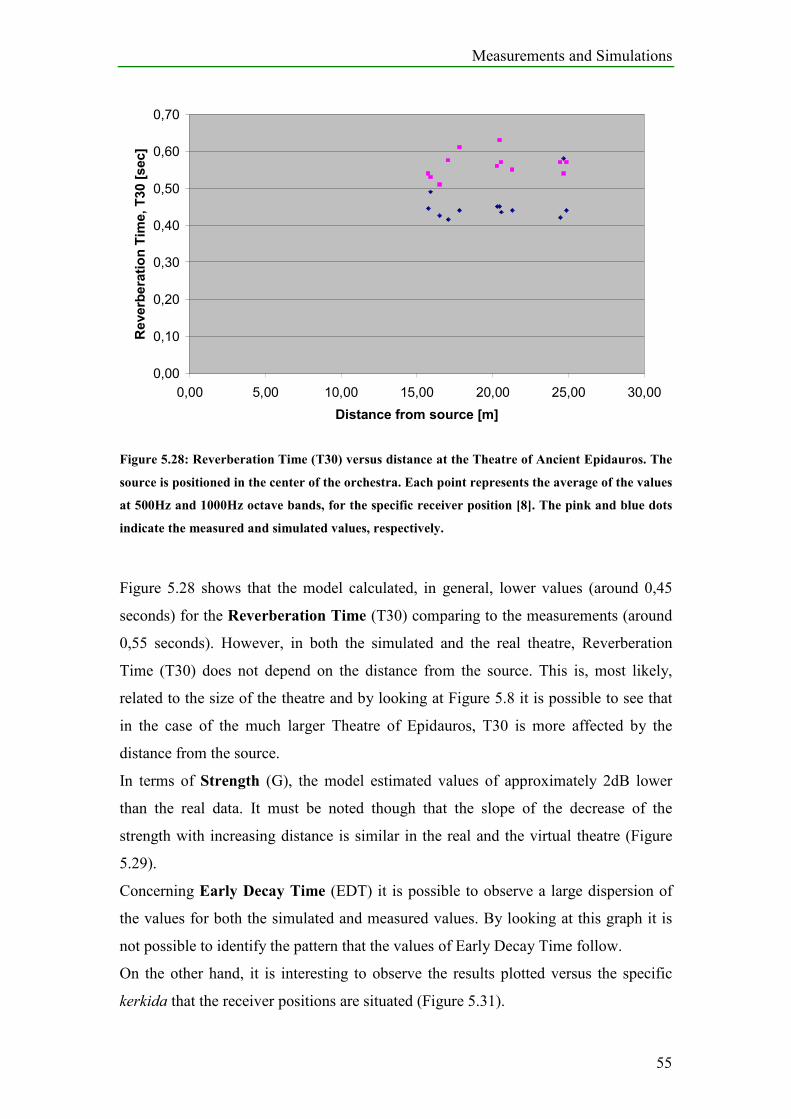
Measurements and Simulations
55
0,00
0,10
0,20
0,30
0,40
0,50
0,60
0,70
0,00 5,00 10,00 15,00 20,00 25,00 30,00
Distance from source [m]
Reverberation Tim
e, T30 [sec]
Figure 5.28: Reverberation Time (T30) versus distance at the Theatre of Ancient Epidauros. The
source is positioned in the center of the orchestra. Each point represents the average of the values
at 500Hz and 1000Hz octave bands, for the specific receiver position [8]. The pink and blue dots
indicate the measured and simulated values, respectively.
Figure 5.28 shows that the model calculated, in general, lower values (around 0,45
seconds) for the Reverberation Time (T30) comparing to the measurements (around
0,55 seconds). However, in both the simulated and the real theatre, Reverberation
Time (T30) does not depend on the distance from the source. This is, most likely,
related to the size of the theatre and by looking at Figure 5.8 it is possible to see that
in the case of the much larger Theatre of Epidauros, T30 is more affected by the
distance from the source.
In terms of Strength (G), the model estimated values of approximately 2dB lower
than the real data. It must be noted though that the slope of the decrease of the
strength with increasing distance is similar in the real and the virtual theatre (Figure
5.29).
Concerning Early Decay Time (EDT) it is possible to observe a large dispersion of
the values for both the simulated and measured values. By looking at this graph it is
not possible to identify the pattern that the values of Early Decay Time follow.
On the other hand, it is interesting to observe the results plotted versus the specific
kerkida that the receiver positions are situated (Figure 5.31).
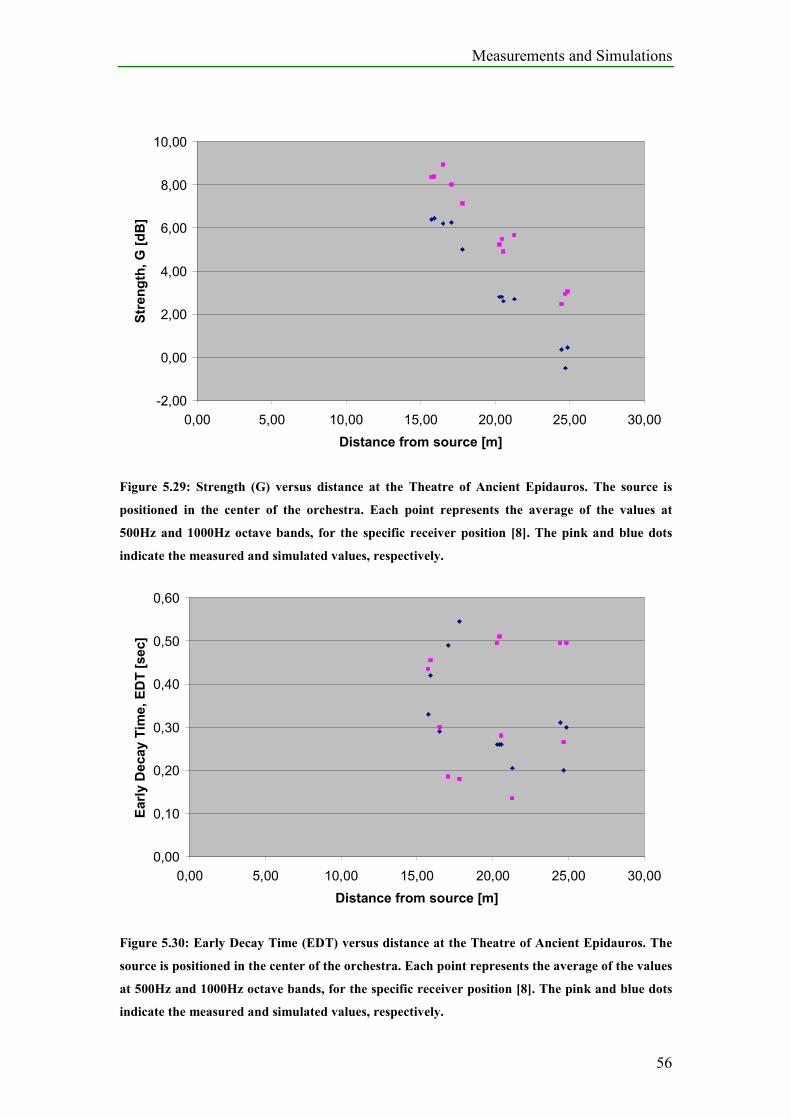
Measurements and Simulations
56
-2,00
0,00
2,00
4,00
6,00
8,00
10,00
0,00 5,00 10,00 15,00 20,00 25,00 30,00
Distance from source [m]
Strength, G [dB]
Figure 5.29: Strength (G) versus distance at the Theatre of Ancient Epidauros. The source is
positioned in the center of the orchestra. Each point represents the average of the values at
500Hz and 1000Hz octave bands, for the specific receiver position [8]. The pink and blue dots
indicate the measured and simulated values, respectively.
0,00
0,10
0,20
0,30
0,40
0,50
0,60
0,00 5,00 10,00 15,00 20,00 25,00 30,00
Distance from source [m]
Early Decay Tim
e, EDT [sec]
Figure 5.30: Early Decay Time (EDT) versus distance at the Theatre of Ancient Epidauros. The
source is positioned in the center of the orchestra. Each point represents the average of the values
at 500Hz and 1000Hz octave bands, for the specific receiver position [8]. The pink and blue dots
indicate the measured and simulated values, respectively.
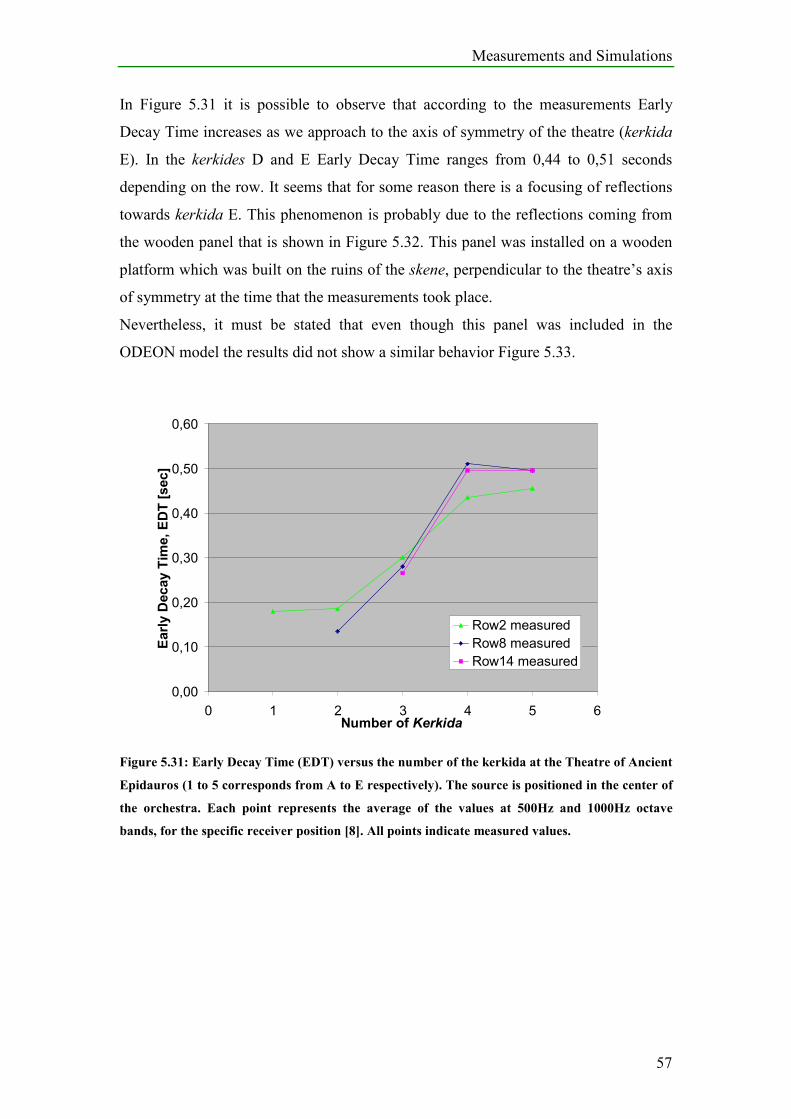
Measurements and Simulations
57
In Figure 5.31 it is possible to observe that according to the measurements Early
Decay Time increases as we approach to the axis of symmetry of the theatre (kerkida
E). In the kerkides D and E Early Decay Time ranges from 0,44 to 0,51 seconds
depending on the row. It seems that for some reason there is a focusing of reflections
towards kerkida E. This phenomenon is probably due to the reflections coming from
the wooden panel that is shown in Figure 5.32. This panel was installed on a wooden
platform which was built on the ruins of the skene, perpendicular to the theatre’s axis
of symmetry at the time that the measurements took place.
Nevertheless, it must be stated that even though this panel was included in the
ODEON model the results did not show a similar behavior Figure 5.33.
0,00
0,10
0,20
0,30
0,40
0,50
0,60
0 1 2 3 4 5 6Number of Kerkida
Early Decay Tim
e, EDT [sec]
Row2 measured
Row8 measured
Row14 measured
Figure 5.31: Early Decay Time (EDT) versus the number of the kerkida at the Theatre of Ancient
Epidauros (1 to 5 corresponds from A to E respectively). The source is positioned in the center of
the orchestra. Each point represents the average of the values at 500Hz and 1000Hz octave
bands, for the specific receiver position [8]. All points indicate measured values.
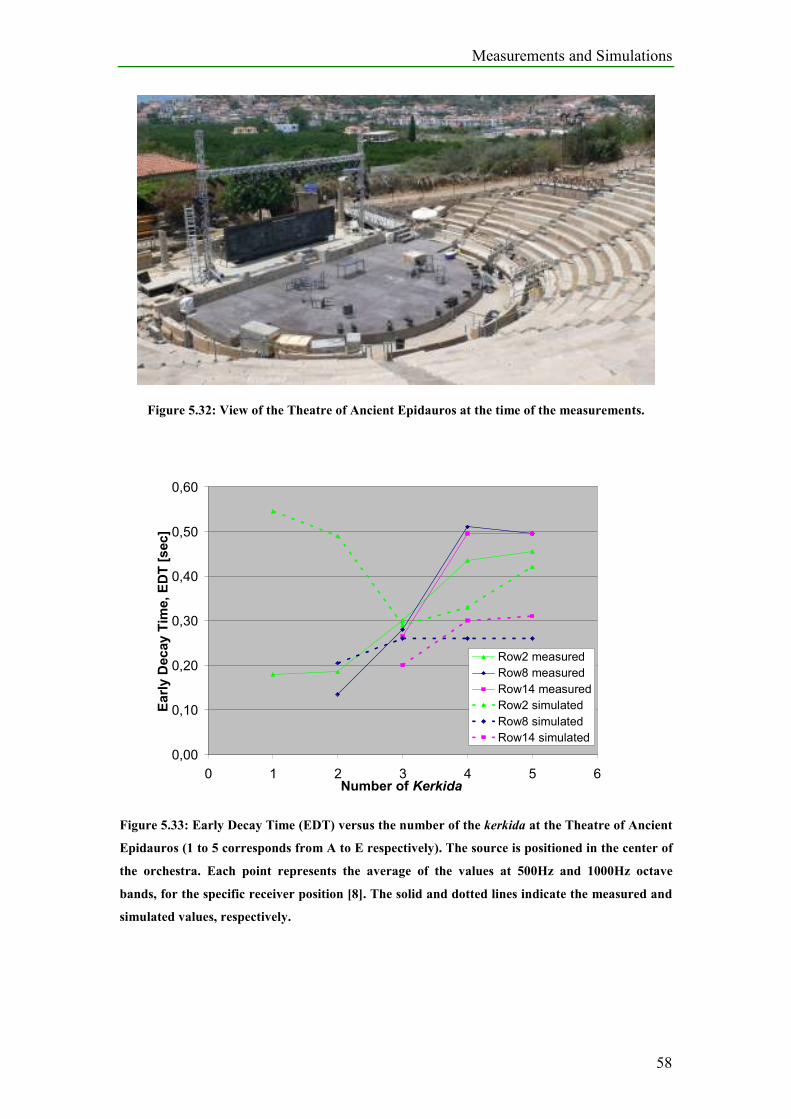
Measurements and Simulations
58
Figure 5.32: View of the Theatre of Ancient Epidauros at the time of the measurements.
0,00
0,10
0,20
0,30
0,40
0,50
0,60
0 1 2 3 4 5 6Number of Kerkida
Early Decay Tim
e, EDT [sec]
Row2 measured
Row8 measured
Row14 measured
Row2 simulated
Row8 simulated
Row14 simulated
Figure 5.33: Early Decay Time (EDT) versus the number of the kerkida at the Theatre of Ancient
Epidauros (1 to 5 corresponds from A to E respectively). The source is positioned in the center of
the orchestra. Each point represents the average of the values at 500Hz and 1000Hz octave
bands, for the specific receiver position [8]. The solid and dotted lines indicate the measured and
simulated values, respectively.
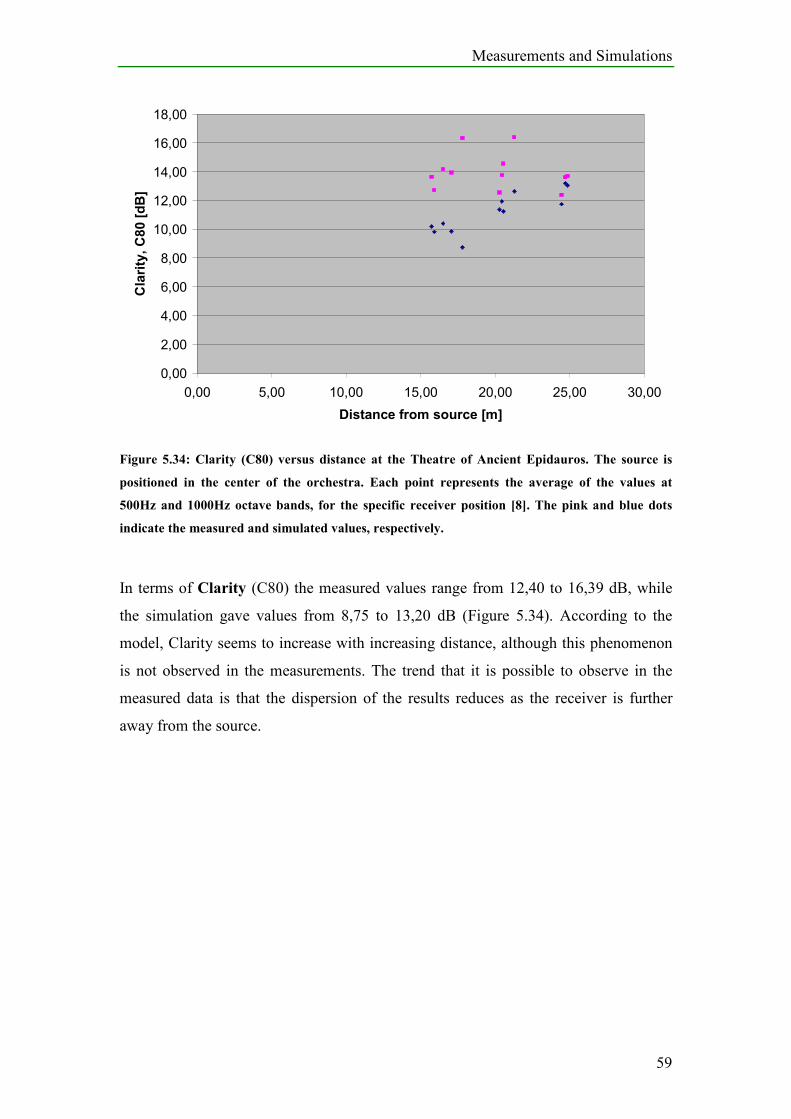
Measurements and Simulations
59
0,00
2,00
4,00
6,00
8,00
10,00
12,00
14,00
16,00
18,00
0,00 5,00 10,00 15,00 20,00 25,00 30,00
Distance from source [m]
Clarity, C80 [dB]
Figure 5.34: Clarity (C80) versus distance at the Theatre of Ancient Epidauros. The source is
positioned in the center of the orchestra. Each point represents the average of the values at
500Hz and 1000Hz octave bands, for the specific receiver position [8]. The pink and blue dots
indicate the measured and simulated values, respectively.
In terms of Clarity (C80) the measured values range from 12,40 to 16,39 dB, while
the simulation gave values from 8,75 to 13,20 dB (Figure 5.34). According to the
model, Clarity seems to increase with increasing distance, although this phenomenon
is not observed in the measurements. The trend that it is possible to observe in the
measured data is that the dispersion of the results reduces as the receiver is further
away from the source.
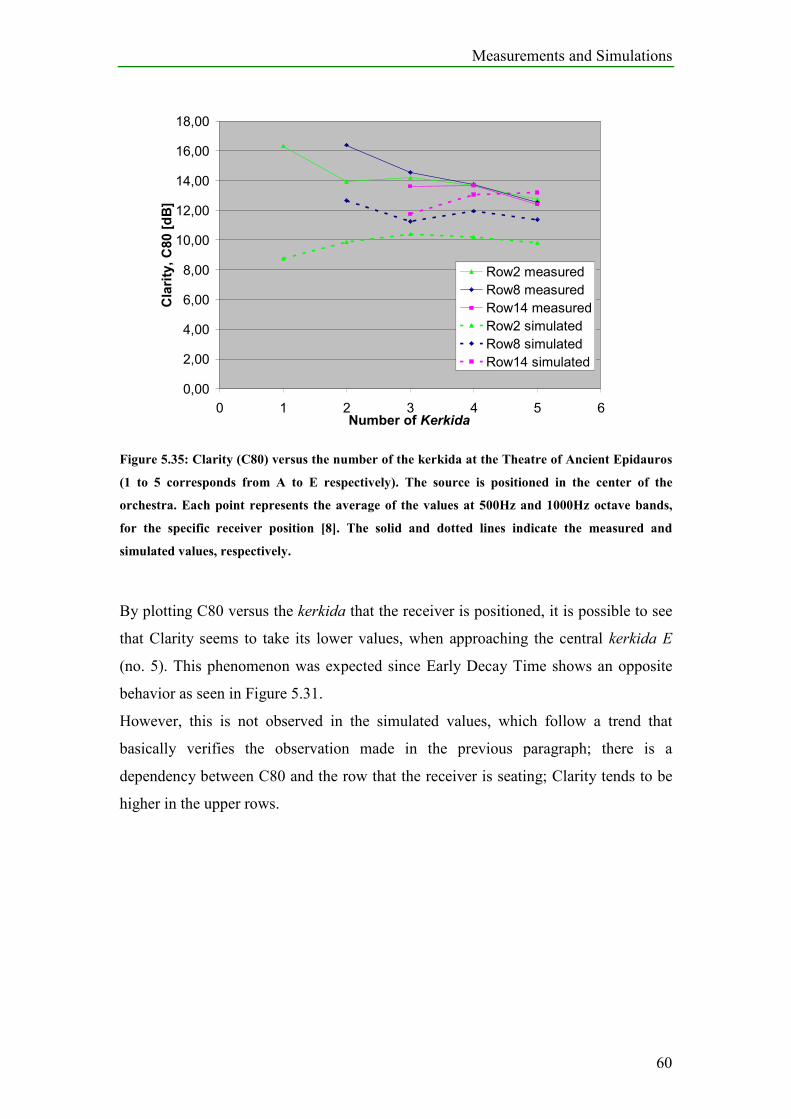
Measurements and Simulations
60
0,00
2,00
4,00
6,00
8,00
10,00
12,00
14,00
16,00
18,00
0 1 2 3 4 5 6Number of Kerkida
Clarity, C80 [dB]
Row2 measured
Row8 measured
Row14 measured
Row2 simulated
Row8 simulated
Row14 simulated
Figure 5.35: Clarity (C80) versus the number of the kerkida at the Theatre of Ancient Epidauros
(1 to 5 corresponds from A to E respectively). The source is positioned in the center of the
orchestra. Each point represents the average of the values at 500Hz and 1000Hz octave bands,
for the specific receiver position [8]. The solid and dotted lines indicate the measured and
simulated values, respectively.
By plotting C80 versus the kerkida that the receiver is positioned, it is possible to see
that Clarity seems to take its lower values, when approaching the central kerkida E
(no. 5). This phenomenon was expected since Early Decay Time shows an opposite
behavior as seen in Figure 5.31.
However, this is not observed in the simulated values, which follow a trend that
basically verifies the observation made in the previous paragraph; there is a
dependency between C80 and the row that the receiver is seating; Clarity tends to be
higher in the upper rows.
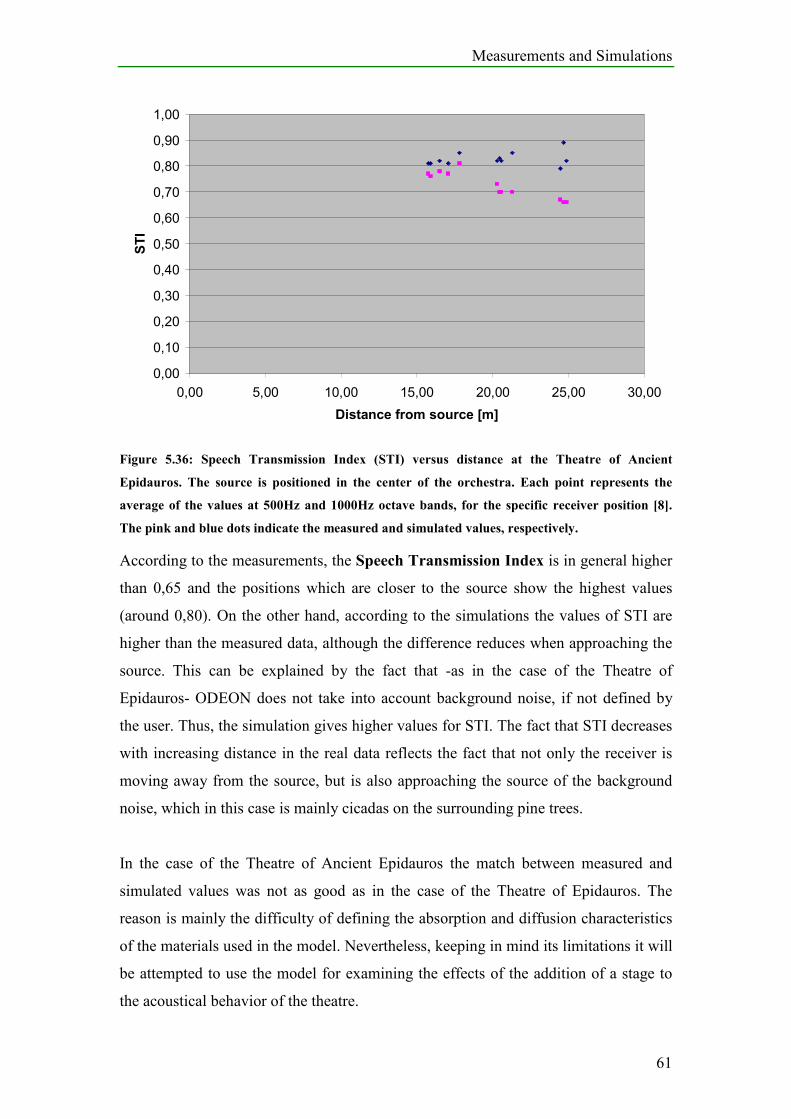
Measurements and Simulations
61
0,00
0,10
0,20
0,30
0,40
0,50
0,60
0,70
0,80
0,90
1,00
0,00 5,00 10,00 15,00 20,00 25,00 30,00
Distance from source [m]
STI
Figure 5.36: Speech Transmission Index (STI) versus distance at the Theatre of Ancient
Epidauros. The source is positioned in the center of the orchestra. Each point represents the
average of the values at 500Hz and 1000Hz octave bands, for the specific receiver position [8].
The pink and blue dots indicate the measured and simulated values, respectively.
According to the measurements, the Speech Transmission Index is in general higher
than 0,65 and the positions which are closer to the source show the highest values
(around 0,80). On the other hand, according to the simulations the values of STI are
higher than the measured data, although the difference reduces when approaching the
source. This can be explained by the fact that -as in the case of the Theatre of
Epidauros- ODEON does not take into account background noise, if not defined by
the user. Thus, the simulation gives higher values for STI. The fact that STI decreases
with increasing distance in the real data reflects the fact that not only the receiver is
moving away from the source, but is also approaching the source of the background
noise, which in this case is mainly cicadas on the surrounding pine trees.
In the case of the Theatre of Ancient Epidauros the match between measured and
simulated values was not as good as in the case of the Theatre of Epidauros. The
reason is mainly the difficulty of defining the absorption and diffusion characteristics
of the materials used in the model. Nevertheless, keeping in mind its limitations it will
be attempted to use the model for examining the effects of the addition of a stage to
the acoustical behavior of the theatre.
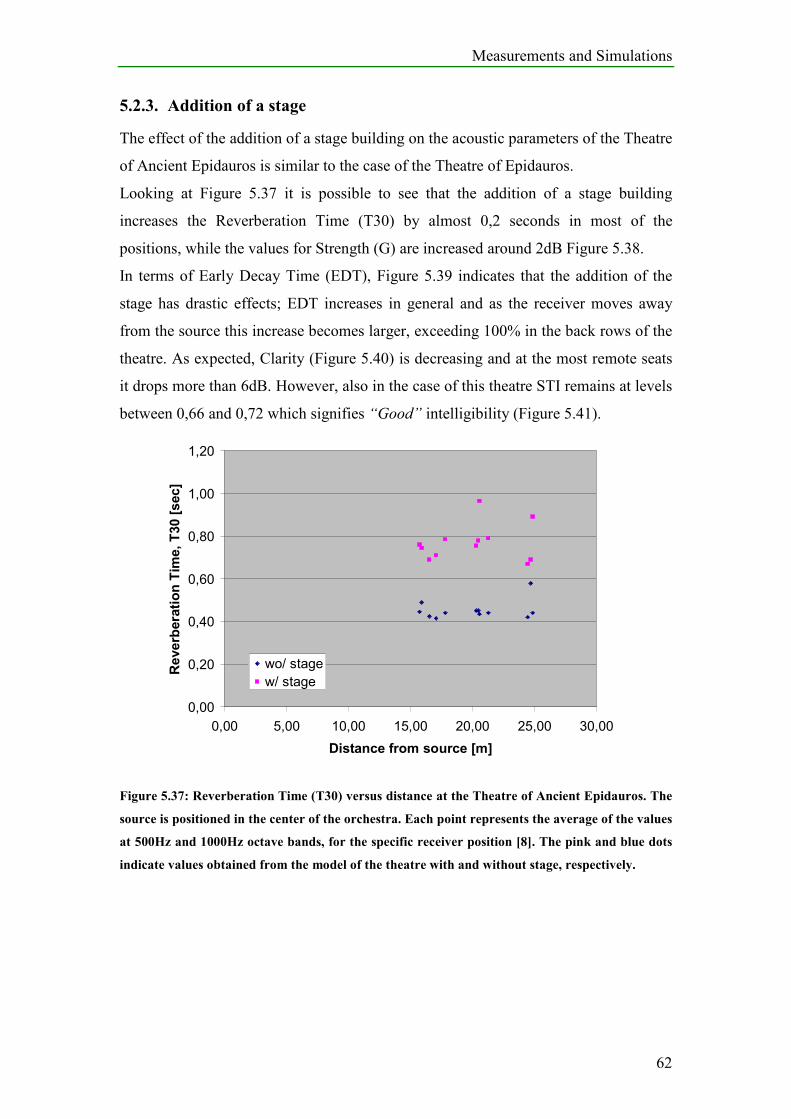
Measurements and Simulations
62
5.2.3. Addition of a stage
The effect of the addition of a stage building on the acoustic parameters of the Theatre
of Ancient Epidauros is similar to the case of the Theatre of Epidauros.
Looking at Figure 5.37 it is possible to see that the addition of a stage building
increases the Reverberation Time (T30) by almost 0,2 seconds in most of the
positions, while the values for Strength (G) are increased around 2dB Figure 5.38.
In terms of Early Decay Time (EDT), Figure 5.39 indicates that the addition of the
stage has drastic effects; EDT increases in general and as the receiver moves away
from the source this increase becomes larger, exceeding 100% in the back rows of the
theatre. As expected, Clarity (Figure 5.40) is decreasing and at the most remote seats
it drops more than 6dB. However, also in the case of this theatre STI remains at levels
between 0,66 and 0,72 which signifies “Good” intelligibility (Figure 5.41).
0,00
0,20
0,40
0,60
0,80
1,00
1,20
0,00 5,00 10,00 15,00 20,00 25,00 30,00
Distance from source [m]
Reverberation Tim
e, T30 [sec]
wo/ stage
w/ stage
Figure 5.37: Reverberation Time (T30) versus distance at the Theatre of Ancient Epidauros. The
source is positioned in the center of the orchestra. Each point represents the average of the values
at 500Hz and 1000Hz octave bands, for the specific receiver position [8]. The pink and blue dots
indicate values obtained from the model of the theatre with and without stage, respectively.
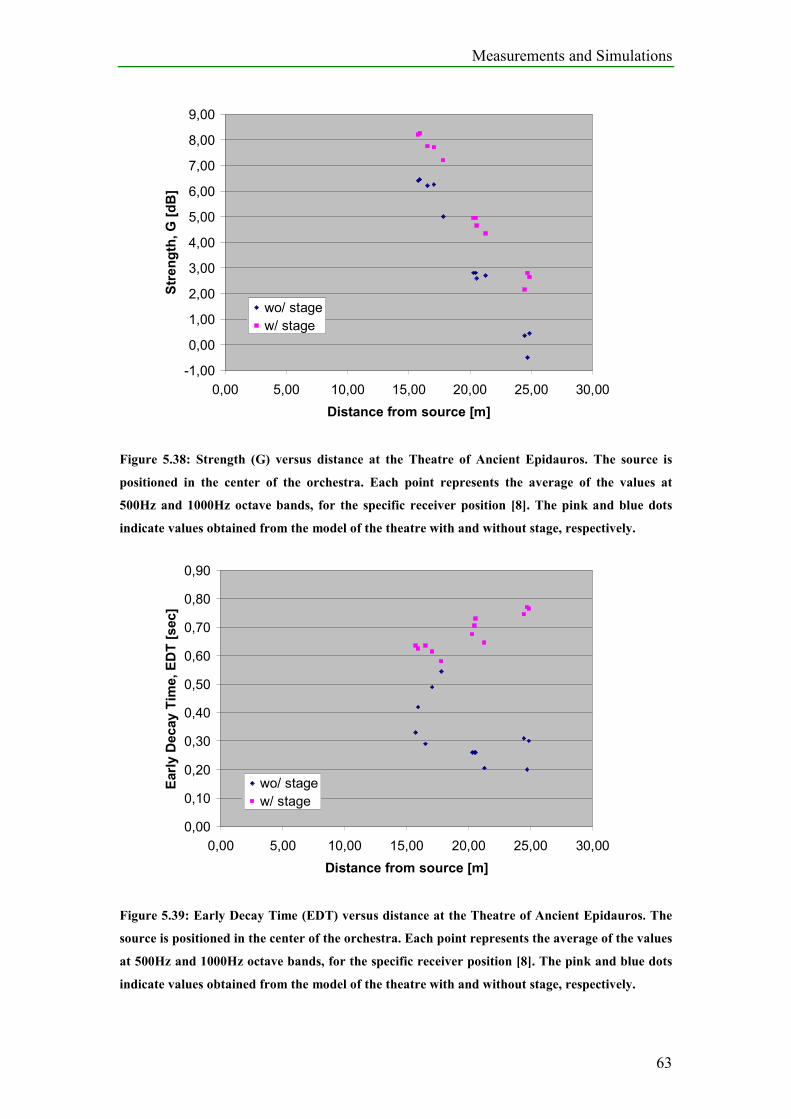
Measurements and Simulations
63
-1,00
0,00
1,00
2,00
3,00
4,00
5,00
6,00
7,00
8,00
9,00
0,00 5,00 10,00 15,00 20,00 25,00 30,00
Distance from source [m]
Strength, G [dB]
wo/ stage
w/ stage
Figure 5.38: Strength (G) versus distance at the Theatre of Ancient Epidauros. The source is
positioned in the center of the orchestra. Each point represents the average of the values at
500Hz and 1000Hz octave bands, for the specific receiver position [8]. The pink and blue dots
indicate values obtained from the model of the theatre with and without stage, respectively.
0,00
0,10
0,20
0,30
0,40
0,50
0,60
0,70
0,80
0,90
0,00 5,00 10,00 15,00 20,00 25,00 30,00
Distance from source [m]
Early Decay Tim
e, EDT [sec]
wo/ stage
w/ stage
Figure 5.39: Early Decay Time (EDT) versus distance at the Theatre of Ancient Epidauros. The
source is positioned in the center of the orchestra. Each point represents the average of the values
at 500Hz and 1000Hz octave bands, for the specific receiver position [8]. The pink and blue dots
indicate values obtained from the model of the theatre with and without stage, respectively.
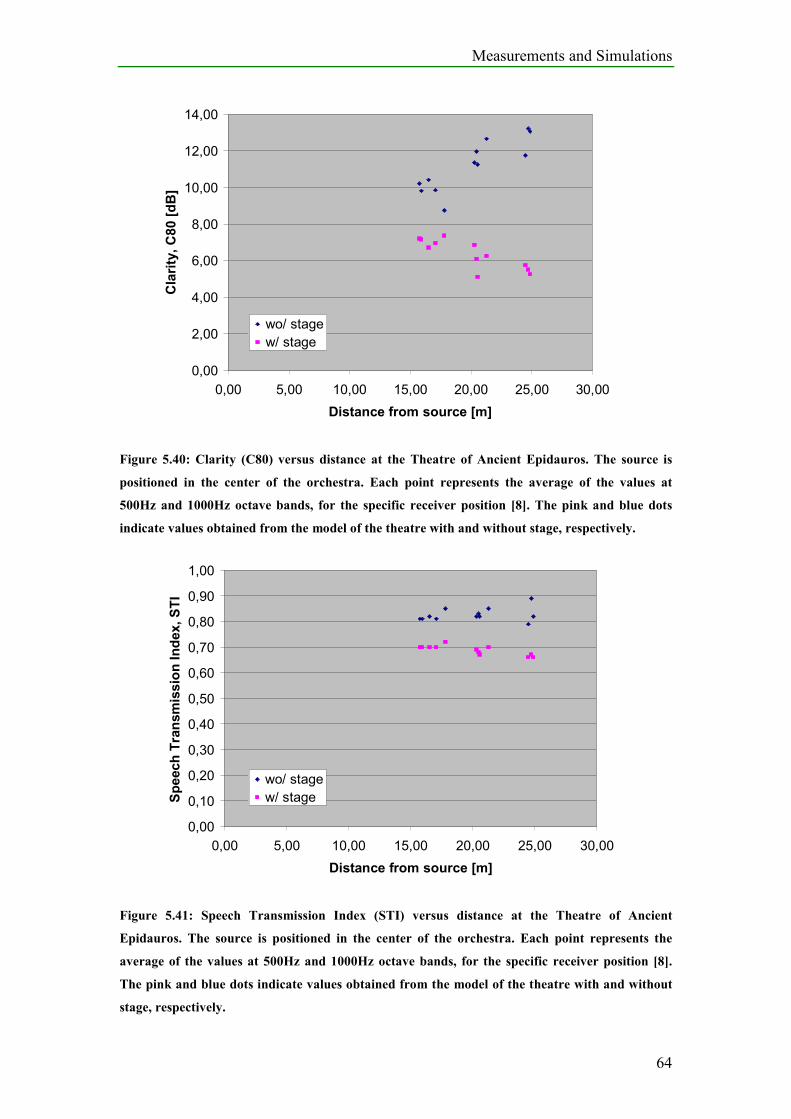
Measurements and Simulations
64
0,00
2,00
4,00
6,00
8,00
10,00
12,00
14,00
0,00 5,00 10,00 15,00 20,00 25,00 30,00
Distance from source [m]
Clarity, C80 [dB]
wo/ stage
w/ stage
Figure 5.40: Clarity (C80) versus distance at the Theatre of Ancient Epidauros. The source is
positioned in the center of the orchestra. Each point represents the average of the values at
500Hz and 1000Hz octave bands, for the specific receiver position [8]. The pink and blue dots
indicate values obtained from the model of the theatre with and without stage, respectively.
0,00
0,10
0,20
0,30
0,40
0,50
0,60
0,70
0,80
0,90
1,00
0,00 5,00 10,00 15,00 20,00 25,00 30,00
Distance from source [m]
Speech Transmission Index, STI
wo/ stage
w/ stage
Figure 5.41: Speech Transmission Index (STI) versus distance at the Theatre of Ancient
Epidauros. The source is positioned in the center of the orchestra. Each point represents the
average of the values at 500Hz and 1000Hz octave bands, for the specific receiver position [8].
The pink and blue dots indicate values obtained from the model of the theatre with and without
stage, respectively.
Measurements and Simulations
65
From the results presented in this section it seems that the addition of a stage will
have more evident effects to the Theatre of Ancient Epidauros than in the case of the
Theatre of Epidauros. However, taking into account that T30 and EDT are quite low
even after adding the stage, the theatre is still too “dry” for hosting a non amplified
musical performance.
Graphical illustrations of the effect of the addition of a stage at the Theatre of Ancient
Epidauros can be found in section 9.4 of the Appendix.
Listening Tests
66
6. Listening Tests
A series of listening tests consisting of 2 sections was conducted in an attempt to
indirectly investigate the effect of the loudspeaker systems, which were used in some
of the performances, on subjective aspects of the acoustical character of the theatres.
The observations were related with objectively measured acoustical quantities
whenever it was possible.
In the first section the test subjects were asked to listen to 3 audio tracks recorded at
the same time in 3 different seating positions at each theatre; the task was to choose
among those 3 positions, the one that seemed closer to the source for them and also to
state the one that they would prefer to be seating.
In the second section, the test subjects were asked to choose between 2 short
presentations of different performances, which one was more intimate for them, as
well as to indicate in which of the 2 audio tracks the theatre seemed larger to them.
The test group consisted of 11 persons with ages between 20 and 30 years old. All test
subjects at the time of the tests, were working or studying at the Acoustic Technology
Department of the Technical University of Denmark. All of them had undergone
various kinds of listening tests, as well as several audiometric analyses in the past;
thus, there was no training previous to the listening tests. All test subjects had normal
hearing at mid-frequencies.
The test subjects had to give their answers on a paper form that was presented to them
at the beginning of the listening tests.
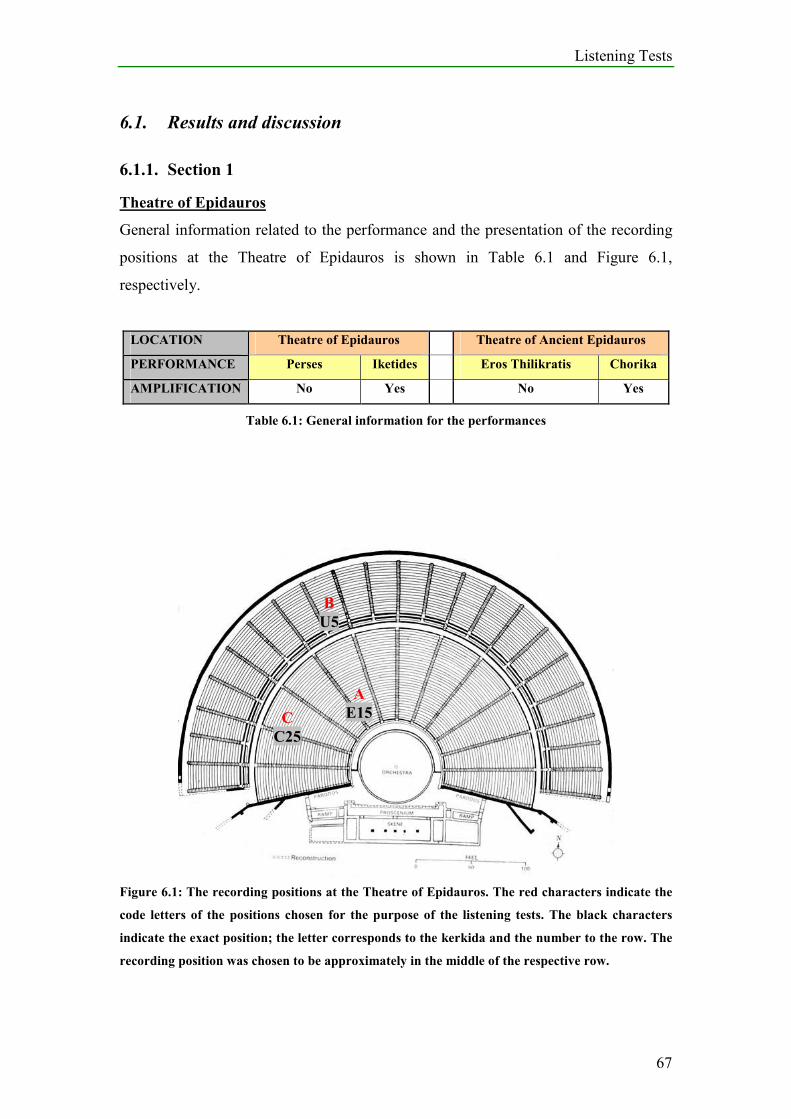
Listening Tests
67
6.1. Results and discussion
6.1.1. Section 1
Theatre of Epidauros
General information related to the performance and the presentation of the recording
positions at the Theatre of Epidauros is shown in Table 6.1 and Figure 6.1,
respectively.
LOCATION Theatre of Epidauros Theatre of Ancient Epidauros
PERFORMANCE Perses Iketides Eros Thilikratis Chorika
AMPLIFICATION No Yes No Yes
Table 6.1: General information for the performances
Figure 6.1: The recording positions at the Theatre of Epidauros. The red characters indicate the
code letters of the positions chosen for the purpose of the listening tests. The black characters
indicate the exact position; the letter corresponds to the kerkida and the number to the row. The
recording position was chosen to be approximately in the middle of the respective row.
C
C25
A
E15
B
U5
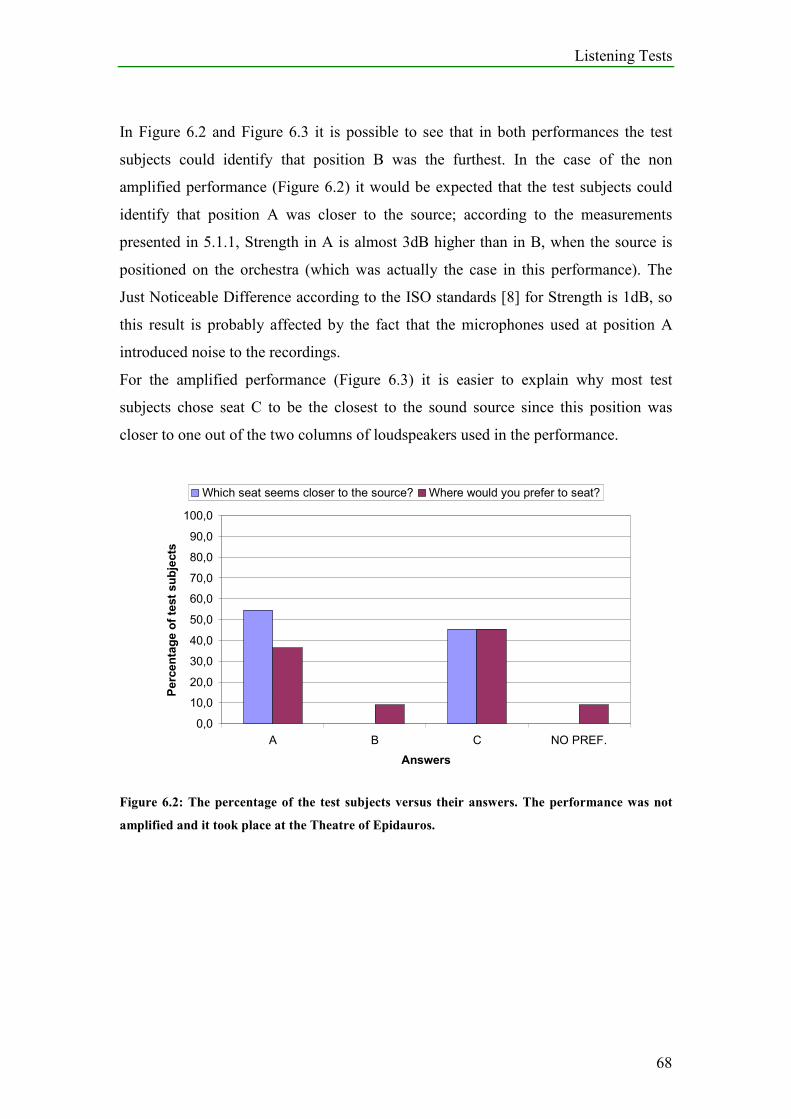
Listening Tests
68
In Figure 6.2 and Figure 6.3 it is possible to see that in both performances the test
subjects could identify that position B was the furthest. In the case of the non
amplified performance (Figure 6.2) it would be expected that the test subjects could
identify that position A was closer to the source; according to the measurements
presented in 5.1.1, Strength in A is almost 3dB higher than in B, when the source is
positioned on the orchestra (which was actually the case in this performance). The
Just Noticeable Difference according to the ISO standards [8] for Strength is 1dB, so
this result is probably affected by the fact that the microphones used at position A
introduced noise to the recordings.
For the amplified performance (Figure 6.3) it is easier to explain why most test
subjects chose seat C to be the closest to the sound source since this position was
closer to one out of the two columns of loudspeakers used in the performance.
0,0
10,0
20,0
30,0
40,0
50,0
60,0
70,0
80,0
90,0
100,0
A B C NO PREF.
Answers
Percentage of test subjects
Which seat seems closer to the source? Where would you prefer to seat?
Figure 6.2: The percentage of the test subjects versus their answers. The performance was not
amplified and it took place at the Theatre of Epidauros.
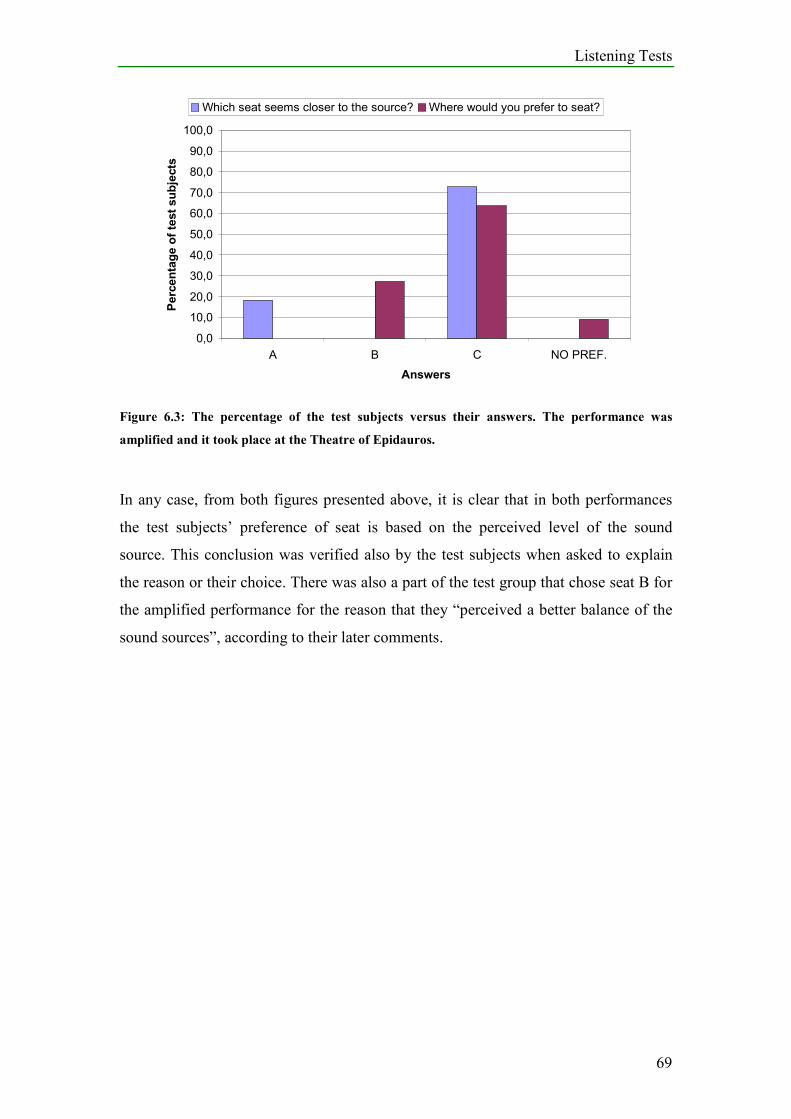
Listening Tests
69
0,0
10,0
20,0
30,0
40,0
50,0
60,0
70,0
80,0
90,0
100,0
A B C NO PREF.
Answers
Percentage of test subjects
Which seat seems closer to the source? Where would you prefer to seat?
Figure 6.3: The percentage of the test subjects versus their answers. The performance was
amplified and it took place at the Theatre of Epidauros.
In any case, from both figures presented above, it is clear that in both performances
the test subjects’ preference of seat is based on the perceived level of the sound
source. This conclusion was verified also by the test subjects when asked to explain
the reason or their choice. There was also a part of the test group that chose seat B for
the amplified performance for the reason that they “perceived a better balance of the
sound sources”, according to their later comments.
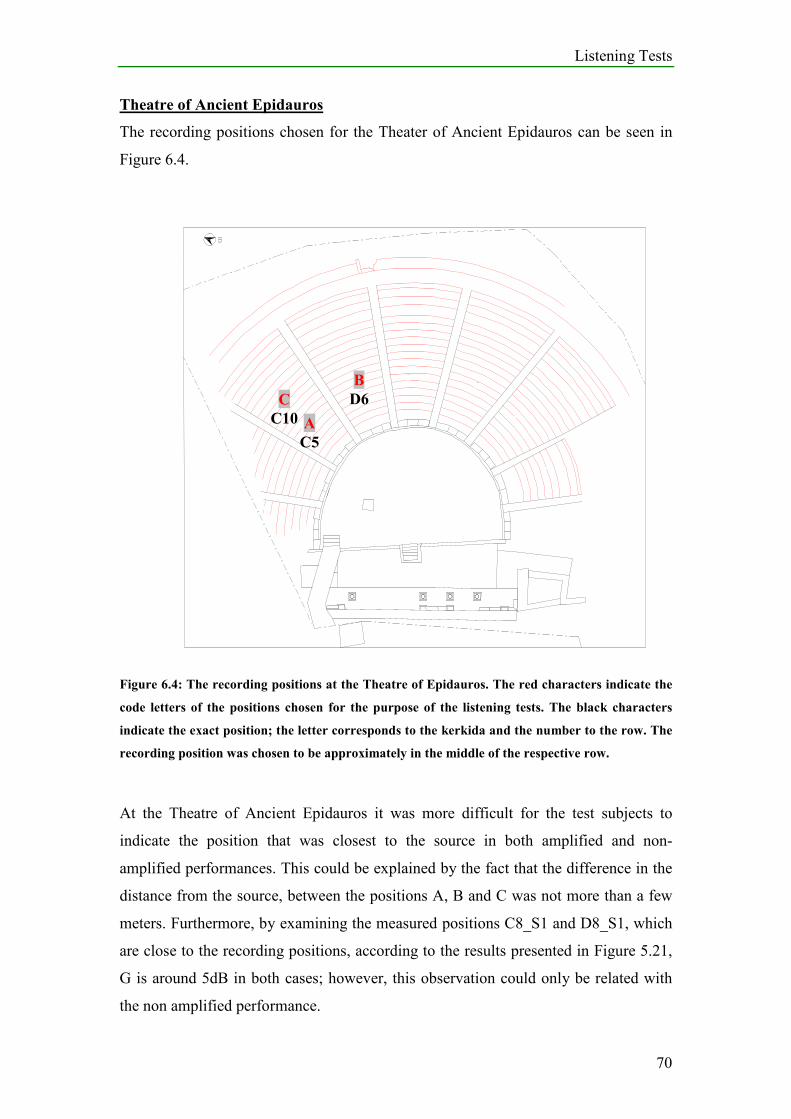
Listening Tests
70
Theatre of Ancient Epidauros
The recording positions chosen for the Theater of Ancient Epidauros can be seen in
Figure 6.4.
A
?
G
?
??
?
T
?
Figure 6.4: The recording positions at the Theatre of Epidauros. The red characters indicate the
code letters of the positions chosen for the purpose of the listening tests. The black characters
indicate the exact position; the letter corresponds to the kerkida and the number to the row. The
recording position was chosen to be approximately in the middle of the respective row.
At the Theatre of Ancient Epidauros it was more difficult for the test subjects to
indicate the position that was closest to the source in both amplified and non-
amplified performances. This could be explained by the fact that the difference in the
distance from the source, between the positions A, B and C was not more than a few
meters. Furthermore, by examining the measured positions C8_S1 and D8_S1, which
are close to the recording positions, according to the results presented in Figure 5.21,
G is around 5dB in both cases; however, this observation could only be related with
the non amplified performance.
C
C10
B
D6
A
C5
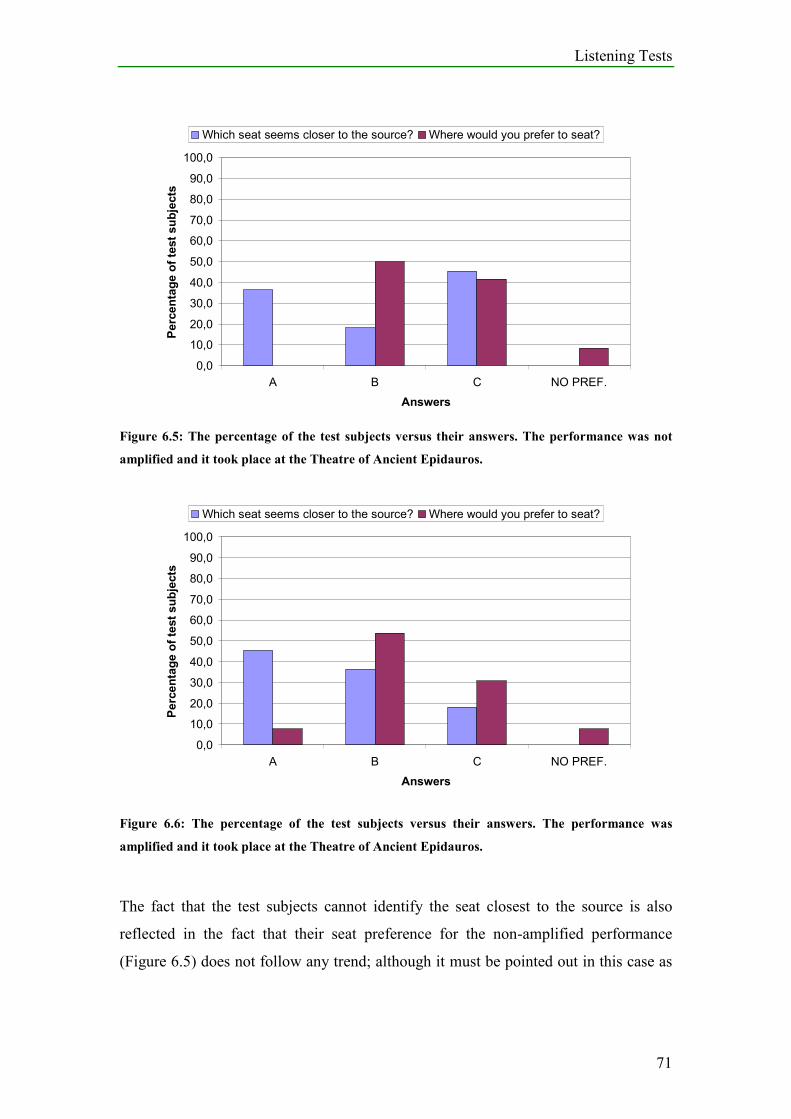
Listening Tests
71
0,0
10,0
20,0
30,0
40,0
50,0
60,0
70,0
80,0
90,0
100,0
A B C NO PREF.
Answers
Percentage of test subjects
Which seat seems closer to the source? Where would you prefer to seat?
Figure 6.5: The percentage of the test subjects versus their answers. The performance was not
amplified and it took place at the Theatre of Ancient Epidauros.
0,0
10,0
20,0
30,0
40,0
50,0
60,0
70,0
80,0
90,0
100,0
A B C NO PREF.
Answers
Percentage of test subjects
Which seat seems closer to the source? Where would you prefer to seat?
Figure 6.6: The percentage of the test subjects versus their answers. The performance was
amplified and it took place at the Theatre of Ancient Epidauros.
The fact that the test subjects cannot identify the seat closest to the source is also
reflected in the fact that their seat preference for the non-amplified performance
(Figure 6.5) does not follow any trend; although it must be pointed out in this case as
Listening Tests
72
well, the problematic microphones of the person recording at position A could the
reason why this position was not preferred by any test subject.
For the amplified performance though (Figure 6.6), the seat that is closer to the axis of
symmetry of the theatre seems to be preferred, for the reason of more equal balance of
the sound sources, as in the case of the large theatre.
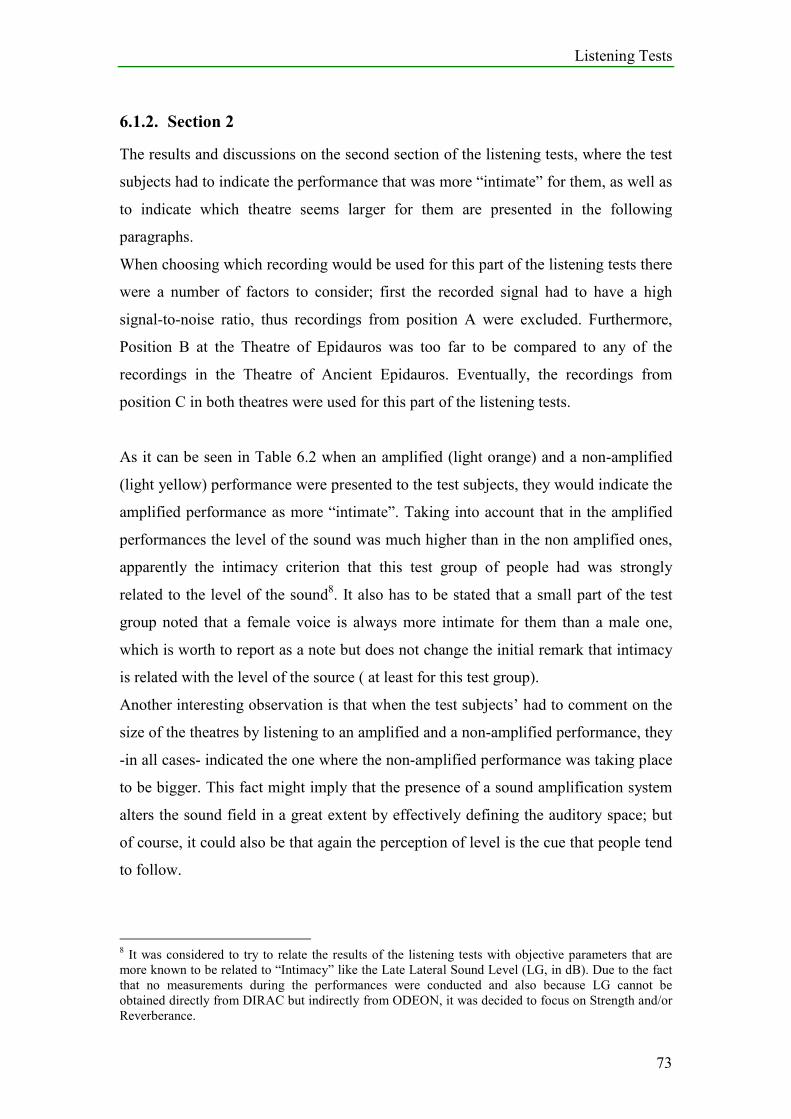
Listening Tests
73
6.1.2. Section 2
The results and discussions on the second section of the listening tests, where the test
subjects had to indicate the performance that was more “intimate” for them, as well as
to indicate which theatre seems larger for them are presented in the following
paragraphs.
When choosing which recording would be used for this part of the listening tests there
were a number of factors to consider; first the recorded signal had to have a high
signal-to-noise ratio, thus recordings from position A were excluded. Furthermore,
Position B at the Theatre of Epidauros was too far to be compared to any of the
recordings in the Theatre of Ancient Epidauros. Eventually, the recordings from
position C in both theatres were used for this part of the listening tests.
As it can be seen in Table 6.2 when an amplified (light orange) and a non-amplified
(light yellow) performance were presented to the test subjects, they would indicate the
amplified performance as more “intimate”. Taking into account that in the amplified
performances the level of the sound was much higher than in the non amplified ones,
apparently the intimacy criterion that this test group of people had was strongly
related to the level of the sound8. It also has to be stated that a small part of the test
group noted that a female voice is always more intimate for them than a male one,
which is worth to report as a note but does not change the initial remark that intimacy
is related with the level of the source ( at least for this test group).
Another interesting observation is that when the test subjects’ had to comment on the
size of the theatres by listening to an amplified and a non-amplified performance, they
-in all cases- indicated the one where the non-amplified performance was taking place
to be bigger. This fact might imply that the presence of a sound amplification system
alters the sound field in a great extent by effectively defining the auditory space; but
of course, it could also be that again the perception of level is the cue that people tend
to follow.
8 It was considered to try to relate the results of the listening tests with objective parameters that are
more known to be related to “Intimacy” like the Late Lateral Sound Level (LG, in dB). Due to the fact
that no measurements during the performances were conducted and also because LG cannot be
obtained directly from DIRAC but indirectly from ODEON, it was decided to focus on Strength and/or
Reverberance.
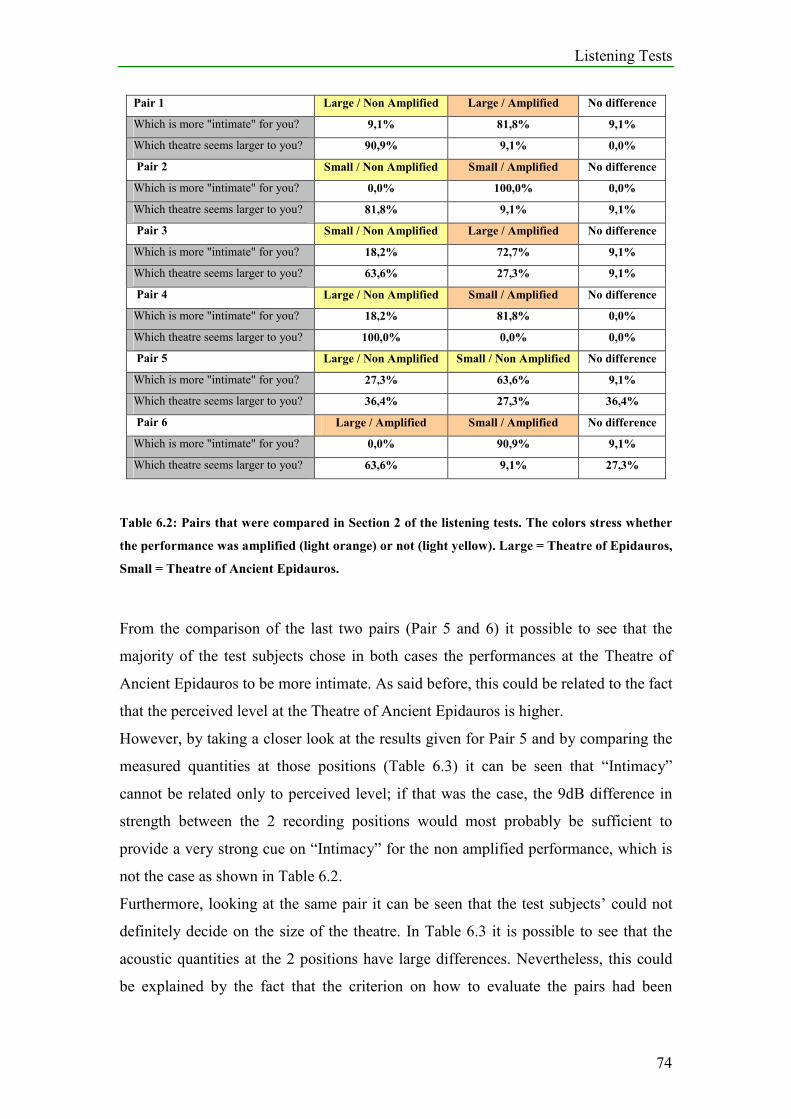
Listening Tests
74
Pair 1 Large / Non Amplified Large / Amplified No difference
Which is more "intimate" for you? 9,1% 81,8% 9,1%
Which theatre seems larger to you? 90,9% 9,1% 0,0%
Pair 2 Small / Non Amplified Small / Amplified No difference
Which is more "intimate" for you? 0,0% 100,0% 0,0%
Which theatre seems larger to you? 81,8% 9,1% 9,1%
Pair 3 Small / Non Amplified Large / Amplified No difference
Which is more "intimate" for you? 18,2% 72,7% 9,1%
Which theatre seems larger to you? 63,6% 27,3% 9,1%
Pair 4 Large / Non Amplified Small / Amplified No difference
Which is more "intimate" for you? 18,2% 81,8% 0,0%
Which theatre seems larger to you? 100,0% 0,0% 0,0%
Pair 5 Large / Non Amplified Small / Non Amplified No difference
Which is more "intimate" for you? 27,3% 63,6% 9,1%
Which theatre seems larger to you? 36,4% 27,3% 36,4%
Pair 6 Large / Amplified Small / Amplified No difference
Which is more "intimate" for you? 0,0% 90,9% 9,1%
Which theatre seems larger to you? 63,6% 9,1% 27,3%
Table 6.2: Pairs that were compared in Section 2 of the listening tests. The colors stress whether
the performance was amplified (light orange) or not (light yellow). Large = Theatre of Epidauros,
Small = Theatre of Ancient Epidauros.
From the comparison of the last two pairs (Pair 5 and 6) it possible to see that the
majority of the test subjects chose in both cases the performances at the Theatre of
Ancient Epidauros to be more intimate. As said before, this could be related to the fact
that the perceived level at the Theatre of Ancient Epidauros is higher.
However, by taking a closer look at the results given for Pair 5 and by comparing the
measured quantities at those positions (Table 6.3) it can be seen that “Intimacy”
cannot be related only to perceived level; if that was the case, the 9dB difference in
strength between the 2 recording positions would most probably be sufficient to
provide a very strong cue on “Intimacy” for the non amplified performance, which is
not the case as shown in Table 6.2.
Furthermore, looking at the same pair it can be seen that the test subjects’ could not
definitely decide on the size of the theatre. In Table 6.3 it is possible to see that the
acoustic quantities at the 2 positions have large differences. Nevertheless, this could
be explained by the fact that the criterion on how to evaluate the pairs had been
Listening Tests
75
defined by the previous paired comparisons between the amplified and non-amplified
performances in which the answers given are very consistent.
This is an indication that a deeper investigation of non amplified performances should
be conducted in order to come up with relations between objective measurements and
subjective evaluations.
C8_S1
(Theatre of Ancient Epidauros)
C25_S1
(Theatre of Epidauros)
G (in dB) 5 dB -4 dB
T30 (in sec) <0,6 sec 1,2 sec
EDT (in sec) <0,3 sec 0,1 sec
Table 6.3: The values of the acoustic quantities measured in the receiver positions which are the
closest to the recording positions used for this part of the listening tests.
Conclusions and future work
76
7. Conclusions and future work
7.1. Conclusions
In the present study, it has been attempted to approach the matter of investigating the
acoustics of Ancient Greek and Roman theatres under the light of their modern use.
By combining results from objective acoustic measurements, computer simulations
and listening tests a “holistic” way of studying the issue has been proposed.
With the help of the in situ measurements it has been possible to observe that in the
present conditions of the theatres the source position does not have an influence on
the acoustic properties of the theatre which in terms of strength are mainly affected by
the distance between source and receiver.
Specifically for the Theatre of Epidauros by positioning the sound source where the
logeion used to be when the skene of the theatre was intact, no positive effect on the
acoustic characteristics was observed. On the contrary, an increase in T30 values was
observed when the source was positioned on the orchestra. However, as stated before
this could be an improvement for performing music (since T30 is already too low for
musical performances) but as far as speech is concerned any source position would be
just as good in terms of intelligibility.
Another interesting result that was evident in both measurements and simulations is
that when the theatre is not occupied, the reflections arriving to the first kerkida from
the surfaces that are in opposite side (and vice versa) could be experienced as a
distinct echo. The computer simulation showed that this effect could be smoothened
by the addition of a stage. Although after adding the stage T30 and G do not increase
much, the effect is obvious on EDT and consequently on C80. However, even if C80
decreases STI still remains at quite high values around 0,65.
In the Theatre of Ancient Epidauros the wooden panel positioned at the back of the
stage seemed to create an increase in the EDT when the receiver was approaching to
the axis of symmetry of the theatre. This fact causes C80 to drop to low values in the
middle kerkida although for the specific theatre this is not so important because its
size is quite small and the values of C80 and STI are high in most positions. This
phenomenon was not observed at the simulations. The agreement of the measured and
Conclusions and future work
77
simulated values was not as good as in the Theatre of Epidauros, basically due to
difficulties in defining successfully diffusion and scattering coefficients in the
surfaces of the modeled theatre. However, from the relative results between the model
with and without the stage it was possible to observe that the addition of the stage in
the Theatre of Ancient Epidauros has similar results as in the Theatre of Epidauros. It
has to be stressed that the comparison between measured and simulated data is
focused in the case where the sound source is situated on the orchestra.
According to the results of the listening tests, the use of amplification systems in both
theatres has to be treated with extra care since the characteristics and settings of the
system, define in a great extent the sound field, and in a way they “denude” the
theatre from its natural acoustically perceived spatial properties, which they are only
underlined by the visual cues.
It is also important to be stated that the existence of a common sound amplification
system (normally comprised of 2 columns of loudspeakers positioned in the left and
right side of the stage) increases the danger of a shifted auditory image for the people
seating close to the loudspeakers. As shown in the first part of the listening tests, the
danger is higher in the Theatre of Ancient Epidauros because it is smaller and the
loudspeakers are usually positioned closer to the seating area.
However, the loudspeaker system increases greatly the level in all positions, allowing
the spectators which are seating at the most remote positions to be able to follow with
no effort the performance. This is not so important in the Theatre of Ancient
Epidauros since its size is much smaller. Finally, according to the results of the
listening tests the use of a loudspeaker system also improves the feeling of acoustical
“intimacy” for the spectators, which seems to be related to the level of the sound.
Many obstacles appeared all along the way of this project and in all the different
stages. Some of them have been discussed in this study.
For example:
• The effect of the weather conditions in the outdoor measurements (observed in
the measurements from source position S3, at the Theatre of Epidauros)

Conclusions and future work
78
• The difficulty of assigning absorption and scattering characteristics to the
surfaces in the models of the theatres in order to obtain a good agreement
between measured and simulated results
• The difficulty of designing/conducting listening tests and interpreting the
results
Some other problems related to the organization of a project like this, the realization
of which depends on many individuals and authorities cannot be shown or evaluated.
However, planning has been an important part of this project and it deserves to be
mentioned. The interaction with people from different disciplines (public servants
from different related authorities - archaeologists, engineers, artists, producers,
philologists) that is needed to organize and conduct a project like this is part of the
learning process; moreover, it is necessary in order to be able to perceive the issue of
the modern use of Ancient Greek and Roman Theatres from all the different points of
view.
7.2. Future work
First of all, the models of the theatres should be further improved in order to give
results that are in better agreement with the measured data.
As far as the effect of the source position on the acoustical behavior of the theatres
under consideration, further investigation of the measured data is required.
Furthermore, comparison of the measured data, with simulations of other source-
receiver configurations, is needed. For investigating specifically the positions of the
sound sources proposed by Vitruvius [6] for the Theatre of Epidauros, the theatre
should be modeled in its initial form.
In terms of relating objective parameters with measured data, more listening tests
should be conducted; as far as “Intimacy” is concerned the relation with parameters
like LG or LEF (which are known to be related with subjective parameters as Listener
Envelopment and Apparent Source Width, respectively) could be studied.
There is a necessity for acoustical measurements in the occupied theatres. Those data
could help in retuning the models and approach the modern use of the theatres from a
more realistic point of view.
References
79
8. References
[1]: ICOMOS, “Principle for the analysis, conservation and structural restoration of
Architectural Heritage”, 2003.
[2]: “Burra Charter”, Ar.18, 1999.
[3]: The Australia ICOMOS Charter, “For the Conservation of places of Cultural
significance”, 1999.
[4]: ERATO: “Final Report: covering period from 1 February 2003 to 31 January
2006”.
[5]: Michel Vallet, Bruno Vincent, Martin Lisa Nielsen, “Report on the Assessment of
the Virtual Environments”, ERATO: Deliverable 9.4. November 2005.
[6]: Vitruvius, “The Ten Books on Architecture”, Translated by Morris Hicky
Morgan, Ph.D., LL.D., Dover Publications, Inc., New York.
[7]: Technical Note 001, “Measuring Impulse Responses using DIRAC”, Acoustics
Engineering, February 2004.
[8]: ISO 2005, “Annex A (informative), Auditorium measures derived from impulse
responses”, ISO/CD 3382-1, 2005.
[9]: L. Cremer, ”Different Distributions of the Audience”, Auditorium Acoustics,
Applied Science Publishers LTD, London 1975.
[10]: H. Kuttruff, ”Room Acoustics”, Fourth Edition, Spon, London, 2000.
[11]: Finn Jacobsen, “Lecture notes for course 31260, Advanced Acoustics, Ex9.
Outdoor Sound Propagation”, Acoustic Technology, Oersted DTU, 2006.
Appendix
80
9. Appendix
9.1. T30 versus T20
For concert halls, T20 is considered to be a more reliable descriptor of the
reverberation time in concert halls/auditoriums, since T30 is more “vulnerable” to
background noise. However, on the Figures that follow below it is possible to observe
how close the values for T20 agree with the ones for T30, when plotted versus
distance, but versus frequency as well. As expected, the values for T20 are generally
somewhat lower than the values for T30. Furthermore, with the current version of
ODEON it is easier to obtain results and graphs for T30, rather than T20. Considering
that a large part of the analysis presented in this report is based on results obtained
from ODEON simulations, and keeping in mind that the real measurements showed a
close agreement between T20 and T30, it was decided to use the parameter T30 for
evaluating reverberation time in both theatres.
0,00
0,20
0,40
0,60
0,80
1,00
1,20
1,40
1,60
1,80
0,00 10,00 20,00 30,00 40,00 50,00 60,00 70,00
Distance [m]
Reverberation Tim
e [sec]
S1_T20
S1_T30
Figure 9.1: Reverberation Time versus distance at the Theatre of Epidauros. The source is
positioned in the center of the orchestra. Each point represents the average of the values at
500Hz and 1000Hz octave bands, for the specific receiver position [8]. The pink and blue line,
indicate the measured values for T20 and T30, respectively.
Appendix
81
0,00
0,20
0,40
0,60
0,80
1,00
1,20
1,40
100 1000 10000
Frequency [Hz]
Reverberation Tim
e [sec]
S1_T20
S1_T30
Figure 9.2: Reverberation Time versus frequency at the Theatre of Epidauros. The source is
positioned in the center of the orchestra. Each point represents the average of the values
measured in all receiver positions, for the specific octave band. The pink and blue line, indicate
the measured values for T20 and T30, respectively.
0,00
0,10
0,20
0,30
0,40
0,50
0,60
0,70
0,00 5,00 10,00 15,00 20,00 25,00 30,00
Distance [m]
Reverberation Tim
e [sec]
S1_T20
S1_T30
Figure 9.3: Reverberation Time versus distance at the Theatre of Ancient Epidauros. The source
is positioned in the center of the orchestra. Each point represents the average of the values at
500Hz and 1000Hz octave bands, for the specific receiver position [8]. The pink and blue line,
indicate the measured values for T20 and T30, respectively.
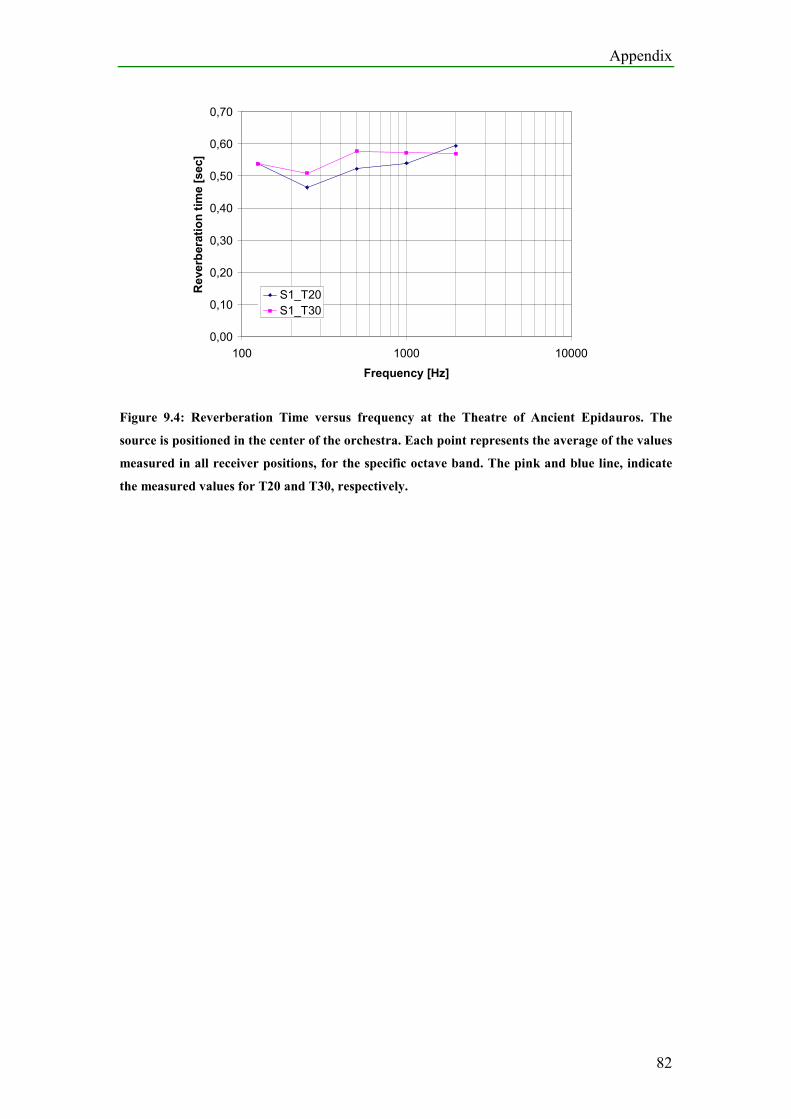
Appendix
82
0,00
0,10
0,20
0,30
0,40
0,50
0,60
0,70
100 1000 10000
Frequency [Hz]
Reverberation tim
e [sec]
S1_T20
S1_T30
Figure 9.4: Reverberation Time versus frequency at the Theatre of Ancient Epidauros. The
source is positioned in the center of the orchestra. Each point represents the average of the values
measured in all receiver positions, for the specific octave band. The pink and blue line, indicate
the measured values for T20 and T30, respectively.
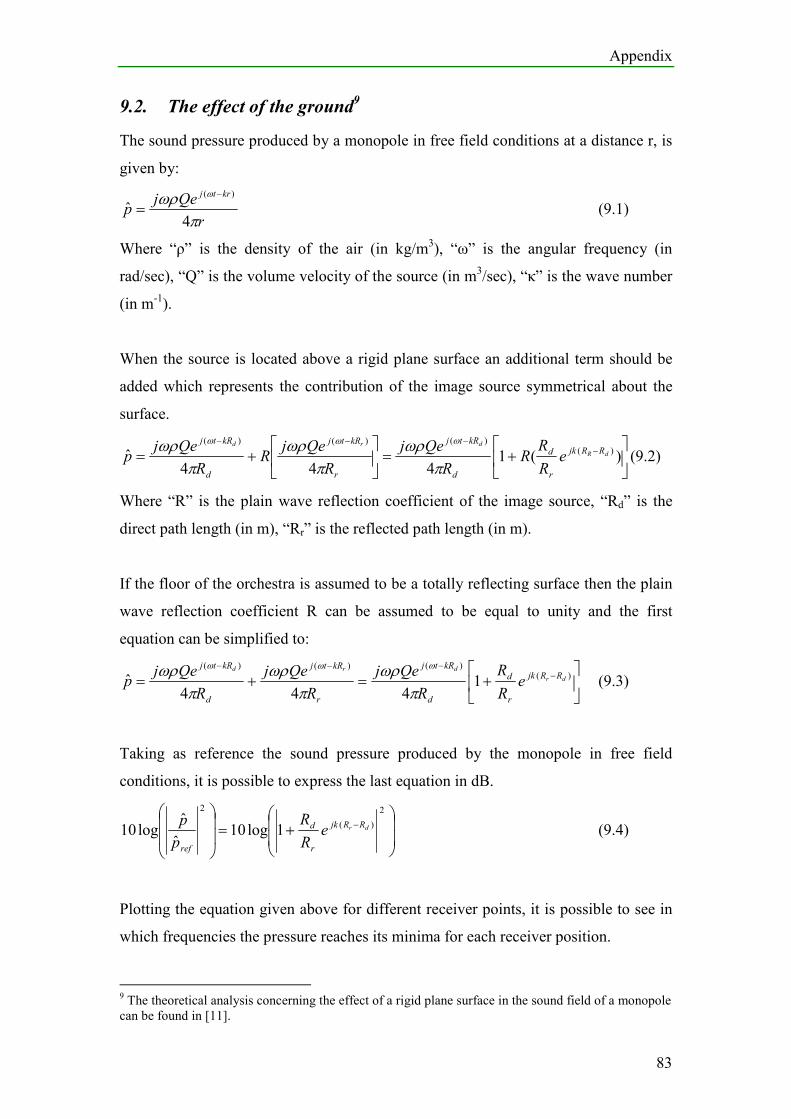
Appendix
83
9.2. The effect of the ground9
The sound pressure produced by a monopole in free field conditions at a distance r, is
given by:
r
Qejp
krtj
πωρ ω
4ˆ
)( −
= (9.1)
Where “ρ” is the density of the air (in kg/m3), “ω” is the angular frequency (in
rad/sec), “Q” is the volume velocity of the source (in m3/sec), “κ” is the wave number
(in m-1).
When the source is located above a rigid plane surface an additional term should be
added which represents the contribution of the image source symmetrical about the
surface.
+=
+= −
−−−
)(1444
ˆ )()()()(
dR
drd
RRjk
r
d
d
kRtj
r
kRtj
d
kRtj
eR
RR
R
Qej
R
QejR
R
Qejp
πωρ
πωρ
πωρ ωωω
(9.2)
Where “R” is the plain wave reflection coefficient of the image source, “Rd” is the
direct path length (in m), “Rr” is the reflected path length (in m).
If the floor of the orchestra is assumed to be a totally reflecting surface then the plain
wave reflection coefficient R can be assumed to be equal to unity and the first
equation can be simplified to:
+=+= −
−−−)(
)()()(
1444
ˆ dr
drd
RRjk
r
d
d
kRtj
r
kRtj
d
kRtj
eR
R
R
Qej
R
Qej
R
Qejp
πωρ
πωρ
πωρ ωωω
(9.3)
Taking as reference the sound pressure produced by the monopole in free field
conditions, it is possible to express the last equation in dB.
+=
−
2
)(
2
1log10ˆ
ˆlog10 dr RRjk
r
d
ref
eR
R
p
p (9.4)
Plotting the equation given above for different receiver points, it is possible to see in
which frequencies the pressure reaches its minima for each receiver position.
9 The theoretical analysis concerning the effect of a rigid plane surface in the sound field of a monopole
can be found in [11].
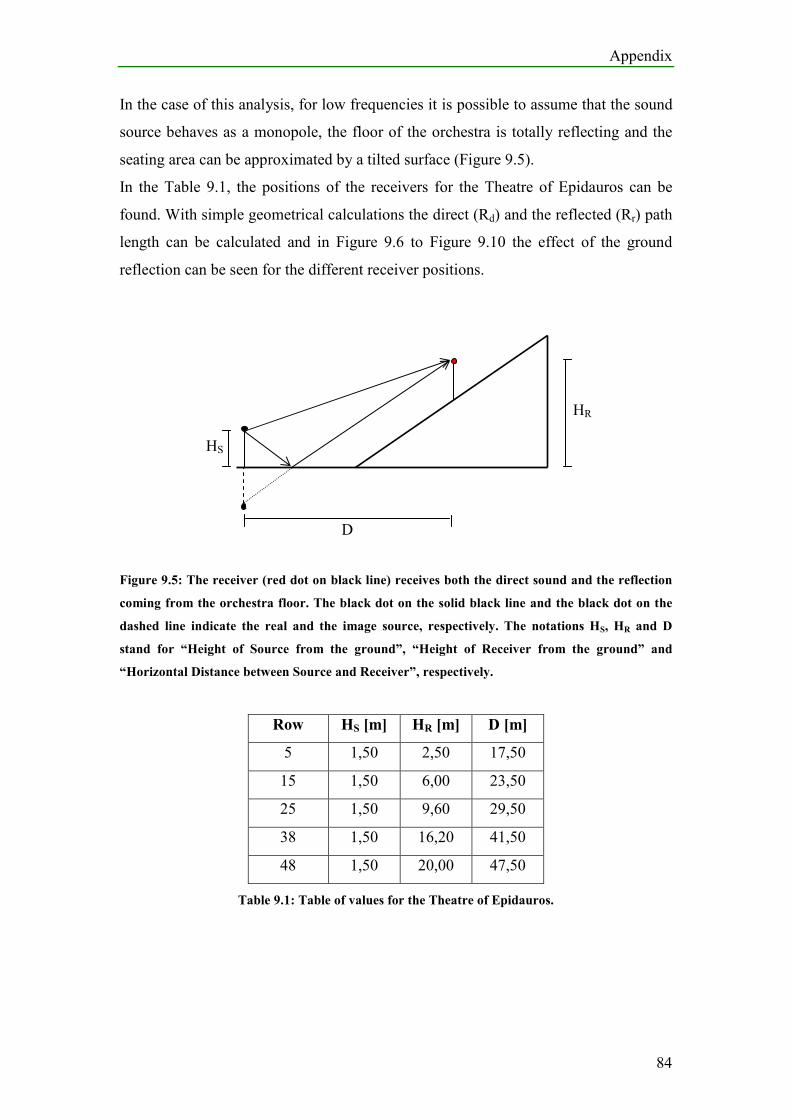
Appendix
84
In the case of this analysis, for low frequencies it is possible to assume that the sound
source behaves as a monopole, the floor of the orchestra is totally reflecting and the
seating area can be approximated by a tilted surface (Figure 9.5).
In the Table 9.1, the positions of the receivers for the Theatre of Epidauros can be
found. With simple geometrical calculations the direct (Rd) and the reflected (Rr) path
length can be calculated and in Figure 9.6 to Figure 9.10 the effect of the ground
reflection can be seen for the different receiver positions.
Figure 9.5: The receiver (red dot on black line) receives both the direct sound and the reflection
coming from the orchestra floor. The black dot on the solid black line and the black dot on the
dashed line indicate the real and the image source, respectively. The notations HS, HR and D
stand for “Height of Source from the ground”, “Height of Receiver from the ground” and
“Horizontal Distance between Source and Receiver”, respectively.
Row HS [m] HR [m] D [m]
5 1,50 2,50 17,50
15 1,50 6,00 23,50
25 1,50 9,60 29,50
38 1,50 16,20 41,50
48 1,50 20,00 47,50
Table 9.1: Table of values for the Theatre of Epidauros.
HR
D
HS
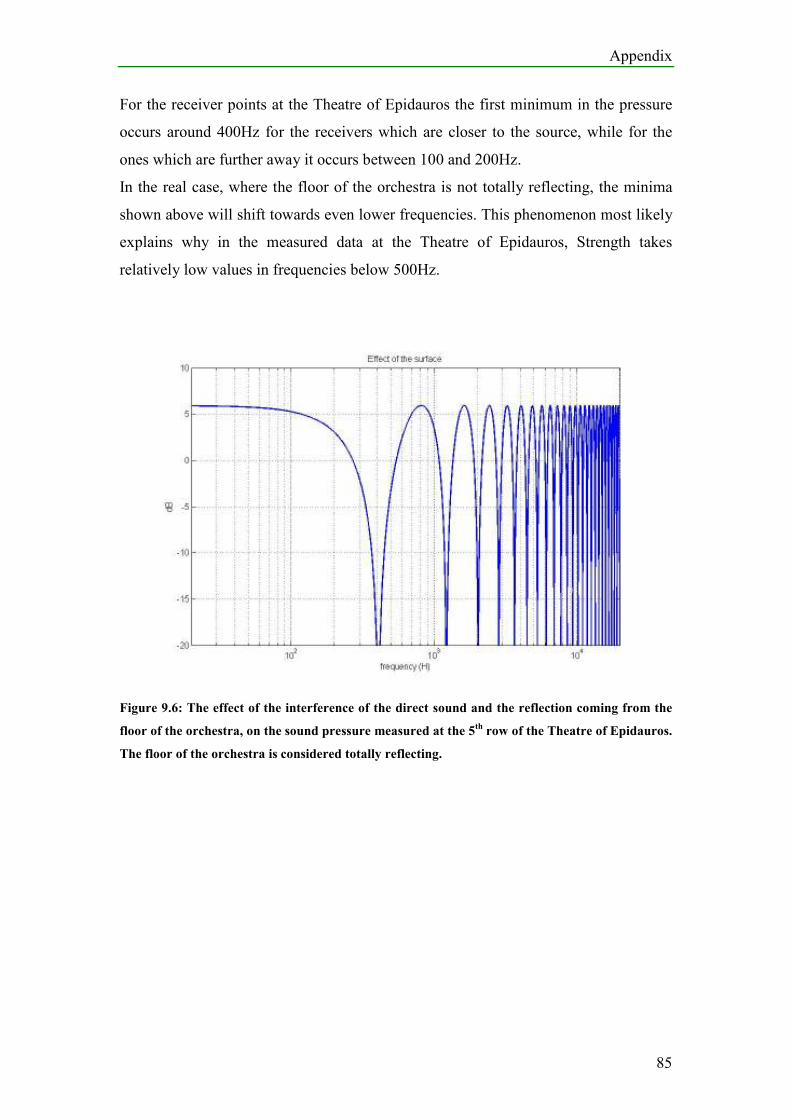
Appendix
85
For the receiver points at the Theatre of Epidauros the first minimum in the pressure
occurs around 400Hz for the receivers which are closer to the source, while for the
ones which are further away it occurs between 100 and 200Hz.
In the real case, where the floor of the orchestra is not totally reflecting, the minima
shown above will shift towards even lower frequencies. This phenomenon most likely
explains why in the measured data at the Theatre of Epidauros, Strength takes
relatively low values in frequencies below 500Hz.
Figure 9.6: The effect of the interference of the direct sound and the reflection coming from the
floor of the orchestra, on the sound pressure measured at the 5th row of the Theatre of Epidauros.
The floor of the orchestra is considered totally reflecting.

Appendix
86
Figure 9.7: The effect of the interference of the direct sound and the reflection coming from the
floor of the orchestra, on the sound pressure measured at the 15th row of the Theatre of
Epidauros. The floor of the orchestra is considered totally reflecting.
Figure 9.8: The effect of the interference of the direct sound and the reflection coming from the
floor of the orchestra, on the sound pressure measured at the 25th row of the Theatre of
Epidauros. The floor of the orchestra is considered totally reflecting.
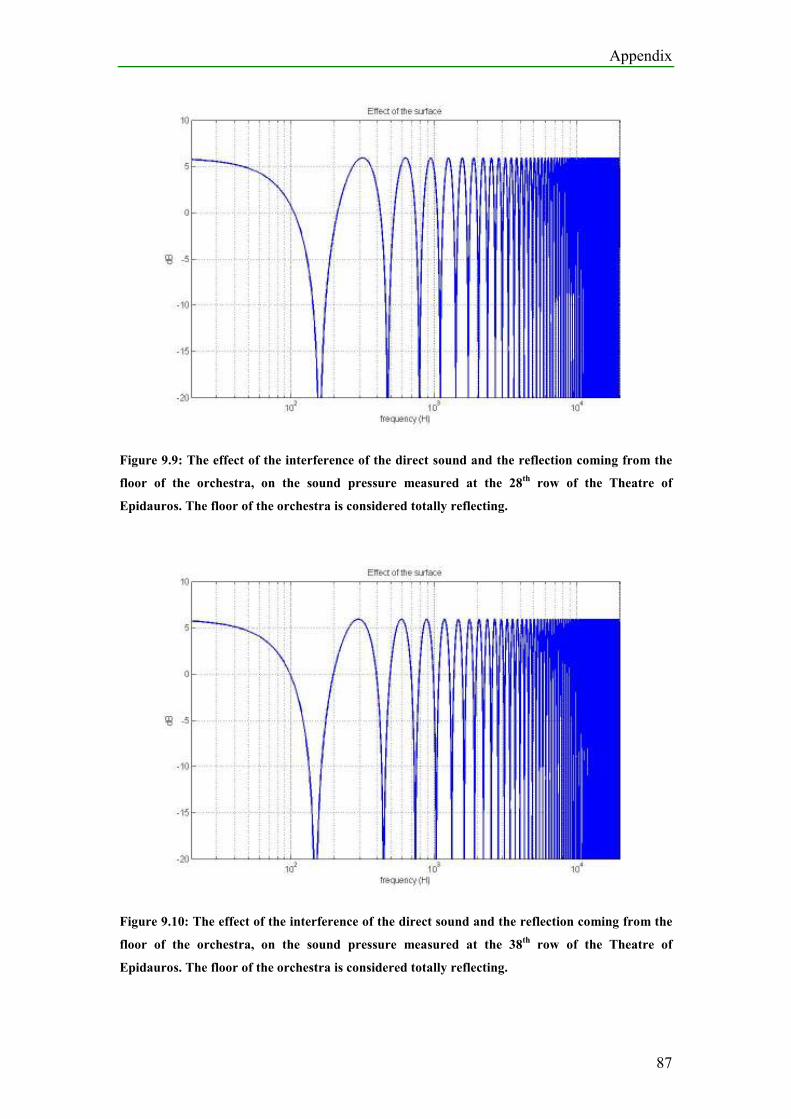
Appendix
87
Figure 9.9: The effect of the interference of the direct sound and the reflection coming from the
floor of the orchestra, on the sound pressure measured at the 28th row of the Theatre of
Epidauros. The floor of the orchestra is considered totally reflecting.
Figure 9.10: The effect of the interference of the direct sound and the reflection coming from the
floor of the orchestra, on the sound pressure measured at the 38th row of the Theatre of
Epidauros. The floor of the orchestra is considered totally reflecting.
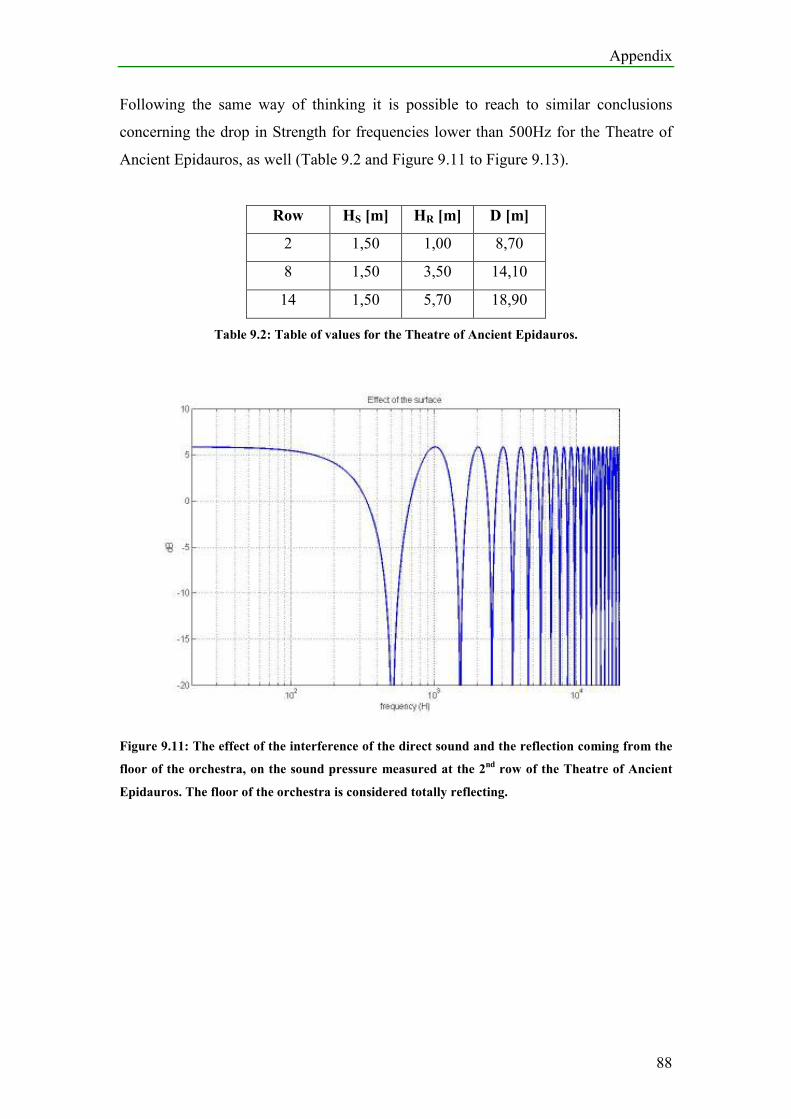
Appendix
88
Following the same way of thinking it is possible to reach to similar conclusions
concerning the drop in Strength for frequencies lower than 500Hz for the Theatre of
Ancient Epidauros, as well (Table 9.2 and Figure 9.11 to Figure 9.13).
Row HS [m] HR [m] D [m]
2 1,50 1,00 8,70
8 1,50 3,50 14,10
14 1,50 5,70 18,90
Table 9.2: Table of values for the Theatre of Ancient Epidauros.
Figure 9.11: The effect of the interference of the direct sound and the reflection coming from the
floor of the orchestra, on the sound pressure measured at the 2nd row of the Theatre of Ancient
Epidauros. The floor of the orchestra is considered totally reflecting.
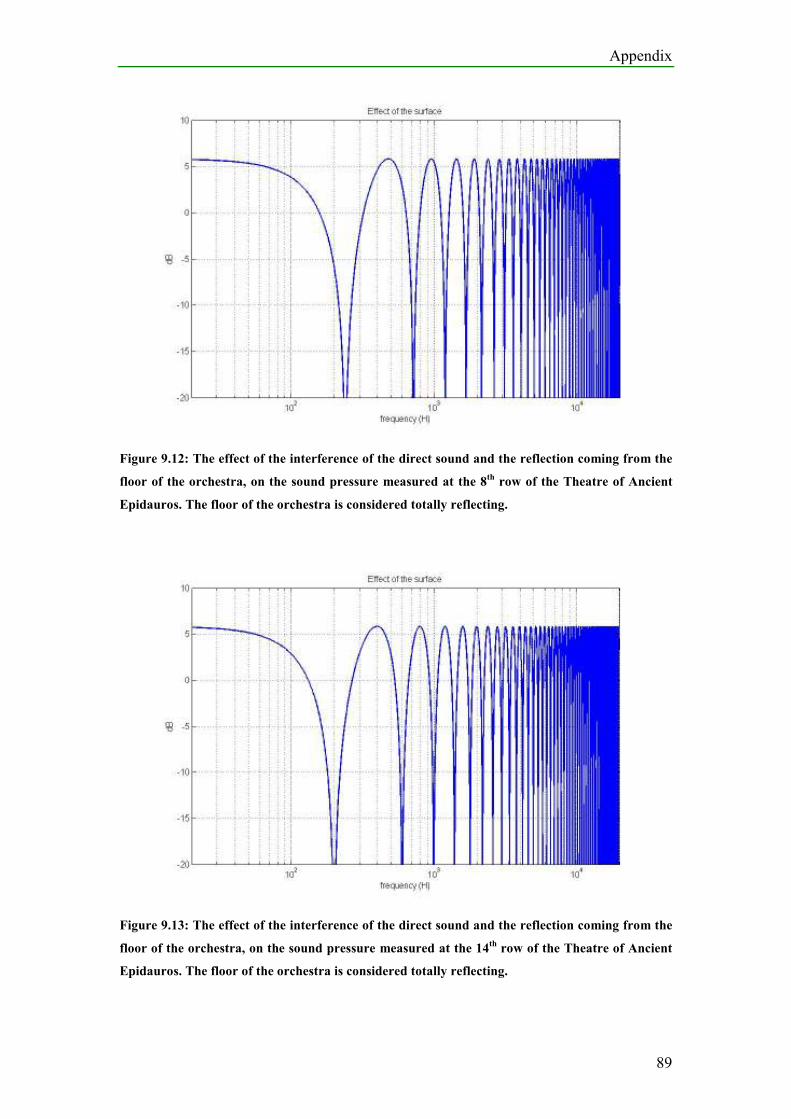
Appendix
89
Figure 9.12: The effect of the interference of the direct sound and the reflection coming from the
floor of the orchestra, on the sound pressure measured at the 8th row of the Theatre of Ancient
Epidauros. The floor of the orchestra is considered totally reflecting.
Figure 9.13: The effect of the interference of the direct sound and the reflection coming from the
floor of the orchestra, on the sound pressure measured at the 14th row of the Theatre of Ancient
Epidauros. The floor of the orchestra is considered totally reflecting.
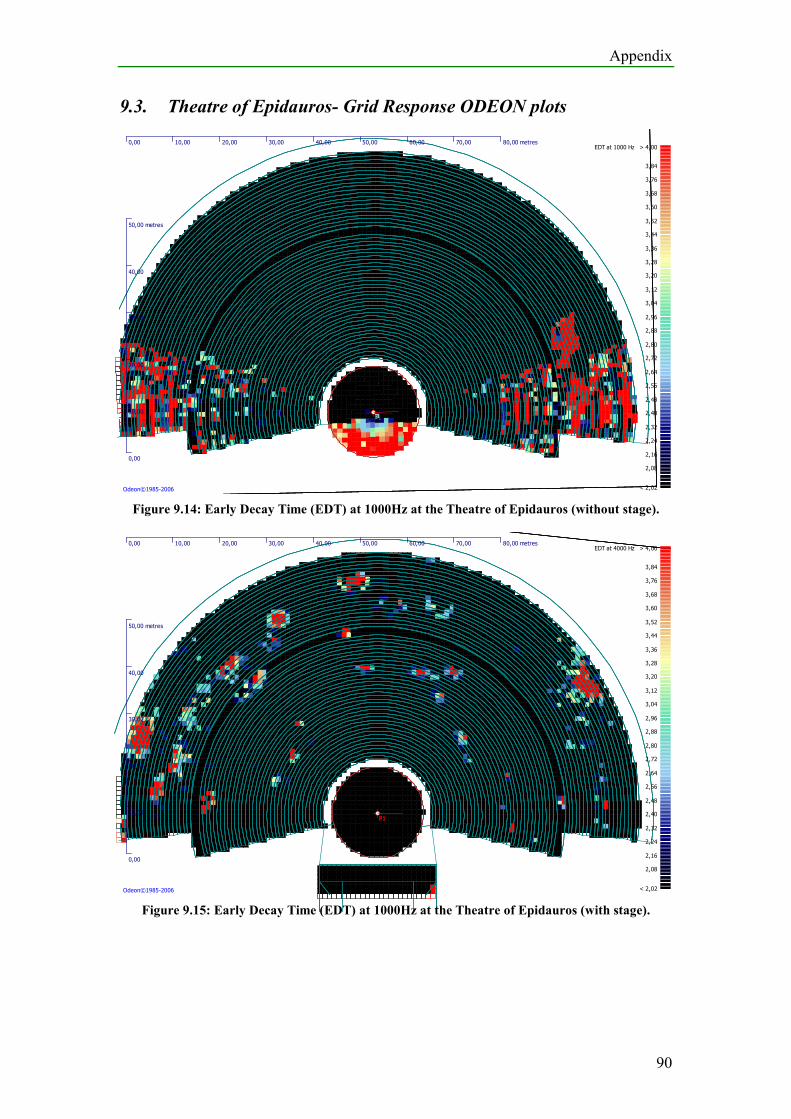
Appendix
90
9.3. Theatre of Epidauros- Grid Response ODEON plots
P1P1
0,00 10,00 20,00 30,00 40,00 50,00 60,00 70,00 80,00 metres
0,00
10,00
20,00
30,00
40,00
50,00 metres
3,84
3,76
3,68
3,60
3,52
3,44
3,36
3,28
3,20
3,12
3,04
2,96
2,88
2,80
2,72
2,64
2,56
2,48
2,40
2,32
2,24
2,16
2,08
EDT at 1000 Hz > 4,00
< 2,02Odeon©1985-2006
Figure 9.14: Early Decay Time (EDT) at 1000Hz at the Theatre of Epidauros (without stage).
P1P1
0,00 10,00 20,00 30,00 40,00 50,00 60,00 70,00 80,00 metres
0,00
10,00
20,00
30,00
40,00
50,00 metres
3,84
3,76
3,68
3,60
3,52
3,44
3,36
3,28
3,20
3,12
3,04
2,96
2,88
2,80
2,72
2,64
2,56
2,48
2,40
2,32
2,24
2,16
2,08
EDT at 4000 Hz > 4,00
< 2,02Odeon©1985-2006
Figure 9.15: Early Decay Time (EDT) at 1000Hz at the Theatre of Epidauros (with stage).
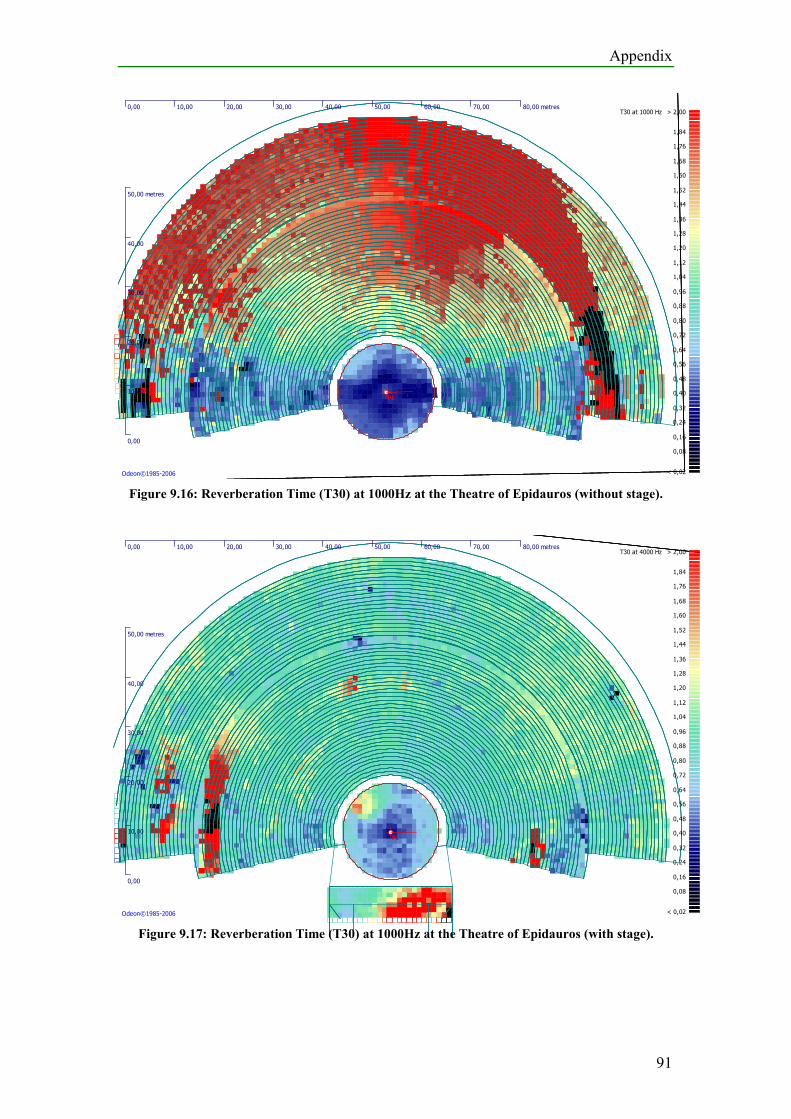
Appendix
91
P1P1
0,00 10,00 20,00 30,00 40,00 50,00 60,00 70,00 80,00 metres
0,00
10,00
20,00
30,00
40,00
50,00 metres
1,84
1,76
1,68
1,60
1,52
1,44
1,36
1,28
1,20
1,12
1,04
0,96
0,88
0,80
0,72
0,64
0,56
0,48
0,40
0,32
0,24
0,16
0,08
T30 at 1000 Hz > 2,00
< 0,02Odeon©1985-2006
Figure 9.16: Reverberation Time (T30) at 1000Hz at the Theatre of Epidauros (without stage).
P1P1
0,00 10,00 20,00 30,00 40,00 50,00 60,00 70,00 80,00 metres
0,00
10,00
20,00
30,00
40,00
50,00 metres
1,84
1,76
1,68
1,60
1,52
1,44
1,36
1,28
1,20
1,12
1,04
0,96
0,88
0,80
0,72
0,64
0,56
0,48
0,40
0,32
0,24
0,16
0,08
T30 at 4000 Hz > 2,00
< 0,02Odeon©1985-2006
Figure 9.17: Reverberation Time (T30) at 1000Hz at the Theatre of Epidauros (with stage).
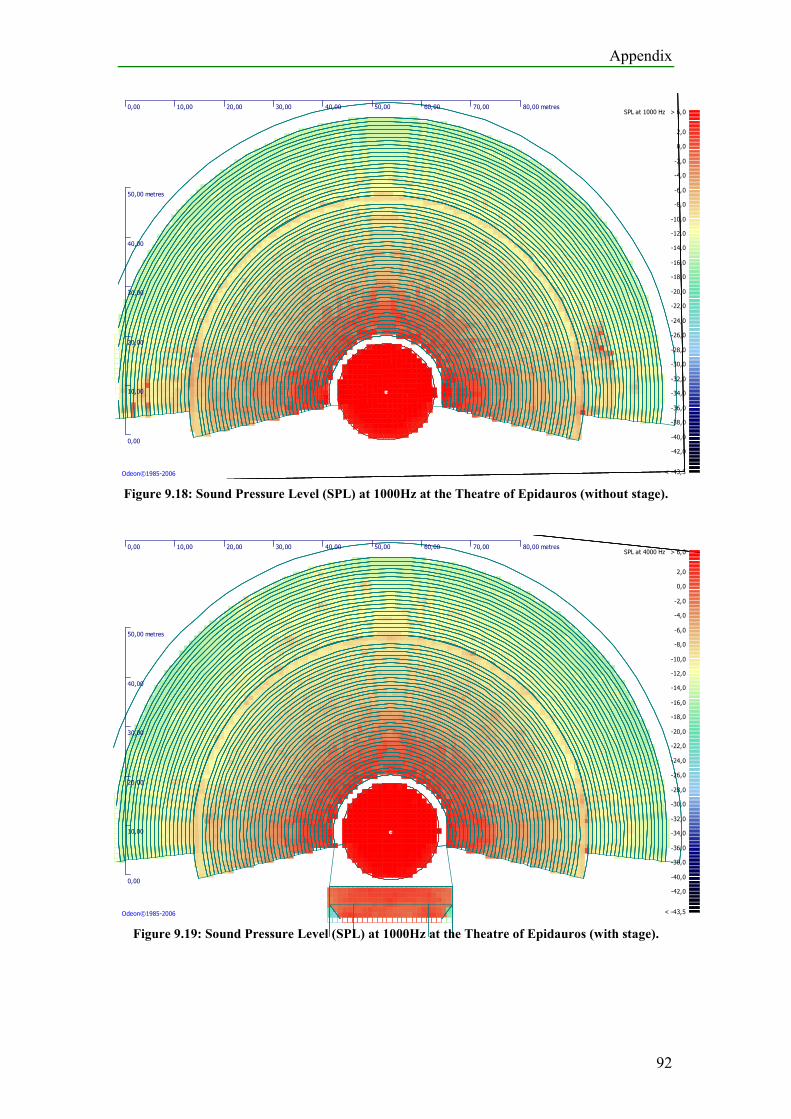
Appendix
92
P1P1
0,00 10,00 20,00 30,00 40,00 50,00 60,00 70,00 80,00 metres
0,00
10,00
20,00
30,00
40,00
50,00 metres
2,0
0,0
-2,0
-4,0
-6,0
-8,0
-10,0
-12,0
-14,0
-16,0
-18,0
-20,0
-22,0
-24,0
-26,0
-28,0
-30,0
-32,0
-34,0
-36,0
-38,0
-40,0
-42,0
SPL at 1000 Hz > 6,0
< -43,5Odeon©1985-2006
Figure 9.18: Sound Pressure Level (SPL) at 1000Hz at the Theatre of Epidauros (without stage).
P1P1
0,00 10,00 20,00 30,00 40,00 50,00 60,00 70,00 80,00 metres
0,00
10,00
20,00
30,00
40,00
50,00 metres
2,0
0,0
-2,0
-4,0
-6,0
-8,0
-10,0
-12,0
-14,0
-16,0
-18,0
-20,0
-22,0
-24,0
-26,0
-28,0
-30,0
-32,0
-34,0
-36,0
-38,0
-40,0
-42,0
SPL at 4000 Hz > 6,0
< -43,5Odeon©1985-2006
Figure 9.19: Sound Pressure Level (SPL) at 1000Hz at the Theatre of Epidauros (with stage).
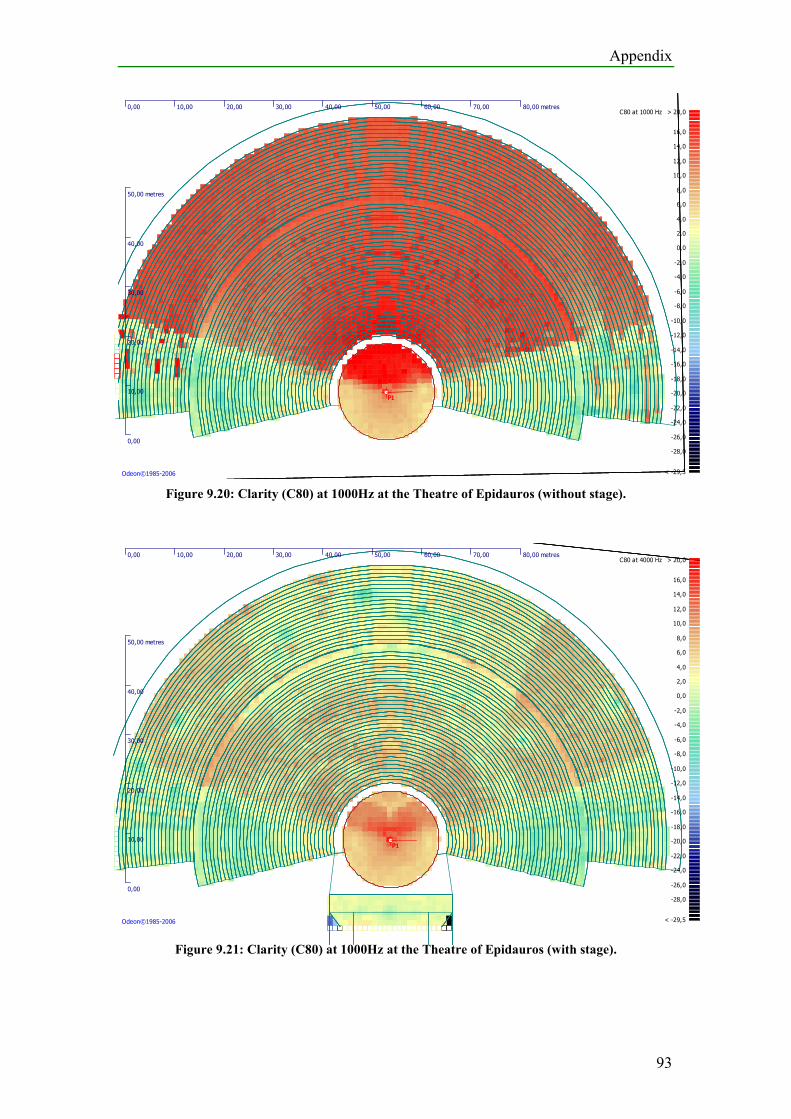
Appendix
93
P1P1
0,00 10,00 20,00 30,00 40,00 50,00 60,00 70,00 80,00 metres
0,00
10,00
20,00
30,00
40,00
50,00 metres
16,0
14,0
12,0
10,0
8,0
6,0
4,0
2,0
0,0
-2,0
-4,0
-6,0
-8,0
-10,0
-12,0
-14,0
-16,0
-18,0
-20,0
-22,0
-24,0
-26,0
-28,0
C80 at 1000 Hz > 20,0
< -29,5Odeon©1985-2006
Figure 9.20: Clarity (C80) at 1000Hz at the Theatre of Epidauros (without stage).
P1P1
0,00 10,00 20,00 30,00 40,00 50,00 60,00 70,00 80,00 metres
0,00
10,00
20,00
30,00
40,00
50,00 metres
16,0
14,0
12,0
10,0
8,0
6,0
4,0
2,0
0,0
-2,0
-4,0
-6,0
-8,0
-10,0
-12,0
-14,0
-16,0
-18,0
-20,0
-22,0
-24,0
-26,0
-28,0
C80 at 4000 Hz > 20,0
< -29,5Odeon©1985-2006
Figure 9.21: Clarity (C80) at 1000Hz at the Theatre of Epidauros (with stage).
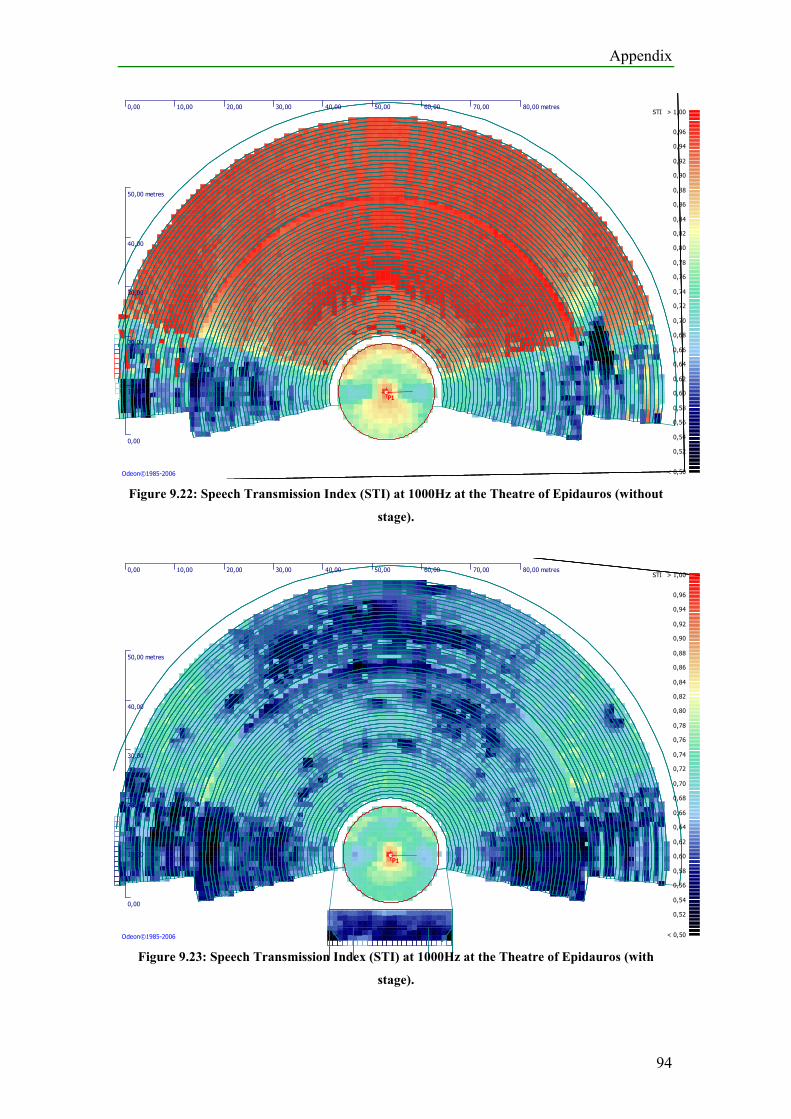
Appendix
94
P1P1
0,00 10,00 20,00 30,00 40,00 50,00 60,00 70,00 80,00 metres
0,00
10,00
20,00
30,00
40,00
50,00 metres
0,96
0,94
0,92
0,90
0,88
0,86
0,84
0,82
0,80
0,78
0,76
0,74
0,72
0,70
0,68
0,66
0,64
0,62
0,60
0,58
0,56
0,54
0,52
STI > 1,00
< 0,50Odeon©1985-2006
Figure 9.22: Speech Transmission Index (STI) at 1000Hz at the Theatre of Epidauros (without
stage).
P1P1
0,00 10,00 20,00 30,00 40,00 50,00 60,00 70,00 80,00 metres
0,00
10,00
20,00
30,00
40,00
50,00 metres
0,96
0,94
0,92
0,90
0,88
0,86
0,84
0,82
0,80
0,78
0,76
0,74
0,72
0,70
0,68
0,66
0,64
0,62
0,60
0,58
0,56
0,54
0,52
STI > 1,00
< 0,50Odeon©1985-2006
Figure 9.23: Speech Transmission Index (STI) at 1000Hz at the Theatre of Epidauros (with
stage).
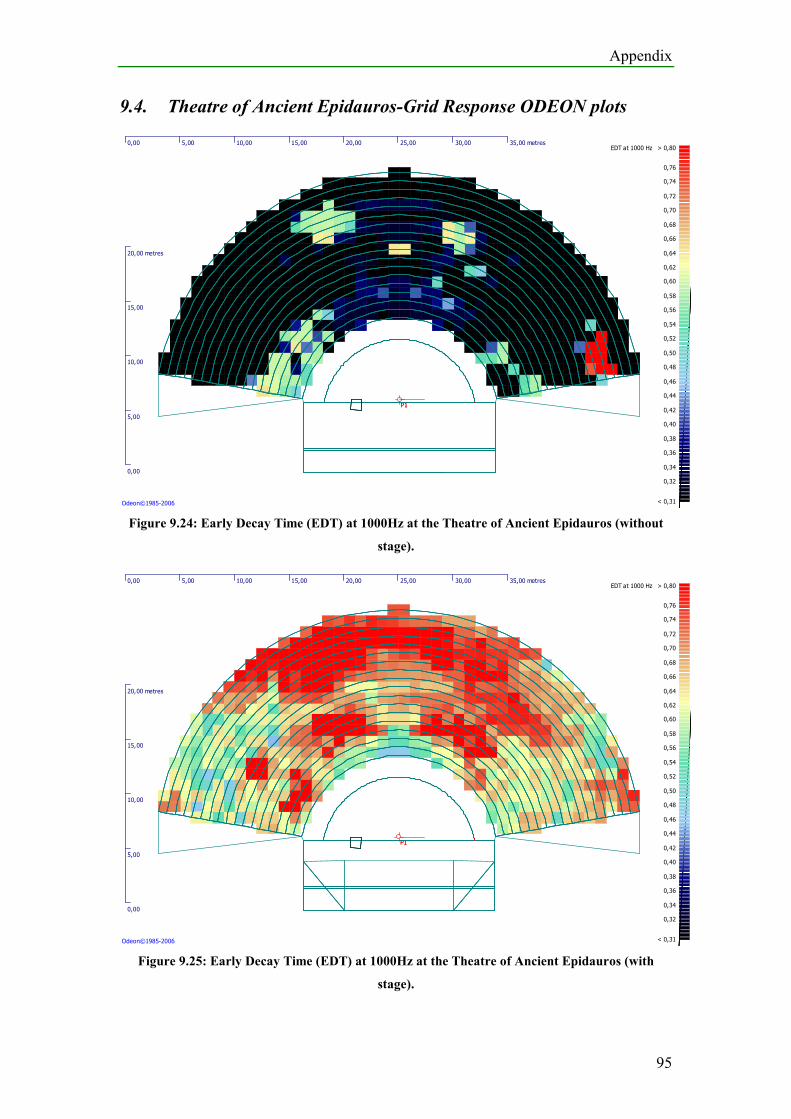
Appendix
95
9.4. Theatre of Ancient Epidauros-Grid Response ODEON plots
P1P1
0,00 5,00 10,00 15,00 20,00 25,00 30,00 35,00 metres
0,00
5,00
10,00
15,00
20,00 metres
0,76
0,74
0,72
0,70
0,68
0,66
0,64
0,62
0,60
0,58
0,56
0,54
0,52
0,50
0,48
0,46
0,44
0,42
0,40
0,38
0,36
0,34
0,32
EDT at 1000 Hz > 0,80
< 0,31Odeon©1985-2006
Figure 9.24: Early Decay Time (EDT) at 1000Hz at the Theatre of Ancient Epidauros (without
stage).
P1P1
0,00 5,00 10,00 15,00 20,00 25,00 30,00 35,00 metres
0,00
5,00
10,00
15,00
20,00 metres
0,76
0,74
0,72
0,70
0,68
0,66
0,64
0,62
0,60
0,58
0,56
0,54
0,52
0,50
0,48
0,46
0,44
0,42
0,40
0,38
0,36
0,34
0,32
EDT at 1000 Hz > 0,80
< 0,31Odeon©1985-2006
Figure 9.25: Early Decay Time (EDT) at 1000Hz at the Theatre of Ancient Epidauros (with
stage).
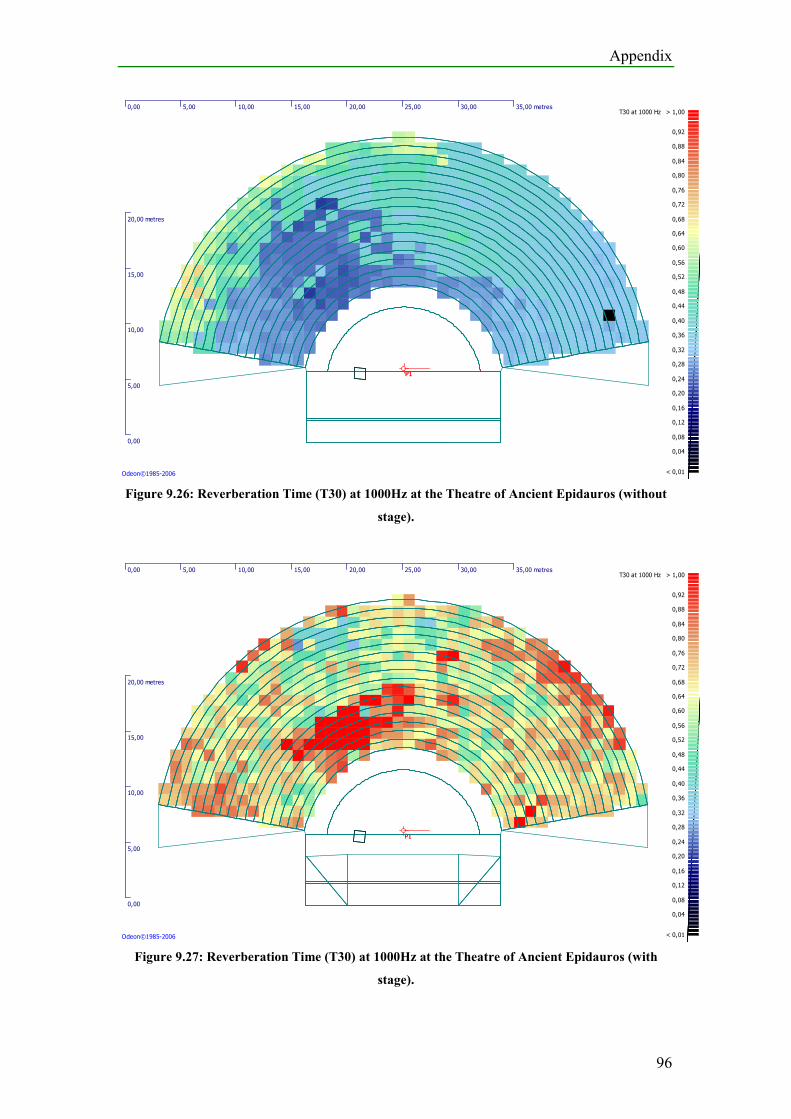
Appendix
96
P1P1
0,00 5,00 10,00 15,00 20,00 25,00 30,00 35,00 metres
0,00
5,00
10,00
15,00
20,00 metres
0,92
0,88
0,84
0,80
0,76
0,72
0,68
0,64
0,60
0,56
0,52
0,48
0,44
0,40
0,36
0,32
0,28
0,24
0,20
0,16
0,12
0,08
0,04
T30 at 1000 Hz > 1,00
< 0,01Odeon©1985-2006
Figure 9.26: Reverberation Time (T30) at 1000Hz at the Theatre of Ancient Epidauros (without
stage).
P1P1
0,00 5,00 10,00 15,00 20,00 25,00 30,00 35,00 metres
0,00
5,00
10,00
15,00
20,00 metres
0,92
0,88
0,84
0,80
0,76
0,72
0,68
0,64
0,60
0,56
0,52
0,48
0,44
0,40
0,36
0,32
0,28
0,24
0,20
0,16
0,12
0,08
0,04
T30 at 1000 Hz > 1,00
< 0,01Odeon©1985-2006
Figure 9.27: Reverberation Time (T30) at 1000Hz at the Theatre of Ancient Epidauros (with
stage).
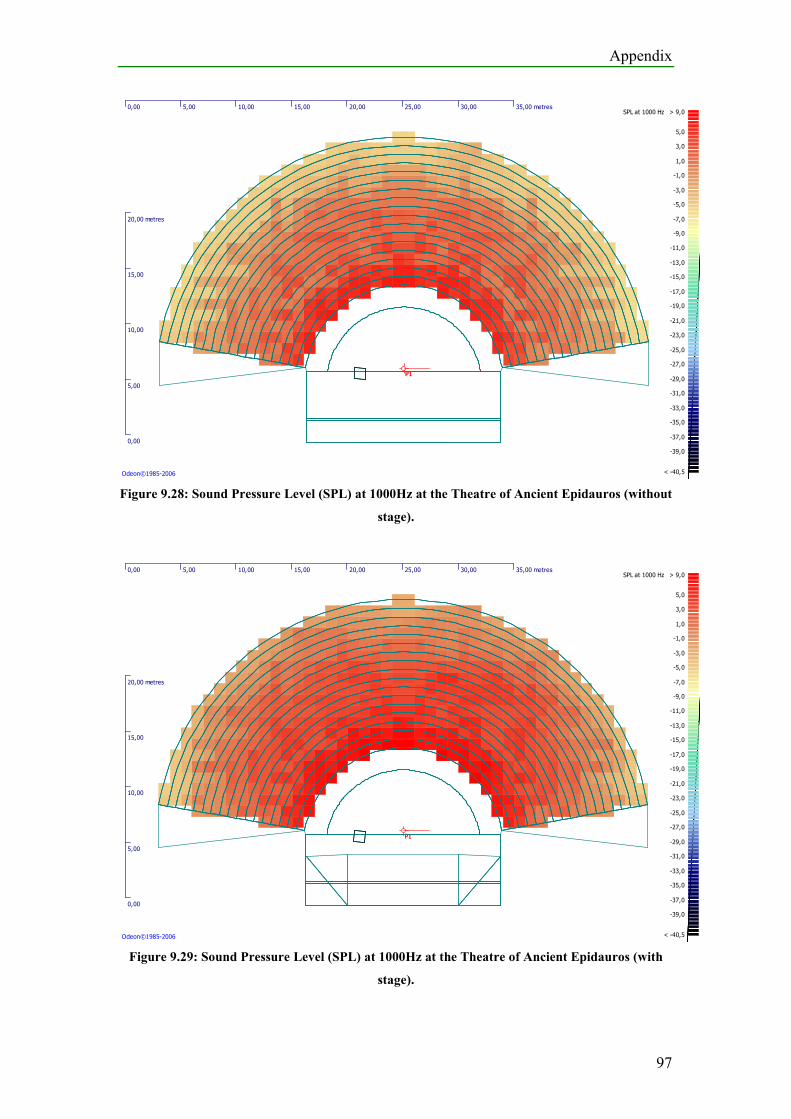
Appendix
97
P1P1
0,00 5,00 10,00 15,00 20,00 25,00 30,00 35,00 metres
0,00
5,00
10,00
15,00
20,00 metres
5,0
3,0
1,0
-1,0
-3,0
-5,0
-7,0
-9,0
-11,0
-13,0
-15,0
-17,0
-19,0
-21,0
-23,0
-25,0
-27,0
-29,0
-31,0
-33,0
-35,0
-37,0
-39,0
SPL at 1000 Hz > 9,0
< -40,5Odeon©1985-2006
Figure 9.28: Sound Pressure Level (SPL) at 1000Hz at the Theatre of Ancient Epidauros (without
stage).
P1P1
0,00 5,00 10,00 15,00 20,00 25,00 30,00 35,00 metres
0,00
5,00
10,00
15,00
20,00 metres
5,0
3,0
1,0
-1,0
-3,0
-5,0
-7,0
-9,0
-11,0
-13,0
-15,0
-17,0
-19,0
-21,0
-23,0
-25,0
-27,0
-29,0
-31,0
-33,0
-35,0
-37,0
-39,0
SPL at 1000 Hz > 9,0
< -40,5Odeon©1985-2006
Figure 9.29: Sound Pressure Level (SPL) at 1000Hz at the Theatre of Ancient Epidauros (with
stage).
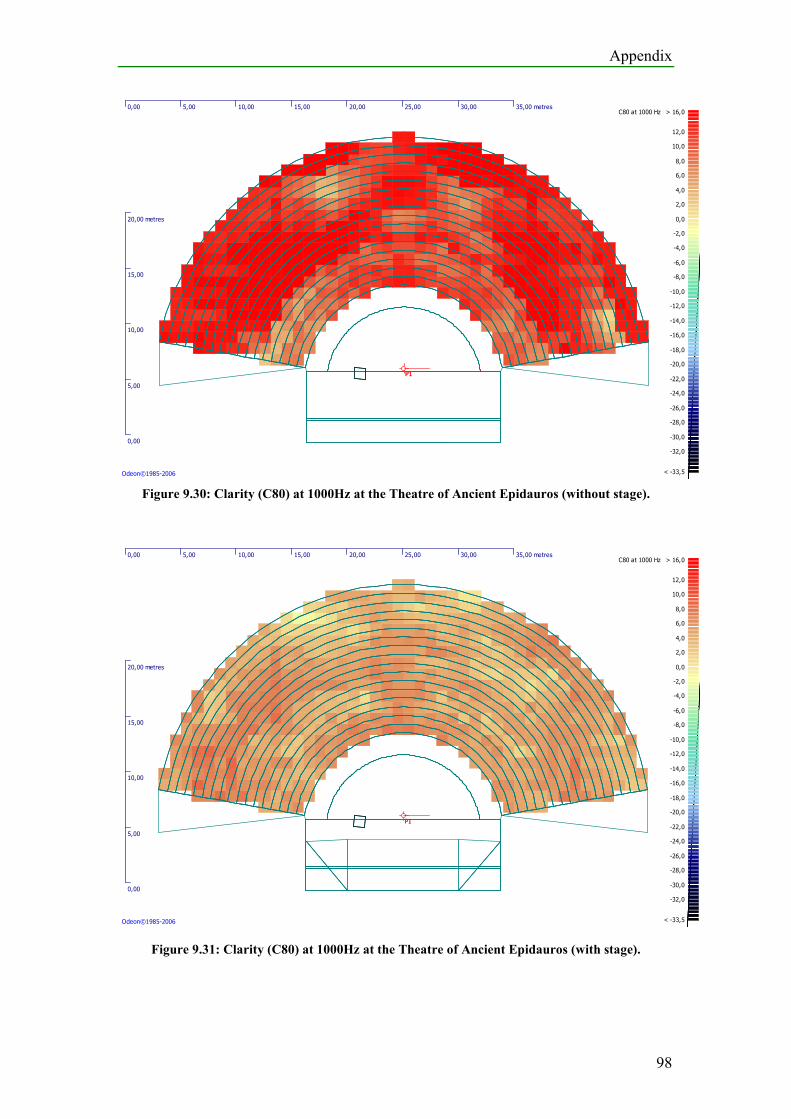
Appendix
98
P1P1
0,00 5,00 10,00 15,00 20,00 25,00 30,00 35,00 metres
0,00
5,00
10,00
15,00
20,00 metres
12,0
10,0
8,0
6,0
4,0
2,0
0,0
-2,0
-4,0
-6,0
-8,0
-10,0
-12,0
-14,0
-16,0
-18,0
-20,0
-22,0
-24,0
-26,0
-28,0
-30,0
-32,0
C80 at 1000 Hz > 16,0
< -33,5Odeon©1985-2006
Figure 9.30: Clarity (C80) at 1000Hz at the Theatre of Ancient Epidauros (without stage).
P1P1
0,00 5,00 10,00 15,00 20,00 25,00 30,00 35,00 metres
0,00
5,00
10,00
15,00
20,00 metres
12,0
10,0
8,0
6,0
4,0
2,0
0,0
-2,0
-4,0
-6,0
-8,0
-10,0
-12,0
-14,0
-16,0
-18,0
-20,0
-22,0
-24,0
-26,0
-28,0
-30,0
-32,0
C80 at 1000 Hz > 16,0
< -33,5Odeon©1985-2006
Figure 9.31: Clarity (C80) at 1000Hz at the Theatre of Ancient Epidauros (with stage).
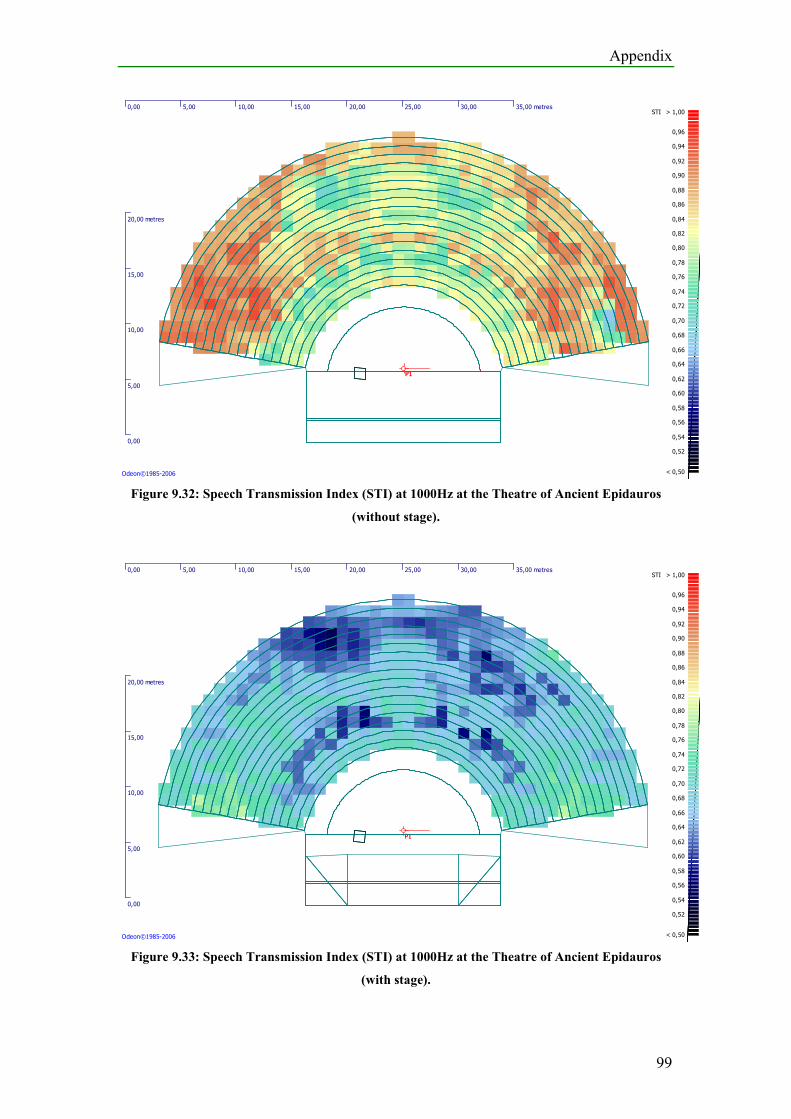
Appendix
99
P1P1
0,00 5,00 10,00 15,00 20,00 25,00 30,00 35,00 metres
0,00
5,00
10,00
15,00
20,00 metres
0,96
0,94
0,92
0,90
0,88
0,86
0,84
0,82
0,80
0,78
0,76
0,74
0,72
0,70
0,68
0,66
0,64
0,62
0,60
0,58
0,56
0,54
0,52
STI > 1,00
< 0,50Odeon©1985-2006
Figure 9.32: Speech Transmission Index (STI) at 1000Hz at the Theatre of Ancient Epidauros
(without stage).
P1P1
0,00 5,00 10,00 15,00 20,00 25,00 30,00 35,00 metres
0,00
5,00
10,00
15,00
20,00 metres
0,96
0,94
0,92
0,90
0,88
0,86
0,84
0,82
0,80
0,78
0,76
0,74
0,72
0,70
0,68
0,66
0,64
0,62
0,60
0,58
0,56
0,54
0,52
STI > 1,00
< 0,50Odeon©1985-2006
Figure 9.33: Speech Transmission Index (STI) at 1000Hz at the Theatre of Ancient Epidauros
(with stage).
Glossary
100
10. Glossary
Diazoma = (διάζωµα/Greek) Horizontal walkway separating the upper and lower
sections of the koilon;
Hellenic = Greek
Kerkida = (Greek; pl. kerkides) wedge-shaped seating section in the koilon;
Klimaka= (κλίµακα/Greek; pl. klimakes), Staircase between the kerkides in the koilon;
Koryphaios = (κορυφαίος/Greek) the leader of the chorus;
Koilon = (κοίλον/ Greek), theatron (hel.), cavea (lat.), seating area;
Logeion = (λογείον/Greek) stage; performances in the Hellenistic period included
actors placed on a raised platform or stage behind the orchestra and in front of the
skene; the roof of the proskenion could be employed for this purpose;
Orchestra = (ορχήστρα) the area between the Koilon and the Skene, where the chorus
performed;
Proscenion = (προσκήνιο/Greek, Proscaenium/Latin) front wall of the skene; an
acting area which projected in front of the skene; in Classical Greek theatre, the
ground-level portion immediately in front of the skene was used as an acting area; in
Hellenistic period, the proskenion was a raised platform in front of the skene; the
skene eventually included two levels, a lower level with a roof (the Hellenistic
logeion or stage) and the second story skene with openings for entrances (thyromata);
Skene = (σκηνή) the stage house;
Thymeli = (θυµέλη) the center of the orchestra of an Ancient Greek Theatre; at the
early years it was meant to be an altar and later on, a place, where the leader of the
chorus (koryphaios) was standing.