Embed Size (px)
Citation preview
The Luxury Goods VoteWhy Left Governments are Punished More for Economic
Downturns – Draft ∗
Mark A. Kayser†
Cassandra Grafstrom‡
27 October 2016
Abstract
Voters often punish incumbent parties for poor economic performance; whether theytreat left and right governments differently has been less clear. We leverage bothobservational and experimental data to establish an empirical regularity: voters,on average, punish left-of-center incumbents more severely for economic downturnsthan their counterparts on the right. A luxury goods model of voting best ex-plains this regularity. When times get tough, voters prioritize economic securityover luxury goods policies – socially desirable but post-material policies most of-ten associated with the left that voters support in abundant times. We reach thisconclusion after running a ‘tournament of theories’ subjecting plausible rival hy-potheses to empirical tests. The data suggest that the vote swing against the left indownturns does not arise from clientelism, partisan accountability, issue ownershipor voters’ fear of redistribution but rather from an aversion to spending on luxurygoods policies when times are lean.
∗The authors thank Tarik Abou-Chadi, Chris Dawes, Jason Eichorst, Holger Doring, Simon Hug, RayDuch, Catherine DeVries, Geoff Evans, Alex Hennessey, Tim Hicks, Karen Jusko, Margaret Levi, NoamLupu, Daniela Niesta Kayser, Anja Neundorf, Sergi Pardos-Prado, Thomas Plumper, Jonathan Rod-den, Thomas Sattler, Ken Scheve, Zeynep Somer-Topcu, Luis Schiumerini, Randy Stevenson, ChristianTraxler, Guy Whitten, Chis Wlezien, Reto Wuest and participants at seminars at Bocconi, Carlos IIIJuan-March, Cologne, Geneva, Hertie, Michigan, Oxford, Stanford, Texas, Texas A&M, and UCL, aswell as at EPSA and MPSA for helpful comments. We thank Julian Zuber for his research assistance.Cassandra Grafstrom thanks the Hertie School of Governance, Berlin, for the support of a pre-doctoralPolitical Economy Cluster Fellowship that funded part of her work on this project. All errors remain theauthors’. DOI: 10.13140/RG.2.2.24409.31841†Hertie School of Governance, Berlin, [email protected]‡University of Michigan, [email protected]
This financial crisis is for capitalist neo-liberals what Chernobyl was for thenuclear lobby. — Daniel Cohn-Bendit, 2008.1
1 Introduction
When the political reckoning arrived after the global financial crisis began in 2008, more
people than Daniel Cohn-Bendit, a charismatic and visible leader on the European Par-
liamentary left, were surprised. Despite the at least partial culpability of large banks
operating under the loose regulatory schemes promoted by the right for the crisis, voters
in most developed democracies failed to favor the left on election day. In six out of 10
Western European elections between between 2008 and 2010, the largest party on the left
actually lost seats in parliament and if one omits countries that received IMF bailouts,
the left in those countries with the most severe crises generally fared worst (Barnes and
Hicks, 2012). Incumbents, in general, fared better than one would expect given the cir-
cumstances, but, where governments actually lost office, center-left governments were
often replaced by the center-right (LeDuc and Pammett, 2013). What explains the poor
performance of the left?
Voters often hold governments accountable for the economy. But are all governments,
right and left, treated alike? Or, given partisan differences in economic policy, might voters
favor governments of a particular partisan stripe in different economic circumstances? The
voluminous literature on the economy and elections has relatively neglected the question
of whether and how government partisanship matters for electoral outcomes despite a
record of systematic differences in how the left and right behave once in office. Voters
retrospectively hold governments accountable for their economic performance but if policy
promises and reputations have any predictive power, should not voters also prospectively
choose their governing parties? Indeed, two modest literatures, which we examine below,
claim that prospective and positional voting does occur – albeit with remarkably contrary
claims. In contrast, recent work on the partisan consequences of the Great Recession has
1As quoted in The Guardian, 17 September 2008
2
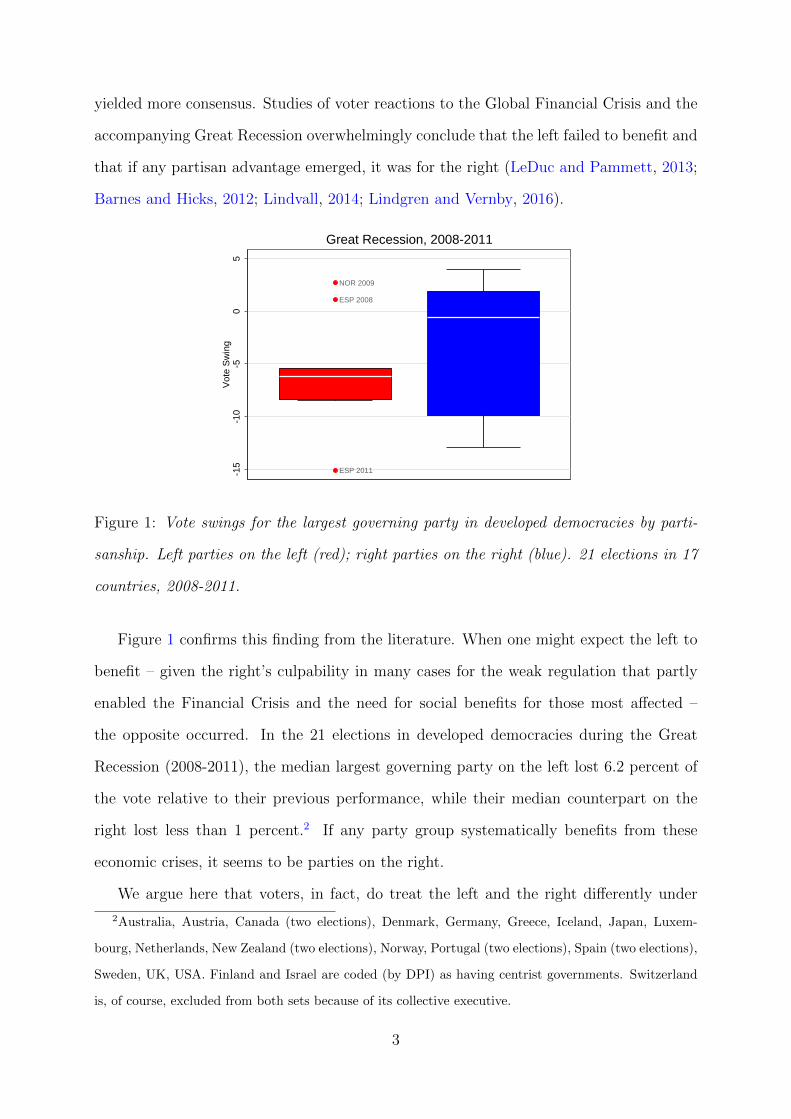
yielded more consensus. Studies of voter reactions to the Global Financial Crisis and the
accompanying Great Recession overwhelmingly conclude that the left failed to benefit and
that if any partisan advantage emerged, it was for the right (LeDuc and Pammett, 2013;
Barnes and Hicks, 2012; Lindvall, 2014; Lindgren and Vernby, 2016).
ESP 2011
ESP 2008
NOR 2009
-15
-10
-50
5V
ote
Sw
ing
Great Recession, 2008-2011
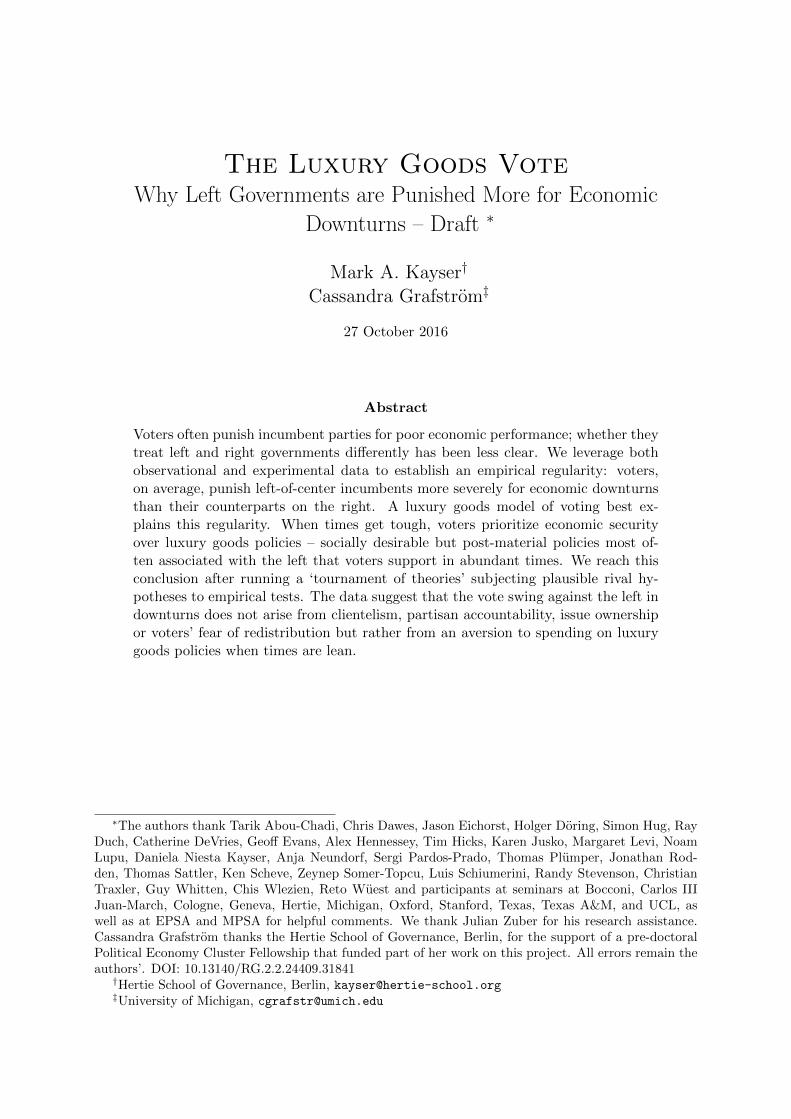
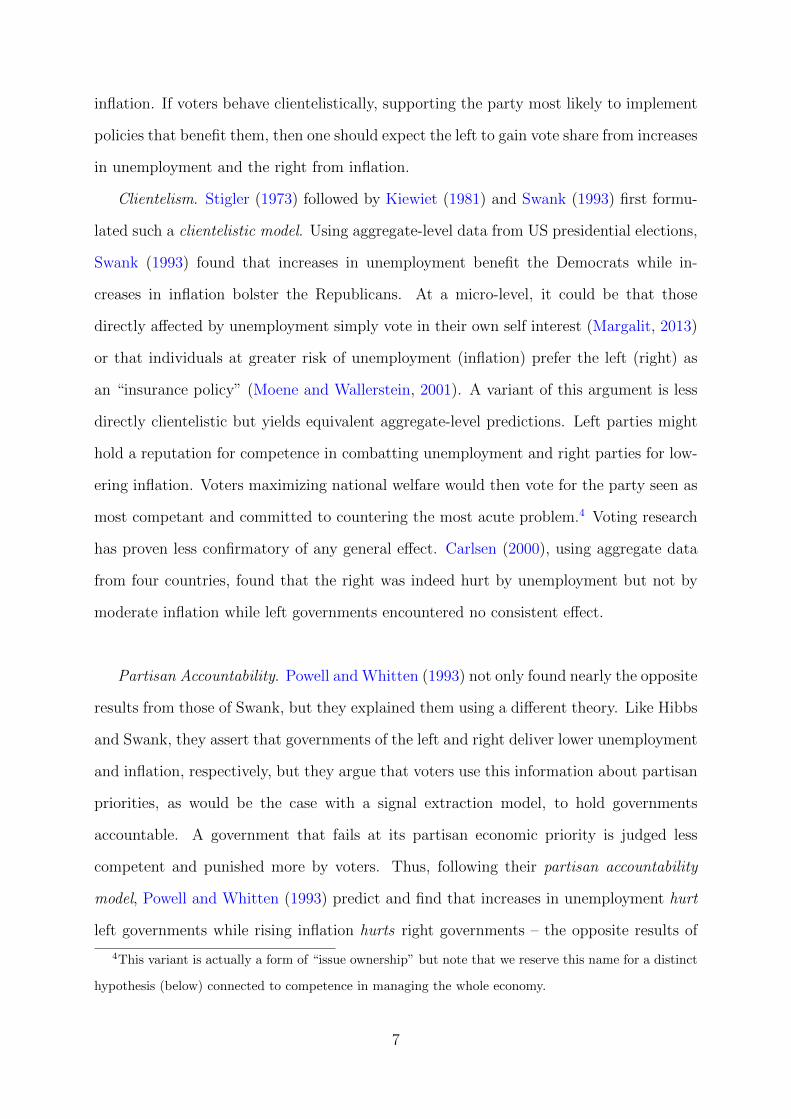
Figure 1: Vote swings for the largest governing party in developed democracies by parti-
sanship. Left parties on the left (red); right parties on the right (blue). 21 elections in 17
countries, 2008-2011.
Figure 1 confirms this finding from the literature. When one might expect the left to
benefit – given the right’s culpability in many cases for the weak regulation that partly
enabled the Financial Crisis and the need for social benefits for those most affected –
the opposite occurred. In the 21 elections in developed democracies during the Great
Recession (2008-2011), the median largest governing party on the left lost 6.2 percent of
the vote relative to their previous performance, while their median counterpart on the
right lost less than 1 percent.2 If any party group systematically benefits from these
economic crises, it seems to be parties on the right.
We argue here that voters, in fact, do treat the left and the right differently under
2Australia, Austria, Canada (two elections), Denmark, Germany, Greece, Iceland, Japan, Luxem-
bourg, Netherlands, New Zealand (two elections), Norway, Portugal (two elections), Spain (two elections),
Sweden, UK, USA. Finland and Israel are coded (by DPI) as having centrist governments. Switzerland
is, of course, excluded from both sets because of its collective executive.
3
given economic circumstances. We do not contest the findings of retrospective economic
voting but rather we posit that a second process connecting the economy to partisan vote
choice occurs simultaneously. Voters do punish or reward incumbent governments for
economic conditions, albeit inconsistently (Anderson, 2007; Kayser, 2014), regardless of
their partisan complexion. They also vote partially prospectively on the basis of parties’
expected policies (Kedar, 2005; Macdonald, Listhaug and Rabinowitz, 1991).
Using observational data from two extensive individual-level panels (the Comparative
Study of Electoral Systems and the Eurobarometer Trendfile) we establish that voters
do, on average, punish left incumbents more than right incumbents when the economy
weakens and, critically, that the magnitude of this effect increases with the leftness of the
governing party. The analysis of subsamples and a survey experiment then sort out the
mechanism by which this effect emerges. Evaluating five potential mechanisms, we argue
that voters associate left parties more with the provision of socially desirable “luxury
goods” that enjoy more support when times are good, such as environmental programs,
international aid, the protection of minority rights and the arts. Luxury goods, in contrast
to necessary and inferior goods, are items that are consumed more as wealth rises.3
When the economy is doing well, voters are more willing to support luxury good
programs. During economic contractions, however, voters prioritize material policies as
the salience of – and, hence, support for – luxury goods policies wanes, as does support
for “luxury goods parties.” Left governments are punished like any other government
for a weak economy but when the economy sours, they are additionally disadvantaged
by their association with luxury goods policies. The increased emphasis of center-left
parties in recent decades on luxury good issues (Kitschelt, 1994; Gerring, 2001) have
helped them attract socio-cultural professionals and prosper during expansions. Issue-
ownership, however, is sticky and results in their punishment when the economy falters
and voters prioritize material issues.
3Thus, they can also include long-term investments such as in medical research but the biggest dis-
tinction between parties of the left and right concerns post-materialist policies such as environmental
protection or minority rights.
4
The primary contributions of this paper are (1) the clear establishment of a fundamen-
tal empirical regularity – left parties, at least those associated with luxury-good policies,
lose support during economic downturns when unemployment climbs – and (2) the eluci-
dation of how this comes about. We are not the first to claim that the economy exercises
a systematic partisan effect on the vote – advantages for both the left and the right have
been previously claimed – nor even the first to argue that the right benefits from down-
turns. We are, however, the first to test for a systematic partisan electoral regularity
in individual voting behavior in response to the economy across such a broad sample of
countries and time periods. The first contribution of this paper is thus to establish a clear
empirical regularity.
We are also the first to systematically test a broad set of plausible and often contradic-
tory causal mechanisms – all of which find some empirical support in previous literature
– in a “tournament of theories.” We do so with extensive individual-level, cross-national
panels (CSES and Eurobarometer) and, where outcomes are observationally equivalent,
we distinguish between mechanisms with the analysis of sample subsets and a survey
experiment. Previous work has been theoretically piecemeal. Despite all holding par-
tisan implications, the contributions to partisan voting theory that we cite below often
do not cite each other. Thus, authors, in isolation, have sometimes found similar effects
but attributed them to very different causes or to regional peculiarities (e.g., such as the
historic role of the left in Scandinavia, Pacek and Radcliff, 1999). We take a more holistic
tack, collecting research from disparate research areas relevant to the economy’s effect on
voters’ partisan preferences and systematically comparing each theory’s empirical impli-
cations to the data. We conclude that when the economy weakens voters drift away from
parties of the left and that a diminished salience of luxury goods policies best explains
this.
5
2 Five Partisan Models of Voting
Five broad models of voter behavior connect parties’ partisan position and the vote, each
with a varying degree of empirical support. Voters may simply choose the party most
likely to tilt public spending and economic policy in their favor (clientelism); they may
assess outcomes in light of the government’s partisan priorities to infer competence and
hold incumbents accountable (partisan accountability); they could use party reputations
for competence on issues – say fighting inflation or lowering unemployment – to choose
the party most fit to address salient problems (issue ownership); or they might evaluate
their own welfare lexicographically, prioritizing necessary goods, such as security and per-
sonal welfare, over luxury goods, such as environmental programs, during downturns but
supporting spending on luxury goods during good times once their needs for necessary
goods have been met. Politically this would translate into punishing parties – the left
– associated with luxury good spending during downturns but supporting them during
expansions (luxury goods model). All of these models of behavior are plausible and find
some amount of support in the literature. We evaluate each of these models with ob-
servational panel data below. Where their predictions are observationally equivalent, we
add survey experiments to distinguish between them. Let us first, however, explain the
models.
2.1 Four rival models
Parties of the left and right govern differently. A key difference arrises from the tendency
of parties to privilege the interests of their core constituencies while in office (Bartels, 2010;
Gilens and Page, 2014). One means toward this end could be macroeconomic policy, with
left governments presiding over over lower unemployment and the right keeping inflation
better in check (Hibbs, 1977; Alesina, 1987). Informed voters thus might have a material
incentive to prefer left or right governments. The economy, in addition to being a valence
issue – (nearly) all voters prefer a growing economy – can be considered a “positional”
issue about which voters have different preferences – e.g., lower unemployment vs. lower
6
inflation. If voters behave clientelistically, supporting the party most likely to implement
policies that benefit them, then one should expect the left to gain vote share from increases
in unemployment and the right from inflation.
Clientelism. Stigler (1973) followed by Kiewiet (1981) and Swank (1993) first formu-
lated such a clientelistic model. Using aggregate-level data from US presidential elections,
Swank (1993) found that increases in unemployment benefit the Democrats while in-
creases in inflation bolster the Republicans. At a micro-level, it could be that those
directly affected by unemployment simply vote in their own self interest (Margalit, 2013)
or that individuals at greater risk of unemployment (inflation) prefer the left (right) as
an “insurance policy” (Moene and Wallerstein, 2001). A variant of this argument is less
directly clientelistic but yields equivalent aggregate-level predictions. Left parties might
hold a reputation for competence in combatting unemployment and right parties for low-
ering inflation. Voters maximizing national welfare would then vote for the party seen as
most competant and committed to countering the most acute problem.4 Voting research
has proven less confirmatory of any general effect. Carlsen (2000), using aggregate data
from four countries, found that the right was indeed hurt by unemployment but not by
moderate inflation while left governments encountered no consistent effect.
Partisan Accountability. Powell and Whitten (1993) not only found nearly the opposite
results from those of Swank, but they explained them using a different theory. Like Hibbs
and Swank, they assert that governments of the left and right deliver lower unemployment
and inflation, respectively, but they argue that voters use this information about partisan
priorities, as would be the case with a signal extraction model, to hold governments
accountable. A government that fails at its partisan economic priority is judged less
competent and punished more by voters. Thus, following their partisan accountability
model, Powell and Whitten (1993) predict and find that increases in unemployment hurt
left governments while rising inflation hurts right governments – the opposite results of
4This variant is actually a form of “issue ownership” but note that we reserve this name for a distinct
hypothesis (below) connected to competence in managing the whole economy.
7
Swank (1993).
More recent work has been more sceptical, showing that inflation differences under
left and right governments emerge in policy makers’ expectations, but not in economic
data (Gandrud and Grafstrom, 2015). The likely source for the demise of the “partisan
business cycle,” if it ever existed, is the limited influence of policymakers over monetary
policy in most developed economies. Expectations alone, however, could be enough to
drive voting effects but no recent work identifies partisan inflation effects on voting while
unemployment has seen only mixed results. Magalhaes (2012), using aggregate-level data
from 30 countries, finds that left parties benefit more from economic growth and lose more
from contractions than their right-of-center counterparts but inflation and unemployment
show little partisan difference in their effects. Dassonneville and Lewis-Beck (2013), in
contrast, do find that unemployment (they do not test for inflation) has a partisan effect,
but the effect is in line with Powell and Whitten (1993) rather than with Swank (1993).
Examining 149 elections in Western Europe, they find that growth in the unemployment
rate weakens support for left incumbents.
Issue ownership. A third model – issue ownership – also posits that voters choose
parties based on perceived competence. Unlike the short-run logic of competence signal
extraction found in Powell and Whitten (1993), however, this theory holds that parties
hold persistent reputations for competence in given issues. After years of policymaking,
advocacy and rhetoric, parties come to “own” different issues. Voters employ party rep-
utations to select parties best suited to address the most salient issues of the moment
while parties compete to persuade voters that the issues that they “own” are the most
salient (Budge and Farlie, 1983; Green and Hobolt, 2008). Issue ownership obviously
extends beyond economic policy but specific parties do obtain reputations for economic
competence that can matter when the economy is salient (Belanger and Meguid, 2008;
Neundorf and Adams, 2016). Such reputations are not static, and data measuring them
are incomplete and intermittent but, on average, we can venture that right parties enjoy
a better reputation for for overall management of the economy (Green and Jennings, in
8
progress). By this framework, voters would turn to the party most associated with eco-
nomic competence (usually the right) when the economy falters.
Class interests. Last, before we turn to the luxury goods voting model, it is also
possible that voters pursue their own self interest, like in the clientelism model, but
rather than focusing on Philips-curve trade-offs from monetary policy, they focus on what
governments better control: fiscal policy. Peltzman (1992) famously proclaimed (US)
voters to be fiscal conservatives, punishing any party that increases spending. A variant
to his argument might assert that sensitivity to spending increases in recessions when
budgets are tight and results in punishment for those parties most that are associated
with greater spending (the left). In economic downturns when their income is least secure,
middle and upper class voters may fear tax increases to finance redistribution and vote
for the right to preclude this. So long as middle and upper class voters outnumber poor
voters, one would expect that downturns suppress support for the left. Lindvall (2014)
best advances this argument.
2.2 The luxury goods model
One quite distinct model of partisan voting behavior – and to preview our results, the
one most substantiated by the data – stands out from the four above. Rather than
maximizing (a) short-term welfare through choosing the party most likely to direct policy
benefits their way (clientelism), (b) long-term welfare by punishing parties who fail at
their top policy goals (partisan accountability), (c) aggregate welfare through selecting
the the party with the best reputation for managing the economy (issue ownership) or
(d) individual financial position through avoiding redistribution (class interests), voters
might shift the importance they assign to given policies when economic circumstances
change.
Policies that affect individual or collective financial security may be distinct from and
prioritized over worthy but “post-material” policies such as environmental protection,
9
human rights and arts funding. Luxury goods voting posits that voters value material
goods more and non- or post-material goods less when the economy sours. Technically,
“luxury goods” are goods that one purchases in greater quantity as one grows wealthier
(caviar, opera, charity). These contrast with necessary goods, the consumption of which
does not change with income (water) and inferior goods, which are consumed less as
income rises (potatoes, ramen noodles). Economic downturns hurt the left because they
are more strongly associated with luxury goods programs which drop in salience relative
to material programs when the economy falters.
The preference ordering that places material wellbeing first – as a necessary good –
finds grounding in psychology at least as far back as Maslow’s hierarchy of needs in the
1950s (Maslow, Frager and Fadiman, 1970). Human needs rank in a hierarchy starting
with physiological requirements for sustenance, followed by physical and material security
and then, after several intermediate categories, ends with self-actualization. Only when a
more basic need is met do individuals place salience on higher-order needs. In a political
and social-policy context, Inglehart (1971) applied Maslow’s hierarchy in arguing that
societies only adopt “post-material” values once they have become sufficiently wealthy to
satiate their material needs. Thus, for example, environmental parties are a phenomenon
found mostly in wealthy democracies.
Stevenson (2002) first coined the term “luxury goods voting” in exploring how the
state of the economy might condition the magnitude of the economic vote. We adopt this
name but define “luxury goods” very differently. Stevenson considered such programs
as social welfare, expanded health programs and unemployment insurance to be luxury
goods. It is true that government spending as a proportion of GDP – likely including that
on health and social welfare – has increased over the long-run with the wealth of a country
(Wagner, 1911; Lamartina and Zaghini, 2011). The short-run economic changes associated
with the business cycle and – we argue, electoral behavior – take place on a much smaller
temporal and economic scale, however. In fact, in the short-run, welfare state spending
usually increases not with the economy, as luxury good definition would require, but rather
when the economy deteriorates and demand for unemployment insurance and other social
10
support surges. As short-run economic changes (Healy and Lenz, 2014; Wlezien, 2015)
matter for the assessments of economic wellbeing that influence vote choice while long-run
material improvements have little influence on perceived wellbeing (Easterlin, 1974), we
restrict our definition of luxury good policies to those that expand, on average, in funding
and support, with the short-run economy.
The advantage of restricting the definition of luxury goods policies to post-material
goods – other than consistency with the short-run definition of luxury goods – is an
abundance of evidence for a micro-mechanism. When voters’ economic security dimin-
ishes, their priorities shift toward immediate material security (Singer, 2011) and away
from higher-order concerns such as environmental protection or even programs with long
term pay-offs like medical research. Parties of the left and the right both hold reputations
for providing material goods – for example, unemployment insurance and tax relief, re-
spectively – but left parties are more strongly associated with many luxury goods policies
(e.g., international aid, environmental protection, minority rights). Indeed, left parties
have increasingly focused on culturally liberal “luxury goods” over the last decades and
less so on traditional material concerns of the working class (Kitschelt, 1994; Inglehart
and Abramson, 1994; Kriesi, 2010).
Expressed differently, left parties “own” most luxury goods issues. We test issue
ownership with respect to a reputation for competence managing the economy as a rival
mechanism but issue ownership with respect to luxury goods issues may play a role in
how the luxury goods vote functions. In general, issue ownership cannot and does not
seek to explain how and why the salience of given issues varies with the economy – as we
do here. Belanger and Meguid (2008), however, have made an important revision to the
conventional formulation of issue ownership (Budge and Farlie, 1983) that, we speculate,
may suggest how luxury goods voting functions. They posit and demonstrate that issue
salience conditions the effect of party issue ownership on individual voting decisions. If
the salience of economic and luxury goods issues varies systematically with the economy,
as seems likely, then Belanger and Meguid (2008) may offer a mico-mechanism for the
luxury goods voting mechanism.
11
Under such a scenario, support for luxury goods policies and parties would diminish
when the economy sours if the salience of these issues weakens with the economy. Voters
may not be repelled from luxury good policies during recessions; rather, they may simply
assign them low salience when their material security diminishes. At the same time, they
might accord greater salience and electoral support to material issues and parties associ-
ated with them. If the salience of luxury good and materialist issues varies inversely as
economic performance changes, it is possible that issue ownership, as posited by Belanger
and Meguid (2008), drives luxury goods voting.
Why do not parties simply shift away from post-material issues when the economy
weakens? Parties’ officers and members have ideological beliefs, commitments and con-
nections to interest groups. Even if parties could change policies quickly, voters would
be slow to notice. Parties hold longstanding and persistent reputations for competence
in and commitment to particular issues (Budge and Farlie, 1983) and that short-run at-
tempts to reposition a party often fail to make an impression on voters (Adams, Ezrow
and Somer-Topcu, 2011). Parties “own” issues and cannot easily shirk these associations
when circumstances change.
2.2.1 Public opinion, political preferences and the economy
A small and scattered literature, when considered together, suggests that a luxury goods
pattern of voting may exist. In the early 1990s, Stimson (1991) collected a mass of
US public opinion data and constructed an index of “policy mood” that demonstrated
alternating cycles of public support for policies associated with the left or the right.A
few years later, Robert Durr (1993), using Stimson’s data, recognized that economic
conditions explain variation in such policy sentiment. Stevenson (2001) confirmed this
regularity in 14 European countries showing that aggregate policy mood shifts to the left
(right) when the economy expands (contracts), as did Markussen (2008) in 20 developed
countries, De Neve (2009) more recently in the United States and Anderson and Hecht
(2014) for 11 European countries during the Great Recession.
Of course, policy mood is distinct from actual voting. Some earlier work has positing
12
that electoral support for various types of programs varies with the state of the economy.
Stevenson focused on specific welfare state policies – thus, not luxury goods policies,
as we define them – and found that right governments benefit from a poor economy.
Kayser (2009) posited that the luxury goods model of voting when combined with inter-
national business cycles could explain synchronous shifts in support for the left or right
in multiple countries. Magalhaes (2012) compared retrospective voting and broadly de-
fined luxury good voting in 30 countries following the Great Recession and found results
more consistent with the luxury goods model. These articles, however, either define lux-
ury goods policies as welfare state spending and yield statistically insignificant results
(Stevenson, 2002; Magalhaes, 2012) or focus on the international rather than domestic
economy (Kayser, 2009).
3 Empirical Strategy
Our empirical strategy is three-fold. We begin with an analysis of cross-national election-
surveys, both the Comparative Study of Electoral Systems (CSES) and Eurobarometer
(EB) datasets, to identify differences in voter responses to the economy under governments
with varying right-left orientation. We do this with both objective aggregate economic
data – changes in the unemployment rate – and with individual-level subjective economic
perceptions before exploring subsets of the data to determine which voters respond in
which manner. These analyses demonstrate that waxing support for the right in down-
turns is a common and widespread empirical regularity not only found in severe recessions.
The second step of our strategy recognizes that leftness is not synonymous with luxury
goods policies. A left-of-center government may adopt numerous policies seen as support-
ing necessary or even inferior goods provision. Workman’s compensation, unemployment
insurance, medical subsidies, universal elementary education and many other policies as-
sociated with the left serve as examples. Distinguishing between voters’ responses (a)
to luxury goods proposals (or reputations) and (b) to simple left orientation of parties,
demands more than can be demonstrated with the observational data. The partisan ac-
13
countability, issue ownership, class interests and luxury goods mechanisms, for example,
are all observationally equivalent with respect to changes in electoral support for the left.
We therefore turn to a survey experiment conducted with participants from Ama-
zon’s Mechanical Turk (Section 5.1) that varies the partisanship of the ruling party and
the proposals of the left party so that some left parties offer basic materialist proposals
and others luxury-good (post-materialist) proposals. The data support the luxury goods
mechanism, which then begs the question of the mechanism for the mechanism. We find
this in a simple pre-post survey (Section 6) that demonstrates that participant preferences
for government spending on luxury good policies drop sharply in recessions, in notable
contrast to preferences for spending on basic welfare-state policies that even increase.
Voters prioritize materialist issues when the economy falters. Left and right parties
both hold reputations for material issues (e.g., social welfare policies and tax cuts, re-
spectively) but left parties are burdened with an association with post-materialist luxury
goods policies which cost them votes. Thus, our argument posits a supplementary ef-
fect. Most governments are punished for a poor economy (the economic vote) but left
governments are punished additionally for their association with luxury goods policies
(the luxury goods vote). Consequently, we are not testing the effect of the economy on
voting for the right or the left but rather the deviation from the baseline economic vote
for incumbent parties that lead a government. The luxury goods policy effect is actually
independent of whether a party is in government or not, but we explicitly account for
incumbent status to avoid confounding with the classic economic vote. Table 1 presents
the simple predictions of the five hypotheses outlined above.
Predicted effects are derived from the mechanism reviewed in Section 2. Objective
measures of unemployment change are particularly good for testing hypotheses from the
clientelism and partisan accountability potential mechanisms because they are associated
with a specific change in a specific economic measure (unemployment). In contrast, an
advantage of perceived economic change is that this measure varies at the individual
14
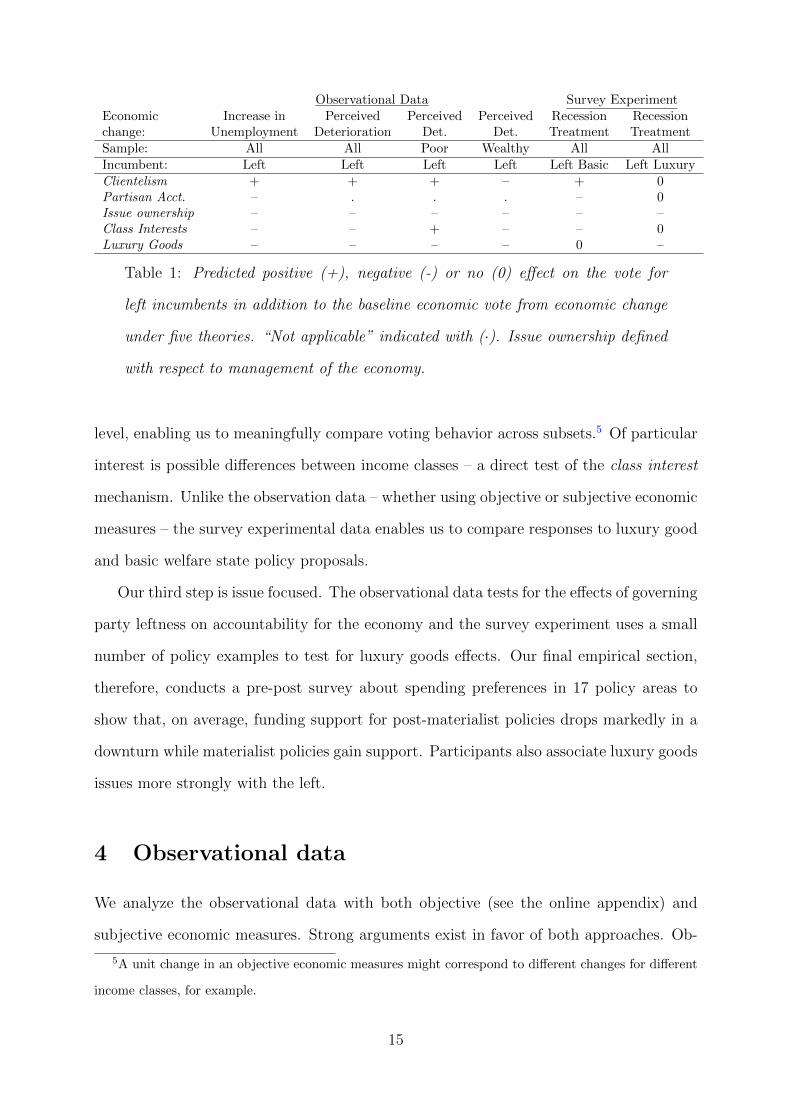
Observational Data Survey ExperimentEconomic Increase in Perceived Perceived Perceived Recession Recessionchange: Unemployment Deterioration Det. Det. Treatment TreatmentSample: All All Poor Wealthy All AllIncumbent: Left Left Left Left Left Basic Left LuxuryClientelism + + + – + 0Partisan Acct. – . . . – 0Issue ownership – – – – – –Class Interests – – + – – 0Luxury Goods – – – – 0 –
Table 1: Predicted positive (+), negative (-) or no (0) effect on the vote for
left incumbents in addition to the baseline economic vote from economic change
under five theories. “Not applicable” indicated with (·). Issue ownership defined
with respect to management of the economy.
level, enabling us to meaningfully compare voting behavior across subsets.5 Of particular
interest is possible differences between income classes – a direct test of the class interest
mechanism. Unlike the observation data – whether using objective or subjective economic
measures – the survey experimental data enables us to compare responses to luxury good
and basic welfare state policy proposals.
Our third step is issue focused. The observational data tests for the effects of governing
party leftness on accountability for the economy and the survey experiment uses a small
number of policy examples to test for luxury goods effects. Our final empirical section,
therefore, conducts a pre-post survey about spending preferences in 17 policy areas to
show that, on average, funding support for post-materialist policies drops markedly in a
downturn while materialist policies gain support. Participants also associate luxury goods
issues more strongly with the left.
4 Observational data
We analyze the observational data with both objective (see the online appendix) and
subjective economic measures. Strong arguments exist in favor of both approaches. Ob-
5A unit change in an objective economic measures might correspond to different changes for different
income classes, for example.
15
jective economic measures such as unemployment, growth in GDP or inflation offer the
advantage of associating voting with observable economic outcomes at least loosely con-
nected to economic policy. They also offer the advantage of clear exogeneity. Scholars
have repeatedly criticized the possible susceptibility of subjective perceptions of economic
performance to influence from our dependent variable, vote preferences, with the atten-
dant problems of endogeneity bias in estimates (Wlezien, Franklin and Twiggs, 1997;
Evans and Pickup, 2010).Objective economic measures also often allow the use of longer
time-series and broader sets of elections since the sample is not limited to election surveys
that included an economic perception question.
Subjective economic measures offer their own tradeoffs. The strongest argument in
favor of subjective perceptions of the economy is that it, like vote choice, varies at the
individual level. Objective measures such as unemployment assume the same level for
every participant in a given country in a given election year. Not only does this introduce
possible measurement error but it precludes the the use of election fixed-effects since there
is no variation in the economic variable within elections. Cross-panel variation in pooled
cross-sectional data can yield misleading results when evaluating hypotheses that assume
within-panel variation (Green, Kim and Yoon, 2001). Economic voting, in particular, has
been shown to be highly context dependent (Powell and Whitten, 1993; Anderson, 2000),
often on time-invariant country-specific contexts.
In addition to permitting election-fixed effects, subjective economic measures also
sidestep the less appreciated but nevertheless important issue of vintage differences in ob-
jective economic estimates. Economic estimates are repeatedly revised over time. Thus,
the growth rate, for example, for the US in 1992 might vary considerably depending on
when one downloaded the data. The later vintages are, on average, more accurate esti-
mates of macroeconomic aggregates in any previous period but voters will have responded
to the initial estimates reported in the media at the time of the election (Hetherington,
1996; Stevenson and Duch, 2013; Kayser and Leininger, 2015).
The choice of economic variable essentially trades off omitted variable bias and mea-
surement error from aggregated and revised data (objective measures) against endogeneity
16
bias and a more limited set of elections and countries (subjective perceptions). It is not
easy to establish which is the greater threat in a given project. Our aim, however, is
to persuade readers that a partisan regularity in voting is systematic and robust, so we
use both types of economic measure. We follow a similar strategy in another area of
dispute – estimates of party placement – in which we use three different measures. And
we also vary the temporal and cross-country covarage of our data by employing two sep-
arate datasets, both the CSES and the Eurobarometer Trendfile(The Comparative Study
of Electoral Systems, 2013; Schmitt and Scholz, 2002). Such redundancy, however, de-
mands more space than we have, so we limit ourselves to the subjective economic and
party-placement measures here. We present the other measures and datasets in the online
appendix.
Only Module 1 of the CSES (1996-2001) queried respondents on their individual per-
ceptions of the economy. Modules 2 and 3 extend coverage to 2011 (and elections to 51
in 20 democracies) when combined with objective economic measures and yield mostly
similar results, as does the Eurobarometer Trendfile (205 elections, 8 countries between
1970 and 1999 with 158,196 participants).6 We restrict our country sample to major de-
veloped democracies with stable party systems. This yields a sample 12 elections in 11
developed democracies in Module 1 with a total of 14,328 observations.7
4.1 Variables
We employ vote choice for the head of government’s party as the dependent variable.
In most cases this is the prime minister’s party but in presidential systems it is the
president’s party. We do this in order to focus on the party most clearly responsible for
economic outcomes. This is consistent with Duch and Stevenson (2008) who conjectured
that the most important posts, namely that of the PM’s office and the Finance Minister,
6See online appendix.7Australia 1996, Canada 1997, Germany 1998, Denmark 1998, Great Britain 1997, Netherlands 1998,
Norway 1997, New Zealand 1996, Portugal 2002, Spain 1996, Spain 2000, Sweden 1998. Note: Module 1
includes the spring 2002 election in Portugal despite nominally ending in 2001. No other elections from
2002 are included.
17
enable clearer attribution or responsibility and Duch, Przepiorka and Stevenson (2015)
who demonstrate with experimental work that voters primarily punish decision makers
with proposal power.8
A 5-point scale of economic perceptions serves as our key explanatory variable: “Would
you say that over the past twelve months, the state of the economy in [country] has gotten
better, stayed about the same, or gotten worse?” We reverse the scale so that it measure
economic deterioration.
Economic performance is our key independent variable but our theory posits that its
influence on the vote is conditioned by the ideological position of the governing party.
We recognize that scales differ across countries (Lo, Proksch and Gschwend, 2013) and
adjust for this by measuring the governing party’s position as its deviation from the
position of the median party in each election on a right-left scale (LeftDeviation). We
further sidestep this problem by using economic data with individual-level variation. It
permits fixed-effects estimation “within” elections surveys so that cross-national party
position variation does not influence estimates. This is not possible with the country-year
aggregate economic data (unemployment) employed in the online appendix.
This party-position calculation is possible because the CSES surveys ask respondents
to locate the parties participating in the recent election on a ten-point left-right scale,
which we reverse so that higher values correspond to greater leftness. Our basic measure
of perceived lead-party leftness is the difference between the lead party and the party each
respondent placed at the median.9 The analysis of objective economic data in the online
appendix adds two party placements based on expert assessments. We do not use them
here, however, because they do not vary on the individual level.
We readily concede that ideological measures of party placement are not conceptually
interchangeble with a party reputation for luxury goods provision. It is wholly possible
8also see Fisher and Hobolt (2010).9Since many respondents only placed a single party and that to be included in our analysis they had
to place the lead party on the right-left scale, a large number of lead (and only lead) parties are placed at
the median. Nevertheless, this method improves comparisons between elections in the objective economic
data section.
18
for even extreme left parties to focus on, say, redistribution rather than on luxury goods.
Nevertheless, it is most often left parties that support luxury good spending leading to a
highly positive associated between leftness and proposals for luxury goods spending. We
take this distinction seriously and distinguish between leftness and luxury goods provision
in the experimental section of the paper.
Rounding out our specification, and with one notable exception, we have a set of
control variables that are likely orthogonal to our economic performance and party place-
ment measures but included out of convention. The exception is PolicyDistance which
measures the perceived ideological distance between each respondent and the governing
party. Respondents in the CSES surveys placed both the lead party and themselves on
the same scale. The remaining control variables are largely self-explanatory and taken
from the CSES dataset: Unemployed, a dummy intended to capture egotropic rather than
sociotropic effects, Age, Female, Education, and Income.
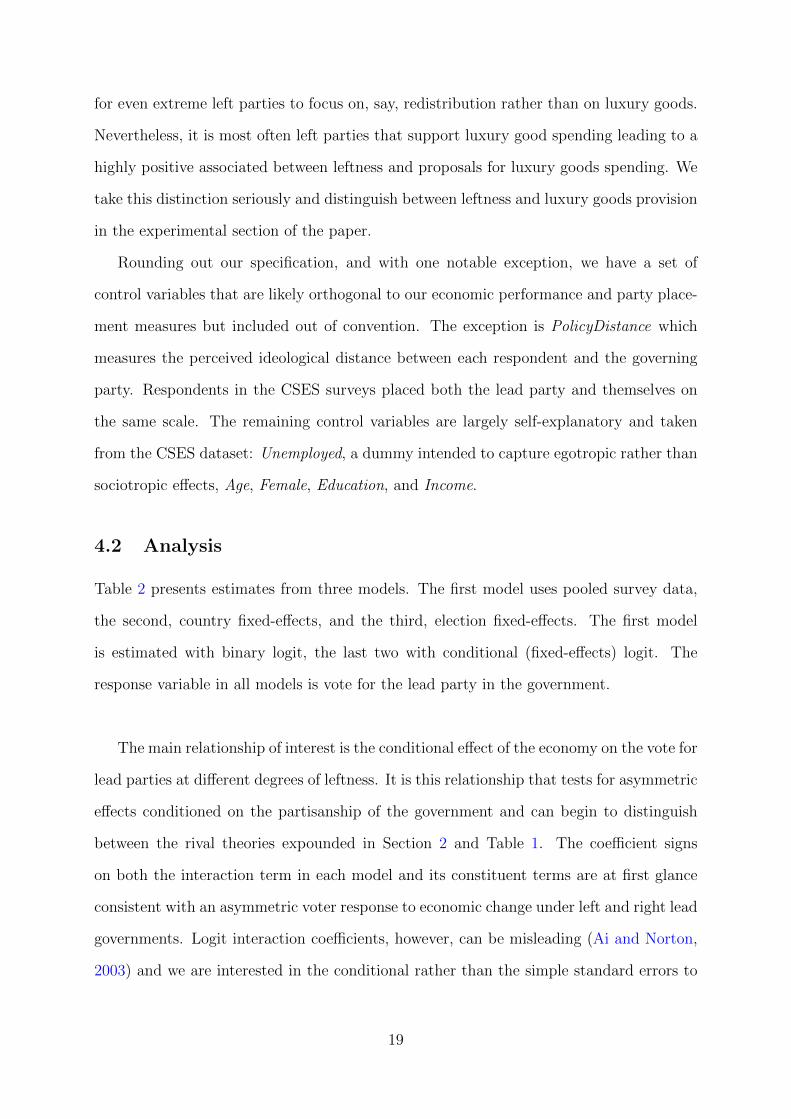
4.2 Analysis
Table 2 presents estimates from three models. The first model uses pooled survey data,
the second, country fixed-effects, and the third, election fixed-effects. The first model
is estimated with binary logit, the last two with conditional (fixed-effects) logit. The
response variable in all models is vote for the lead party in the government.
The main relationship of interest is the conditional effect of the economy on the vote for
lead parties at different degrees of leftness. It is this relationship that tests for asymmetric
effects conditioned on the partisanship of the government and can begin to distinguish
between the rival theories expounded in Section 2 and Table 1. The coefficient signs
on both the interaction term in each model and its constituent terms are at first glance
consistent with an asymmetric voter response to economic change under left and right lead
governments. Logit interaction coefficients, however, can be misleading (Ai and Norton,
2003) and we are interested in the conditional rather than the simple standard errors to
19
(1) (2) (3)EconDecline -0.547∗∗∗ (0.130) -0.520∗∗∗ (0.025) -0.516∗∗∗ (0.025)LeftDeviation 0.045 (0.070) 0.081∗∗∗ (0.022) 0.083∗∗∗ (0.022)EconDecline ∗ LeftDeviation -0.002 (0.025) -0.022∗∗ (0.008) -0.022∗∗ (0.008)PolicyDistance -0.306 (0.172) -0.362∗∗∗ (0.011) -0.363∗∗∗ (0.011)Age 0.007∗ (0.003) 0.006∗∗∗ (0.001) 0.006∗∗∗ (0.001)Female 0.136∗ (0.056) 0.144∗∗∗ (0.040) 0.143∗∗∗ (0.040)Education -0.137∗∗∗ (0.033) -0.107∗∗∗ (0.013) -0.108∗∗∗ (0.013)Unemployed -0.119 (0.122) -0.265∗ (0.112) -0.258∗ (0.112)Income 0.077 (0.047) 0.077∗∗∗ (0.016) 0.076∗∗∗ (0.016)Constant 1.475∗∗∗ (0.326)FixedEffects – Country ElectionN.Obs. 14328 14328 14328N.Elections 12 12 12N.Countries 11 11 11BIC 15880 15153 15145
Table 2: Effect of economic perceptions on the vote for the lead party. CSES data. Binary
logit (model 1) and conditional (fixed-effects) logit (models 2 & 3). Perceived economic
performance is reverse coded so that higher values represent greater economic deteriora-
tion. * p < 0.05, ** p < 0.01, *** p < 0.001. Standard errors in parentheses and clustered
by country in model 1. Within-panel variation in economic perceptions allows fixed-effects
in models 2 and 3.
test for statistical significance at various values of the lead party leftness. To evaluate
this relationship and to render substantive magnitudes more apparent, we plot out the
marginal effect of a one-point change in our economic variable on the probability of voting
for the lead governing party at all values of leftness (LeftDeviation) in our sample. Figure
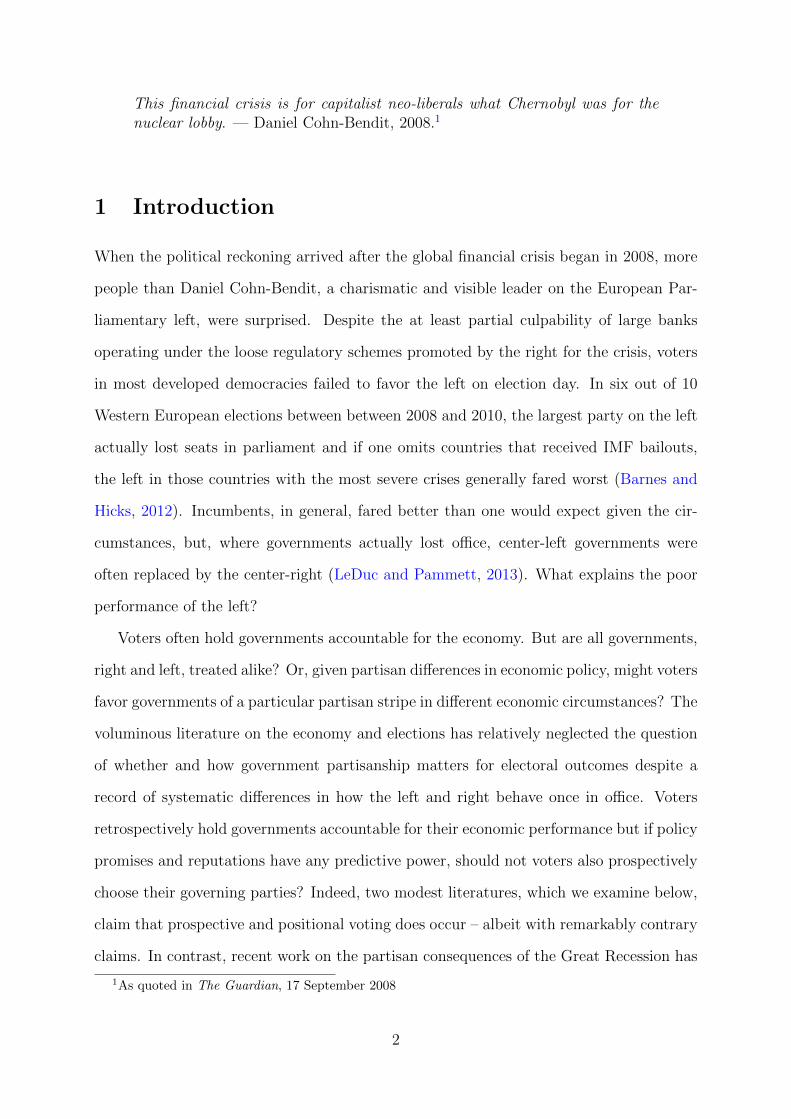
2 presents the conditional marginal effects graphically, setting continuous covariates at
their means and categorial covariates at their modes.
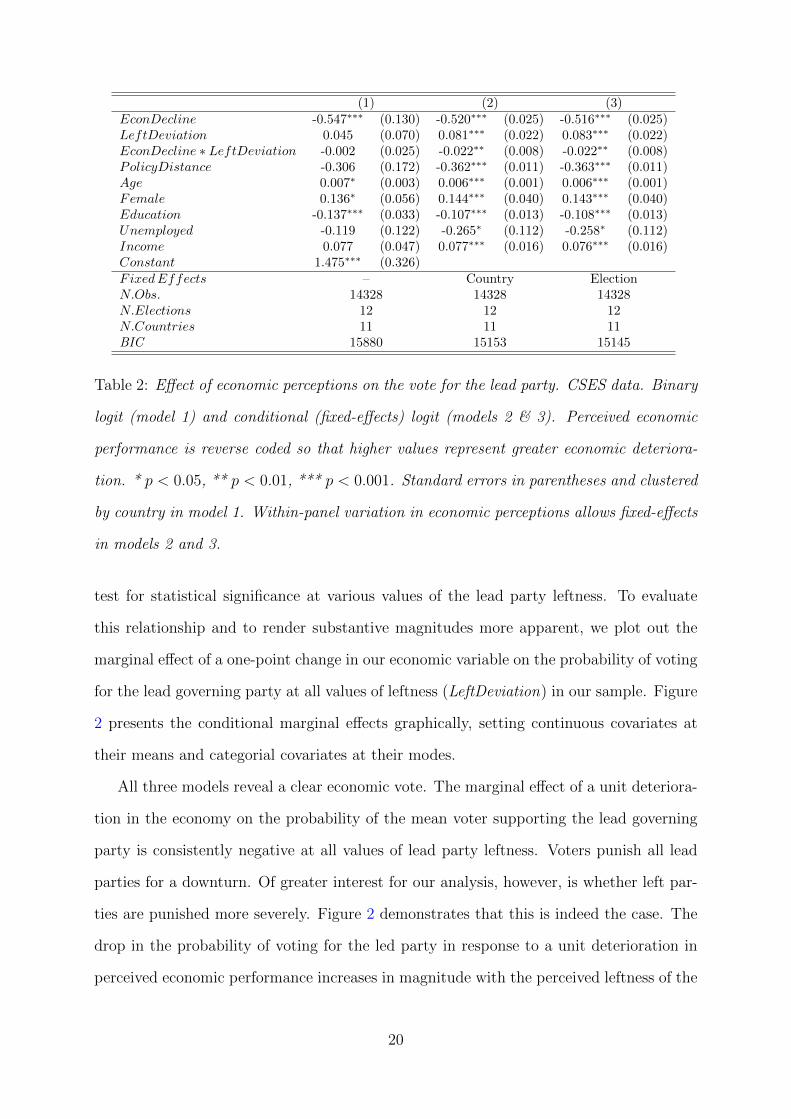
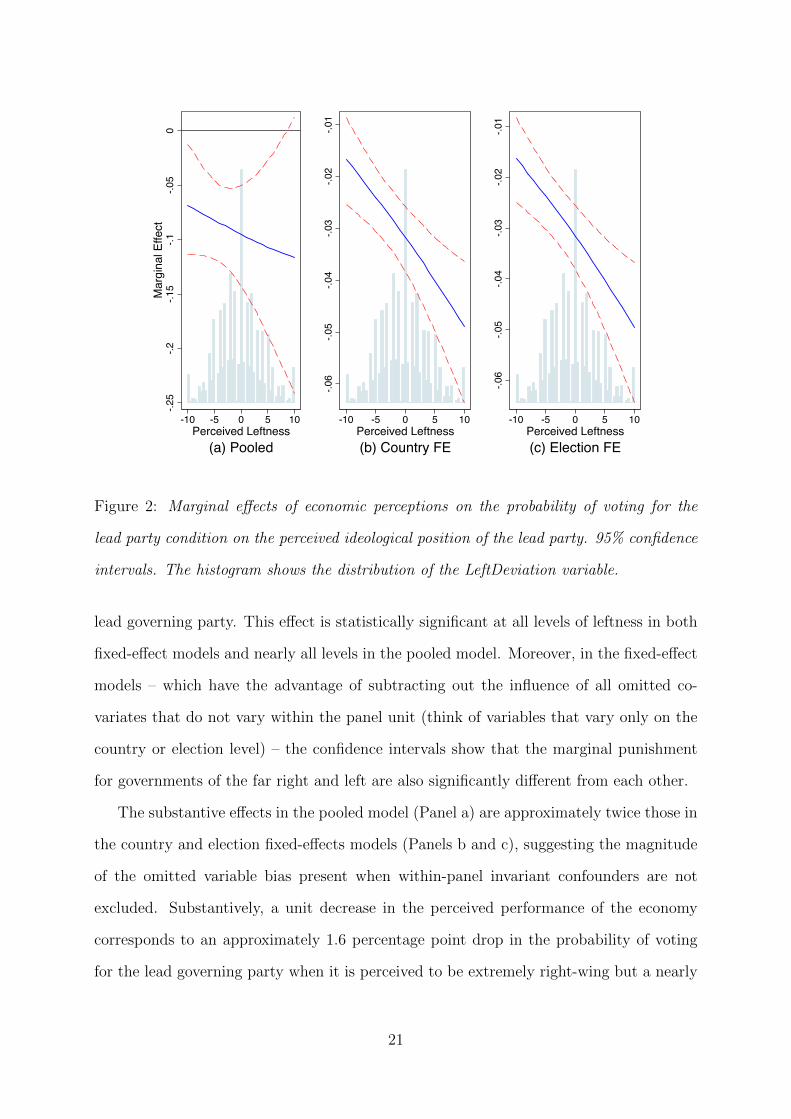
All three models reveal a clear economic vote. The marginal effect of a unit deteriora-
tion in the economy on the probability of the mean voter supporting the lead governing
party is consistently negative at all values of lead party leftness. Voters punish all lead
parties for a downturn. Of greater interest for our analysis, however, is whether left par-
ties are punished more severely. Figure 2 demonstrates that this is indeed the case. The
drop in the probability of voting for the led party in response to a unit deterioration in
perceived economic performance increases in magnitude with the perceived leftness of the
20
-.25
-.2-.1
5-.1
-.05
0M
argi
nal E
ffect
-10 -5 0 5 10Perceived Leftness
(a) Pooled
-.06
-.05
-.04
-.03
-.02
-.01
-10 -5 0 5 10Perceived Leftness(b) Country FE
-.06
-.05
-.04
-.03
-.02
-.01
-10 -5 0 5 10Perceived Leftness(c) Election FE
Figure 2: Marginal effects of economic perceptions on the probability of voting for the
lead party condition on the perceived ideological position of the lead party. 95% confidence
intervals. The histogram shows the distribution of the LeftDeviation variable.
lead governing party. This effect is statistically significant at all levels of leftness in both
fixed-effect models and nearly all levels in the pooled model. Moreover, in the fixed-effect
models – which have the advantage of subtracting out the influence of all omitted co-
variates that do not vary within the panel unit (think of variables that vary only on the
country or election level) – the confidence intervals show that the marginal punishment
for governments of the far right and left are also significantly different from each other.
The substantive effects in the pooled model (Panel a) are approximately twice those in
the country and election fixed-effects models (Panels b and c), suggesting the magnitude
of the omitted variable bias present when within-panel invariant confounders are not
excluded. Substantively, a unit decrease in the perceived performance of the economy
corresponds to an approximately 1.6 percentage point drop in the probability of voting
for the lead governing party when it is perceived to be extremely right-wing but a nearly
21
5 percentage point drop when it is extremely left-wing. Voters punish all lead parties in
government for a poor economy but they punish left parties more.
Might these results be driven by endogeneity bias? The conditioning variable – per-
ceived party position (LeftDeviation) – might be influenced by the respondent’s vote
choice, as might economic perceptions. Similar models in the online appendix using
change in unemployment and and two similarly exogenous measures of party placement
(expert placement and party manifestos) show broadly similar results, however. If en-
dogeneity bias is present, it is insufficiently large to change the basic finding that voters
punish left lead parties more for downturns. Moreover, by testing for asymmetric parti-
san accountability for the economy in different time-periods (CSES, 1996-2011) and with
different datasets (Eurobarometer Trendfile, 1970-1999) the supplementary results in the
online appendix suggest robustness.
So what do these first results suggest about partisan theories of voting? The clien-
telism hypothesis predicts that voters should increase support for left governing parties
when unemployment rises, so is refuted by the data. Voters faced with an increase in
general unemployment do not, on average, increase their support for parties most likely
to prioritize reducing unemployment (i.e., the left). Personal experience of unemployment
indeed does increase support for the left as shown elsewhere (Margalit, 2013, and, looking
ahead, in Section 4.3), but this effect is insufficiently large to outweigh the contrary turn
toward the right of the more numerous employed voters.
The Luxury goods voting, class interests, issue ownership (for competence managing
the economy) and partisan accountability hypotheses, in contrast, all correctly predict a
decrease in support for the left. Such observational equivalence will require different tests
in the following sections. At this point, however, we can tentatively conclude two things:
Voters do seem to punish left incumbents more than their counterparts on the right during
downturns and all potential mechanisms except for clientelism are compatible with this
finding.
22
4.3 Who votes how?
Up to this point we have simply spoken of voters but not distinguished among them. It
is valuable in itself to observe which types of voters respond most strongly. Certain hy-
potheses, however, most notably class interests, suggest a differential response by different
voters.
The class interest mechanism implies distinct behavior in different income categories.
Middle and upper income voters – but not their lower income counterparts – should avoid
supporting the left during economic downturns in order to reduce the probability of higher
taxes and redistribution when their economic security is most at risk. In contrast, low-
income voters should increase their support of left parties in order to benefit from greater
redistribution. So long as middle and upper class voters outnumber low-income voters,
the net effect should favor the right.
In contrast to class interests, the other remaining mechanisms – partisan accountabil-
ity, issue ownership and luxury goods voting – do not offer clearly falsifiable hypotheses
with respect to voters subsets. None of these three potential mechanisms stipulate how
voter subsets should behave.
23
(1) (2) (3) (4) (5) (6) (7) (8) (9) (10)Income-low Income-mid Income-high Right Centrist Left Educ-low Educ-high Unemployed Employed
EconDecline -0.556∗∗∗ -0.504∗∗∗ -0.480∗∗∗ -0.495∗∗∗ -0.401∗∗∗ -0.174∗∗ -0.400∗∗∗ -0.479∗∗∗
(0.042) (0.054) (0.038) (0.055) (0.037) (0.065) (0.064) (0.069)
LeftDeviation 0.082∗ 0.075 0.072∗ -0.034 0.085∗ 0.147∗ 0.015 0.069 -0.052∗ 0.014(0.036) (0.050) (0.036) (0.047) (0.037) (0.061) (0.060) (0.068) (0.025) (0.030)
EconDecline ∗ LeftDeviation -0.019 -0.023 -0.019 -0.019 -0.029∗ -0.018 0.008 -0.009(0.012) (0.017) (0.013) (0.015) (0.012) (0.020) (0.020) (0.026)
PolicyDistance -0.285∗∗∗ -0.394∗∗∗ -0.427∗∗∗ -0.403∗∗∗ -0.378∗∗∗ -0.529∗∗∗ -0.555∗∗∗ -0.505∗∗∗ -0.360∗∗∗ -0.569∗∗∗
(0.018) (0.025) (0.019) (0.035) (0.025) (0.044) (0.034) (0.034) (0.055) (0.036)
Age 0.011∗∗∗ 0.008∗∗ 0.000 -0.002 0.003 0.011∗∗ 0.007 0.003 -0.006 0.008∗∗∗
(0.002) (0.003) (0.002) (0.003) (0.002) (0.003) (0.004) (0.004) (0.007) (0.002)
Female 0.271∗∗∗ 0.065 0.070 0.331∗∗∗ 0.098 -0.098 0.084 0.015 0.051 0.100(0.068) (0.085) (0.062) (0.085) (0.058) (0.103) (0.107) (0.103) (0.121) (0.054)
Education -0.061∗ -0.100∗∗∗ -0.126∗∗∗ -0.067∗ -0.072∗∗∗ -0.171∗∗∗ -0.142∗∗ -0.100∗∗
(0.025) (0.029) (0.019) (0.028) (0.019) (0.034) (0.051) (0.031)
Income 0.043 0.058∗ 0.155∗∗∗ 0.035 0.057 0.080 0.029(0.033) (0.023) (0.040) (0.047) (0.042) (0.051) (0.047)
∆Unemployment -0.060 -0.020(0.100) (0.109)
∆Unem ∗ LeftDeviation 0.049∗∗∗ -0.007(0.015) (0.026)
Constant 0.800 0.353(0.454) (0.254)
FixedEffects Election Election Election Election Election Election Election Election – –N.Obs. 5089 3220 6072 4359 6560 3462 2017 2621 1364 16467N.Elections 12 12 12 12 12 12 11 12 36 36N.Countries 11 11 11 11 11 11 10 11 18 18CorrectPred.(%) 74.99 74.63 71.89 80.82 72.71 84.20 73.48 78.52 71.19 73.24BIC 5429 3504 6613 3804 7300 2588 2279 2587 1608 17092
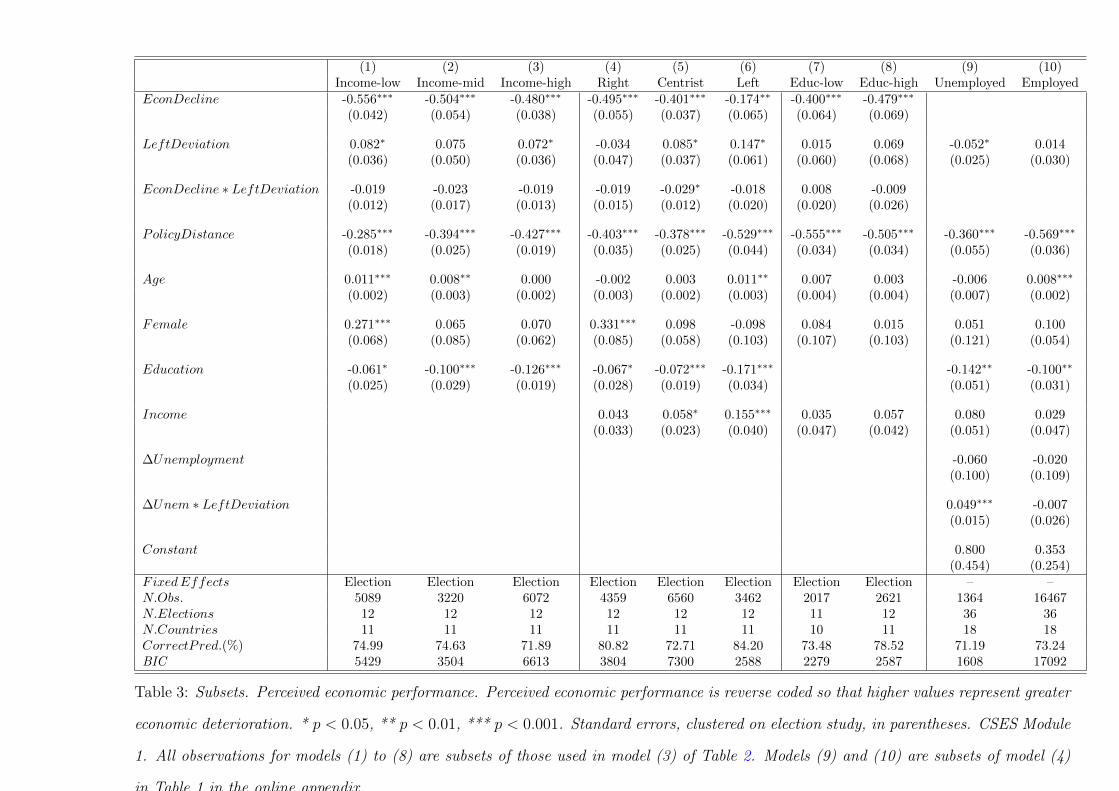
Table 3: Subsets. Perceived economic performance. Perceived economic performance is reverse coded so that higher values represent greater
economic deterioration. * p < 0.05, ** p < 0.01, *** p < 0.001. Standard errors, clustered on election study, in parentheses. CSES Module
1. All observations for models (1) to (8) are subsets of those used in model (3) of Table 2. Models (9) and (10) are subsets of model (4)
in Table 1 in the online appendix.
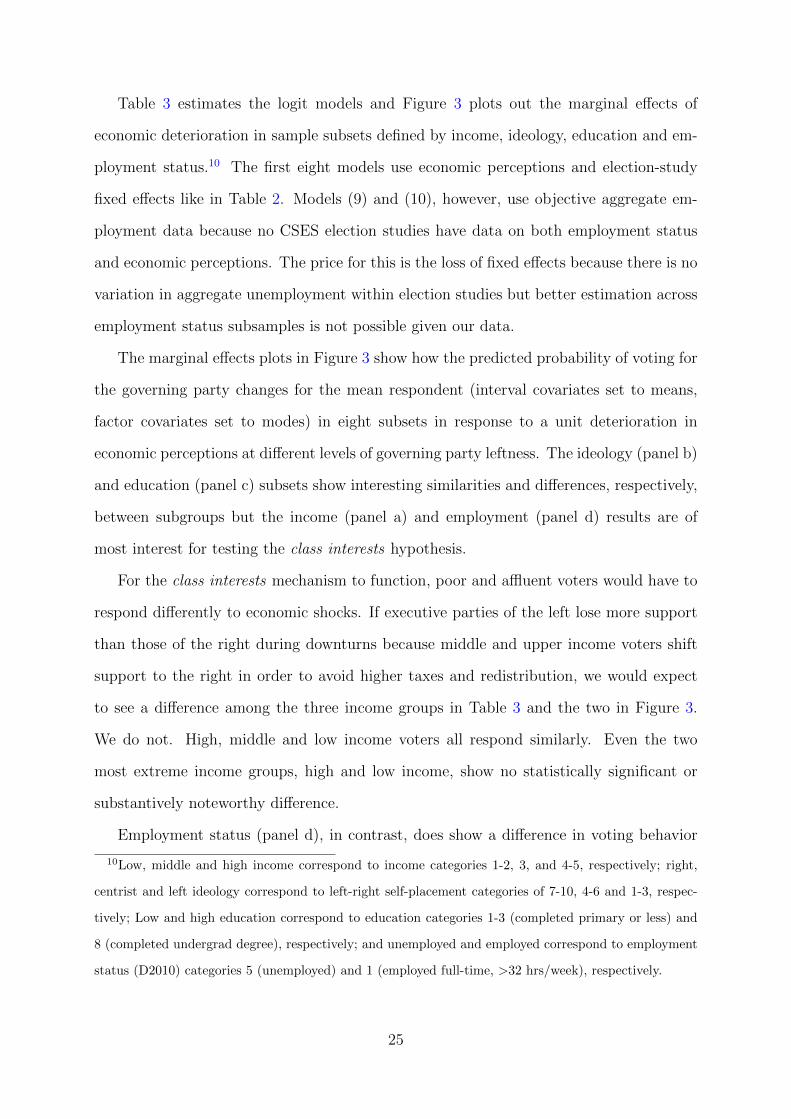
Table 3 estimates the logit models and Figure 3 plots out the marginal effects of
economic deterioration in sample subsets defined by income, ideology, education and em-
ployment status.10 The first eight models use economic perceptions and election-study
fixed effects like in Table 2. Models (9) and (10), however, use objective aggregate em-
ployment data because no CSES election studies have data on both employment status
and economic perceptions. The price for this is the loss of fixed effects because there is no
variation in aggregate unemployment within election studies but better estimation across
employment status subsamples is not possible given our data.
The marginal effects plots in Figure 3 show how the predicted probability of voting for
the governing party changes for the mean respondent (interval covariates set to means,
factor covariates set to modes) in eight subsets in response to a unit deterioration in
economic perceptions at different levels of governing party leftness. The ideology (panel b)
and education (panel c) subsets show interesting similarities and differences, respectively,
between subgroups but the income (panel a) and employment (panel d) results are of
most interest for testing the class interests hypothesis.
For the class interests mechanism to function, poor and affluent voters would have to
respond differently to economic shocks. If executive parties of the left lose more support
than those of the right during downturns because middle and upper income voters shift
support to the right in order to avoid higher taxes and redistribution, we would expect
to see a difference among the three income groups in Table 3 and the two in Figure 3.
We do not. High, middle and low income voters all respond similarly. Even the two
most extreme income groups, high and low income, show no statistically significant or
substantively noteworthy difference.
Employment status (panel d), in contrast, does show a difference in voting behavior
10Low, middle and high income correspond to income categories 1-2, 3, and 4-5, respectively; right,
centrist and left ideology correspond to left-right self-placement categories of 7-10, 4-6 and 1-3, respec-
tively; Low and high education correspond to education categories 1-3 (completed primary or less) and
8 (completed undergrad degree), respectively; and unemployed and employed correspond to employment
status (D2010) categories 5 (unemployed) and 1 (employed full-time, >32 hrs/week), respectively.
25
high
low
-.2
-.15
-.1
-.05
0
-10 -8 -6 -4 -2 0 2 4 6 8 10Perceived Leftness
(a) Income
left
right
-.3
-.2
-.1
0
-10 -8 -6 -4 -2 0 2 4 6 8 10Perceived Leftness
(b) Ideology
high
low
-.15
-.1
-.05
0
-10 -8 -6 -4 -2 0 2 4 6 8 10Perceived Leftness
(c) Education
unemployed
employed
-.2
-.1
0.1
-10 -8 -6 -4 -2 0 2 4 6 8 10Perceived Leftness
(d) Employment
Figure 3: Marginal effects of an economic downturn on probability of voting for the lead governing party
at perceived government positions relative to the median party. Covariates set at means. Figures based
on estimates in corresponding models in Table 3. Panels (a) to (c) use economic perceptions. Panel (d)
uses aggregate unemployment data because no CSES election studies have data on both employment status
and economic perceptions. We use 83.5% confidence intervals to facilitate comparison of the conditional
marginal effects from each of the models. 83.5% confidence intervals are the equivalent of 95% intervals
for the comparison of two distributions (Maghsoodloo and Huang, 2010).
between the full time employed and the unemployed actively seeking work. Although
the difference in the responses between the unemployed and full-time employed are only
statistically significant when the the governing party is extremely left, the point estimates
suggest self-interested behavior. Unemployed respondents are 12% less likely to vote for
a governing party of the far right and 8% more likely to vote for a governing party of the
far left, following a unit increase in the unemployment rate. This result parallels that of
Margalit (2013) who shows that even right-of-center voters in the U.S., are more likely
26
to vote for the left while receiving unemployment benefits but revert to their previous
electoral behavior once they are again employed. Clientelism does seem to occur in the
most directly tangible circumstance – personal unemployment. The modest magnitude of
the subsample effect, however, and the relatively small number unemployed in all but the
most dire economic circumstances yield an overall effect that is outweighed by the rest of
the sample. The data refute the class interests mechanism.
Up to here, all of our analyses have relied on observational data. Such data enjoy
some advantages, most notably external validity, but they also suffer from drawbacks.
Omitted covariates may bias results and, no less problematically, some mechanisms can
only be tested with difficulty, if at all. The observational data have shown that economic
deterioration (a) shifts voter support toward the right, refuting the clientelism hypothesis,
and (b) prompts similar responses among poor and wealthy respondents, rejecting the
class interests hypothesis. Left party vote, our dependent variable with the observational
data, cannot distinguish between types of left governing parties resulting in observational
equivalence between the partisan accountability, issue ownership and luxury goods mecha-
nisms. All three predict weakening support for left incumbents when the economy falters.
The observational data that we have also cannot discern differences in the change in sup-
port for specific policies when the economy sours. We recognize the limits of these data
for differentiating between mechanisms and consequently turn to an experiment.
5 Experiment
We strengthen the internal validity of our basic finding and better identify the causal paths
driving this regularity with the help of a survey experiments conducted with Amazon’s
Mechanical Turk. The experiment confirms the basic result found in the observations
data – voters punish left governments more for poor economic performance – and then
demonstrates that parties’ association with luxury goods policies, not just leftness, drives
this effect.
27
5.1 Data and design
To test our basic finding and the luxury goods mechanism, we conducted an online
(Qualtrics) survey experiment on 264 subjects in the United States recruited via Amazon
Mechanical Turk in the summer of 2015. We set a high qualification threshold (97% of
previous tasks, a.k.a. HITs, approved) and included two attention checks in the survey to
filter out (8) insufficiently careful respondents. Six other participants did not complete the
survey and were also removed, leaving a sample of 250. The sample shows considerable
variation in geographic location (IP address), income, partisan identification, ideological
self-placement, education and sex (see summary statistics in the online appendix). This
is consistent with research that has found Amazon “Turkers” to be more representative
of the US population than both (a) the modal convenience sample in political science ex-
periments (Berinsky, Huber and Lenz, 2012) and (b) at least one commonly used survey
panel (Huff and Tingley, 2015).
Participants first read a vignette describing two parties, incumbent and opposition,
and the policies they proposed. Neither party was explicitly identified as “left” or “right”,
although the policies were similar to those often associated with left and right parties.
The right party proposed cutting taxes and social spending while the left party proposed
spending on either “basic” or “luxury good” social programs. Basic programs were listed
as “workers compensation for injured workers, vocational training for the unemployed
and better unemployment benefits” while luxury good programs examples were given as
“the arts, programs for troubled teens and the reintroduction of native species to the
local forests”. The explicit wording of the full vignette appears in online appendix. The
basic design is 2 × 2 in which the incumbent government is either left or right and the
left party proposes spending on either basic or luxury policies. There is only one type
of right party and participants were randomly assigned to each of the four groups. We
recorded the participants’ expressed likelihood of voting for the incumbent government on
a nine-point scale at two times – before and after a randomly assigned recession treatment
that informed treated participants that the economy had deteriorated under the current
28
government:
“Under the stewardship of the same governing party mentioned in the previous
question, the economy goes into a DEEP RECESSION. The government still
proposes fully funding the arts and programs such as those mentioned above.
You earn enough to meet the needs of your family but you are not wealthy
and have to monitor your budget closely. The economic slowdown has reduced
your income and a friend of yours has lost his job as the unemployment rate
has increased. Given the new economic situation and assuming that you will
vote, how likely are you to vote for the governing party?”
In an actual election campaign during a recession it is unlikely that a party would
actually emphasize its luxury goods agenda. Parties, however, have longstanding and
slow-changing reputations for issue competence, priorities and credibility (cf., Green and
Hobolt, 2008). Issue ownership is persistent and voters update changes in party positions
very slowly (Adams, Ezrow and Somer-Topcu, 2011). The wording in the treatment
vignette simulates this persistent association of parties with issues. Luxury goods parties,
who likely gain from these issues during expansions, cannot flee from them in downturns.
The pre- and post-treatment measurement thus yields a 2 × 2 × 2 design. The eight
cells represent four conditions – left government with basic policies (N=60), left govern-
ment with luxury goods policies (N=62), right government running against basic policy
opposition (N=66) and right government running against luxury goods opposition (N=62)
– each with a pre-treatment measure and a post treatment measure for each conditions’
(randomly chosen) treatment group. The core conceit is to vary the policy proposals
associated with left governments – basic worker welfare v. luxury goods policies – and
measure how “voters” respond to these two types of left parties before and after a recession
treatment.
In order to avoid confounding with the punishment of the incumbent party during a
downturn – the classic economic vote – we vary whether the left or right is in government.
To preserve simplicity and limit the number of cells, we only vary the policies of left
29
governments. Right parties also espouse luxury goods policies but as such policies are
considerably more common on the left, we find this a reasonable simplification. We also
take care to ensure that the policies themselves rather than the extremity of the policies
drives the results. All of the left’s proposals, be they worker welfare or luxury goods, are
relatively moderate. Thus, this experiment addresses an ambiguity in the observational
studies in the previous section, i.e., whether more extreme left parties are more severely
punished during economic downturns because of the (a) the extremity of their positions,
for example, redistribution or disarmament, or (b) their association with luxury goods.
In our experiment, the left’s proposals remain moderate and only the association with
luxury goods changes.
5.2 Results
We estimate the recession treatment effects for the different government partisanship and
policy type groups using difference-in-differences estimation. We control for each respon-
dent’s previous vote, so that results are group averages of individual pre-post treatment
differences. Table 3 in the online appendix reports the model estimates, which Figure 4
presents graphically.
Results suggest a notable luxury goods voting effect. When the left is associated with
basic welfare state policies, both left and right governments are punished for a recession at
the mean level for all governments (i.e., the classic economic vote, marked with a dotted
horizontal line). When the left espouses luxury goods policies, however, it is punished
more severely than other governments when in office while right governments are punished
only lightly.
In more detail, the first point estimate in Figure 4 shows the recession effect for all left
governments (basic and luxury good) and parallels our finding with the observational data:
Voters punish left governments more severely than right governments in a downturn. The
next two results separate left governments into “basic” and “luxury goods” policy types
and show that there is indeed “double jeopardy” for left governments – punishment for
30
-3-2
-10
1
left left-basic left-lux right-v-basic right-v-lux
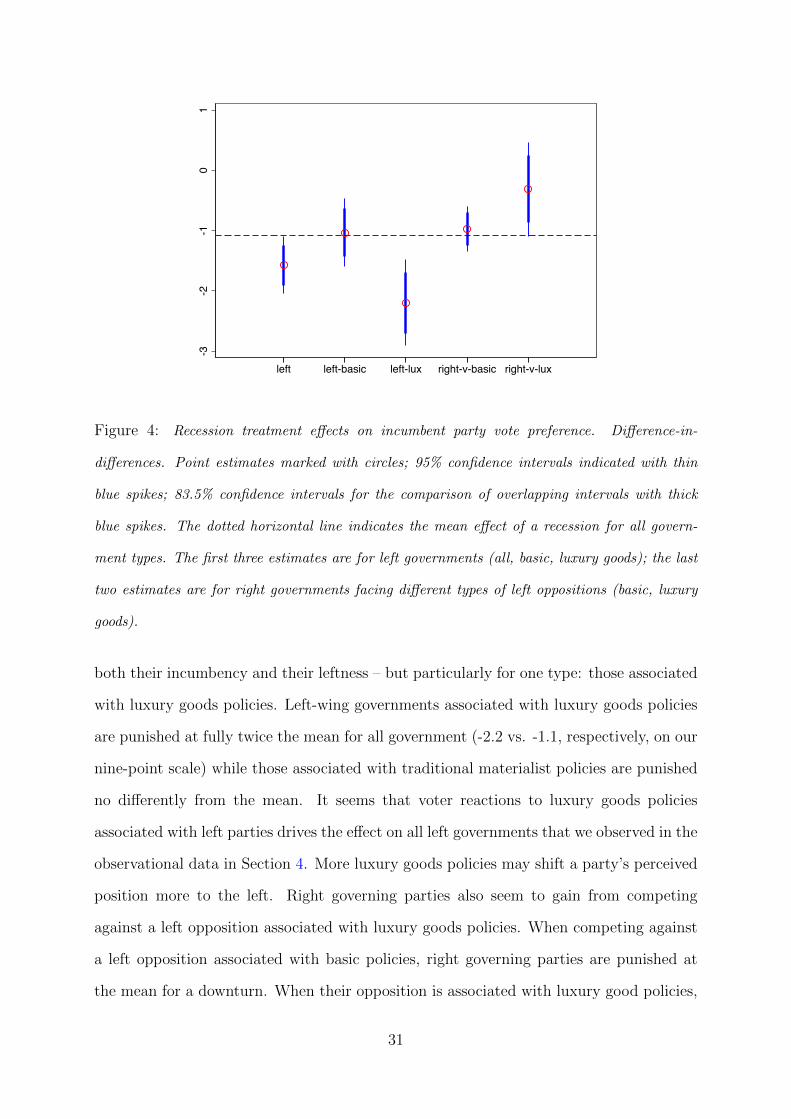
Figure 4: Recession treatment effects on incumbent party vote preference. Difference-in-
differences. Point estimates marked with circles; 95% confidence intervals indicated with thin
blue spikes; 83.5% confidence intervals for the comparison of overlapping intervals with thick
blue spikes. The dotted horizontal line indicates the mean effect of a recession for all govern-
ment types. The first three estimates are for left governments (all, basic, luxury goods); the last
two estimates are for right governments facing different types of left oppositions (basic, luxury
goods).
both their incumbency and their leftness – but particularly for one type: those associated
with luxury goods policies. Left-wing governments associated with luxury goods policies
are punished at fully twice the mean for all government (-2.2 vs. -1.1, respectively, on our
nine-point scale) while those associated with traditional materialist policies are punished
no differently from the mean. It seems that voter reactions to luxury goods policies
associated with left parties drives the effect on all left governments that we observed in the
observational data in Section 4. More luxury goods policies may shift a party’s perceived
position more to the left. Right governing parties also seem to gain from competing
against a left opposition associated with luxury goods policies. When competing against
a left opposition associated with basic policies, right governing parties are punished at
the mean for a downturn. When their opposition is associated with luxury good policies,
31
however, they are barely punished at all.
For our “tournament of theories”, what matters most is the difference in how partic-
ipants punish the two types of left governments in response to the recession treatment.
Figure 4 includes two types of confidence intervals, the standard 95% interval (the thin
spikes) to test for the exclusion of a single value (usually the null) and a 83.5% interval
(the thick spikes) which is the equivalent of a 95% interval for testing for the overlap of
two confidence intervals. Not only did participants punish the left party associated with
“luxury goods” at twice the magnitude of the left party with basic materialist policies,
the difference is statistically significant.
Three possible mechanisms for the empirical regularity that voters punish left more
than right governments during downturns survived the tests with observational data:
partisan accountability, issue ownership and luxury goods voting. Comparing the recession
treatment effects for the two types of left governments is informative for evaluating these
remaining mechanisms.
If the greater punishment of left governments during downturns arrises from the parti-
san accountability mechanism (Powell and Whitten, 1993), we would expect both types of
left governments to be similarly punished. In contrast, our experiment (Figure 4) shows
that left governments associated with luxury goods policies are punished twice as severely.
This result, plus the observation that left and right governments are not differently pun-
ished for a recession when the left is associated with basic and moderate welfare policies,
suggests that partisan accountability cannot lie behind the observational results in the
previous sections.
What if right parties “own” the issue of economic competence? We would expect to
see voters eschew the left during downturns, as we do. Issue ownership that associates
competence in managing the economy with parties of the right, however, does not distin-
guish between types of left parties. A right party reputation for competence managing
the economy cannot explain the difference in punishment of left parties espousing luxury
goods policies and those espousing basic materialist policies as shown in Figure 4. This
32
formulation of issue ownership also fails as a rival mechanism.
We examined five mechanisms in this paper – clientelism, partisan accountability, issue
ownership, class interests and luxury goods voting. Only one mechanism is consistent with
the data, both observational and experimental: luxury goods voting.
6 Funding preferences survey
Our experiment above cites three post-materialist and three materialist policies but they
hardly cover the spectrum of issues present in an election. Does voters support decline for
all or most luxury goods policies in hard times? How does this policy support compare to
that for other types of policies, most notably materialist policies, in a recession? Luxury
goods voting may be the only mechanism that the data does not refute but this mechanism
itself draws on some assumptions, most notably that support for post-materialist policies
drops when the economy falters.
To investigate this question we conducted a second study on 92 Mechanical Turk par-
ticipants in the United States. As in the first study, we accepted only highly qualified
workers (with a previous HIT acceptance rate of 97% or above) and removed any partic-
ipants who failed an attention check. The sample descriptive statistics and more details
are in the online appendix.
Each participant filled out a survey measuring their funding preferences for 17 distinct
policy areas on a seven-point scale ranging from “decrease spending radically” to “increase
spending radically” with zero marking no change. We then measured their funding pref-
erences a second time after we exposed them to a nearly identical recession vignette as in
the voting experiment in Section 5.1 above.
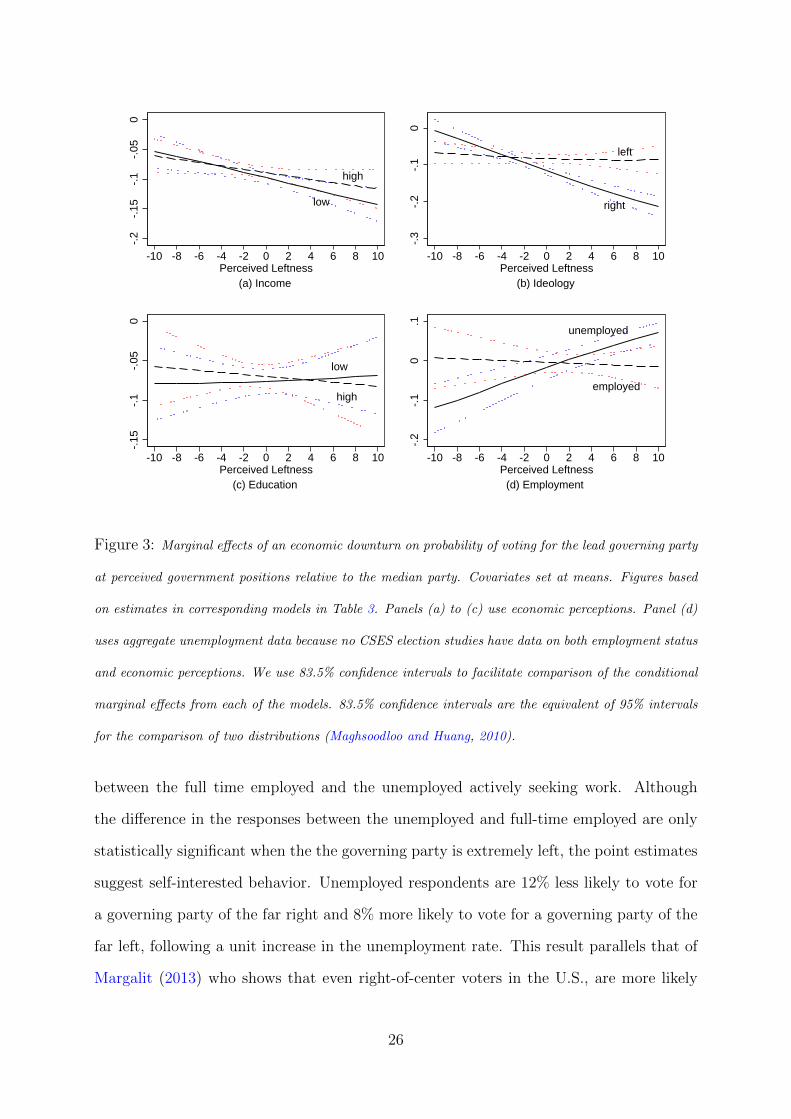
Figure 5 shows the mean changes in policy preferences across all 17 policy areas,
ordered by the size of the mean change. Several patterns catch the eye. First, as predicted,
participants’ support for luxury good, post-materialist policies such as international aid,
the return of natural species to native habitats, arts funding, reduction of CO2 emissions
and social inclusion programs declines markedly during a recession. The salience of post-
33
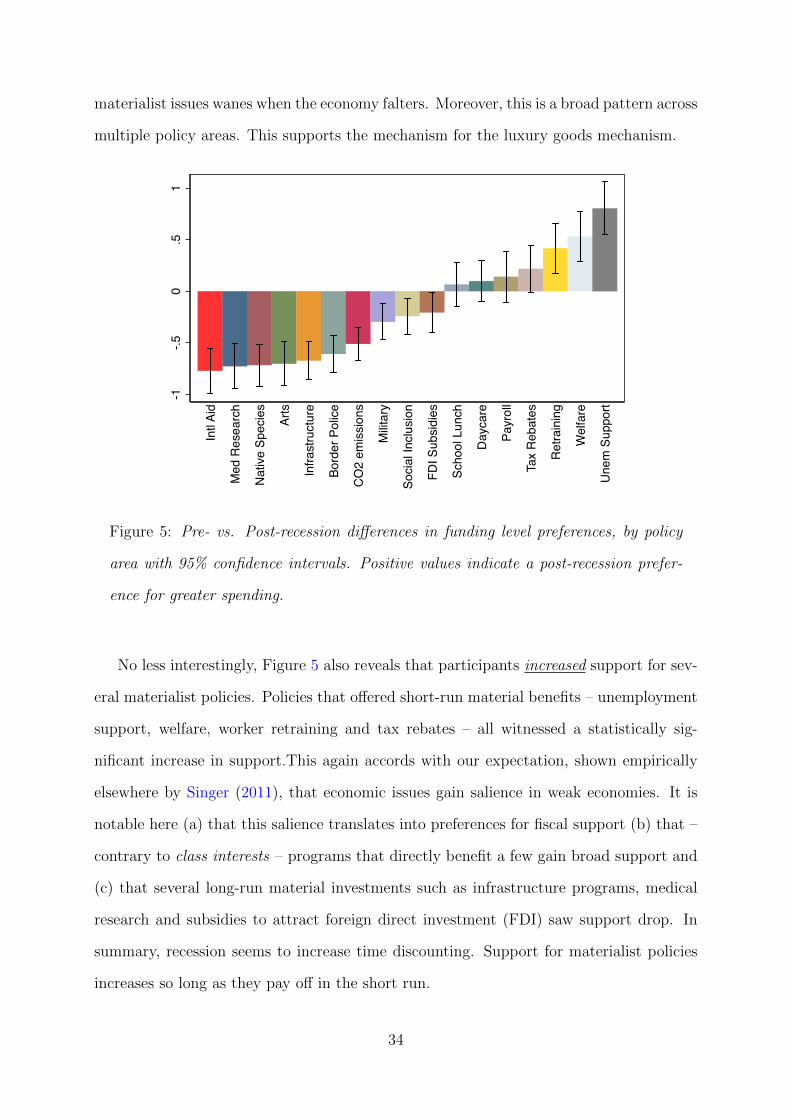
materialist issues wanes when the economy falters. Moreover, this is a broad pattern across
multiple policy areas. This supports the mechanism for the luxury goods mechanism.
-1-.5
0.5
1
Intl A
id
Med
Res
earc
h
Nativ
e Sp
ecie
s
Arts
Infra
stru
ctur
e
Bord
er P
olice
CO2
emiss
ions
Milit
ary
Socia
l Inc
lusio
n
FDI S
ubsid
ies
Scho
ol L
unch
Dayc
are
Payr
oll
Tax
Reba
tes
Retra
inin
g
Wel
fare
Unem
Sup
port
Figure 5: Pre- vs. Post-recession differences in funding level preferences, by policy
area with 95% confidence intervals. Positive values indicate a post-recession prefer-
ence for greater spending.
No less interestingly, Figure 5 also reveals that participants increased support for sev-
eral materialist policies. Policies that offered short-run material benefits – unemployment
support, welfare, worker retraining and tax rebates – all witnessed a statistically sig-
nificant increase in support.This again accords with our expectation, shown empirically
elsewhere by Singer (2011), that economic issues gain salience in weak economies. It is
notable here (a) that this salience translates into preferences for fiscal support (b) that –
contrary to class interests – programs that directly benefit a few gain broad support and
(c) that several long-run material investments such as infrastructure programs, medical
research and subsidies to attract foreign direct investment (FDI) saw support drop. In
summary, recession seems to increase time discounting. Support for materialist policies
increases so long as they pay off in the short run.
34
How might these shifts in policy preferences influence elections? Materialist policy ef-
fects on voting are ambiguous because both the left (e.g., unemployment support) and the
right (e.g., tax rebates) are associated with short-run material issues. Post-materialist lux-
ury good issues, however, are predominantly associated with the left. When the economy
deteriorates, many voters likely find themselves less supportive of issues that previously
attracted them to the left, thereby weakening electoral support for left parties, especially
those associated with luxury goods policies. These data are from US participants, but in
other developed democracies where the center-right has become part of the welfare state
coalition (Gingrich and Hausermann, 2015), the attraction of the right in downturns, as
seen in our cross-national observational data, might be even stronger.
7 Discussion and conclusion
This paper, employing both observation and experimental data, offers the first individual-
level evidence to demonstrate across multiple countries that voters drift away from the left
in economic downturns. We find evidence for this phenomenon in a luxury goods model
of voting but not in rival mechanisms such clientelism, aversion to redistribution, partisan
accountability or right-party reputation for economic competence. Voters, we argue,
eschew post-material, luxury-good policies when the economy sours and material concerns
gain salience. Leftist parties lose electoral support because they are more associated with
luxury goods policies than are parties on the right. When voters associate parties of the
left with with material issues such as welfare or unemployment benefits rather than post-
material, luxury good issues such as the environment, arts and international aid, they are
punished only at the mean for all parties leading a government in downturns.
One of the most documented effects in the study of politics is the economic vote – the
loss in electoral support that incumbents incur when the economy sours. This literature,
however, ignores the ideology and policies of incumbent parties, remaining content to
demonstrate non-partisan retrospective voting. As secure as this regularity is, however,
voters are not purely retrospective; they also care prospectively about the policies that
35
a new government would introduce. We demonstrate that both effects matter: voters do
punish the party of the governing executive for economic downturns but when the ruling
party is from the left, it faces additional sanctions as voters shun parties associated with
post-material policies at a time when material concerns dominate. Thus, the economy has
partisan electoral consequences. Voters punish left governments associated with luxury
good policies, unlike their counterparts on the right, doubly: once retrospectively via the
economic vote and once prospectively via the luxury goods vote.
Political science has known about the effect of national income level on the emergence
of “post-materialist” values and parties since the seminal work of Inglehart (1971). The
similarity with our results are not coincidental as most post-material policies are luxury
goods policies. As long established as post-materialism is in the study of parties, how-
ever, we believe that we are the first to connect it to short-run economic fluctuations and
voting. Our primary focus is on the voting effects of short-run contractions rather than,
as in Inglehart’s case, the long-run effects of wealth accumulation on values, democracy
and party systems. Interpreting our results in terms of positive (e.g., decreasing unem-
ployment) rather than negative economic change, yields results that look more similar
to Inglehart’s. Left parties prosper from prosperity, not just in terms of policy mood
(Markussen, 2008) but in voting. When voters’ material needs are satiated, their policy
shift beyond the material, advantaging the left.
The focus of many parties of the left on values and post-material issues such as environ-
mental protection, minority rights and international aid may have attracted new support
from socio-cultural professionals and other left-libertarians (Kitschelt, 1994; Kriesi, 1998,
2010) to replace some of that lost to the the erosion of class voting (Evans, 1999). We
show here, however, that this move comes along with risks. When the economy falters,
voters prioritize material issues.
36
References
Adams, James, Lawrence Ezrow and Zeynep Somer-Topcu. 2011. “Is Anybody Listening?
Evidence That Voters Do Not Respond to European Parties’ Policy Statements During
Elections.” American Journal of Political Science 55(2):370–382.
Ai, Chunrong and Edward C Norton. 2003. “Interaction terms in logit and probit models.”
Economics letters 80(1):123–129.
Alesina, Alberto. 1987. “Macroeconomic policy in a two-party system as a repeated
game.” The Quarterly Journal of Economics pp. 651–678.
Anderson, Christopher J. 2000. “Economic voting and political context: a comparative
perspective.” Electoral Studies 19(2):151–170.
Anderson, Christopher J. 2007. “The End of Economic Voting? Contingency Dilem-
mas and the Limits of Democratic Accountability.” Annual Review of Political Science
10(1):271–296.
Anderson, Christopher J and Jason D Hecht. 2014. Crisis of Confidence? The Dynamics
of Economic Opinions During the Great Recession. In Mass Politics in Tough Times:
Opinions, Votes, and Protest in the Great Recession, ed. Nancy Bermeo and Larry M.
Bartels. Oxford and New York: Oxford University Press pp. 40–71.
Barnes, Lucy and Tim Hicks. 2012. “Left Behind? Partisan Politics after the Financial
Crisis.” SSRN Working paper, http://ssrn.com/abstract=2105210 .
Bartels, Larry M. 2010. Unequal democracy: The political economy of the new gilded age.
Princeton University Press.
Belanger, Eric and Bonnie M Meguid. 2008. “Issue salience, issue ownership, and issue-
based vote choice.” Electoral Studies 27(3):477–491.
Berinsky, Adam J, Gregory A Huber and Gabriel S Lenz. 2012. “Evaluating online labor
37
markets for experimental research: Amazon. com’s Mechanical Turk.” Political Analysis
20(3):351–368.
Budge, Ian and Dennis J. Farlie. 1983. Explaining and Predicting Elections: Issue Effects
and Party Strategies in Twenty-Three Democracies. London: Allen and Unwin.
Carlsen, Fredrik. 2000. “Unemployment, Inflation, and Government Popularity: Are
There Partisan Effects?” Electoral Studies 19(2/3):141–50.
Dassonneville, Ruth and Michael S Lewis-Beck. 2013. “Economic Policy Voting and In-
cumbency: Unemployment in Western Europe.” Political Science Research and Methods
1(1):53–66.
De Neve, Jan E. 2009. “Ideological Change and the Economics of Voting Behavior in the
US, 1920-2008.”.
Duch, Raymond M. and Randy Stevenson. 2008. The Economic Vote: How Political and
Economic Institutions Condition Election Results. Cambridge: Cambridge University
Press.
Duch, Raymond, Wojtek Przepiorka and Randolph Stevenson. 2015. “Responsibility attri-
bution for collective decision makers.” American Journal of Political Science 59(2):372–
389.
Durr, Robert H. 1993. “What Moves Policy Sentiment?” American Political Science
Review 87(1):158–72.
Easterlin, Richard A. 1974. “Does economic growth improve the human lot? Some
empirical evidence.” Nations and households in economic growth 89.
Evans, Geoffrey. 1999. The end of class politics?: class voting in comparative context.
Oxford University Press.
Evans, Geoffrey and Mark Pickup. 2010. “Reversing the causal arrow: the political
38
conditioning of economic perceptions in the 2000-2004 US presidential election cycle.”
Journal of Politics 72(4):1236–1251.
Fisher, Stephen D and Sara B Hobolt. 2010. “Coalition government and electoral ac-
countability.” Electoral studies 29(3):358–369.
Gandrud, Christopher and Cassandra Grafstrom. 2015. “Inflated Expectations: How gov-
ernment partisanship shapes monetary policy bureaucrats’ inflation forecasts.” Political
Science Research and Methods 3(02):353–380.
Gerring, John. 2001. Party ideologies in America, 1828-1996. Cambridge University
Press.
Gilens, Martin and Benjamin I Page. 2014. “Testing theories of American politics: Elites,
interest groups, and average citizens.” Perspectives on politics 12(03):564–581.
Gingrich, Jane and Silja Hausermann. 2015. “The decline of the working-class vote, the
reconfiguration of the welfare support coalition and consequences for the welfare state.”
Journal of European Social Policy 25(1):50–75.
Green, Donald P, Soo Yeon Kim and David H Yoon. 2001. “Dirty pool.” International
Organization 55(02):441–468.
Green, Jane and Sara B Hobolt. 2008. “Owning the issue agenda: Party strategies and
vote choices in British elections.” Electoral Studies 27(3):460–476.
Green, Jane and Will Jennings. in progress. The Politics of Competence: The Nature and
Implications of Public Opinion about Party Competence. Book Manuscript.
Healy, Andrew and Gabriel S. Lenz. 2014. “Substituting the End for the Whole: Why Vot-
ers Respond Primarily to the Election-Year Economy.” American Journal of Political
Science 58(1):31–47.
Hetherington, Marc J. 1996. “The Media’s Role in Forming Voters’ National Economic
Evaluations in 1992.” American Journal of Political Science 40(2):372–395.
39
Hibbs, Douglas A. 1977. “Political Parties and Macroeconomic Policy.” American Political
Science Review 71:1467–87.
Huff, Connor and D Tingley. 2015. Research & Politics (July-September):1–12.
Inglehart, Ronald. 1971. “The silent revolution in Europe: Intergenerational change in
post-industrial societies.” American political science review 65(04):991–1017.
Inglehart, Ronald and Paul R Abramson. 1994. “Economic Security and Value Change.”
American political science review 88(02):336–354.
Kayser, Mark A. 2009. “Partisan Waves: International Business Cycles and Electoral
Choice.” American Journal of Political Science 53(4):950–970.
Kayser, Mark A. 2014. The Elusive Economic Vote. In Comparing Democracies 4, ed.
Lawrence LeDuc, Richard G. Niemi and Pippa Norris. Thousand Oaks, CA: Sage.
Kayser, Mark Andreas and Arndt Leininger. 2015. “Vintage errors: do real-time economic
data improve election forecasts?” Research & Politics 2(3):2053168015589624.
Kedar, Orit. 2005. “When moderate voters prefer extreme parties: Policy balancingin
parliamentary elections.” American Political Science Review 99(02):185–199.
Kiewiet, Roderick D. 1981. “Policy-Orientied Voting in Response to Economic Issues.”
American Political Science Review 75:448–59.
Kitschelt, Herbert. 1994. The transformation of European social democracy. cambridge
university press.
Kriesi, Hanspeter. 1998. “The transformation of cleavage politics The 1997 Stein Rokkan
lecture.” European journal of political research 33(2):165–185.
Kriesi, Hanspeter. 2010. “Restructuration of Partisan Politics and the Emergence of a
New Cleavage Based on Values.” West European Politics 33(3):673–685.
40
Lamartina, Serena and Andrea Zaghini. 2011. “Increasing Public Expenditure: Wagner’s
Law in OECD Countries.” German Economic Review 12(2):149–164.
LeDuc, Lawrence and Jon H Pammett. 2013. “The Fate of Governing Parties in Times
of Economic Crisis.” Electoral Studies .
Lindgren, Karl-oskar and Kare Vernby. 2016. “The electoral impact of the financial crisis:
Evidence using district-level data.” Electoral Studies .
Lindvall, Johannes. 2014. “The electoral consequences of two great crises.” European
Journal of Political Research 53(4):747–765.
Lo, J., S.-O. Proksch and T. Gschwend. 2013. “A Common Left-Right Scale for Voters
and Parties in Europe.” Political Analysis 23113:1–19.
Macdonald, Stuart Elaine, Ola Listhaug and George Rabinowitz. 1991. “Issues and Party
Support in Multiparty Systems.” American Political Science Review 85(04):1107–1131.
Magalhaes, Pedro. 2012. “Economy, Ideology, and the Elephant in the Room: A Research
Note on the Elections of the Great Recession in Europe.” Available at SSRN 2122416 .
Maghsoodloo, Saeed and Ching-Ying Huang. 2010. “Comparing the Overlapping of Two
Independent Confidence Intervals with a Single Confidence Interval for Two Normal
Population Parameters.” Journal of Statistical Planning and Inference 140(1):3295–
3305.
Margalit, Yotam. 2013. “Explaining Social Policy Preferences : Evidence from the Great
Recession.” American Political Science Review 107(1):80–103.
Markussen, S. 2008. “How the left prospers from prosperity.” European Journal of Polit-
ical Economy 24(2):329–342.
Maslow, Abraham Harold, Robert Frager and James Fadiman. 1970. Motivation and
personality. Vol. 2 Harper & Row New York.
41
Moene, Karle O. and Michael Wallerstein. 2001. “Inequality, Social Insurance, and Re-
distribution.” American Political Science Review 95(04):859–874.
Neundorf, Anja and James Adams. 2016. “The micro-foundations of party competition
and issue ownership: the reciprocal effects of citizens’ issue salience and party attach-
ments.” British Journal of Political Science pp. 1–22.
Pacek, Alexander C and Benjamin Radcliff. 1999. “Economics and the Left Party Vote
in.” Scandinavian Political Studies 22(4):295–304.
Peltzman, Sam. 1992. “Voters as fiscal conservatives.” The Quarterly Journal of Eco-
nomics 107(2):327–361.
Powell, Bingham G. and Guy D. Whitten. 1993. “A Cross-National Analysis of Economic
Voting: Taking Account of the Political Context.” American Journal of Political Science
37(2):391–414.
Schmitt, Hermann and Evi Scholz. 2002. “The Mannheim Eurobarometer Trend File
1970–1999.” Ann Arbor, MI: Inter-University Consortium for Political and Social Re-
search .
Singer, Matthew M. 2011. “Who Says “It’s the Economy”? Cross-National and Cross-
Individual Variation in the Salience of Economic Performance.” Comparative Political
Studies 44(3):284–312.
Stevenson, Randolph T. 2001. “The Economy and Policy Mood: A Fundamental Dynamic
of Democratic Politics?” American Journal of Political Science 45(3):620–33.
Stevenson, Randolph T. 2002. The Economy as Context: Indirect Links between the
Economy and Voters. In Economic Voting, ed. Han Dorussen and Michaell Taylor.
Routledge chapter 3, pp. 45–65.
Stevenson, Randolph T and Raymond Duch. 2013. “The meaning and use of subjective
perceptions in studies of economic voting.” Electoral Studies 32(2):305–320.
42
Stigler, George J. 1973. “General Economic Conditions and National Elections.” American
Economic Review LXIII:160–167.
Stimson, James A. 1991. Public Opinion in America: Moods, Cycles, and Swings. Boulder:
Westview.
Swank, Otto H. 1993. “Popularity functions based on the partisan theory.” Public Choice
75(4):339–356.
The Comparative Study of Electoral Systems. 2013. dataset, 27 March 2013 version,
www.cses,org. module 3.
Wagner, Adolph. 1911. Staat in nationaloekonomischer Hinsicht. Vol. VII 3 ed. pp. 743–
745.
Wlezien, Christopher. 2015. “The Myopic Voter? The Economy and US Presidential
Elections.” Electoral Studies Forthcoming.
Wlezien, Christopher, Mark Franklin and Daniel Twiggs. 1997. “Economic Perceptions
and Vote Choice: Disentangling the Endogeneity.” Political Behavior 19(1):7–17.
43