Embed Size (px)
Citation preview
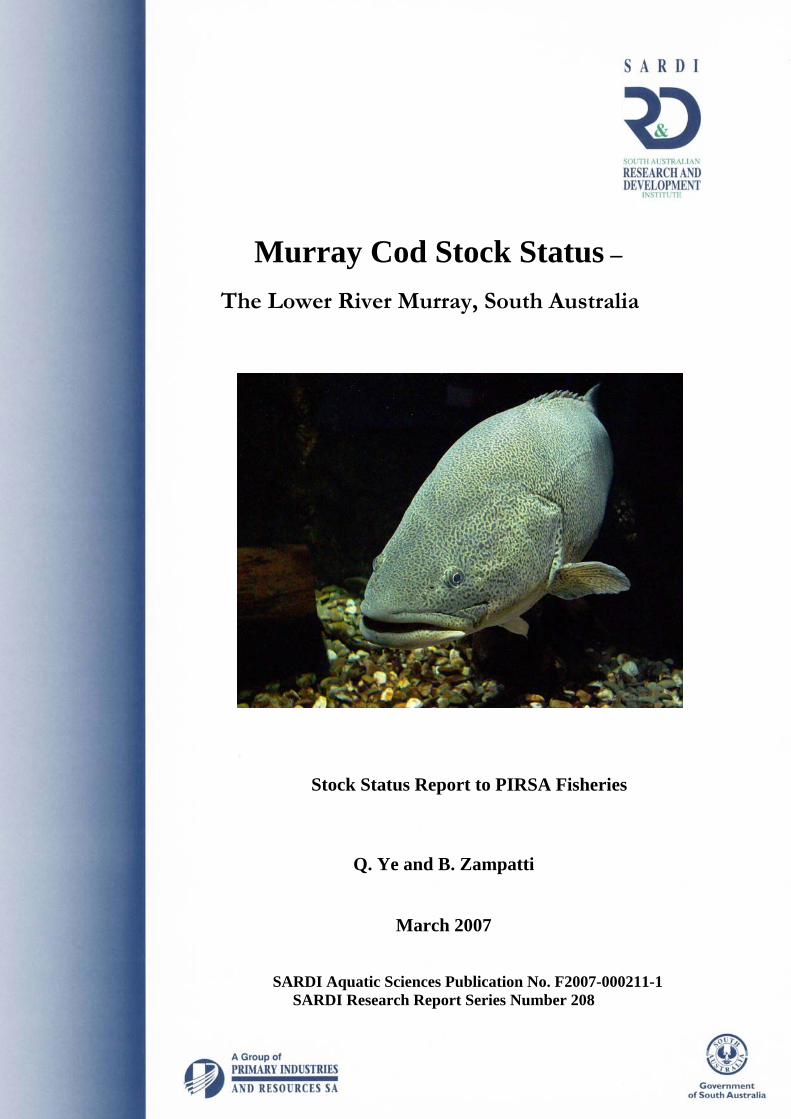
Murray Cod Stock Status –
The Lower River Murray, South Australia
Stock Status Report to PIRSA Fisheries
Q. Ye and B. Zampatti
March 2007
SARDI Aquatic Sciences Publication No. F2007-000211-1 SARDI Research Report Series Number 208
Murray Cod Stock Status –
The Lower River Murray, South Australia
Stock Status Report to PIRSA Fisheries
Q. Ye and B. Zampatti
March 2007
SARDI Aquatic Sciences Publication No. F2007-000211-1 SARDI Research Report Series Number 208
This Publication may be cited as: Ye, Q and Zampatti, B (2007) Murray cod stock status – the Lower River Murray, South Australia. Stock Status Report to PIRSA Fisheries. South Australian Research and Development Institute (Aquatic Sciences), Adelaide, 32pp. SARDI Publication Number F2007-000211-1.
South Australian Research and Development Institute SARDI Aquatic Sciences 2 Hamra Avenue West Beach, SA 5024 Telephone: (08) 8207 2400 Facsimile: (08) 8207 5481 http://www.sardi.sa.gov.au Disclaimer. The authors warrant that they have taken all reasonable care in producing this report. The report has been through the SARDI Aquatic Sciences internal review process, and has been formally approved for release by the Chief Scientist. Although all reasonable efforts have been made to ensure quality, SARDI Aquatic Sciences does not warrant that the information in this report is free from errors or omissions. SARDI Aquatic Sciences does not accept any liability for the contents of this report or for any consequences arising from its use or any reliance placed upon it. © 2007 SARDI Aquatic Sciences This work is copyright. Apart from any use as permitted under the Copyright Act 1968, no part may be reproduced by any process without prior written permission from the author. Printed in Adelaide 21 May 2007 SARDI Aquatic Sciences Publication Number F2007-000211-1 SARDI Research Report Series Number 208 Author(s): Q. Ye and B. Zampatti Reviewers: Tony Fowler and Jason Tanner Approved by: J. Tanner
Signed: Date: 21 May 2007 Distribution: PIRSA Fisheries, Inland Fisheries Management Committee, SARDI Aquatic
Sciences Library Circulation: Public Domain
Ye and Zampatti (2007) Murray Cod Stock Status _____________________________________________________________________________________________
1
Table of Contents List of Tables 2 List of Figures 3 Acknowledgements 4 Executive Summary 5 1. Introduction 6 2. Key Biological Information 8 3. Stock Status 12
3.1 Commercial Catch and Effort 12 3.2 Size Composition 16 3.3 Recreational and Indigenous Fishing Survey 18 3.4 Native Fish Monitoring 18 3.5 Other research 25
4. General Discussion 27 5. Future Research and Monitoring Needs 29 6. References 30
Ye and Zampatti (2007) Murray Cod Stock Status _____________________________________________________________________________________________
2
List of Tables Table 1. The size and age at first maturity of Murray cod from different regions in Australia.9 Table 2. Estimates of the recreational harvest and release of Murray cod in 2001/02 from the
South Australian River Murray and overall inland waters. 18 Table 3. A summary table of the number of Murray cod sampled, fishing effort and CPUE
through the Native Fish Monitoring Program between January 2005 and April 2006. 21
Ye and Zampatti (2007) Murray Cod Stock Status _____________________________________________________________________________________________
3
List of Figures Figure 1. Map of the Murray-Darling Basin. 8 Figure 2. Lengths at age of Murray cod from the lower River Murray, South Australia. 10 Figure 3. Lengths at age of Murray cod from the River Murray, Victoria. 11 Figure 4. Morphometric relationships of Murray cod in the lower River Murray, South
Australia. a. Total and standard length relationship. b. Total length and weight relationship. 11
Figure 5. Murray cod commercial landings from the South Australian inland fisheries
between 1951/52 and 2002/03. 12 Figure 6. a. Annual commercial landings and fishing effort for Murray cod in the South
Australian River Fishery from 1985 to 2003; b. Catch per unit of effort (CPUE kg/manday); c. River Murray daily flow rate (ML/day) to South Australia at the border. 13
Figure 7. Annual commercial catch and fishing effort for Murray cod by gear type in the
South Australian River Fishery from 1985 to 2003. 15 Figure 8. Catch rates and flow adjusted catch rates by gear for Murray cod in the South
Australian River Fishery from 1985 to 2003. 15 Figure 9. Length frequency distributions (percent frequency) of Murray cod in South
Australia from 1990 to 2003. 17 Figure 10. Native Fish Monitoring sampling sites along the lower River Murray, South
Australia. 20 Figure 11. Size frequency distributions of Murray cod sampled through the Native Fish
Monitoring Program between January 2005 and April 2006. 21 Figure 12. Native Fish Monitoring electrofishing sites during April 2006 along the lower
River Murray, South Australia. 23 Figure 13. Boat electrofishing in April 2006 along the lower River Murray, South Australia.
23 Figure 14. Typical habitats at boat electrofishing sites for Murray cod along the lower River
Murray during 3-7 April 2006. 24 Figure 15. Length-frequency distribution of Murray cod boat electrofished (a) downstream of
Lock 7, (b) in the Chowilla Anabranch system and (c) immediately downstream of Locks 1, 2 and 3 (Blanchetown to Waikerie). 26
Ye and Zampatti (2007) Murray Cod Stock Status _____________________________________________________________________________________________
4
Acknowledgements We acknowledge the field assistance of SA River Fishers Tony Smith as well as Damien and
Malcolm Wilksch for the Native Fish Monitoring Program. We appreciate the SA Inland
commercial fishers for the supply of their catch and effort data, and are grateful to the fishers
who voluntarily collected the length data of the intercepted and returned Murray cod during
the 1990-1994 moratorium and seasonal closures.
This status report incorporates invaluable biological data for Murray cod collected through
other research projects funded by the Murray-Darling Basin Commission and the South
Australian Department of Water, Land and Biodiversity Conservation. Thanks to numerous
staff from the New South Wales Department of Primary Industries (Narrandera Fisheries
Centre) and the Arthur Rylah Institute in Victoria who collaborate on these projects.
Thanks to the following SARDI staff for their contribution to this assessment: Dave Fleer,
David Short, Matthew Pellizzare, and Michael Guderian for assistance in field sampling, lab
processing, data management and age determination. Malcolm Knight, Angelo Tsolos, and
Emily Thompson provided the fisheries statistics.
Special thanks to Dr Keith Jones for providing regional information on Murray cod based on
the National Recreational and Indigenous Fishing Survey 2000/01. Thanks also to Alice Fistr
for comments on the manuscript. Dr Tony Fowler and Dr Jason Tanner formally reviewed a
draft of this report. This report is funded by PIRSA Fisheries.
Ye and Zampatti (2007) Murray Cod Stock Status _____________________________________________________________________________________________
5
Executive Summary • In the South Australian River Murray, there is little indication of strong recruitment of
Murray cod since 1994.
• There appears to have been some low level recruitment in 2000 associated with flows in
the River Murray of approximately 20,000 to 60,000 ML/day.
• Previous stock assessments for Murray cod in SA were primarily dependent on the
readily available commercial fishery data. Such data are no longer available since the
restructure of the commercial River Fishery in July 2003. Attempts have been made to
sample Murray cod through the Native Fish Monitoring Program, nevertheless,
information collected so far has been limited and patchy.
• Historical fishery data indicate a strong link between river flow and Murray cod
recruitment with a positive relationship.
• Given protracted years without significant high flows, and particularly the critical drought
conditions in the last six years in the Murray-Darling Basin, there is a high risk that the
stock may decline further unless strong year classes can be added.
• Furthermore, to mitigate the impact of flow regulation on Murray cod, environmental
water allocations are essential to maintain/enhance natural recruitment of this species.
Effective flow management, habitat rehabilitation and fish passage restoration, in
conjunction with fishing regulations to ensure sustainable exploitation, are important
measures for the sustainable management and conservation of Murray cod populations.
• The National Recreational and Indigenous Fishing Survey suggested significant
recreational harvest of Murray cod in the SA River Murray (22.8 tonnes in 2000/01), with
an additional 16.4% released.
• Ensuring an adequate spawning biomass to maximise recruitment from years when
environmental conditions are favourable is an important strategy for the management of
the Murray cod fishery.
• A precautionary approach to the management of this species should be adopted.
Conservation management measures may include: changing size limits; seasonal or area
closures; a moratorium on the take of Murray cod.
• Current research indicates that key areas (such as major anabranches) may be important
for Murray cod recruitment, particularly during years of sustained low and uniform flows
in the River Murray.
Ye and Zampatti (2007) Murray Cod Stock Status _____________________________________________________________________________________________
6
1. Introduction
Murray cod (Maccullochella peelii peelii) is the icon fish species of the River Murray. It was
a key commercial species in the South Australian Inland Waters Fishery and remains an
important recreational species. The first fishery assessment report specific to Murray cod was
prepared in November 2000. That report provided a detailed review of the fishery biology
and ecology of this species and information on biological performance indicators estimated
from compulsory catch and effort data and data collected voluntarily by commercial fishers
(i.e. size compositions and non-targeted catch rate of Murray cod during the seasonal closure
between 1st September and 31st December) (Ye et al. 2000). In 2002 an interim report on
Murray cod was provided to PIRSA Fisheries, which updated the commercial catch and effort
information to June 2002 (Ye et al. 2002).
In 2003 Murray cod was listed as a species that was nationally vulnerable to extinction under
the Environment Protection and Biodiversity Conservation Act 1999 (EPBC Act). As such, a
National Recovery Plan for this species is currently in the final stages of development.
Commercial fishing for native fish including Murray cod ceased in the South Australian
reaches of the River Murray when the fishery underwent a major restructure to a non-native
fishery in July 2003. In January 2005, a fishery independent monitoring program (Native
Fish Monitoring Program) was implemented by PIRSA Fisheries and SARDI Aquatic
Sciences. This program aims to collect biological information for key native fish species such
as Murray cod and golden perch (Macquaria ambigua), and measure biological performance
indicators for stock assessment.
This document is a stock status report, highlighting key biological information on Murray cod
and evaluating current stock status in the lower River Murray, South Australia. Several
independent datasets are considered including: commercial catch and effort data updated to
June 2003; information on size composition collected by fishers between 1990 and 2003;
estimates of recreational harvest and release from the National Recreational and Indigenous
Fishing Survey conducted in 2000/01 (Henry and Lyle 2003; Jones and Doonan 2005); and
additional information from the Native Fish Monitoring Program (NFM) and Murray-Darling
Basin Commission funded projects (e.g. the Tristate Murray River Fishway Assessment
Program and the Chowilla Fish Ecology Project). Key biological performance indicators
derived from the above data are:
• catch rates (CPUE) from the previous commercial fishery and the fishery independent
sampling program (NFM);
Ye and Zampatti (2007) Murray Cod Stock Status _____________________________________________________________________________________________
7
• temporal and spatial variability in size composition, as an indirect indicator of
recruitment strength, based on data from the previous commercial fishery (measured
and released cod during the moratorium and the closed seasons), NFM (netting) and
other research projects in this region (electrofishing);
• harvest and release of Murray cod from the recreational fishery.
River flow is also considered, as an environmental performance indicator, because historical
fishery data suggest a strong correlation between flow and Murray cod recruitment (Ye et al.
2000). The trends for flow-corrected catch rates are also considered to indicate changes in
stock abundance.
Ye and Zampatti (2007) Murray Cod Stock Status _____________________________________________________________________________________________
8
2. Key Biological Information
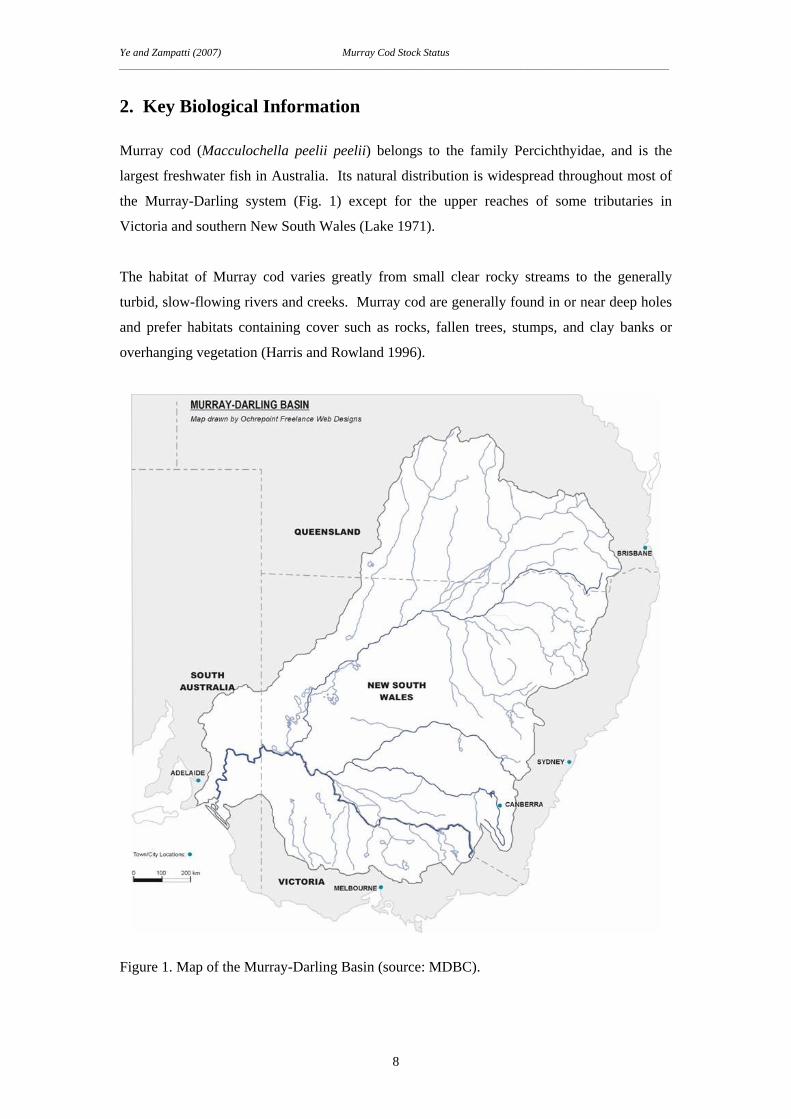
Murray cod (Macculochella peelii peelii) belongs to the family Percichthyidae, and is the
largest freshwater fish in Australia. Its natural distribution is widespread throughout most of
the Murray-Darling system (Fig. 1) except for the upper reaches of some tributaries in
Victoria and southern New South Wales (Lake 1971).
The habitat of Murray cod varies greatly from small clear rocky streams to the generally
turbid, slow-flowing rivers and creeks. Murray cod are generally found in or near deep holes
and prefer habitats containing cover such as rocks, fallen trees, stumps, and clay banks or
overhanging vegetation (Harris and Rowland 1996).
Figure 1. Map of the Murray-Darling Basin (source: MDBC).
Ye and Zampatti (2007) Murray Cod Stock Status _____________________________________________________________________________________________
9
Murray cod has a relatively short, well-defined breeding season. Spawning occurs in spring
and early summer cued by increasing photoperiod and water temperature (recorded range 15 –
23.5 ºC) (Lake 1967; Langtry in Cadwallader 1977; Rowland 1983, 1985; Gooley et al.,
1995; Koehn and Harrington 2006). Murray cod deposits large (3 mm) adhesive eggs onto
solid surfaces such as logs, rocks or clay, and relative fecundity is approximately 5000 eggs
per kg of body weight (Rowland 1985). Murray cod spawn annually (Humphries et al. 2002;
Humphries 2005), but in the lower River Murray, Edward, Wakool and Murrumbidgee Rivers
relatively strong year classes may only be established when the breeding season coincides
with high river flows both within channel and overbank (Rowland 1998; Ye et al. 2000). The
South Australian historical fishery data suggest a strong correlation between the recruitment
of Murray cod and river flows (Ye et al. 2000).
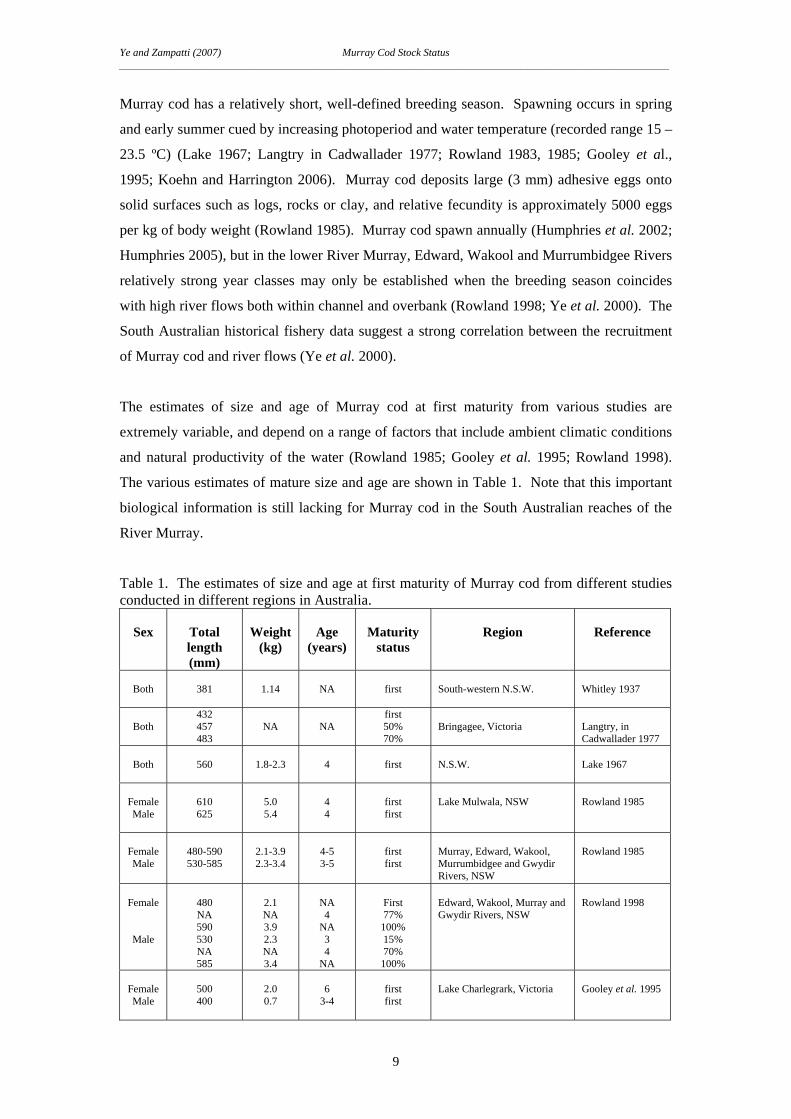
The estimates of size and age of Murray cod at first maturity from various studies are
extremely variable, and depend on a range of factors that include ambient climatic conditions
and natural productivity of the water (Rowland 1985; Gooley et al. 1995; Rowland 1998).
The various estimates of mature size and age are shown in Table 1. Note that this important
biological information is still lacking for Murray cod in the South Australian reaches of the
River Murray.
Table 1. The estimates of size and age at first maturity of Murray cod from different studies conducted in different regions in Australia.
Sex
Total length (mm)
Weight
(kg)
Age
(years)
Maturity
status
Region
Reference
Both
381
1.14
NA
first
South-western N.S.W.
Whitley 1937
Both
432 457 483
NA
NA
first 50% 70%
Bringagee, Victoria
Langtry, in Cadwallader 1977
Both
560
1.8-2.3
4
first
N.S.W.
Lake 1967
Female Male
610 625
5.0 5.4
4 4
first first
Lake Mulwala, NSW
Rowland 1985
Female Male
480-590 530-585
2.1-3.9 2.3-3.4
4-5 3-5
first first
Murray, Edward, Wakool, Murrumbidgee and Gwydir Rivers, NSW
Rowland 1985
Female
Male
480 NA 590 530 NA 585
2.1 NA 3.9 2.3 NA 3.4
NA 4
NA 3 4
NA
First 77%
100% 15% 70%
100%
Edward, Wakool, Murray and Gwydir Rivers, NSW
Rowland 1998
Female Male
500 400
2.0 0.7
6
3-4
first first
Lake Charlegrark, Victoria
Gooley et al. 1995
Ye and Zampatti (2007) Murray Cod Stock Status _____________________________________________________________________________________________
10
Murray cod is a long-lived species with a life span that extends to at least 48 years (Anderson
et al. 1992). Growth rates and body forms may vary significantly between populations from
different regions and different habitats within the Murray-Darling Basin (Rowland 1985;
Anderson et al. 1992; Nicol et al. 2005). In general, growth is characterised by mostly
increasing weight when Murray cod are older than 10 years (Harris and Rowland 1996).
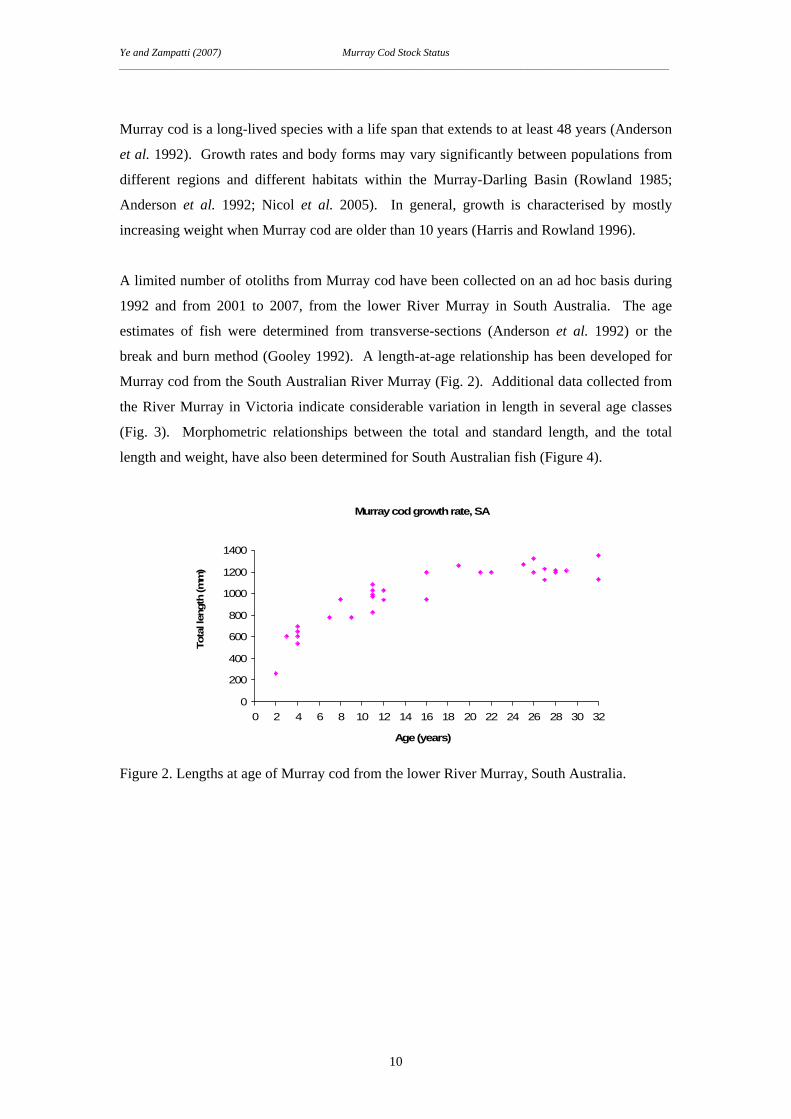
A limited number of otoliths from Murray cod have been collected on an ad hoc basis during
1992 and from 2001 to 2007, from the lower River Murray in South Australia. The age
estimates of fish were determined from transverse-sections (Anderson et al. 1992) or the
break and burn method (Gooley 1992). A length-at-age relationship has been developed for
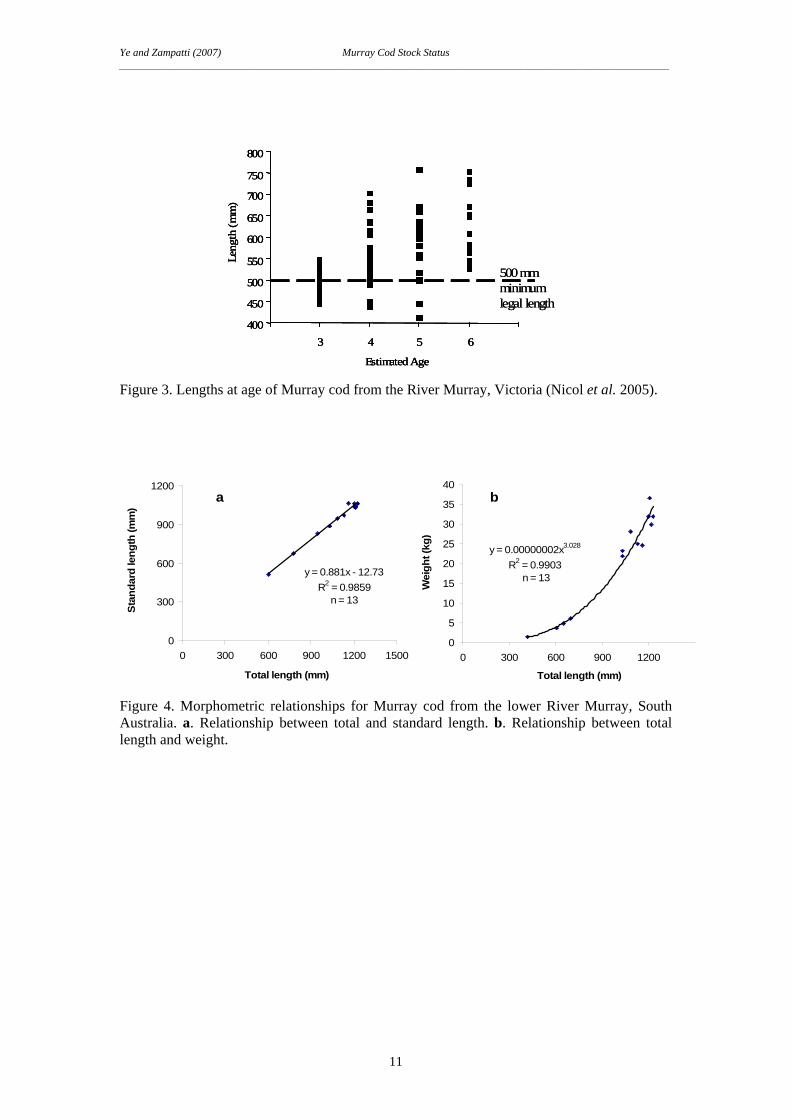
Murray cod from the South Australian River Murray (Fig. 2). Additional data collected from
the River Murray in Victoria indicate considerable variation in length in several age classes
(Fig. 3). Morphometric relationships between the total and standard length, and the total
length and weight, have also been determined for South Australian fish (Figure 4).
Murray cod growth rate, SA
0
200
400
600
800
1000
1200
1400
0 2 4 6 8 10 12 14 16 18 20 22 24 26 28 30 32
Age (years)
Tota
l len
gth
(mm
)
Figure 2. Lengths at age of Murray cod from the lower River Murray, South Australia.
Ye and Zampatti (2007) Murray Cod Stock Status _____________________________________________________________________________________________
11
400
450
500
550
600
650
700
750
800
3 4 5 6
Leng
th (m
m)
Estimated Age
500 mmminimumlegal length
400
450
500
550
600
650
700
750
800
3 4 5 6
Leng
th (m
m)
Estimated Age
400
450
500
550
600
650
700
750
800
3 4 5 6
Leng
th (m
m)
Estimated Age
500 mmminimumlegal length
Figure 3. Lengths at age of Murray cod from the River Murray, Victoria (Nicol et al. 2005).
a
y = 0.881x - 12.73R2 = 0.9859
n = 13
0
300
600
900
1200
0 300 600 900 1200 1500
Total length (mm)
Stan
dard
leng
th (m
m)
b
y = 0.00000002x3.028
R2 = 0.9903 n = 13
0
5
10
15
20
25
30
35
40
0 300 600 900 1200
Total length (mm)
Wei
ght (
kg)
Figure 4. Morphometric relationships for Murray cod from the lower River Murray, South Australia. a. Relationship between total and standard length. b. Relationship between total length and weight.
Ye and Zampatti (2007) Murray Cod Stock Status _____________________________________________________________________________________________
12
3. Stock Status
3.1 Commercial Catch and Effort
Overall landings
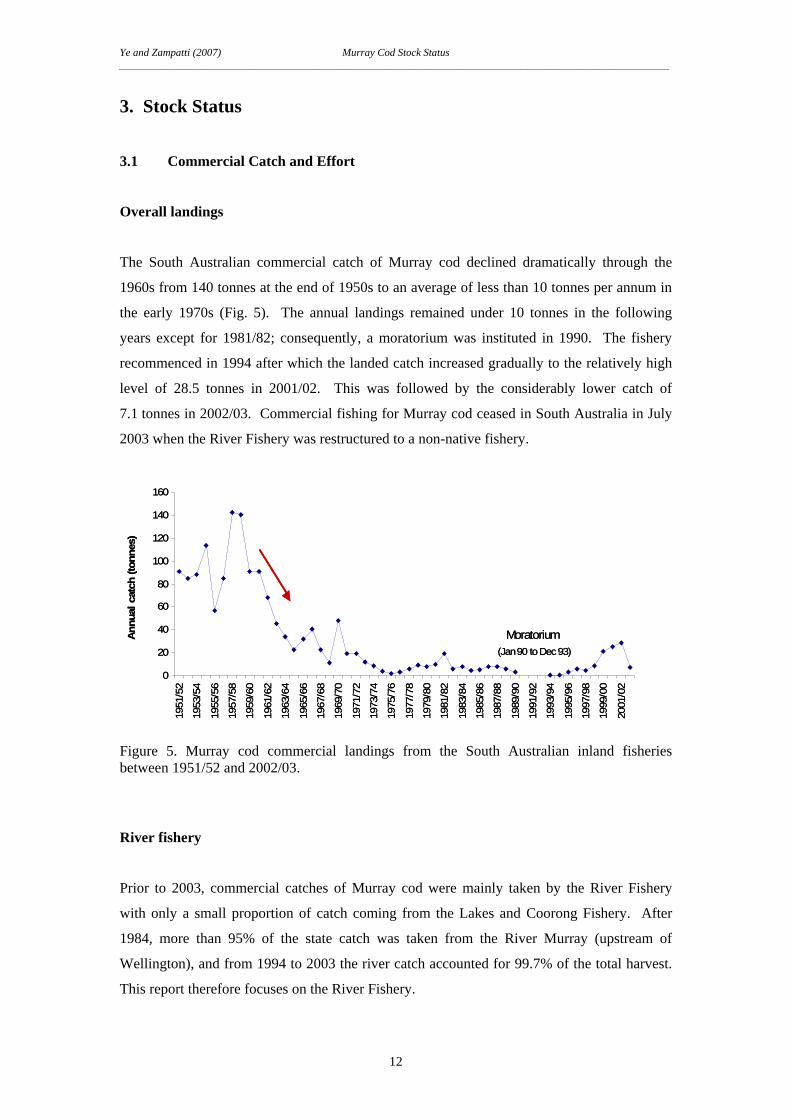
The South Australian commercial catch of Murray cod declined dramatically through the
1960s from 140 tonnes at the end of 1950s to an average of less than 10 tonnes per annum in
the early 1970s (Fig. 5). The annual landings remained under 10 tonnes in the following
years except for 1981/82; consequently, a moratorium was instituted in 1990. The fishery
recommenced in 1994 after which the landed catch increased gradually to the relatively high
level of 28.5 tonnes in 2001/02. This was followed by the considerably lower catch of
7.1 tonnes in 2002/03. Commercial fishing for Murray cod ceased in South Australia in July
2003 when the River Fishery was restructured to a non-native fishery.
Moratorium(Jan 90 to Dec 93)
0
20
40
60
80
100
120
140
160
1951
/52
1953
/54
1955
/56
1957
/58
1959
/60
1961
/62
1963
/64
1965
/66
1967
/68
1969
/70
1971
/72
1973
/74
1975
/76
1977
/78
1979
/80
1981
/82
1983
/84
1985
/86
1987
/88
1989
/90
1991
/92
1993
/94
1995
/96
1997
/98
1999
/00
2001
/02
Ann
ual c
atch
(ton
nes)
Figure 5. Murray cod commercial landings from the South Australian inland fisheries between 1951/52 and 2002/03.
River fishery
Prior to 2003, commercial catches of Murray cod were mainly taken by the River Fishery
with only a small proportion of catch coming from the Lakes and Coorong Fishery. After
1984, more than 95% of the state catch was taken from the River Murray (upstream of
Wellington), and from 1994 to 2003 the river catch accounted for 99.7% of the total harvest.
This report therefore focuses on the River Fishery.
Ye and Zampatti (2007) Murray Cod Stock Status _____________________________________________________________________________________________
13
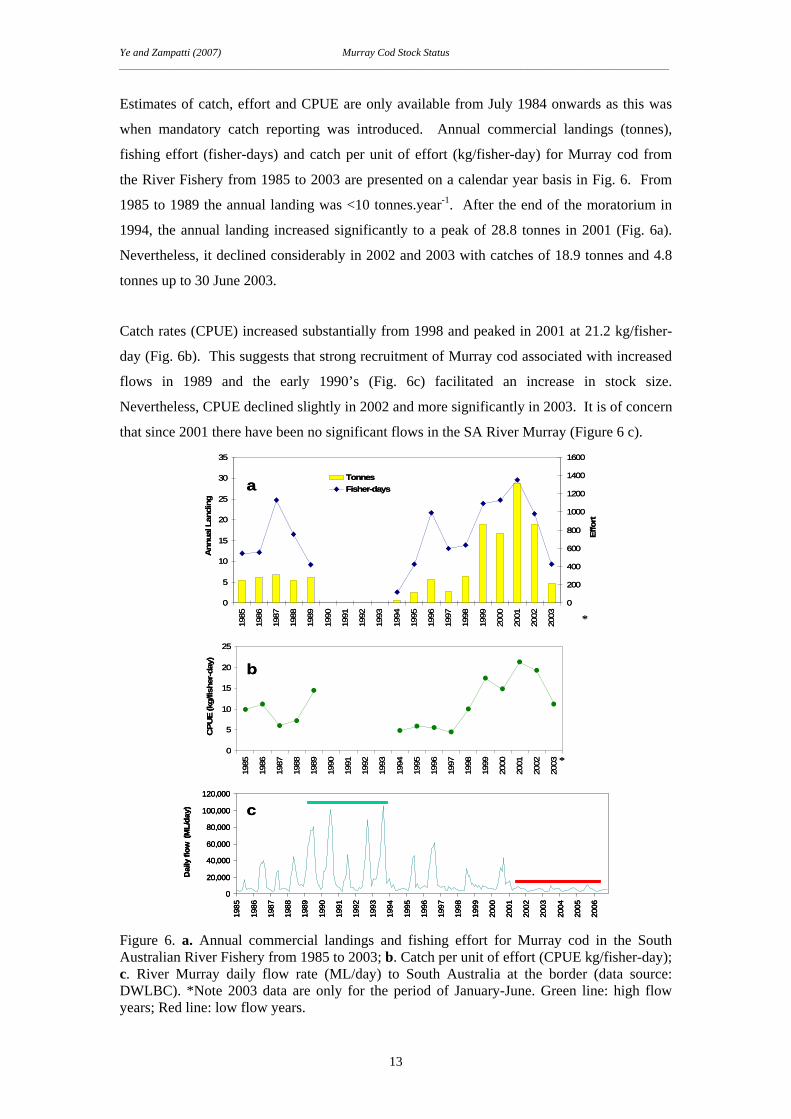
Estimates of catch, effort and CPUE are only available from July 1984 onwards as this was
when mandatory catch reporting was introduced. Annual commercial landings (tonnes),
fishing effort (fisher-days) and catch per unit of effort (kg/fisher-day) for Murray cod from
the River Fishery from 1985 to 2003 are presented on a calendar year basis in Fig. 6. From
1985 to 1989 the annual landing was <10 tonnes.year-1. After the end of the moratorium in
1994, the annual landing increased significantly to a peak of 28.8 tonnes in 2001 (Fig. 6a).
Nevertheless, it declined considerably in 2002 and 2003 with catches of 18.9 tonnes and 4.8
tonnes up to 30 June 2003.
Catch rates (CPUE) increased substantially from 1998 and peaked in 2001 at 21.2 kg/fisher-
day (Fig. 6b). This suggests that strong recruitment of Murray cod associated with increased
flows in 1989 and the early 1990’s (Fig. 6c) facilitated an increase in stock size.
Nevertheless, CPUE declined slightly in 2002 and more significantly in 2003. It is of concern
that since 2001 there have been no significant flows in the SA River Murray (Figure 6 c).
0
20,000
40,000
60,000
80,000
100,000
120,000
1985
1986
1987
1988
1989
1990
1991
1992
1993
1994
1995
1996
1997
1998
1999
2000
2001
2002
2003
2004
2005
2006
Dai
ly fl
ow (
ML/
day)
a
b
c
*
*
0
5
10
15
20
25
30
35
1985
1986
1987
1988
1989
1990
1991
1992
1993
1994
1995
1996
1997
1998
1999
2000
2001
2002
2003
Ann
ual L
andi
ng
0
200
400
600
800
1000
1200
1400
1600
Effo
rt
TonnesFisher-days
0
5
10
15
20
25
1985
1986
1987
1988
1989
1990
1991
1992
1993
1994
1995
1996
1997
1998
1999
2000
2001
2002
2003
CPU
E (k
g/fis
her-d
ay)
0
20,000
40,000
60,000
80,000
100,000
120,000
1985
1986
1987
1988
1989
1990
1991
1992
1993
1994
1995
1996
1997
1998
1999
2000
2001
2002
2003
2004
2005
2006
Dai
ly fl
ow (
ML/
day)
0
20,000
40,000
60,000
80,000
100,000
120,000
1985
1986
1987
1988
1989
1990
1991
1992
1993
1994
1995
1996
1997
1998
1999
2000
2001
2002
2003
2004
2005
2006
Dai
ly fl
ow (
ML/
day)
a
b
c
*
*
0
5
10
15
20
25
30
35
1985
1986
1987
1988
1989
1990
1991
1992
1993
1994
1995
1996
1997
1998
1999
2000
2001
2002
2003
Ann
ual L
andi
ng
0
200
400
600
800
1000
1200
1400
1600
Effo
rt
TonnesFisher-days
0
5
10
15
20
25
1985
1986
1987
1988
1989
1990
1991
1992
1993
1994
1995
1996
1997
1998
1999
2000
2001
2002
2003
CPU
E (k
g/fis
her-d
ay)
Figure 6. a. Annual commercial landings and fishing effort for Murray cod in the South Australian River Fishery from 1985 to 2003; b. Catch per unit of effort (CPUE kg/fisher-day); c. River Murray daily flow rate (ML/day) to South Australia at the border (data source: DWLBC). *Note 2003 data are only for the period of January-June. Green line: high flow years; Red line: low flow years.
Ye and Zampatti (2007) Murray Cod Stock Status _____________________________________________________________________________________________
14
River catch and effort by gear
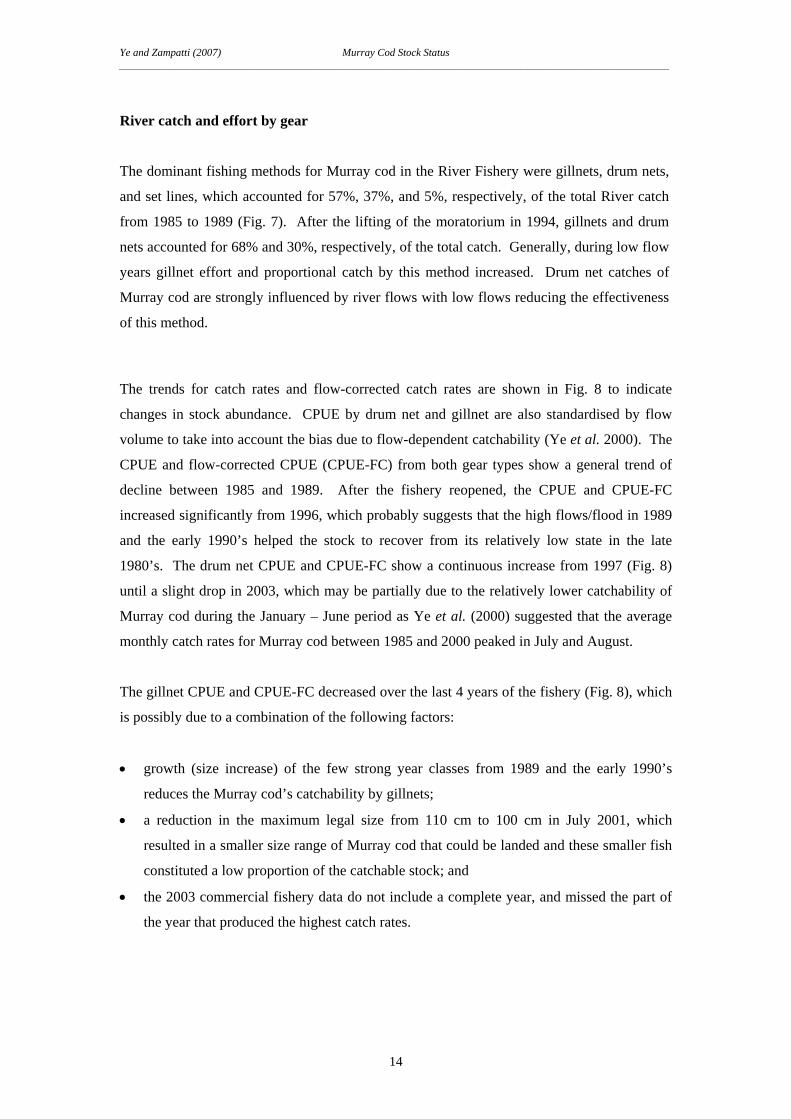
The dominant fishing methods for Murray cod in the River Fishery were gillnets, drum nets,
and set lines, which accounted for 57%, 37%, and 5%, respectively, of the total River catch
from 1985 to 1989 (Fig. 7). After the lifting of the moratorium in 1994, gillnets and drum
nets accounted for 68% and 30%, respectively, of the total catch. Generally, during low flow
years gillnet effort and proportional catch by this method increased. Drum net catches of
Murray cod are strongly influenced by river flows with low flows reducing the effectiveness
of this method.
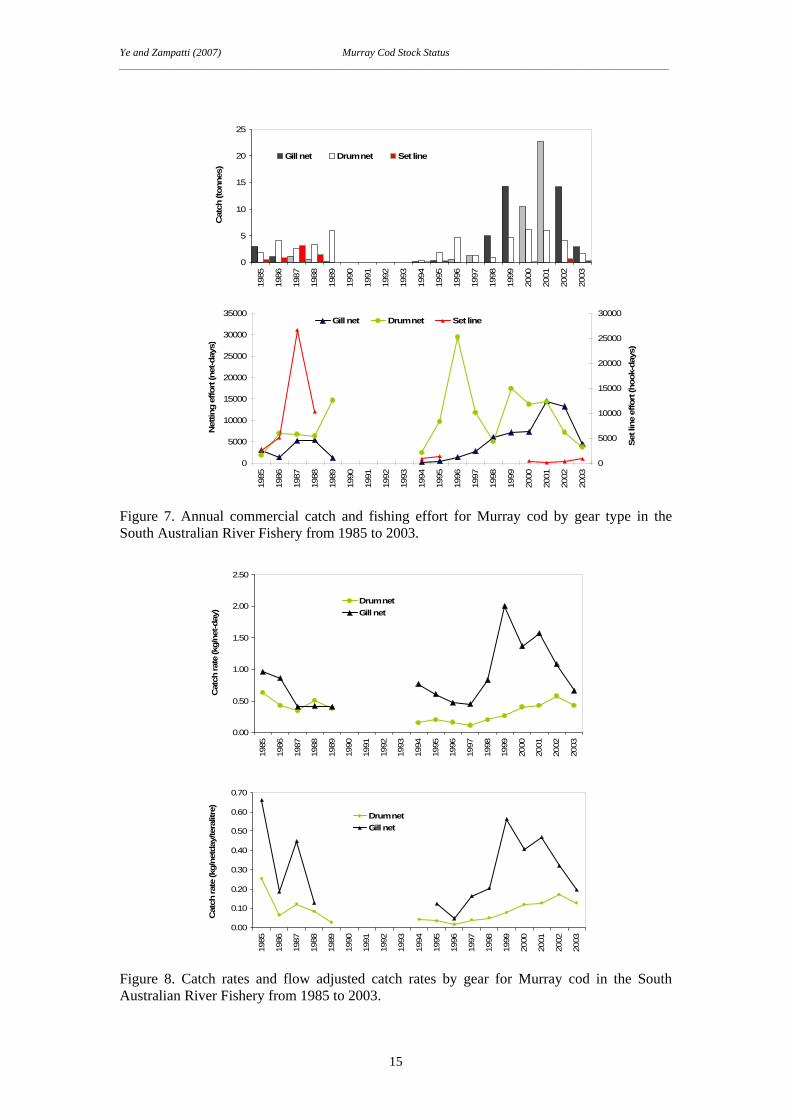
The trends for catch rates and flow-corrected catch rates are shown in Fig. 8 to indicate
changes in stock abundance. CPUE by drum net and gillnet are also standardised by flow
volume to take into account the bias due to flow-dependent catchability (Ye et al. 2000). The
CPUE and flow-corrected CPUE (CPUE-FC) from both gear types show a general trend of
decline between 1985 and 1989. After the fishery reopened, the CPUE and CPUE-FC
increased significantly from 1996, which probably suggests that the high flows/flood in 1989
and the early 1990’s helped the stock to recover from its relatively low state in the late
1980’s. The drum net CPUE and CPUE-FC show a continuous increase from 1997 (Fig. 8)
until a slight drop in 2003, which may be partially due to the relatively lower catchability of
Murray cod during the January – June period as Ye et al. (2000) suggested that the average
monthly catch rates for Murray cod between 1985 and 2000 peaked in July and August.
The gillnet CPUE and CPUE-FC decreased over the last 4 years of the fishery (Fig. 8), which
is possibly due to a combination of the following factors:
• growth (size increase) of the few strong year classes from 1989 and the early 1990’s
reduces the Murray cod’s catchability by gillnets;
• a reduction in the maximum legal size from 110 cm to 100 cm in July 2001, which
resulted in a smaller size range of Murray cod that could be landed and these smaller fish
constituted a low proportion of the catchable stock; and
• the 2003 commercial fishery data do not include a complete year, and missed the part of
the year that produced the highest catch rates.
Ye and Zampatti (2007) Murray Cod Stock Status _____________________________________________________________________________________________
15
0
5
10
15
20
25
1985
1986
1987
1988
1989
1990
1991
1992
1993
1994
1995
1996
1997
1998
1999
2000
2001
2002
2003
Cat
ch (t
onne
s)
Gill net Drum net Set line
0
5000
10000
15000
20000
25000
30000
35000
1985
1986
1987
1988
1989
1990
1991
1992
1993
1994
1995
1996
1997
1998
1999
2000
2001
2002
2003
Net
ting
effo
rt (n
et-d
ays )
0
5000
10000
15000
20000
25000
30000
Set l
ine
effo
rt (h
ook-
days
)
Gill net Drum net Set line
Figure 7. Annual commercial catch and fishing effort for Murray cod by gear type in the South Australian River Fishery from 1985 to 2003.
0.00
0.10
0.20
0.30
0.40
0.50
0.60
0.70
1985
1986
1987
1988
1989
1990
1991
1992
1993
1994
1995
1996
1997
1998
1999
2000
2001
2002
2003
Cat
ch ra
te (k
g/ne
tday
/tera
litre
)
Drum netGill net
0.00
0.50
1.00
1.50
2.00
2.50
1985
1986
1987
1988
1989
1990
1991
1992
1993
1994
1995
1996
1997
1998
1999
2000
2001
2002
2003
Cat
ch ra
te (k
g/ne
t-day
) Drum net
Gill net
Figure 8. Catch rates and flow adjusted catch rates by gear for Murray cod in the South Australian River Fishery from 1985 to 2003.
Ye and Zampatti (2007) Murray Cod Stock Status _____________________________________________________________________________________________
16
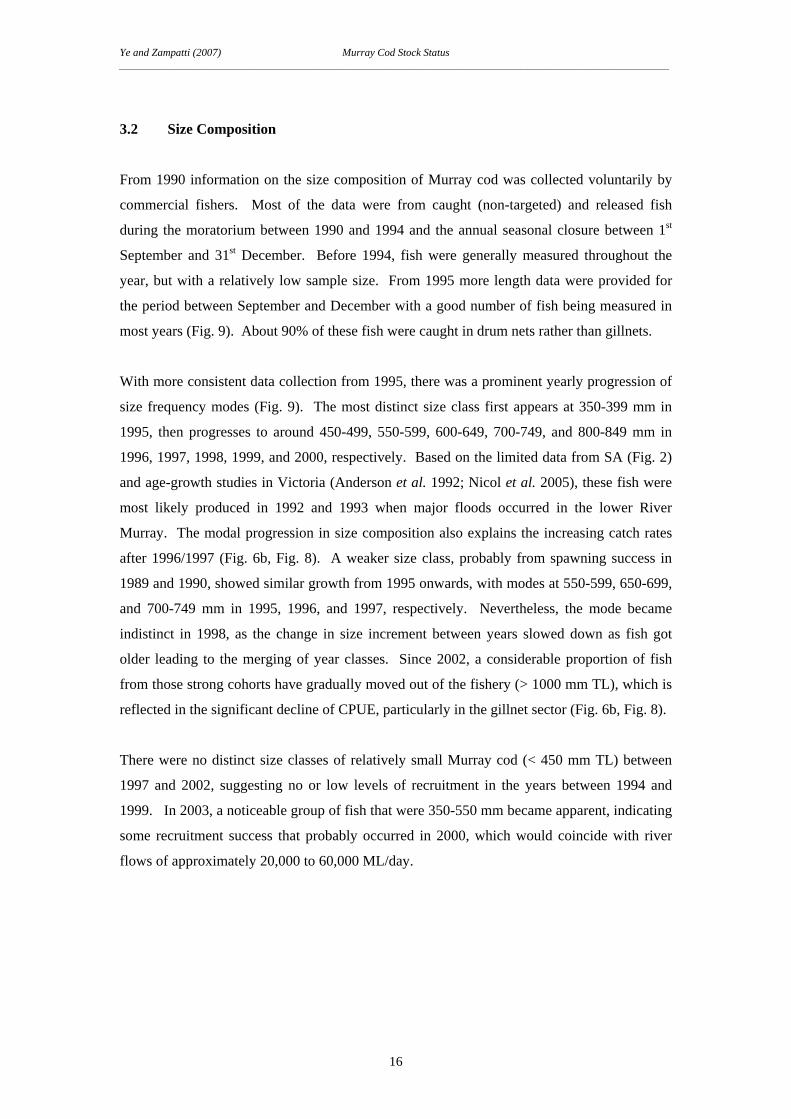
3.2 Size Composition
From 1990 information on the size composition of Murray cod was collected voluntarily by
commercial fishers. Most of the data were from caught (non-targeted) and released fish
during the moratorium between 1990 and 1994 and the annual seasonal closure between 1st
September and 31st December. Before 1994, fish were generally measured throughout the
year, but with a relatively low sample size. From 1995 more length data were provided for
the period between September and December with a good number of fish being measured in
most years (Fig. 9). About 90% of these fish were caught in drum nets rather than gillnets.
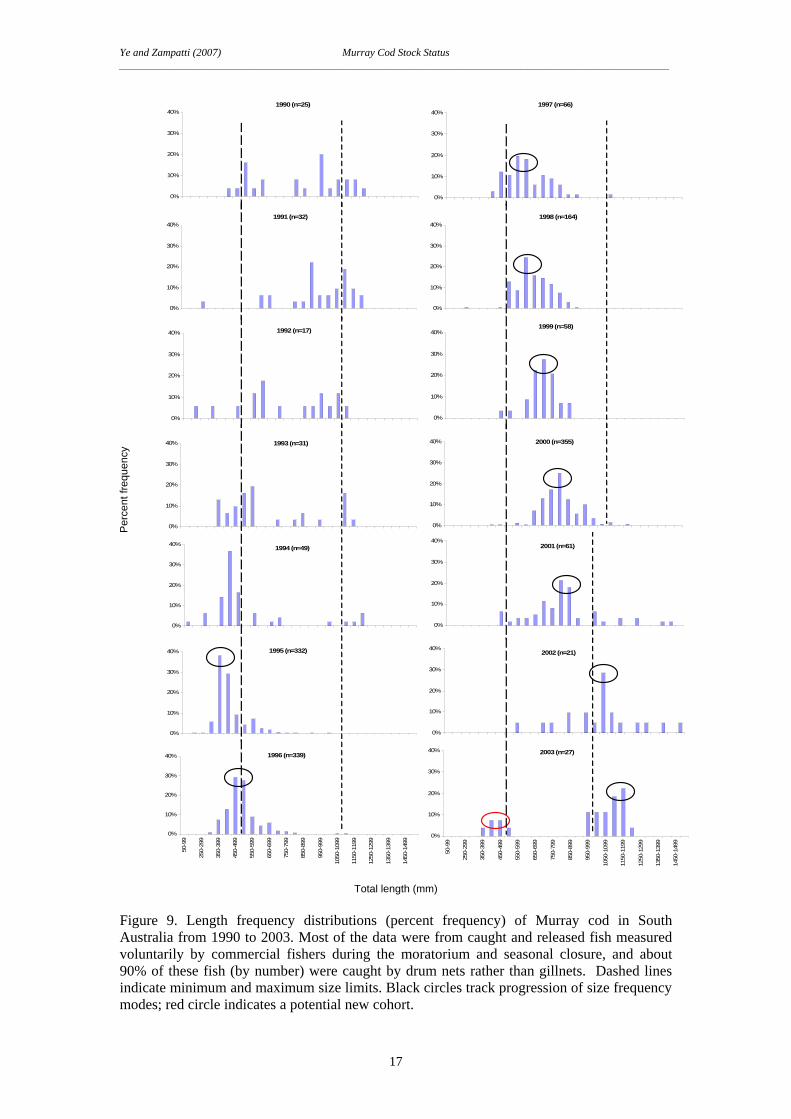
With more consistent data collection from 1995, there was a prominent yearly progression of
size frequency modes (Fig. 9). The most distinct size class first appears at 350-399 mm in
1995, then progresses to around 450-499, 550-599, 600-649, 700-749, and 800-849 mm in
1996, 1997, 1998, 1999, and 2000, respectively. Based on the limited data from SA (Fig. 2)
and age-growth studies in Victoria (Anderson et al. 1992; Nicol et al. 2005), these fish were
most likely produced in 1992 and 1993 when major floods occurred in the lower River
Murray. The modal progression in size composition also explains the increasing catch rates
after 1996/1997 (Fig. 6b, Fig. 8). A weaker size class, probably from spawning success in
1989 and 1990, showed similar growth from 1995 onwards, with modes at 550-599, 650-699,
and 700-749 mm in 1995, 1996, and 1997, respectively. Nevertheless, the mode became
indistinct in 1998, as the change in size increment between years slowed down as fish got
older leading to the merging of year classes. Since 2002, a considerable proportion of fish
from those strong cohorts have gradually moved out of the fishery (> 1000 mm TL), which is
reflected in the significant decline of CPUE, particularly in the gillnet sector (Fig. 6b, Fig. 8).
There were no distinct size classes of relatively small Murray cod (< 450 mm TL) between
1997 and 2002, suggesting no or low levels of recruitment in the years between 1994 and
1999. In 2003, a noticeable group of fish that were 350-550 mm became apparent, indicating
some recruitment success that probably occurred in 2000, which would coincide with river
flows of approximately 20,000 to 60,000 ML/day.
Ye and Zampatti (2007) Murray Cod Stock Status _____________________________________________________________________________________________
17
1990 (n=25)
0%
10%
20%
30%
40%
1991 (n=32)
0%
10%
20%
30%
40%
1992 (n=17)
0%
10%
20%
30%
40%
1993 (n=31)
0%
10%
20%
30%
40%
1997 (n=66)
0%
10%
20%
30%
40%
1998 (n=164)
0%
10%
20%
30%
40%
1999 (n=58)
0%
10%
20%
30%
40%
2000 (n=355)
0%
10%
20%
30%
40%
1995 (n=332)
0%
10%
20%
30%
40%
1996 (n=339)
0%
10%
20%
30%
40%
50-9
9
250-
299
350-
399
450-
499
550-
599
650-
699
750-
799
850-
899
950-
999
1050
-109
9
1150
-119
9
1250
-129
9
1350
-139
9
1450
-149
9
1994 (n=49)
0%
10%
20%
30%
40% 2001 (n=61)
0%
10%
20%
30%
40%
2002 (n=21)
0%
10%
20%
30%
40%
2003 (n=27)
0%
10%
20%
30%
40%
50-9
9
250-
299
350-
399
450-
499
550-
599
650-
699
750-
799
850-
899
950-
999
1050
-109
9
1150
-119
9
1250
-129
9
1350
-139
9
1450
-149
9
Total length (mm)
Figure 9. Length frequency distributions (percent frequency) of Murray cod in South Australia from 1990 to 2003. Most of the data were from caught and released fish measured voluntarily by commercial fishers during the moratorium and seasonal closure, and about 90% of these fish (by number) were caught by drum nets rather than gillnets. Dashed lines indicate minimum and maximum size limits. Black circles track progression of size frequency modes; red circle indicates a potential new cohort.
Per
cent
freq
uenc
y
Ye and Zampatti (2007) Murray Cod Stock Status _____________________________________________________________________________________________
18
3.3 Recreational and Indigenous Fishing Survey
The National Recreational and Indigenous Fishing Survey, conducted between May 2000 and
April 2001, suggested that the recreational harvest of Murray cod from South Australian
inland waters was 22.8 tonnes (Table 2) (Henry and Lyle 2003). All harvest of Murray cod
came from the River Murray system (Jones and Doonan 2005), and the level is similar to
commercial harvest (25.5 tonnes) in the same year. The survey also indicated that an
additional 16.4% of the recreational catch of Murray cod from the River Murray was released
(Table 2). Nevertheless, the estimates are based on minimal records, and the standard error is
very high relative to the harvest level.
During the 2000/01 survey, there were a total of 20 fishing events reporting the harvest or
release of Murray cod in SA, and a total of 9 households fished in these events. Of the 9
households, 3 were from interstate (Victory, Tasmania and Western Australia), and the
remaining 6 were SA households.
Table 2. Estimates of the recreational harvest (+/- standard error) and release of Murray cod in 2000/01 from the South Australian River Murray and total inland waters (Jones and Doonan 2005).
Region Harvest
(nos.)
SE
+/-
Average
weight (kg)
Harvested
Biomass (kg)
Released
(nos.)
%
Released
SA 2,278 1,362 10.0 22,780 1,088 32.3
River Murray
System
2,278 1,362 10.0 22,780 448 16.4
3.4 Native Fish Monitoring
Sampling by drum nets and gillnets
Previous stock assessments for native fish species such as Murray cod and golden perch in SA
were mainly dependent on readily available commercial fishery data. Since the restructuring
of River Fishery in July 2003, commercial fishery data are no longer available to inform
research. In January 2005, PIRSA Fisheries and SARDI Aquatic Sciences implemented a
long-term fishery independent monitoring program. The aim of this sampling program is to
collect biological information for key native fish species (Murray cod and golden perch) and
to measure biological performance indicators for stock assessment. The sampling program is
Ye and Zampatti (2007) Murray Cod Stock Status _____________________________________________________________________________________________
19
undertaken with the assistance of two former River Fishery licence holders. The data
presented in this report were collected from January 2005 to April 2006.
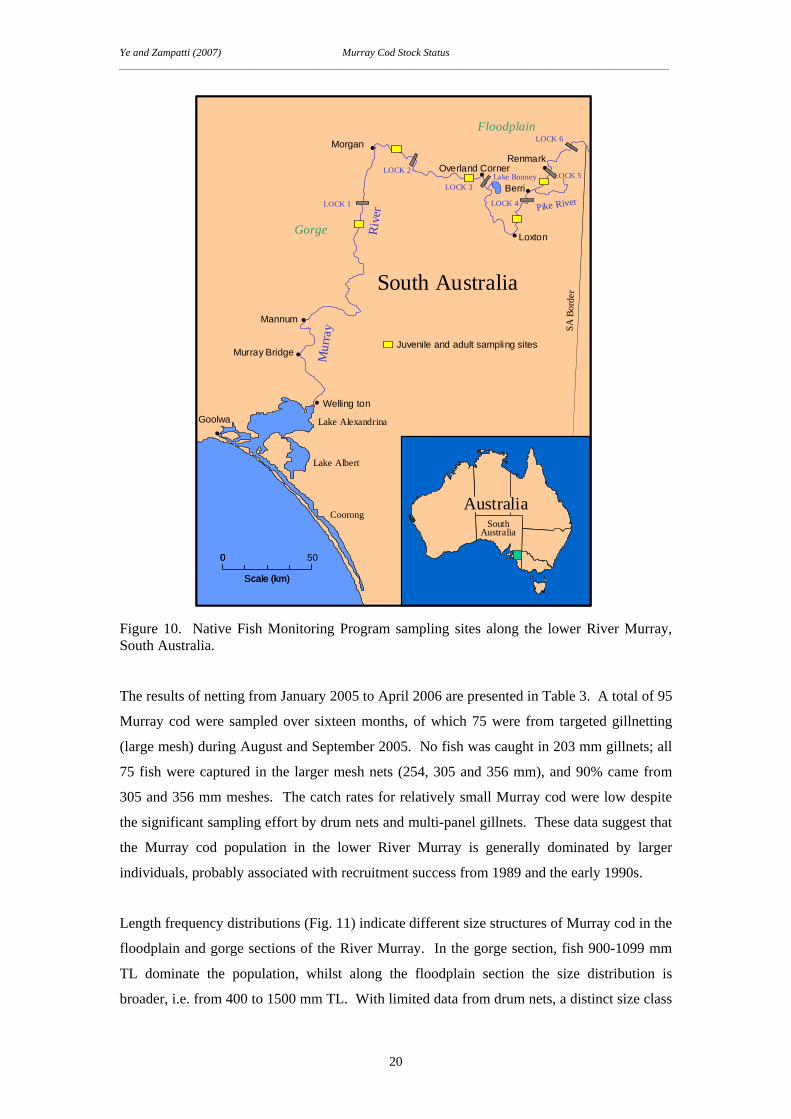
Following initial support and training from SARDI, monthly sampling has been carried out by
commercial fishers at six sites along the lower River Murray below Locks 1-6 (Fig. 10).
Three of the sites were within the gorge section (above Wellington and below Overland
Corner) and three in the floodplain section (between the SA/NSW border and Overland
Corner). A standard set of sampling gear (provided by SARDI) was used at each site, with
nets set and checked over three consecutive nights. The set of gear included:
• 10 small-mesh drum nets (January 2005 to April 2006);
• 4 multi-panel gillnets (45 x 2 m, 38, 51, 70, 114, 152 mm meshes) (January to April
2005)
Additional methods were used to specifically target Murray cod including
• 5 large funnel/mesh drum nets (August 2005 to April 2006)
• 4 large mesh gillnets (50 x 2 m) with various mesh sizes i.e. 203, 254, 305 and 356 mm
(August and September 2005)
All fish captured from each net were identified to species, counted, and total lengths
measured for all Murray cod and golden perch and a sub-sample of 20 individuals per species
for other species for each gear type. A research log was provided by SARDI to record all
relevant information.
Ye and Zampatti (2007) Murray Cod Stock Status _____________________________________________________________________________________________
20
500
Scale (km)
Lake Alexandrina
Lake Albert
Coorong
•
•
•
•
•
••
Renmark
Berri
Loxton
Morgan
Mannum
Murray Bridge
Goolwa
AustraliaSouth
Australia
Mur
ray
Riv
er
South Australia
Floodplain
Gorge
LOCK 1
LOCK 2
LOCK 3
LOCK 4
LOCK 5
LOCK 6
Juvenile and adult sampling sites
Pike River
Lake Bonney
Welling ton•
Overland Corner•
SA B
o rde
r500
Scale (km)
Lake Alexandrina
Lake Albert
Coorong
•
•
•
•
•
••
Renmark
Berri
Loxton
Morgan
Mannum
Murray Bridge
Goolwa
AustraliaSouth
Australia
Mur
ray
Riv
er
South Australia
Floodplain
Gorge
LOCK 1
LOCK 2
LOCK 3
LOCK 4
LOCK 5
LOCK 6
Juvenile and adult sampling sites
Pike River
Lake Bonney
Welling ton•
Overland Corner•
500
Scale (km)
0
Scale (km)
Lake Alexandrina
Lake Albert
Coorong
•
•
•
•
•
••
Renmark
Berri
Loxton
Morgan
Mannum
Murray Bridge
Goolwa
AustraliaSouth
Australia
Mur
ray
Riv
er
South Australia
Floodplain
Gorge
LOCK 1
LOCK 2
LOCK 3
LOCK 4
LOCK 5
LOCK 6
Juvenile and adult sampling sites
Pike River
Lake Bonney
Welling ton•
Overland Corner•
SA B
o rde
r
Figure 10. Native Fish Monitoring Program sampling sites along the lower River Murray, South Australia. The results of netting from January 2005 to April 2006 are presented in Table 3. A total of 95
Murray cod were sampled over sixteen months, of which 75 were from targeted gillnetting
(large mesh) during August and September 2005. No fish was caught in 203 mm gillnets; all
75 fish were captured in the larger mesh nets (254, 305 and 356 mm), and 90% came from
305 and 356 mm meshes. The catch rates for relatively small Murray cod were low despite
the significant sampling effort by drum nets and multi-panel gillnets. These data suggest that
the Murray cod population in the lower River Murray is generally dominated by larger
individuals, probably associated with recruitment success from 1989 and the early 1990s.
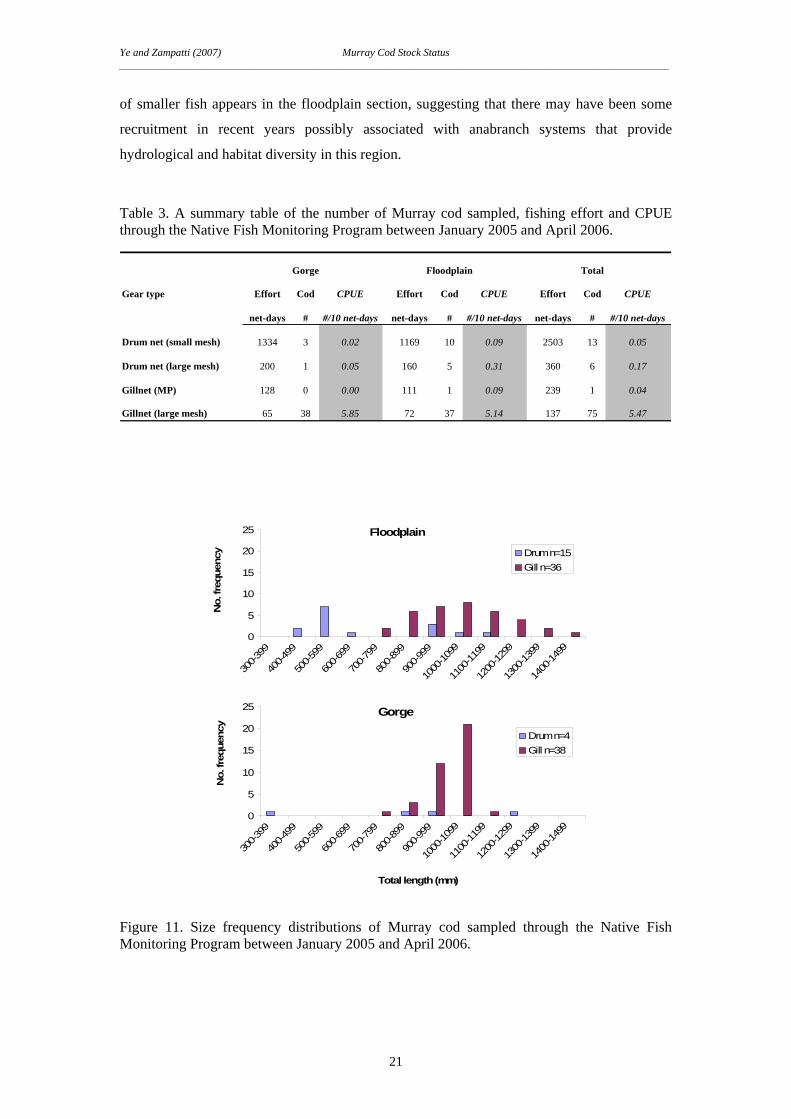
Length frequency distributions (Fig. 11) indicate different size structures of Murray cod in the
floodplain and gorge sections of the River Murray. In the gorge section, fish 900-1099 mm
TL dominate the population, whilst along the floodplain section the size distribution is
broader, i.e. from 400 to 1500 mm TL. With limited data from drum nets, a distinct size class
Ye and Zampatti (2007) Murray Cod Stock Status _____________________________________________________________________________________________
21
of smaller fish appears in the floodplain section, suggesting that there may have been some
recruitment in recent years possibly associated with anabranch systems that provide
hydrological and habitat diversity in this region.
Table 3. A summary table of the number of Murray cod sampled, fishing effort and CPUE through the Native Fish Monitoring Program between January 2005 and April 2006.
Gorge Floodplain Total
Gear type Effort Cod CPUE Effort Cod CPUE Effort Cod CPUE
net-days # #/10 net-days net-days # #/10 net-days net-days # #/10 net-days
Drum net (small mesh) 1334 3 0.02 1169 10 0.09 2503 13 0.05
Drum net (large mesh) 200 1 0.05 160 5 0.31 360 6 0.17
Gillnet (MP) 128 0 0.00 111 1 0.09 239 1 0.04
Gillnet (large mesh) 65 38 5.85 72 37 5.14 137 75 5.47
Floodplain
0
5
10
15
20
25
300-3
99
400-4
99
500-5
99
600-6
99
700-7
99
800-8
99
900-9
99
1000
-1099
1100
-1199
1200
-1299
1300
-1399
1400
-1499
No.
freq
uenc
y
Drum n=15Gill n=36
Gorge
0
5
10
15
20
25
300-3
99
400-4
99
500-5
99
600-6
99
700-7
99
800-8
99
900-9
99
1000
-1099
1100
-1199
1200
-1299
1300
-1399
1400
-1499
Total length (mm)
No.
freq
uenc
y
Drum n=4Gill n=38
Figure 11. Size frequency distributions of Murray cod sampled through the Native Fish Monitoring Program between January 2005 and April 2006.
Ye and Zampatti (2007) Murray Cod Stock Status _____________________________________________________________________________________________
22
Boat electrofishing
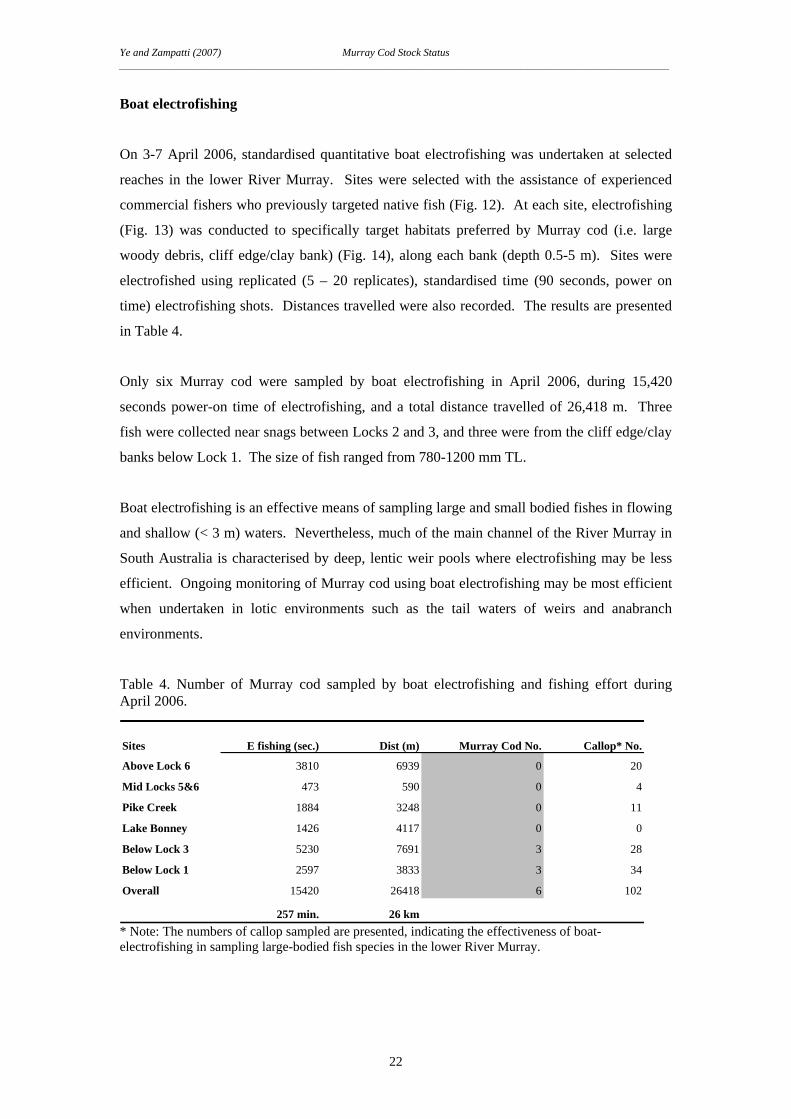
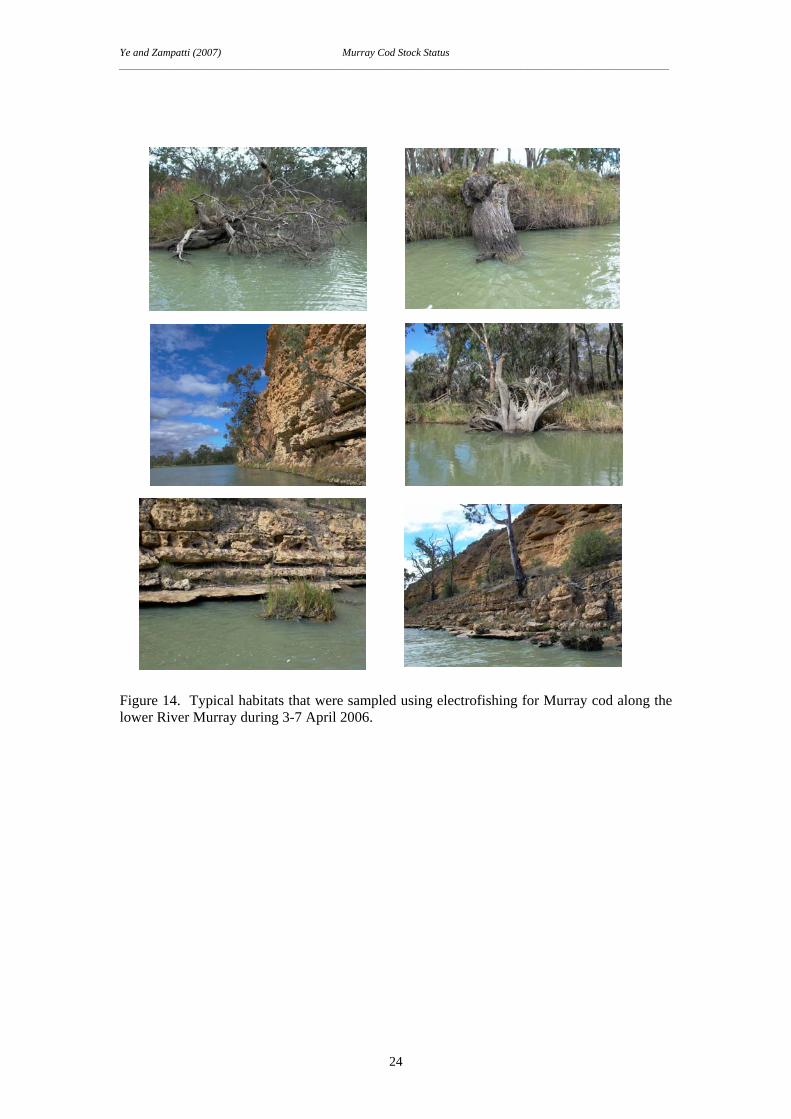
On 3-7 April 2006, standardised quantitative boat electrofishing was undertaken at selected
reaches in the lower River Murray. Sites were selected with the assistance of experienced
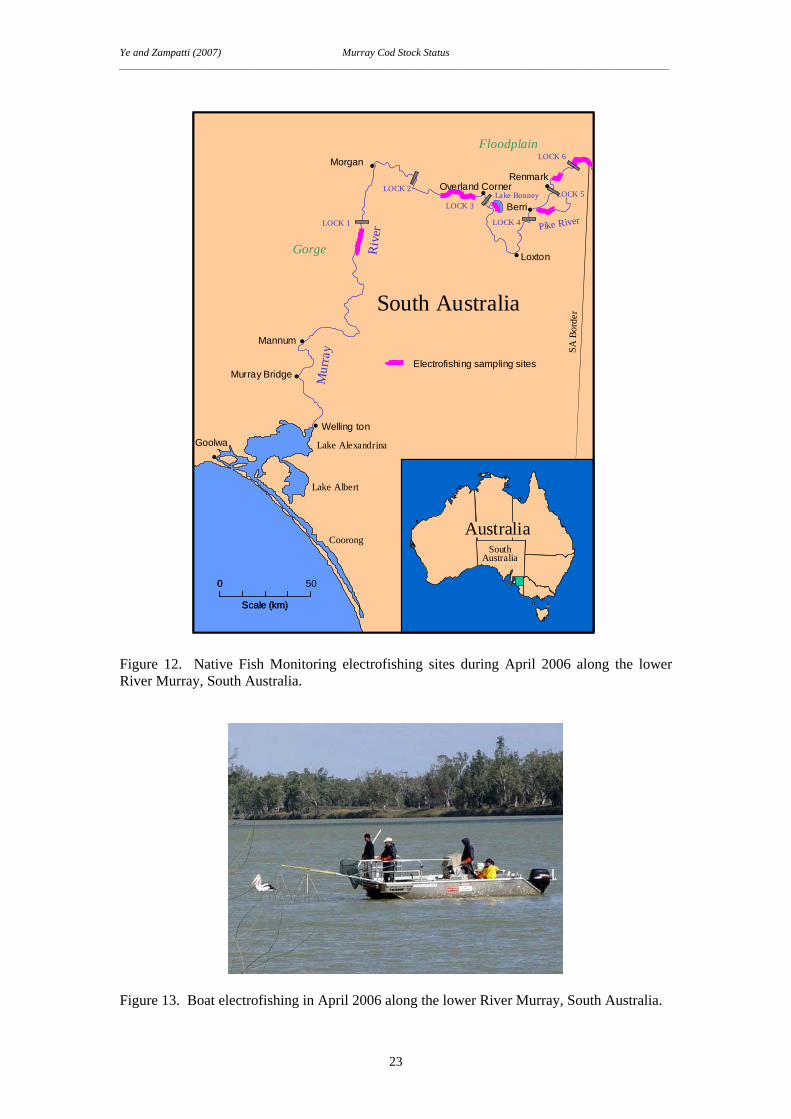
commercial fishers who previously targeted native fish (Fig. 12). At each site, electrofishing
(Fig. 13) was conducted to specifically target habitats preferred by Murray cod (i.e. large
woody debris, cliff edge/clay bank) (Fig. 14), along each bank (depth 0.5-5 m). Sites were
electrofished using replicated (5 – 20 replicates), standardised time (90 seconds, power on
time) electrofishing shots. Distances travelled were also recorded. The results are presented
in Table 4.
Only six Murray cod were sampled by boat electrofishing in April 2006, during 15,420
seconds power-on time of electrofishing, and a total distance travelled of 26,418 m. Three
fish were collected near snags between Locks 2 and 3, and three were from the cliff edge/clay
banks below Lock 1. The size of fish ranged from 780-1200 mm TL.
Boat electrofishing is an effective means of sampling large and small bodied fishes in flowing
and shallow (< 3 m) waters. Nevertheless, much of the main channel of the River Murray in
South Australia is characterised by deep, lentic weir pools where electrofishing may be less
efficient. Ongoing monitoring of Murray cod using boat electrofishing may be most efficient
when undertaken in lotic environments such as the tail waters of weirs and anabranch
environments.
Table 4. Number of Murray cod sampled by boat electrofishing and fishing effort during April 2006.
Sites E fishing (sec.) Dist (m) Murray Cod No. Callop* No.
Above Lock 6 3810 6939 0 20
Mid Locks 5&6 473 590 0 4
Pike Creek 1884 3248 0 11
Lake Bonney 1426 4117 0 0
Below Lock 3 5230 7691 3 28
Below Lock 1 2597 3833 3 34
Overall 15420 26418 6 102
257 min. 26 km * Note: The numbers of callop sampled are presented, indicating the effectiveness of boat-electrofishing in sampling large-bodied fish species in the lower River Murray.
Ye and Zampatti (2007) Murray Cod Stock Status _____________________________________________________________________________________________
23
500
Scale (km)
Lake Alexandrina
Lake Albert
Coorong
•
•
•
•
•
••
Renmark
Berri
Loxton
Morgan
Mannum
Murray Bridge
Goolwa
AustraliaSouth
Australia
Mur
ray
Riv
er
South Australia
Floodplain
Gorge
LOCK 1
LOCK 2
LOCK 3
LOCK 4
LOCK 5
LOCK 6
Pike River
Lake Bonney
Welling ton•
Overland Corner•
Electrofishing sampling sites
SA B
orde
r500
Scale (km)
Lake Alexandrina
Lake Albert
Coorong
•
•
•
•
•
••
Renmark
Berri
Loxton
Morgan
Mannum
Murray Bridge
Goolwa
AustraliaSouth
Australia
Mur
ray
Riv
er
South Australia
Floodplain
Gorge
LOCK 1
LOCK 2
LOCK 3
LOCK 4
LOCK 5
LOCK 6
Pike River
Lake Bonney
Welling ton•
Overland Corner•
Electrofishing sampling sites
500
Scale (km)
0
Scale (km)
Lake Alexandrina
Lake Albert
Coorong
•
•
•
•
•
••
Renmark
Berri
Loxton
Morgan
Mannum
Murray Bridge
Goolwa
AustraliaSouth
Australia
Mur
ray
Riv
er
South Australia
Floodplain
Gorge
LOCK 1
LOCK 2
LOCK 3
LOCK 4
LOCK 5
LOCK 6
Pike River
Lake Bonney
Welling ton•
Overland Corner•
Electrofishing sampling sites
SA B
orde
r
Figure 12. Native Fish Monitoring electrofishing sites during April 2006 along the lower River Murray, South Australia.
Figure 13. Boat electrofishing in April 2006 along the lower River Murray, South Australia.
Ye and Zampatti (2007) Murray Cod Stock Status _____________________________________________________________________________________________
24
Figure 14. Typical habitats that were sampled using electrofishing for Murray cod along the lower River Murray during 3-7 April 2006.
Ye and Zampatti (2007) Murray Cod Stock Status _____________________________________________________________________________________________
25
3.5 Other research
Two Murray-Darling Basin Commission (MDBC) funded projects are collecting long-term
data on fish assemblages in the South Australian catchment of the lower River Murray,
including distribution, spawning and length-frequency data for Murray cod. The ‘Sea to
Hume Dam’ fish passage project has facilitated the collection of six years of data (2001-2007)
on fish assemblages downstream of Locks 1-3 and considerable data on fish assemblages in
the vicinity of Locks 7-9 (New South Wales immediately upstream of the South Australian
border). In addition, the Chowilla Fish Ecology project has investigated the spatial and
temporal distribution of fish assemblages, and the spawning and recruitment of Murray cod in
the Chowilla Anabranch system and adjacent River Murray.
To determine spatial and temporal variation in fish assemblages both projects use
standardised quantitative boat electrofishing which means that data are comparable between
the projects. Sites are electrofished using replicated (12 – 16 replicates), standardised time
(90 – 120 seconds, power-on time) electrofishing shots.
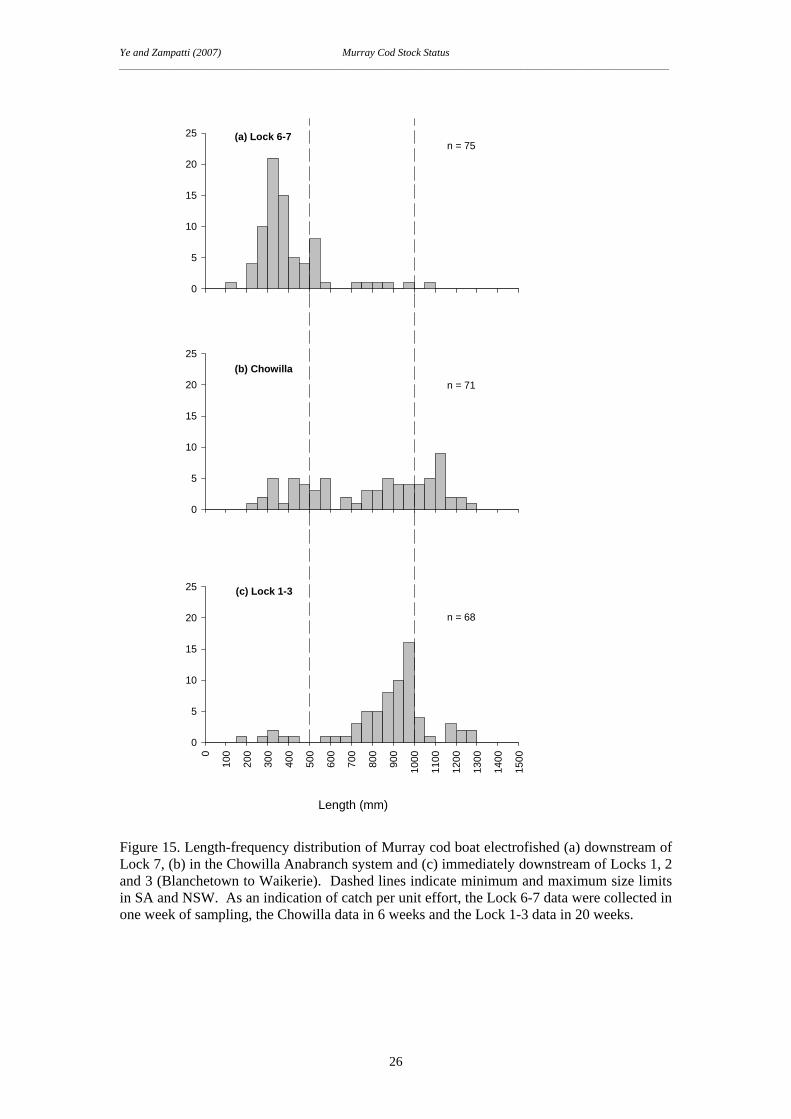
Length-frequency data based on sampling undertaken to March 2006 indicate three scenarios
in the lower River Murray (Fig. 15). In the River Murray downstream of Lock 7 there
appears to be considerable recent recruitment or stocking of juvenile fish. The length
frequency distribution for fish collected in this region is also truncated, potentially as a result
of high angling pressure. In the Chowilla Anabranch system there appears to have been some
recruitment in recent years although there are no particularly strong cohorts. In the River
Murray in the vicinity of Locks 1-3 (Blanchetown to Waikerie) there appears to have been
minimal recruitment with the majority of fish collected being greater than 700 mm.
These preliminary data indicate that hydrologically diverse anabranch systems may maintain
some level of Murray cod recruitment during periods of sustained low flows and hence low
hydrological variability in the main channel of the River Murray. Consequently these
anabranch systems may be an important source of low numbers of recruits to the River
Murray during years of limited recruitment in the main stem of the River. Other significant
anabranch systems for Murray cod recruitment in the lower River Murray include the Lindsay
Mullaroo system (Meredith et al. 2002) and potentially the Pike Mundic (bypasses Lock 5)
and the Katarapko Creek systems (bypasses Lock 4).
Ye and Zampatti (2007) Murray Cod Stock Status _____________________________________________________________________________________________
26
Figure 15. Length-frequency distribution of Murray cod boat electrofished (a) downstream of Lock 7, (b) in the Chowilla Anabranch system and (c) immediately downstream of Locks 1, 2 and 3 (Blanchetown to Waikerie). Dashed lines indicate minimum and maximum size limits in SA and NSW. As an indication of catch per unit effort, the Lock 6-7 data were collected in one week of sampling, the Chowilla data in 6 weeks and the Lock 1-3 data in 20 weeks.
0
5
10
15
20
25
Length (mm)
0
100
200
300
400
500
600
700
800
900
1000
1100
1200
1300
1400
1500
0
5
10
15
20
25
0
5
10
15
20
25
(b) Chowilla
(c) Lock 1-3
(a) Lock 6-7n = 75
n = 71
n = 68
Ye and Zampatti (2007) Murray Cod Stock Status _____________________________________________________________________________________________
27
4. General Discussion CPUE from the previous commercial fishery and the fishery independent sampling program
(NFM) have been used to indicate the stock abundance of Murray cod. In the last two years
of the River Fishery (2002 and 2003) there was a decline in the overall CPUE (kg/fisher-day).
Both CPUE (kg/net-day) and CPUE-FC (kg/net-day/teralitre) from the gillnet sector
decreased over the last 4 years of the fishery, and that from the drum net sector decreased in
the last year. These data suggest a decline of the fishable stock of Murray cod (legal size 500-
1000 mm TL), most probably due to the growth of the few strong year classes from 1998 and
the early 1990’s. More recent fishery independent sampling (NFM) produced low catch rates
of Murray cod from drum nets, multi-panel gillnets and electrofishing, despite considerable
fishing effort from January 2005 to April 2006. Nevertheless, there was a reasonable CPUE
when gillnets with larger meshes (305 and 356 mm) were used to target Murray cod. This
further suggests that larger individuals dominate the lower Murray population.
As an indirect indicator of recruitment strength, the temporal changes in the size composition
of the Murray cod measured and released by commercial fishers during the moratorium and
closed seasons between 1990 and 2003 were examined. A distinct size class could be tracked
over time, showing a prominent yearly progression of size frequency modes from 1995 to
2000. This size class is most likely linked to recruitment success during the high flows/flood
years in the early 1990s. Since 1994, there is little indication of strong recruitment of Murray
cod in the SA lower River Murray. The appearance of a group of 350-550 mm fish in 2003
indicates there may have been some low level recruitment in 2000 associated with river flows
of approximately 20,000 to 60,000 ML/day, nevertheless the sample size was small (n=27).
Spatial differences in size composition of Murray cod between the gorge and floodplain
sections of the River Murray, based on limited data from the NFM, further suggest that low
level recruitment in recent years may have occurred along the floodplain section of the River
Murray. There are major anabranch systems along this geo-morphic zone, providing habitat
and hydrological diversity in contrast to the river channel. Preliminary data from the MDBC
funded Chowilla Fish Ecology Project also support the notion that significant anabranch
systems such as Chowilla may be an important source of Murray cod recruits to the River
Murray during low flow years when there is low hydrological variability and limited
recruitment in the main stem of the River.
Ye and Zampatti (2007) Murray Cod Stock Status _____________________________________________________________________________________________
28
River flow is considered a potential environmental performance indicator of Murray cod
stock status. It is of most concern that there have been protracted years without significant
high flows, and critical drought conditions have persisted for more than six years in the
Murray-Darling Basin. The SA historical commercial fishery data (Ye et al. 2000) and
previous NSW studies (Rowland 1998) suggest a strong link between river flows and Murray
cod recruitment. Under current conditions, there is a high risk that the stock may decline
further unless strong year classes can be added.
Ensuring an adequate spawning biomass to maximise recruitment success from years when
environmental conditions are favourable is an important strategy for the management of the
Murray cod fishery. Given the estimate of significant catch from the recreational fishery, and
lack of strong years classes of new recruits over protracted drought years, a precautionary
approach to the management of Murray cod should be adopted. Conservation management
measures may include:
• changing size limits (a minimum size of 600 mm will ensure greater confidence that
fish reach reproductive maturity before being removed from the stock. Nevertheless,
this measure may be ineffective unless new strong year classes are added to the stock);
• extended seasonal closures (e.g. August to December) to protect Murray cod before and
during the spawning season;
• spatial closures to protect reaches/areas which may be significant spawning sites;
• a moratorium on the take of Murray cod.
Ye and Zampatti (2007) Murray Cod Stock Status _____________________________________________________________________________________________
29
5. Future Research and Monitoring Needs
• In the absence of commercial fishery data, an effective monitoring program is needed to
measure stock status and recruitment success;
• Assessment of the catch and potential impact of the recreational fishery on the stock is
essential;
• Basic biological and ecological information is required for Murray cod populations in
SA;
• Other research projects (eg Murray Fishway Program and Chowilla Fish Ecology
project) contribute invaluable data to the stock assessment of Murray cod in SA.
Nevertheless, this is currently an unfunded component of these projects.
Ye and Zampatti (2007) Murray Cod Stock Status _____________________________________________________________________________________________
30
6. References
Anderson JR, Morison AK, Ray DJ (1992) Age and growth of Murray cod, Maccullochella
peelii (Mitchell) (Perciformes: Percichthyidae), in the lower Murray-Darling basin,
Australia, from thin-sectioned otoliths. Australian Journal of Marine and Freshwater
Research 43, 983-1013.
Cadawallader PL (1977) 'J. O. Langtry's 1949-50 Murray River investigations.' No. 13.
Fisheries and Wildlife Paper Victoria. pp. 70.
Gooley GJ (1992) Validation of the use of otoliths to determine the age and growth of Murray
cod, Maccullochella peelii (Mitchell) (Percichthyidae), in Lake Charlegrark, Western
Victoria. Australian Journal of Marine and Freshwater Research 43, 1091-102.
Gooley GJ, Anderson TA, Appleford P (1995) Aspects of the reproductive cycle and gonadal
development of Murray cod, Maccullochella peelii peelii (Michell) (Percichthyidae),
in Lake Charlegrark and adjacent farm ponds, Victoria, Australia. Marine and
Freshwater Research 46, 723-8.
Harris JH, Rowland SJ (1996) Australian freshwater cods and basses. In ‘Freshwater Fishes
of South-eastern Australia’. (Ed. RM McDowall) pp. 150-163. Reed Books, NSW pp.
247.
Henry, G.W. and Lyle, J.M., (2003) The National Recreational and Indigenous Fishing
Survey. Final Report to the Fisheries Research & Development Corporation and the
Fisheries Action Program. Project No. 1999/158. NSW Fisheries Final Report Series
No. 48. ISSN 1440-3544. 188pp.
Humphries P (2005) Spawning time and early life history of the Murray cod, Maccullochella
peelii peelii (Mitchell) in an Australian river. Environmental Biology of Fishes 72,
393-407.
Humphries P, Serafini LG, King AJ (2002) River regulation and fish larvae: variation through
space and time. Freshwater Biology 47, 1307-1331.
Ye and Zampatti (2007) Murray Cod Stock Status _____________________________________________________________________________________________
31
Jones K, Doonan A (2005) 2000-1 National Recreational and Indigenous Fishing Survey
South Australian Regional Information. South Australian Fisheries Management
Series Paper No. 46. ISBN 0 7590 1362 4. 99pp. (PIRSA: Adelaide)
Koehn JD, Harrington DJ (2006) Environmental conditions and timing for the spawning of
Murray cod (Maccullochella peelii peelii) and the endangered trout cod (M.
macquariensis) in Southeastern Australian Rivers. River Research and Applications
22, 327-343.
Lake JS (1967) Freshwater fish of the Murray-Darling River system. In ‘Australian Inland
Waters and Their Fauna’. (Ed. AH Weatherley) pp. 192-213. (Australian National
University Press: Canberra)
Lake JS (1971) ‘Freshwater fishes and rivers of Australia’. (Thomas Nelson: Sydney)
Meredith S, Gawne B, Sharpe C, Whiterod N, Conallin A, Zukowski S (2002) ‘Dryland
floodplain ecosystems: influence of flow pattern on fish production’. Technical
Report 1/2002. (Murray-Darling Freshwater Research Centre, Lower Basin
Laboratory: Mildura)
Nicol S, Todd C, Koehn J, Lieschke J (2005) How can recreational angling regulations help
meet the multiple objectives of Murray cod populations. In ‘Management of Murray
Cod in the Murray-Darling Basin: Statement, Recommendations and Supporting
Papers. Proceedings of a workshop held in Canberra, ACT, 3-4 June 2004’. (Ed.
Lintermans M, Phillips B). pp. 98-106. (Murray-Darling Basin Commission and
Cooperative Research Centre for Freshwater Ecology: Canberra).
Rowland SJ (1983) Spawning of the Australian freshwater fish Murray cod, Maccullochella
peeli (Mitchell), in earthen ponds. Journal of Fish Biology 23,525-34.
Rowland SJ (1985) ‘Aspects of the biology and artificial breeding of the Murray cod,
Maccullochella peeli and the eastern freshwater cod M. Ikei sp. Nov. (Pisces:
Percichthyidae)’. Ph.D. Thesis. School of Biological Sciences. Macquarie
University, Sydney. pp. 252.
Rowland SJ (1998) Aspects of the reproductive biology of Murray cod, Maccullochella peelii
peelii. Proceeding of the Linnean Society of New South Wales 120, 149-162.
Ye and Zampatti (2007) Murray Cod Stock Status _____________________________________________________________________________________________
32
Ye Q, Jones GK, Pierce BE (2000) 'Murray cod (Maccullochella peelii peelii). Fishery
assessment report to PIRSA for the Inland Waters fishery managment committee.'
South Australian Fisheries Assessment Series 2000/17. pp. 47.
Ye Q, Jones GK, Johnson J (2002) ‘Update on Murray cod data for 2001/2002. An interim
report to PIRSA Fisheries.’ SARDI Aquatic Sciences. pp. 7.