Embed Size (px)
Citation preview

The Loss of Property Rights and the Collapse of Zimbabwe
Craig J. Richardson
Introduction What in the world happened to Zimbabwe? Although the country certainly had its share
of difficulties during the first twenty years since independence in 1980, it largely dodged
the famines, civil strife, and grossly mismanaged government policies so common in other
sub-Saharan African countries. Through the 1980s, its annual real GDP growth averaged
over 5 percent, and unlike other African countries, agricultural yields were large enough to
allow the country to export grain to other countries. In the following decade, economic
growth slowed, and government policies were less than efficient, but Zimbabwe still
managed to grow an average of 4.3 percent, in real terms.1 The government also offered
free education and relatively good access to medical care. Population growth was slowing,
and direct foreign investment increasing. With rich mineral assets, an educated workforce,
and beautiful natural wonders, Zimbabwe appeared to have the best chance to be an
African success story.
However, in the year 2000 and continuing through 2003, the Zimbabwean government
initiated a land reform policy that involved forcibly taking over white-owned commercial
farms, ostensibly to redistribute this property to landless blacks. The rationale for this
Cato Journal, Vol. 25, No. 2 (Spring/Summer 2005). Copyright © Cato Institute. All rights reserved. Craig Richardson is Associate Professor of Economics at Salem College (Winston-Salem, NC). He sincerely thanks Barrie Richardson, Chris Mackie, Art Goldsmith (Washington and Lee University), Hernando de Soto, Arthur Goldsmith (UMass Boston) and Milton Friedman for their helpful comments and support in writing this article. The author welcomes comments from readers. Email: [email protected]. 1This excludes 1992, which had the worst drought in 50 years, causing GDP to sharply drop by 9 percent in that year only (World Bank Development Indicators). There were no other years of negative growth during this decade except for 1999, which experienced –0.7 percent growth.

2
policy was to redress the British seizure of fertile farmland in the late 1890s, which
resulted in hundreds of thousands of blacks being pushed onto lower grade communal
lands.
No compensation was paid to the commercial farmers, and hundreds of thousands of
employed black farm workers were left without jobs. Despite a ruling from Zimbabwe’s
Supreme Court that the action was illegal, the Mugabe-led government continued with the
land takings. These land reforms marked an important turning point for Zimbabwe: It was
the first time in its 20 year history that laws regarding property rights were no longer
respected or defended.
Three years later, Zimbabwe had gone from a place of hope to one of the grimmest
places on Earth. The economy collapsed by 5 percent in 2000, 8 percent in 2001, 12
percent in 2002 and perhaps as much as 18 percent in 2003 (OECD 2004: 357). Inflation
was running at 500 percent and Zimbabwean dollars had lost more than 99 percent of their
real exchange value (IMF 2003: 28). However, at the same time the IMF, the UN and the
OECD blamed the “severe drought” in 2001/02 for causing much of the food shortages and
resulting economic difficulties, along with a host of other factors, including AIDS, poor
fiscal and monetary policies, and rigid price controls. Although the other factors certainly
contributed negatively to Zimbabwe’s economy, the land reforms and the changes in
rainfall were the only variables that appeared to change dramatically from 2000-2003.
Thus, they are the primary suspects in plumbing the reasons for Zimbabwe’s quick
collapse.
The central question posed here is this: Which played a more important role in
Zimbabwe’s economic collapse, the damage to property rights or the drought? I argue that

3
the land reforms were the primary driver of Zimbabwe’s sudden collapse, not the lack of
rainfall. To do so, the paper is presented in four parts. First, I give a brief overview of the
literature that covers the link between property rights and economic growth. Second, I
correlate official Zimbabwe government rainfall data with GDP growth, and also use this
data to rank the severity of the 2001/02 drought versus other droughts in the past 50 years.
Third, I illustrate the precise mechanics of Zimbabwe’s collapse, by showing how the
damage to property rights destroyed three key, yet invisible components of the
marketplace, in sequence. They included investor trust, followed by land equity, and then
entrepreneurial knowledge and incentives. Last, I use OLS regression analysis to
independently assess the impact of the rainfall, land reforms, political strife, labor
productivity, capital formation and foreign aid on Zimbabwe’s economic growth. I
conclude that the land reforms alone were responsible for an estimated 12.5 percent
average decline in GDP growth. Rainfall played a minimal role in the GDP contraction.
The collapse of Zimbabwe is thus a dramatic natural experiment that serves as a
compelling case study on the economic consequences of damaging property rights.
Previous Work on Property Rights and Economic Growth
Property rights have long been recognized as a key ingredient in markets, as noted by
Adam Smith ([1776] 1976) and much later, Frank Knight (1971). Both pointed out that
economic activity is enhanced when people are able to secure the value of their work in a
legally defended asset. Economic historians such as North (1973) and Rosenberg (1994)
have argued that property rights are important with respect to long-run economic growth.
Hernando de Soto (2000) notes that a property system creates a network through which

4
people can rearrange their assets into more valuable combinations. By creating such a
network, de Soto argues, developing economies can grow far more quickly, because
previously untitled land can now be leveraged as equity to build new businesses.
Yet most of the recent theoretical work explaining economic growth has been framed
by neo-classical models that underscore investment in technology, human capital and
international trade flows (Solow 1956, Romer 1986 and Grossman and Helpman 1991).
These models offer important insights into causes of economic growth, but they implicitly
assume that there are well-enforced private property rights (Heltberg 2002). More recently,
Easterly (2002) nicely summarizes many theoretical reasons for Africa’s dismal
performance, but again barely mentions Africa’s poorly defined property rights as a
contributing factor.
Economists have shown more interest in empirically measuring the link between
property rights and economic growth. Scully (1988) reported that countries with well-
developed property rights and market structures experienced, on average, 2.6 percent GDP
growth, compared to 1.1 percent in countries where property rights were limited and there
was a great deal of state intervention. Heitger (2004) showed that a doubling of an index of
property rights more than doubled living standards, and concluded that property rights
were one of the ultimate sources of economic growth. Goldsmith (1995) also found that
second and third world countries enjoyed faster growth when they had more secure
property rights, as measured by a Heritage Foundation index.
On the other hand, Torstennson (1994) reported in a cross-sectional analysis of 68
developed and developing countries, that those countries which experienced arbitrary
seizures of property had negative economic growth. His study predicted that a country

5
might increase its growth rate by more than one percentage point by putting a stop to such
seizures. Of the fifteen countries in his study that undertook arbitrary seizure of property,
nine had negative growth rates. They included Chad (-6.1 percent), Liberia (-4.0 percent)
and Zaire (-5.1 percent). Those findings appear to underestimate the total impact of
property seizures, at least in the case of Zimbabwe.
The underlying reasons for this economic growth are buttressed by other studies. For
example, preliminary evidence in Peru suggests that the nationwide effort to secure land
titles has vastly increased the labor supply, because people spend much less time guarding
their property, thus increasing economic growth (Field 2002). In addition, research has
shown that investments in land improvements on titled land were 1.4-2.2 times higher than
on untitled land in Paraguay, Thailand, Brazil and Honduras (Alston 1996 and Feder
1999). The reason for this, as demonstrated by Broegaard, et.al. (2002) in a Nicaraguan
study, is that formal land documents increase the value of the land by giving better
incentives to invest and engage in long-term land use, such as growing perennial crops. All
of this results in higher output. The authors also noted that rural credit markets need to be
developed in tandem, as titling currently has little impact on the credit supply in
Nicaragua. They conclude that without formal titles, landowners in Nicaragua tend to be
rich individuals with liquid assets, who are not necessarily the most productive users of the
land. However, there is also evidence from Thailand (Feder et al. 1988) and Honduras
(Feder 1999) that shows the positive improvement in credit access and land prices after
issuing formal land titles. Titled farms obtained 3-4 times as much credit as untitled farms.
Furthermore, titled land was valued 1.8 times higher than untitled land in both countries.

6
Land security also encourages conservation and sustainable use of natural resources, as
shown by Heltberg (2002). In Central America, deforestation and environmental
degradation have brought renewed attention to land titling and the security of property
rights (Lutz 1998 and Utting 1996). In Zimbabwe, satellite photos clearly indicate that
areas without well-defined property rights suffer severe erosion, as communal farming
methods take their toll through slash and burn agriculture. Small and large-scale farms
with property titles (owned by both whites and blacks) suffer no such environmental
degradation (Prince 2004).
Just How Severe Was The Drought?
In order to untangle the reasons for the collapse of Zimbabwe, a critical piece of the
puzzle is assessing the severity of the 2001/02 drought, which occurred during the same
time frame. Reports from the IMF (2003), USDA (2002) and the UN (2004) all concurred
that the devastating food shortages since 2000 were largely to be blamed on the “severe
drought.” For example, the IMF’s Executive Director for Zimbabwe, Ismaila Usman
(2003), argued that this drought was the worst in 50 years, and appealed to the IMF to give
Zimbabwe another chance. The UN 2004 Humanitarian Appeal asked for $95 million in
aid, blaming Zimbabwe’s “vulnerability to climatic fluctuations and the shock of drought,
the HIV/AIDS pandemic and a constrained policy environment (UN 2004). However, as
Richardson (2004: 70-74) shows, hard evidence on the severity of the drought was
surprisingly hard to substantiate, as the evidence for all of these studies came from
secondary sources or a small subsample of rainfall stations. Rarely are the land reforms
squarely blamed for the food shortages. Indeed, a much better case for aid can be made if a

7
country is seen as being down on its luck, and in an economic tailspin due to factors
outside its control. Perhaps this is the reason the hard questions were never asked.
Measuring the actual amount of rainfall is thus imperative in order to tease apart the
impact of the drought from the land reforms. Fortunately, Zimbabwe’s Department of
Meteorology granted me special permission to view this highly sensitive data. These
primary data included individual data on all 80 rainfall stations in the country, reported on
a month-to-month basis, but only 48 stations had complete information over the period of
interest. The monthly data for these 48 rainfall stations were summed over twelve months,
and then averaged, to find the countrywide mean rainfall for a given agricultural year. The
data tell a compelling story that does not agree with any prior explanations.
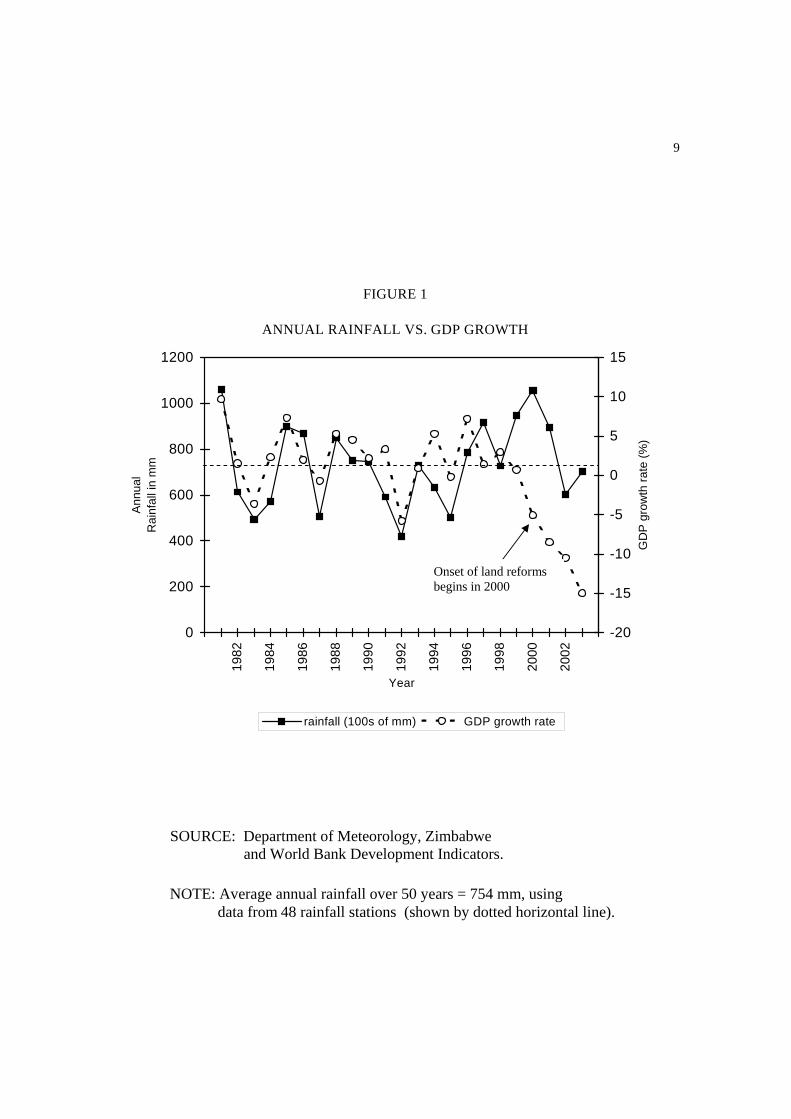
Figure 1 below shows that indeed the economy once hinged on rainfall. From 1980 to
1998 (1980/81 corresponds to 1981 on the graph, for example) the coefficient of
correlation between real GDP growth and rainfall was calculated to be r = 0.65. In other
words, 65 percent of GDP growth was correlated with rainfall, giving an excellent
indication of just how important the agricultural sector was in driving the economy. With
the economy sputtering at –0.7 percent growth in 1999, the link between GDP and rainfall
then sharply disconnected in the year 2000, the year of the land reforms. GDP growth
plunged downward, even as rainfall returned to above normal levels. The graph shows a
clear break from the past 20-year pattern, indicating the serious collapse in the agricultural
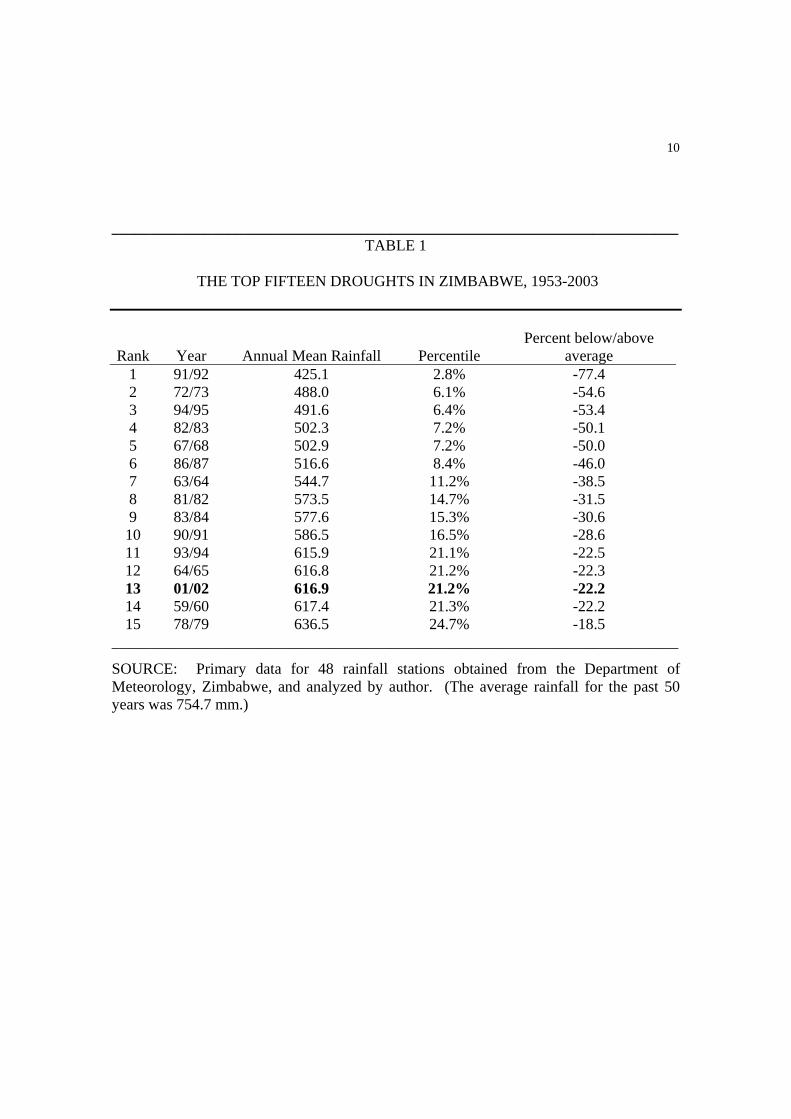
sector’s production levels. Using the data from Table 1 below, one can infer a sharply
different conclusion than the IMF regarding the 2001/02 crop season. The amount of
rainfall during this time was just 22 percent below the 50-year average. By ranking

8
cumulative rainfall over the past 50 years from lowest to highest, the 2001/02 growing
season comes in 13th place- 12 out of the past 50 years had worse rainfall.
There is indeed no doubt that the 2001/02 drought caused devastation for communal
farmers. However, to put primary blame on the drought for the sudden drop in overall
agricultural production, as the IMF, USDA and UN do, misses a key point. Zimbabwe
differs significantly from other African countries that suffered through the same drought.
The reason is that it possessed large dams and well-engineered irrigation systems for its
commercial farming regions. Because of the early and large amount of rainfall in late 2001,
dams throughout Zimbabwe were reported as full, with enough water to last through the
next rainy season.2
Despite the restoration of normal rainfall patterns after 2002, international donor
organizations continued to feed the myth of the drought as one of the principal causes of
Zimbabwe’s food shortages, all the while skirting the land reform issue. For example, The
Mercy Corps (2003), an aid organization that dispenses millions of dollars each year to
2Andrew Natsios, Administrator for USAID, reported at a Foreign Press Briefing, on August 20, 2002 that “there is water available, even if there’s a second-year drought, to grow a crop, but the crops aren’t being planted because the commercial farmers and farm workers have been evicted by the government. We have urged them to reconsider their expropriation of these farms at a time when that really was the insurance policy for people to survive in a severe drought.” The Zimbabwe’s Daily News reported on May 15, 2002 that Zimbabwe’s dams were reported as 74 percent full, and Peter Sibanda, Bulawayo’s Director of Engineering Services, said there was enough water to last through the next rainy season.
9
SOURCE: Department of Meteorology, Zimbabwe and World Bank Development Indicators.
FIGURE 1
ANNUAL RAINFALL VS. GDP GROWTH
0
200
400
600
800
1000
1200
1982
1984
1986
1988
1990
1992
1994
1996
1998
2000
2002
Year
Ann
ual
Rai
nfal
l in
mm
-20
-15
-10
-5
0
5
10
15
GD
P g
row
th ra
te (%
)
rainfall (100s of mm) GDP growth rate
NOTE: Average annual rainfall over 50 years = 754 mm, using data from 48 rainfall stations (shown by dotted horizontal line).
Onset of land reforms begins in 2000
10
_________________________________________________________________________ TABLE 1
THE TOP FIFTEEN DROUGHTS IN ZIMBABWE, 1953-2003
Rank
Year
Annual Mean Rainfall
Percentile
Percent below/above
average 1 91/92 425.1 2.8% -77.4 2 72/73 488.0 6.1% -54.6 3 94/95 491.6 6.4% -53.4 4 82/83 502.3 7.2% -50.1 5 67/68 502.9 7.2% -50.0 6 86/87 516.6 8.4% -46.0 7 63/64 544.7 11.2% -38.5 8 81/82 573.5 14.7% -31.5 9 83/84 577.6 15.3% -30.6 10 90/91 586.5 16.5% -28.6 11 93/94 615.9 21.1% -22.5 12 64/65 616.8 21.2% -22.3 13 01/02 616.9 21.2% -22.2 14 59/60 617.4 21.3% -22.2 15 78/79 636.5 24.7% -18.5
_________________________________________________________________________
SOURCE: Primary data for 48 rainfall stations obtained from the Department of Meteorology, Zimbabwe, and analyzed by author. (The average rainfall for the past 50 years was 754.7 mm.)

11
developing nations, reported in 2003 that Zimbabwe was currently experiencing a
“crippling drought,” leading to “widespread food shortages.”
The Damage and Disruption to Trust, Land Equity and Knowledge
Since the drought had effects far less severe than is generally understood, it is now
necessary to explore in depth the consequences of the land reforms on Zimbabwe’s
economy. As was stated in the introduction, the 2000-2003 land reforms were significant
as they marked the first time in Zimbabwe’s history that property rights laws had been
openly ignored by the Mugabe government.
We have also seen that the literature indicates that property rights are correlated with
economic growth. Unlike those studies cited, let me propose that the relationship between
economic growth and property rights is not a linear one. There are likely diminishing
returns to GDP growth as property rights improve, not unlike the process of building trust
in a relationship. Richardson (2004:135-141) discusses the case of Nicaragua as a prime
example of this point. Damaging property rights, on the other hand, is likely to cause a
sudden collapse. When examining Zimbabwe’s key economic indicators, it is indeed as if
the country were pushed off a cliff in the year 2000.
Why is this so? When property rights are damaged, it can be suggested that there are
three effects that ultimately change individuals’ perceptions in a drastic way. First, there is
the loss of trust in the government to enforce the law, which dramatically affects foreign
investors’ view of the country. Second, the loss of property titles dramatically limits the
amount of borrowing and entrepreneurial activity, by disrupting the banking sector.
Individuals no longer can offer banks their property as collateral for a loan. Third, there is

12
the loss in the incentive to pass along entrepreneurial knowledge, and work initiatives are
sharply stymied as well, since one’s investment is not retained. The next three subsections
discuss these ideas in greater detail.
The Loss of Investor Trust
In 1993 the Zimbabwean Stock Exchange (ZSE) was opened to foreigners for the first
time. Investors were bullish on Zimbabwe, and by 1996, Zimbabwe’s equity markets were
“surging.” More than half the growth in the top 35 sub-Saharan companies (excluding
South African groups, which are listed separately) came from Zimbabwe. The number of
Zimbabwean companies in the region’s top 35 rose from nine to eleven in one year, but
more importantly, their combined market capitalization more than doubled to $2.6 billion
from $1.2 billion. Zimbabwe was one of top performers in the world’s emerging markets
and a new favorite of investors. Four companies were brand new entrants, among them,
Meikles Africa, a conglomerate with ties to retailing, tourism, agriculture and
manufacturing (Business Times 1997).
Yet in 1998, the stock market began to plunge. One of those reasons had to do with a
“loss of confidence” in the government, including the government's publicly stated
intention to acquire commercial farms for resettlement. (Another factor included high
interest rates, which lured investors to money markets.) At the end of 1998, the value of
stocks traded on the ZSE had dropped by 88 percent (MBendi Profile 2004).
Foreigner investors became increasingly concerned with the Mugabe government’s
willful disregard of the law, especially after its own Supreme Court declared the land
seizures unconstitutional in 2000. Granted, there had been numerous human rights abuses,
and wasteful, corrupt expenditures by government officials, but this was far different. An

13
unnerving precedent had been set: For the first time, the executive branch of government
condoned the involuntary expropriation of private property, and there was nothing the
judicial branch could do. Indeed, President Mugabe simply replaced judges who were not
sympathetic toward his aims (Meredith 2002: 199-207).
Intimidated by these actions, investors and businesspeople worldwide wondered if
homes, stocks or other businesses could be next. The result was a flight of foreign
investment as nervous investors quickly pulled out their financial stakes in the country.
Between 1998 and 2001, direct foreign investment dropped by 99 percent (World Bank
2002). In addition, the risk premium on investment in Zimbabwe jumped from 3.4 percent
in 2000 to 20.4 percent in 2001 (World Bank 2002). Simply the discussion of the potential
loss of property rights had very real consequences.
The Loss of Land Equity
After the land reforms began in 2000, newly resettled Zimbabweans were assigned
plots of former commercial farmland without land titles. Instead, Zimbabweans were
forced to lease the land from year to year from the government. With no means to borrow
against their land, the new farmers could not obtain loans from banks for seeds or farm
equipment. As the farm seizures continued, banks became increasingly reluctant to lend to
the remaining commercial farmers whose land had been “listed” for compulsory
acquisition by the government, or occupied by squatters (OECD 2002: 306).
As this section will show, the land seizures caused a vast constriction of borrowing
which rippled from business to business, and sector-to-sector. There was no way for banks
to foreclose on the land, because the Zimbabwean government became the sole property
owner, rendering the property titles valueless, and which severely impacted the banking

14
sector. The seizures point out an important lesson: When a government seizes land in an
effort to tap into the land’s wealth, the amount it captures will only be a tiny fraction of the
land’s full potential. The rest of that potential quickly evaporates if there is no way for the
land to be leveraged, and no way for the funds to be channeled from one source to another
by a network of economic activity.
How much wealth was lost from the country just as a result of the farm seizures? I
estimate that from 1999-2000, nearly 5 billion US dollars in wealth vanished from the
agricultural sector. This estimate was obtained by first gathering information from The
Commercial Farmer’s Union of Zimbabwe (CFU), which included the total revenue from
all commercial farm production from 1997-2003.
To impute the value of commercial farmland is not easy, given Zimbabwe’s fast-
changing environment of high inflation and parallel exchange rates. An admittedly crude
estimate was made using other available information. First, in 1997 there were 11.3
million hectares of commercial farmland, and the average selling price in that year was
Z$9,883 per hectare (Rugube and Chambati 2002:14). There was slightly above average
rainfall this year, making it a good representative year for typical agricultural revenue.
Therefore, the total value of farmland in that year was approximately Z$111.678 billion, or
US$9.384 billion, using the parallel exchange rate in that year of 11.9Z$=1 US$.
What was the rate of return on that land? According to the CFU, commercial farmers
earned US$1.119 billion in revenue in 1997. That is a return of 11.92 percent,
coincidentally a number very close to the exchange rate. Using that return, the approximate
value of commercial farmland in succeeding years was imputed by dividing the value of
agricultural production, in US dollars, by 0.1192.

15
During 2000, the value of the commercial farmland dropped dramatically by 5 billion
US dollars, as can be seen in the Table 2 below. Not only that, the land now changed in
character. It was now what de Soto (2000) calls “dead capital.” Unable to be leveraged
and used as equity, the farmers who tilled the land quickly resorted to inefficient
subsistence farming techniques. The loss of $5 billion in wealth caused a reverse multiplier
effect, quickly tearing down the networks of economic activity.
With banks holding now worthless titles, and unable to foreclose on properties, by late
2004 thirteen of Zimbabwe’s forty-one banking institutions were in financial crisis. In
particular, the failure of a large institution named Trust Bank in 2004 indicated the depth
of the financial crisis. Trust’s closure was “particularly worrying” to financial experts
because the RBZ poured in billions of dollars of taxpayers’ money in a bid to rescue the
bank, but the effort still failed (Muleya 2004). There is another telling statistic: Prior to
1997, an average of 1,600 tractors were sold per year throughout Zimbabwe, with farmland
typically used as collateral. By 2002, total national sales dropped to only eight tractors
(IMF 2003:26). Gross private capital formation, once a healthy 20 percent of GDP in
1995, now fell to –6.7 percent in 2002, as farming equipment was looted, destroyed or
sold, and new farmers saw little reason to invest in tobacco barns or tillage equipment
(OECD 2004:360-362). Zimbabwe’s conversion from live to dead capital was nearly
complete.
The Loss of Knowledge and Tragedy of the Commons
Aside from the damage done to the banking sector, the land reforms caused big
changes in agricultural production. In 1999/2000 the commercial farmers planted 200,000
hectares of farmland; in 2000/01 it was 90,000 hectares, and by 2001/02 it was only 50,000

16
hectares (a hectare is 2.2 acres). As a result, maize, groundnuts, cotton, wheat, soybean,
sunflowers, coffee and sheep production contracted between 50 and 90 percent during the
_________________________________________________________________________
TABLE 2
THE LOSS IN AGRICULTURAL REVENUE AND WEALTH FROM COMMERCIAL FARMLAND, 1997-2003
1997 1998 1999 2000 2001 2002 2003 Total commercial agricultural revenue, in millions of Zimbabwean dollars
13,300
21,184
33,603
48,933
102,843
249,239
524,560 Parallel exchange rate (Z$ to US$)
11.9
21.4
38.3
200.0
410.0
1,100.0
1,800.0 Total agricultural revenue, in millions of U.S. dollars
1,118.6
989.4
877.1
244.7
250.8
226.6
291.4
Imputed Value of Commercial Farmland, billions of US $
9.38
8.30
7.36
2.05
2.10
1.90
2.44 Year to year change in farmland value, in US billions of $
-1.08
-0.94
-5.31
-0.05
0.20
0.54 Cumulative loss, US billions of $
-1.08
-2.02
-7.33
-7.28
-7.48
-6.94
_________________________________________________________________________
SOURCE: Zimbabwe Commercial Farmers’ Union, the IMF, and author calculations. The imputed value is found by dividing the total agricultural revenue by 0.1192, which was the average rate of return on titled farmland property in 1997 in Zimbabwe. NOTE: The enormous drop in wealth occurs in the year 2000, the first year of the land reforms. The numbers in bold indicate the change from live to dead capital, as property titles were revoked. The collapse in the banking sector meant a reverse multiplier effect many times more than these initial losses.

17
2000-2003 period. Only drought-resistant sorghum had any gains, although only 5,000
hectares were planted over this time.3
Since the government had no plan for redistribution or access to property titles, over
half of the vacated farms were left unclaimed and unused. The commercial farmers took
with them the intricate knowledge needed to produce a variety of crops under arid
conditions. The drop in hard currency lost from commercial farming output meant that the
new farmers also had no money for seeds or fertilizer. This hard currency was crucially
important to Zimbabwe in other ways: It provided a means to purchase imports of
everything from spare parts to cars and gasoline.
With the absence of property rights, Zimbabwe’s advanced system of commercial
farming quickly liquidated, and tragedy of the commons replaced it. Godwin (2004)
observed that evicted farmers dug up, sold or took the irrigation pipes; some ZANU-PF
supporters even melted pipes down to sell as coffin handles or scrap metal. Sophisticated
farming equipment was looted, set on fire or stolen by marauding groups. To make matters
worse, the Grain Marketing Board (GMB), run by the Zimbabwe government, delivered
seeds late in 2001, and many communal farmers criticized it because their maize crops did
not receive a basal fertilizer dressing, which is important for root growth. Without it, maize
is very susceptible to droughts (FAO 2002:7). Most importantly, the people who replaced
the commercial farmers lacked the knowledge of running a commercial farm, and many
farms were simply left fallow or the wrong types of inputs were used.
The conversion from commercial farms to communal farms transformed increasing
numbers of Zimbabweans back to a subsistence form of living, and turned once fertile

18
farmland back to the bush. During the 2001/02 drought, communal maize production
dropped by a stunning two-thirds, from 1.091 million tons in 2000/01 to only 315,000 tons
the following year. The drought reduced communal farms to only 7 percent of the
productivity of commercial farms by the end of 2002, whereas they had been 28 percent as
efficient in 1999/2000. Another way of putting this is that in the 1999/2000 crop year, one
hectare of commercially farmed land produced the same as 3.6 hectares of communally
farmed land. Two years later, the ratio was 1 to 15, even using the evicted commercial
farmland.
What if land reforms had not taken place?
If land reforms had not taken place, the drop in agricultural production would have not
been nearly so dramatic. Zimbabwe’s insurance policy- its irrigated commercial farm
system- would have greatly ameliorated the harm of the drought, by providing the hard
currency for seeds for the following year, and food for the present. Zimbabwe would have
simply exported very little of its maize and used the majority of it to feed its people. The
drought would have registered as a “tough year” but hardly a catastrophe, as the following
year brought restorative rains. In fact, as we have seen, dams were widely reported as full
through this time.
The commercial farms’ abilities to weather droughts is demonstrated by examining the
changes in maize yield for communal vs. commercial farmers, on a per hectare basis. As
Table 3 shows below, during the 2001/02 drought the yield for maize per hectare only
dropped 15.7 percent for commercial farmers whose land had not yet been seized, from
3Calculations made using data sent to me from Commercial Farmers’ Union, Zimbabwe.
19
4.28 to 3.70 tons per hectare. Communal farmers’ yield, on the other hand, fell
precipitously by nearly three-fourths of the previous year’s production levels.
I also hypothesize in Table 3 what might have happened if land reforms had not taken
place. Total commercial maize production can be approximately projected by employing
the yearly productivity changes, per hectare, of the remaining commercial farms. For
example, in 2000/01, commercial maize production per hectare increased by 5.7 percent.
This means that the commercial acreage that yielded 810,000 tons in 1999/2000 would
have yielded an additional 5.7 percent in the next year. The total yields for 2000/01
would have increased by approximately 46,000 tons, for a total commercial output of
856,000 tons. (This analysis assumes there were not significant differences in agricultural
yields per hectare between seized farms and remaining farms.) Instead, because of rapidly
falling total commercial acreage, output collapsed to 385,000 tons. What the table also
shows is that by the end of 2002, without land reforms total production would have been
more than twice the output of what it actually was, at 1 million pounds of maize versus
500,000 pounds. The extent of the famine could have been greatly avoided.

20
_________________________________________________________________________
TABLE 3
DIFFERENCES IN YIELDS AND PRODUCTION BETWEEN COMMUNAL AND COMMERCIAL FARMS, FOR MAIZE PRODUCTION, 1999-2002.
1999/2000 2000/2001 2001/2002
A. Yield (tons per hectare)
Communal farms 1.13 0.96 0.25 Yearly Productivity change n.a. -17.7% -74.0%
Commercial farms 4.05 4.28 3.70 Yearly Productivity change n.a. +5.7% -15.7%
Ratio of communal to commercial production.
0.279
0.224
0.068
B. Actual Production (1,000s of tons)
Communal farms 1,338 1,091 315
Commercial farms 810 385 185
Total 2,148 1,476 500 C. Hypothesized Production (Without land reforms)
Communal farms 1,338 1,091 315 Commercial farms 810 856 722 Total 2,148 1,947 1,037
NOTE: Data for sections A and B came from Statistical Appendix, Table 3, in the 2003 Article IV IMF Staff Report, which used information from official government agencies in Zimbabwe. Projections in bold, calculated by author using data from commercial farms’ yearly productivity changes.

21
Ripple Effects Through the Economy
Zimbabwe’s government now faced two enormous and pressing problems as its
commercial sector disappeared. First, it was apparent that with the precipitous drop in
maize production, its citizens would no longer be able to feed themselves. Second, its most
lucrative cash crops, such as tobacco and cotton, were no longer providing sufficient
foreign exchange. Zimbabwe’s decline in cash crops badly hurt the government’s coffers,
which depend on hard currency. From 1999 to 2000, commercial farm revenue dropped
from 877 million U.S. dollars to just 247 million U.S. dollars. In normal years, the balance
of the foreign exchange from the agricultural sector provided between 40-45% of the total
foreign exchange for the country; of this percentage, around 80% originates from the
commercial farm sub-sector.4
The lack of hard currency caused by the collapse of the commercial farming sector
meant that the government had little money to spend on important agricultural inputs for
the communal farmers, such as fertilizer. In addition, the deficit-ridden and government
subsidized Grain Marketing Board (GMB) was unable to guarantee a pre-planting price for
maize, which made farmers reluctant to produce a crop that probably would have a very
low return. Price controls on fertilizer created shortages, as companies were reluctant to
deliver the input at a loss. Late payments by the GMB the previous year also stymied
farmers’ initiative to grow maize. As a result, thousands of hectares remained fallow after
2000, adding to the collapse of production caused by the drought and the land reforms.
The downward spiral has the potential to get worse each year, as crops are not adequately
4 This information was provided to me by Neil Wright, an economist for the Commercial Farmers’ Union.

22
fertilized, which results in lower yields, and even less money for fertilizer the following
year (FAO 2002: 1-3).
The damage done to the agricultural sector spread quickly to Zimbabwe’s relatively
sophisticated manufacturing sector, as industrial production declined by 10.5 percent in
2001 and an estimated 17.5 percent in 2002. Seven hundred companies shut their doors by
late 2001 (BBC 2001). The reason was because of the symbiotic relationship between the
two sectors. In addition to providing nearly half of the hard currency, agricultural
production provides about 40 percent of the raw inputs for manufacturing (Sugunan 1997).
According to OECD (2004:361) estimates, manufacturing production declined by 13
percent in 2003, compared to a decline of 15 percent in the same period in 2002. Industrial
production, which relies on imports, was badly hit by the acute foreign currency shortage.
As a result, output of non-metallic minerals fell by 40 percent, food by 30 percent, textiles
by 26 percent, wood and furniture by 20 percent and transport equipment by 12 percent,
during 2003.
After 2001, Zimbabwe's total demand for hard currency now far exceeded the supply.
For the period April 2002 to March 2003 it amounted to US $1.14 billion, a long way from
the expected inflows of only US $486.4 million, according to a Ministry of Finance report
(Thondlana 2002). The resulting deficit of US $660 million was reflected in critical
shortages of essential inputs. Zimbabwe’s payments on loans to The World Bank, already
overdue, increased even further its payment arrears.
Once independent from government, The Reserve Bank of Zimbabwe (RBZ) now was
instructed to buy up millions of Zimbabwean dollars worth of government bonds to finance
the rapidly expanding deficits. It subsequently invested in a high-speed processor and

23
shredder to keep up with the “demand,” apparently seeing little link between that purchase
and the runaway inflation rate (Richardson 2004:103). By May of 2003, Zimbabwe’s
central bank ran out of foreign exchange to import the special paper and ink used to print
currency, and resorted to printing “bank notes” instead (Njanji 2003). Inflation levels had
jumped from around 50 percent in the late 1990s to more than 500 percent by the end of
2003 (IMF 2003). In the same year, worthless currency now made food shortages
commonplace and severe; one report noted that once well-fed rural Zimbabweans were
now forced to make meals out of caterpillars (Thurow 2003).
The Data, Regression Model and Results In this section, I make a formal test of the hypothesis that the land reforms were the
major determinant of the collapse in Zimbabwe’s economy, as measured by GDP growth.
I also test for the impact of rainfall on the economy, to test for the claim that rainfall
played a much smaller role. In doing so, the separate effects of the land reforms and the
rainfall can be teased apart, along with other independent variables, using ordinary least
squares regression techniques.
Data The study employed yearly time-series data, covering the period 1961 to 2003, for a
total of 43 observations. (This time period represented the largest span for which all
relevant data were available.) The model included Zimbabwe-specific and standard
economic measures of economic growth. The Zimbabwe-specific variables measure
rainfall and serious changes in economic security, or “political strife.” The data on rainfall
were obtained from Zimbabwe’s Department of Meteorology, and the “political strife”
24
variables were based upon two time periods, the war for independence and the land
reforms, both of which caused serious institutional disruptions. The data for the economic
variables come from the World Bank Development Indicators (2002), which are available
on a yearly basis for Zimbabwe. The construction of and rationale for these variables are
now discussed in more detail below.
Zimbabwe-Specific Variables.
Because Zimbabwe’s economy is heavily influenced by its agricultural sector, rainfall is
an important input. A crop year with higher rainfall is hypothesized to lead to higher crop
yields, and thus greater GDP growth. Zimbabwe’s average annual rainfall (RAINFALL)
was measured by taking the mean of forty-eight different rainfall stations’ reported annual
rainfall. These stations were widely scattered throughout the country. Rainfall data for
each station was reported on a month-to-month basis, so the data first had to be aggregated
on a yearly basis, before they were averaged.
LANDREFM is a dummy variable that switches on during the four years of the land
reforms, from 2000 to 2003. I have argued in this paper that those years were significantly
different than the ones that preceded it, in terms of the erosion of property rights, and the
accompanying domino effects. Although this variable does not measure property rights
directly, its coefficient estimates will help describe the average speed of the economic
decline during these years, holding constant the other important factors included in the
regression. The focus of this paper is primarily on this coefficient, since it gives an
important measure of how quickly Zimbabwe collapsed once its property rights were under
siege.

25
In addition, I added another dummy variable, (70sWAR), which switches on during
1975-1979, which was the final era of the white minority leadership over Rhodesia
(Zimbabwe’s former name) and the last vestige of British colonial rule. This variable
parallels the LANDREFM to some degree, since it also attempts to measure political strife,
breakdown in law and order, and lack of economic security. As the white government
faced attack during this time from Mugabe-led guerilla soldiers seeking majority rule, the
war consumed as much as one-third of the budget. In addition, Rhodesia was weakening
after years of tough sanctions from Britain, which punished it for its anti-democratic
policies. Both of these resulted in severe economic consequences during the mid to late
1970s (Minter and Schmidt 1988: 233).
Economic Variables.
Standard models of economic growth models consider the size of savings and
investment, as well as the labor force, to be important determinants. Saving and investment
are important components of growth, because they play a role in the expansion of
productive capacity (Otani and Villanueva 1990). Gross capital formation as a percent of
GDP (I/GDP) is used as a proxy to reflect this economic factor.
There is little data available on an annual basis regarding Zimbabwe’s labor force.
However, the age dependency ratio can serve as a crude proxy for labor productivity. This
variable (AGEDEPEN) measures the percentage change in the age dependency ratio,
which is the total number of dependents divided by the working population. It is
hypothesized here that as age dependency ratio increases, GDP growth will decline, since
increasing numbers of children require more time away from the workplace.

26
Foreign aid has been shown to cause negative consequences for economic growth
(Easterly 2002). Aid causes dependency and lack of initiative as countries become
increasingly interested in finding incentives to get more aid, not less. The worse a country
does, the more aid it gets. Thus it is hypothesized that aid creates perverse incentives. The
percent of foreign aid as a share of Gross National Income (FORAID) is used in the
regression to measure this phenomenon. (Both FORAID and I/GDP are measured as a
percent of GDP to adjust for Zimbabwe’s hyperinflation, which would cause tremendous
distortions in estimation otherwise.)
The Regression Model and Results
The consideration of the determinants of economic growth implies the following
specification below, to be estimated using ordinary least squares.
GDPGROW = α + β(RAINFALL) + φ(LANDREFM) + δ1(70sWAR) + δ2(I/GDP) +
δ3(AGEDEPEN) +δ4(FORAID) + ε
where:
GDPGROW = (GDPt+1 – GDPt)/GDPt* 100, or annual GDP growth in percentage terms,
α = the constant term,
RAINFALL = average annual rainfall in 100 mm,
LANDREFM = a dummy variable that equals “1” for the years 2000-2003, “0” otherwise,
70sWAR = a dummy variable that equals “1” for the years 1975-1979, “0” otherwise,
I/GDP = gross capital formation as a percentage of GDP,
AGEDEPEN = the percentage change in the age dependency ratio,
FORAID = foreign aid as a percentage of gross national income,
β, φ, δ1-δ4 are the parameters to be estimated and ε is a random error term.

27
In order to assess the relative importance of rainfall, land reform and the other variables
on GDP growth, there were two approaches taken in the regression analysis. The first
approach, in typical fashion, reports the size of the estimated b-coefficients as well as the t-
statistics. This approach allows one to project the independent impact, of say, a specific
change in rainfall on GDP growth, holding the other variables constant. These results are
reported in column (a) in Table 4.
The second approach involves standardizing the variables so they are converted to z-
statistics, each with a zero mean and a standard deviation of 1.0. This approach allows one
to measure the relative influence of each independent variable in a regression; the resulting
estimates are known as beta-coefficients. Beta-coefficients indicate the net effect on GDP
growth after changing a given independent variable by one standard deviation. The larger
the absolute value of the beta-coefficient, the more relative strength an independent
variable has in influencing the dependent variable. The second approach is useful for
assessing whether changes in rainfall or the land reforms had a generally more powerful
impact on Zimbabwe’s economy. These results are reported in column (b).
As expected, the sign for the b-coefficient estimate for RAINFALL is positive. Using
the regression results in column (a) of Table 4, the estimate implies that every 100 mm of
rainfall in Zimbabwe led to a 0.97 percentage point increase in real GDP growth, ceteris
paribus. The RAINFALL variable barely misses being significant at the 95 percent
confidence level (the p-statistic was .056). Evidence thus suggests that rainfall directly
influences economic growth.
So how much of a difference did the actual drop in rainfall during the 2001/02 drought
make on economic growth? With these regression results, we can directly measure the

28
impact. As Table 1 shows, the rainfall was 138 mm below average in 2001/02, so by
multiplying the b-coefficient estimate for rainfall (0.97) by -138, and dividing by 100, the
model predicts that the drop in rainfall in that year contributed to a slowdown of GDP
growth by only -1.34 percentage points, ceteris peribus. The economy contracted by about
10 percentage points in 2002, so this means the drop in rainfall only accounted for 13.4
percent (less than one-seventh) of the overall contraction.
These results thus strongly corroborate the first hypothesis of this paper, that the drop in
rainfall played a minor role in the economic collapse of Zimbabwe, primarily because
rainfall didn’t drop as much as is commonly believed. These results also suggest that in
subsequent years, rainfall even less to do with the collapsing economy. However, with the
move away from commercially irrigated farming, it can be expected that this variable may
play a stronger determinant in Zimbabwe’s economic growth in future years.
In contrast, the LANDREFM dummy variable has the largest impact of all the
variables on economic growth. The b-coefficient estimate in the base regression shows
that each year of the land reforms led to an average 12.5 percentage point collapse in GDP,
ceteris paribus. Indeed, if it weren’t for above average rainfall in the years 1999 to early
2001, the actual contraction of Zimbabwe would have been even greater than the 5 to 8
percentage point collapse that actually occurred. As terrible as conditions are presently in
Zimbabwe, this analysis shows they could have been even worse. This variable was
statistically significant at the 99 percent level of confidence.
The 70sWAR dummy variable also was statistically significant at the 99 percent level,
indicating the serious consequences to the Zimbabwe (then Rhodesia) economy during its
struggle for independence. Each year of this battle cost it dearly, as GDP declined 9.2
29
percentage points per year, ceteris paribus. It was no wonder that after five years, the
white-led government was ready to hand over the reins to Mugabe and his ZANU-PF
political party.
The other variables, I/GDP, AGEDEPEND and FORAID had the expected signs but
were statistically insignificant. This may be because of the relatively small number of
observations, or because the variables were not well specified. Perhaps the proxies for
labor and capital could be improved with better data. It may also indicate that Zimbabwe’s
GDP growth is not well described by standard economic growth models. The typical
emphasis that is placed upon these types of explanatory variables may be misplaced;
perhaps institution and country-specific variables matter the most in predicting economic
growth and collapse in lesser-developed countries.
With regard to the standardized regression approach, column (b) in Table 4 clearly
shows that land reforms played the biggest role in the collapse of GDP, as LANDREFM
had the largest beta coefficient of –0.543. Social/political strife in the 1970s also has a big
impact, as the beta-coefficient was second largest, at –0.439. RAINFALL was next most
important at 0.257. This second approach also reinforces the initial hypothesis that
institutional changes affected Zimbabwe much more than the variation in rainfall. Using
ANOVA, the calculated F-statistic was 6.46, strongly rejecting the null hypothesis that the
overall regression model had no explanatory power, at the 99 percent level of confidence.
The adjusted R-squared was 0.46.
Conclusion
This paper has demonstrated that the primary cause of Zimbabwe’s 2000-2003 collapse
was the land reform movement. The drought played a minor role in 2001/02, responsible

30
for less than one seventh of the total 10-percentage point drop in GDP growth in that year.
Rainfall was inconsequential to Zimbabwe’s collapse in the years following. The land
reform movement resulted in a crash in the stock market, and a loss of nearly three-
quarters of the total value of farmland, according to this paper’s estimates. This had a
severe impact on the banking system and the economy in general, as borrowing dried up.
Estimates from this paper also show that agricultural production levels would have been
twice as large had the commercial farms not been seized by the government, which would
have greatly ameliorated the food crisis of 2002. Lastly, according to regression estimates,
the land reforms’ multiple effects dragged economic growth down by an average of 12.5
percentage points annually, for the years 2000-2003. If it were not for the above average
rainfall in 2002-2003, Zimbabwe’s economy would have been in even worse shape than it
is today.
Zimbabwe thus provides a compelling case study for the perils of ignoring rule of law
and property rights when enacting (often well-intentioned) land reforms. We have seen that
Zimbabwe’s markets collapsed extraordinarily quickly after 2000, with a domino-like
series of effects. Thus, the lesson learned here is that property rights are not only crucial
for economic growth, but more importantly, they serve as a market economy’s key
linchpin. Once those rights are damaged or removed, economies may be prone to collapse
with surprising and devastating speed. As we have seen, this happens because damaged
property rights trigger the loss of investor trust, the vanishing of land equity and the
disappearance of entrepreneurial knowledge and incentives- all of which are the essential
ingredients for economic growth.

31
_______________________________________________________________________________________ TABLE 4
REGRESSION RESULTS
DEPENDENT VARIABLE: ANNUAL GDP GROWTH (GDPGROW)
(Sign for independent variables indicates hypothesized relationship)
NOTES: * denotes significance at the 10 percent level ; ** denotes significance at the 5 percent level; *** denotes significance at the 1 percent level. Figures in parentheses are t-statistics.
Independent Variable
Unstandardized
b-coefficient
Standardized Beta
Coefficient
INTERCEPT -3.51 (-0.74)
n.a.
RAINFALL (+) 0.97*
(1.98) 0.257*
LANDREFM (-) -12.49*** (-2.97)
-0.543***
70sWAR (-) -9.15*** (-3.31)
-0.439***
I/GDP (+) 0.16 (0.72)
0.129
AGEDEPEN (-) -0.039
(-0.45) -0.007
FORAID (-) -0.49 (-1.34)
-0.204
Adjusted R2 = 0.46 F Statistic = 6.43 N = 43
32
References
Business Times. (1997) “Zimbabwe leads Africa in equity revolution.” (http://www.btimes.co.za/97/0202/world/world2.htm). Broegaard, R., Heltberg J. R., and Malchow-Moller N. (2002) “Property Rights and Land Tenure in Nicaragua.” University of Copenhagen: Center for Development Research working paper. Available at: (http://www.econ.ku.dk/heltberg/Papers/landtenureNicaragua.pdf).
Easterly, W. (2001) The Elusive Quest for Growth: Economists’ Adventures and Misadventures in the Tropics. Cambridge: MIT Press.
FASonline. (2002) “Zimbabwe: Drought Threatens 2001/02 Summer Crops.” (http://www.fas.usda.gov/pecad2/highlights/2002/02/zim/zimfeb.htm).
Food and Agricultural Organization. (2002) “Special Report: FAO/WFP Crop and
Food Supply Assessment Mission to Zimbabwe.” 1-3. (http://www.fao.org/docrep/005/y6816e/y6816e00.htm).
Feder, G., Onchan, T., Chalamwong, Y. and Hongladarom, C. (1988) Land Policies and Farm Productivity in Thailand. Baltimore: The Johns Hopkins University Press.
Feder, G. (1999) Access to Land and Poverty Reduction. Presentation at the
International Colloquium forAgrarian Reform and Rural Development in the 21st Century, Puebla, Mexico.
Field, E. (2003) “Entitled to Work: Urban Tenure Security and Labor Supply in Peru.” Princeton University Research Program in Development Studies Working Paper (220), 20 November.
de Soto, H. (2000) The Mystery of Capital. New York: Basic Books. Godwin, P. (2003) “A Land Possessed.” National Geographic, August: 100-114. Goldsmith, A. (1995) “Democracy, property rights and economic growth.” Journal of Development Studies (32): 157-175.
Grossman, G. and Elhanan H. (1991) Innovation and Growth in the Global Economy. Cambridge, Mass: MIT Press. Heitger, B. (2004) “Property Rights and the Wealth of Nations: A Cross-Country Study.” The Cato Journal 23 (3): 381-402.

33
Heltberg, R. (2002) “Property Rights and Natural Resource Management in the Developing Countries.” Journal of Economic Surveys, 16 (2): 189-214.
International Monetary Fund. (2003) Zimbabwe: 2003 Article IV Consultation- Staff Report. Washington, DC: IMF Publication Services, July.
Lee, R. (2002) “Crisis in Chidobe,” in Zimbabwe Eyewitness, World Food Program (www.wfp.org/newsroom/in_depth/africa/sa_chidobe0209.htm).
Lutz, E. (1998) “Agriculture and the environment: Perspectives on sustainable rural development.” Working paper. Washington, D.C.: World Bank.
Knight, F.H. (1971) Risk, Uncertainty and Profit. Chicago: University of Chicago Press. MBendi Profile. Zimbabwe Stock Exchange- General Information (http://mbendi.co.za/exch/11/p0005.htm#10). McGrory, D. (2001) “War veterans gloat as farm goes to ruin.” The Times (UK), 9 March (http://www.zimbabwesituation.com/mar10.html#link1). Mercy Corps. (2003) “Mercy Corps Begins Emergency Food Program in Zimbabwe in Response to Drought.” 15 July (http://www.mercycorps.org/items/1458/). Minter, W. and Schmidt E. (1988) “When Sanctions Worked: The Case of Rhodesia Re-examined.” African Affairs 87 (347): 207-237, April.
Muleya, D. (2004) “Wobbly banks still send tremors.” The Independent (www.theindependent.co.zw/news/2004/October/Friday1/analysis.html). Njanji, S. (2003 ) “No let up in Zimbabwe’s forex woes as country fails to even print bank notes.” Agence France Presse, 11 May. North, D. (1990) Institutions, Institutional Change and Economic Performance. Cambridge: Cambridge University Press. OECD. (2003) African Economic Outlook 2002/2003- Country Studies: Zimbabwe. Paris: OECD Headquarters. OECD. (2004) African Economic Outlook 2003/2004- Country Studies: Zimbabwe. Paris: OECD Headquarters. Otani, I. and D. Villanueva. (1989) “Major determinants of long-term growth in LDCs.” Finance & Development, 26 (3): 41-44.

34
Prince, S. (1998)“Deforestation and Degradation in Central and Southern Africa.” Working paper. Department of Geography, University of Maryland. Satellite photos can be seen at: http://www.geog.umd.edu/LGRSS/Projects/degradation.html
Richardson, C. (2004) The Collapse of Zimbabwe in the Wake of the 2000-2003 Land Reforms. Lewiston: The Edwin Mellen Press. Romer, P. (1986) “Increasing Returns and Economic Growth.” Journal of Political Economy (95): 1002-1037.
Rosenberg, N. (1994) Exploring The Black Box: Technology, Economics and History. Cambridge: Oxford University Press. Rugube, L. and Chambati W. (2001) “Land Redistribution in Zimbabwe: Five Census Surveys of Farmland Transactions, 1996-2000.” Working paper. Madison: The Land Tenure Center, University of Wisconsin. Available at: (http://www.ies.wisc.edu/ltc/live/bassaf0107a.pdf.). Scully, G. (1988) The Institutional Framework and Economic Development.” Journal of Political Economy (96): 652-62.
Smith, A. (1937) An Inquiry into the Nature and Origins of the Wealth of Nations. New York: Modern Library. Solow, Robert M. (1956) “A Contribution to the Theory of Economic Growth”. Quarterly Journal of Economics 70: 65-94.
Thondlana, B. (2002) “Foreign currency deficit hits $660 million.” The Zimbabwean Independent, 13 December. Thurow, R. (2003) “Once a Breadbasket, Zimbabwe Today Can’t Feed Itself.” Wall Street Journal, 24 December: A1. Torstennson, J. (1994) “Property Rights and Economic Growth: An Empirical Study.” Kyklos 472.
United Nations. (2004) “Revised Consolidated Appeal for Zimbabwe-Humanitarian Appeal (http://www.un.org/Depts/ocha/cap/zimbabwe.html). Usman, I (2003) “Statement by Ismaila Usman, Executive Director for Zimbabwe.” Article IV Report, Zimbabwe: International Monetary Fund. Utting, P. (1996) Bosques, sociedad y poder. Managua, Universidad Centroamericana (UCA).

35
World Bank. (2002) World Development Indicators. Washington, D.C.: The World Bank.