Embed Size (px)
Citation preview

51
1.2:
Sus
tain
able
Com
petit
iven
ess
CHAPTER 1.2
The Long-Term View: Developing a Framework for Assessing Sustainable CompetitivenessJENNIFER BLANKE
ROBERTO CROTTI
MARGARETA DRZENIEK HANOUZ
BRINDUSA FIDANZA
THIERRY GEIGER
World Economic Forum
For more than three decades, the World Economic Forum has been studying the concept of competitive-ness, defined as the set of institutions, policies, and factors that determine the level of productivity of a country, in an effort to understand and measure the drivers of eco-nomic prosperity. The goal of this work is to provide diagnostic tools that indicate the areas of strength upon which economies can build as well as the chal-lenges that must be overcome in order to increase national competitiveness. Over the years the Forum has adapted and updated its approach as the research and thinking on the topic has evolved. Integrating the latest concepts into the Forum’s work has ensured that it remains highly relevant in the ever-changing global economic context.
The concept of sustainability, along with a sense of urgency about its achievement, have recently cap-tured the attention of policymakers, business leaders, and the public at large. Sustainable development can be Sustainable development can be Sustainable developmentbroadly defined as development that satisfies the needs of the present without compromising the ability of future genera-tions to meet their own needs.1 A commonly used conven-tion stipulates that being sustainable requires the ability to meet society’s economic, social, and environmental needs.2
The literature on sustainability and its measure-ment is vast and growing rapidly. Several efforts have been made over recent decades to devise methods to capture the concept of sustainability. One such effort is triple bottom line accounting, which emerged in the 1980s in an attempt to expand the traditional report-ing framework to take into account environmental and social performance as well as financial or economic performance.3 Another effort can be seen in the work of the Commission on the Measurement of Economic Performance and Social Progress, led by Joseph Stiglitz, Amartya Sen, and Jean-Paul Fitoussi. The Stiglitz-Sen-Fitoussi commission made a remarkable attempt to open a new path for assessing the measure-ment of economic performance, one that embraces the ambition of going “beyond measures of market activ-ity to measure wellbeing.”4
In addition, some progress has been made toward measuring many of the environmental aspects of sus-tainability. These include the broad effort to mea-sure net domestic product—the economic output that considers the capital that has been consumed, such as the depreciation of cars, housing, and machinery, for example. This measure is seen as a better gauge of sus-tainability than gross domestic product (which con-siders only the market value of the goods and services produced and does not take into account what they consume on the way to producing that value) because it accounts for the depreciation of physical capital.
The authors would like to thank Chloé Langevin-Bourdon and Marc Levy for their critical input into the work presented in this chapter.
The Global Competitiveness Report 2011-2012 © 2011 World Economic Forum
52
1.2:
Sus
tain
able
Com
petit
iven
ess
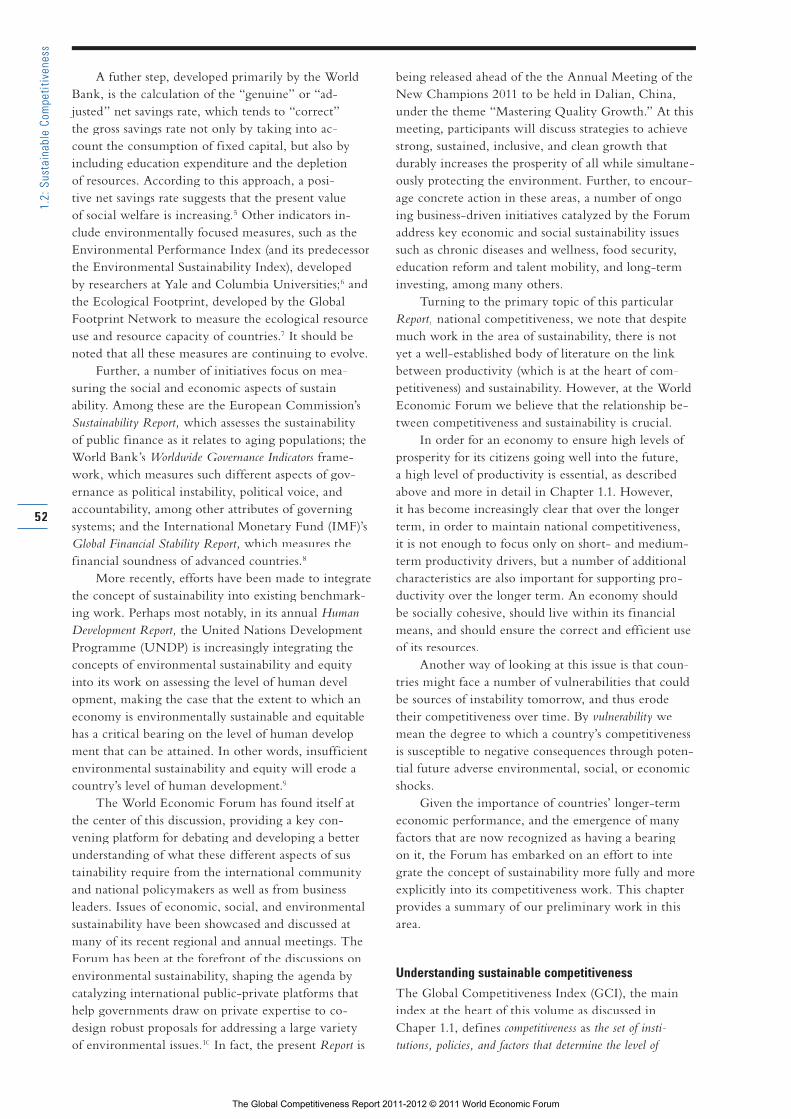
A futher step, developed primarily by the World Bank, is the calculation of the “genuine” or “ad-justed” net savings rate, which tends to “correct” the gross savings rate not only by taking into ac-count the consumption of fixed capital, but also by including education expenditure and the depletion of resources. According to this approach, a posi-tive net savings rate suggests that the present value of social welfare is increasing.5 Other indicators in-clude environmentally focused measures, such as the Environmental Performance Index (and its predecessor the Environmental Sustainability Index), developed by researchers at Yale and Columbia Universities;6 and the Ecological Footprint, developed by the Global Footprint Network to measure the ecological resource use and resource capacity of countries.7 It should be noted that all these measures are continuing to evolve.
Further, a number of initiatives focus on mea-suring the social and economic aspects of sustain-ability. Among these are the European Commission’s Sustainability Report, which assesses the sustainability of public finance as it relates to aging populations; the World Bank’s Worldwide Governance Indicators frame-work, which measures such different aspects of gov-ernance as political instability, political voice, and accountability, among other attributes of governing systems; and the International Monetary Fund (IMF)’s Global Financial Stability Report, which measures the financial soundness of advanced countries.8
More recently, efforts have been made to integrate the concept of sustainability into existing benchmark-ing work. Perhaps most notably, in its annual Human Development Report, the United Nations Development Programme (UNDP) is increasingly integrating the concepts of environmental sustainability and equity into its work on assessing the level of human devel-opment, making the case that the extent to which an economy is environmentally sustainable and equitable has a critical bearing on the level of human develop-ment that can be attained. In other words, insufficient environmental sustainability and equity will erode a country’s level of human development.9
The World Economic Forum has found itself at the center of this discussion, providing a key con-vening platform for debating and developing a better understanding of what these different aspects of sus-tainability require from the international community and national policymakers as well as from business leaders. Issues of economic, social, and environmental sustainability have been showcased and discussed at many of its recent regional and annual meetings. The Forum has been at the forefront of the discussions on environmental sustainability, shaping the agenda by catalyzing international public-private platforms that help governments draw on private expertise to co-design robust proposals for addressing a large variety of environmental issues.10 In fact, the present Report is Report is Report
being released ahead of the the Annual Meeting of the New Champions 2011 to be held in Dalian, China, under the theme “Mastering Quality Growth.” At this meeting, participants will discuss strategies to achieve strong, sustained, inclusive, and clean growth that durably increases the prosperity of all while simultane-ously protecting the environment. Further, to encour-age concrete action in these areas, a number of ongo-ing business-driven initiatives catalyzed by the Forum address key economic and social sustainability issues such as chronic diseases and wellness, food security, education reform and talent mobility, and long-term investing, among many others.
Turning to the primary topic of this particular Report, national competitiveness, we note that despite much work in the area of sustainability, there is not yet a well-established body of literature on the link between productivity (which is at the heart of com-petitiveness) and sustainability. However, at the World Economic Forum we believe that the relationship be-tween competitiveness and sustainability is crucial.
In order for an economy to ensure high levels of prosperity for its citizens going well into the future, a high level of productivity is essential, as described above and more in detail in Chapter 1.1. However, it has become increasingly clear that over the longer term, in order to maintain national competitiveness, it is not enough to focus only on short- and medium-term productivity drivers, but a number of additional characteristics are also important for supporting pro-ductivity over the longer term. An economy should be socially cohesive, should live within its financial means, and should ensure the correct and efficient use of its resources.
Another way of looking at this issue is that coun-tries might face a number of vulnerabilities that could be sources of instability tomorrow, and thus erode their competitiveness over time. By vulnerability we mean the degree to which a country’s competitiveness is susceptible to negative consequences through poten-tial future adverse environmental, social, or economic shocks.
Given the importance of countries’ longer-term economic performance, and the emergence of many factors that are now recognized as having a bearing on it, the Forum has embarked on an effort to inte-grate the concept of sustainability more fully and more explicitly into its competitiveness work. This chapter provides a summary of our preliminary work in this area.
Understanding sustainable competitivenessThe Global Competitiveness Index (GCI), the main index at the heart of this volume as discussed in Chaper 1.1, defines competitiveness as the set of insti-tutions, policies, and factors that determine the level of
The Global Competitiveness Report 2011-2012 © 2011 World Economic Forum

53
1.2:
Sus
tain
able
Com
petit
iven
ess
productivity of a country. The GCI is a comprehensive index that takes into account 12 pillars, or drivers, of competitiveness: institutions, infrastructure, macro-economic environment, health and primary education, higher education and training, goods market effi-ciency, labor market efficiency, financial market devel-opment, technological readiness, market size, business sophistication, and innovation. With regard to a time horizon, the GCI considers the drivers of productivity that are important over the short to medium term.
In overlaying a sustainability perspective with the GCI approach, it becomes apparent that some drivers do not matter significantly in the shorter term—and are therefore not accounted for in the GCI—but are nevertheless important over the longer term and there-fore essential from a sustainability perspective. In this light, it is necessary to integrate concepts that correct for situations that might have no negative impact on productivity, or might even enhance it in the short term, but that are not sustainable or are even detri-mental in the longer run.
It is important to note that there is a body of liter-ature that suggests that when resources become scarcer, economic agents automatically adjust their consump-tion and production patterns in response to chang-ing social dynamics, resource availability, and relative prices. For instance, drawing on Robert Solow’s work, the Commission on Geosciences, Environment and Resources described how “lost natural assets may be compensated for by other natural assets. For example, if a given industry is dependent on some particular re-source which becomes increasingly scarce, it is possible that the industrial processes may be reconfigured to rely on some alternative material or process.”11
According to this view, little attention needs to be paid to conserving and managing resources, and efforts should be devoted primarily to pricing assets at their proper value. However, because some market failures are inevitable, we have taken a different approach and make several important assumptions. First, we assume that some resources (for example, water) are not sub-stitutable. We also assume, based on the vast public goods literature,12 that markets alone may lead to the sub-optimal allocation and usage of those non-substi-tutable resources. Of course, it is very possible that in the future markets will indeed assign a price that is in line with the actual value of these factors. However, even those future market prices may not guarantee that the consumption of such resources is compatible with both high economic productivity and human prosperity. The goal in this work is therefore to delin-eate some of the areas that we believe will eventually become clear areas of vulnerability; in this way we can avoid being blindsided by the sudden realization of a vulnerability, or even prevent its occurrence. In the meantime, integrating the concept of sustainability into our competitiveness work signals to stakeholders
that they should consider social, economic, and envi-ronmental factors as well as more traditional ones in their competitiveness strategies.
As mentioned above, the conversation on sustain-able competitiveness can also be cast in the light of longer-term vulnerabilities. Discussions to date have identified a number of potential areas of vulnerability for national competitiveness. A first relates to human capital and incorporates individual factors such as de-mographics, social cohesion, and the degree of politi-cal freedom in a country. These elements could point to vulnerabilities embedded in a political or social situation that is unsustainable because the population is challenged by a lack of civil and political rights, weak socio-economic rights, or excessive inequality. For example, in some countries involved in what has come to be known as the Arab Spring of 2011, the presence of an educated but unemployed young popu-lation that had limited official outlets through which to express their frustration was instrumental in bring-ing about revolution and political change. While the denouement of the political transition has the potential to raise the competitiveness of these countries going forward, it is also clear that prior to the Arab Spring, the lack of social cohesion was a serious vulnerability for the existing economic structure.
A second area of vulnerability relates to aspects of the markets that are not sustainable. For example, markets that encourage the buildup of unsustainable private debt and bubbles, as seen numerous times in history—most recently in the form of the subprime mortgage crisis—can invite massive repercussions for the global financial and economic system, and there-fore for national competitiveness, both in the shorter and longer terms.
Finally, a number of environmental elements are critical over the longer term. In particular, the way that the physical environment is managed can have a serious impact on future productivity. The extent to which it is well managed can be measured by factors such as the efficient use of resources and, more gener-ally, by environmental quality. Countries that do not properly manage their environmental assets face direct risks to the productivity of their human resources base by damaging the health of the workforce. For exam-ple, it has been demonstrated by a climate–air pollu-tion model that fossil fuel CO2 increases surface ozone, carcinogens, and particulate matter; the result is an increase in asthma, hospitalization, cancer, and death rates. According to this study there is an actual causal link between air pollution and the increase in deaths brought about by respiratory illnesses, not simply a correlation.13
These longer-term issues of resource management and areas of vulnerability are not accounted for in the GCI, but it would be important to include them when measuring sustainable competitiveness.
The Global Competitiveness Report 2011-2012 © 2011 World Economic Forum

54
1.2:
Sus
tain
able
Com
petit
iven
ess
but it also integrates a number of additional concepts that are particularly important over the longer term (e.g., demographics, social cohesion, and environmen-tal stewardship). The resulting broader index provides a deeper understanding of the drivers of longer-term sustainable competitiveness while retaining the time-series data of the Forum’s well-established GCI.
In this way, the GCI can be seen as presenting a short- to medium-term view of the future, while the SCI presents the longer-term view, looking to 20 years ahead. Such an approach makes it possible to highlight the relationship between competitiveness and sustain-ability while isolating its shorter- and longer-term ef-ability while isolating its shorter- and longer-term ef-ability while isolating its shorter- and longer-term effects. It also makes it possible to compare and contrast those countries that are preparing well not only for a short- to medium-term future, but also for the longer term, and those that are proving less adept at doing so.
In order to ensure that this issue is approached in a comprehensive way, the World Economic Forum has created a high-level Advisory Board on Sustainability and Competitiveness to provide guidance and input into the process. Advisory Board members are drawn
The Sustainable Competitiveness Index: A preliminary approachWith the above concerns in mind, this chapter lays out the Forum’s preliminary thinking about a new index that aims to integrate a number of such factors. The Sustainable Competitiveness Index (SCI), introduced in its preliminary, or beta, version in this chapter, re-f lects the fact that some components of sustainability affect national productivity in the longer run but are not important in the short term. In this light, sustain-able competitiveness is defined as the set of institutions, policies, and factors that determine the level of productivity of a country while ensuring the ability of future generations to meet their own needs.
In other words, the SCI accounts for the elements required to make competitiveness sustainable over the longer run, in economic, social, and environmental terms. Specifically, this new Index maintains almost all of the elements already captured by the GCI, which are important over both the shorter as well as the longer term (e.g., governance, education and health, infrastructure, the functioning of markets, innovation),
Box 1: Advisory Board on Sustainability and Competitiveness
The Advisory Board on Sustainability and Competitiveness The Advisory Board on Sustainability and Competitiveness advises the World Economic Forum on integrating the concept advises the World Economic Forum on integrating the concept of sustainability more fully into of sustainability more fully into The Global Competitiveness The Global Competitiveness Report.Report. The Board’s 13 members are drawn from the network The Board’s 13 members are drawn from the network of Global Agenda Councils (GAC), which is the World Economic of Global Agenda Councils (GAC), which is the World Economic Forum’s knowledge backbone. They represent voices from key Forum’s knowledge backbone. They represent voices from key business sectors, government, and civil society.business sectors, government, and civil society.
•• James Cameron,James Cameron, Founder and Vice-Chairman, Founder and Vice-Chairman, Climate Change Capital, United Kingdom (GAC on Climate Climate Change Capital, United Kingdom (GAC on Climate Change)Change)
•• Dan Esty,Dan Esty, Commissioner, Connecticut Department Commissioner, Connecticut Department of Energy and Environmental Protection, United of Energy and Environmental Protection, United States (GAC on Benchmarking Process)States (GAC on Benchmarking Process)
•• Edwin J. Feulner Jr,Edwin J. Feulner Jr, President, The Heritage Foundation, President, The Heritage Foundation, United States (GAC on Benchmarking Process)United States (GAC on Benchmarking Process)
•• Clément Gignac,Clément Gignac, Minister of Economic Development, Minister of Economic Development, Innovation and Export Trade of Quebec, Canada Innovation and Export Trade of Quebec, Canada (GAC on Competitiveness)(GAC on Competitiveness)
•• Jeni Klugman,Jeni Klugman, Director, Gender and Development, World Director, Gender and Development, World Bank, United States (GAC on Benchmarking Process)Bank, United States (GAC on Benchmarking Process)
•• Hans-Juergen Matern,Hans-Juergen Matern, Vice-President, Head of Strategic Vice-President, Head of Strategic Quality Management, METRO GROUP, Germany (GAC on Quality Management, METRO GROUP, Germany (GAC on Ocean Governance)Ocean Governance)
•• John McArthur,John McArthur, Chief Executive Officer and Executive Chief Executive Officer and Executive Director of Millennium Promise, United States (GAC on Director of Millennium Promise, United States (GAC on Benchmarking Process)Benchmarking Process)
•• Kevin X. Murphy,Kevin X. Murphy, President and Chief Executive President and Chief Executive Officer, J.E. Austin Associates, United States Officer, J.E. Austin Associates, United States (GAC on Competitiveness)(GAC on Competitiveness)
•• Mari Elka Pangestu,Mari Elka Pangestu, Minister of Trade of Indonesia (GAC Minister of Trade of Indonesia (GAC on Competitiveness)on Competitiveness)
•• Luis Guillermo Plata,Luis Guillermo Plata, Chief Executive Officer, Chief Executive Officer, The Cornerstone Group, Colombia (GAC on The Cornerstone Group, Colombia (GAC on Competitiveness)Competitiveness)
•• Xavier Sala-i-Martin,Xavier Sala-i-Martin, Professor, Economics Department, Professor, Economics Department, Columbia University, United States Columbia University, United States (GAC on Competitiveness)(GAC on Competitiveness)
•• Mark Spelman,Mark Spelman, Global Head of Strategy, Accenture, United Global Head of Strategy, Accenture, United Kingdom (GAC on Competitiveness)Kingdom (GAC on Competitiveness)
•• Simon Zadek,Simon Zadek, Senior Visiting Fellow, Global Green Growth Senior Visiting Fellow, Global Green Growth Institute, Switzerland (GAC on Sustainable Consumption)Institute, Switzerland (GAC on Sustainable Consumption)
Board members have participated in a number of meetBoard members have participated in a number of meet--ings and conference calls over the past year to develop the ings and conference calls over the past year to develop the preliminary concept presented in this chapter. The Board’s work preliminary concept presented in this chapter. The Board’s work will continue over the coming year, during which time the conwill continue over the coming year, during which time the con--cept will be refined and adapted to incorporate feedback from cept will be refined and adapted to incorporate feedback from experts and the public at large.experts and the public at large.
The Global Competitiveness Report 2011-2012 © 2011 World Economic Forum

55
1.2:
Sus
tain
able
Com
petit
iven
ess
from the Forum’s network of Global Agenda Councils, and represent the perspectives of leaders from gov-ernment, business, academia, and civil society. The Advisory Board has worked closely with the World Economic Forum over the past year to develop the ap-proach described in this chapter. Box 1 provides more details on its composition.
Sustainable competitiveness is a nacent area of research, and our initial work has shown that many of the data for measuring key concepts are not yet avail-able. We therefore recognize that the effort to prop-erly capture the concept of sustainable competitiveness through reliable indicators that can be gathered for a large number of countries will require a multi-year effort. However, with the goals of contributing to the discourse about the drivers of sustainable competitive-neness, and also of encouraging feedback at this early stage that can serve as input for refining and further developing the concept, the World Economic Forum has decided to release the preliminary results of this evolving work in the present volume.
The structure of the SCI is presented in Figure 1. As noted earlier, it retains most of the elements of the GCI, while recognizing that the present GCI is miss-ing some factors that matter over the longer term. For this reason, the indicators that compose the SCI have been reorganized to highlight a number of areas where long-term vulnerabilities may manifest themselves, as discussed above.
As Figure 1 shows, all of the 12 pillars of the GCI, as described in Chapter 1.1, have been retained in the SCI, but here they are reorganized into a frame-work of five subindexes that makes it possible to high-light the new elements that are critical over the longer term. The five subindexes are human capital, market conditions, technology and innovation, policy envi-ronment and enabling conditions, and the physical environment. To this reorganized framework we have added a number of entirely new categories that capture areas that are important over the longer term: social
cohesion, environmental policy, resource efficiency, management of renewable resources, and environmen-tal degradation. As well as adding these new pillars, each composed of a number of individual variables described below, we have included or modified a small number of individual variables within the more famil-iar pillars originating in the GCI in order to provide an index that is more appropriate to gauging sustain-ability aspects of competitiveness.14
What follows is a description of the organization of the SCI, by subindex, with particular emphasis on the indicators that are new to this Index. In selecting new indicators we have given priority to those that can be affected by actions, rather than those that sim-ply represent natural endowments.
Subindex 1: Human capitalHigh-quality human capital is a critical driver of pro-ductivity over the shorter as well as the longer term. Today’s globalizing economy requires countries to nurture pools of healthy and well-educated workers who are able to adapt rapidly to their changing en-vironment and the evolving needs of the production system. These aspects of health and education are al-ready included in the GCI because they are important for both the short- and longer-term productivity of economies worldwide.
A key feature of human capital over the longer term that is not part of the GCI is that of changing demographics. On the one hand, some countries—particularly in the developing world—have young populations with the potential to contribute to pro-ductivity and to support the non-working population, most notably those who have retired from the work-force, for years to come. On the other hand, a number of advanced economies—including Japan and several European countries—are characterized by aging popu-lations and relatively low fertility rates, which means
HumanHumancapitalcapital
• Healthandprimaryeducation
• Higher• Higher educationeducationand trainingand training
• Socialcohesion
MarketMarketconditionsconditions
• Labor• Labor marketmarketefficiencyefficiency
• Financial• Financial marketmarketdevelopmentdevelopment
• Market• Market sizesize• Goods• Goods marketmarket
efficiencyefficiency
Technology Technology and innovationand innovation
• Technological• Technologicalreadinessreadiness
• Business• Businesssophistication sophistication
• Innovation• Innovation
Policy environment Policy environment and enabling conditionsand enabling conditions
• Institutions• Institutions• Infrastructure• Infrastructure• Macroeconomic
environment• Environmental
policy
Physical environment
• Resource efficiency
• Managementof renewable resources
• Environmentaldegradation
Figure 1: The Sustainable Competitiveness Index framework
Notes: See Appendix A for the detailed structure of the SCI and Appendix B for the definitions and sources of its additional variables. The pillars that incorporate variables not already included in the GCI are highlighted in blue in this figure.
The Global Competitiveness Report 2011-2012 © 2011 World Economic Forum
56
1.2:
Sus
tain
able
Com
petit
iven
ess
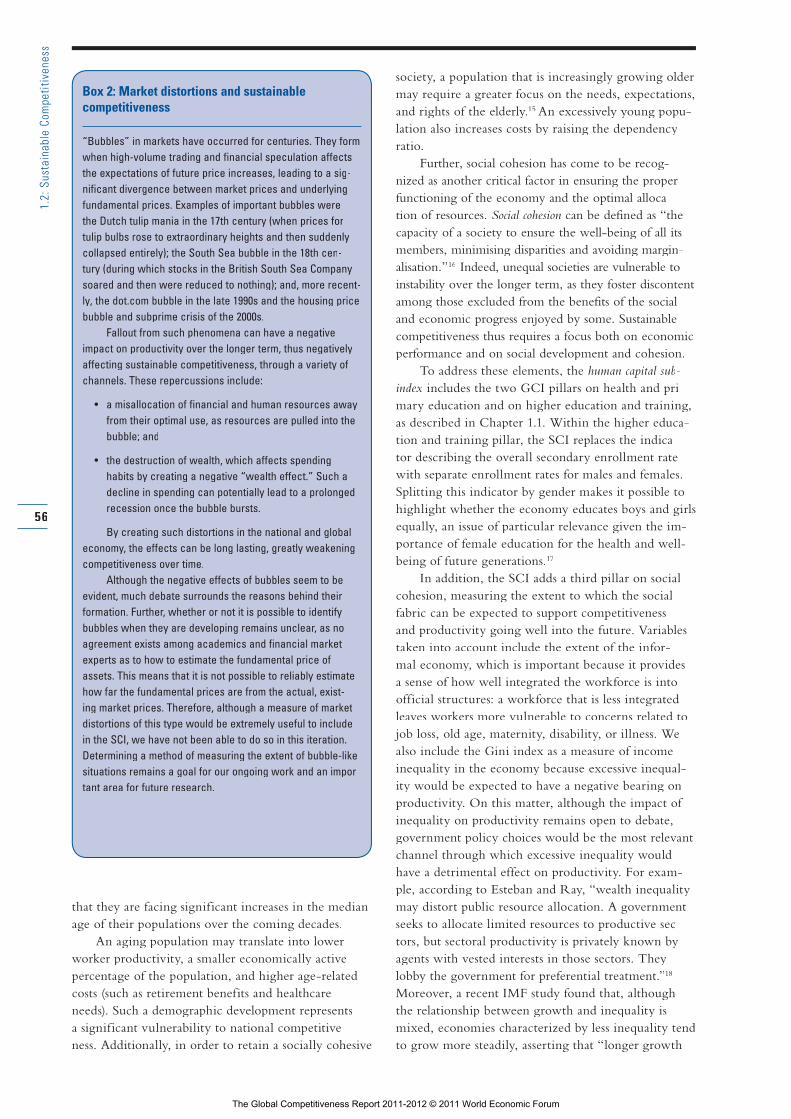
that they are facing significant increases in the median age of their populations over the coming decades.
An aging population may translate into lower worker productivity, a smaller economically active percentage of the population, and higher age-related costs (such as retirement benefits and healthcare needs). Such a demographic development represents a significant vulnerability to national competitive-ness. Additionally, in order to retain a socially cohesive
society, a population that is increasingly growing older may require a greater focus on the needs, expectations, and rights of the elderly.15 An excessively young popu-lation also increases costs by raising the dependency ratio.
Further, social cohesion has come to be recog-nized as another critical factor in ensuring the proper functioning of the economy and the optimal alloca-tion of resources. Social cohesion can be defined as “the capacity of a society to ensure the well-being of all its members, minimising disparities and avoiding margin-alisation.”16 Indeed, unequal societies are vulnerable to instability over the longer term, as they foster discontent among those excluded from the benefits of the social and economic progress enjoyed by some. Sustainable competitiveness thus requires a focus both on economic performance and on social development and cohesion.
To address these elements, the human capital sub-index includes the two GCI pillars on health and pri-mary education and on higher education and training, as described in Chapter 1.1. Within the higher educa-tion and training pillar, the SCI replaces the indica-tor describing the overall secondary enrollment rate with separate enrollment rates for males and females. Splitting this indicator by gender makes it possible to highlight whether the economy educates boys and girls equally, an issue of particular relevance given the im-portance of female education for the health and well-being of future generations.17
In addition, the SCI adds a third pillar on social cohesion, measuring the extent to which the social fabric can be expected to support competitiveness and productivity going well into the future. Variables taken into account include the extent of the infor-mal economy, which is important because it provides a sense of how well integrated the workforce is into official structures: a workforce that is less integrated leaves workers more vulnerable to concerns related to job loss, old age, maternity, disability, or illness. We also include the Gini index as a measure of income inequality in the economy because excessive inequal-ity would be expected to have a negative bearing on productivity. On this matter, although the impact of inequality on productivity remains open to debate, government policy choices would be the most relevant channel through which excessive inequality would have a detrimental effect on productivity. For exam-ple, according to Esteban and Ray, “wealth inequality may distort public resource allocation. A government seeks to allocate limited resources to productive sec-tors, but sectoral productivity is privately known by agents with vested interests in those sectors. They lobby the government for preferential treatment.”18
Moreover, a recent IMF study found that, although the relationship between growth and inequality is mixed, economies characterized by less inequality tend to grow more steadily, asserting that “longer growth
Box 2: Market distortions and sustainable competitiveness
“Bubbles” in markets have occurred for centuries. They form “Bubbles” in markets have occurred for centuries. They form when high-volume trading and financial speculation affects when high-volume trading and financial speculation affects the expectations of future price increases, leading to a sigthe expectations of future price increases, leading to a sig--nificant divergence between market prices and underlying nificant divergence between market prices and underlying fundamental prices. Examples of important bubbles were fundamental prices. Examples of important bubbles were the Dutch tulip mania in the 17th century (when prices for the Dutch tulip mania in the 17th century (when prices for tulip bulbs rose to extraordinary heights and then suddenly tulip bulbs rose to extraordinary heights and then suddenly collapsed entirely); the South Sea bubble in the 18th cencollapsed entirely); the South Sea bubble in the 18th cen--tury (during which stocks in the British South Sea Company tury (during which stocks in the British South Sea Company soared and then were reduced to nothing); and, more recentsoared and then were reduced to nothing); and, more recent--ly, the dot.com bubble in the late 1990s and the housing price ly, the dot.com bubble in the late 1990s and the housing price bubble and subprime crisis of the 2000s.bubble and subprime crisis of the 2000s.
Fallout from such phenomena can have a negative Fallout from such phenomena can have a negative impact on productivity over the longer term, thus negatively impact on productivity over the longer term, thus negatively affecting sustainable competitiveness, through a variety of affecting sustainable competitiveness, through a variety of channels. These repercussions include:channels. These repercussions include:
•• a misallocation of financial and human resources away a misallocation of financial and human resources away from their optimal use, as resources are pulled into the from their optimal use, as resources are pulled into the bubble; andbubble; and
•• the destruction of wealth, which affects spending the destruction of wealth, which affects spending habits by creating a negative “wealth effect.” Such a habits by creating a negative “wealth effect.” Such a decline in spending can potentially lead to a prolonged decline in spending can potentially lead to a prolonged recession once the bubble bursts.recession once the bubble bursts.
By creating such distortions in the national and global By creating such distortions in the national and global economy, the effects can be long lasting, greatly weakening economy, the effects can be long lasting, greatly weakening competitiveness over time.competitiveness over time.
Although the negative effects of bubbles seem to be Although the negative effects of bubbles seem to be evident, much debate surrounds the reasons behind their evident, much debate surrounds the reasons behind their formation. Further, whether or not it is possible to identify formation. Further, whether or not it is possible to identify bubbles when they are developing remains unclear, as no bubbles when they are developing remains unclear, as no agreement exists among academics and financial market agreement exists among academics and financial market experts as to how to estimate the fundamental price of experts as to how to estimate the fundamental price of assets. This means that it is not possible to reliably estimate assets. This means that it is not possible to reliably estimate how far the fundamental prices are from the actual, existhow far the fundamental prices are from the actual, exist--ing market prices. Therefore, although a measure of market ing market prices. Therefore, although a measure of market distortions of this type would be extremely useful to include distortions of this type would be extremely useful to include in the SCI, we have not been able to do so in this iteration. in the SCI, we have not been able to do so in this iteration. Determining a method of measuring the extent of bubble-like Determining a method of measuring the extent of bubble-like situations remains a goal for our ongoing work and an imporsituations remains a goal for our ongoing work and an impor--tant area for future research.tant area for future research.
The Global Competitiveness Report 2011-2012 © 2011 World Economic Forum

57
1.2:
Sus
tain
able
Com
petit
iven
ess
spells are robustly associated with more equality in the income distribution.”19
A third measure included in the social cohesion pillar is the extent of youth unemployment. High unemployment of the younger population not only limits future productivity by preventing their smooth start into productive employment, but also—particu-larly when combined with relatively high educational attainment rates and inefficient goods and labor mar-kets—can place significant pressure on existing social structures, with sometimes violent results.
Finally, we include the expected dependency ratio in the year 2030, which provides a sense of how demographic trends can be expected to weaken com-petitiveness over the next two decades in some coun-tries. Some research has shown that a country with a population that is excessively old or excessively young tends to be less productive than a country with a more balanced population, particularly one with a strong cohort of workers in their 40s. As 20 years is approxi-mately the time required to shape the age strucuture of the workforce, we have taken projections to 2030.
Subindex 2: Market conditionsThe proper functioning of markets ensures that goods, labor, and financial capital are allocated in the most productive manner and put to the best possible use. As discussed in Chapter 1.1, there is a vast literature showing the adverse effects of market distortions on the efficient functioning of the economy and the wel-fare of its population. In the case of goods markets, the main vehicle for achieving market efficiency is maintaining a healthy level of competition for prod-ucts and services while keeping economic distortions to a minimum. In the case of labor markets, efficiency and f lexibility are critical for ensuring that workers are allocated to their best use in the economy. In addition, well-developed financial markets ensure that available capital is invested in the most efficient and productive way, providing firms with access to the capital they need to expand their business activities. Further, the size of the market affects productivity since large mar-kets allow firms to exploit economies of scale, both through their domestic market and through foreign markets via trade.
The market conditions subindex is composed of the pillars from the GCI that measure the efficiency of the goods, labor, and financial markets as well as market size. Although we plan to include a measure of mar-ket distortions, such as asset price bubbles, within the financial market development pillar of this subindex in the future, a lack of current relevant data has made this impossible at the present stage. Box 2 outlines how such market distortions have a negative impact on sustainable competitiveness. For this preliminary ver-sion of the SCI, this subindex is therefore composed entirely of elements also included in the GCI, which
are critical for both shorter- and longer-term national productivity and competitiveness.
Subindex 3: Technology and innovationAs described in Chapter 1.1, technological adoption and the ability to innovate are critical competitiveness drivers that have both become important elements for firms to compete and prosper, and that will remain important going into the future. Those economies that are innovative and that harness the latest technologies will be better able to adjust to the rapidly changing global economy and confront future vulnerabilities. It is these economies that will be best able to sustain their competitiveness.
The technology and innovation subindex includes three key pillars from the GCI: technological readi-ness, business sophistication, and innovation, as these represent both short- and longer-term drivers of com-petitiveness. No specific indicators related to “green technologies” have been integrated because we con-sider that countries that are highly innovative will be those that move toward the most appropriate innova-tions and technologies going forward, which will also likely include green technologies.
Subindex 4: Policy environment and enabling conditionsThe policy environment as well as the physical and macroeconomic infrastructure of economies are criti-cal for ensuring a level playing field, providing much of the backbone on which economies are constructed. The policy environment—which includes overall gov-ernance, judicial structures, security, and environmen-tal stewardship as well as sound macroeconomic man-agement—has a bearing on the level of trust among economic actors in the national business environment and the organization of the elements of production; it also inf luences investment decisions (Box 3 provides a discussion of the intertemporal nature of investment). For its part, well-developed physical infrastructure re-duces the effect of distance between regions, integrat-ing the national market and connecting it at low cost to markets in other countries and regions. In addition, the quality and extensiveness of infrastructure net-works have a substantial impact on economic growth and reduce income inequalities and poverty, all with significant implications for sustainable competitiveness.
The policy environment and enabling conditions subin-dex includes three pillars from the GCI: institutions, infrastructure, and the macroeconomic environment. Within the macroeconomic environment pillar, we have made two adjustments to increase its relevance to productivity in the longer term. First, we have removed the inf lation rate, because this is a phenom-enon that is not persistent over time. Second, we have replaced the annual government budget deficit with a five-year average, in order to better capture longer-run fiscal management soundness.
The Global Competitiveness Report 2011-2012 © 2011 World Economic Forum

58
1.2:
Sus
tain
able
Com
petit
iven
ess
Box 3: Sustainability and the financial system
JAMES CAMERON AND BEN CALDECOTT, Climate Change Capital
Environmental sustainability can affect the financial system and Environmental sustainability can affect the financial system and thus the competitiveness of economies in a number of different thus the competitiveness of economies in a number of different ways. These include reducing exposure to volatile commodity ways. These include reducing exposure to volatile commodity prices, minimizing the risks of dangerous climate change on prices, minimizing the risks of dangerous climate change on portfolios, enhancing political stability, and protecting the value portfolios, enhancing political stability, and protecting the value of ecosystem services that underpin investments.of ecosystem services that underpin investments.
Of the effects that greater environmental sustainability Of the effects that greater environmental sustainability can have on the financial system, two in particular stand out as can have on the financial system, two in particular stand out as having a bearing on future economic competitiveness, although having a bearing on future economic competitiveness, although they remain poorly understood. The first is the systemic risk they remain poorly understood. The first is the systemic risk in financial systems that is created by an overexposure to in financial systems that is created by an overexposure to unsustainable investments as we move to a sustainable global unsustainable investments as we move to a sustainable global economy. The second concerns the need for a longer-term and economy. The second concerns the need for a longer-term and more holistic approach to financing sustainable assets.more holistic approach to financing sustainable assets.
Systemic risk from unsustainable investmentsSystemic risk from unsustainable investmentsThe transition to a sustainable global economy is a necessity. The transition to a sustainable global economy is a necessity. Nevertheless, it will be a complex and challenging process, Nevertheless, it will be a complex and challenging process, with significant value being created, and other value being with significant value being created, and other value being destroyed. The process of value creation and destruction could destroyed. The process of value creation and destruction could have significant implications for national and international have significant implications for national and international financial systems, and consequently on the competitiveness of financial systems, and consequently on the competitiveness of economies.economies.
In this context, the depth and breadth of current finanIn this context, the depth and breadth of current finan--cial exposure to high-carbon, extractive, and environmentally cial exposure to high-carbon, extractive, and environmentally unsustainable investments could become a major problem as unsustainable investments could become a major problem as we transition to a sustainable global economy. In the United we transition to a sustainable global economy. In the United Kingdom, for example, five of the top ten FTSE 100 companies Kingdom, for example, five of the top ten FTSE 100 companies are almost exclusively high carbon, and alone they account are almost exclusively high carbon, and alone they account for 25 percent of that index’s entire market capitalization. This for 25 percent of that index’s entire market capitalization. This exposure is likely to be replicated in other indexes, by compaexposure is likely to be replicated in other indexes, by compa--nies, in bank loan books, and in the strategic asset allocation nies, in bank loan books, and in the strategic asset allocation decisions taken by institutional investors.decisions taken by institutional investors.
As a result, if policy, technology, and markets work consisAs a result, if policy, technology, and markets work consis--tently to reduce returns in environmentally unsustainable areas tently to reduce returns in environmentally unsustainable areas while supporting sustainable ones, investing in high-carbon or while supporting sustainable ones, investing in high-carbon or extractive industries—say as an institutional investor looking extractive industries—say as an institutional investor looking to generate good long-term returns—could result in underto generate good long-term returns—could result in under--performing or even stranded assets. Despite this, institutional performing or even stranded assets. Despite this, institutional investors, as well as banks, companies, mutual funds, and retail investors, as well as banks, companies, mutual funds, and retail investors continue to deploy significant amounts of capital into investors continue to deploy significant amounts of capital into unsustainable assets, or into companies with a significant expounsustainable assets, or into companies with a significant expo--sure to those unsustainable assets.sure to those unsustainable assets.
Is this building up trouble for the future? Could it be Is this building up trouble for the future? Could it be another example of capital markets fundamentally mispricanother example of capital markets fundamentally mispric--ing assets and, as a result, building up a systemic risk that ing assets and, as a result, building up a systemic risk that threatens long-term growth? If this proves to be the case, could threatens long-term growth? If this proves to be the case, could economies that reduce their financial exposure to unsustaineconomies that reduce their financial exposure to unsustain--able assets be exposed to less risk and thus gain a competitive able assets be exposed to less risk and thus gain a competitive advantage?advantage?
Longer-term investment decisionsLonger-term investment decisionsThe transition to a sustainable global economy will involve movThe transition to a sustainable global economy will involve mov--ing from an energy system with low capital and high marginal ing from an energy system with low capital and high marginal costs to one with the opposite characteristics—high capital costs to one with the opposite characteristics—high capital and low marginal costs. This reflects the intrinsic nature of and low marginal costs. This reflects the intrinsic nature of renewables: the sun shines and the wind blows for free, but the renewables: the sun shines and the wind blows for free, but the technologies able to capture their energy are capital intensive.technologies able to capture their energy are capital intensive.
As a result, one of the key barriers to deploying renewAs a result, one of the key barriers to deploying renew--ables at the scale and pace necessary is overcoming the chalables at the scale and pace necessary is overcoming the chal--lenges associated with financing high upfront capital costs. lenges associated with financing high upfront capital costs. This is difficult to do, as many investors are driven by the need This is difficult to do, as many investors are driven by the need to deliver returns in the short run and are reluctant to lock to deliver returns in the short run and are reluctant to lock in capital for long, while longer-term investors find it hard to in capital for long, while longer-term investors find it hard to deploy capital into renewables because of their relative market deploy capital into renewables because of their relative market immaturity. Moreover, because renewable projects are capital immaturity. Moreover, because renewable projects are capital intensive, the cost of capital becomes a significant variable in intensive, the cost of capital becomes a significant variable in determining their overall cost. By making renewable projects determining their overall cost. By making renewable projects more attractive to the low-cost capital held by long-term invesmore attractive to the low-cost capital held by long-term inves--tors, such as pension funds and insurance companies, the avertors, such as pension funds and insurance companies, the aver--age cost of capital can be reduced, which in turn can decrease age cost of capital can be reduced, which in turn can decrease the overall cost of renewables. This could generate competitive the overall cost of renewables. This could generate competitive advantages. advantages.
Economies that create mechanisms and instruments for Economies that create mechanisms and instruments for longer-term investors to invest in renewables, and that simullonger-term investors to invest in renewables, and that simul--taneously create regulatory frameworks that value low-risk taneously create regulatory frameworks that value low-risk renewable assets appropriately, can help overcome these barrenewable assets appropriately, can help overcome these bar--riers. By doing so, these economies could more easily attract riers. By doing so, these economies could more easily attract investment in infrastructure assets that are able to reduce investment in infrastructure assets that are able to reduce exposure to volatile fossil fuel prices, while delivering other exposure to volatile fossil fuel prices, while delivering other positive externalities.positive externalities.
Research questionsResearch questionsFor these and other related issues to be reflected in the World For these and other related issues to be reflected in the World Economic Forum’s work on sustainable competitiveness in the Economic Forum’s work on sustainable competitiveness in the future, further research is needed to understand these topics future, further research is needed to understand these topics in more detail. The following are questions that may need to be in more detail. The following are questions that may need to be explored:explored:
•• What is the extent of financial exposure to high-What is the extent of financial exposure to high-carbon, extractive, and environmentally unsustainable carbon, extractive, and environmentally unsustainable investments?investments?
•• How might relative values, between sustainable and How might relative values, between sustainable and unsustainable investments, change over time and how unsustainable investments, change over time and how this might affect different parts of the financial system? To this might affect different parts of the financial system? To what extent could this affect the real economy?what extent could this affect the real economy?
•• What instruments might be designed and deployed What instruments might be designed and deployed to help to restrain the buildup of risk associated with to help to restrain the buildup of risk associated with environmentally unsustainable assets, while encouraging environmentally unsustainable assets, while encouraging investment in more sustainable assets?investment in more sustainable assets?
•• What might we do to create sustainable, low-carbon What might we do to create sustainable, low-carbon alternatives for investors with the right risk-reward alternatives for investors with the right risk-reward profiles?profiles?
The Global Competitiveness Report 2011-2012 © 2011 World Economic Forum

59
1.2:
Sus
tain
able
Com
petit
iven
ess
In addition to these three pillars, a new pillar on environmental policy has been added, with four new indicators that measure the extent to which economies have instituted the types of policies necessary to pro-tect the environment from degradation. In this pillar we measure the stringency of the government’s envi-ronmental regulations in each country as well as the extent to which they are actually enforced. Also in-cluded is a measure of the number of key international environmental treaties, out of a group of 25, in which the country is a participant. The variable indicates the country’s level of engagement with environmental issues and thus its willingness to become involved in international efforts toward addressing global envi-ronmental challenges. Finally, the percentage of land that has been designated as a protected area is also included, providing a measure of national commit-ment to ensuring the protection of natural capital for sustaining competitiveness.
Some statistical evidence in the literature has shown that there is no direct relationship between environmental regulation and competitiveness at the country level.20 For this reason, a normative approach that assumes there may be indirect effects is taken here. We assume that a protected environment has benefits for overall competitiveness through health and ecology advantages that may not be easily measurable.
Subindex 5: Physical environmentA high-quality and well-managed physical environ-ment is critical for sustainable competitiveness through three key channels. First, the efficient use of energy and other resources lowers costs and directly boosts productivity by virtue of making better use of inputs. Second, the efficient management of renewable re-sources (such as wood or fish that can be replenished naturally with the passage of time) ensures that the extraction and use of resources today, such as water and forests, does not come at the expense of the abil-ity to fully use such inputs in the future.21 Third, a high-quality natural environment supports a healthy workforce, avoiding damaging effects on human capi-tal (such as illness and lower human capital productiv-ity) that can be brought about by pollution and other environmental degradation. Environmental degrada-tion can also directly reduce the productivity of sectors such as agriculture, which in turn lowers output and potentially the ability for a country to meet the food needs of the population.22
The physical environment subindex is an entirely new element that has been added to the Forum’s competi-tiveness work. This subindex integrates three pillars that focus on the three channels described above: the efficiency of resources, the management of renewable resources, and the degradation of the environment. The Forum has worked closely with experts at Yale’s Center for Environmental Law and Policy and with
the Center for International Earth Science Information Network (CIESIN) at Columbia University’s Earth Institute to define the best existing indicators to use in this area, and to understand the shortcomings of these data. The measures captured here are meant to complement the analysis carried out through the Environmental Performance Index (EPI) produced by these two organizations, which provides a much more comprehensive indication of national performance on a variety of environmental indicators.
The resource efficiency pillar aims to measure the extent to which countries are using existing resources in an efficient manner, thus directly supporting higher productivity and competitiveness. It is measured through through three variables: the water intensity of agriculture in an economy, which considers the extent to which the agriculture sector is efficient in its use of water; the efficiency of energy use as measured by the economy’s energy output as a percentage of GDP; and the CO2 intensity of energy use at the national level, which measures the emissions of CO2 that result from the consumption of solid fuel in an economy.
The management of renewable resources pillar measures how well countries are faring in terms of ensuring that their resources will continue to be avail-able into the future. The three variables included to capture this concept are the percent of the population who have access to improved drinking water in the country; marine trophic intensity, which considers the extent to which marine fisheries in the country are in-creasing, stable, or declining; and the annual change to the forest cover, measured in the percent of total land area that is afforested (or deforested), over time.
Finally, the environmental degradation pillar captures the extent to which countries are ensuring (or not) a healthy physical environment, thus setting the stage for a healthy and productive workforce and economic sectors going into the future. Here we in-clude pollution measures of both the air (by looking at particulate matter concentration) and water (through the water stress index, which considers the degree of oversubscription of a country’s water supply) in indi-vidual economies.
It is important to note that although some indica-tors that have been included, such as CO2 intensity, provide a sense of national contributions to climate change, at present the decision was taken to not in-clude climate change as a specific factor in the SCI. This is because there is no agreement about how to al-locate emissions to countries—for example, in a world of global markets, should they be allocated to the producing country of the goods that created the emis-sions, or to the consuming country? Also it is not yet clear how contributing to climate change is related to national competitiveness, particularly in the absence of an international agreement that would impose costs on
The Global Competitiveness Report 2011-2012 © 2011 World Economic Forum

60
1.2:
Sus
tain
able
Com
petit
iven
ess
Box 4: Climate change and competitiveness in a global context
Climate change presents a pressing environmental challenge. Climate change presents a pressing environmental challenge. Scientists estimate that an increase in the global average Scientists estimate that an increase in the global average temperature of 2 degrees Celsius (2°C) by 2050 is the threshold temperature of 2 degrees Celsius (2°C) by 2050 is the threshold beyond which there is no longer a measure of assurance that beyond which there is no longer a measure of assurance that we can avoid many negative climate impacts.we can avoid many negative climate impacts.11 Even within a Even within a rise of 2°C, before reaching the precise threshold, a certain rise of 2°C, before reaching the precise threshold, a certain degree of adaptation to climate change will be required in most degree of adaptation to climate change will be required in most parts of the world. To have a reasonable chance of containing parts of the world. To have a reasonable chance of containing warming to 2°C, long-term concentrations of global greenhouse warming to 2°C, long-term concentrations of global greenhouse gas must be stabilized below 450 parts per million (ppm) of gas must be stabilized below 450 parts per million (ppm) of carbon dioxide equivalent (COcarbon dioxide equivalent (CO22e). Achieving this goal demands e). Achieving this goal demands mitigating 17 gigatonnes (Gt) of COmitigating 17 gigatonnes (Gt) of CO22e by 2020, rather than e by 2020, rather than continuing with business as usual.continuing with business as usual.22 In June 2011, the global In June 2011, the global recorded COrecorded CO22 concentration reached 393.69 ppm. concentration reached 393.69 ppm.33
Although uncertainties remain, there has been enough Although uncertainties remain, there has been enough well-founded research about the expected significant impacts well-founded research about the expected significant impacts of climate change to consider them a serious risk to sustained of climate change to consider them a serious risk to sustained growth for many countries. Arguably, these impacts will have growth for many countries. Arguably, these impacts will have major consequences for the more vulnerable, developing counmajor consequences for the more vulnerable, developing coun--tries. As remarked in the tries. As remarked in the Stern Review on the Economics of Stern Review on the Economics of Climate Change,Climate Change, “climate change threatens the basic elements “climate change threatens the basic elements of life for people around the world—access to water, food, of life for people around the world—access to water, food, health, and use of land and the environment. On current trends, health, and use of land and the environment. On current trends, average global temperatures could rise by 2–3°C within the next average global temperatures could rise by 2–3°C within the next fifty years or so, leading to many severe impacts, often medififty years or so, leading to many severe impacts, often medi--ated by water, including more frequent droughts and floods.”ated by water, including more frequent droughts and floods.”44
Among these impacts are falling crop yields, significant Among these impacts are falling crop yields, significant changes in water availability, ecosystem damage, increased changes in water availability, ecosystem damage, increased frequency and intensity of extreme events, a rise of sea level, frequency and intensity of extreme events, a rise of sea level, and so on. These in turn may affect food production, fisheries, and so on. These in turn may affect food production, fisheries, widespread vector-borne diseases, and population migration widespread vector-borne diseases, and population migration and displacement, among other consequences.and displacement, among other consequences.55
The efforts required to mitigate and adapt to climate The efforts required to mitigate and adapt to climate change, as well as the costs of doing so,change, as well as the costs of doing so,66 have been at the have been at the center of international climate change negotiations for many center of international climate change negotiations for many years. The discourse has focused particularly on efficiency, years. The discourse has focused particularly on efficiency, cost-effectiveness—domestic and international—and on equity cost-effectiveness—domestic and international—and on equity and fairness among nations.and fairness among nations.77
However, while there can be many linkages to national However, while there can be many linkages to national competitiveness as described above, given the global nature of competitiveness as described above, given the global nature of the climate challenge it is very difficult to isolate its impact on the climate challenge it is very difficult to isolate its impact on the competitiveness of individual countries. Some of the main the competitiveness of individual countries. Some of the main unresolved issues include:unresolved issues include:
Is there a first-mover advantage?Is there a first-mover advantage?The optimal way to address a collective action problem is to The optimal way to address a collective action problem is to create a global agreement that creates obligations to reduce create a global agreement that creates obligations to reduce carbon emissions for all countries and has an effective carbon emissions for all countries and has an effective enforcement mechanism. In the short term, the United Nations enforcement mechanism. In the short term, the United Nations Framework Convention on Climate Change is still undergoing Framework Convention on Climate Change is still undergoing negotiations and a global treaty has not yet been adopted. In negotiations and a global treaty has not yet been adopted. In the absence of a global treaty, and given the high cost of clean the absence of a global treaty, and given the high cost of clean technologies, it is not at present clear whether there will be a technologies, it is not at present clear whether there will be a first-mover advantage to be gained by countries that take action first-mover advantage to be gained by countries that take action early to mitigate climate change, or if indeed undertaking costly early to mitigate climate change, or if indeed undertaking costly transformation would have a negative effect on productivity. transformation would have a negative effect on productivity. In the context of this assessment, the question of how best to In the context of this assessment, the question of how best to
reconcile activities and policies that lower carbon emissions reconcile activities and policies that lower carbon emissions with an increase in productivity remains.with an increase in productivity remains.
Accounting for tradeAccounting for tradeIn global environmental terms, a ton of COIn global environmental terms, a ton of CO22 emitted is the same emitted is the same wherever it occurs. However, it is estimated that approximately wherever it occurs. However, it is estimated that approximately 25 percent of all CO25 percent of all CO22 emissions from human activities “flow”— emissions from human activities “flow”—meaning they are either imported or exported—from one counmeaning they are either imported or exported—from one coun--try to another. Net importers of embodied carbon emissions try to another. Net importers of embodied carbon emissions include, for example, the United Kingdom (with consumption include, for example, the United Kingdom (with consumption emissions estimated at 34 percent higher than production emissions estimated at 34 percent higher than production emissions), Germany (29 percent), Japan (19 percent) and the emissions), Germany (29 percent), Japan (19 percent) and the United States (13 percent). In 2004, for example, it is estimated United States (13 percent). In 2004, for example, it is estimated that China exported about 23 percent of all its domestically prothat China exported about 23 percent of all its domestically pro--duced COduced CO22..88 From the point of view of its impact on productivity From the point of view of its impact on productivity within national borders, this is particularly difficult to quantify within national borders, this is particularly difficult to quantify because it is not clear whether the responsibility and primary because it is not clear whether the responsibility and primary impact on competitiveness lies with the exporter (the producer) impact on competitiveness lies with the exporter (the producer) or the importer (the consumer), or how to allocate responsibility or the importer (the consumer), or how to allocate responsibility fairly and accurately between the two.fairly and accurately between the two.
Valuing the futureValuing the futureFrom an environmental perspective, it is cumulative emissions, From an environmental perspective, it is cumulative emissions, over time, that have a profound influence on the maximum over time, that have a profound influence on the maximum increase of temperature in the atmosphere.increase of temperature in the atmosphere.99 Consequently, the Consequently, the impacts of climate change will continue to intensify the longer impacts of climate change will continue to intensify the longer the world squanders in inaction. In 2006, the the world squanders in inaction. In 2006, the Stern ReviewStern Review con conStern ReviewStern Review conStern ReviewStern Review --cluded that “the cost of inaction will be significantly higher than cluded that “the cost of inaction will be significantly higher than the cost of action.”the cost of action.”1010 Yet some argue that the costs of dealing Yet some argue that the costs of dealing with climate change should be paid for by future generations, with climate change should be paid for by future generations, which—by historical trends—one would expect to be richer which—by historical trends—one would expect to be richer than the present generation. From a national productivity and than the present generation. From a national productivity and competitiveness perspective, this raises a problem we face competitiveness perspective, this raises a problem we face across all aspects of sustainability—what is an appropriate across all aspects of sustainability—what is an appropriate measure of discounting the distant future?measure of discounting the distant future?
In addition to these major categories of questions, a In addition to these major categories of questions, a number of other questions arise:number of other questions arise:
•• Should developing versus developed economies be Should developing versus developed economies be treated differently in an assessment of climate change and treated differently in an assessment of climate change and productivity? How should we account for climate differproductivity? How should we account for climate differ--ences across regions of the world?ences across regions of the world?
•• How can one translate climate change impacts into quanHow can one translate climate change impacts into quan--tifiable risks for investment, thereby allowing for a longer-tifiable risks for investment, thereby allowing for a longer-term assessment of vulnerability of investment portfolios? term assessment of vulnerability of investment portfolios? What is the best method for valuing investment in qualitaWhat is the best method for valuing investment in qualita--tive, inter-generational assets (such as education, or the tive, inter-generational assets (such as education, or the maintenance of stock, etc.)—in other words, for valuing maintenance of stock, etc.)—in other words, for valuing factors that affect the future?factors that affect the future?
•• What is the best way to integrate the ability of a country What is the best way to integrate the ability of a country to assess and manage risk into a competitiveness assessto assess and manage risk into a competitiveness assess--ment? ment?
(Cont’d.)
The Global Competitiveness Report 2011-2012 © 2011 World Economic Forum
61
1.2:
Sus
tain
able
Com
petit
iven
ess
emissions. The relationship between competitiveness and climate change is discussed in Box 4.
Interlinkages of the sustainable competitiveness drivers
It is clear that the interrelations between the vari-ous factors mentioned above are also a critical part of the sustainable competitiveness story. Vulnerability is brought about not only by individual factors but also by combinations of phenomena that together can have a greater impact on vulnerability than the individual concepts. For example, natural disasters coupled with
poor infrastructure or with weak institutions become a major competitiveness vulnerability. Similarly, the Asian financial crisis, which was driven in large part by the large current account deficits that were fu-elled by short-term portfolio investments rather than longer-term foreign direct investment, became a major vulnerability. When that capital was rapidly pulled out, a huge recession ensued.
In addition, interlinkages among multiple aspects can create systemic risks: if you fail, you fail across the system. One of the goals of our future research will be to find a way to identify, illustrate, and potentially quantify these interlinkages, drawing on the Forum’s work on global risks.
Concepts not yet captured by the SCIThere are a number of areas that we recognize as criti-cal for sustainable competitiveness, but that have not yet been included in the SCI because of the lack of relevant, reliable data. A goal will be to include these elements as the data become available in coming years. Among these elements are:
• The incidence of political violence and civil war. Although this has a clear bearing on sustain-able competitiveness via physical security and the ability of institutions to function, as well as a clear impact on social cohesion, we are still in the pro-cess of identifying the most relevant data to mea-sure this concept.
• Market imbalances or “bubbles.” Throughout modern history, financial markets have been repeat-edly plagued by excessive price developments caused by speculation that is out of tune with mar-ket fundamentals. As discussed above, such situa-tions have the potential to create a massive misallo-cation of human and financial resources. However, there is no agreement yet in the academic commu-nity about how best to measure the correct price of assets, so this remains an area for future research. Related to this issue, a measure of the transparency of financial markets would also provide an impor-tant angle on sustainable competitiveness in this area.
• Natural disasters. A country’s ability to prepare for and address natural disasters has a significant impact on its ability to be productive and com-petitive over the longer term. However, a lack of relevant data has made it impossible to include this measure this year, although it remains an important area for future research.
• Environmental damage and resource depletion. For a number of concepts critical to measuring environmental damage and resource depletion, such as the amount of waste produced or soil pollution,
Box 4: Climate change and competitiveness in a global context (cont’d.)
•• Given that climate change is a global issue requiring Given that climate change is a global issue requiring global cooperation, what is the value of cooperation global cooperation, what is the value of cooperation among countries and how can it be captured through among countries and how can it be captured through data measures?data measures?
Because of these and a number of other related quesBecause of these and a number of other related ques--tions, it is not yet clear how to model climate change directly tions, it is not yet clear how to model climate change directly in the SCI. This issue remains an important area for further in the SCI. This issue remains an important area for further research, and it is our hope that we can encourage a conresearch, and it is our hope that we can encourage a con--structive discussion on this topic.structive discussion on this topic.
NotesNotes11 See UNEP 2010a. Based on a review of the scientific See UNEP 2010a. Based on a review of the scientific
literature, the Intergovernmental Panel on Climate literature, the Intergovernmental Panel on Climate Change (IPCC) has summarized the benefits of limiting Change (IPCC) has summarized the benefits of limiting the increase of global average surface temperature to the increase of global average surface temperature to around 1.6–2.6°C relative to pre-industrial conditions around 1.6–2.6°C relative to pre-industrial conditions and, conversely, the risks of allowing temperature to and, conversely, the risks of allowing temperature to rise above this level. Summaries may be found in varirise above this level. Summaries may be found in vari--ous Fourth Assessment reports including the Synthesis ous Fourth Assessment reports including the Synthesis Report; in Table 19.1 of the Working Group II report; Report; in Table 19.1 of the Working Group II report; and in Table 3.11 of the Working Group III Report of the and in Table 3.11 of the Working Group III Report of the IPCC.IPCC.
22 Project Catalyst 2009.Project Catalyst 2009.
33 US Department of Commerce, NOAA Research, US Department of Commerce, NOAA Research, “Trends in Atmospheric Carbon Dioxide.”“Trends in Atmospheric Carbon Dioxide.”
44 HM Treasury 2006, HM Treasury 2006, Stern Review.Stern Review.
55 HM Treasury 2006, HM Treasury 2006, Stern Review.Stern Review.
66 The cost of action to mitigate climate change is estiThe cost of action to mitigate climate change is esti--mated globally at around US$500 billion per annum. mated globally at around US$500 billion per annum. See World Economic Forum 2011.See World Economic Forum 2011.
77 Pew Center on Global Climate Change 2003.Pew Center on Global Climate Change 2003.
88 The Carbon Trust, “Global Flows.”The Carbon Trust, “Global Flows.”
99 This is because carbon dioxide and some other greenThis is because carbon dioxide and some other green--house substances have long residence times in the house substances have long residence times in the atmosphere, which means that their concentration at atmosphere, which means that their concentration at any particular time relies on their accumulation over any particular time relies on their accumulation over many previous years. See UNEP 2010.many previous years. See UNEP 2010.
1010 HM Treasury 2006, HM Treasury 2006, Stern Review.Stern Review.
The Global Competitiveness Report 2011-2012 © 2011 World Economic Forum

62
1.2:
Sus
tain
able
Com
petit
iven
ess
cross-country comparable data are not available. Work in this area is urgently needed.
• Better measures of food security. Interlinked with the areas of natural disasters, environmen-tal damage, and the physical environment, better measures of the reliable availability of food (or lack thereof) are needed.
• Non-communicable diseases. To better mea-sure the health of the stock of human capital of a country, data on the prevelance and treatment of non-communicable diseases, such as heart disease, cancer, diabetes, and obesity, are required.
• Worker protection. One critical area of social cohesion that needs to be addressed further is that of the protection of workers. Data that can provide an accurate measure of worker protection that is comparable across a large number of countries are, to the best of our knowledge, not yet available.
Weighting schemeAt present we have not implemented a weighting scheme that prioritizes among the five subindexes of the SCI. No particular theory exists that would guide such a weighting scheme, and there is no specific variable that could be used as a dependent variable to test the model. The SCI shown here is therefore an unweighted average of the five subindexes. However, this represents yet another important area for further analysis and research.
Country coverageFrom the 142 economies covered by the GCI in Chapter 1.1, we cover in the SCI a subsample of 100 countries for which we have been able to gather suf-countries for which we have been able to gather suf-countries for which we have been able to gather sufficient data. Data availability represents a major chal-lenge and constraint in this exercise: for many of the concepts we are trying to capture, no measures exist, or data are available for only a limited num-ber of countries (e.g., countries in the Organisation for Co-operation and Development, the G-20, or the European Union). The goal going forward is to in-clude an increasing number of countries in the analysis as data become more readily available.
Selected results of the Sustainable Competitiveness Index
Given that the methodology discussed in this chap-ter remains preliminary, and given also the need for further refinement, the full results are not presented here. Instead, Table 1 shows how the results of the SCI differ from those of the GCI discussed in Chapter 1.1, in a first attempt to demonstrate the extent to which
countries are preparing well for their future competi-tiveness. To do so, we have categorized the subset of 100 countries into five potential groupings: (1) those that are much higher than in the GCI (countries that are 10 or more places higher in the SCI than they are in the GCI, shown by an arrow pointing straight up); (2) those that are somewhat higher (between 3 and 9 places higher, shown by an upward-slanting arrow); (3) those with a stable performance (between 2 places higher and 2 places lower, shown by a horizontal arrow); (4) those that are somewhat lower (between 3 and 9 places lower, shown by a downward-slanting arrow); and (5) those that are much lower (10 or more places lower, shown by an arrow pointing straight down).
Although the results of the SCI are still very pre-liminary, Table 1 provides a general sense of the vul-nerability of national-level competitiveness when the new sustainable competitiveness factors are taken into account. For presentational purposes, economies are shown in the same order in which they appear in the GCI, with their GCI rankings in the left column. The 42 countries that appear in the GCI but not included in the SCI are not shown. Thus there are gaps in the ranks, so, for example, the United Kingdom (rank 10 in the GCI) is followed by Canada (rank 12 in the GCI) because the country that appears in the GCI be-tween the United Kingdom and Canada with the 11th rank was not included in the SCI. The third column reports the GCI rank but based on the 100 countries (instead of 142), listing them from 1 to 100, in the same order as the GCI ranking. The results for the SCI are indicated by the five categories of arrows de-scribed above, which indicate the extent to which the SCI ranking differs from the GCI ranking. Please note that the SCI comprises only those countries covered in the GCI for which no more than one additional SCI variable is unavailable.23
Switzerland performs very well in the SCI, as it does in the GCI rankings. Along with its strong showing across the traditional competitiveness factors already included in the GCI, Switzerland is well as-sessed for its environmental policy measures, as well as for the management of renewable resources and the extent to which resources are employed efficiently in the economy. The country also receives relatively high marks for social cohesion.
The Nordic countries are among the top-ranked countries in the SCI, with Sweden, Norway, Finland,and Denmark performing very well. Norway in parDenmark performing very well. Norway in parDenmark -ticular shows some improvement in the SCI compared with the GCI, indicating that it is preparing better for the future than it is performing today in terms of com-petitiveness. All the Nordic countries have put into place very stringent and well-enforced environmental policies, which are leading to positive outcomes. Their social cohesion indicators are sustainable overall, although this
The Global Competitiveness Report 2011-2012 © 2011 World Economic Forum

63
1.2:
Sus
tain
able
Com
petit
iven
ess
Table 1: The impact of sustainability on competitiveness
GCI 2011− GCI rank within Sustainability 2012 rank* Country/Economy the SCI sample† impact‡
1 Switzerland 1 ⇒2 Singapore 2 ⇒3 Sweden 3 ⇒4 Finland 4 ⇒5 United States 5 ⇓6 Germany 6 ⇒7 Netherlands 7 ⇒8 Denmark 8 ⇒9 Japan 9 ⇒
10 United Kingdom 10 ⇘12 Canada 11 ⇒15 Belgium 12 ⇘16 Norway 13 ⇗17 Saudi Arabia 14 ⇓18 France 15 ⇒19 Austria 16 ⇗20 Australia 17 ⇗21 Malaysia 18 ⇒22 Israel 19 ⇓24 Korea, Rep. 20 ⇒25 New Zealand 21 ⇗26 China 22 ⇓27 United Arab Emirates 23 ⇒29 Ireland 24 ⇗31 Chile 25 ⇗33 Estonia 26 ⇗34 Kuwait 27 ⇓36 Spain 28 ⇒39 Thailand 29 ⇘40 Tunisia 30 ⇓41 Poland 31 ⇘43 Italy 32 ⇓44 Lithuania 33 ⇘45 Portugal 34 ⇗46 Indonesia 35 ⇘47 Cyprus 36 ⇑48 Hungary 37 ⇘49 Panama 38 ⇗50 South Africa 39 ⇓51 Malta 40 ⇗52 Sri Lanka 41 ⇘53 Brazil 42 ⇗55 Azerbaijan 43 ⇓56 India 44 ⇓57 Slovenia 45 ⇑58 Mexico 46 ⇘59 Turkey 47 ⇘61 Costa Rica 48 ⇑62 Iran, Islamic rep. 49 ⇓63 Uruguay 50 ⇑
GCI 2011− GCI rank within Sustainability 2012 rank* Country/Economy the SCI sample† impact‡
64 Latvia 51 ⇑65 Vietnam 52 ⇒66 Russian Federation 53 ⇑67 Peru 54 ⇗68 Colombia 55 ⇑71 Jordan 56 ⇓72 Kazakhstan 57 ⇒73 Morocco 58 ⇓74 Bulgaria 59 ⇒75 Philippines 60 ⇑76 Croatia 61 ⇑78 Albania 62 ⇑81 Trinidad and Tobago 63 ⇑82 Ukraine 64 ⇒83 Namibia 65 ⇗84 Guatemala 66 ⇗85 Argentina 67 ⇗86 Honduras 68 ⇒87 Algeria 69 ⇓88 Georgia 70 ⇗89 Lebanon 71 ⇗90 Greece 72 ⇑91 El Salvador 73 ⇗92 Armenia 74 ⇓93 Moldova 75 ⇓94 Egypt 76 ⇘96 Mongolia 77 ⇘97 Cambodia 78 ⇒98 Syria 79 ⇓
100 Bosnia and Herzegovina 80 ⇒101 Ecuador 81 ⇑102 Kenya 82 ⇑103 Bolivia 83 ⇗104 Benin 84 ⇒106 Ethiopia 85 ⇓107 Jamaica 86 ⇑108 Bangladesh 87 ⇒110 Dominican Republic 88 ⇑111 Senegal 89 ⇘114 Ghana 90 ⇑115 Nicaragua 91 ⇗116 Cameroon 92 ⇗118 Pakistan 93 ⇘120 Tanzania 94 ⇗122 Paraguay 95 ⇗124 Venezuela 96 ⇑126 Kyrgyz Republic 97 ⇒127 Nigeria 98 ⇗133 Mozambique 99 ⇒139 Angola 100 ⇒
* This is the GCI rank, as presented in Chapter 1.1. Only the 100 countries included in the SCI are reported here.† The SCI sample is the set of 100 countries included in the SCI, based on data availability. For further details, please see the text.SCI sample is the set of 100 countries included in the SCI, based on data availability. For further details, please see the text.SCI sample‡ The sustainability impact refers to the direction and magnitude of the difference in a country’s rank between the GCI and the SCI. This applies to only sustainability impact refers to the direction and magnitude of the difference in a country’s rank between the GCI and the SCI. This applies to only sustainability impact those countries covered by the SCI.
Legend:Higher (by 10 or more positions): ⇑Slightly higher (by 3 to 9 positions): ⇗Stable (higher or lower by 2 or fewer positions): ⇒Slightly lower (by 3 to 9 positions): ⇘Lower (by 10 or more positions): ⇓
The Global Competitiveness Report 2011-2012 © 2011 World Economic Forum

64
1.2:
Sus
tain
able
Com
petit
iven
ess
pillar demonstrates varying performances across these countries (mainly because of differences in their depen-dency ratios and youth unemployment rates).
Canada is another country with an overall stable performance across both the SCI and the GCI. Canada is relatively better assessed than a number of other advanced economies for its environmental policy and resource efficiency, and in particular it shows a lack of environmental degradation.
Japan is also stable across the SCI and the GCI assessments. On the environmental side, it displays insufficient resource efficiency and a poor showing on degradation of its physical environment, although these problems are compensated for by good envi-ronmental policy and good management of resources. Perhaps the greatest concern for this country is its demographic outlook: Japan faces a particularly bleak dependency ratio in 2030, an issue of major concern for the country going forward.
Box 5: Policies to mitigate vulnerability
The Sustainable Competitiveness Index provides a picture of The Sustainable Competitiveness Index provides a picture of the vulnerability of national competitiveness over a 20-year the vulnerability of national competitiveness over a 20-year horizon as reflected by quantifiable indicators that are available horizon as reflected by quantifiable indicators that are available today. In doing so, however, the SCI does not capture some of today. In doing so, however, the SCI does not capture some of the policy efforts that countries are presently making.the policy efforts that countries are presently making.
For example, policies intended to mitigate environmental For example, policies intended to mitigate environmental vulnerability have been multiplying in recent years, spurred vulnerability have been multiplying in recent years, spurred particularly by international climate change processes, but particularly by international climate change processes, but also more generally under an overarching green growth aegis. also more generally under an overarching green growth aegis. Should they bear fruit, these policies would contribute to the Should they bear fruit, these policies would contribute to the reduction of risk from environmental factors, and would thus be reduction of risk from environmental factors, and would thus be expected, over time, to improve the sustainable competitiveness expected, over time, to improve the sustainable competitiveness of the countries that implement them.of the countries that implement them.
Some of the current policy efforts that may not yet be facSome of the current policy efforts that may not yet be fac--tored into the measures of sustainable competitiveness include tored into the measures of sustainable competitiveness include the following:the following:
•• China’s 12th five-year plan includes objectives to reduce China’s 12th five-year plan includes objectives to reduce energy intensity by 16 percent, carbon intensity by 17 perenergy intensity by 16 percent, carbon intensity by 17 per--cent, and new energy as a percentage of primary energy cent, and new energy as a percentage of primary energy by 11.4 percent, while maintaining a 7 percent rate of GDP by 11.4 percent, while maintaining a 7 percent rate of GDP growth between 2011 and 2015.growth between 2011 and 2015.11
•• Ethiopia aims to cut its carbon emissions in half by underEthiopia aims to cut its carbon emissions in half by under--taking soil and forest development works, according to its taking soil and forest development works, according to its Green Growth plan, which will be unveiled in time for the Green Growth plan, which will be unveiled in time for the Durban climate change negotiation weeks in December Durban climate change negotiation weeks in December 2011.2011.22
•• India’s National Action Plan on Climate Change, launched India’s National Action Plan on Climate Change, launched in 2008,in 2008,33 establishes eight National Missions. Among these establishes eight National Missions. Among these are the National Solar Mission with the aim of generating are the National Solar Mission with the aim of generating 20 gigawatts of solar power by 2022;20 gigawatts of solar power by 2022;44 the National Mission the National Mission for Enhanced Energy Efficiency; and the National Water for Enhanced Energy Efficiency; and the National Water Mission,Mission,55 which aims to increase water use efficiency by which aims to increase water use efficiency by 20 percent, among other goals.20 percent, among other goals.
•• Korea’s Green Growth plan includes the objectives of Korea’s Green Growth plan includes the objectives of reducing, by 2020, its greenhouse gas emissions by 30 reducing, by 2020, its greenhouse gas emissions by 30 percent of its previously projected growth, increasing the percent of its previously projected growth, increasing the share of renewable energies in its total energy supply to share of renewable energies in its total energy supply to 11 percent by 2030, and promoting the development of 27 11 percent by 2030, and promoting the development of 27 core green technologies that would provide future engines core green technologies that would provide future engines of growth for its economy.of growth for its economy.66
•• Morocco’s National Renewable Energy and Energy Morocco’s National Renewable Energy and Energy Efficiency plan aims to achieve 42 percent renewable Efficiency plan aims to achieve 42 percent renewable energy and 15 percent energy savings by 2020,energy and 15 percent energy savings by 2020,77 objectives objectives supported by a renewable energy law passed in June supported by a renewable energy law passed in June 2010.2010.88
•• South Africa has put forward a number of planning docuSouth Africa has put forward a number of planning docu--ments, including its National Climate Change Response ments, including its National Climate Change Response Green Paper, which highlights solutions planned across Green Paper, which highlights solutions planned across a number of key adaptation sectors including water, agria number of key adaptation sectors including water, agri--culture, and energy.culture, and energy.99 The country also has developed a The country also has developed a New Economic Growth Path that prioritizes support for the New Economic Growth Path that prioritizes support for the green economy,green economy,1010 an Industrial Policy Action Plan, an Industrial Policy Action Plan,1111 and and an Integrated Resource Plan,an Integrated Resource Plan,1212 among others, that include among others, that include setting targets for renewable energy scale-up.setting targets for renewable energy scale-up.
NotesNotes11 The Climate Group 2011.The Climate Group 2011.
22 Rodriguez 2011.Rodriguez 2011.
33 GOI, Prime Minister’s Council on Climate Change 2008.GOI, Prime Minister’s Council on Climate Change 2008.
44 GOI, Jawaharlal Nehru National Solar Mission 2009.GOI, Jawaharlal Nehru National Solar Mission 2009.
55 GOI, Ministry of Water Resources 2009.GOI, Ministry of Water Resources 2009.
66 UNEP 2010b.UNEP 2010b.
77 Ministère de l’Énergie, des Mines, de l’Eau et de Ministère de l’Énergie, des Mines, de l’Eau et de l’Environnement 2011 and UNCTAD 2011.l’Environnement 2011 and UNCTAD 2011.
88 The Kingdom of Morocco, Ministry of Energy, Mines, The Kingdom of Morocco, Ministry of Energy, Mines, Water, and Environment 2010.Water, and Environment 2010.
99 Government of the Republic of South Africa, Department Government of the Republic of South Africa, Department of Environmental Affairs 2010.of Environmental Affairs 2010.
1010 Government of the Republic of South Africa, Ministry of Government of the Republic of South Africa, Ministry of Economic Development 2010.Economic Development 2010.
1111 Government of the Republic of South Africa, Economic Government of the Republic of South Africa, Economic Sectors and Employment Cluster 2010.Sectors and Employment Cluster 2010.
1212 Government of the Republic of South Africa, Department Government of the Republic of South Africa, Department of Energy 2011.of Energy 2011.
The Global Competitiveness Report 2011-2012 © 2011 World Economic Forum

65
1.2:
Sus
tain
able
Com
petit
iven
ess
The United States performs more poorly in the SCI than it does in the GCI. This is traced in large part to the country’s showing on a number of envi-ronmental indicators: its relatively good management of renewable resources is offset by insufficient resource efficiency and a fairly high level of environmental degradation. In addition, and even more dramatically, the country does not fare well with regard to some social cohesion factors. For example, the country’s inequality and dependency ratio indicators are of some concern: its Gini index is somewhat high and grow-ing, showing movement toward an increasingly un-equal society. Additionally, although not at the same level as other advanced economies, its dependency ratio is expected to worsen over coming decades.
On a regional basis, we find that North Africancountries tend to be assessed less well in the SCI than they do in the GCI. For example, Tunisia is sig-nificantly lower in the SCI, a result mainly linked to lower ranks in the area of resource efficiency and environmental degredation. In addition, some aspects of social cohesion are a concern, including its degree of youth unemployment—which is considered to be one of the main catalysts of the social unrest earlier this year. Morocco and Egypt are also evaluated lower than they are in the GCI. As well as high youth unemployment rates, their use of resources could be more efficient and they have experienced relatively high environmental degradation.
Similar results are found among countries from the Middle East, with Israel, Jordan, and Saudi Arabia all significantly lower in the SCI rankings than they are in the GCI, indicating some vulner-abilities with respect to their competitiveness going forward.
On the other hand, the trend among Latin American countries is for the most part to show more positive results in the SCI than in the GCI. In par-ticular, Colombia, Costa Rica, and Ecuador are especially well assessed by a number of the sustainable competitiveness factors, with good to excellent results among the environmental indicators. In addition, they are all characterized by good demographic prospects, and Costa Rica and Ecuador also have relatively low youth unemployment.
Brazil is rated slightly better in the SCI than in the GCI. The country fares rather poorly on some aspects of the social cohesion measures of the SCI, with its notably high inequality partially offset by its positive projected demographic trend. Further, Brazil’s performance in many of the environmental indicators is strong. Despite a worrisome deforestation rate, over-all its strong and well-enforced environmental policies ensure low environmental degradation. The economy is also characterized by a level of resource efficiency that is among the best in the world.
Among other large emerging market economies, China is significantly lower in the SCI than in its GCI ranking. In particular, some of its environmental indi-cators raise concerns, particularly in its lack of resource efficiency and its high environmental degredation.
Similarly, India is also significantly lower in the SCI rankings than in its showing in the GCI. Mainly because of is offset by environmental concerns. India’s sustainable competitiveness would be well served by stronger environmental policies, a more efficient use of resources, and better protection of the environment more generally.
It is important to note that a number of efforts are being made in several countries that, if successful, would be expected to improve their sustainable com-petitiveness (see Box 5 on policy efforts to enhance environmental sustainability).
Conclusions and next stepsAs described above, there are several concepts we have not been able to capture because of lack of data, or because the relationship between the factor and sus-tainable competitiveness is not yet clearly established. In this light, it is important to see the work presented in this chapter as the first step in a process. We will update and refine our thinking and methodology over time, integrating feedback and the latest research on an ongoing basis.
A first step in this process will be the creation of an online site where feedback on the preliminary methodology can be collected from the public. To this end, the Forum has set up a dedicated page, avail-able at www.weforum.org/sci, to collect responses and comments. A number of expert peer reviewers will also be asked to provide their feedback through a structured process.
In addition, the Forum will create a dialogue series where experts from the business sector, govern-ments, academia, and civil society will be invited to participate in working sessions at each of the Forum’s regional events, as well as at the Annual Meeting in Davos, and asked to provide their advice and sug-gestions regarding the key elements of sustainable competitiveness.
The Advisory Board on Sustinability and Competitiveness will continue to deliberate and to work with the Forum throughout the coming year and to integrate the feedback collected into this work. The goal will be to present an updated, more comprehen-sive, and improved methodology in the next edition of The Global Competitiveness Report.
Notes1 WCED 1987.
2 See, for example, United Nations 2005.
The Global Competitiveness Report 2011-2012 © 2011 World Economic Forum

66
1.2:
Sus
tain
able
Com
petit
iven
ess
3 The phrase triple bottom line was first introduced in John triple bottom line was first introduced in John triple bottom lineElkington’s 1998 book entitled Cannibals with Forks: The Triple Bottom Line of 21st Century Business.
4 Stiglitz, et al. 2009, p. 3.
5 See, for example, Hamilton and Clemens 1998; Heal 2011; and the World Bank’s World Development Indicators 2011.
6 For more information on the EPI, see http://www.epi.yale.edu/.
7 For more information about the Ecological Footprint project, see http://www.footprintnetwork.org/en/index.php/GFN/.
8 An important distinction remains in the literature on environmental sustainability between what are termed “weak” and “strong” sustainability. Weak sustainability is interested in ensuring that Weak sustainability is interested in ensuring that Weak sustainabilityfuture generations can attain present living standards or better, and considers different types of capital to be substitutes for each other. Thus the loss of some natural capital can be made up for by an increase through innovations of human or knowledge capital that allows living standards to be maintained. So, for example, the loss of a water supply can be balanced out by an innovative method for conserving or treating water. Strong sustainability, on the other hand, sees inherent value in natural capital and looks beyond maintaining living standards to the goal of conserving all life forms on the planet. In the work done to date on the SCI, the approach that has been adopted is closer to that of fostering weak sustainability, given that the goal is by definition to measure impacts on living standards and productivity. It could be argued, however, that the inevitable uncertainties about tomorrow render a strong sustainability approach more prudent. For an excellent discussion on this debate, see Heal 2011.
9 The UNDP argues that “the urgent global challenges of sustain-ability and equity must be addressed together.” See UNDP 2010, Chapter 4, “Good Things Don’t Always Come Together,” and the forthcoming Human Development Report 2011 (to launch in November 2011), available at http://hdr.undp.org/en/.
10 Areas of the World Economic Forum’s work in this area include helping developing country governments develop specific public-finance tools and policies that draw private capital at scale into low-carbon industry sectors such as energy, land use, and transportation; combining best-in-class economic analysis with public-private expert advisory networks to help governments that are facing water security challenges design and implement practi-cal national water sector transformation strategies; establishing the business case for sustainability and exploring transformative forms of collaboration along the value chain; exploring creative energy-efficient financing solutions that allow real estate portfolio holders to access capital and recommending policy tools that jump-start the investment market; addressing key barriers to energy efficiency through discussions among regional and sector-based stakeholders in energy, engineering, mining, chemicals, and information technology; addressing intermodal policy chal-lenges and catalyzing initiatives in aviation biofuels, road transport electrification, and carbon reporting; developing a new methodolo-gy to assess critical actions required to increase the effectiveness and speed of the transition to future energy systems that balance the need to underpin environmental sustainability, economic com-petitiveness and energy security.
11 See Commission on Geosciences, Environment, and Resources, and National Research Council 1994, p. 7.
12 See, for example, Stiglitz 1986; Samuelson 1954; and Cowen 1992.
13 See Jacobson 2008.
14 Some factors are important for competitiveness and productiv-ity in the shorter term, but are not persistent and thefore not as important for the longer term. Changes or omissions have affected the following three variables: inflation, which appears in the GCI in the macroecononmic environment pillar, is excluded entirely from the SCI because it is not persistent in the longer term; the (annual) government budget balances of the same pillar in the GCI have been replaced by five-year averages because this reflects longer-term policy trends better; and aggregated second-ary education enrollment rates have been replaced by separate rates for males and females, assigning a half weight to each instance, because this provides a sense of gender equality in the economy, which is very important to social sustainability.
15 For more on changing demographics and the impact of aging populations, see the United Nations Population fund at http://www.unfpa.org/pds/ageing.html, and conference papers from the Federal Reserve Bank of Boston 2011 conference entitled “Seismic Shifts: The Economic Impact of Demographic Change,” available at http://www.bos.frb.org/economic/conf/conf46/.
16 Council of Europe 2008, Box 3, p. 14.
17 According to the World Bank, “Systematic exclusion of women from access to schooling and the labor force translates into a less educated workforce, inefficient allocation of labor, lost productiv-ity, and consequently diminished progress of economic develop-ment. Evidence across countries suggests that countries with better gender equality are more likely to have higher economic growth. The benefits of women’s education go beyond higher productivity for 50 percent of the population. More educated women also tend to be healthier, participate more in the for-mal labor market, earn more income, have fewer children, and provide better health care and education to their children, all of which eventually improve the well-being of all individuals and lift households out of poverty. These benefits also transmit across generations, as well as to their communities at large.” In particu-lar, “several of the studies on health care indicate substantially stronger effects of secondary schooling.” See World Bank, Girls’ Education.
18 Esteban and Ray 2006, p. 1.
19 Berg and Ostry 2011, p. 3.
20 For example, an empirical study on the relationship between environmental regulation and competitiveness of the manufac-turing sector in the United States found that “there is little to document that environmental regulation have had a measurably adverse effect on competitiveness.” See Stavins et al. 1994, p. 3
21 For a discussion of the increasing importance of resource effi-ciency, see Moody and Nogrady 2010.
22 See, for example, Marshall et al. 1997.
23 The 42 countries included in the GCI but not covered in the SCI because of missing data are: Bahrain, Barbados, Belize, Botswana, Brunei Darussalam, Burkina Faso, Burundi, Cape Verde, Chad, Côte d’Ivoire, Czech Republic, Gambia, Guyana, Haiti, Hong Kong SAR, Iceland, Iran, Lesotho, Luxembourg, Macedonia, FYR, Madagascar, Malawi, Mali, Mauritania, Mauritius, Montenegro, Nepal, Oman, Puerto Rico, Qatar, Romania, Rwanda, Serbia, Slovak Republic, Suriname, Swaziland, Taiwan, Tajikistan, Timor-Leste, Uganda, Yemen, Zambia.
ReferencesBerg A. and J. Ostry. 2011. “Inequlity and Unsustainable Growth: Two
Sides of the Same Coin?” IMF Staff Discussion Note. Washington DC: International Monetary Fund. Available at http://www.imf.org/external/pubs/ft/sdn/2011/sdn1108.pdf.
The Carbon Trust. “Global Flows.” International Carbon Flows. Available at http://www.carbontrust.co.uk/policy-legislation/international-carbon-flows/pages/default.aspx.
The Climate Group. 2011. Delivering Low Carbon Growth: A Guide to China’s 12th Five Year Plan. Report commissioned by HSBC Climate Change Centre of Excellence. Available at http://www.theclimategroup.org/_assets/files/FINAL_14Mar11_-TCG_DELIVERING-LOW-CARBON-GROWTH-V3.pdf.
Coase, R. 1960. “The Problem of Social Cost.” Journal of Law and Economics 3 (October): 1–44.Economics 3 (October): 1–44.Economics
Commission on Geosciences, Environment, and Resources, and National Research Council. 1994. Assigning Economic Value to Natural Resources. Washington DC: National Academies Press.
Council of Europe. 2008. Report of High-Level Task Force on Social Cohesion: Towards an Active, Fair and Socially Cohesive Europe.Strasbourg: Council of Europe. TFSC (2007) 31E. Available at www.coe.int/t/dg3/socialpolicies/source/TFSC(2007)31E.doc.
Cowen, T., ed. 1992. Public Goods and Market Failures. New Brunswick, NJ: Transaction Publishers.
The Global Competitiveness Report 2011-2012 © 2011 World Economic Forum

67
1.2:
Sus
tain
able
Com
petit
iven
ess
Driscoll, T., K. Steenland, D. Imel Nelson, and J. Leigh. 2004. Occupational Airborne Particulates: Assessing the Environmental Burden of Disease at National and Local Levels. Environmental Burden of Disease Series, No. 7. Geneva: World Health Organization.
Elkington, J. 1997. Cannibals with Forks: The Triple Bottom Line of 21st Century Business. Oxford, United Kingdom: John Wiley & Sons.
Esteban, J. and D. Ray. 2006. “Inequality, Lobbying and Resource Allocation.” The American Economic Review 96 (1): 257–79.The American Economic Review 96 (1): 257–79.The American Economic Review
Esty, D. C., M. Levy, T. Srebotnjak, and A. de Sherbinin. 2005. 2005 Environmental Sustainability Index: Benchmarking National Environmental Stewardship. New Haven: Yale Center for Environmental Law & Policy. Available at http://www.yale.edu/esi/.
European Commision, Economic and Financial Affairs. 2009. Sustainability Report 2009. Luxembourg: European Communities.
Ewing B., A. Reed, A. Galli, J. Kitzes, and M. Wackernagel. 2010. Calculation Methodology for the National Footprint Accounts.Oakland: Global Footprint Network.
Federal Reserve Bank of Boston. 2011. Seismic Shifts: The Economic Impact of Demographic Change. Conference Series 46, ed. J. S. Little and R. K. Triest. Available at http://www.bos.frb.org/eco-nomic/conf/conf46/.
Feyrer, J. 2007. “Demographics and Productivity.” The Review of Economics and Statistics 89 (1): 100–09.Economics and Statistics 89 (1): 100–09.Economics and Statistics
Fuentes-Nieva, R. and I. Pereira. 2010. “The Disconnect Between Indicators of Sustainability and Human Development.” Human Development Research Paper No. 2010/34. New York: UNDP.Development Research Paper No. 2010/34. New York: UNDP.Development Research Paper
GOI (Government of India), Jawaharlal Nehru National Solar Mission. 2009. Towards Building SOLAR INDIA. Available at http://india.gov.in/allimpfrms/alldocs/15657.pdf.
———, Ministry of Water Resources. 2009. National Water Mission under National Action Plan on Climate Change. April. Available at http://www.india.gov.in/allimpfrms/alldocs/15658.pdf.
———, Prime Minister’s Council on Climate Change. 2008. National Action Plan on Climate Change. Available at http://pmindia.nic.in/Pg01-52.pdf.
Government of the Republic of South Africa, Department of Energy. 2011. Government Notice: Electricity Regulation Act No. 4 of 2006: Electricity Regulations on the Integrated Resource Plan 2010–2030. Available at http://www.energy.gov.za/IRP/2010/IRP2010.pdf.
———, Department of Environmental Affairs. 2010. National Climate Change Response Green Paper 2010. Available at http://www.environment.gov.za/HotIssues/2010/cgreenpaper.pdf.
———, Economic Sectors and Employment Cluster. 2010. 2010/11–2012/13 Industrial Action Plan. Available at http://www.info.gov.za/view/DownloadFileAction?id=117330.
———, Ministry of Economic Development. 2010. The New Growth Path: The Framework. November. Available at http://www.info.gov.za/view/DownloadFileAction?id=135748.
Hamilton, K. and M. Clemens. 1998. “Genuine Savings Rates in Developing Countries.” World Bank Economic Review 13 (2): World Bank Economic Review 13 (2): World Bank Economic Review333–56.
Hanley, N., J. Shogren, and B. White. 2007. Environmental Economics in Theory and Practice. London: Palgrave Macmillan.
Hardin, G. 1968. “The Tragedy of the Commons.” Science 162 (3859): Science 162 (3859): Science1243–48.
Heal, G. 2011. “Sustainability and Its Measurement.” NBER Working Paper No. 17008. Cambridge: National Bureau of Economic Paper No. 17008. Cambridge: National Bureau of Economic PaperResearch. Available at http://www.nber.org/papers/w17008.
HM Treasury. 2006. Stern Review on the Economics of Climate Change. Available at http://webarchive.nationalarchives.gov.uk/+/http:/www.hm-treasury.gov.uk/sternreview_index.htm
IMF (International Monetary Fund). 2011. Global Financial Stability Report: Durable Financial Stability: Getting There from Here.Washington DC: IMF.
Jacobson, M. Z. 2008. “On the Causal Link between Carbon Dioxide and Air Pollution Mortality.” Geophysical Research Letters 35, Geophysical Research Letters 35, Geophysical Research LettersL03809, doi:10.1029/2007GL031101.
Kaufmann, D., A. Kraay, and M. Mastruzzi. 2010. “The Worldwide Governance Indicators: Methodology and Analytical Issues.” World Bank Policy Research Working Paper No. 5430. World Bank Policy Research Working Paper No. 5430. World Bank Policy Research Working PaperWashington DC: World Bank.
King, R. R., V. L. Smith, A. W. Williams, and M. V. van Boening. 1993. “The Robustness of Bubbles and Crashes in Experimental Stock Markets.” In Nonlinear Dynamics and Evolutionary Economics,ed. R. H. Day and P. Chen. New York: Oxford University Press.
The Kingdom of Morocco, Ministry of Energy, Mines, Water, and Environment. 2010. Law No. 13-09 on Renewable Energy.Available at http://www.mem.gov.ma/Documentation/pdf/loi%20Energies%20renouvelables/loi%20Energies%20renouvelables.pdf.
Malik, A. and J. R. W. Temple, 2009. “The Geography of Output Volatility.” Journal of Development Economics 90 (2): 163–78.Journal of Development Economics 90 (2): 163–78.Journal of Development Economics
Marshall, A. 1925. Principles of Economics, 8th edition. London: Macmillan.
Marshall, F., M. Ashmore, and F. Hinchcliffe. 1997. A Hidden Threat to Food Production: Air Pollution and Agriculture in the Developing World. Gatekeeper series, NO SA 73. London: International Institute for Environment and Development.
Mercer. 2011. Climate Change Scenarios: Implications for Strategic Asset Allocation. Public Report. Washington DC: Mercer, sup-ported by Carbon Trust, and IFC. Available at www.mercer.com/climatechange.
Meyer, S. 1999. The Economic Impact of Environmental Regulation.MIT Project on Environmental Politics & Policy. Available at http://web.mit.edu/polisci/mpepp/Reports/Econ%20Impact%20Enviro%20Reg.pdf.
Ministère de l’Énergie, des Mines, de l’Eau et de l’Environnement. 2011. Stratégie Energétique Bilan d’Etape, May. Available at http://www.mem.gov.ma/Actualites/2011/aout/pdf/Bilan.pdf.
Mishan, E. J. 1971. “The Postwar Literature on Externalities: An Interpretative Essay.” Journal of Economic Literature 9 (1): 1–28.Journal of Economic Literature 9 (1): 1–28.Journal of Economic Literature
Malhotra, A., R. Pande, and C. Grown. 2003. “Impact of Investements in Female Education on Gender Equality.” Paper commissioned by The World Bank Gender and Development Group, Washington DC.
Moody, J. B. and B. Nogrady. 2010. The Sixth Wave. North Sydney: Random House Australia.
Neumayer, E. 2010. “Human Development and Sustainability.” Human Development Research Paper No. 2010/05. Available at http://hdr.Development Research Paper No. 2010/05. Available at http://hdr.Development Research Paperundp.org/en/reports/global/hdr2010/papers/HDRP_2010_05.pdf.
Pew Center on Global Climate Change. 2003. Beyond Kyoto: Advancing the International Effort Against Climate Change. Arlington, VA: Pew Center on Global Climate Change.
Pigou, A. C. 1946. The Economics of Welfare, 4th edition. London: Macmillan.
Project Catalyst. 2009. “Project Catalyst Brief Synthesis Summary,” December. Project Catalyst, an initiative of the ClimateWorks Foundation and the European Climate Foundation. Available at http://project-catalyst.info.
Rajan, R. 2010. Fault Lines: How Hidden Fractures Still Threaten the World Economy. Princeton: Princeton University Press.
Rodriguez, D. 2011. “Ethiopia to Launch FIrst Green Growth Plan in Africa.” Climate Action, August 11. Available at http://www.cli-mateactionprogramme.org/news/ethiopia_to_launch_first_green_growth_plan_in_africa/.
Rohàc, D. 2011. “Does Inequality Matter?” Briefing Paper. London: Adam Smith Institute. Available at http://www.adamsmith.org/files/Does_Inequality_Matter_ASI.pdf.
Samuelson, P. A. 1954. “The Pure Theory of Public Expenditure.” Review of Economics and Statistics 36 (1954): 387–90.Review of Economics and Statistics 36 (1954): 387–90.Review of Economics and Statistics
Solow, R. 1992. An Almost Practical Step Toward Sustainability.Washington DC: Resources for the Future.
The Global Competitiveness Report 2011-2012 © 2011 World Economic Forum

68
1.2:
Sus
tain
able
Com
petit
iven
ess
Smit, B. and O. Pilifosova. 2001. “Adaptation to Climate Change in the Context of Sustainable Development and Equity.” In Climate Change 2001: Impacts, Adaptation, and Vulnerability, ed. J. J. McCarthy, O. F. Canziani, N. A. Leary, D. J. Dokken, and K. S. White. Contribution of Working Group II to the Third Assessment Report of the Intergovernmental Panel on Climate Change. Cambridge: Cambridge University Press.
Stavins, R., A. Jaffe, S. Peterson, and P. Portney. 1994 “Environment Regulation and the Competitiveness of U.S. Manufacturing: What Does the Evidence Tell Us?” Center for Science and International Affairs (CSIA) Discussion Paper No. E-94-04. Cambridge: Kennedy Affairs (CSIA) Discussion Paper No. E-94-04. Cambridge: Kennedy Affairs (CSIA) Discussion PaperSchool of Government, Harvard University. Available at http://belfercenter.ksg.harvard.edu/files/1994_Stavins_Environmental_Regulation_and_the_Competitiveness_of_US_Manufacturing.pdf.
Stiglitz, J. E. 1986. Economics of the Public Sector. New York: Norton & Company.
Stiglitz, J., A. Sen, and J. Fitoussi. 2009. The Measurement of Economic Performance and Social Progress Revisited: Reflections and Overview. Available at http://www.stiglitz-sen-fitoussi.fr/docu-ments/overview-eng.pdf.
UNCTAD (United Nations Conference on Trade and Development). 2011. The Road to Rio + 20. New York and Geneva: UNCTAD. Issue 1, March. Available at http://www.unctad.org/trade_env/greeneconomy/road2rioGE2.asp.
UNDP (United Nations Development Programme). 2010. Human Development Report 2010. Houndsmills, Basingstoke, Hampshire and New York: Palgrave Macmillan. Available at http://hdr.undp.org/en/media/HDR_2010_EN_Complete_reprint.pdf.
———. 2011 in press. Human Development Report 2011. Houndsmills, Basingstoke, Hampshire and New York: Palgrave Macmillan. Available at http://hdr.undp.org/en/.
UNEP (United Nations Environment Programme. 2010a. “How Close Are We to the Two Degree Limit?” Information Note. UNEP Governing Council Meeting & Global Ministerial Environment Forum, February 24–26, 2010. Bali, Indonesia. Available at http://www.rona.unep.org/documents/news/20100223-temperature-briefing.pdf.
———. 2010b. Overview of the Republic of Korea’s National Strategy for Green Growth. Report prepared by the United Nations Environment Programme as part of its Green Economy Initiative, April. Available at http://www.unep.org/PDF/PressReleases/201004_UNEP_NATIONAL_STRATEGY.pdf.
United Nations. 2005. Resolution adopted by the General Assembly: 2005 World Summit Outcome. Available at http://data.unaids.org/Topics/UniversalAccess/worldsummitoutcome_resolution_24oct2005_en.pdf.
US Department of Commerce, NOAA (National Oceanic & Atmospheric Administration) Research. “Trends in Atmospheric Carbon Dioxide.” Earth System Research Laboratory, Global Monitoring Division. Available at http://www.esrl.noaa.gov/gmd/ccgg/trends/.
WCED (World Commission on Environment and Development). 1987. Our Common Future. WCED Report. Oxford, UK: Oxford University Press.
WHO/UNEP (World Health Organization/United Nations Environment Programme). 1992. Urban Air Pollution in Megacities of the World. Oxford, UK: Blackwell.
World Bank. Girls’ Education. Available at http://web.worldbank.org/WBSITE/EXTERNAL/TOPICS/EXTEDUCATION/0,,contentMDK:20298916~menuPK:617572~pagePK:148956~piPK:216618~theSitePK:282386,00.html#why.
World Economic Forum. 2011. Green Investing 2011: Reducing the Cost of Financing. New York: World Economic Forum USA.
The Global Competitiveness Report 2011-2012 © 2011 World Economic Forum

69
1.2:
Sus
tain
able
Com
petit
iven
ess
Appendix A: Structure of the Sustainable Competitiveness Index
This appendix presents the structure of the Sustainable Competitiveness Index (SCI).
The numbers identifying the indicators that come from the Global Competitiveness Index (GCI) are the same as they are in that index, and are preceded by the letter “G.” Numbers for indicators that are included only in the SCI are assigned in the order in which they appear, and are preceded by the letter “S.” All of these new indicators also appear in blue.
The computation of the SCI is based on successive aggregations of scores from the indicator level (i.e., the most disaggregated level) all the way up to the overall score. An arithmetic mean is always used to aggregate individual variables within a category and at all levels of aggregation.a
Variables that are not derived from the Executive Opinion Survey (Survey) are identified by an asterisk (*). To make the aggregation possible, these variables are transformed into a 1-to-7 scale in order to align them with the Survey results. We apply a min-max transformation, which preserves the order of, and the relative distance between, country scores.b
Indicators marked with a “½” superscript means that we assign a half-weight to each instance.
HUMAN CAPITAL
Health and primary educationA. Health
G4.01 Business impact of malaria d
G4.02 Malaria incidence * d
G4.03 Business impact of tuberculosis d
G4.04 Tuberculosis incidence * d
G4.05 Business impact of HIV/AIDS d
G4.06 HIV prevalence * d
G4.07 Infant mortality *G4.08 Life expectancy *
B. Primary educationG4.09 Quality of primary educationG4.10 Primary education enrollment rate *
Higher education and trainingA. Quantity of education
S01 Secondary education enrollment rate, males * c
S02 Secondary education enrollment rate, females * c
G5.02 Tertiary education enrollment rate *
B. Quality of educationG5.03 Quality of the education systemG5.04 Quality of math and science educationG5.05 Quality of management schoolsG5.06 Internet access in schools
C. On-the-job trainingG5.07 Local availability of research and training serv.G5.08 Extent of staff training
Social cohesionS03 Expected dependency ratio *S04 Gini index *S05 Youth unemployment *S06 Extent of informal economy
MARKET CONDITIONS
Labor market efficiencyA. Flexibility
G7.01 Cooperation in labor-employer relationsG7.02 Flexibility of wage determinationG7.03 Rigidity of employment *G7.04 Hiring and firing practicesG7.05 Redundancy costs *G6.04 Extent and effect of taxation ½
B. Efficient use of talentG7.06 Pay and productivityG7.07 Reliance on professional management ½
G7.08 Brain drainG7.09 Female participation in labor force *
The Global Competitiveness Report 2011-2012 © 2011 World Economic Forum

70
Appendix A: Structure of the Sustainable Competitiveness Index (cont’d.)
1.2:
Sus
tain
able
Com
petit
iven
ess
Financial market developmentA. Efficiency
G8.01 Availability of financial servicesG8.02 Affordability of financial servicesG8.03 Financing through local equity marketG8.04 Ease of access to loansG8.05 Venture capital availabilityG8.06 Restriction on capital flows
A. Trustworthiness and confidenceG8.07 Soundness of banksG8.08 Regulation of securities exchangesG8.09 Legal rights index *
Market sizeA. Domestic market size
G10.01 Domestic market size index * h
B. Foreign market sizeG10.02 Foreign market size index * i
Goods market efficiencyA. Competitione
1. Domestic competitione
G6.01 Intensity of local competitionG6.02 Extent of market dominanceG6.03 Effectiveness of anti-monopoly policyG6.04 Extent and effect of taxationG6.05 Total tax rate*G6.06 Number of procedures required to start a business * f
G6.07 Time required to start a business * f
G6.08 Agricultural policy costs
2. Foreign competitionG6.09 Prevalence of trade barriersG6.10 Trade tariffs *G6.11 Prevalence of foreign ownershipG6.12 Business impact of rules on FDIG6.13 Burden of customs proceduresG6.14 Imports as a percentage of GDP * g
B. Quality of demand conditionsG6.15 Degree of customer orientationG6.16 Buyer sophistication
TECHNOLOGY AND INNOVATION
Technological readinessA. Technological adoption
G9.01 Availability of latest technologiesG9.02 Firm-level technology absorptionG9.03 FDI and technology transfer
B. ICT useG9.04 Internet users *G9.05 Broadband Internet subscriptions *G9.06 Internet bandwidth *G2.08 Fixed telephone lines * ½
G2.09 Mobile telephone subscriptions * ½
Business sophisticationG11.01 Local supplier quantityG11.02 Local supplier qualityG11.03 State of cluster developmentG11.04 Nature of competitive advantageG11.05 Value chain breadthG11.06 Control of international distributionG11.07 Production process sophisticationG11.08 Extent of marketingG11.09 Willingness to delegate authorityG7.07 Reliance on professional management ½
InnovationG12.01 Capacity for innovationG12.02 Quality of scientific research institutionsG12.03 Company spending on R&DG12.04 University-industry collaboration in R&DG12.05 Government procurement of advanced technology
productsG12.06 Availability of scientists and engineersG12.07 Utility patents *G1.02 Intellectual property protection ½
POLICY ENVIRONMENT AND ENABLING CONDITIONS
InstitutionsA. Public institutions
1. Property rightsG1.01 Property rightsG1.02 Intellectual property protection ½
2. Ethics and corruptionG1.03 Diversion of public fundsG1.04 Public trust of politiciansG1.05 Irregular payments and bribes
3. Undue influenceG1.06 Judicial independenceG1.07 Favoritism in decisions of government officials
4. Government inefficiencyG1.08 Wastefulness of government spendingG1.09 Burden of government regulationG1.10 Efficiency of legal framework in settling disputesG1.11 Efficiency of legal framework in challenging
regulationsG1.12 Transparency of government policymaking
5. SecurityG1.13 Business costs of terrorismG1.14 Business costs of crime and violenceG1.15 Organized crimeG1.16 Reliability of police services
B. Private institutions
1. Corporate ethicsG1.17 Ethical behavior of firms
2. AccountabilityG1.18 Strength of auditing and reporting standardsG1.19 Efficacy of corporate boardsG1.20 Protection of minority shareholders’ interestsG1.21 Strength of investor protection *
The Global Competitiveness Report 2011-2012 © 2011 World Economic Forum
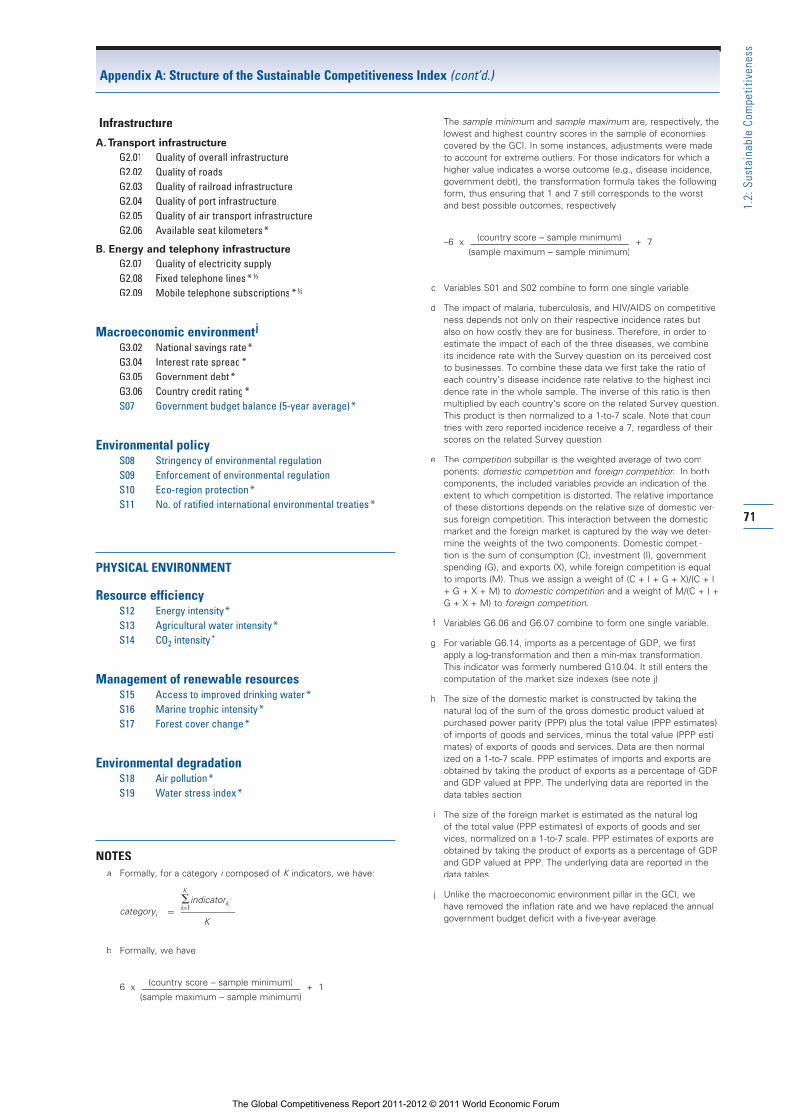
71
Appendix A: Structure of the Sustainable Competitiveness Index (cont’d.)
1.2:
Sus
tain
able
Com
petit
iven
ess
InfrastructureA. Transport infrastructure
G2.01 Quality of overall infrastructureG2.02 Quality of roadsG2.03 Quality of railroad infrastructureG2.04 Quality of port infrastructureG2.05 Quality of air transport infrastructureG2.06 Available seat kilometers *
B. Energy and telephony infrastructureG2.07 Quality of electricity supplyG2.08 Fixed telephone lines * ½
G2.09 Mobile telephone subscriptions * ½
Macroeconomic environmentj
G3.02 National savings rate *G3.04 Interest rate spread *G3.05 Government debt *G3.06 Country credit rating *S07 Government budget balance (5-year average) *
Environmental policyS08 Stringency of environmental regulationS09 Enforcement of environmental regulationS10 Eco-region protection *S11 No. of ratified international environmental treaties *
PHYSICAL ENVIRONMENT
Resource efficiencyS12 Energy intensity *S13 Agricultural water intensity *S14 CO2 intensity *
Management of renewable resourcesS15 Access to improved drinking water *S16 Marine trophic intensity *S17 Forest cover change *
Environmental degradationS18 Air pollution *S19 Water stress index *
NOTESa Formally, for a category i composed of i composed of i K indicators, we have:K indicators, we have:K
categoryiK
�k=1
indicatork
K
�
b Formally, we have:
6 x (country score – sample minimum) + 1 (sample maximum – sample minimum)
The sample minimum and sample maximum are, respectively, the lowest and highest country scores in the sample of economies covered by the GCI. In some instances, adjustments were made to account for extreme outliers. For those indicators for which a higher value indicates a worse outcome (e.g., disease incidence, government debt), the transformation formula takes the following form, thus ensuring that 1 and 7 still corresponds to the worst and best possible outcomes, respectively:
–6 x (country score – sample minimum) + 7 (sample maximum – sample minimum)
c Variables S01 and S02 combine to form one single variable.
d The impact of malaria, tuberculosis, and HIV/AIDS on competitive-ness depends not only on their respective incidence rates but also on how costly they are for business. Therefore, in order to estimate the impact of each of the three diseases, we combine its incidence rate with the Survey question on its perceived cost to businesses. To combine these data we first take the ratio of each country’s disease incidence rate relative to the highest inci-dence rate in the whole sample. The inverse of this ratio is then multiplied by each country’s score on the related Survey question. This product is then normalized to a 1-to-7 scale. Note that coun-tries with zero reported incidence receive a 7, regardless of their scores on the related Survey question.
e The competition subpillar is the weighted average of two com-ponents: domestic competition and foreign competition. In both components, the included variables provide an indication of the extent to which competition is distorted. The relative importance of these distortions depends on the relative size of domestic ver-sus foreign competition. This interaction between the domestic market and the foreign market is captured by the way we deter-mine the weights of the two components. Domestic competi-tion is the sum of consumption (C), investment (I), government spending (G), and exports (X), while foreign competition is equal to imports (M). Thus we assign a weight of (C + I + G + X)/(C + I + G + X + M) to domestic competition and a weight of M/(C + I + G + X + M) to foreign competition.
f Variables G6.06 and G6.07 combine to form one single variable.
g For variable G6.14, imports as a percentage of GDP, we first apply a log-transformation and then a min-max transformation. This indicator was formerly numbered G10.04. It still enters the computation of the market size indexes (see note j).
h The size of the domestic market is constructed by taking the natural log of the sum of the gross domestic product valued at purchased power parity (PPP) plus the total value (PPP estimates) of imports of goods and services, minus the total value (PPP esti-mates) of exports of goods and services. Data are then normal-ized on a 1-to-7 scale. PPP estimates of imports and exports are obtained by taking the product of exports as a percentage of GDP and GDP valued at PPP. The underlying data are reported in the data tables section.
i The size of the foreign market is estimated as the natural log of the total value (PPP estimates) of exports of goods and ser-vices, normalized on a 1-to-7 scale. PPP estimates of exports are obtained by taking the product of exports as a percentage of GDP and GDP valued at PPP. The underlying data are reported in the data tables.
j Unlike the macroeconomic environment pillar in the GCI, we have removed the inflation rate and we have replaced the annual government budget deficit with a five-year average.
The Global Competitiveness Report 2011-2012 © 2011 World Economic Forum

72
1.2:
Sus
tain
able
Com
petit
iven
ess
Appendix B: Technical notes and sources for the Sustainable Competitiveness Index variables
This appendix presents the technical descriptions and sources for the additional 19 variables that are specific to the Sustainable Competitiveness Index (SCI).These variables are identified by an “S” before the variable number. They appear here in order, from S01 through S19. The numbering indicates only the order of these variables in the structure, but not the pillar to which they belong.
The descriptions and sources for the variables common to the GCI are available in the Technical Notes and Sources at the end of the Report.
S01 Gross secondary enrollment rate, malesGross secondary enrollment rate, males | 2009The reported value corresponds to the ratio of total secondary enrollment among boys, regardless of age, to the male popula-tion of the age group that officially corresponds to the second-ary education level. Secondary education (ISCED levels 2 and 3) completes the provision of basic education that began at the primary level, and aims to lay the foundations for lifelong learn-ing and human development, by offering more subject- or skills-oriented instruction using more specialized teachers.
Sources: UNESCO Institute for Statistics (accessed May 4, Institute for Statistics (accessed May 4, Institute for Statistics2011); national sources
S02 Gross secondary enrollment rate, femalesGross secondary enrollment rate, females | 2009The reported value corresponds to the ratio of total second-ary enrollment among girls, regardless of age, to the female population of the age group that officially corresponds to the secondary education level. Secondary education (ISCED levels 2 and 3) completes the provision of basic education that began at the primary level, and aims at laying the foundations for lifelong learning and human development, by offering more subject- or skills-oriented instruction using more specialized teachers.
Sources: UNESCO Institute for Statistics (accessed May 4, Institute for Statistics (accessed May 4, Institute for Statistics2011); national sources
S03 Expected dependency ratioNumber of dependents (people younger than 15 or older than 64) to the working-age population (those aged 15–64) in 2030 | 2010
Source: Authors’ calculation based on United Nations World Population Prospects: The 2010 revision
S04 Gini indexMeasure of income inequality [0 = perfect equality; 1 = perfect inequality] | 2008This index measures the extent to which the distribution of income among individuals or households within an economy deviates from a perfectly equal distribution. A Lorenz curve plots the cumulative percentages of total income received against the cumulative number of recipients, starting with thepoorest individual. The Gini index measures the area between the Lorenz curve and a hypothetical line of absolute equality, expressed as a percentage of the maximum area under the line. Thus a Gini index of 0 represents perfect equality, while an index of 100 implies perfect inequality.
Sources: The World Bank, World Development Indicators & Global Development Finance Catalog (April 2011 edition); & Global Development Finance Catalog (April 2011 edition); & Global Development Financenational sources
S05 Youth unemploymentUnemployment, youth total (percent of total labor force ages 15–24) | 2009Youth unemployment refers to the share of the labor force ages 15–24 without work but available for and seeking employment.
Sources: The World Bank, World Development Indicators & Global Development Finance Catalog (April 2011 edition); & Global Development Finance Catalog (April 2011 edition); & Global Development Financethe World Bank in turn sources from the International Labour Organization, Key Indicators of the Labour Market database; Key Indicators of the Labour Market database; Key Indicators of the Labour Marketnational sources
S06 Extent of informal economyHow much economic activity in your country would you estimate to be undeclared or unregistered? [1 = most economic activity is undeclared or unregistered; 7 = most economic activity is declared or registered] | 2010–11 weighted average
Source: World Economic Forum, Executive Opinion Survey
The Global Competitiveness Report 2011-2012 © 2011 World Economic Forum
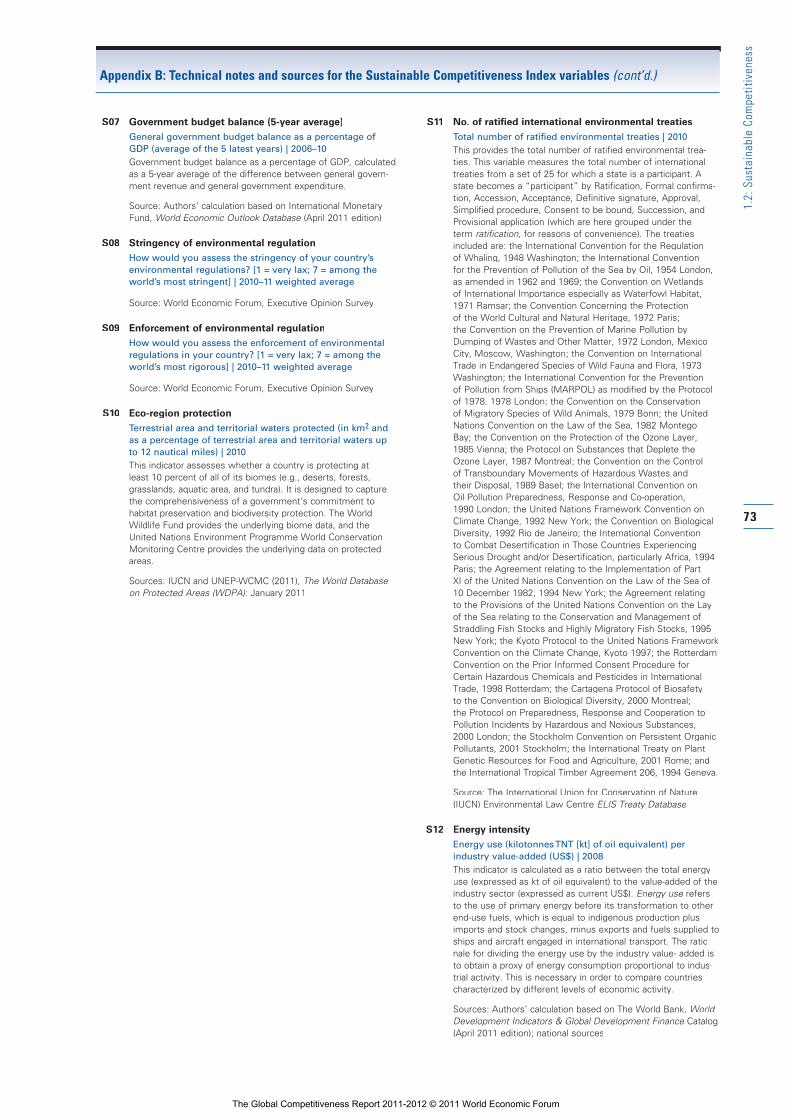
73
Appendix B: Technical notes and sources for the Sustainable Competitiveness Index variables (cont’d.)
1.2:
Sus
tain
able
Com
petit
iven
ess
S07 Government budget balance (5-year average)General government budget balance as a percentage of GDP (average of the 5 latest years) | 2006–10Government budget balance as a percentage of GDP, calculated as a 5-year average of the difference between general govern-ment revenue and general government expenditure.
Source: Authors’ calculation based on International Monetary Fund, World Economic Outlook Database (April 2011 edition)World Economic Outlook Database (April 2011 edition)World Economic Outlook Database
S08 Stringency of environmental regulationHow would you assess the stringency of your country’s environmental regulations? [1 = very lax; 7 = among the world’s most stringent] | 2010–11 weighted average
Source: World Economic Forum, Executive Opinion Survey
S09 Enforcement of environmental regulationHow would you assess the enforcement of environmental regulations in your country? [1 = very lax; 7 = among the world’s most rigorous] | 2010–11 weighted average
Source: World Economic Forum, Executive Opinion Survey
S10 Eco-region protectionTerrestrial area and territorial waters protected (in km2 and as a percentage of terrestrial area and territorial waters up to 12 nautical miles) | 2010This indicator assesses whether a country is protecting at least 10 percent of all of its biomes (e.g., deserts, forests, grasslands, aquatic area, and tundra). It is designed to capture the comprehensiveness of a government’s commitment to habitat preservation and biodiversity protection. The World Wildlife Fund provides the underlying biome data, and the United Nations Environment Programme World Conservation Monitoring Centre provides the underlying data on protected areas.
Sources: IUCN and UNEP-WCMC (2011), The World Database on Protected Areas (WDPA): January 2011
S11 No. of ratified international environmental treatiesTotal number of ratified environmental treaties | 2010This provides the total number of ratified environmental trea-ties. This variable measures the total number of international treaties from a set of 25 for which a state is a participant. A state becomes a “participant” by Ratification, Formal confirma-tion, Accession, Acceptance, Definitive signature, Approval, Simplified procedure, Consent to be bound, Succession, and Provisional application (which are here grouped under the term ratification, for reasons of convenience). The treaties included are: the International Convention for the Regulation of Whaling, 1948 Washington; the International Convention for the Prevention of Pollution of the Sea by Oil, 1954 London, as amended in 1962 and 1969; the Convention on Wetlands of International Importance especially as Waterfowl Habitat, 1971 Ramsar; the Convention Concerning the Protection of the World Cultural and Natural Heritage, 1972 Paris; the Convention on the Prevention of Marine Pollution by Dumping of Wastes and Other Matter, 1972 London, Mexico City, Moscow, Washington; the Convention on International Trade in Endangered Species of Wild Fauna and Flora, 1973 Washington; the International Convention for the Prevention of Pollution from Ships (MARPOL) as modified by the Protocol of 1978, 1978 London; the Convention on the Conservation of Migratory Species of Wild Animals, 1979 Bonn; the United Nations Convention on the Law of the Sea, 1982 Montego Bay; the Convention on the Protection of the Ozone Layer, 1985 Vienna; the Protocol on Substances that Deplete the Ozone Layer, 1987 Montreal; the Convention on the Control of Transboundary Movements of Hazardous Wastes and their Disposal, 1989 Basel; the International Convention on Oil Pollution Preparedness, Response and Co-operation, 1990 London; the United Nations Framework Convention on Climate Change, 1992 New York; the Convention on Biological Diversity, 1992 Rio de Janeiro; the International Convention to Combat Desertification in Those Countries Experiencing Serious Drought and/or Desertification, particularly Africa, 1994 Paris; the Agreement relating to the Implementation of Part XI of the United Nations Convention on the Law of the Sea of 10 December 1982, 1994 New York; the Agreement relating to the Provisions of the United Nations Convention on the Lay of the Sea relating to the Conservation and Management of Straddling Fish Stocks and Highly Migratory Fish Stocks, 1995 New York; the Kyoto Protocol to the United Nations Framework Convention on the Climate Change, Kyoto 1997; the Rotterdam Convention on the Prior Informed Consent Procedure for Certain Hazardous Chemicals and Pesticides in International Trade, 1998 Rotterdam; the Cartagena Protocol of Biosafety to the Convention on Biological Diversity, 2000 Montreal; the Protocol on Preparedness, Response and Cooperation to Pollution Incidents by Hazardous and Noxious Substances, 2000 London; the Stockholm Convention on Persistent Organic Pollutants, 2001 Stockholm; the International Treaty on Plant Genetic Resources for Food and Agriculture, 2001 Rome; and the International Tropical Timber Agreement 206, 1994 Geneva.
Source: The International Union for Conservation of Nature (IUCN) Environmental Law Centre ELIS Treaty Database
S12 Energy intensityEnergy use (kilotonnes TNT [kt] of oil equivalent) per industry value-added (US$) | 2008This indicator is calculated as a ratio between the total energy use (expressed as kt of oil equivalent) to the value-added of the industry sector (expressed as current US$). Energy use refers Energy use refers Energy useto the use of primary energy before its transformation to other end-use fuels, which is equal to indigenous production plus imports and stock changes, minus exports and fuels supplied to ships and aircraft engaged in international transport. The ratio-nale for dividing the energy use by the industry value- added is to obtain a proxy of energy consumption proportional to indus-trial activity. This is necessary in order to compare countries characterized by different levels of economic activity.
Sources: Authors’ calculation based on The World Bank, World Development Indicators & Global Development Finance Catalog Development Indicators & Global Development Finance Catalog Development Indicators & Global Development Finance(April 2011 edition); national sources
The Global Competitiveness Report 2011-2012 © 2011 World Economic Forum

74
Appendix B: Technical notes and sources for the Sustainable Competitiveness Index variables (cont’d.)
1.2:
Sus
tain
able
Com
petit
iven
ess
S13 Agricultural water intensityAgricultural water withdrawal as a percent of total renewable water resources | 2002This indicator is calculated as the ratio of (100 × Agricultural water withdrawal) to Total renewable water resources, where Total renewable water resources = (Total surface renewable water + Total renewable groundwater – Overlap between sur-face water and groundwater). Where available, Total renewable water resources include the percent of desalinated water used for agriculture (Kuwait, Saudi Arabia, the United Arab Emirates, Qatar, Bahrain, and Spain). They also include renewable fresh-water resources as well as the potential over-abstraction of renewable groundwater or the withdrawal of fossil ground-water, the use of agricultural drainage water, and desalinated water and treated wastewater. They include water withdrawn for irrigation purposes and for livestock watering, although—depending on the country—this last category sometimes is included in municipal water withdrawal. The value of water withdrawn for irrigation far exceeds the consumptive use of irrigation because of water lost in its distribution from its source to the crops. The term water requirement ratio (sometimes also water requirement ratio (sometimes also water requirement ratiocalled irrigation efficiency) is used to indicate the ratio between irrigation efficiency) is used to indicate the ratio between irrigation efficiencythe net irrigation water requirements or crop water require-ments, which is the volume of water needed to compensate for the deficit between potential evapotranspiration and effec-tive precipitation over the growing period of the crop, and the amount of water withdrawn for irrigation, including the losses. In the specific case of paddy rice irrigation, additional water is needed for flooding to facilitate land preparation and to protect plants. In that case, irrigation water requirements are the sum of rainfall deficit and the water needed to flood paddy fields. At the scheme level, water requirement ratio values can vary from less than 20 percent to more than 95 percent. For livestock watering, the ratio between net consumptive use and water withdrawn is estimated to be between 60 and 90 percent. By default, livestock water use is accounted for in agricultural water use, although some countries include it in municipal water withdrawal.
Sources: Environmental Performance Index (EPI), Yale University; Food and Agricultural Organization of the United Nations (FAO), Aquastat
S14 CO2 intensityCO2 intensity (kg of CO2 per kg of oil equivalent energy use) | 2007Carbon dioxide emissions from solid fuel consumption refer mainly to emissions from the use of coal as an energy source.
Sources: The World Bank, World Development Indicators & Global Development Finance Catalog (April 2011 edition); & Global Development Finance Catalog (April 2011 edition); & Global Development Financenational sources
S15 Access to improved drinking waterAccess to improved drinking water, percentage of population | 2008This variable refers to the percentage of the population with reasonable access to an adequate amount of water from an improved source, such as a household connection, public stand-pipe, borehole, protected well or spring, or rainwater collection. Unimproved sources include vendors, tanker trucks, and unpro-tected wells and springs. Reasonable access is defined as the Reasonable access is defined as the Reasonable accessavailability of at least 20 liters per person per day from a source within 1 kilometer of the dwelling.
Source: World Health Organization, World Health Statistics 2011, retrieved May 2011
S16 Marine trophic intensityTrend line slope | 2004This indicator measures the slope of the trend line in the Marine Trophic Index (MTI) from 1980 to 2004. If the slope is 0 or positive, the fishery is either stable or improving. If the slope is negative (below 0), it means the fishery is declining, and that smaller and smaller fish are being caught. Using the Sea Around Us website, data were gathered on the slope of the trend line in the Marine Trophic Index (MTI) from 1980 to 2004 for a country’s exclusive economic zones (EEZs). For countries with more than one EEZ, a weighted average slope was calculated on the basis of the relative size of the EEZs. The marine trophic level ranges from 1 in plants to 4 or 5 in larger predators. It expresses the relative position of fish and other animals in the hierarchical food chain that nourishes them. They provide food for small fish that have a trophic level of about 3, and the small fish are eaten by slightly larger fish that have a trophic level of 4, which, in turn, are what large predators such as sharks and marine mammals and humans typically eat (Pauly and MacLean 2003). If the average level at which a country’s fisheries are catching fish declines over time, it means that the overall the trophic structure of the marine ecosystem is becoming depleted of larger fish higher up the food chain, and is resorting to smaller fish.
Sources: Environmental Performance Index (EPI), Yale University; the Sea Around Us Project; the Convention on Biological Diversity
S17 Forest cover changeAnnual percent change in forest cover between 2000 and 2010 | 2000–2010
Source: Food and Agriculture Organization of the United Nations (FAO), State of the World’s Forests 2011
S18 Air pollutionAnnual average PM2.5 (particulate matter with an aerodynamic diameter less than or equal to 2.5 micrometers) concentration for 2001–06, population weighted by country | 2010This indicator is based on satellite data that are then converted to ground-level concentrations using the GEOS-Chem global chemical transport model to account for the meteorological and chemical factors that influence the spatially and temporally vary-ing relationship between column and surface concentrations. The 0.1 x 0.1° resolution aerosol optical depth (AOD) values for 2001–06 are derived from the NASA Terra MODIS and MISR sensors, averaged to get a 6-year mean AOD for each grid cell, and then population-weighted to better represent human expo-sure by country.
Source: NASA MODIS and MISR data, processed by Dalhousie University (van Donkelaar et al. [2010]), Battelle, and CIESIN
S19 Water stress indexPercentage of a country’s territory affected by oversubscription of water resources | 1995Countries can to some extent accommodate oversubscription in one region with inter-basin transfers, but these engender significant environmental impacts of their own. Thus, the ulti-mate target for each country is to have no area of their territory affected by oversubscription. A high degree of oversubscription is indicated when the water use is more than 40 percent of available supply. This indicator is calculated as: Total freshwater withdrawal (surface water + groundwater) + Desalinated water produced + Treated wastewater reused, as a percent of total renewable water resources.
Sources: Environmental Performance Index (EPI), Yale University; University of New Hampshire, Water Systems Analysis Group
The Global Competitiveness Report 2011-2012 © 2011 World Economic Forum