Embed Size (px)
Citation preview
The Long-lasting E↵ects of Newspaper Op-Eds on Public Opinion⇤
Alexander Coppock
†
, Emily Ekins
‡
, and David Kirby
§
.
August 24, 2016
Abstract
Do newspaper opinion pieces change the minds of those who read them? We conduct two
randomized panel survey experiments on elite and mass convenience samples to estimate the
e↵ects of five op-eds on policy attitudes. We find very large treatment e↵ects on target issues,
equivalent to shifts of 10 to 20 percentage points, that persist for at least one month. We
find essentially no treatment e↵ects on non-target issues, suggesting that our subjects read,
understood, and were persuaded by the arguments presented in these op-eds. We find limited
evidence of treatment e↵ect heterogeneity by party identification: Democrats, Republicans and
independents all appear to move in the predicted direction by similar magnitudes. We conduct
this study on both a sample of Amazon Mechanical Turk workers and a sample of elites. Despite
large di↵erences in demographics and initial political beliefs, we find that op-eds were persuasive
to both the mass public and elites, but marginally more persuasive among the mass public. Our
findings add to the growing body of evidence of the everyday nature of persuasion.
⇤This research was reviewed and approved by the Columbia University Institutional Review Board (IRB-AAAP9305). Except where indicated, all analyses were pre-registered at egap.org.
†Alexander Coppock is Assistant Professor of Political Science at Yale University‡Emily Ekins is a Research Fellow at the Cato Insitute§David Kirby is a Vice President and Senior Fellow at the Cato Institute
1
“As the world has grown smaller, the nation more powerful, the problems besetting man infinitely more
complex, the pressures more intense, the health of this democracy has increasingly depended on deeper
public understanding of di�cult issues. Through the new page opposite the Editorial Page that we
inaugurate today, we hope that a contribution may be made toward stimulating new thought and provoking
new discussion on public concerns.”
New York Times, September 21, 1970
The modern “opposite the Editorial Page,” or op-ed, debuted in the New York Times on
September 21, 1970. At its launch, opinion pieces were designed to provide an intellectual arena
to provoke new ideas and discussion on public policies (Times, 1970a).1 John B. Oakes, editor of
the Times, had long argued that the central function of newspaper should be to “interpret [the]
age to the general public” while avoiding the the inaccessibilities of elitism (quoted in Socolow
(2010)). The Times intended to create a forum to host a variety of outside experts to articulate
their arguments and engage in the “exchange and clash of ideas” for the benefit of the general
public, their intended audience (Times, 1970b). In fact, when deciding whether to launch the op-ed
pages, the Times publisher believed an op-ed page would help maintain readership as the paper
raised prices. Thus, from its inception, the op-ed was intended to be written by a diverse array
of elite experts on the salient issues of the day with the purpose of prompting civic discourse and
learning among the general public. Indeed many view the op-ed pages today as a mechanism that
continues to shape public opinion (Porpora and Nikolaev, 2008). In the more than 40 years since,
the op-ed format has grown widely, with nearly every major print and online newspaper publishing
two to three op-eds per day (Sommer and Maycroft, 2008).
Present-day newspaper op-eds are very similar in form to those envisioned in the 1970s: expert
elites publish policy opinions intended to provoke debate among the general public (Sommer and
Maycroft, 2008). However, today it is acknowledged that op-ed pages of major papers set the agenda
not only for the general public but also fellow elites2 (Alexander, 2004; Sommer and Maycroft, 2008;
Nico Calavita, 2003; Rosenfeld, 2000; Golan, 2013). For instance, Sommer and Maycroft (2008)
claim that during legislative debate, lawmakers routinely circulate op-eds in e↵orts to persuade
colleagues to their point of view.
Do op-eds accomplish either the goal of persuading the mass public or persuading elites? A
large research literature has shown that members of the mass public know little about the nuanced
details of politics and public policy (Neuman, 1986; Somin, 1998; Delli Carpini and Keeter, 1996;
Berelson, Lazarsfeld and McPhee, 1954; Campbell et al., 1960; Converse, 1964). Given low levels
of political knowledge, one might expect that complex arguments that depend on understanding
1Newspaper pieces that bear some resemblance to the modern op-ed can be traced back as early as 1912 whenthe Chicago Tribune featured a separate page dedicated to outside opinion. New York World editor Herbert BayardSwope was first to structure a section of commentary opposite the editorial page. Several newspapers followed suitsuch as the Washington Post who featured an “op-ed page” in the 1930s, and the Los Angeles Times in the 1950s(Socolow, 2010).
2We take a broad view of “elites,” among whom we include lawmakers, journalists, Hill sta↵ers, economists,lawyers, and political and policy professionals of all stripes.
2

nuanced policy details would be ine↵ective among a general audience that at best has a hazy grasp
of the terms of the debate. Some scholars have suggested that op-ed pages are “o↵ limits” to average
people because of elite authorship and focus on complex policy topics (Ciofalo and Traveso, 1994).
If op-eds are ine↵ective at changing mass opinion, should they be expected to change the minds
of elites? Since elites are more politically aware and exposed to more policy arguments, they may
be more selective of which policy considerations they decide to accept and process (Zaller, 1992).
They may also be more resistant to information that conflicts with their political identities.
If it were the case that neither of the intended audiences, mass or elite, actually updates their
views as a result of exposure to op-eds, why would anyone write them? Perhaps it flatters the
egos of op-ed writers to see their names in print. Perhaps op-eds bolster the authors’ influence
within elite policy circles by virtue of increased name recognition or “buzz.” Or perhaps op-eds are
ine↵ective at changing minds, but newspapers publish them anyway because they attract readers
who already agree with the message: Op-eds may preach to the choir, but at least the choristers
generate ad revenue.
We take up the question of whether newspaper op-eds actually achieve their original objective
of changing minds. If so, do they have greater impact among the mass public or elites? Do op-eds
change the minds of readers ideologically opposed to the author’s argument? Are opinion changes
persistent or ephemeral?
In this paper we present results from two large-scale randomized panel survey experiments that
estimate the e↵ects of newspaper policy op-eds on public opinion, one among a mass sample and the
other among elite opinion leaders, with three main results. For both mass public and elite samples,
we randomly assigned respondents to receive one of several newspaper policy op-eds or not. All
respondents then took the same public opinion survey that included policy questions regarding
policies related to each of the several op-ed treatments used. We then administered two follow-up
surveys to the mass public sample and one follow-up survey to the elite sample to determine if any
measured persuasive e↵ects endured.
We find, first, find large treatment e↵ects among both the mass public and elites, despite large
di↵erences in demographics and initial political beliefs. Consistent with expectations, these e↵ects
are somewhat smaller among elite readers. Second, we find limited evidence of heterogeneous
treatment e↵ects by partisan identification. This indicates that op-eds do not merely “preach to
the choir” by only changing the opinions of aligned ideological adherents. Instead, we find that
Democrats, Republicans, and independents update their opinions in the predicted direction of the
op-ed and by similar magnitudes. Third, we find that policy op-eds have a very large treatment
e↵ects on target issues that persist for at least one month, suggesting that e↵ects are due to
underlying attitude change and not simply experimenter demand or survey artifacts.
Our study di↵ers from previous work in several ways. First, we use real, unmodified opinion
pieces as treatments. This choice means that we cannot describe what particular feature of the
3

op-ed was the causal agent that changed minds, but what we lose in our ability to separate out
mechanisms, we gain back in realism. Second, we unbundle the opinion piece from the rest of
the newspaper, allowing us to understand the specific impact of the op-ed separate from the news
of the day. Third, as recent changes in survey technology have made panel studies cheaper and
more feasible, we measure outcomes over the course of an entire month, allowing us to estimate the
persistence of the persuasive e↵ects of these treatments.
1 Previous Literature
As Ciofalo and Traveso (1994) note, there is little scholarly research of the origins, role, and e↵ect of
newspaper op-eds. Furthermore, to our knowledge, no previous study has specifically investigated
the persuasive e↵ects of newspaper op-eds on policy opinions of readers. The extant research
has tended to focus on op-eds’ use of issue-framing, not persuasion specifically (e.g. Porpora and
Nikolaev (2008); Golan (2010, 2013)).
More has been written about the e↵ects of newspapers generally, not just the op-ed section.
These investigations into the persuasive e↵ect of newspaper media content on public opinion gen-
erally fall into two categories. The first is observational studies that use aggregate data to try
and demonstrate a causal link between newspaper exposure and political outcomes. Exposure is
often operationalized as newspaper “slant.” Overall, these studies tend to conclude that newspaper
content impacts voters’ candidate evaluations and political knowledge. For instance, Dalton, Beck
and Huckfeldt (1998) examine the correlation between media content and voter preferences in the
1992 election and find that newspaper editorials were a statistically significant predictor of candi-
date favorability. Druckman and Parkin (2005) focus on a single Senate race find that editorial
slant of two local newspapers is predictive of both candidate evaluations and vote choice. Jerit,
Barabas and Bolsen (2006) find that variations in quantities of newspaper and broadcast coverage
of political issues is correlated with political knowledge, with this relationship appearing strongest
among the more educated. Nicholson (2003) voters were more aware of ballot initiatives if featured
in a major newspaper, controlling for other aspects of the political environment leading up to an
election.
Drawing causal inferences from these studies can require strong assumptions, in particular that
people who are exposed one level of “slant” are otherwise similar to those who are exposed to a
di↵erent level. This problem is compounded by measurement error in the independent variable.
People have poor recall and inaccurately report what they have seen and read (Guess, Forthcom-
ing)), and furthermore, errors associated with respondent recall can be correlated with political
attitudes (Vavreck et al., 2007). For instance, individuals who are more interested in politics are
more likely to receive and recall media messages and thus di↵er systematically from those who
don’t recall receiving media content.
The second category of studies examining the e↵ects of newspapers generally are randomized
4
experiments in which the researcher directly controls the content to which subjects are exposed.
DeFleur et al. (1992) measure the e↵ect of exposing respondents to news stories from various types
of media on recall and knowledge of the news stories, finding that people learned the most from
newspapers. Norris and Sanders (2003) found campaign issue information transmitted through
various platforms increased political knowledge of the parties, but did not find newspapers to out-
perform other types of media. In their book, W. Russell Neumann (1992) expose respondents to
parallel news stories from di↵erent types of media and measure the impact on political knowledge,
finding that newspapers did increase knowledge although broadcast media was more e↵ective among
those with average cognitive ability. Nyhan and Reifler (2010); Thomas Wood (2016) use altered
newspaper op-eds as part of their treatments. They measure the e↵ect of adding corrective infor-
mation to altered newspaper op-eds on readers perceptions of facts. They find that by and large
readers update their misperceptions when corrected with reputable facts and that some corrections
are more e↵ective than others.
Two previous studies have examined the impact of newspapers in a field experimental setting.
Alan S. Gerber (2009) randomly sent Virginia residents either the left-leaning Washington Post,
the right-leaning Washington Times, or neither, and found little evidence of di↵erences in political
knowledge, opinions about political events, or voter turnout. However they do find that receiving
either paper led to increased support for the Democratic gubernatorial candidate. The treatments
in that study were the entire newspapers, including but not limited to the opinion pages. Jerit,
Barabas and Cli↵ord (2013) conduct and contrast both laboratory and field experiments of news-
paper article stories on knowledge and policy attitudes. In the laboratory experiment they find
large treatment e↵ects on some attitudes but find weak evidence of newspaper impact on attitudes
or knowledge in the field experiment. Of the 17 outcome measures reported, only one attitudinal
measure registered a significant e↵ect.
Taken together, the existing scholarly record on the e↵ects of newspapers on political attitudes
and behavior is mixed. Observational studies estimate positive e↵ects, but those estimates may be
prone to bias due to measurement error and unobserved heterogeneity. The survey and laboratory
experimental literature finds that newspapers can indeed increase political knowledge. The existing
field experimental evidence on this point shows no evidence of a consistent relationship, though it
should be noted that compliance with the experimental treatments may have been low, indicating
that these studies were underpowered to detect the modest e↵ects measured by other research
designs.
Our reading of the previous literature leads us to five hypotheses:
• (H1) We expect that newspaper op-eds can influence the opinions of readers ontarget issues in the direction intended by the author. Expectancy value and acces-sibility models of how mass media information impacts public opinion contend that surveyresponse is a product of respondents’ considerations and the weights associated with the re-
5

spective considerations (Ajzen and Fishbein, 1980; Zaller, 1992; Nelson, Clawson and Oxley,1997; Iyengar, 1990; Chong and Druckman, 2012). Accordingly, survey response results fromthe balance of political messages, or considerations, received and resisted and how recentlythose considerations have been brought to mind (Zaller, 1992). Applying the expectancyvalue model to previous studies of newspaper e↵ects suggests that such studies’ newspapertreatments influenced the combination of considerations available to impact opinion response.Consequently, we’d expect newspaper op-eds to influence readers’ opinion on target issues inthe intended direction.
• (H2) We do not expect op-eds to impact attitudes on non-target issues. Since thescope of treatment is a single policy opinion piece, we avoid introducing competing consider-ations and thus we do not expect op-eds to impact attitudes on non-target issues.
• (H3) We expect the e↵ects of opeds would be smaller among elites comparedto the mass public Existing research would lead us to expect smaller treatment e↵ectsamong elites, since elites are more politically sophisticated, are exposed to more policy argu-ments than the mass public, and have more stable attitudes (Jennings, 1992; Feldman, 1989;Putnam, Leonardi and Nanetti, 1979). Expectancy models of public opinion anticipate thatsurvey responses are a product of respondent’s considerations available at the top of theirheads and the weights associated with the respective considerations (Ajzen and Fishbein,1980; Zaller, 1992; Nelson, Clawson and Oxley, 1997; Chong and Druckman, 2012). Accord-ingly, influential considerations result from the balance of political messages received andresisted and how recently those considerations have been brought to mind (Zaller, 1992). Za-ller postulates, “If citizens are well informed, they react mechanically to political ideas on thebasis of external cues about their partisan implications, and if they are too poorly informedto be aware of these cues, they tend to uncritically accept whatever ideas they encounter.”(p. 45)’ Consequently, we would expect that if anything, e↵ects of opeds would be smalleramong elites compared to the mass public.
• (H4) We expect hetergenous treatment e↵ects by respondent party identification.A similar line of reasoning to H3 suggests that we may also find smaller e↵ects among subjectswhose political identities are at odds with the op-ed’s policy argument. Such readers mayresist information inconsistent with their ideology, suggesting heterogeneous treatment e↵ectsacross partisan groups.
• (H5) We expect that treatments should have lasting treatment e↵ects. Baden andLecheler (2012) argue that informational treatments should have more enduring e↵ects. Sinceour treatments are full-length real op-eds, and thus laden with policy-relevant information,we anticipate that treatment e↵ects should persist.
2 Study 1: Mechanical Turk
We enrolled 3,567 subjects on Amazon’s Mechanical Turk (MTurk) into a three-wave panel sur-
vey.3 Participants were o↵ered $1.00 for each wave of the survey they completed. In Wave 1, we
3Some research conducted on MTurk has been criticized on external validity grounds. While we are sensitiveto such concerns, we also note that recent replication e↵orts (Mullinix et al., 2015; Coppock, 2016) have shown
6

collected pre-treatment background variables, exposed subjects to one of five treatment op-eds (or
nothing), and collected immediate outcomes. Ten days later, we recontacted subjects for Wave 2, in
which we collected outcomes a second time. Wave 2 included a cross-cutting distraction experiment
(the results of which are detailed in the appendix) to guard against the possibility that respon-
dents simply remember how they answered the questions last time or if respondents imagined that
the researchers were looking for particular answers. Wave 3, conducted 30 days after treatment,
collected outcomes a third and final time.
This design is summarized in Table 1. We obtained a recontact rate of 82% in Wave 2 and
67% in Wave 3. The treatment does not appear to have influenced whether subjects respond in
subsequent waves. Using chi-square tests, we fail to reject the null hypothesis that treatment status
and response in follow-up waves are independent (Wave 2: p = 0.11; Wave 3: p = 0.62).
Table 1: MTurk Experimental Design
Treatment Condition
Wave 1 Control Amtrak Climate Flat Tax Veterans Wall Street TotalsN 622 597 570 587 592 603 3571
Wave 2 Control Amtrak Climate Flat Tax Veterans Wall Street TotalsDistraction 263 240 252 243 256 243 1497
No Distraction 253 247 240 243 257 261 1501
Responded 516 487 492 486 513 504 2998Did not respond 106 110 78 101 79 99 573
Wave 3 Control Amtrak Climate Flat Tax Veterans Wall Street TotalsResponded 433 412 386 386 412 422 2451
Did not respond 189 185 184 201 180 181 1120
We analyze our experiment in two main ways. The first simply compares mean outcomes
in each treatment group to the control group. This approach has the advantage of making no
assumptions about how the op-eds might influence attitudes on non-target issues. The second
approach compares mean outcomes in each treatment group to all other treatment conditions,
essentially rolling the other treatment groups in with the control subjects. The main advantage
of this approach is increased statistical precision, but the interpretation of the resulting estimates
can be tricky. If we assume that treatments do not a↵ect attitudes towards non-target issues, then
pooling these groups together presents no problem. If treatment can a↵ect non-target issues, then
this e↵ect can be interpreted as the e↵ect of treatment in a “noisy” information environment. As
shown in the results section, this distinction turns out not to matter much, either for precision or
that experimental estimates obtained on Mechanical Turk correspond very closely with those obtained on nationally-representative samples. For this reason, we believe that our MTurk sample will provide estimates of the e↵ects ofnewspapers among the “mass” public to a first approximation.
7

interpretation: we obtain similar answers using both approaches.
2.1 Treatments
Our treatments consisted of op-eds advocating for libertarian policy positions. Table 2 presents the
op-ed topics, titles, authors, and publication outlets. Cato Institute scholars authored four of the
op-eds and a presidential candidate, Sen. Rand Paul (R-KY), authored the fifth op-ed. The op-ed
on Amtrak argues that government spends transportation funds ine�ciently, using new revenue to
build new projects rather than to maintain and repair existing infrastructure, such as old rail lines.
The author argues for Amtrak and other infrastructure to be funded through user fees rather than
general taxes to ensure money goes toward its intended purpose. The op-ed on climate change
suggests that natural causes also contribute toward climate change and that politicians unjustly
wield their political power to bully climate scientists who challenge “alarmist claims about the
climate.” The op-ed on the Department of Veterans A↵airs criticizes the mismanagement of the
VA and argues to replace the government run veterans health care system with a voucher system
in which the government would give money to veterans to purchase private health insurance. The
op-ed on Wall Street argues that Wall Street bankers are not all bad and help e�ciently allocate
investment funds to the companies that need it to produce valued consumer goods. The op-ed on
the flat tax suggests that we “blow up the tax code” and adopt a flat tax of roughly 14 percent on
incomes over $50,000, arguing that this would help all Americans not just wealthy Americans by
eliminating tax loopholes.
To ensure the experience of reading the op-eds was as similar as possible to how respondents
would encounter them in print or online, we preserved key visual elements such as the publication
masthead logo, title and subtitle typesetting, font, font size and color, and byline with position
and a�liation information. We include the full text of the treatments, as they were seen by our
subjects, in the appendix.
2.2 Outcome Measures
Each of the issue areas addressed by our treatment opinion pieces is complex and multifaceted.
In order to measure our subjects’ policy attitudes, we endeavored to select questions that were as
closely related to the specific arguments made by the op-eds. When possible, we selected standard
survey questions to measure relevant attitudes. We chose four or five questions for each issue area.
The wording for all dependent variables are given in the appendix.
We will present the e↵ects of treatment on our dependent variables in three ways. First, in our
pre-analysis plan, we selected one question per topic to be the “main” dependent variable. These
variables are all 7-point scales, with higher values indicating more libertarian attitudes. Second,
we constructed composite scales for each attitude, using all of the questions in the corresponding
issue area. The scale was constructed by estimating a factor analysis model with two factors each,
8

Table 2: Op-Ed Treatments
Treatment Title Author Publication
Amtrak The Amtrak Crash: IsMore Spending theAnswer?
Randal O’Toole Newsweek
Climate The Political Assaulton Climate Skeptics
Richard S. Lindzen The Wall Street Journal
Flat Tax Blow Up the Tax Codeand Start Over
Rand Paul The Wall Street Journal
Veterans The Other VeteransScandal
Michael F. Cannon andChristopher Preble
The New York Times
Wall Street Wall Street O↵ers VeryReal Benefits
Thaya Knight USA Today
subjecting the resulting scores to the varimax rotation, and extracting the first dimension. This
model was estimated on the control group only. The scores have unit variance in the control group,
so any average shift can be interpreted directly in standard deviations. We use the same model to
generate scores for the second and third waves, i.e., the measurement model does not change over
time (or across experiments). Third, we calculate dichotomous “agreement” dependent variables by
splitting the composite scale variable at the median in the control group. We will use this variable
in Section 5 when discussing the cost per “mind changed.” By construction, exactly 50% of the
control group “agrees” with the Op-ed author; we assess the e↵ects of treatment on increasing this
agreement score.4
The main dependent variables are listed below. In each case, outcomes are coded so that higher
values correspond to the predicted direction of the treatment e↵ect due to the corresponding opinion
piece.
• Amtrak Main DV: Do you think the government should spend more, less, or about what it
does now on transportation and infrastructure? [7pt scale, 1:A lot more to 7: A lot less]
• Climate Main DV: Would you say that climate change is best described as a... [7pt scale, 1:
Crisis to 7: Not a problem at all]
• Flat Tax Main DV: Would you favor or oppose changing the federal tax system to a flat tax,
where everyone making more than $50,000 a year pays the same percentage of his or her
income in taxes? [7pt scale, 1: Strongly Oppose to 7: Strongly Favor]
4In this spirit of full disclosure, we note that the second (scales derived from factor analysis models) and third(agreement) measurement strategies were not included in the preanalysis plan.
9

• Veterans Main DV: How much confidence do you have in the Department of Veterans A↵airs’
ability to care for veterans? [7pt scale, 1: A great deal, 7: None at all]
• Wall Street Main DV: How much confidence do you have in Wall Street bankers and brokers
to do the right thing? [7pt scale, 1: None at all, 7: A great deal]
2.3 Results
In this section, we present the immediate e↵ects of treatment on our main dependent variables
(Table 3) and composite scale variables (Table 4). For a visualization of the e↵ects of our treatments
on all 21 dependent variables, see the online appendix.
All five treatments appear to have had large, robust e↵ects on attitudes, either as measured
by the main dependent variables or by the composite scale. Turning first to the main dependent
variables, the size of the treatment e↵ects of the op-eds on their target issues varied from 0.429
scale points (on a 1 to 7 scale) for the climate piece to 0.917 scale points for the wall street piece.
All five of the e↵ects on their target dependent variables are statistically significant at p < 0.001.
The e↵ects of the op-eds on the non-target issues are all close to zero. Of the 20 treatment e↵ects
on non target issues, only two are statistically significant (Flat Tax op-ed on Amtrak outcome and
Wall Street op-ed on Veterans outcome).
Table 3: MTurk Experiment: Treatment E↵ects on Main Dependent Variables
Amtrak Climate Flat Tax Veterans Wall Street
Op-ed: Amtrak 0.440⇤⇤⇤ �0.020 0.056 �0.056 �0.035(0.085) (0.095) (0.108) (0.082) (0.079)
Op-ed: Climate 0.054 0.427⇤⇤⇤ 0.132 �0.009 0.026(0.079) (0.098) (0.110) (0.082) (0.080)
Op-ed: Flat Tax 0.195⇤⇤ 0.130 0.850⇤⇤⇤ �0.033 �0.018(0.078) (0.097) (0.109) (0.082) (0.079)
Op-ed: Veterans 0.047 0.032 �0.106 0.770⇤⇤⇤ �0.124(0.079) (0.095) (0.110) (0.078) (0.078)
Op-ed: Wall Street 0.038 0.079 0.151 �0.210⇤⇤ 0.915⇤⇤⇤
(0.078) (0.095) (0.107) (0.084) (0.082)Constant (Constant) 2.902 2.773 3.738 4.502 2.616
(0.054) (0.065) (0.076) (0.058) (0.054)N 3,571 3,571 3,571 3,571 3,571R2 0.012 0.008 0.026 0.048 0.061⇤p < .1; ⇤⇤p < .05; ⇤⇤⇤p < .01Models estimated via OLS. Robust standard errors in parentheses.
The treatment e↵ects reported in Table 4 are in terms of the composite scales, and can be
interpreted in standard units. The e↵ect sizes on the target issues are quite large. The smallest is
again the e↵ect of the climate op-ed on the climate scale, at 0.278 standard deviations, while the
10

Table 4: MTurk Experiment: Treatment E↵ects on Composite Scale Dependent Variables
Amtrak Climate Flat Tax Veterans Wall Street
Op-ed: Amtrak 0.501⇤⇤⇤ 0.018 0.005 0.051 �0.034(0.059) (0.056) (0.056) (0.056) (0.054)
Op-ed: Climate 0.078 0.276⇤⇤⇤ 0.045 �0.007 0.008(0.056) (0.057) (0.057) (0.056) (0.055)
Op-ed: Flat Tax 0.080 0.110⇤⇤ 0.488⇤⇤⇤ 0.048 �0.023(0.055) (0.056) (0.060) (0.056) (0.056)
Op-ed: Veterans 0.044 0.003 �0.026 0.646⇤⇤⇤ �0.090⇤
(0.058) (0.057) (0.057) (0.054) (0.054)Op-ed: Wall Street 0.055 0.067 0.097⇤ �0.113⇤⇤ 0.698⇤⇤⇤
(0.055) (0.057) (0.057) (0.057) (0.056)Constant (Constant) �0.125 �0.079 �0.101 �0.103 �0.096
(0.039) (0.039) (0.039) (0.040) (0.038)N 3,571 3,571 3,571 3,571 3,571R2 0.029 0.009 0.030 0.063 0.076⇤p < .1; ⇤⇤p < .05; ⇤⇤⇤p < .01Models estimated via OLS. Robust standard errors in parentheses.Dependent variables are constructed via factor analysis and have unit variance.
remainder range from about 0.5 to 0.7 standard deviations. By this measure as well, the cross-issue
e↵ects are small to non-existent.
In summary, the e↵ects of the newspaper opinion pieces were large, positive, and statistically
significant. Our hypothesis H1, that op-eds would a↵ect attitudes on target issues, is strongly
supported in the MTurk sample. Hypothesis H2, that the op-eds would not move attitudes on
non-target issues, was also strongly supported.
3 Study 2: Elites
In order to explore whether the results from the Mechanical Turk study would generalize to the
other presumed target of op-eds in national newspapers, we conducted a nearly identical study
among individuals one might characterize as “elite.” We began with a database of 32,498 email
addresses of individuals that we considered, broadly, to be political or policy professionals. Our list
included nearly 3,800 law professors, 6,000 government a↵airs and hill sta↵ers, 4,500 journalists,
1,500 think tank professionals, and 10,000 financiers. We did not o↵er these subjects any incen-
tives for participation because we were cautioned that many government o�cials are specifically
prohibited from accepting “gifts” of any kind. We assured all subjects that their answers would be
kept fully anonymous. The experimental treatments and outcome measures were identical to the
Mechanical Turk study, but we dropped the “climate” treatment arm because we anticipated that
our final sample would be too small to support the full six-arm design.
11

We invited these elite subjects to participate in our study by first sending a pre-invitation email
indicating that we would be sending a survey link in a few days. We sent this link and two reminders
to those who had not yet responded. This procedure yielded 2,169 subjects who completed our
survey. As in the MTurk study, we asked subjects to participate in a follow-up survey after 10 days;
after two reminders, we obtained 1,349 complete responses. Table 5 displays the experimental design
as well as the number of subjects in each arm that we were able to recontact.5
Table 5: Elite Experimental Design
Treatment Condition
Wave 1 Control Amtrak Flat Tax Veterans Wall Street TotalsN 448 407 463 438 425 2181
Wave 2 Control Amtrak Flat Tax Veterans Wall Street TotalsDistraction 139 135 126 132 138 670
No Distraction 141 126 141 148 132 688
Responded 280 261 267 280 270 1358Did not respond 168 146 196 158 155 823
The resulting sample is by no means a probability sample of all “elites” in the United States.
First, there exists no commonly-accepted definition of elite, nor does there exist a list of such
elites from which to draw a representative sample. Second, many subjects declined to participate
because they “don’t take political surveys” or were “too busy.” We heard from many journalists
in particular who reported that they were not permitted by their employers to take surveys. Our
elite subjects, like our MTurk subjects, constitute a convenience sample.
The elites di↵er in substantively important ways from the Mechanical Turk sample. They are
older, whiter, more male, better educated, and hold stronger partisan attachments.6
3.1 Results
In this section, we present the immediate e↵ect of treatment on our main dependent variables (Ta-
ble 6) and composite scale variables (Table 7). As expected, we find moderately large, statistically
significant e↵ects of our treatments on policy attitudes for each of the four policy op-eds among our
elite sample. Turning first to main dependent variables, we found statistically significant treatment
e↵ects for three of the four treatments (Amtrak, Flat Tax, Wall Street) at p < 0.001, but did not
for the Veterans op-ed treatment. The size of the treatment e↵ects of the op-eds on their target
issues ranged from .434 scale points (on a 1 to 7 scale) for the Flat Tax treatment to .802 scale
5See the appendix for a demonstration that attrition was unrelated to treatment assignment.6These di↵erences are all highly statistically significant, as determined by chi2 tests. See the appendix for a
complete demographic breakdown of both samples.
12

points for the Wall Street op-ed. We find no evidence of cross-issue e↵ects of the treatments on
non-target issues for the main dependent variables.
Table 7 presents the treatment e↵ects in terms of the standardized composite issue scales. We
find statistically significant treatment e↵ects for three of the four treatments (Amtrak and Wall
Street at p < 0.001; Veterans at p < 0.05), but did not for the Flat Tax treatment. Thus, we
find significant treatment e↵ects for the Flat Tax op-ed using the main dependent variable but
not the composite scale variable, and the reverse is true for the Veterans A↵airs op-ed. For a
visualization of the e↵ects of our treatments on all 16 dependent variables, see the online appendix.
The treatment e↵ect sizes on their target issues range from .156 for the Veterans treatment to .58
for the Wall Street treatment. The e↵ects of the op-eds on non-target issues are all close to zero.
Of the 16 treatment e↵ects on non-target issues, only one is statistically significant (Amtrak op-ed
on Veterans outcome).
The elite experiment shows that even individuals with presumably well-formed and consistent
opinion about politics can nevertheless change their minds in response to fact-based, reasoned
arguments. Hypotheses H1 and H2 are supported in the elite sample as well.
Table 6: Elite Experiment: Treatment E↵ects on Main Dependent Variables
Amtrak Flat Tax Veterans Wall Street
Op-ed: Amtrak 0.438⇤⇤⇤ �0.094 0.069 0.071(0.110) (0.150) (0.093) (0.103)
Op-ed: Flat Tax �0.023 0.411⇤⇤⇤ �0.060 �0.004(0.101) (0.144) (0.091) (0.101)
Op-ed: Veterans �0.004 �0.156 0.045 0.119(0.103) (0.147) (0.091) (0.101)
Op-ed: Wall Street 0.042 0.067 �0.055 0.791⇤⇤⇤
(0.109) (0.148) (0.093) (0.105)Constant (Constant) 2.304 3.578 4.585 2.926
(0.073) (0.103) (0.064) (0.071)N 2,181 2,181 2,181 2,181R2 0.012 0.008 0.001 0.037⇤p < .1; ⇤⇤p < .05; ⇤⇤⇤p < .01Models estimated via OLS. Robust standard errors in parentheses.
3.2 Heterogeneous E↵ects by Experimental Sample
Our hypothesis H3 posited that while we predicted that op-eds would sway the opinions of both
elite and mass subjects, the treatment e↵ects would be lower for the elite sample. Table 8 provides
some evidence in support of that claim. The di↵erence between the e↵ects obtained on MTurk
and the elite sample are represented by the interaction terms. On each of the target dependent
variables, the treatment e↵ect for elites was smaller. For example, the e↵ect of the Amtrak op-
13
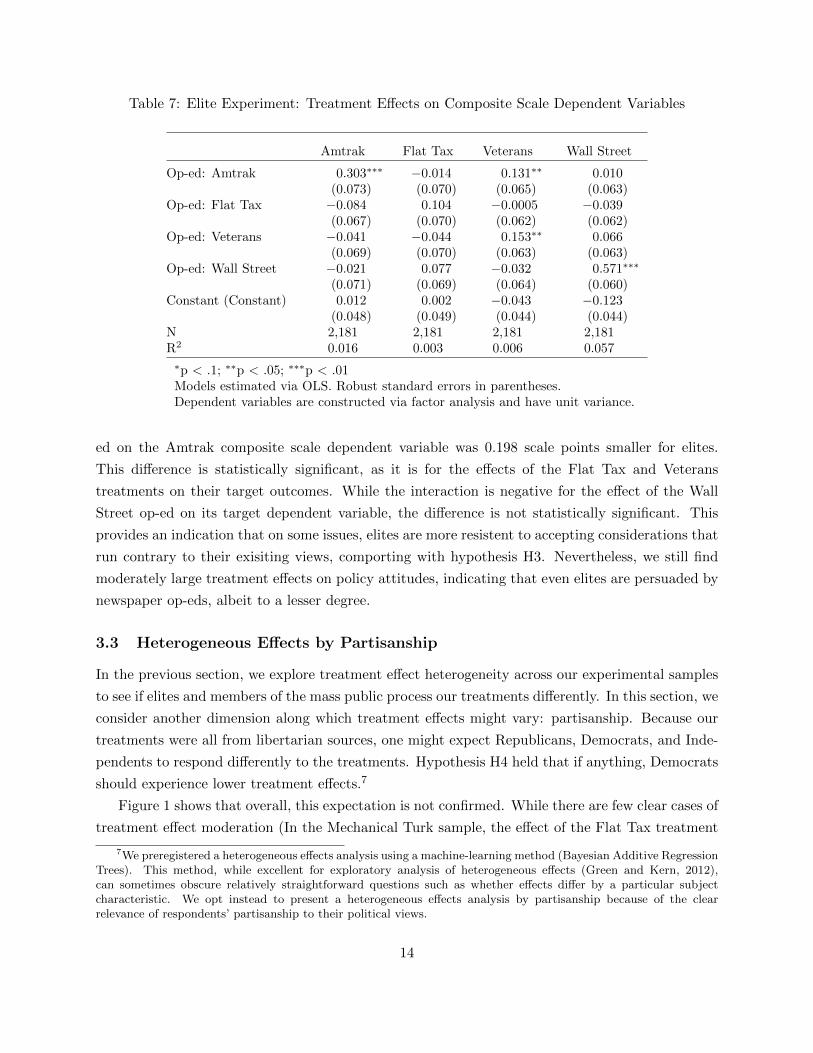
Table 7: Elite Experiment: Treatment E↵ects on Composite Scale Dependent Variables
Amtrak Flat Tax Veterans Wall Street
Op-ed: Amtrak 0.303⇤⇤⇤ �0.014 0.131⇤⇤ 0.010(0.073) (0.070) (0.065) (0.063)
Op-ed: Flat Tax �0.084 0.104 �0.0005 �0.039(0.067) (0.070) (0.062) (0.062)
Op-ed: Veterans �0.041 �0.044 0.153⇤⇤ 0.066(0.069) (0.070) (0.063) (0.063)
Op-ed: Wall Street �0.021 0.077 �0.032 0.571⇤⇤⇤
(0.071) (0.069) (0.064) (0.060)Constant (Constant) 0.012 0.002 �0.043 �0.123
(0.048) (0.049) (0.044) (0.044)N 2,181 2,181 2,181 2,181R2 0.016 0.003 0.006 0.057⇤p < .1; ⇤⇤p < .05; ⇤⇤⇤p < .01Models estimated via OLS. Robust standard errors in parentheses.Dependent variables are constructed via factor analysis and have unit variance.
ed on the Amtrak composite scale dependent variable was 0.198 scale points smaller for elites.
This di↵erence is statistically significant, as it is for the e↵ects of the Flat Tax and Veterans
treatments on their target outcomes. While the interaction is negative for the e↵ect of the Wall
Street op-ed on its target dependent variable, the di↵erence is not statistically significant. This
provides an indication that on some issues, elites are more resistent to accepting considerations that
run contrary to their exisiting views, comporting with hypothesis H3. Nevertheless, we still find
moderately large treatment e↵ects on policy attitudes, indicating that even elites are persuaded by
newspaper op-eds, albeit to a lesser degree.
3.3 Heterogeneous E↵ects by Partisanship
In the previous section, we explore treatment e↵ect heterogeneity across our experimental samples
to see if elites and members of the mass public process our treatments di↵erently. In this section, we
consider another dimension along which treatment e↵ects might vary: partisanship. Because our
treatments were all from libertarian sources, one might expect Republicans, Democrats, and Inde-
pendents to respond di↵erently to the treatments. Hypothesis H4 held that if anything, Democrats
should experience lower treatment e↵ects.7
Figure 1 shows that overall, this expectation is not confirmed. While there are few clear cases of
treatment e↵ect moderation (In the Mechanical Turk sample, the e↵ect of the Flat Tax treatment
7We preregistered a heterogeneous e↵ects analysis using a machine-learning method (Bayesian Additive RegressionTrees). This method, while excellent for exploratory analysis of heterogeneous e↵ects (Green and Kern, 2012),can sometimes obscure relatively straightforward questions such as whether e↵ects di↵er by a particular subjectcharacteristic. We opt instead to present a heterogeneous e↵ects analysis by partisanship because of the clearrelevance of respondents’ partisanship to their political views.
14

Table 8: Comparison of Treatment E↵ects on Composite Scale Dependent Variables
Amtrak Flat Tax Veterans Wall Street
Op-ed: Amtrak 0.501⇤⇤⇤ 0.005 0.051 �0.034(0.059) (0.056) (0.056) (0.054)
Op-ed: Flat Tax 0.080 0.488⇤⇤⇤ 0.048 �0.023(0.055) (0.060) (0.056) (0.056)
Op-ed: Veterans 0.044 �0.026 0.646⇤⇤⇤ �0.090⇤
(0.058) (0.057) (0.054) (0.054)Op-ed: Wall Street 0.055 0.097⇤ �0.113⇤⇤ 0.698⇤⇤⇤
(0.055) (0.057) (0.057) (0.056)Elite Experiment 0.137⇤⇤ 0.103 0.060 �0.027
(0.062) (0.063) (0.059) (0.058)Elite X Amtrak �0.198⇤⇤ �0.018 0.080 0.044
(0.094) (0.090) (0.086) (0.083)Elite X Flat Tax �0.164⇤ �0.384⇤⇤⇤ �0.048 �0.016
(0.087) (0.092) (0.084) (0.083)Elite X Veterans �0.085 �0.019 �0.493⇤⇤⇤ 0.156⇤
(0.090) (0.090) (0.083) (0.083)Elite X Wall Street �0.076 �0.020 0.081 �0.127
(0.090) (0.089) (0.086) (0.082)Constant (Constant) �0.125 �0.101 �0.103 �0.096
(0.039) (0.039) (0.040) (0.038)N 5,182 5,182 5,182 5,182R2 0.026 0.021 0.045 0.076⇤p < .1; ⇤⇤p < .05; ⇤⇤⇤p < .01Models estimated via OLS. Robust standard errors in parentheses.Dependent variables are constructed via factor analysis and have unit variance.
15

is larger among Republicans than it is among Democrats), the overall trend indicates that subjects’
partisan identifications is not a major driver of treatment response heterogeneity. On the whole,
subjects in all three subgroups update their attitudes by approximately the same amount in response
to the op-eds. Table 9 presents the results of a formal statistical test of the null hypothesis that the
treatment e↵ects among Republicans, Democrats, and Independents are equal. With the exceptions
of the Amtrak and Flat Tax treatments in the Mechanical Turk sample, we fail to reject this null:
treatment e↵ects do not appear to vary greatly by partisanship. Given that a partisan cue was
more readily available for the flat tax treatment, as the author’s party a�liation was noted in the
op-ed, we are unsurprised to find hetegeneous treatment e↵ects among these readers.
Table 9: Joint Tests of Treatment E↵ect Heterogeneity by Partisanship
Mechanical Turk Elites
Main DV Scale DV Main DV Scale DV
Amtrak 0.045 0.029 0.436 0.342Climate 0.845 0.243Flat Tax 0.009 0.001 0.146 0.293Veterans 0.878 0.562 0.434 0.291Wall Street 0.310 0.371 0.316 0.265
Entries are p-values from F tests in which the null hypoth-esis is that the average treatment e↵ects for Democrats,Independents, and Republicans are equal.
4 Long Term E↵ects
Next we measure the persistence of newspaper op-eds’ persuasive e↵ects. As Gerber et al (2007)
point out, large treatment e↵ects followed by steep decay undermine the idea that op-eds are
actually changing minds, but rather making particular considerations more accessible when taking
the survey. However, if newspaper op-eds have a persuasive e↵ect lasting over several weeks time
this would be suggestive of some degree of underlying attitudinal change (?).
To measure the lasting e↵ects of newspaper op-ends, we measured outcomes at two additional
waves, after 10 days and again at 30 days, allowing us to estimate the persistence of the treatment
e↵ects caused by our op-eds, over time.8. Respondents were not shown the op-ed again, but instead
were only presented with the survey of policy questions. An added benefit of the subsequent waves
is to separate treatment from outcome measurement. Thus, respondents taking the survey in Wave
2 and Wave 3 were responding to opinion questions only, and had not been immediately primed to
consider arguments prior to taking the surveys.
8We restrict our attention to the 2,269 subjects who responded in all three waves. We rely on an assumptionthat these 2,269 are “always-reporters,” or that whether or not they respond is unrelated to their treatment status.
16

Figure 1: E↵ects of Treatment, by Party and Experimental Sample
Main DV Scale DV
●
●
●
●
●
●
●
●
●
●
●
●
●
●
●
●
●
●
Amtrak
Climate
Flat Tax
Veterans
Wall Street
Amtrak
Flat Tax
Veterans
Wall Street
Mechanical Turk
Elites
−1 0 1 −0.4 0.0 0.4 0.8 1.2
● Democrat Independent Republican
17

Figure 2 shows our results. Each facet groups together the e↵ects of the treatments by outcome.
Time in days since treatment is plotted on the horizontal axis and the average level of the composite
scale by treatment groups is plotted on the vertical axis. At time zero, the large, robust e↵ects of
treatment can be easily discerned by comparing the outcomes of the target issue treatment group
to all other conditions. The separation between the target issue treatment group and the other
groups persists overtime. While the treatment e↵ects are indeed smaller (approximately 50% the
original magnitudes in each case), they remain statistically significant in most cases. These data
support our hypothesis H5, that treatment e↵ects would persist over time.
On Mechanical Turk, we measured outcomes at three points in time. We were surprised by the
“hockey stick” pattern of results. We had expected that the 30-day results would be diminished
relative to the 10-day results just as the 10-day results were diminished relative to the immediate
results. However, we do not observe much decay at all after the initial decline. This phenomenon
requires much further study, but an initial explanation of this pattern might be that immediate
e↵ects are a combination of two factors: information and priming. The priming e↵ects fade, but
the information e↵ects persist.
5 Cost Per Mind Changed
In the previous sections, we demonstrated that op-eds have large, long lasting e↵ects on attitudes
among both elites and members of the mass public. We now turn to a brief discussion of the
cost-e↵ectiveness of op-eds. Analogously to calculations of the cost per vote of get-out-the-vote
experiments, we consider the cost per mind changed of newspaper op-eds.
We calculate the cost per mind changed using Equation 1. It has three arguments, the cost of
producing an op-ed, the number of people who read it, and the probability of the op-ed changing a
reader’s mind. We estimate the first two arguments using industry figures and the final argument
using the results of our experiments.
Cost per mind changed =Cost
Op-Ed Readership ⇤ Percentage Point Change in Agreement(1)
We take two approaches to estimating the cost of producing an op-ed. The first is the going
market rate for ghost-writing and placing an op-ed, which can range between $5,000-$10,000, de-
pending on the complexity of the topic and the prestige of the placement. The second is the cost of
an op-ed-sized advertisement, which costs approximately $50,000 for the weekday opinion section
of the New York Times.
Table 10 displays our attempt to back out the number of readers the average op-ed can expect
to reach. The first columns shows the total circulation numbers (print and online) for the New
York Times, the Wall Street Journal, USA Today, and Newsweek, the outlets where our treatment
18

Figure 2: Long Term E↵ects of Treatment
MTurk Study Elite Study
●● ●
● ● ●
●● ●
● ● ●
● ● ●
● ●
● ●
●●
●●
−0.25
0.00
0.25
0.50
−0.25
0.00
0.25
0.50
−0.25
0.00
0.25
0.50
−0.25
0.00
0.25
0.50
−0.25
0.00
0.25
0.50
Outcom
es: Amtrak
Outcom
es: VeteransO
utcomes: W
all StreetO
utcomes: Flat Tax
Outcom
es: Clim
ate
0 10 20 30 0 10 20 30Days Since Treatment
Com
posi
te A
ttitu
de S
cale
● ControlTreatment: Amtrak
Treatment: VeteransTreatment: Climate
Treatment: Wall StreetTreatment: Flat Tax
19
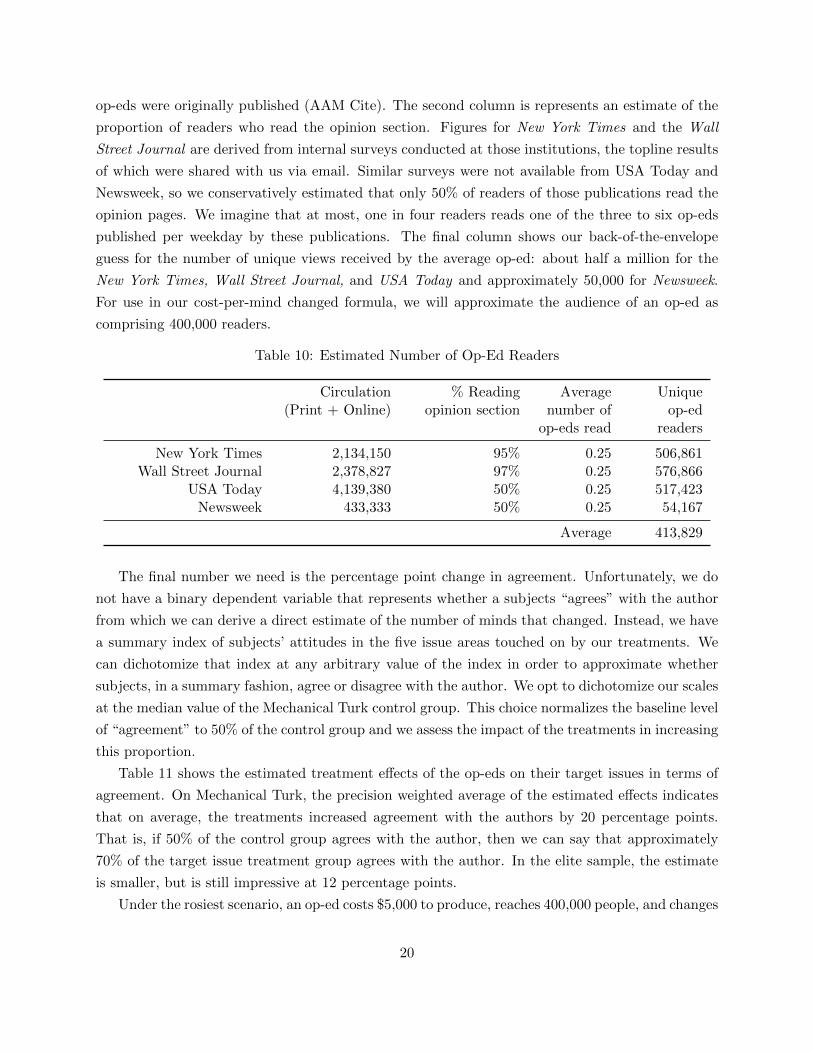
op-eds were originally published (AAM Cite). The second column is represents an estimate of the
proportion of readers who read the opinion section. Figures for New York Times and the Wall
Street Journal are derived from internal surveys conducted at those institutions, the topline results
of which were shared with us via email. Similar surveys were not available from USA Today and
Newsweek, so we conservatively estimated that only 50% of readers of those publications read the
opinion pages. We imagine that at most, one in four readers reads one of the three to six op-eds
published per weekday by these publications. The final column shows our back-of-the-envelope
guess for the number of unique views received by the average op-ed: about half a million for the
New York Times, Wall Street Journal, and USA Today and approximately 50,000 for Newsweek.
For use in our cost-per-mind changed formula, we will approximate the audience of an op-ed as
comprising 400,000 readers.
Table 10: Estimated Number of Op-Ed Readers
Circulation(Print + Online)
% Readingopinion section
Averagenumber of
op-eds read
Uniqueop-ed
readers
New York Times 2,134,150 95% 0.25 506,861Wall Street Journal 2,378,827 97% 0.25 576,866
USA Today 4,139,380 50% 0.25 517,423Newsweek 433,333 50% 0.25 54,167
Average 413,829
The final number we need is the percentage point change in agreement. Unfortunately, we do
not have a binary dependent variable that represents whether a subjects “agrees” with the author
from which we can derive a direct estimate of the number of minds that changed. Instead, we have
a summary index of subjects’ attitudes in the five issue areas touched on by our treatments. We
can dichotomize that index at any arbitrary value of the index in order to approximate whether
subjects, in a summary fashion, agree or disagree with the author. We opt to dichotomize our scales
at the median value of the Mechanical Turk control group. This choice normalizes the baseline level
of “agreement” to 50% of the control group and we assess the impact of the treatments in increasing
this proportion.
Table 11 shows the estimated treatment e↵ects of the op-eds on their target issues in terms of
agreement. On Mechanical Turk, the precision weighted average of the estimated e↵ects indicates
that on average, the treatments increased agreement with the authors by 20 percentage points.
That is, if 50% of the control group agrees with the author, then we can say that approximately
70% of the target issue treatment group agrees with the author. In the elite sample, the estimate
is smaller, but is still impressive at 12 percentage points.
Under the rosiest scenario, an op-ed costs $5,000 to produce, reaches 400,000 people, and changes
20

Table 11: E↵ects of Op-eds on “Agreement” Dependent Variables
MTurk Elite
Amtrak 0.15 (0.03) 0.10 (0.03)Climate 0.11 (0.03)Flat Tax 0.20 (0.03) 0.02 (0.03)Veterans 0.28 (0.03) 0.08 (0.03)Wall Street 0.28 (0.03) 0.26 (0.03)
Precision weighted average 0.20 (0.01) 0.12 (0.02)
Entries are estimated treatment e↵ects.Robust standard errors are in parentheses.
the mind of 20% of them. Plugging these values into Equation 1, we obtain that the cost per mind
changed is a mere 6 cents. Under a more conservative set of assumptions, an op-ed costs ten times
as much ($50,000), reaches half as many people (200,000), and changes half as many minds (10%).
The resulting cost per mind changed would work out to $2.50. The cost-e↵ectiveness of an op-ed
clearly varies with the persuasiveness of the author, but we think that cost-per-mind change figures
that range between 50 cents and three dollars are reasonable.
6 Discussion
Our paper has sought to answer the question previously left unanswered by existing scholarship: do
op-eds change the minds of the people who read them? Many remain skeptical that op-eds achieve
the initital vision set out by the Times 40 years ago to meaningfully enhance debate and inform the
general public, or even elites, on substantive policy matters. The pessimistic view would remind
us that both voters are ill-informed and thus perhaps unable to grasp detailed policy subjects, and
that since well-informed elites are better able to resist information that conflicts with their partisan
identities that they too would remain impervious to arguments running counter to existing views.
Our study indicates that both pessmistic views of op-eds’ impact are unwarranted.
In both studies of the mass public and elites, we find large statistically signficant treatment
e↵ects of op-eds between .30-.50 standard deviations on policy attitudes. These findings comport
with previous scholarship that has found signficant e↵ects of newspapers on political knowledge,
candidate evaluations, and turnout. However, unlike previous scholarship, we unpack the newspaper
to find a significant e↵ect of the op-ed pages on policy attitudes, specifically. A strength of our
studies is that we replicated the same design on both mass public and elite samples, similarly finding
across both samples large treatment e↵ects on target issues and relatively small or no e↵ects on non-
target issues. However, we do find diminished e↵ects among elites compared to the mass sample,
as theory would lead us to expect.
21
Since these op-eds were written from the libertarian economic perspective, we would expect
Democrats to be less persuaded than Republicans. However, this is generally not supported by
our results. Instead, we find Democrats, independents, and Republicans all move in the direction
intended by the author, and largely by similar magnitudes.
Furthermore, op-ed treatment e↵ects are not empheral. They appear to persist for at least
one month subsequent exposure to the op-ed, which is suggestive of underlying attitudinal change.
Over time results have the potential to shed light on the primary mechanishm by which op-eds
change attidues. We expect that treatments that operate by priming particular considerations or
by framing arugments in one light or another to have fleeting e↵ects, whereas treatments that
operate by providing subjects new information are expected to last longer. The “hockey stick”
pattern of decay between Wave 1 and 2 but the leveling o↵ between Wave 2 and 3 leads us to
consider that perhaps immediate treatment e↵ects may be a combination of both priming as well
as as information impacting attitudes. Over the course of a month, however, priming e↵ects may
fade. However persistent treatment e↵ects observed between Wave 2 and 3, fully 30 days after
treatment exposure, lead us to infer that these e↵ects operate primarily by information impacting
attitudes rather than priming.
Lastly, these results indicate that op-eds are remarkably cost e↵ective. Our calculations based
on the cost of producing an op-ed, the number of people who read it, combined with our estimated
probability of changing a reader’s mind leads us to estimate that the cost-per-mind changed ranges
from approximately 50 cents to $3.00.
We acknowledge that survey experimental research is well-equipped to answer some questions
while leaving others unanswered. As with any survey experiment, the extent to which these results
generalize to other settings is of concern. Because we found similar findings across two very di↵erent
populations (MTurk repondents and political elites), we would expect that if this specific experiment
were conducted on new samples, the results would be quite similar. We also believe are our results
are robust to the choice of specific survey questions used to measure outcomes because we found
similar results regardless of whether we used only one main dependent variable as the primary
outcome measure or a composite scale of the 4-5 questions in each corresponding issue area. We
also expect our findings to generalize to other op-ed treatments, including op-eds that were written
by liberal or conservative (rather than libertarian) authors.
However, the inferential target might not be the e↵ects that would be obtained if this experiment
(or minor variants) were conducted. Instead, we might imagine that the main question of interest is
what happens when people encounter op-eds in a real-world, naturalistic setting. In the ‘wild’ of real
world media communications, op-eds are typically encountered in a bundle: a physical newspaper
or email digest of the day’s news. People may selectively choose the content they read, skipping over
op-eds with titles or authors that they find boring or that they anticipate will conflict with their
existing points of view. Subjects in survey experiments may pay attention di↵erently than those
22

who would encounter an op-ed in their physical newspaper or online. Additionally, our treatments
did not o↵er two-sided messages as are often found in newspapers o↵ering “point-counter-point”
content. These di↵erences between the survey experimental setting and the field suggest that the
estimates of the e↵ects of op-eds on opinion may represent an upper bound.
Taken together, these results imply that well-argued, long-form opinion pieces have the ability
to change minds of even ideological opponents, and contributes to the growing body of evidence
of the everyday nature of persuasion. Although our increasingly polarized political environment
poses challenges to substantive and respectful political discourse, these results indicate that at least
in the setting of newspaper op-eds, individuals are capable of considering diverse views that may
perhaps even change their minds.
23
References
Ajzen, Icek and Martin Fishbein. 1980. Understanding Attitudes and Predicting Social Behavior. Vol. 278 EnglewoodCli↵s, NJ: Prentice Hall.
Alan S. Gerber, Dean Karlan, Daniel Bergan. 2009. “Does the Media Matter? A Field Experiment Measuring theE↵ect of Newspapers on Voting Behavior and Political Opinions.” American Economic Journal 1(2):35–52.
Alexander, Ernest R. 2004. “Capturing the Public Interest: Promoting Planning in Conservative Times.” Journal ofPlanning Education and Research 24(1):102–106.
Baden, Christian and Sophie Lecheler. 2012. “Fleeting, Fading, or Far-Reaching? A Knowledge-Based Model of thePersistence of Framing E↵ects.” Communication Theory 22(4):359–382.URL: http://dx.doi.org/10.1111/j.1468-2885.2012.01413.x
Berelson, Bernard R., Paul F. Lazarsfeld and William N. McPhee. 1954. Voting: A Study of Opinion Formation ina Presidential Campaign. Chicago: University of Chicago Press.
Campbell, Angus, Philip E. Converse, Warren E. Miller and Donald E. Stokes. 1960. The American Voter. NewYork: Wiley.
Chong, Dennis and James N. Druckman. 2012. Dynamics in Mass Communication E↵ects Research. In The SageHandbook of Political Communication, ed. Holli Semetko and Maggie Scammell. Los Angeles, CA: Sage Publicationspp. 307–323.
Ciofalo, Andrew and Kim Traveso. 1994. “Does the op-ed page have a chance to become a public forum?” NewspaperResearch Journal 15(4):51–63.
Converse, Philip E. 1964. The Nature of Belief Systems in Mass Publics. In Ideology and Discontent, ed. David E.Apter. Ann Arbor: University of Michigan Press.
Coppock, Alexander. 2016. Positive, Small, Homogeneous, and Durable: Political Persuasion in Response to Infor-mation PhD thesis Columbia University.
Dalton, Russell J., Paul A. Beck and Robert Huckfeldt. 1998. “Partisan Cues and the Media: Information Flows inthe 1992 Presidential Election.” American Political Science Review 92(1):111–126.
DeFleur, Melvin L., Lucinda Davenport, Mary Cronin and Margaret DeFleur. 1992. “Audience Recall of News StoriesPresented by Newspaper, Computer, Television and Radio.” Journalism and Mass Communication Quarterly69(4):1010–1022.URL: http://jmq.sagepub.com/content/69/4/1010.abstract
Delli Carpini, Michael X. and Scott Keeter. 1996. What Americans Know About Politics and Why it Matters. NewHaven: Yale University Press.
Druckman, James N. and Michael Parkin. 2005. “The Impact of Media Bias: How Editorial Slant A↵ects Voters.”Journal of Politics 67(4):1030–1049.URL: http://dx.doi.org/10.1111/j.1468-2508.2005.00349.x
Feldman, Stanley. 1989. “Measuring Issue Preferences: The Problem of Response Instability.” Political Analysis1:25–60.URL: http://www.jstor.org/stable/23317338
Golan, Guy. 2013. “The Gates of Op-Ed Diplomacy: Newspaper Framing the 2011 Egyptian Revolution.” Interna-tional Communication Gazette 75(4):359–373.
Golan, Guy J. 2010. “Editorials, Op-ed Columns Frame Medical Marijuana Debate.” Newspaper Research Journal31(3):50–61.URL: http://nrj.sagepub.com/content/31/3/50.abstract
24
Green, Donald P. and Holger L. Kern. 2012. “Modeling Heterogeneous Treatment E↵ects in Survey Experimentswith Bayesian Additive Regression Trees.” Public Opinion Quarterly 76(3):491–511.
Guess, Andrew M. Forthcoming. “Measure for Measure: An Experimental Test of Online Political Media Exposure.”Political Analysis .
Iyengar, Shanto. 1990. “THE ACCESSIBILITY BIAS IN POLITICS: TELEVISION NEWS AND PUBLIC OPIN-ION.” International Journal of Public Opinion Research 2(1):1–15.URL: http://ijpor.oxfordjournals.org/content/2/1/1.abstract
Jennings, M.K. 1992. “Ideological thinking among mass publics and political elites.” Public Opinion Quarterly56(4):419–441.
Jerit, Jennifer, Jason Barabas and Scott Cli↵ord. 2013. “Comparing Contemporaneous Laboratory and Field Exper-iments on Media E↵ects.” Public Opinion Quarterly 77(1):256–282.URL: http://poq.oxfordjournals.org/content/77/1/256.abstract
Jerit, Jennifer, Jason Barabas and Toby Bolsen. 2006. “Citizens, Knowledge, and the Information Environment.”American Journal of Political Science 50(2):266–282.URL: http://dx.doi.org/10.1111/j.1540-5907.2006.00183.x
Mullinix, Kevin J., Thomas J. Leeper, James N. Druckman and Jeremy Freese. 2015. “The Generalizability of SurveyExperiments.” Journal of Experimental Political Science 2:109–138.
Nelson, Thomas E., Rosalee A. Clawson and Zoe M. Oxley. 1997. “Media Framing of a Civil Liberties Conflict andIts E↵ect on Tolerance.” American Political Science Review 91(3):567–583.
Neuman, W. Russell. 1986. The paradox of Mass Publics: Knowledge and Opinion in the American Electorate.Cambridge: Harvard University Press.
Nicholson, Stephen P. 2003. “The Political Environment and Ballot Proposition Awareness.” American Journal ofPolitical Science 47(3):403–410.URL: http://dx.doi.org/10.1111/1540-5907.00029
Nico Calavita, Norman Krumholz. 2003. “Capturing the Public Interest: Using Newspaper Op-Eds to PromotePlanning in Conservative Times.” Journal of Planning Education and Research 22(4):400–406.URL: http://jpe.sagepub.com/content/22/4/400.abstract
Norris, Pippa and David Sanders. 2003. “Message or Medium? Campaign Learning During the 2001 British GeneralElection.” Political Communication 20(3):233.
Nyhan, Brendan and Jason Reifler. 2010. “When Corrections Fail: The Persistence of Political Misperceptions.”Political Behavior 32(2):303–330.
Porpora, Douglas V. and Alexander Nikolaev. 2008. “Moral Muting in US Newspaper Op-eds Debating the Attackon Iraq.” Discourse and Communication 2(2):165–184.URL: http://dcm.sagepub.com/content/2/2/165.abstract
Putnam, Robert D, Robert Leonardi and Ra↵aella Y Nanetti. 1979. “Attitude Stability among Italian Elites.”American Journal of Political Science 23(3):463.
Rosenfeld, Stephen S. 2000. “The Op-Ed Page: A Step to a Better Democracy.” The Harvard International Journalof Press/Politics 5(3):7–11.
Socolow, Michael J. 2010. “A Profitable Public Sphere: The Creation of the New York Times Op-Ed Page.” Jour-nalism and Mass Communication Quarterly 87(2):281–296.URL: http://jmq.sagepub.com/content/87/2/281.abstract
Somin, Ilya. 1998. “Voter Ignorance and the Democratic Ideal.” Critical Review 12(4):413–458.
25
Sommer, Bob and John R. Maycroft. 2008. “Influencing Public Policy: An Analysis of Published Op-Eds by Aca-demics.” Politics and Policy 36(4):586–613.URL: http://dx.doi.org/10.1111/j.1747-1346.2008.00122.x
Thomas Wood, Ethan Porter. 2016. “The elusory backfire e↵ect: mass attitudes’ steadfast factual adherence.”Working Paper .
Times, New York. 1970a. “Op. Ed. Page.”.
Times, New York. 1970b. “Times Will O↵er Daily Forum Page: Special Opinion Articles Will Supplement Columns.”.
Vavreck, Lynn et al. 2007. “The exaggerated e↵ects of advertising on turnout: The dangers of self-reports.” QuarterlyJournal of Political Science 2(4):325–343.
W. Russell Neumann, Marion R. Just, Ann N. Crigler. 1992. Common Knowledge: News and the Construction ofPolitical Meaning. Chicago: University of Chicago Press.
Zaller, John R. 1992. The Nature and Origins of Mass Opinion. New York: Cambridge University Press.
26
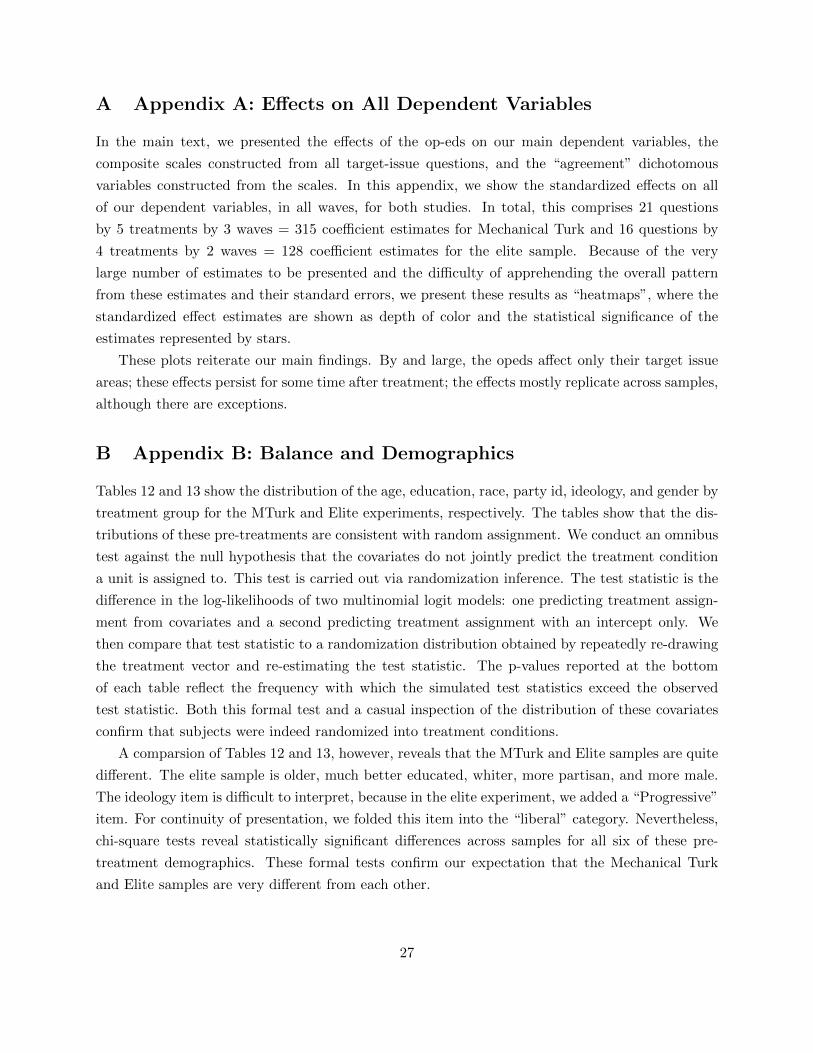
A Appendix A: E↵ects on All Dependent Variables
In the main text, we presented the e↵ects of the op-eds on our main dependent variables, the
composite scales constructed from all target-issue questions, and the “agreement” dichotomous
variables constructed from the scales. In this appendix, we show the standardized e↵ects on all
of our dependent variables, in all waves, for both studies. In total, this comprises 21 questions
by 5 treatments by 3 waves = 315 coe�cient estimates for Mechanical Turk and 16 questions by
4 treatments by 2 waves = 128 coe�cient estimates for the elite sample. Because of the very
large number of estimates to be presented and the di�culty of apprehending the overall pattern
from these estimates and their standard errors, we present these results as “heatmaps”, where the
standardized e↵ect estimates are shown as depth of color and the statistical significance of the
estimates represented by stars.
These plots reiterate our main findings. By and large, the opeds a↵ect only their target issue
areas; these e↵ects persist for some time after treatment; the e↵ects mostly replicate across samples,
although there are exceptions.
B Appendix B: Balance and Demographics
Tables 12 and 13 show the distribution of the age, education, race, party id, ideology, and gender by
treatment group for the MTurk and Elite experiments, respectively. The tables show that the dis-
tributions of these pre-treatments are consistent with random assignment. We conduct an omnibus
test against the null hypothesis that the covariates do not jointly predict the treatment condition
a unit is assigned to. This test is carried out via randomization inference. The test statistic is the
di↵erence in the log-likelihoods of two multinomial logit models: one predicting treatment assign-
ment from covariates and a second predicting treatment assignment with an intercept only. We
then compare that test statistic to a randomization distribution obtained by repeatedly re-drawing
the treatment vector and re-estimating the test statistic. The p-values reported at the bottom
of each table reflect the frequency with which the simulated test statistics exceed the observed
test statistic. Both this formal test and a casual inspection of the distribution of these covariates
confirm that subjects were indeed randomized into treatment conditions.
A comparsion of Tables 12 and 13, however, reveals that the MTurk and Elite samples are quite
di↵erent. The elite sample is older, much better educated, whiter, more partisan, and more male.
The ideology item is di�cult to interpret, because in the elite experiment, we added a “Progressive”
item. For continuity of presentation, we folded this item into the “liberal” category. Nevertheless,
chi-square tests reveal statistically significant di↵erences across samples for all six of these pre-
treatment demographics. These formal tests confirm our expectation that the Mechanical Turk
and Elite samples are very di↵erent from each other.
27

Figure 3: Standardized E↵ects on All Dependent Variables: MTurk Wave 1
***
***
**
*** *
****
***
***
*
*** *
***
***
***
****
****
*
***
***
*
* ***
***
Crisis/Not A Problem
Cause: Human Activity/Natural
Solution: Govt Policies/Free Market
Media Underestimates/Exaggerates
Expected Future Temp Change (+3/−3)
Climate Change
Feeling Thermometer (cool/warm)
% Bankers Not Corrupt
Confidence in Wall Street
Govt Regulate Banks More/Less
Wall Street
Govt Spend More/Less
Projects Funded: Taxes/User Fees
Taxes Used for Existing/New Projects
% Spending Waste Transit
Transportation
VA Feeling Thermometer (cool/warm)
Confidence in VA
Credit for Vets Health Care Oppose/Favor
% Spending Waste VA
Dept. Veterans Affairs
Oppose/Favor Flat Tax
Preferred Avg Rate (High to Low)
14.5 Flat Corporate Tax Oppose/Favor
Help Wealthy/All Americans
Flat Tax
Climate Wall Street Amtrak Veterans PaulOp−Ed Shown
−1.0
−0.5
0.0
0.5
1.0Estimate
28
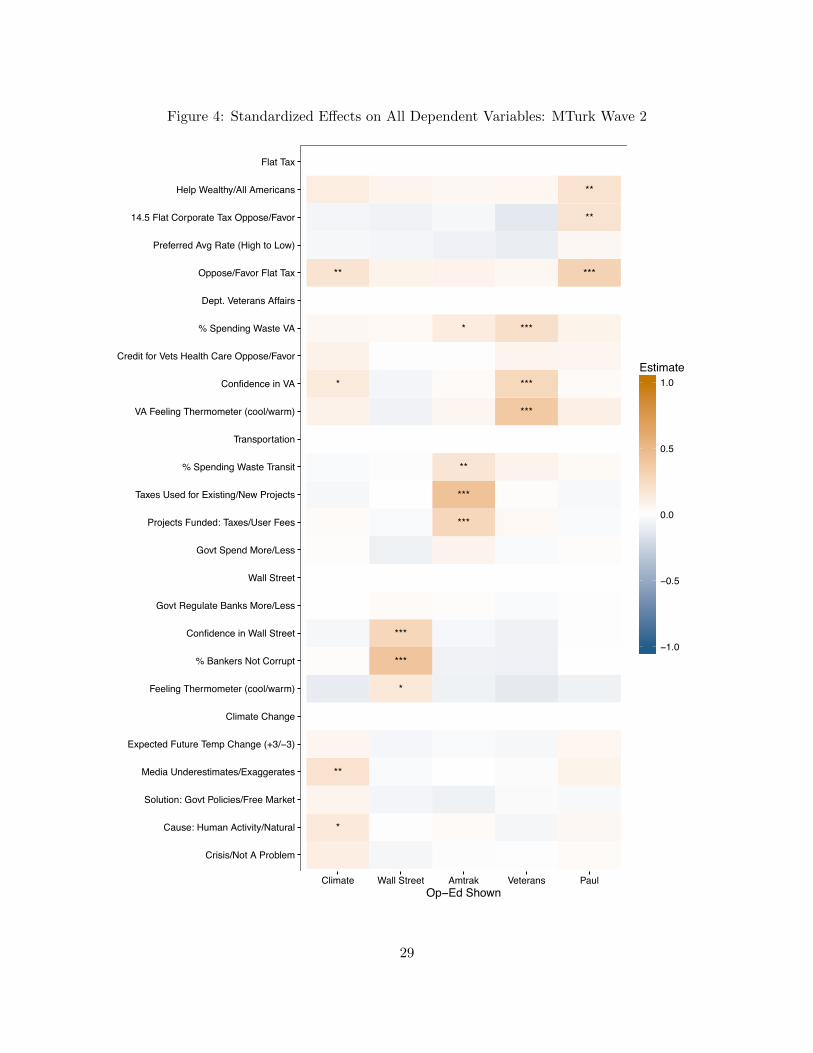
Figure 4: Standardized E↵ects on All Dependent Variables: MTurk Wave 2
*
**
*
***
***
***
***
**
***
* ***
* ***
** ***
**
**
Crisis/Not A Problem
Cause: Human Activity/Natural
Solution: Govt Policies/Free Market
Media Underestimates/Exaggerates
Expected Future Temp Change (+3/−3)
Climate Change
Feeling Thermometer (cool/warm)
% Bankers Not Corrupt
Confidence in Wall Street
Govt Regulate Banks More/Less
Wall Street
Govt Spend More/Less
Projects Funded: Taxes/User Fees
Taxes Used for Existing/New Projects
% Spending Waste Transit
Transportation
VA Feeling Thermometer (cool/warm)
Confidence in VA
Credit for Vets Health Care Oppose/Favor
% Spending Waste VA
Dept. Veterans Affairs
Oppose/Favor Flat Tax
Preferred Avg Rate (High to Low)
14.5 Flat Corporate Tax Oppose/Favor
Help Wealthy/All Americans
Flat Tax
Climate Wall Street Amtrak Veterans PaulOp−Ed Shown
−1.0
−0.5
0.0
0.5
1.0Estimate
29
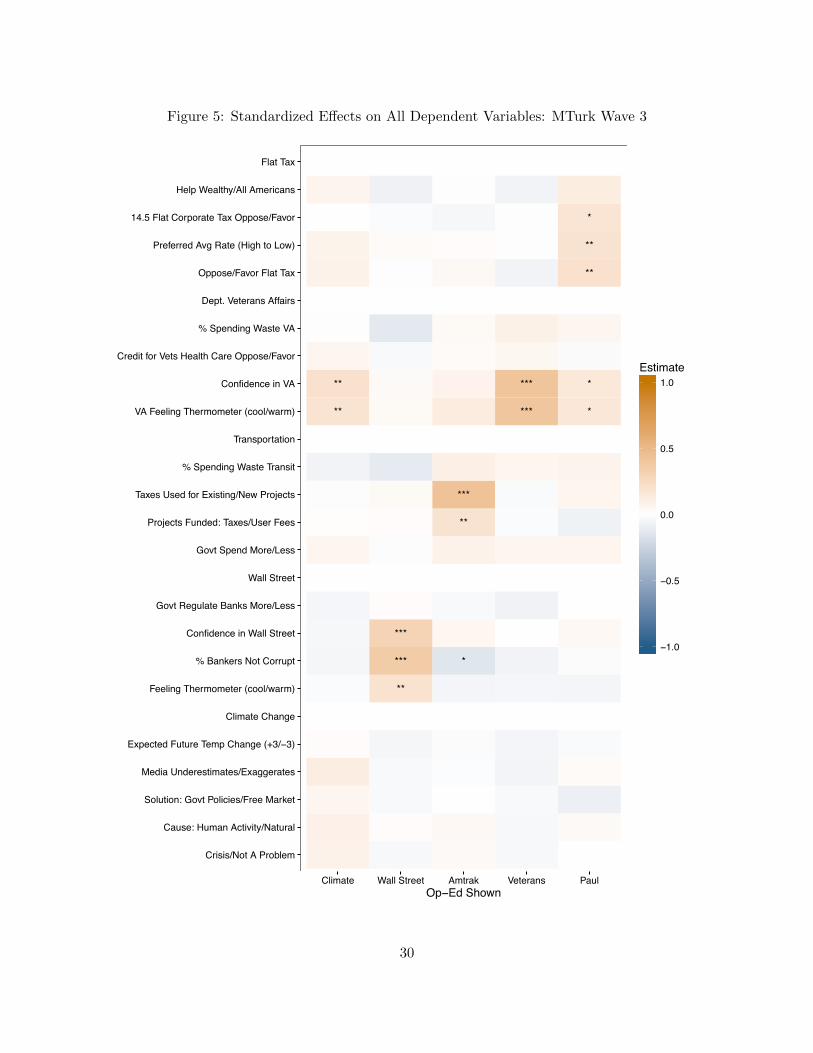
Figure 5: Standardized E↵ects on All Dependent Variables: MTurk Wave 3
**
****
***
**
***
** ****
** ****
**
**
*
Crisis/Not A Problem
Cause: Human Activity/Natural
Solution: Govt Policies/Free Market
Media Underestimates/Exaggerates
Expected Future Temp Change (+3/−3)
Climate Change
Feeling Thermometer (cool/warm)
% Bankers Not Corrupt
Confidence in Wall Street
Govt Regulate Banks More/Less
Wall Street
Govt Spend More/Less
Projects Funded: Taxes/User Fees
Taxes Used for Existing/New Projects
% Spending Waste Transit
Transportation
VA Feeling Thermometer (cool/warm)
Confidence in VA
Credit for Vets Health Care Oppose/Favor
% Spending Waste VA
Dept. Veterans Affairs
Oppose/Favor Flat Tax
Preferred Avg Rate (High to Low)
14.5 Flat Corporate Tax Oppose/Favor
Help Wealthy/All Americans
Flat Tax
Climate Wall Street Amtrak Veterans PaulOp−Ed Shown
−1.0
−0.5
0.0
0.5
1.0Estimate
30
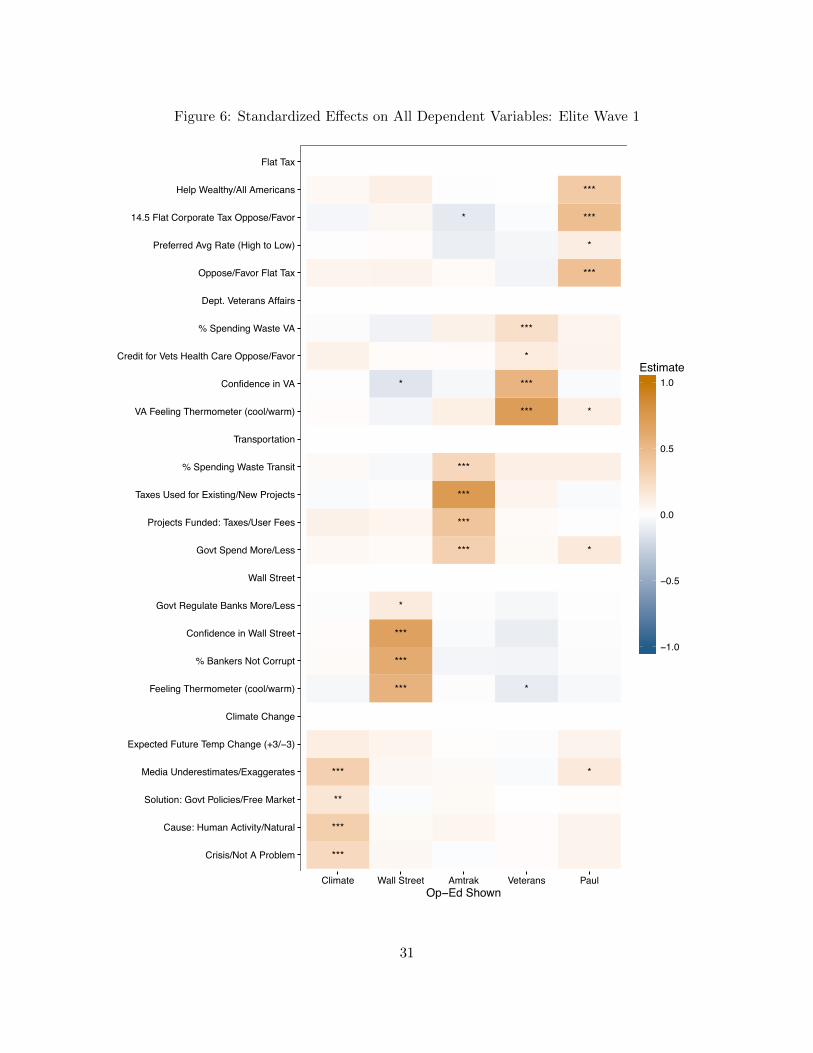
Figure 6: Standardized E↵ects on All Dependent Variables: Elite Wave 1
***
***
**
*** *
****
***
***
*
*** *
***
***
***
****
****
*
***
***
*
* ***
***
Crisis/Not A Problem
Cause: Human Activity/Natural
Solution: Govt Policies/Free Market
Media Underestimates/Exaggerates
Expected Future Temp Change (+3/−3)
Climate Change
Feeling Thermometer (cool/warm)
% Bankers Not Corrupt
Confidence in Wall Street
Govt Regulate Banks More/Less
Wall Street
Govt Spend More/Less
Projects Funded: Taxes/User Fees
Taxes Used for Existing/New Projects
% Spending Waste Transit
Transportation
VA Feeling Thermometer (cool/warm)
Confidence in VA
Credit for Vets Health Care Oppose/Favor
% Spending Waste VA
Dept. Veterans Affairs
Oppose/Favor Flat Tax
Preferred Avg Rate (High to Low)
14.5 Flat Corporate Tax Oppose/Favor
Help Wealthy/All Americans
Flat Tax
Climate Wall Street Amtrak Veterans PaulOp−Ed Shown
−1.0
−0.5
0.0
0.5
1.0Estimate
31

Figure 7: Standardized E↵ects on All Dependent Variables: Elite Wave 2
*
**
*
***
***
***
***
**
***
* ***
* ***
** ***
**
**
Crisis/Not A Problem
Cause: Human Activity/Natural
Solution: Govt Policies/Free Market
Media Underestimates/Exaggerates
Expected Future Temp Change (+3/−3)
Climate Change
Feeling Thermometer (cool/warm)
% Bankers Not Corrupt
Confidence in Wall Street
Govt Regulate Banks More/Less
Wall Street
Govt Spend More/Less
Projects Funded: Taxes/User Fees
Taxes Used for Existing/New Projects
% Spending Waste Transit
Transportation
VA Feeling Thermometer (cool/warm)
Confidence in VA
Credit for Vets Health Care Oppose/Favor
% Spending Waste VA
Dept. Veterans Affairs
Oppose/Favor Flat Tax
Preferred Avg Rate (High to Low)
14.5 Flat Corporate Tax Oppose/Favor
Help Wealthy/All Americans
Flat Tax
Climate Wall Street Amtrak Veterans PaulOp−Ed Shown
−1.0
−0.5
0.0
0.5
1.0Estimate
32

Table 12: MTurk Experimental Balance and Demographics
Control Amtrak Climate Flat Tax Veterans Wallstreet
18 - 29 0.469 0.456 0.419 0.463 0.436 0.42830 - 39 0.310 0.302 0.309 0.298 0.302 0.32340 - 49 0.116 0.124 0.153 0.129 0.125 0.11850 - 59 0.084 0.080 0.086 0.078 0.105 0.091
60+ 0.021 0.039 0.033 0.031 0.032 0.040
Less than High School 0.006 0.005 0.007 0.007 0.005 0.002High School 0.092 0.094 0.096 0.123 0.096 0.085
Some College 0.391 0.380 0.375 0.370 0.380 0.395College 0.395 0.397 0.382 0.356 0.383 0.418
Graduate School 0.116 0.124 0.139 0.145 0.135 0.101
Black 0.059 0.089 0.070 0.046 0.051 0.080Hispanic 0.053 0.059 0.051 0.080 0.041 0.060
White 0.773 0.750 0.763 0.777 0.814 0.761Other 0.114 0.102 0.116 0.097 0.095 0.100
Strong Democrat 0.183 0.216 0.179 0.182 0.184 0.222Not very strong Democrat 0.285 0.236 0.265 0.227 0.245 0.277
Lean Democrat 0.150 0.166 0.163 0.158 0.164 0.138Independent 0.148 0.166 0.153 0.150 0.159 0.149
Lean Republican 0.061 0.062 0.047 0.087 0.086 0.061Not very strong Republican 0.117 0.092 0.137 0.135 0.108 0.100
Strong Republican 0.056 0.062 0.056 0.061 0.054 0.053
Liberal 0.452 0.469 0.461 0.402 0.456 0.444Moderate 0.265 0.240 0.242 0.303 0.258 0.259
Libertarian 0.072 0.064 0.058 0.060 0.056 0.060Conservative 0.174 0.179 0.202 0.198 0.171 0.189
Other 0.037 0.049 0.037 0.037 0.059 0.048
Male 0.527 0.518 0.511 0.537 0.500 0.522Female 0.473 0.482 0.489 0.463 0.500 0.478
N 622 597 570 587 592 603
Omnibus balance test: p = 0.43
33
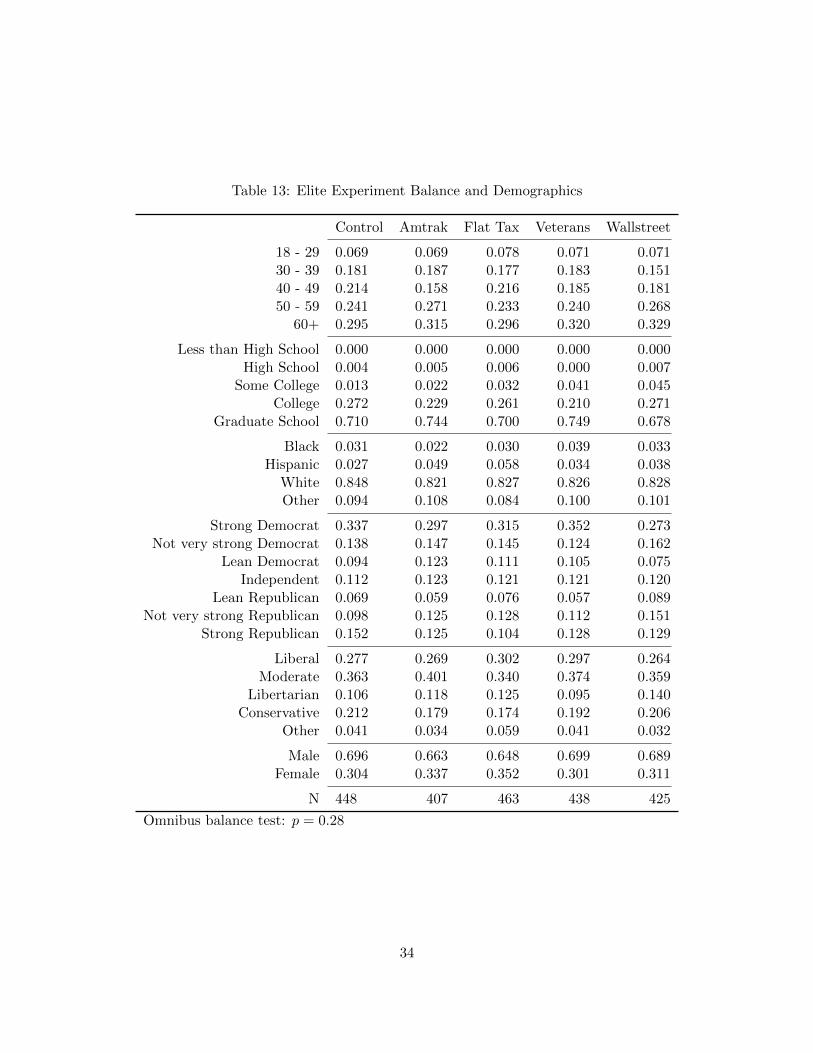
Table 13: Elite Experiment Balance and Demographics
Control Amtrak Flat Tax Veterans Wallstreet
18 - 29 0.069 0.069 0.078 0.071 0.07130 - 39 0.181 0.187 0.177 0.183 0.15140 - 49 0.214 0.158 0.216 0.185 0.18150 - 59 0.241 0.271 0.233 0.240 0.268
60+ 0.295 0.315 0.296 0.320 0.329
Less than High School 0.000 0.000 0.000 0.000 0.000High School 0.004 0.005 0.006 0.000 0.007
Some College 0.013 0.022 0.032 0.041 0.045College 0.272 0.229 0.261 0.210 0.271
Graduate School 0.710 0.744 0.700 0.749 0.678
Black 0.031 0.022 0.030 0.039 0.033Hispanic 0.027 0.049 0.058 0.034 0.038
White 0.848 0.821 0.827 0.826 0.828Other 0.094 0.108 0.084 0.100 0.101
Strong Democrat 0.337 0.297 0.315 0.352 0.273Not very strong Democrat 0.138 0.147 0.145 0.124 0.162
Lean Democrat 0.094 0.123 0.111 0.105 0.075Independent 0.112 0.123 0.121 0.121 0.120
Lean Republican 0.069 0.059 0.076 0.057 0.089Not very strong Republican 0.098 0.125 0.128 0.112 0.151
Strong Republican 0.152 0.125 0.104 0.128 0.129
Liberal 0.277 0.269 0.302 0.297 0.264Moderate 0.363 0.401 0.340 0.374 0.359
Libertarian 0.106 0.118 0.125 0.095 0.140Conservative 0.212 0.179 0.174 0.192 0.206
Other 0.041 0.034 0.059 0.041 0.032
Male 0.696 0.663 0.648 0.699 0.689Female 0.304 0.337 0.352 0.301 0.311
N 448 407 463 438 425
Omnibus balance test: p = 0.28
34
C Appendix C: Distractor Task and E↵ects of Marijuana Op-Ed
Measured peristence e↵ects in subsequent waves may overstate actual e↵ects due to acquiescense
bias. In other words, respondents may remember taking the survey from the first wave have a desire
to answer in a similar way on subsequent surveys. For instance, they may wish to appear consis-
tent or may want to provide answers they believe the researchers want to hear rather than what
respondents really believe. In e↵orts to disentangle persistence e↵ects from potential acquiescense
bias we subjected our analysis to a stronger test. To do this, we randomly assigned half of the
second wave subjects a new op-ed with a subject unrelated to the original treatments. This way we
measure natural decay among half and “perturbed” decay among the other half. For this distractor
treatment, we selected an op-ed written by a Cato Institute scholar on marijuana legalization. A
benefit of this op-ed is that its subject matter is completely di↵erent from the original treatment
op-eds on fiscal issues. Furthermore, since marijuana legalization is often associated with the polit-
ical left, treated respondents had an opportunity to receive treatments with both conservative and
liberal messages. The socially liberal message of marijuana legalization might dissuade politically
sophsticated respondents from believing that researchers were looking for politically conservative
answers.
C.1 E↵ects of Marijuana Op-Ed on Marijuana Attitudes
C.2 E↵ects of Marijuana Op-Ed on E↵ects of Wave 1 Treatments
35

Figure 8: E↵ects of Marijuana Op-Ed on Marijuana Attitudes
Wave 2 Wave 3
●
●
●
●
●
●
●
●
●
●
●
●
●
●
●
●
●
●Agreement (Binary)
Composite scale
Predict decreased use if legalized
Less dangerous than heroin
Should not prosecute
Favor legalization
Agreement (Binary)
Composite scale
Predict decreased use if legalized
Less dangerous than heroin
Should not prosecute
Favor legalization
Mechanical Turk
Elites
−0.1 0.0 0.1 0.2 −0.1 0.0 0.1 0.2Standardized Treatment Effect Estimates
36

Figure 9: E↵ects of Marijuana Op-Ed on E↵ects of Wave 1 Treatments
No Distraction Distraction Difference
●
●
●
●
●
●
●
●
●
●
●
●
●
●
●
●
●
●
●
●
●
●
●
●
●
●
●
Amtrak
Climate
Flat Tax
Veterans
Wall Street
Amtrak
Flat Tax
Veterans
Wall Street
Mechanical Turk
Elites
−0.5 0.0 0.5 −0.5 0.0 0.5 −0.5 0.0 0.5
● Main DV Scale DV
37

D Appendix D: Missingness
When exploring the persistence of treatment e↵ects over time, we relied on an assumption that
subjects could be partitioned into always-reporters and never-reporters. Wave 2 always-reporters
respond in wave 2, regardless of their treatment assignment, likewise for wave 3 always-reporters.
Wave 2 never-reporters do not respond in wave 2, regardless of treatment assignment. This as-
sumption rules out types that would respond in, for example, wave 2 if and only if assigned to the
Amtrak op-ed.
We can attempt to falsify this assumption by estimating the e↵ect of the treatments on respond-
ing in wave 2. As shown in Table 14, we do not see evidence that the rates of response in follow-up
waves are a↵ected by treatment in either experiment. This table bolsters the always-reporters
assumption in that it does not provide evidence that it is false.
Table 14: Predicting Follow-up Response From Treatment Condition
Responded Wave 2 Responded Wave 3
Op-ed: Amtrak 0.016 �0.014 �0.006(0.033) (0.022) (0.026)
Op-ed: Climate 0.034 �0.019(0.021) (0.027)
Op-ed: Flat Tax �0.048 �0.002 �0.039(0.032) (0.022) (0.027)
Op-ed: Veterans 0.014 0.037⇤ �0.0002(0.032) (0.021) (0.026)
Op-ed: Wall Street 0.010 0.006 0.004(0.033) (0.021) (0.026)
Constant (Constant) 0.625 0.830 0.696(0.023) (0.015) (0.018)
Sample Elite MTurk MTurkN 2,181 3,571 3,571R2 0.003 0.003 0.001⇤p < .1; ⇤⇤p < .05; ⇤⇤⇤p < .01Models estimated via OLS. Robust standard errors in parentheses.
Always-reporters, of course, can and do di↵er from never-reporters. Table 15 shows the results
of a logistic regression on follow-up response on demographic characteristics. The follow-up sample
is qualitatively di↵erent from the initial sample. However, since both the elite and MTurk samples
are convenience samples to begin with, population inference is not our goal; the always-reporter
samples can be thought of as di↵erent convenience samples among whom persistence can be studied
without bias.
38

Table 15: Predicting Follow-up Response From Demographics
Responded Wave 2 Responded Wave 3
Age: 30 - 39 0.023 0.595⇤⇤⇤ 0.646⇤⇤⇤
(0.226) (0.111) (0.088)Age: 40 - 49 �0.214 0.676⇤⇤⇤ 0.723⇤⇤⇤
(0.220) (0.163) (0.123)Age: 50 - 59 0.042 0.866⇤⇤⇤ 0.863⇤⇤⇤
(0.215) (0.201) (0.148)Age: 60+ 0.069 1.510⇤⇤⇤ 1.113⇤⇤⇤
(0.214) (0.430) (0.251)High School 0.281 0.504
(0.571) (0.516)Some College 0.946 0.487 0.582
(0.906) (0.559) (0.507)College 1.528⇤ 0.815 0.828
(0.870) (0.560) (0.507)Graduate School 1.795⇤⇤ 0.790 0.598
(0.870) (0.575) (0.514)Hispanic 0.374 �0.411⇤ �0.149
(0.367) (0.246) (0.209)White 0.715⇤⇤ 0.051 �0.130
(0.291) (0.188) (0.152)Other Race 0.482 �0.064 �0.171
(0.324) (0.226) (0.184)Moderate �0.210 �0.089 �0.301⇤⇤⇤
(0.139) (0.131) (0.101)Libertarian �0.005 �0.610⇤⇤⇤ �0.292⇤
(0.213) (0.197) (0.168)Conservative �0.048 �0.075 �0.189
(0.216) (0.202) (0.150)Other 0.109 �0.071 �0.445⇤⇤
(0.275) (0.234) (0.183)Female �0.262⇤⇤ 0.047 �0.154⇤⇤
(0.108) (0.095) (0.075)7-point Party ID �0.001 0.010 0.052⇤
(0.034) (0.041) (0.030)Constant �1.652⇤ 0.767 0.138
(0.920) (0.591) (0.531)Sample Elite MTurk MTurkN 1,899 3,571 3,571Log Likelihood -1,230.551 -1,517.129 -2,154.779AIC 2,495.101 3,070.257 4,345.558⇤p < .1; ⇤⇤p < .05; ⇤⇤⇤p < .01Models estimated via logistic regression. Robust standard errors in parentheses.Omitted Categories: Age 18-29, Less than High School, Black, Liberal, Male
39
E Appendix E: Experimental Stimuli
40
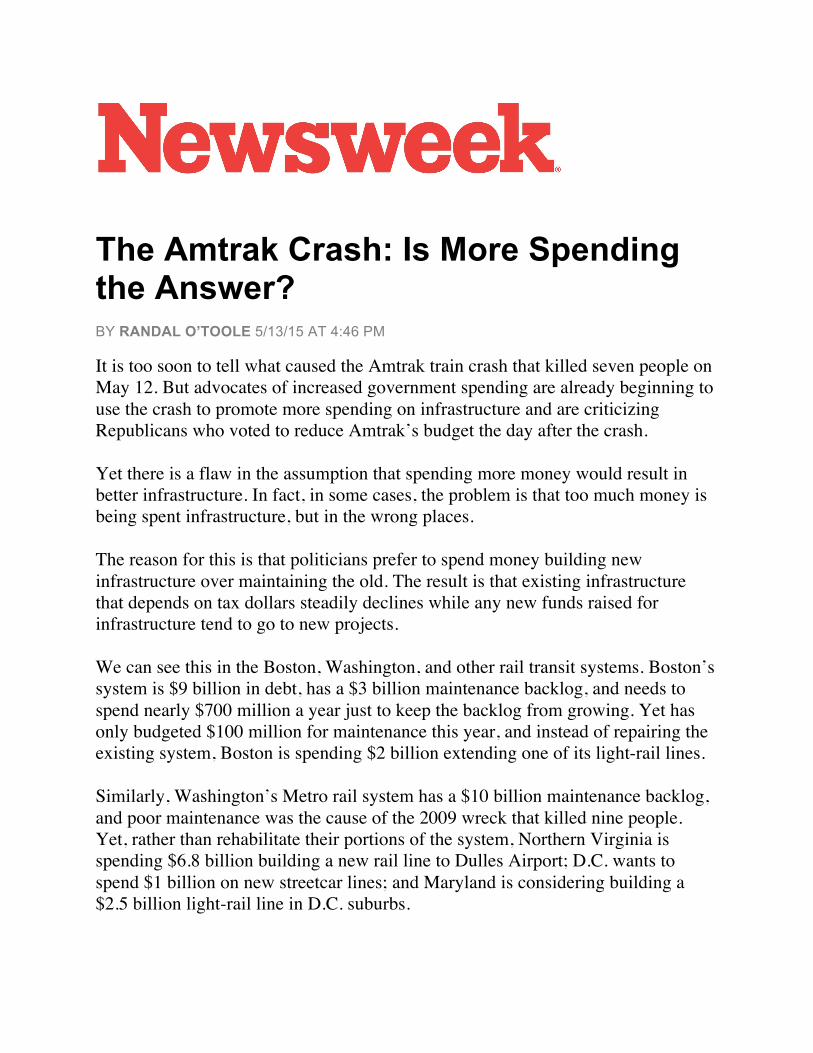
The Amtrak Crash: Is More Spending the Answer? BY RANDAL O’TOOLE 5/13/15 AT 4:46 PM It is too soon to tell what caused the Amtrak train crash that killed seven people on May 12. But advocates of increased government spending are already beginning to use the crash to promote more spending on infrastructure and are criticizing Republicans who voted to reduce Amtrak’s budget the day after the crash. Yet there is a flaw in the assumption that spending more money would result in better infrastructure. In fact, in some cases, the problem is that too much money is being spent infrastructure, but in the wrong places. The reason for this is that politicians prefer to spend money building new infrastructure over maintaining the old. The result is that existing infrastructure that depends on tax dollars steadily declines while any new funds raised for infrastructure tend to go to new projects. We can see this in the Boston, Washington, and other rail transit systems. Boston’s system is $9 billion in debt, has a $3 billion maintenance backlog, and needs to spend nearly $700 million a year just to keep the backlog from growing. Yet has only budgeted $100 million for maintenance this year, and instead of repairing the existing system, Boston is spending $2 billion extending one of its light-rail lines. Similarly, Washington’s Metro rail system has a $10 billion maintenance backlog, and poor maintenance was the cause of the 2009 wreck that killed nine people. Yet, rather than rehabilitate their portions of the system, Northern Virginia is spending $6.8 billion building a new rail line to Dulles Airport; D.C. wants to spend $1 billion on new streetcar lines; and Maryland is considering building a $2.5 billion light-rail line in D.C. suburbs.

On the other hand, infrastructure that is funded out of user fees is generally in good shape. Despite tales of crumbling bridges, the 2007 Minnesota bridge collapse was due to a construction flaw and the 2013 Washington state bridge collapse was due to an oversized truck; lack of maintenance had nothing to do with either failure. Department of Transportation numbers show that the number of bridges considered structurally deficient has fallen by more than 50 percent since 1990, while the average roughness of highway pavement has decreased. State highways and bridges, which are almost entirely funded out of user fees, tend to be in the best condition while local highways and bridges, which depend more on tax dollars, tend to be the ones with the most serious problems. Before 1970, almost all of our transportation infrastructure was funded out of user fees and the United States had the best transportation system in the world. Since then, funding decisions have increasingly been made by politicians who are more interested in getting their pictures taken cutting ribbons than in making sure our transportation systems run safely and smoothly. Proponents of higher gas taxes and other increased funding on infrastructure may talk about crumbling bridges, but what they really want is to spend more money on new projects that are often of little value. For example, they want high-speed trains that cost more but go less than half the speed of flying and light-rail trains that cost more but can move fewer people than buses. This country doesn’t need more infrastructure that it can’t afford to maintain. Instead, it needs a more reliable system of transport funding, and that means one based on user fees and not tax subsidies. Randal O’Toole is a senior fellow with the Cato Institute and author of Gridlock: Why We’re Stuck in Traffic and What to Do About It.

The Political Assault on Climate Skeptics Members of Congress send inquisitorial letters to universities, energy companies, even think tanks. By RICHARD S. LINDZEN March 4, 2015 6:50 p.m. ET Research in recent years has encouraged those of us who question the popular alarm over allegedly man-made global warming. Actually, the move from “global warming” to “climate change” indicated the silliness of this issue. The climate has been changing since the Earth was formed. This normal course is now taken to be evidence of doom. Individuals and organizations highly vested in disaster scenarios have relentlessly attacked scientists and others who do not share their beliefs. The attacks have taken a threatening turn. As to the science itself, it’s worth noting that all predictions of warming since the onset of the last warming episode of 1978-98—which is the only period that the United Nations Intergovernmental Panel on Climate Change (IPCC) attempts to attribute to carbon-dioxide emissions—have greatly exceeded what has been observed. These observations support a much reduced and essentially harmless climate response to increased atmospheric carbon dioxide. In addition, there is experimental support for the increased importance of variations in solar radiation on climate and a renewed awareness of the importance of natural unforced climate variability that is largely absent in current climate models. There also is observational evidence from several independent studies that the so-called “water vapor feedback,” essential to amplifying the relatively weak impact of carbon dioxide alone on Earth temperatures, is canceled by cloud processes. There are also claims that extreme weather—hurricanes, tornadoes, droughts, floods, you name it—may be due to global warming. The data show no increase in the number or intensity of such events. The IPCC itself acknowledges the lack of
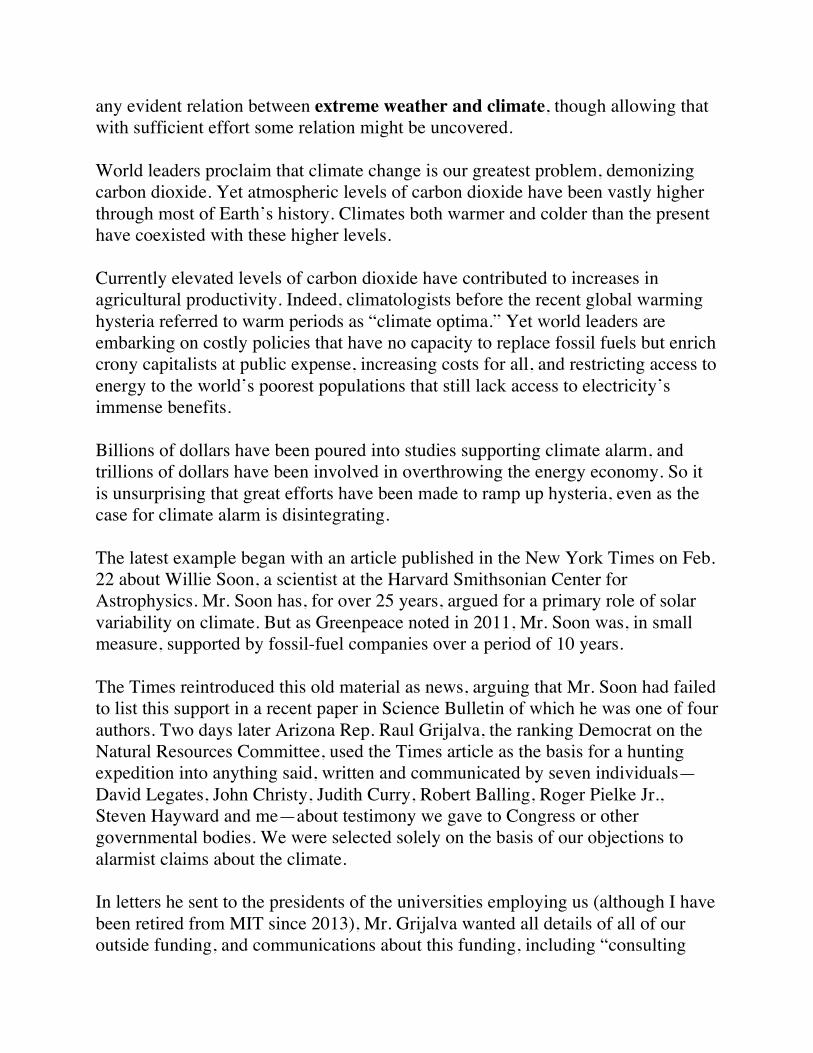
any evident relation between extreme weather and climate, though allowing that with sufficient effort some relation might be uncovered. World leaders proclaim that climate change is our greatest problem, demonizing carbon dioxide. Yet atmospheric levels of carbon dioxide have been vastly higher through most of Earth’s history. Climates both warmer and colder than the present have coexisted with these higher levels. Currently elevated levels of carbon dioxide have contributed to increases in agricultural productivity. Indeed, climatologists before the recent global warming hysteria referred to warm periods as “climate optima.” Yet world leaders are embarking on costly policies that have no capacity to replace fossil fuels but enrich crony capitalists at public expense, increasing costs for all, and restricting access to energy to the world’s poorest populations that still lack access to electricity’s immense benefits. Billions of dollars have been poured into studies supporting climate alarm, and trillions of dollars have been involved in overthrowing the energy economy. So it is unsurprising that great efforts have been made to ramp up hysteria, even as the case for climate alarm is disintegrating. The latest example began with an article published in the New York Times on Feb. 22 about Willie Soon, a scientist at the Harvard Smithsonian Center for Astrophysics. Mr. Soon has, for over 25 years, argued for a primary role of solar variability on climate. But as Greenpeace noted in 2011, Mr. Soon was, in small measure, supported by fossil-fuel companies over a period of 10 years. The Times reintroduced this old material as news, arguing that Mr. Soon had failed to list this support in a recent paper in Science Bulletin of which he was one of four authors. Two days later Arizona Rep. Raul Grijalva, the ranking Democrat on the Natural Resources Committee, used the Times article as the basis for a hunting expedition into anything said, written and communicated by seven individuals— David Legates, John Christy, Judith Curry, Robert Balling, Roger Pielke Jr., Steven Hayward and me—about testimony we gave to Congress or other governmental bodies. We were selected solely on the basis of our objections to alarmist claims about the climate. In letters he sent to the presidents of the universities employing us (although I have been retired from MIT since 2013), Mr. Grijalva wanted all details of all of our outside funding, and communications about this funding, including “consulting
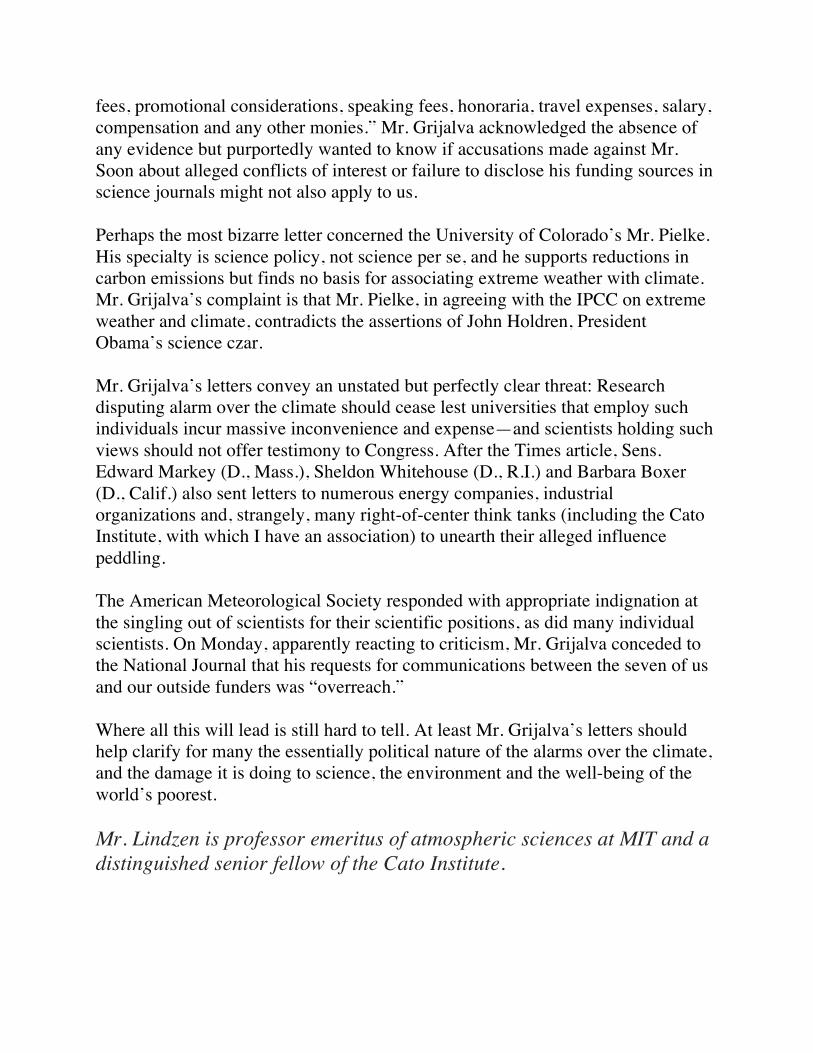
fees, promotional considerations, speaking fees, honoraria, travel expenses, salary, compensation and any other monies.” Mr. Grijalva acknowledged the absence of any evidence but purportedly wanted to know if accusations made against Mr. Soon about alleged conflicts of interest or failure to disclose his funding sources in science journals might not also apply to us. Perhaps the most bizarre letter concerned the University of Colorado’s Mr. Pielke. His specialty is science policy, not science per se, and he supports reductions in carbon emissions but finds no basis for associating extreme weather with climate. Mr. Grijalva’s complaint is that Mr. Pielke, in agreeing with the IPCC on extreme weather and climate, contradicts the assertions of John Holdren, President Obama’s science czar. Mr. Grijalva’s letters convey an unstated but perfectly clear threat: Research disputing alarm over the climate should cease lest universities that employ such individuals incur massive inconvenience and expense—and scientists holding such views should not offer testimony to Congress. After the Times article, Sens. Edward Markey (D., Mass.), Sheldon Whitehouse (D., R.I.) and Barbara Boxer (D., Calif.) also sent letters to numerous energy companies, industrial organizations and, strangely, many right-of-center think tanks (including the Cato Institute, with which I have an association) to unearth their alleged influence peddling. The American Meteorological Society responded with appropriate indignation at the singling out of scientists for their scientific positions, as did many individual scientists. On Monday, apparently reacting to criticism, Mr. Grijalva conceded to the National Journal that his requests for communications between the seven of us and our outside funders was “overreach.” Where all this will lead is still hard to tell. At least Mr. Grijalva’s letters should help clarify for many the essentially political nature of the alarms over the climate, and the damage it is doing to science, the environment and the well-being of the world’s poorest. Mr. Lindzen is professor emeritus of atmospheric sciences at MIT and a distinguished senior fellow of the Cato Institute.

Blow Up the Tax Code and Start Over Apply a 14.5% flat tax to personal income and to businesses. Cut deductions. Watch the economy roar. By RAND PAUL June 17, 2015 7:09 p.m. ET Some of my fellow Republican candidates for the presidency have proposed plans to fix the tax system. These proposals are a step in the right direction, but the tax code has grown so corrupt, complicated, intrusive and antigrowth that I’ve concluded the system isn’t fixable. So on Thursday I am announcing an over $2 trillion tax cut that would repeal the entire IRS tax code—more than 70,000 pages—and replace it with a low, broad-based tax of 14.5% on individuals and businesses. I would eliminate nearly every special-interest loophole. The plan also eliminates the payroll tax on workers and several federal taxes outright, including gift and estate taxes, telephone taxes, and all duties and tariffs. I call this “The Fair and Flat Tax.” President Obama talks about “middle-class economics,” but his redistribution policies have led to rising income inequality and negative income gains for families. Here’s what I propose for the middle class: The Fair and Flat Tax eliminates payroll taxes, which are seized by the IRS from a worker’s paychecks before a family ever sees the money. This will boost the incentive for employers to hire more workers, and raise after-tax income by at least 15% over 10 years. Here’s why we have to start over with the tax code. From 2001 until 2010, there were at least 4,430 changes to tax laws—an average of one “fix” a day—always promising more fairness, more simplicity or more growth stimulants. And every year the Internal Revenue Code grows absurdly more incomprehensible, as if it were designed as a jobs program for accountants, IRS agents and tax attorneys. Polls show that “fairness” is a top goal for Americans in our tax system. I envision a traditionally All-American solution: Everyone plays by the same rules. This means no one of privilege, wealth or with an arsenal of lobbyists can game the system to pay a lower rate than working Americans.

Most important, a smart tax system must turbocharge the economy and pull America out of the slow-growth rut of the past decade. We are already at least $2 trillion behind where we should be with a normal recovery; the growth gap widens every month. Even Mr. Obama’s economic advisers tell him that the U.S. corporate tax code, which has the highest rates in the world (35%), is an economic drag. When an iconic American company like Burger King wants to renounce its citizenship for Canada because that country’s tax rates are so much lower, there’s a fundamental problem. Another increasingly obvious danger of our current tax code is the empowerment of a rogue agency, the IRS, to examine the most private financial and lifestyle information of every American citizen. We now know that the IRS, through political hacks like former IRS official Lois Lerner, routinely abused its auditing power to build an enemies list and harass anyone who might be adversarial to President Obama’s policies. A convoluted tax code enables these corrupt tactics. My tax plan would blow up the tax code and start over. In consultation with some of the top tax experts in the country, including the Heritage Foundation’s Stephen Moore, former presidential candidate Steve Forbes and Reagan economist Arthur Laffer, I devised a 21st-century tax code that would establish a 14.5% flat-rate tax applied equally to all personal income, including wages, salaries, dividends, capital gains, rents and interest. All deductions except for a mortgage and charities would be eliminated. The first $50,000 of income for a family of four would not be taxed. For low-income working families, the plan would retain the earned-income tax credit. I would also apply this uniform 14.5% business-activity tax on all companies—down from as high as nearly 40% for small businesses and 35% for corporations. This tax would be levied on revenues minus allowable expenses, such as the purchase of parts, computers and office equipment. All capital purchases would be immediately expensed, ending complicated depreciation schedules. The immediate question everyone asks is: Won’t this 14.5% tax plan blow a massive hole in the budget deficit? As a senator, I have proposed balanced budgets and I pledge to balance the budget as president. Here’s why this plan would balance the budget: We asked the experts at the nonpartisan Tax Foundation to estimate what this plan would mean for jobs, and whether we are raising enough money to fund the government. The analysis is positive news: The plan is an economic steroid injection. Because the Fair and Flat

Tax rewards work, saving, investment and small business creation, the Tax Foundation estimates that in 10 years it will increase gross domestic product by about 10%, and create at least 1.4 million new jobs. And because the best way to balance the budget and pay down government debt is to put Americans back to work, my plan would actually reduce the national debt by trillions of dollars over time when combined with my package of spending cuts. The left will argue that the plan is a tax cut for the wealthy. But most of the loopholes in the tax code were designed by the rich and politically connected. Though the rich will pay a lower rate along with everyone else, they won’t have special provisions to avoid paying lower than 14.5%. The challenge to this plan will be to overcome special-interest groups in Washington who will muster all of their political muscle to save corporate welfare. That’s what happened to my friend Steve Forbes when he ran for president in 1996 on the idea of the flat tax. Though the flat tax was surprisingly popular with voters for its simplicity and its capacity to boost the economy, crony capitalists and lobbyists exploded his noble crusade. Today, the American people see the rot in the system that is degrading our economy day after day and want it to end. That is exactly what the Fair and Flat Tax will do through a plan that’s the boldest restoration of fairness to American taxpayers in over a century. Sen. Paul, a Republican from Kentucky, is running for his party’s presidential nomination.

The Other Veterans Scandal By MICHAEL F. CANNON and CHRISTOPHER A. PREBLE JUNE 15, 2014 WASHINGTON — THE Department of Veterans Affairs is mired in scandal. More than 57,000 veterans have been waiting at least three months for a doctor’s appointment. Another 64,000 never even made it onto a waiting list. There are allegations that waits for care either caused or contributed to veterans’ deaths. But another, even larger problem with the Department of Veterans Affairs is being overlooked: Even when the department works exactly as intended, it helps inflict great harm on veterans, active-duty military personnel and civilians. Here’s how. Veterans’ health and disability benefits are some of the largest costs involved in any military conflict, but they are delayed costs, typically reaching their peak 40 or 50 years after the conflict ends. Congress funds these commitments — through the Department of Veterans Affairs — only once they come due. As a result, when Congress debates whether to authorize and fund military action, it can act as if those costs don’t exist. But concealing those costs makes military conflicts appear less burdensome and therefore increases their likelihood. It’s as if Congress deliberately structured veterans’ benefits to make it easier to start wars. The Department of Veterans Affairs is supposed to help wounded veterans, but its current design makes soldiers more likely to get killed or injured in the first place. The scandal isn’t at the Department of Veterans Affairs. The scandal is the Department of Veterans Affairs. Is there a better way? We propose a system of veterans’ benefits that would be funded by Congress in advance. It would allow veterans to purchase life,
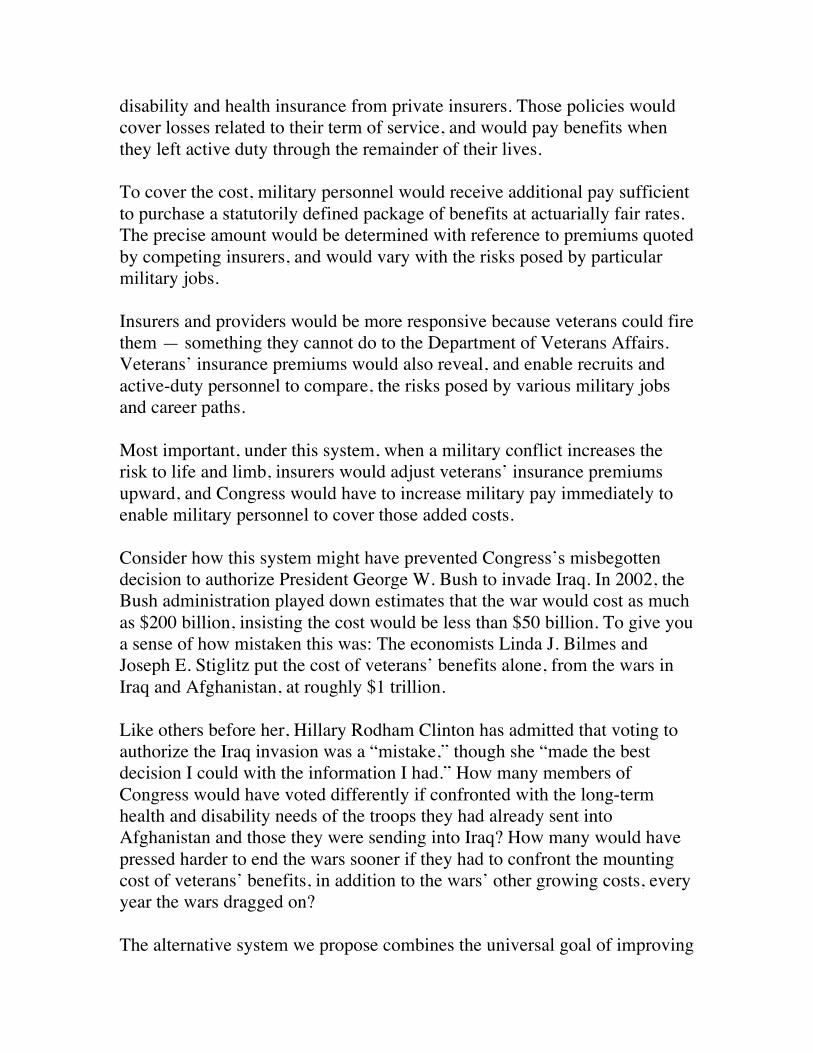
disability and health insurance from private insurers. Those policies would cover losses related to their term of service, and would pay benefits when they left active duty through the remainder of their lives. To cover the cost, military personnel would receive additional pay sufficient to purchase a statutorily defined package of benefits at actuarially fair rates. The precise amount would be determined with reference to premiums quoted by competing insurers, and would vary with the risks posed by particular military jobs. Insurers and providers would be more responsive because veterans could fire them — something they cannot do to the Department of Veterans Affairs. Veterans’ insurance premiums would also reveal, and enable recruits and active-duty personnel to compare, the risks posed by various military jobs and career paths. Most important, under this system, when a military conflict increases the risk to life and limb, insurers would adjust veterans’ insurance premiums upward, and Congress would have to increase military pay immediately to enable military personnel to cover those added costs. Consider how this system might have prevented Congress’s misbegotten decision to authorize President George W. Bush to invade Iraq. In 2002, the Bush administration played down estimates that the war would cost as much as $200 billion, insisting the cost would be less than $50 billion. To give you a sense of how mistaken this was: The economists Linda J. Bilmes and Joseph E. Stiglitz put the cost of veterans’ benefits alone, from the wars in Iraq and Afghanistan, at roughly $1 trillion. Like others before her, Hillary Rodham Clinton has admitted that voting to authorize the Iraq invasion was a “mistake,” though she “made the best decision I could with the information I had.” How many members of Congress would have voted differently if confronted with the long-term health and disability needs of the troops they had already sent into Afghanistan and those they were sending into Iraq? How many would have pressed harder to end the wars sooner if they had to confront the mounting cost of veterans’ benefits, in addition to the wars’ other growing costs, every year the wars dragged on? The alternative system we propose combines the universal goal of improving

veterans’ benefits with conservative Republicans’ preference for market incentives and antiwar Democrats’ desire to make it harder to wage war. Pre-funding veterans’ benefits could prevent unnecessary wars, or at least end them sooner. We can think of no greater tribute to the men and women serving in our armed forces. _______ Michael F. Cannon is the director of health policy studies, and Christopher Preble is the vice president for defense and foreign policy studies, at the Cato Institute.

Wall Street offers very real benefits: Opposing view But headlines focus on the bad behavior. Thaya Knight 7:16 pm May 26, 2015 Not every person on Wall Street is a morally corrupt Gordon Gekko. Do Wall Street traders want to make money? Yes. Are they generally people who thrive in a fast-paced, competitive environment? You bet. And that is a good thing. At its core, here’s what Wall Street does: It makes sure that companies doing useful things get the money they need to keep doing those things. Do you like your smartphone? Does it make your life easier? The company that made that phone got the money to develop the product and get it into the store where you bought it with the help of Wall Street. When a company wants to expand, or make a new product, or improve its old products, it needs money, and it often gets that money by selling stock or bonds. That helps those companies, the broader economy and consumers generally. When we have flashing headlines about Wall Street traders acting badly, as we had last week with news of five major banks pleading guilty to criminal charges, it is very easy to hate Wall Street. But we only hear headlines about the worst behavior. No one writes news stories about traders who go about their business every day, carefully complying with the many (and there are many) rules and regulations that govern their work. Also, the financial sector, which is usually what people mean when they say “Wall Street,” isn’t only or even mostly the big banks. There are small firms, banks, funds and advisers that make up a large portion of our financial industry. While the news about corruption, corporate welfare and lawbreaking is very bad, it doesn’t mean the entire industry is rotten. Or, more important, that we don’t need it. Wall Street could be better. We could eliminate regulations that crowd out competition for the big banks. We could reform the system to do away with “too big to fail,” making it harder for bad traders to get away with bad behavior. Either way, we shouldn’t lose sight of the very real economic and social benefits Wall Street provides. Thaya Knight is associate director of financial regulation studies at the Cato Institute.

F Appendix F: Outcome Measures
Amtrak Outcomes:
• Do you think the government should spend more, less, or about what it does now on trans-portation and infrastructure? [1: A lot more, A lot less]
• Would you prefer government pay for building and maintaining roads and infrastructurethrough raising taxes for transportation spending, or through charging user-fees, like payingtolls when you drive on the highways? [1: Fund entirely through tax increases, 4: BothEqually, 7; Fund entirely through user fees]
• If the government raised taxes to pay for more transportation spending, do you expect thatmoney would primarily go toward building new infrastructure projects or maintaining andimproving existing infrastructure? [1: Entirely toward NEW infrastructure projects, 4: BothEqually, 7: Entirely toward maintaining EXISTING infrastructure]
• For every dollar the government spends on transportation and infrastructure projects, abouthow many cents do you think are spent ine�ciently? [Slider 0 - 100, How Many Cents SpentIne�ciently?]
Climate Outcomes:
• Would you say that climate change is best described as a ... (1: Crisis, 7: Not a problem atall)
• From what you’ve read and heard, do you believe increases in Earth’s temperature are due...(1: Entirely due to the e↵ects of pollution from human activity, 7: Entirely due to naturalcauses)
• Do you think the solution to the climate change problem will primarily come from governmentpolicies or technological innovation in the free market? (1: Entirely from the free market, 7:Entirely from government policies)
• Thinking about what’s in the news, is the seriousness of global warming generally exaggerated,correct, or underestimated? (1: Generally exaggerated, 4: Generally Correct, 7: Generallyunderestimated)
• How many degrees (Fahrenheit) do you believe the Earth will warm over the next 100 years?(Select “0” if you think the temperature will stay about the same) [Slider -3 to 3]
53
Flat Tax Outcomes:
• Would you favor or oppose changing the federal tax system to a flat tax, where everyonemaking more than $50,000 a year pays the same percentage of his or her income in taxes? [1:Strongly Favor, 7: Strongly Oppose]
• What percentage of income, from 0 to 100, do you think Americans should pay in federaltaxes on average? [Slider 0 - 100, Average Tax Rate]
• Do you favor or oppose reducing the business and corporate tax rate to 14.5% percent? [1:Strongly Favor, 7: Strongly Oppose]
• Do you think a flat tax on incomes over $50,000 without tax deductions or credits will domore to help all Americans or do more to help wealthy Americans? [1: Do more to help ALLAmericans, 7: Do more to help WEALTHY Americans]
Veterans Outcomes:
• How would you rate your feelings toward the Department of Veterans A↵airs (the VA) on ascale of 0 to 100, where a rating of 100 means you feel as warm and positive as possible and0 means you feel as cold and negative as possible? How do you feel toward... [Department ofVeterans A↵airs]
• How much confidence do you have in the Department of Veterans A↵airs’ ability to care forveterans? [1: A Great Deal, 7: None At All]
• Would you favor or oppose changing the healthcare system for Veterans to a system wherethe government provides additional money su�cient for Veterans to purchase a government-approved health insurance plan from private health insurance companies? [1: Strongly Favor,7: Strongly Oppose]
• For every dollar the government spends on Veterans Benefits, about how many cents do youthink are spent ine�ciently? [Slider 0 - 100, How Many Cents Spent Ine�ciently?]
Amtrak Outcomes:
• Do you think the government should spend more, less, or about what it does now on trans-portation and infrastructure? [1: A lot more, A lot less]
• Would you prefer government pay for building and maintaining roads and infrastructurethrough raising taxes for transportation spending, or through charging user-fees, like payingtolls when you drive on the highways? [1: Fund entirely through tax increases, 4: BothEqually, 7; Fund entirely through user fees]
• If the government raised taxes to pay for more transportation spending, do you expect thatmoney would primarily go toward building new infrastructure projects or maintaining andimproving existing infrastructure? [1: Entirely toward NEW infrastructure projects, 4: BothEqually, 7: Entirely toward maintaining EXISTING infrastructure]
54
• For every dollar the government spends on transportation and infrastructure projects, abouthow many cents do you think are spent ine�ciently? [Slider 0 - 100, How Many Cents SpentIne�ciently?]
Climate Outcomes:
• Would you say that climate change is best described as a ... (1: Crisis, 7: Not a problem atall)
• From what you’ve read and heard, do you believe increases in Earth’s temperature are due...(1: Entirely due to the e↵ects of pollution from human activity, 7: Entirely due to naturalcauses)
• Do you think the solution to the climate change problem will primarily come from governmentpolicies or technological innovation in the free market? (1: Entirely from the free market, 7:Entirely from government policies)
• Thinking about what’s in the news, is the seriousness of global warming generally exaggerated,correct, or underestimated? (1: Generally exaggerated, 4: Generally Correct, 7: Generallyunderestimated)
• How many degrees (Fahrenheit) do you believe the Earth will warm over the next 100 years?(Select “0” if you think the temperature will stay about the same) [Slider -3 to 3]
55

Flat Tax Outcomes:
• Would you favor or oppose changing the federal tax system to a flat tax, where everyonemaking more than $50,000 a year pays the same percentage of his or her income in taxes? [1:Strongly Favor, 7: Strongly Oppose]
• What percentage of income, from 0 to 100, do you think Americans should pay in federaltaxes on average? [Slider 0 - 100, Average Tax Rate]
• Do you favor or oppose reducing the business and corporate tax rate to 14.5% percent? [1:Strongly Favor, 7: Strongly Oppose]
• Do you think a flat tax on incomes over $50,000 without tax deductions or credits will domore to help all Americans or do more to help wealthy Americans? [1: Do more to help ALLAmericans, 7: Do more to help WEALTHY Americans]
Veterans Outcomes:
• How would you rate your feelings toward the Department of Veterans A↵airs (the VA) on ascale of 0 to 100, where a rating of 100 means you feel as warm and positive as possible and0 means you feel as cold and negative as possible? How do you feel toward... [Department ofVeterans A↵airs]
• How much confidence do you have in the Department of Veterans A↵airs’ ability to care forveterans? [1: A Great Deal, 7: None At All]
• Would you favor or oppose changing the healthcare system for Veterans to a system wherethe government provides additional money su�cient for Veterans to purchase a government-approved health insurance plan from private health insurance companies? [1: Strongly Favor,7: Strongly Oppose]
• For every dollar the government spends on Veterans Benefits, about how many cents do youthink are spent ine�ciently? [Slider 0 - 100, How Many Cents Spent Ine�ciently?]
Wall Street Outcomes:
• How would you rate your feelings toward the following on a scale of 0 to 100, where a ratingof 100 means you feel as warm and positive as possible and 0 means you feel as cold andnegative as possible. How do you feel toward... [CEOs; Wall Street Bankers; GovernmentRegulators]
• What percentage of Wall Street bankers, from zero to one hundred, do you think are corrupt?[Slider 0 - 100: % Wall Street Bankers Corrupt]
• How much confidence do you have in Wall Street bankers and brokers to do the right thing...[1: A Great Deal, 7: None at all]
• Compared to what it’s doing now, do you think the federal government needs to regulatebanks and financial institutions [1: A lot more, A lot less]
56
Marijuana Outcomes:
• Do you favor or oppose legalizing marijuana? [1: Strongly Favor, 7: Strongly Oppose]
• As you may know, some states have decided to allow marijuana use, but it is still prohibitedunder federal law. Do you think the federal government should or should not prosecute peoplewho use marijuana in these states? [1: Federal government should not prosecute, 7: Federalgovernment should prosecute]
• Under federal law, marijuana is categorized as a drug equally dangerous to heroin. Do youthink federal law should categorize marijuana as more dangerous than heroin, less dangerousthan heroin, or equally dangerous as heroin? [1: A lot less dangerous, 7: A lot more dangerous]
• If marijuana is legalized, do you expect marijuana usage will increase, decrease, or stay thesame? [1: Decrease a lot, 7: Increase a lot]
57