Embed Size (px)
Citation preview

The London School of Economicsand Political Science
Essays in Corporate Finance
Luana Zaccaria
A thesis submitted to the Department of Finance of the London School of Eco-
nomics for the degree of Doctor of Philosophy, London, August 2016
1

Declaration
I certify that the thesis I have presented for examination for the PhD degree of the
London School of Economics and Political Science is solely my own work other than
where I have clearly indicated that it is the work of others (in which case the extent
of any work carried out jointly by me and any other person is clearly identified in
it).
The copyright of this thesis rests with the author. Quotation from it is permitted,
provided that full acknowledgement is made. This thesis may not be reproduced
without my prior written consent. I warrant that this authorisation does not, to
the best of my belief, infringe the rights of any third party.
I declare that my thesis consists of 22,455 words
Statement of conjoint work
I confirm that Chapter 2 was jointly co-authored with Dr Juanita Gonzalez-Uribe
and I contributed 50% of this work.
2

Abstract
In most countries financial authorities regulate capital markets by monitoring
banks’ lending activity and imposing disclosure requirements on issuers of pub-
licly traded securities. However, most companies’ financial claims are not listed
and many different investors, outside of the banking industry, affect credit expan-
sion and capital provision to the real economy. Examples of non-banks capital
providers include venture capital firms and money market funds. This PhD thesis
focuses on the growing and largely unsupervised finance arena that lies outside
of traditional banking intermediation or public capital markets. In the first chap-
ter, “Are Family and Friends the Wrong Investors? Evidence from U.S. Start-ups”,
I investigate the effects of funding from family and friends on firms’ subsequent
access to venture capital. To address potential endogeneity of informal finance, I
use an instrument that hinges on founders’ family size as an exogenous constraint
on the supply of informal funds. My results show that informal finance reduces
the probability of future financing events. In the second chapter, “Private Capital
Markets and Entrepreneurial Debt: Evidence from U.S. Unregistered Securities
Offerings” co-authered with Dr. Juanita Gonzalez-Uribe, we investigate the use
of non-bank private debt by very early stage firms. Contrary to many accounts of
start-up activity, we document that entrepreneurial firms have an important re-
liance on private debt. We show that late stage rounds are 3% more likely to be
conducted with debt contracts but we find little evidence that collateral availabil-
ity affects the issuance of private debt. Finally, in “Discipline in the Securitization
Market”, I examine how investors’ sophistication in securitization markets affects
efficiency of credit generation and loan performance. I find that it is never optimal
to have a perfectly informed Buy Side, as it would constrain high quality credit
generation. Furthermore, market discipline is facilitated by high risk free rates
and diminished volatility in loan payoffs.
3
Contents
1 Are Family and Friends the Wrong Investors? Evidence from U.S. Start-Ups 10
1.1 Introduction . . . . . . . . . . . . . . . . . . . . . . . . . . . . . . . . . . . . . . . . . . 10
1.2 Data Description and Summary Statistics . . . . . . . . . . . . . . . . . . . . . 16
1.2.1 Small and Medium Sized Firm Financing: Capital Raising withUnregistered Securities Offerings . . . . . . . . . . . . . . . . . . . . . . 17
1.2.2 A Proxy for Informal Finance: Non-Accredited Investors . . . . . . . 19
1.2.3 The Founders Team . . . . . . . . . . . . . . . . . . . . . . . . . . . . . . . . 21
1.2.4 Rare Surnames and Informal Finance . . . . . . . . . . . . . . . . . . . 22
1.3 Empirical Strategy . . . . . . . . . . . . . . . . . . . . . . . . . . . . . . . . . . . . . 24
1.3.1 Empirical Specifications . . . . . . . . . . . . . . . . . . . . . . . . . . . . . 24
1.3.2 Rare Last Names, Informal Finance and Access to Private CapitalMarkets . . . . . . . . . . . . . . . . . . . . . . . . . . . . . . . . . . . . . . . . . 27
1.4 Results . . . . . . . . . . . . . . . . . . . . . . . . . . . . . . . . . . . . . . . . . . . . . 31
1.5 Direct Effects on Performance or Frictions in Private Capital Markets? 33
1.5.1 Direct Effects: The California Subsample . . . . . . . . . . . . . . . . . 33
1.5.2 Frictions in Private Capital Markets: the Fight for Control . . . . . 35
1.5.3 Alternative mechanisms . . . . . . . . . . . . . . . . . . . . . . . . . . . . . 36
1.6 Conclusions . . . . . . . . . . . . . . . . . . . . . . . . . . . . . . . . . . . . . . . . . . 37
2 Private Capital Markets and Entrepreneurial Debt: Evidence from UnregisteredSecurities Offerings 58
2.1 Introduction . . . . . . . . . . . . . . . . . . . . . . . . . . . . . . . . . . . . . . . . . . 58
2.2 Entrepreneurial Finance, Regulation D and Private Capital Markets . 62
2.3 Entrepreneurial Debt . . . . . . . . . . . . . . . . . . . . . . . . . . . . . . . . . . . . . . 66
2.3.1 Early vs Late Stage . . . . . . . . . . . . . . . . . . . . . . . . . . . . . . . . . . . 67
2.3.2 Determinants of Private Debt . . . . . . . . . . . . . . . . . . . . . . . . . . . . . 69
2.4 Conclusions . . . . . . . . . . . . . . . . . . . . . . . . . . . . . . . . . . . . . . . . . . . 72
4

3 Discipline in the Securitization Market 88
3.1 Introduction . . . . . . . . . . . . . . . . . . . . . . . . . . . . . . . . . . . . . . . . . . 88
3.2 Model Set Up . . . . . . . . . . . . . . . . . . . . . . . . . . . . . . . . . . . . . . . . . 92
3.3 Solving the Model . . . . . . . . . . . . . . . . . . . . . . . . . . . . . . . . . . . . . . 95
3.4 Discussion . . . . . . . . . . . . . . . . . . . . . . . . . . . . . . . . . . . . . . . . . . . 111
3.5 Conclusion . . . . . . . . . . . . . . . . . . . . . . . . . . . . . . . . . . . . . . . . . . . 112
5
List of Figures
1.1 Summary Statistics: The Seed Round . . . . . . . . . . . . . . . . . . . . . 41
1.2 Summary Statistics: The Seed Round. Investors and Founders . . . . 43
1.3 Founders: Year of First Employment. . . . . . . . . . . . . . . . . . . . . . 49
1.4 Immigration to U.S. 1820-2007, Source: U.S. Department of HomelandSecurity. . . . . . . . . . . . . . . . . . . . . . . . . . . . . . . . . . . . . . . . . 50
2.1 Number of Offerings and Amounts Sold by Quarter . . . . . . . . . . . 73
2.2 Median and Mean Dollar Amount Sold per Offering . . . . . . . . . . . 75
3.1 Probability of loan transaction . . . . . . . . . . . . . . . . . . . . . . . . . 98
3.2 Equilibrium 1 . . . . . . . . . . . . . . . . . . . . . . . . . . . . . . . . . . . . 104
3.3 Equilibrium 2 . . . . . . . . . . . . . . . . . . . . . . . . . . . . . . . . . . . . 105
3.4 Equilibrium 3 . . . . . . . . . . . . . . . . . . . . . . . . . . . . . . . . . . . . 106
3.5 Equilibrium and market discipline . . . . . . . . . . . . . . . . . . . . . . 108
3.6 Market discipline and credit generation: numerical simulation . . . . 110
6

List of Tables
1.1 Seed Round Summary Statistics: Industry . . . . . . . . . . . . . . . . . 39
1.2 Seed Round Summary Statistics: State of Location . . . . . . . . . . . . 40
1.3 Seed Round Summary Statistics: Deal and Firm Characteristics . . . 42
1.4 Revenue Size Transition Matrix . . . . . . . . . . . . . . . . . . . . . . . . 44
1.5 Seed Round Summary statistics: IF-firms vs NonIF-firms . . . . . . . . 45
1.6 Ethnic/Linguistic Categories definition, founders’ team mix and follow-
on funding . . . . . . . . . . . . . . . . . . . . . . . . . . . . . . . . . . . . . . 46
1.7 Small Family and Informal Finance . . . . . . . . . . . . . . . . . . . . . . 47
1.8 Small Family and Growth . . . . . . . . . . . . . . . . . . . . . . . . . . . . 48
1.9 Founders: Education . . . . . . . . . . . . . . . . . . . . . . . . . . . . . . . . 49
1.10 Ethnicity of Founders: Rare and Non Rare Surnames . . . . . . . . . . 51
1.11 Small Family and Future Financing Events . . . . . . . . . . . . . . . . . 52
1.12 Bivariate Probit Model: Full Sample . . . . . . . . . . . . . . . . . . . . . 53
1.13 Bivariate Probit Model: Disclosed Revenues . . . . . . . . . . . . . . . . 54
1.14 Marginal Effect of Informal Finance on the Probability of Future
Financing Events . . . . . . . . . . . . . . . . . . . . . . . . . . . . . . . . . . 55
7

1.15 The California Subsample: Descriptive statistics and Business En-
tity Status (as of June 2015) . . . . . . . . . . . . . . . . . . . . . . . . . . 56
1.16 Survival vs Follow-on Financing Probability . . . . . . . . . . . . . . . . 57
1.17 Informal Finance and Control . . . . . . . . . . . . . . . . . . . . . . . . . 57
2.1 Deal and Firm Characteristics . . . . . . . . . . . . . . . . . . . . . . . . . 74
2.2 Total Offerings by Industry . . . . . . . . . . . . . . . . . . . . . . . . . . . 76
2.3 Industry Breakdown and the General Solicitation Exemption . . . . 77
2.4 Location: U.S. and Non-U.S. Firms . . . . . . . . . . . . . . . . . . . . . . . 78
2.5 Public Listings and Industry . . . . . . . . . . . . . . . . . . . . . . . . . . 79
2.6 Public Listings and Location . . . . . . . . . . . . . . . . . . . . . . . . . . 80
2.7 Early vs Late Stage Deals: Descriptive Statistics . . . . . . . . . . . . . . 81
2.8 Early vs Late Stage Deals: Industry Breakdown . . . . . . . . . . . . . . 82
2.9 Securities Issued and Use of Debt . . . . . . . . . . . . . . . . . . . . . . . 84
2.10 Use of Debt in Private Capital Markets . . . . . . . . . . . . . . . . . . . . 85
2.11 Use of Debt: Early and Late Stage Deals . . . . . . . . . . . . . . . . . . . 86
2.12 Use of Debt in Early Stage and Collateral Availability . . . . . . . . . . 87
8

“If I wanted to shake this tree with my hands I should not be able to do it. But the wind,
which we do not see, tortures and bends it in whatever direction it pleases.
It is by invisible hands that we are bent and tortured worst.”
F. Nietzsche, “Thus Spoke Zarathustra”
9
Chapter 1
Are Family and Friends the Wrong
Investors? Evidence from U.S.
Start-Ups
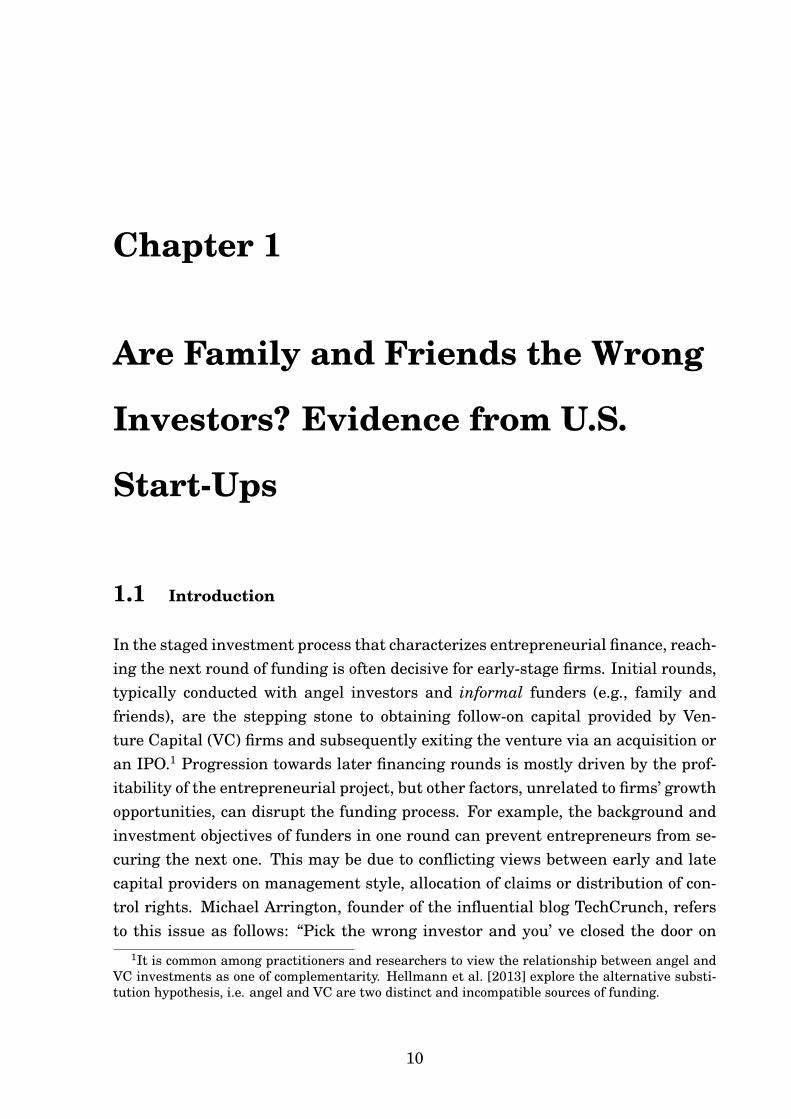
1.1 Introduction
In the staged investment process that characterizes entrepreneurial finance, reach-ing the next round of funding is often decisive for early-stage firms. Initial rounds,typically conducted with angel investors and informal funders (e.g., family andfriends), are the stepping stone to obtaining follow-on capital provided by Ven-ture Capital (VC) firms and subsequently exiting the venture via an acquisition oran IPO.1 Progression towards later financing rounds is mostly driven by the prof-itability of the entrepreneurial project, but other factors, unrelated to firms’ growthopportunities, can disrupt the funding process. For example, the background andinvestment objectives of funders in one round can prevent entrepreneurs from se-curing the next one. This may be due to conflicting views between early and latecapital providers on management style, allocation of claims or distribution of con-trol rights. Michael Arrington, founder of the influential blog TechCrunch, refersto this issue as follows: “Pick the wrong investor and you’ ve closed the door on
1It is common among practitioners and researchers to view the relationship between angel andVC investments as one of complementarity. Hellmann et al. [2013] explore the alternative substi-tution hypothesis, i.e. angel and VC are two distinct and incompatible sources of funding.
10

others”.2 This paper elaborates on the idea behind this quote, focusing on infor-mal finance. Are family and friends the wrong investors, in the sense that theydeter subsequent funding? If so, what is the nature of their conflict with other in-vestors? The relevance of these questions extends beyond entrepreneurial financeand venture capital literature, since, due to a lack of accounting or market data,there is little empirical evidence on whether and how informal finance affects firms’outcomes. This is despite entrepreneurs’ social circle provides the most accessibleform of funding for young firms around the world (Bygrave and Quill [2006]).
I investigate the effects of informal finance on startups’ ability to access additionalcapital during later funding stages. To do so, I select a sample of early-stage firmsat the time of their seed funding round and track their future financing events. Dif-ferently from previous studies on early-stage and seed financing that largely relyon survey data and self reporting investors’ documentation, I use a novel hand-collected dataset based on SEC filings for private placements (Form Ds) of smalland young U.S. firms.3 The advantages provided by this data are twofold. First, itrelaxes sampling bias concerns, as filing is mandatory for firms that sell unregis-tered securities to outside investors such as family and friends, angels or invest-ment funds.4 Therefore, this dataset provides a more complete picture of privatecapital markets, including seed funding which precedes access to VC investments.This early investment phase has not been fully documented by the existing litera-ture. Second, it provides new information on characteristics and financing choicesfor a large sample of startups. For example, along with industry, location andamount of capital raised, Form Ds contain data on the age of the company, itsmanagement team, the size of its revenues and the type of security offered in theprivate placement.
Crucially for the purpose of this paper, Form Ds also contain information on in-formal finance, as issuers must disclose whether informal investors are allowed toparticipate in the offering. Thus, this is one of the first studies that attempt toquantify and characterize recourse to informal finance in entrepreneurial litera-ture. In this sample, only 17% of firms use family and friends funding and wheninformal funders participate in initial rounds they typically co-invest with formal
2“VCs And Super Angels: The War For The Entrepreneur” posted on TechCrunch on 15 August2010.
3See for example Lerner et al. [2015], Kerr et al. [2014], Robb and Robinson [2012], Hellmannet al. [2013].
4Although failing to file a form D does not result in the loss of the federal registration exemption,the SEC can seek to have the issuer enjoined from future use of Regulation D under rule 507. Theviolation can also constitute felony. It can be argued that enforcement of this requirement maybe currently weak, but firms that have access to legal advice and that intend to proceed towardsfurther VC funding are reasonably likely to comply. There are no filing fees and the “estimatedaverage burden hours per response” is 4, as stated on the form.
11
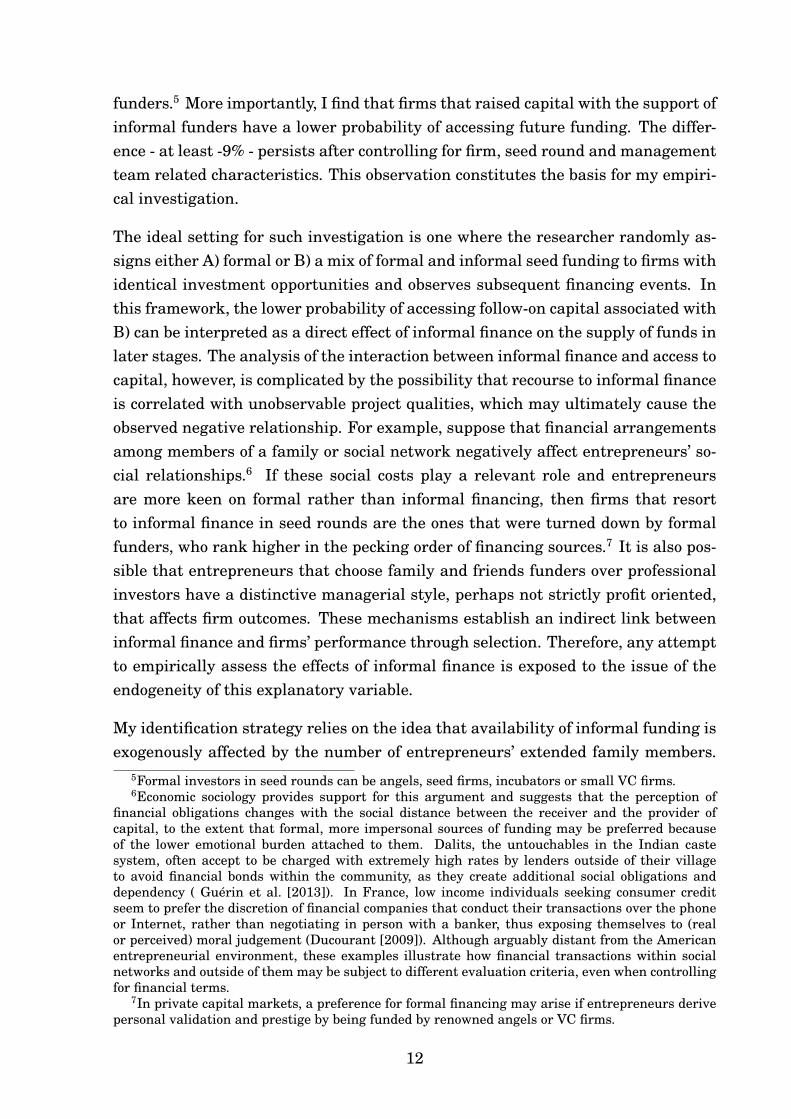
funders.5 More importantly, I find that firms that raised capital with the support ofinformal funders have a lower probability of accessing future funding. The differ-ence - at least -9% - persists after controlling for firm, seed round and managementteam related characteristics. This observation constitutes the basis for my empiri-cal investigation.
The ideal setting for such investigation is one where the researcher randomly as-signs either A) formal or B) a mix of formal and informal seed funding to firms withidentical investment opportunities and observes subsequent financing events. Inthis framework, the lower probability of accessing follow-on capital associated withB) can be interpreted as a direct effect of informal finance on the supply of funds inlater stages. The analysis of the interaction between informal finance and access tocapital, however, is complicated by the possibility that recourse to informal financeis correlated with unobservable project qualities, which may ultimately cause theobserved negative relationship. For example, suppose that financial arrangementsamong members of a family or social network negatively affect entrepreneurs’ so-cial relationships.6 If these social costs play a relevant role and entrepreneursare more keen on formal rather than informal financing, then firms that resortto informal finance in seed rounds are the ones that were turned down by formalfunders, who rank higher in the pecking order of financing sources.7 It is also pos-sible that entrepreneurs that choose family and friends funders over professionalinvestors have a distinctive managerial style, perhaps not strictly profit oriented,that affects firm outcomes. These mechanisms establish an indirect link betweeninformal finance and firms’ performance through selection. Therefore, any attemptto empirically assess the effects of informal finance is exposed to the issue of theendogeneity of this explanatory variable.
My identification strategy relies on the idea that availability of informal funding isexogenously affected by the number of entrepreneurs’ extended family members.
5Formal investors in seed rounds can be angels, seed firms, incubators or small VC firms.6Economic sociology provides support for this argument and suggests that the perception of
financial obligations changes with the social distance between the receiver and the provider ofcapital, to the extent that formal, more impersonal sources of funding may be preferred becauseof the lower emotional burden attached to them. Dalits, the untouchables in the Indian castesystem, often accept to be charged with extremely high rates by lenders outside of their villageto avoid financial bonds within the community, as they create additional social obligations anddependency ( Guérin et al. [2013]). In France, low income individuals seeking consumer creditseem to prefer the discretion of financial companies that conduct their transactions over the phoneor Internet, rather than negotiating in person with a banker, thus exposing themselves to (realor perceived) moral judgement (Ducourant [2009]). Although arguably distant from the Americanentrepreneurial environment, these examples illustrate how financial transactions within socialnetworks and outside of them may be subject to different evaluation criteria, even when controllingfor financial terms.
7In private capital markets, a preference for formal financing may arise if entrepreneurs derivepersonal validation and prestige by being funded by renowned angels or VC firms.
12

I construct an instrument that proxies for the size of founders’ family using theCensus Frequently Occurring Surnames (FOS) dataset on U.S. surnames. The in-strument is a dummy variable (SmallFamily) that takes a value of 1 when a firm’sfounder team has a small combined family network, that is when the team hasa higher than average component of individuals with rare last names. I classifylast names as rare if they occur less than 100 times in the FOS. While details oneach rare name’s frequency are not provided, the summary statistics reported inthe FOS show that the expected number of individuals that bear any one of theserare names is 4.5. Therefore, founders with rare surnames are statistically likelyto have a small extended family. To illustrate the logic behind this approach, con-sider the example of a married male. Exactly five occurrences of his last namein the national survey may include records of himself, his spouse, one child andtwo parents. The count would easily exceed 5 if other relatives (siblings, cousins,uncles, etc.) were included.8
The relevance of this instrument is supported by its negative and significant firststage coefficient: firms with SmallFamily = 1 are 5% less likely to resort to infor-mal finance. Importantly, the SmallFamily instrument has a significant positiveeffect (+4%) on the probability of future financing events. Its validity, however,relies on the hypothesis that founders with rare last names have no advantagein managing a business or accessing capital markets. Clark and Cummins [2015]suggest that rare last names typically belong to recent immigrants or small localfamilies. It can be argued that foreign-born individuals are particularly prolificinnovators (Kerr [2008]) or that small families’ offspring is wealthier and bettereducated because of lower dispersion of family resources (Goodman et al. [2012],Downey [2001]). By means of a matching algorithm (Ambekar et al. [2009]), Iassociate founders’ surnames with their ethnicities. I show that the positive rela-tionship between the instrument and the outcome variable mostly originates fromthe subgroup of individuals with European origins and therefore it is unlikely to bedue to recent immigration to the U.S. Furthermore, I collect on-line curricula for asubsample of founders. Startup founders are likely to have a college or higher de-gree and approximately ten years of working experience, but differences betweenthe rare last names group and the rest of the sample are not significant. Thus, inmy sample, I find no evidence that individuals belonging to small families possesshigher education or business skills.
8There are few data available on size and structure of families for the general population inthe U.S. In a study conducted by Garceau et al. [2008] on a sample of 1,019 individuals resid-ing in Connecticut the average number of blood related immediate family members is 5.07 andthe average number of blood related extended family members (aunt/uncle, niece/nephew, grand-mother/grandfather) is 7.41. In Hampton et al. [2011], a survey of American Facebook users showsthat immediate and extended family members account for 21 of the active contacts on average.
13

At the firm level, the SmallFamily variable is not correlated with measures of prof-itability and growth opportunities. Revenues as reported at the time of the seedround are marginally lower than for the rest of the firms in the sample and, condi-tional on receiving additional funding, the instrument does not predict changes inrevenue size between the seed and the follow-on round.
The endogeneity problem is formally addressed by means of a bivariate probitmodel (as in Greene [1998] and Evans and Schwab [1995]), where I simultane-ously estimate the probabilities of accessing follow-on funding and of resorting toinformal finance in the seed round. The instrument is included in the regression forthe binary endogenous variable. My results show that recourse to informal financehas a negative and significant effect on the probability of future financing eventsranging from -15% to -19%, with the strongest effect associated with later fundingprovided exclusively by formal investors. The magnitude of these estimates im-plies that marginal effects or coefficients computed from a single equation probitor a linear probability model, which range from -5% to -13%, underestimate thenegative impact of informal finance.
The main results in this paper suggest that funding from family and friends affectsfuture financial constraints. Therefore, while informal finance may constitute acheaper source of capital as it mitigates some frictions in the formal capital market(Stiglitz [1990] and Besley and Coate [1995]), it may also impose costs further downthe line.9
There are at least two explanations for these findings. First, informal fundersmay introduce corporate governance issues that deter professional investors fromparticipating in later rounds. Goldfarb et al. [2012] and Wong [2002] argue that,unlike angels, VC firms use staging and various contractual provisions to moni-tor managers, protect their claims and pursue their investment objectives.10 Themost direct way to exert control is to gain board seats and replace founders in themanagement team (Wasserman [2012]). Founders with a pronounced desire forcontrol are likely to resist this process, and resistance can be difficult to overcomeif family and friends stakeholders side with founders. Such unofficial shareholderagreements can originate from altruistic preferences of informal funders or from
9Informal finance can relax capital constraints by mitigating asymmetric information and moralhazard problems. Social and physical proximity to the entrepreneurs provide informal funderswith superior information and lower monitoring costs as compared to other financial intermedi-aries (Stiglitz [1990]). Also, reputational concerns enhance and correct incentives when capitaltransactions are conducted within a narrow community (Besley and Coate [1995]).
10Control is not usually claimed by angel investors because geographic proximity and higher eq-uity stake left to founders allow for low monitoring. Also, firms in their early stages are presumablytesting products and business models, which requires founders’ specific skills, making external su-pervision unnecessary or even counterproductive.
14

non-pecuniary private benefits of retaining control within the close social circle.11
The expectation of a costly or time consuming negotiation over control with thisinformal coalition can discourage investments from outsiders.12 The novel datasetemployed in this paper allows to explore this hypothesis. I provide evidence thatlate stage investors are less likely to gain control over firms that have informalfunders. Specifically, founders are more likely to retain executive positions afterreceiving follow-on capital if they sourced seed funding from family and friends.
A second explanation for the negative effect of informal finance on subsequent ac-cess to capital resides in its potential direct impact on businesses profitability andgrowth, which ultimately determines the likelihood of receiving additional fund-ing. Using survey data for Chinese firms, Ayyagari et al. [2010] show that informalfinancing is associated with lower sales growth and reinvestment rates. Informalfinance is unlikely to provide entrepreneurs with the same level of guidance andmonitoring offered by professional investors. Moreover, having relatives or friendsas initial shareholders may affect the management style, for example by inducingtoo much risk aversion and causing firms to forgo profitable growth opportunities(Lee and Persson [2013]), or by introducing poor governance practices. If this con-jecture is true, lower probabilities of raising additional funds simply reflect inferiorbusiness performance. Evidence based on survival data for a subsample of firmslocated in California does not support this argumentation. Like in the full sample,informal finance is negatively correlated with subsequent formal capital raising,but it does not predict lower survival probabilities.
To summarize, family and friends seem to be the wrong investors, as they deterformal venture capital, which improves firms’ chances of survival. Then why doentrepreneurs resort to them? Informal finance may be cheaper than formal. How-ever, my data show that it is usually not sufficient to cover initial investment needsin full. Formal capital providers (e.g angels) who co-invest with family and friendsmay anticipate the lower probability of follow-on rounds and raise the bar for ac-cess to seed rounds, thus undoing the cheapness of informal finance. If informalcapital does not materially reduce the cost of funding, the benefits of involving fam-ily and friends must have a non pecuniary nature. The data on founder-managerturnover indicate that recourse to informal finance may depend on entrepreneurs’
11In the related family firms literature, Demsetz and Lehn [1985] refer to these benefits as the“amenity potential” of control. Informally funded firms are similar to family firms insofar as in-formal stakeholders are motivated by goals that are not purely related to financial performances.However, these firms do not necessarily share other distinctive features of family firms such as di-rect involvement of the family in the management or preference for within firm inter-generationaltransfers (Bennedsen et al. [2010])
12To continue the parallel with family firms literature, this mechanism can also explain why VCrarely invest in family firms. See for example Martí et al. [2013].
15

taste for control and on VC investment practices. Having trustworthy stakeholdersincreases the probability of retaining control in founders’ hands, counterbalancingthe negative effects on access to formal capital.
Thanks to the novelty and the scope of the SEC Form D dataset, this paper con-tributes to the entrepreneurial finance literature by significantly expanding empir-ical evidence on firm and founders’ characteristics and financing choices of privateventures in their early-stage investment phase. Importantly, my focus on informalfinance adds to the current understanding of the role of this source of finance instartups’ capital structure (Robb and Robinson [2012]) and firms’ outcomes. Theresults on the negative effects of family and friends funding on access to formalcapital are also new to the existing body of theoretical literature on informal fi-nance (Stiglitz [1990], Besley and Coate [1995], Lee and Persson [2013]). Finally,by providing suggestive evidence on corporate governance and performance relatedmechanisms, I connect informal finance literature with previous empirical and the-oretical work on entrepreneurship (Hurst and Pugsley [2010], Hamilton [2000]),family firms (Demsetz and Lehn [1985], Burkart et al. [2003], Bennedsen et al.[2007], Miller et al. [2007]) and stage financing (Hellmann and Thiele [2015]).
The remainder of the paper is organized as follows. Sections I describes the data.Section II illustrates the empirical methodology and Section III presents the re-sults. Possible mechanisms are explored in Section IV. Section V concludes.
1.2 Data Description and Summary Statistics
The main dataset employed in this study is constructed using filings for unreg-istered securities offerings (Form Ds) submitted by firms to the SEC. These fil-ings contain information on firms, investors, terms of the offering and managers.I expand the dataset with information on the ethnicity of founders-managers bymeans of a name-ethnicity matching algorithm. The proxy for the size of founders’extended family is derived using the Frequently Occurring Surnames Dataset pro-vided by the Census Bureau.
16

1.2.1 Small and Medium Sized Firm Financing: Capital Raising with
Unregistered Securities Offerings
Currently available data on financing choices of early-stage firms rely primarilyon surveys that cover a small portion of total capital raising. In order to attenu-ate this problem, I construct a dataset based on online filings for private offeringsconducted in exemption to US securities laws.13 Securities laws (“Securities Act”1933, “Exchange Act” 1934) apply to all companies that issue securities. The mainpurpose of these laws is to protect investors as they enforce transparency and dis-closure of companies’ business and risk profile. The most common exemption forsmall businesses is the private placement exemption under SEC Regulation D,14
which requires non-reporting firms to notify the SEC of the sale of securities viaForm D. Angel investors and VC firms, for example, make their investments bypurchasing in these private offerings of unregistered securities.15 Regulation Drequires that Form D must be filed within 15 days of securities first sale date,regardless of whether the total amount offered has been sold in full or not. Nosubmission fees are charged and, beginning in March 2009, the SEC has made itobligatory to file Form D online. Despite the light work load that filing involves,it is reasonable to expect that this requirement may not be fulfilled by the totalityof the firms subject to it but only by a selection of them. This can happen if en-trepreneurs are unaware of the regulation or have no access to legal counseling.In this case, my sample may be tilted towards more sophisticated and experiencedentrepreneurs. This circumstance, however, is unlikely to spuriously drive resultson the negative effects of informal finance on access to venture capital. To the con-trary, it may relax concerns over adverse selection of informally funded firms, asthe sample excludes subsistence enterprises.
Any Form D filed is publicly available on the SEC website and contains the follow-ing information: issuer characteristics (year and state of incorporation, address,industry group, revenue range), type of securities issued (equity, debt, hybrid se-curities), offering and sales amount and the total number of investors who partici-pated to the offering.
I collect all Form Ds that were filed with the SEC between March 2009 and October2014. For the purpose of investigating the effects of informal finance, I identify a
13See http://www.sec.gov/info/smallbus/qasbsec.htm14Private offering can also be conducted under Section(a)(2) of the Securities Act. Ivanov and
Bauguess [2013] show that the amount of capital raised through Section(a)(2) during the years2009 to 2012 is less than 20% of the amount raised through Regulation D.
15Tracking investments in private firms via Form D filings is becoming increasingly popular inthe business community. See for example the website www.FormDs.com .
17

sample of issuers that display early stage business features and follow their capitalraising activity over time. Each firm is uniquely identified by the Central Key Code,a numeric code assigned by the SEC.
Specifically, this restricted sample includes 6,717 non-financial firms, selected ac-cording to the following criteria:
1. All firms filed a Form D for the first time in years 2011-201216
2. Firms are less than 2 years old at the time of the first offering
3. First offerings are smaller than $6M17
4. Disclosed revenues at the time of the first offering are smaller than $5 million
5. Firms operate in the U.S. and are incorporated (if already so) in Canada orthe U.S.
Filters 1. and 2. are used in order to identify young firms that access entrepreneurialfinance for the first time. Filters 3. and 4. are added in order to exclude firms that,despite being young and new to private capital markets, are large in size and in amature stage, as it would be the case for spin-offs of established companies. Filter5. rids the analysis of potential additional complexity due to frictions in interna-tional capital markets.
Table 1.1 shows the industry breakdown: Technology (other than Biotechnologyand Telecommunications) dominates the sample with 24.2% of the observations.Other relevant sectors are Commercial (7.4%), Health Care (other than Hospitalsand Health Insurance, 6.1%) and Oil and Gas (6.1%). Most firms are located in Cal-ifornia (19.2%), Texas (10.8%), New York (9.8%), Florida (4.7%) and Massachusetts(4.7%) (Table 1.2). The total amount offered by firms in the sample at the time oftheir first access to private capital markets ranges between $1.2 billion and $1.4billion per quarter, while the average size of the offering is $1.5 million (see Figures
16Choosing observations from the middle years of the larger sample makes sure that it is possibleto track all previous offerings and restrict the sample only to first rounds for firms less than 2 yearsold and allows a little over 6 quarters after the first issuance to track future financing events.
17The rational for this threshold is that VC firms usually participate in larger, late stage deals.Average Series A VC deal size was $6.2 million, $6.5 milion and $8.6milion in years 2012, 2013 andin the first three quarters of 2014 respectively, according to Prequin Venture Capital Deals reportOctober 2014.
18

1.2a and 1.2b).18 These descriptive statistics are consistent with survey-based dataon seed financing as they match evidence and trends on angel investing highlightedby Halo Reports (provided by ARI, SVB and CB Insights) for the correspondingyears.19
The granularity of the information contained in these filings allows for the analysisof private capital markets along novel dimensions. In terms of firm characteristics,common legal entity types are Corporations (45.8%) and LLCs (44.4%), most firmsare incorporated in Delaware (49.4%), while only 0.67% of the firms were not yetincorporated at the time of the deal. Half of the firms in the sample decline todisclose revenues, 27% of them had no revenues and the rest disclose revenuessmaller than $5 million. Table 3 reports characteristics of the seed round. The se-curity type used is equity (alone or in combination with other securities) for 79.7%of the observations and debt (alone or in combination with other securities) for14.8% of the observations. The issues are rarely conducted with the support of aregistered financial intermediary (less than 5%). The average number of investorsper deal is 11.42 and the median is 6 (Figure 1.2a).
In order to assess firms’ ability to access private capital markets, I analyze follow-on rounds filed within six quarters of the initial round.20 Only 19% of firms in thesample raise capital in a second offering.21 The average amount offered is substan-tially higher than in first rounds ( $3.2 million on average) and debt (alone or incombination with other securities) is more widely used (26%). Firm characteristicsare essentially unchanged: 99% of the issuers are still incorporated in the samestate, only 7% report to operate in a different sector and 14% report a change inrevenue size (see the revenue size transition matrix in Table 1.4).
1.2.2 A Proxy for Informal Finance: Non-Accredited Investors
SEC disclosure requirements for private placements allow researchers to constructan empirical proxy for informal finance. Firms filing Form D must disclose whether
18Since filing of Form D is required within 15 days since the day of the first sale, amounts offeredand amounts sold by the filing date can differ. On average, firms report to have sold 58% of theamount offered.
19http://www.angelresourceinstitute.org/research/halo-report/halo-report.aspx20Conditional on observing a second offering after the first one, the average time between the first
and the second issuance in the sample is 3.86 quarters, but decreases over time due to observability.6 quarters represents the 75th percentile in the distribution of time elapsed between the first andthe second offering for all of the 8 subsamples of firms by quarter of first issuance.
21For a comparison, the Angel Capital Association reports that in 2012 the number ofVC deals was approximately 15% of the number of seed round deals provided by angels(https://www.sec.gov/info/smallbus/acsec/acsec-091713-verrill-hudson-slides.pdf)
19

non-accredited investors can purchase the security offered: I use this informationas the indicator for recourse to informal finance.Regulation D (in its most commonly used rule, 506(b)) imposes restrictions to secu-rities sales based on financial sophistication and need for protection of investors.22
Specifically, buyers in a private offering are assumed to be sophisticated if theycomply with the definition of accredited investor. In the context of this study,the relevant accredited investor definition includes: registered financial interme-diaries, charity organizations, directors or executives of the firm, individuals withnet worth greater than $1 million or income exceeding $200 thousands per year.23
Under Rule 506(b) there are no restrictions on participation and disclosures if se-curities are sold to accredited investors, while non-accredited investors cannot bemore than 35 in each single offering and must be provided with specific disclosuredocuments, such as certified financial statements.24 Since general solicitation, i.e.any form of advertisement of a private securities sale, is forbidden, investors mustbe approached directly by the issuer.25 While financial intermediation companiesare well known to the general public through websites or advertisement, angelinvestors usually organize themselves in groups operating via a website, in or-der to increase their visibility to entrepreneurs. The Angel Capital Association,the largest angel organization in the world, and the vast majority of angel groupsin U.S.A., only accept accredited investors as members. Thus, non-accredited in-
22Private offerings in exemption of securities laws can be conducted also under Rule 504, Rule 505and, since September 2013, Rule 506(c). Rules 504 and 505 are applicable to smaller issuances ($1million or $5 million) and, under certain circumstances, they relax constraints on non-accreditedinvestors participation . However, only Rule 506(b) exempts from Blue Sky law registration. Thisseems to be the reason why Rule 506(b) has been used in 94% of the offerings between 2009 and2012. See Ivanov and Bauguess [2013].
23The standards for accredited investor qualification were first set 1982 when Regulation D wasissued. The first revision of these criteria was introduced in 2011 with the Dodd-Frank Act andenacted in December 2012. It excluded the house of first residence from the calculation of natu-ral persons net worth. According to the Dodd-Frank Act, the SEC is now required to revise theaccredited investor definition every four years.
24The constraint on the number of non-accredited investors does not appear to be binding for firmsin this sample, as 96% of first round filings for completed offerings report less than 35 investors intotal.
For offerings up to $2,000,000 financial statements requirements are the following : balancesheets as of the end of each of the two most recent fiscal years (only the balance sheet, dated within120 days of the start date of the offering, must be audited);statements of income, cash flow andchanges in stockholders’ equity for each of the two years preceding the date of the most recentaudited balance sheet (or such shorter period as the issuer has been in business); and interimfinancial statements as of the end of the issuer’s most recent fiscal quarter. For offerings up to$7,500,000 the same requirements apply. However, the financial statements must be audited unlessthe issuer cannot obtain audited financial statements without unreasonable effort or expense. Forofferings over $7,5000,000 the issuer must provide the financial statements required to be filed ina registration statement that the issuer would be entitled to use.
25The solicitation of an offering became less restricted with the JOBS act in 2012. The newRule 506(c) allows general solicitation provided that the offering is addressed only to accreditedinvestors.
20
vestors participating in these offerings are likely to be individuals within the en-trepreneur’s social network (such as family, friends or employees). This identi-fication criterion is strict: depending on their wealth, family and friends of theentrepreneur may qualify as accredited investors and participate in the offering assuch. As a consequence, the informal finance proxy may underestimate the extentto which firms rely on this type of investors for funding.
Table 1.5 provides descriptive statistics for the 1,117 firms (16.63% of the wholesample) that have informal funders among their initial investors (I will refer to thisgroup as IF-firms) and compare them with the rest of the sample (NonIF-firms).Consistent with economic intuition, IF-firms are smaller (in terms of number offounders and amount offered in the first round) and at an earlier stage of businessoperations (as per revenue size, years since incorporation and entity type). More-over, location and sector distributions are more dispersed than for NonIF-firms,with smaller weights on California and Tech companies.
97% of the completed IF-firms’ first offerings have accredited investors participat-ing alongside non accredited investors. Informal finance is rarely the only sourceof funding and it is usually combined with professional investments.
Crucially in the context of this paper, the likelihood of raising capital in a secondoffering drops dramatically for the IF-firms subsample: approximately 10% of thefirms access capital markets for a second time, and less than 5% do so via offeringsconducted exclusively with formal investors (see Table 1.5 ).
1.2.3 The Founders Team
“Have you ever noticed how few successful startups were founded by just one per-son?” asks Paul Graham in his blog.26 Undoubtedly, the size of the managementteam matters for professional investors when deciding whether to finance a project.Ability to work in teams and complementarities in product development and man-agement skills are often quoted as the motive for easier access to VC capital offirms with two or more founders.
Form D contains the full name and address of “related persons”, namely issuer’sexecutive officers, directors or promoters.27 I refer to the group of related persons
26Paul Graham is a known tech entrepreneur, venture capitalist and co-founder of Y Combinator,a seed capital firm.
27The definition of promoter includes: (i) Any person who, acting alone or in conjunction with oneor more other persons, directly or indirectly takes initiative in founding and organizing the business
21

in each deal as the management team. In the absence of any legal or conventionaldefinition, I assign the founder status to individuals with managerial positions inthe firm at the time of its first round of capital raising, provided that it takes placewithin two years since incorporation. Therefore, I refer to the group of managersin the seed round as the founders.
This sample contains the names of 19,498 founders: 44.13% of the individuals inthis group are directors, 46.31% are executive officers and 9.56% are promoters,with 4% of them being other business entities. The size distribution of the foundersmanagement team is illustrated in Figure 1.2b. Mean and median size of foundersteams is 3 and 99% of the firms have less than 9 founders. Consistently withGraham’s quote, single-founder firms (20% of the sample) are less likely to raisecapital after the first deal: 13% of these issuers access the market a second time,versus 20% of firms with 2 or more founders.
In order to gain further insight on founders’ demographics and lacking any infor-mation on their biographies, I match founders’ last names with linguistic group/ethnicityaccording to the algorithm in Ambekar et al. [2009]. This automated ethnicity clas-sifier uses hidden Markov models and decision trees to assign names to one of 13ethnic/linguistic categories (Table 1.6, Panel A shows the hierarchical structure ofthe categories). Panel B in Table 1.6 illustrates the ethnic mix of the foundersteams. The average founders team is mostly composed of individuals with a Eu-ropean descent (84%). Interestingly, the average composition of teams that accesscapital markets for a second time is broadly similar to the full sample’s. Similarly,teams with a majority of European descendants do not seem to be more likely toraise more funding after the first round when compared to the full sample or thesubsample of firms with a balanced ethnic mix (i.e. firms where no ethnicity repre-sents more than 50% of the team).
1.2.4 Rare Surnames and Informal Finance
Since financing decisions are made by firms’ managers, investigating personalcharacteristics of founders can help identify sources of variation in the use of in-formal finance. For example, the size of founders’ extended family network mightaffect the supply of informal funds. I construct a proxy for small combined family
or enterprise of an issuer; or (ii) Any person who, in connection with the founding and organizingof the business or enterprise of an issuer, directly or indirectly receives in consideration of servicesor property, or both services and property, 10 percent or more of any class of securities of the issueror 10 percent or more of the proceeds from the sale of any class of such securities. However, aperson who receives such securities or proceeds either solely as underwriting commissions or solelyin consideration of property shall not be deemed a promoter within the meaning of this paragraphif such person does not otherwise take part in founding and organizing the enterprise. SecuritiesAct of 1933, Rule 405, 17 C.F.R. § 230.405.
22
network of the founder team, based on information on founders’ surnames con-tained in the Frequently Occurring Surnames dataset (FOS) provided by the Cen-sus Bureau.
The FOS ranks all American last names (6.2 million) in order of occurrences, i.e.in terms of number of U.S. residents with each surname. This dataset shows, alongwith names and occurrences, statistics on ethnicity and race of individuals asso-ciated with each name. For example, the last name Smith ranks first with over2.3 million occurrences and is mostly borne by non-Hispanic white (73%) and non-Hispanic black (22%) individuals. For privacy reasons related to the disclosure ofsuch sensitive demographic data, the list is truncated to exclude names that occurless than 100 times. However, summary statistics for these rare names are pro-vided by Word et al. [2008]. There are 6,096,744 rare names that correspond toover 27 million people ( 10% of the surveyed population). Thus, each rare namecorresponds on average to 4.5 individuals. Furthermore, over 90% of these rarenames occur less than 10 times.28
As a consequence of this truncation, some founders’ names in my sample (13.87%)cannot be matched with the FOS list and are classified as rare. On the basis of thejudgment that 4.5 expected occurrences of a last name reveal an exiguous numberof familiar links, I identify founders with small family networks as the ones bearinga rare surname.
I define the SmallFamily dummy variable Si = 1 if the proportion of founders infirm i with rare last names is greater than the sample average. Consistently withthe intuition above, firms with Si = 1 (1,954 observations) are less likely to resort toinformal finance as compared to the full sample (12.69% versus 16.67%).29 Impor-tantly, these firms also seem to be associated with a higher probability of raisingcapital more than once (21.85% versus 19.04%).30 The issue of robustness of thecorrelation between Si and informal finance and the question of whether channelsother than family size can affect the relationship between Si and subsequent fi-nancing events are addressed in the next section.
28Similar distributional properties of Spanish and English last names have been exploited byGüell et al. and Clark and Cummins [2015] to establish family links among individuals and trackinter-generational mobility.
29This difference is significant at 1% confidence level30This difference is significant at 1% confidence level
23

1.3 Empirical Strategy
1.3.1 Empirical Specifications
A simple way to estimate the impact of informal finance on future financing eventsis via a single equation probit model. Let the indicator variable Yi = 1 if firmi raises capital in private markets within 6 quarters since its first offering. Theprobability of Yi = 1 can be described by
Pr [Yi = 1] = Pr [Xiβ + IFiδ + εi > 0] = Φ [Xiβ + IFiδ] (1.1)
where Φ [·]is the standard normal cdf, Xi is a vector of firm, seed round, foundersand time variables and IFi is a dummy variable that takes value 1 when non-accredited investors are allowed to participate in the first offering and εi is a stan-dard normally distributed random error.
In this single-equation probit model the informal finance coefficient is treated asexogenous. There are, however, reasons why this may not be the case. Entrepreneurswho involve individuals from their social network as investors in their venturemay be the ones that enjoy non-pecuniary benefits from running a business thatis strongly connected with their communities and, as a consequence, they are notpurely profit-oriented. This attitude may discourage outside investors. Alterna-tively, if entrepreneurs prefer formal to informal finance and the supply of capitalis limited, the best projects will receive full financing by professional investorswhile other projects will either not receive funding or will be funded by informalinvestors.31 The best projects are also more likely to successfully raise capital in asecond round. Thus, the informal finance effect is due to an unobservable omitted“project quality” variable rather than a causal link with future access to capital.Notice however that the richness of the SEC data allows for extensive controls onsize, revenues and age and, more importantly, almost all of the seed round offeringswith informal funders are also subscribed by other investors. Informal finance thusdoes not seem to be correlated with rejection by early stage professional investorslike angels.
In order to allow for the possibility of endogeneity, I estimate model (1.1) jointlywith a probit model for the informal finance variable (see Greene [1998] and Evansand Schwab [1995] for applications in education economics).
31Entrepreneurs’ preference for one source of funding over the other is not an uncontroversialissue. While informal finance imposes regulatory and “emotional” burdens on founders, it might besignificantly cheaper than formal finance, especially when capital supply is exiguous and there isstrong inequality of bargaining power between entrepreneurs and professional investors.
24

Suppose that the probability of IFi = 1 is described by
Pr [IFi = 1] = Pr [Ziθ + µi > 0] = Φ [Ziθ] (1.2)
where Zi is a vector of observable and µi is a random error.
In this setting, both the outcome variable and the potentially endogenous regres-sor are dichotomous and as a consequence both the first stage and the structuralmodel are non linear. Following Heckman [1978], I employ a bivariate probit modelapproach.32
This model is identified if at least one variable (the instrument) in Zi is not con-tained in Xi.33 Equation (1.2) can be rewritten as
Pr [IFi = 1] = Pr [Xiλ+ Siπ + µi > 0] = Φ [Xiλ+ Siπ] (1.3)
where the instrument Si is the proxy for small combined family as defined in theprevious section.34
Finally, since large social networks may support founders through multiple stagesof financing, the indicator dependent variable can be redefined as Yi = 1 if firm i
raises capital in private markets with accredited investors only within 6 quarterssince its first offering. With this specification I evaluate the impact of informalfinance on funding from formal investors.
In all of the above specifications, the full vector of covariates Xi includes:32 To account for the possibility that IFi and Yi are determined by correlated unobservable vari-
ables ( say “project quality”) I assume that εi in (1.1) and µi in (1.2) are distributed bivariate normalwith E [εi] = E [µi] = 0 , var [εi] = var [µi] = 1 and corr [εi, µi] = ρ . In this model there are 4 possiblestates of the world (IFi = 0 or IFi = 1 and Yi = 0 or Yi = 1 ) and corresponding likelihood functionis a bivariate probit.
33Han and Vytlacil [2013] extend this identification result to a wider class of models that includesbivariate probit models as a special case
34 An alternative strategy consists in a 2SLS estimation where non linear fitted values for IFi
from (1.3) are used as instrument (Angrist and Pischke [2008]). While the linear IV method providesconsistent estimates of the average effect, it can be biased in small samples and its performancecan be inferior to a correctly specified maximum likelihood estimation approach. Despite thesedrawbacks, in the next section I present 2SLS estimates along with bivariate probit model resultsfor comparison.
25

• Firm characteristics: industry, revenue size, legal entity type, state of loca-tion, state of incorporation, year of incorporation
• Founders Team characteristics: size, ethnicity mix (based on Level 2 as perTable 1.6), a Corp dummy that takes value 1 if one or more of the relatedpersons are other business entities, a family dummy that takes value 1 is twoor more founders have the same last name
• Seed Round characteristics: amount offered, number of investors, quarter ofissuance, type of security issued, an Intermediation dummy that takes value1 if the offering was conducted with the support of a registered financial in-termediary, a Hot Deal dummy that takes value 1 if more than 80% of theamount offered was sold at the time of the filing (approximately half of thesample).
• An interaction term between year of incorporation and quarter of first is-suance, to capture the effect of firms’ age in different capital markets condi-tions
The coefficient of interest is δ in equation (1.1), which captures the effect of informalfinance on future financing.35 Any claim of causality relies on the relevance andvalidity of the instrument, which are discussed next.
35 In order to measure the qualitative importance of the covariates I report Average Marginal
Effects. For the j-th covariate, these are given by
AMEj = γi1
n
n∑i=1
ϕ (Aiγ)
for continuous covariates and
AMEj =1
n
n∑i=1
{Φ(Aiγ | γji = 1
)− Φ
(Aiγ | γji = 0
)}
for dummy variables , where n is the sample size, Ai is the full vector of covariates and ϕ (·) is
the first derivative of Φ (·)
26
1.3.2 Rare Last Names, Informal Finance and Access to Private Capital
Markets
For the bivariate probit model to be identified we need a) the instrument to belongto the set of explanatory variables in (1.2) and b) the instrument to be excludedfrom the structural model in (1.1). In order to verify the relevance of instrument SiI estimate the first stage single equation probit in (1.3).
Estimated coefficients and average marginal probabilities are reported in Table 1.7together with coefficient estimates for a linear probability model . Results showthat Si has a significant negative effect (-5%) on the probability of firms resortingto informal finance. The interpretation of this coefficient is relatively straightfor-ward: if the founders team has a small combined family network it is less likelyfor the firm to have informal investors. The magnitude is considerable when com-pared with the unconditional probability of resorting to informal finance for firmsin my sample (17%). Incidentally, coefficients estimates of equation (1.3) offer aninteresting insight on startups financing choices. Informal finance is less likelyfor larger offerings, but the size of the management team does not seem to play asignificant role. The estimated coefficient for the Hot Deal dummy is negative andsignificant: first rounds that are open to professional investors only are subscribedfaster.
As the relevance of the instrument is confirmed, the credibility of the identificationstrategy relies on the hypothesis that the proxy for founders family network sizedoes not affect the ability of the firm to raise capital in private markets a secondtime (other than via less frequent recourse to informal finance). At the firm level,small combined family networks do not seem to be associated with higher growthpotential. Table 1.8 shows that the instrument is not correlated with higher rev-enue size or capital raised in the seed round, nor it is predicts changes in revenuesize for firms that access follow-on financing. Hence, in this sample, availabilityof family and friends’ financial support does not make it easier for entrepreneursto kick-start their business. Furthermore, the instrument does not explain fasterexpansion processes where financing needs (measured by proportional change incapital raised between seed and follow-on round) grow more rapidly. This evidenceis consistent with the idea that founders’ preferences for non-pecuniary benefits ofentrepreneurship are orthogonal to family size, while correlated with family andfriends’ investments.
It remains to be assessed whether founders with rare last names somehow “special”in their ability to run a business or securing funding. In order to address this
27
question, I examine further the demographics of the rare last names group andcompare it with the rest of the sample. As suggested by Clark and Cummins [2015],individuals’ surnames classify as rare in three instances
1. Small local families
2. Early generations immigrants
3. Spelling mistakes/name mutations.
Each of the above classification groups poses specific challenges to the identifica-tion strategy.
Firstly, an instrument that oversamples individuals belonging to small Americanfamilies can fail the validity test if these families have larger wealth or more pow-erful social networks, as this might imply better access to funding. Such conjec-ture is consistent with the idea that lower fertility can improve the socioeconomicconditions of descendants because of lower dispersion of family resources (Good-man et al. [2012], Downey [2001]). Concerns over the validity of the instrumentmotivated by the argument above are mitigated by the fact that the population ofstart-up founders in this sample is likely to be more homogeneous in terms of socialbackground and education than the broad U.S. population.36
Second, Immigrants may have better or more innovative ideas, perhaps because ofbetter education systems outside of U.S. or because they are more motivated. Previ-ous literature explored the role of immigration in innovation and entrepreneurship.Kerr [2008] shows how Chinese and Indian inventors were important contributorsto innovation in the U.S in the 1990s by matching a name-ethnicity database withindividual patent records. On the other hand, Michelacci and Silva [2007] provideevidence that entrepreneurs who work in the same region where they were bornare more successful than outsiders as they are better at taking advantage of fi-nancial opportunities arising in that region. Although geographical distance fromfamily can certainly discourage informal finance, if the first effect dominated, theinstrument proposed would be also picking up better unobservable project qual-ity. Notice that, in this study, the “recent immigrant” status does not necessarilyassociate with the rare last name category: an entrepreneur named Elena Garcia
36According to a report published in 2010 by CB Insights, 52% of the founders of firms involvedin Internet Seed and Series A rounds have graduate level education, with 7% of the sample holdinga PhD degree.
28

would not be part of the rare surname subsample (Garcia is the 8st most commonsurname in U.S.), even if she just moved from Mexico to California.
Finally, while unable to verify the incidence of name mutations (i.e. surnamespelling mistakes at the time of registration in public records), spelling mistakesare unlikely to be frequent in the dataset as the filings are filled in by the foundersthemselves (or their representative) and machine readable. Of course, if name mu-tations and spelling mistakes were the major reason why surnames are classifiedas rare the conjectured link with the family size would no longer be grounded. Inthat case, however, it would be difficult to make sense of the first stage resultspresented in Table 1.7.
To investigate whether individuals with small families in my sample are morelikely to have higher social stata or business skills, I extract information on founderseducation and past working experience from LinkedIn, an internet-based profes-sional network. Each individual j, founder of firm i is uniquely identified if first andlast name correspond to a member of the network and if this member’s curriculumincludes a working experience in firm i. Although the working experience criterionreasonably ensures that individuals in the sample are correctly paired with net-work members, it reduces the probability of matching, as legal entity names oftendo not coincide with company names used on CVs or for commercial purposes. As aresult, only 24% (4,422 individuals) of the founders were uniquely matched with amember’s profile. The matched subsample however appears to be representative ofthe population, as the differences in the distributions of matched and unmatchedindividuals by location, sector, revenues size, team size, role and ethnicity are notstatistically different from zero.37 Insofar as education is strongly correlated withsocioeconomic background and business skills, the results support the validity ofthe instrument. Education attainments and the length of past working experienceare remarkably similar between the two groups (see Table 1.9 and Figure 1.3). Therepresentative founder has college or higher level education and approximately 10years of previous working experience, with no significant difference between indi-viduals with rare and non rare last names.38
37The test statistics and p-values for Chi-squared tests of homogeneity in the distributions ofmatched and unmatched individuals by State, Sector, Revenue Size, Team Size, Role and Ethnicityare as follows: χ2
(df) = 46.33(51), Prob=0.659; χ2(df) = 9.25(6), Prob=0.16; χ2
(df) = 1.76(3), Prob=0.624;χ2(df) = 20.44(18), Prob=0.093; χ2
(df) = 1.06(2), Prob=0.588; χ2(df) = 16.62(12), Prob=0.165;
38 This result does not necessarily contradict the idea that individuals who belong to small fam-ilies achieve higher than average sociology-economic conditions, but rather it highlights how suchachievements are common among the population of entrepreneurs in this sample, regardless of thesize of their families.
29

Finally, Panel A in Table 1.10 shows the ethnic classification of the rare last namesgroup versus the full population sample. The comparison of the two distributionsis largely in line with the idea of foreign born individuals being over-represented,but presents some peculiar features, especially when examined in juxtapositionwith U.S. immigration dynamics over the last century (Figure 1.4). East Asian andHispanic ethnicities are under-represented in the rare last names group, despiteChina and Mexico being the largest contributors to recent immigration in terms ofcountry of origin. Indian origin is over-represented, consistently with strong Indianimmigration flows in the 2000s, but so is the Italian, even though strong immigra-tion flows from this country substantially stopped in the 1980s. This mixed picturereveals that rare last names do not predominantly belong to early generation im-migrants. Different surnames distributions of different linguistic groups are due tohistorical, cultural, geographical and biological evolution (Manrubia and Zanette[2002]) and affect the probability of surnames from these groups to fall into therare category. Italian last names distribution, for example, is one of the most dis-persed while the Chinese and Korean ones are very concentrated.39 As immigrantsover time bring the name distribution feature of their linguistic group into thehost country, names belonging to groups with more (less) dispersed distributionscan qualify as rare (non-rare) even for second-or-later (first) generations. There-fore, the ethnicity classification is insightful but not fully informative of whetherrare last names mostly belong to foreign born individuals.
An additional characterization of the rare last names group in terms of early immi-grants versus small American families can be provided by looking at first names. Isplit the sample in American versus Early Generation individuals by matching firstnames with the list of the 2,438 most common given names as reported in the 1990Census. The logic behind this classification is that names that were popular atthe beginning of the 1990s must belong to the dominant cultural/ethnic heritage ofcurrent second-or-later generation Americans. Therefore, names within the list arelabeled as American and unmatched names are labeled as Early Generation. In therare subsample, American individuals have mostly European origins (88%) whileEarly Generation ones have more diverse ethnic background (Table 1.10, Panel B).Importantly, the American component in the non-rare subsample is significantlyhigher than in the rare group (89% versus 75%).
The ethnicity mix of founders is included in the set of explanatory variables Xi,but an exact control for recent immigration is not viable due to lack of data. Thus,I use the notion that European origins are mostly associated with second or later
39Rossi, the most common Italian last name approximately belongs to 0.2% of the populationwhile more than 20% Koreans bear the family name Kim
30

generations Americans to conduct robustness checks.
1.4 Results
Firms with small combined founders’ family are 4% more likely to access follow-on capital. Coefficient estimates and average marginal effects for a probit modelof the follow-on funding outcome on the exogenous variables and the SmallFam-ily instrument Si are presented in Table 1.11, together with estimates for a lin-ear probability model. The full set of covariates is employed as control. In PanelB the outcome variable is redefined as Yi = 1 if firm i raises capital in privatemarkets with formal investors only within 6 quarters since its first offering. Thecoefficient on the instrument Si is significant at conventional levels in both specifi-cations. Other results in Table 1.11 are consistent with the intuition and anecdotalevidence on entrepreneurial finance. Firms with larger founders teams are morelikely to secure subsequent financing while larger initial offerings are less likely tobe followed by second offerings in the immediate future.
The main results on the effect of informal finance on subsequent access to ven-ture capital stem from the joint estimate of (1.1) and (1.3) with a bivariate probitmodel and are illustrated in Table 1.12. Columns 1, 2 , 5 and 6 show coefficientestimates and average marginal effects using the two proposed definitions for theoutcome variable Yi. Results of 2SLS estimations are presented for comparison incolumns 3 and 7. Despite the potential endogeneity issue related to the informalfinance choice, I include estimates of average marginal effects for the single equa-tion probit model in (1.1) in columns 4 and 8. Informal finance has a negative andsignificant effect on the probability of future financing events ranging from -15%to -19%, with the strongest effect associated with follow-on funding from formalinvestors only.40 Notice that the Hot Deal variable does not affect probability offuture financing events, while it is negatively correlated with the use of informalfinance. This suggests that seed rounds conducted with no informal investors aresubscribed faster for reasons that are unrelated to higher unobservable quality of
40The significance of the informal finance variable is not overstated by its dichotomous specifi-cation. In unreported estimations, I replicate the analysis using the proportion of non-accreditedinvestors over total number of investors as proxy for informal finance. The coefficient estimatesare negative and significant at 1% level in both the probit and the linear probability model andwith both specifications for the dependent variable. However, the categorical definition is preferredbecause it is more accurate as the proportion of non-accredited to accredited investors may changeafter the filing date, once the offering is completed.
31

the entrepreneurial idea. It is possible that some early stage formal investors an-ticipate a lower probability of securing further finance in the future for informallyfunded firms and this drives the negative relationship between the Hot Deal vari-able and informal finance in the seed round. This interpretation is supported bythe fact that informal finance coefficients and marginal effects as computed withthe single equation probit model are smaller in absolute value as compared to theones computed using the instrument. In other words, it appears that the bar foraccessing formal seed financing is set higher for firms open to informal funding,effectively producing a positive, rather than adverse, selection bias.
Revenue size is arguably a relevant variable for this analysis and unfortunatelyapproximately 50% of the firms in the sample decline to disclose this information.In order to check whether the results above are driven by bad controls for revenuessize I estimate the same models for the restricted sample of firms that discloserevenues: the average effect of informal finance is still negative (-14%) and signifi-cant when follow-on rounds are conducted exclusively with formal investors (Table1.13).
The main results presented above are computed using models that include all vari-ables in the control set Xi defined in Section 3.1. Table 1.14 shows that averagemarginal effects in a bivariate probit model that only includes firm size controls(column 2) or firm size, industry and location controls (column 3) are not signif-icantly different from estimates for the full model.41 Thus, a more parsimoniousspecification with only size, industry and location controls is viable with no sig-nificant loss in the explanatory power of informal finance. Further robustnesschecks are presented in Table 1.14. In columns 4 and 5 I make use of the eth-nicity classification for founders in different ways. Instead of using the proportionof people belonging to each ethnic/linguistic group for each firm, I include either adummy variable that takes value 1 if the majority of the founders have Europeandescent or a dummy variable that takes value 1 if no ethnic group represents morethan 50% of the founders team. The purpose of these different specifications is toaccount for homogeneity versus multiethnicity of the founders team compositionrather than focusing on the specific ethnicity breakdown. This different approachdoes not yield different estimates for the effects of informal finance. In column 6I restrict the sample to firms where the majority of the founders have Europeanorigins. In doing so, I verify that the effects of informal finance are not related torecent immigration of founders. Finally I restrict the sample to Hot Deals, namelyfirms that sold at least 80% of the offering amount at the time of the filing for theirseed round. Column 7 shows that the magnitude and significance of marginal ef-
41Size controls include revenue size, legal entity type and amount offered in the seed round.
32
fects on funding from all investors types drop for this subsample but stay constantwhen follow-on funding from formal investors only is used as dependent variable.42
1.5 Direct Effects on Performance or Frictions in Private Capital Mar-
kets?
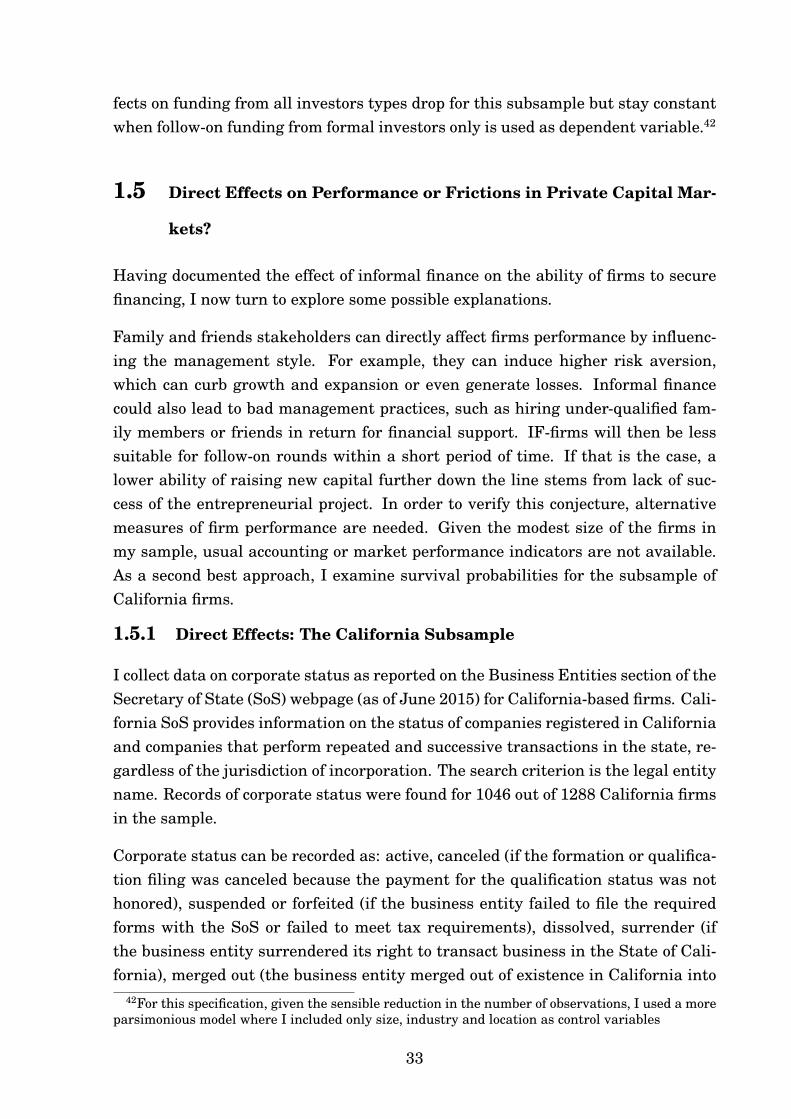
Having documented the effect of informal finance on the ability of firms to securefinancing, I now turn to explore some possible explanations.
Family and friends stakeholders can directly affect firms performance by influenc-ing the management style. For example, they can induce higher risk aversion,which can curb growth and expansion or even generate losses. Informal financecould also lead to bad management practices, such as hiring under-qualified fam-ily members or friends in return for financial support. IF-firms will then be lesssuitable for follow-on rounds within a short period of time. If that is the case, alower ability of raising new capital further down the line stems from lack of suc-cess of the entrepreneurial project. In order to verify this conjecture, alternativemeasures of firm performance are needed. Given the modest size of the firms inmy sample, usual accounting or market performance indicators are not available.As a second best approach, I examine survival probabilities for the subsample ofCalifornia firms.
1.5.1 Direct Effects: The California Subsample
I collect data on corporate status as reported on the Business Entities section of theSecretary of State (SoS) webpage (as of June 2015) for California-based firms. Cali-fornia SoS provides information on the status of companies registered in Californiaand companies that perform repeated and successive transactions in the state, re-gardless of the jurisdiction of incorporation. The search criterion is the legal entityname. Records of corporate status were found for 1046 out of 1288 California firmsin the sample.
Corporate status can be recorded as: active, canceled (if the formation or qualifica-tion filing was canceled because the payment for the qualification status was nothonored), suspended or forfeited (if the business entity failed to file the requiredforms with the SoS or failed to meet tax requirements), dissolved, surrender (ifthe business entity surrendered its right to transact business in the State of Cali-fornia), merged out (the business entity merged out of existence in California into
42For this specification, given the sensible reduction in the number of observations, I used a moreparsimonious model where I included only size, industry and location as control variables
33

another business entity), converted out (the business entity converted to anothertype of business entity or to the same type under a different jurisdiction as providedby statute), term expired (if the business entity’s term of existence has expired, asprovided by the entity’s Articles of Incorporation), inactive.43
Descriptive statistics are provided in Table 1.15. Not surprisingly, the technolog-ical sector dominates this subsample. IF-firms are more likely to operate in theservice industry and are smaller in terms of revenues size. The interesting factemerging from Table 1.15 is that the distributions of corporate status are identi-cal (differences are not statistically significant) for IF and NonIF firms. In otherwords, informal finance does not seem to affect survival probabilities. Moreover,among firms that did not raise further capital after the first offering, IF-firms aremarginally more likely to survive. This evidence is investigated more formally inwhat follows.
Define Y Si = 1 if firm i’s status is reported as active or merged out. I estimate
Pr[Y Si = 1
]= Pr [Ziγ + IFiδ + ui > 0] = Φ [Ziγ + IFiδ] (1.4)
where Zi ≡ [Xi, Yi] and ui is a random error. Thus, Zi includes all controls in (1.2)plus the financing event dummy Yi . Marginal effects of IF and Y are reportedin Table 1.16, together with marginal effects obtained by estimating (1.2) on theCalifornia sample.44
The effect of informal finance on the probability of future financing events confirmsthe general findings based on the analysis of the full sample and discussed in theprevious section. In model (1.4), follow-on financing events are associated withhigher probabilities of survival. There are several possible explanations behindthis result. Formal investors in follow-on rounds may be able to select successfulfirms or they may directly contribute to performance improvement with mentoringand guidance. Crucially, marginal effects of informal finance are positive but notsignificant. Hence, informal finance does not negatively affect performance (prox-ied by survival probabilities).
43See http://www.sos.ca.gov/business-programs/business-entities/cbs-field-status-definitions/44In unreported estimations, I use the same instrumental variable approach employed for deriv-
ing the main results in Section 4. Because of the sensible drop in the sample size I use a moreparsimonious model, where only size controls are included in the set of the exogenous covariates.Marginal effects of financing events on survival probabilities range between 12.7% (follow-on eventsconducted with formal investors only) and 13.3% (all follow-on events) and are statistically signif-icant at 1% confidence level. Marginal effects of informal finance on survival probabilities are notstatistically different from zero.
34

A consistent interpretation of these results suggests that late stage professionalinvestors are more inclined to provide capital to firms where family and friends offounders are not involved as stakeholders but the motivations behind such prefer-ence are not directly related to the quality of the entrepreneurial project.
1.5.2 Frictions in Private Capital Markets: the Fight for Control
An alternative explanation is related to the business model of the venture capitalindustry. Late stage, VC-type investors typically demand some degree of manage-rial control over the firms they finance. This praxis is generally grounded on thepremise that, once the start-up has successfully overcome its embryonic phase andthe business idea has been proven commercially viable, professional managementis needed in order to grow revenues and scale up operations. This often impliesdisplacing founders’ leadership, for example by replacing existing managers anddirectors with individuals chosen by the investors. In a 2008 article on the Har-vard Business Review, this is how Noam Wasserman describes his findings on theissue of founders control: “When I analyzed 212 American start-ups that sprangup in the late 1990s and early 2000s, I discovered that most founders surrenderedmanagement control long before their companies went public. By the time the ven-tures were three years old, 50% of founders were no longer the CEO; in year four,only 40% were still in the corner office; and fewer than 25% led their companies’initial public offerings”.45
Founders-entrepreneurs, who are often motivated by non pecuniary goals suchas decisional autonomy in the workplace (Hurst and Pugsley [2010], Hamilton[2000]), are likely to resist this transition process. In the article cited above,Wasserman continues: “Founders don’t let go easily, though. Four out of five en-trepreneurs, my research shows, are forced to step down from the CEO’s post. Mostare shocked when investors insist that they relinquish control, and they’re pushedout of office in ways they don’t like and well before they want to abdicate”.
The clash over managerial leadership can be costlier and more time consumingfor outside investors if existing shareholders/friends side with the founders. Suchsupport may be granted on the basis of altruistic preferences of informal funders. Aplausible conjecture follows: informal finance may discourage funding from formalinvestors because it makes it harder to impose control on funded firms.
To test this hypothesis, I examine changes in the management team for the sub-sample of firms that tap private capital markets at least 3 times (674 observations).
45https://hbr.org/2008/02/the-founders-dilemma
35

For all of these firms, I can observe the names of managers in office after the follow-on round. The majority of these companies (55%) operate in the technological in-dustry and are mostly located in California (24%), New York (11%), Massachusetts(8%) , Washington (6%) and Texas (5%). The proportion of founders in the man-agement team at the time of the third round of funding is higher for IF-firms. Themedian (mean) value for this proportion is 82% (71%) for IF-firms and 67% (63%)for NonIF-firms. Moreover, IF-firms are more likely to have founders controlledteams (proportion of founders>51%): 67% versus 59% for NonIF-firms, on average.At the time of the seed round, 846 founders had an executive officer role and, inline with Wasserman’s findings, only 46.2% of them retained this position afterthe follow-on round. I use this sample of founders-CEOs to estimate the effects ofinformal finance on the probability of founders retaining executive positions.
Define Ej,i = 1 if founder j of firm i still holds an executive position at the time ofthe third financing event. I estimate
prob [Ej,i = 1] = Φ [Aj,iθ + IFiϑ]
where Aj,i is a set of controls that includes industry, revenue size, location, numberof quarters between round 1 and round 3, founder’s ethnicity.46 Both the marginaleffect of the single equation probit and the coefficient of a linear probability modelare positive and significant, indicating that informal finance increases the proba-bility of executive-founders maintaining their roles by approximately 19% (Table1.17).
1.5.3 Alternative mechanisms
The evidence provided so far suggests that family and friends are the wrong in-
vestors for start-ups because, by helping founders retain control, they discourage
late stage outside investors.
A different but related motivation for my findings is that informal finance maydirectly affect demand for funds, by shifting founders’ preferences from venturecapital to alternative forms of funding. In other words, the “amenity potential” of
46In this subsample, given the substantial drop in the number of observations, the negative cor-relation between the instrument and recourse to informal finance is too weak to support an IVapproach. However, concerns on endogeneity are alleviated by the fact that all these firms areequally successful, as they access private capital markets at least three times in 3 years. Neverthe-less, the evidence provided here is also consistent with entrepreneurs with strong taste for controlchoosing informal finance at the time of the seed round.
36
control increases for entrepreneurs when family and friends are involved in theventure. In this case, some of the informally funded firms that did not receivefollow-on capital may have successfully financed expansion differently, for examplewith bank loans. This mechanism places the origin of the causal effect of informalfinance on a reshuffle of firms’ financing sources pecking order, but hinges on thesame argument based on control as the supply driven explanation proposed above.
Alternatively, professional investors may forgo investment opportunities in firmswith informal stakeholders because of potential constraints on exit options, such asIPOs or acquisitions. An IPO process can be suspended by the SEC if the issuer hasnot previously complied with the regulations concerning exemptions to securitieslaws (such as Regulation D). The length of the necessary checks and the probabil-ity of a breach can increase with the higher regulatory fulfillment requirementsassociated with offerings conducted with non accredited investors, increasing legalrisks for existing shareholders. If, instead of going pubic, the firm is acquired byanother company, the merged entity will have to disclose its financial statementsto non accredited shareholders. This can discourage acquisitions by non publiclytraded companies.
Whether regulations imposed to financial markets in order to protect unsophisti-cated investors can impose additional constraints to entrepreneurship, as the ar-gument above suggests, is an interesting and relevant question. However, becauseof lack of exit data, it cannot be addressed within this study.
1.6 Conclusions
Despite the strong interest that entrepreneurship and its role in economic growthattracts among the general public and policy makers, there is limited empiricalknowledge on small and young firms choices in terms of financing sources andwhat repercussions these may have on firms’ survival and success. This is mostlydue to lack of relevant and readily available databases. In this paper I contributeclosing this gap by examining whether recourse to family and friends financingduring the early stages of business investment affects firms ability to raise capitalin later rounds.
To answer this question empirically, I employ a novel dataset based on SEC fil-ings for securities offerings conducted by small and young firms raising capital inprivate markets. The information contained in these filings includes recourse tofunding from non-accredited investors, which I use as an indicator for informal
37

finance. Incidentally, the extensiveness of the collected dataset sheds new lighton a blind spot of entrepreneurial finance literature, namely the pre-VC phase ofstartups.
In order to address the issue of endogeneity of informal finance, I construct aninstrument based on founders’ surnames which is employed as a proxy for smallfamily size. A bivariate model is estimated, where the instrument is included inthe regression for the potentially endogenous variable. I find that informal financereduces the probability of future financing events in private capital markets by15% to 19% . These results suggest that, while informal finance can relax financialconstraints in early stages, it can impose additional restrictions on future access tocapital.
I provide arguments and formal tests for two possible mechanisms underlyingthe documented effects. Informal finance may cause a deterioration of the en-trepreneurial project, due to, for example, lower risk tolerance, and this ultimatelydecreases the probability of receiving funds from professional investors. Alterna-tively, the second mechanism proposed relies on a corporate governance argumentand on the VC industry business model. In particular, concerns over the abilityof gaining control, due to conflicting objectives between existing and prospectiveshareholders, can discourage professional investors. Evidence from subsamples ofthis dataset supports this last hypothesis while it is less consistent with the firstargument.
38

Table 1.1: Seed Round Summary Statistics: Industry
Frequency of first financing events (i.e. seed rounds) by Industry. The list of industry categories isprovided on Form D. The filing issuer chooses the one that best qualifies its business.
Industry Freq. %Agriculture 41 0.6%Airlines and Airports 4 0.1%Biotechnology 157 2.3%Business Services 178 2.6%Coal Mining 1 0.0%Commercial 497 7.4%Computers 160 2.4%Construction 32 0.5%Electric Utilities 23 0.3%Energy Conservation 31 0.5%Environmental Services 14 0.2%Health Insurance 3 0.0%Hospitals and Physicians 28 0.4%Lodging and Conventions 24 0.4%Manufacturing 238 3.5%Oil and Gas 411 6.1%Other 1,568 23.3%Other Energy 128 1.9%Other Health Care 413 6.1%Other Real Estate 344 5.1%Other Technology 1,627 24.2%Other Travel 14 0.2%Pharmaceuticals 56 0.8%Residential 321 4.8%Restaurants 183 2.7%Retailing 155 2.3%Telecommunications 53 0.8%Tourism and Travel Services 14 0.2%
Total 6,718 100.0%
39
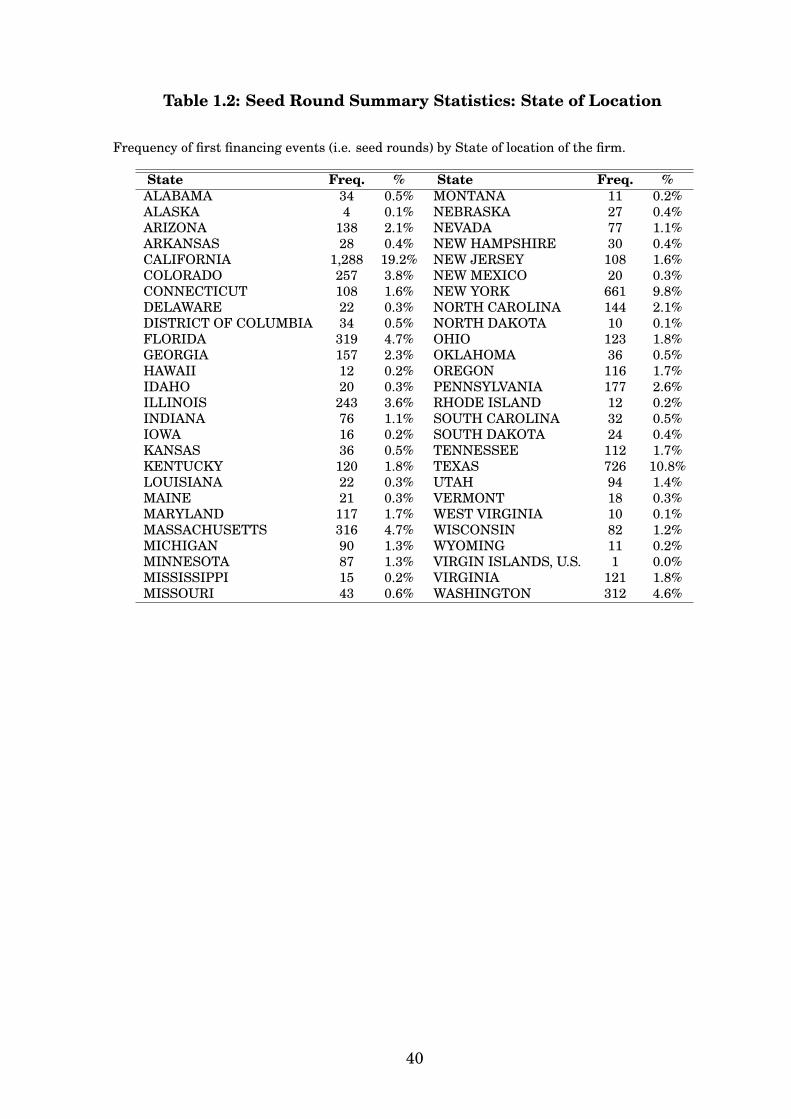
Table 1.2: Seed Round Summary Statistics: State of Location
Frequency of first financing events (i.e. seed rounds) by State of location of the firm.
State Freq. % State Freq. %ALABAMA 34 0.5% MONTANA 11 0.2%ALASKA 4 0.1% NEBRASKA 27 0.4%ARIZONA 138 2.1% NEVADA 77 1.1%ARKANSAS 28 0.4% NEW HAMPSHIRE 30 0.4%CALIFORNIA 1,288 19.2% NEW JERSEY 108 1.6%COLORADO 257 3.8% NEW MEXICO 20 0.3%CONNECTICUT 108 1.6% NEW YORK 661 9.8%DELAWARE 22 0.3% NORTH CAROLINA 144 2.1%DISTRICT OF COLUMBIA 34 0.5% NORTH DAKOTA 10 0.1%FLORIDA 319 4.7% OHIO 123 1.8%GEORGIA 157 2.3% OKLAHOMA 36 0.5%HAWAII 12 0.2% OREGON 116 1.7%IDAHO 20 0.3% PENNSYLVANIA 177 2.6%ILLINOIS 243 3.6% RHODE ISLAND 12 0.2%INDIANA 76 1.1% SOUTH CAROLINA 32 0.5%IOWA 16 0.2% SOUTH DAKOTA 24 0.4%KANSAS 36 0.5% TENNESSEE 112 1.7%KENTUCKY 120 1.8% TEXAS 726 10.8%LOUISIANA 22 0.3% UTAH 94 1.4%MAINE 21 0.3% VERMONT 18 0.3%MARYLAND 117 1.7% WEST VIRGINIA 10 0.1%MASSACHUSETTS 316 4.7% WISCONSIN 82 1.2%MICHIGAN 90 1.3% WYOMING 11 0.2%MINNESOTA 87 1.3% VIRGIN ISLANDS, U.S. 1 0.0%MISSISSIPPI 15 0.2% VIRGINIA 121 1.8%MISSOURI 43 0.6% WASHINGTON 312 4.6%
40
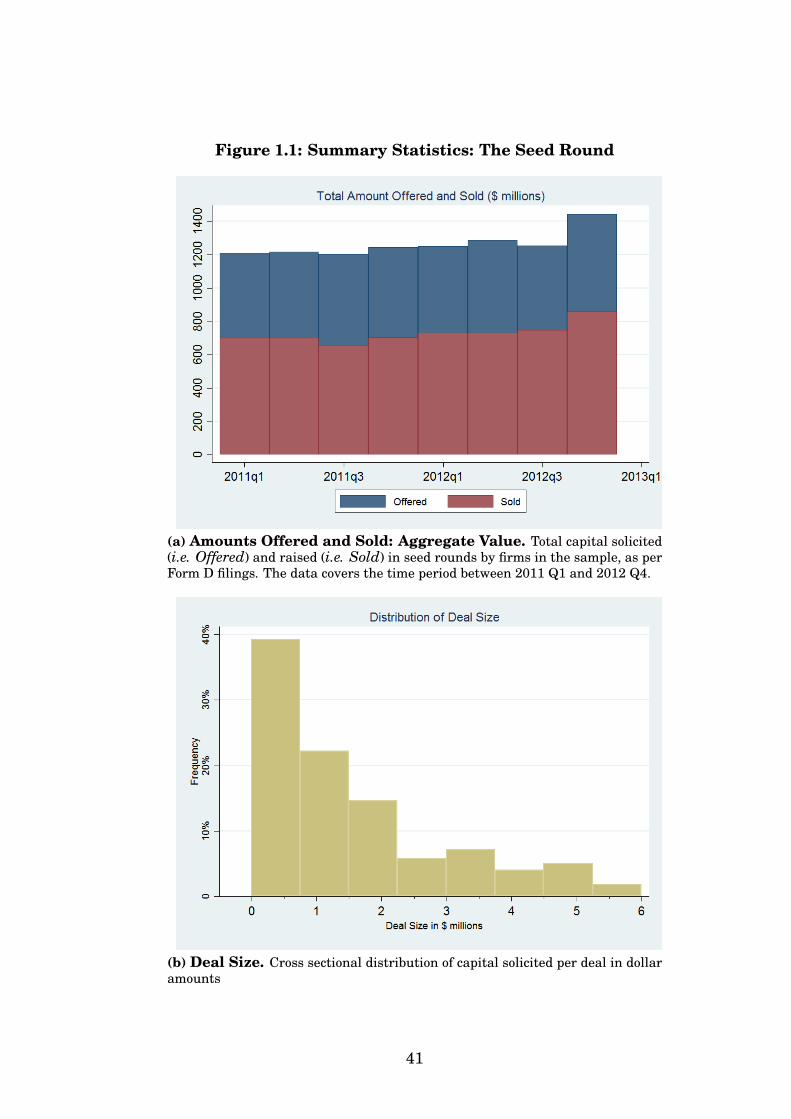
Figure 1.1: Summary Statistics: The Seed Round
(a) Amounts Offered and Sold: Aggregate Value. Total capital solicited(i.e. Offered) and raised (i.e. Sold) in seed rounds by firms in the sample, as perForm D filings. The data covers the time period between 2011 Q1 and 2012 Q4.
(b) Deal Size. Cross sectional distribution of capital solicited per deal in dollaramounts
41

Table 1.3: Seed Round Summary Statistics: Deal and Firm Characteristics
The table presents selected characteristics of the seed round and selected characteristics of thefirm at the time of the financing event. Security refers to the security (Debt, Equity or Other) orcombination of securities used. The category Other includes: option, warrant or other right toacquire another security, security to be acquired upon exercise of option, warrant or other rightto acquire security, tenant-in-common securities, mineral property securities, other securities
(unspecified). Intermediation is a dummy variable that takes value 1 if services of a registeredfinancial intermediary were employed during the offering
DEAL CHARACTERISTICS Frequency %SecurityDebt 319 4.7%Debt&Other 400 6.0%Equity 4,566 68.0%Equity&Debt 161 2.4%Equity&Debt&Other 116 1.7%Equity&Other 512 7.6%Other 644 9.6%
Year2011 3,297 49.1%2012 3,421 50.9%
Intermediation 290 4.3%
FIRM CHARACTERISTICSLegal Entity TypeBusiness Trust 8 0.1%Corporation 3,078 45.8%General Partnership 58 0.9%Limited Liability Company 2,985 44.4%Limited Partnership 445 6.6%Other 144 2.1%
Revenue Size$1 - $1,000,000 1,011 15.0%$1,000,001 - $5,000,000 263 3.9%Decline to Disclose 3,392 50.5%No Revenues 1,835 27.3%Not Applicable 217 3.2%
Year of Incorporation2009 433 6.4%2010 1,563 23.3%2011 2,940 43.8%2012 1,781 26.5%
42

Figure 1.2: Summary Statistics: The Seed Round. Investors and Founders
(a) Distribution of total number of investors per deal as reportedin Form D. The sample is restricted to filings that report the first securitysale as already occurred (5,510 observations)
(b) Distribution of number of founders per firm. The status offounder is assigned to individuals with managerial positions in the firm at thetime of its first round of funding.
43
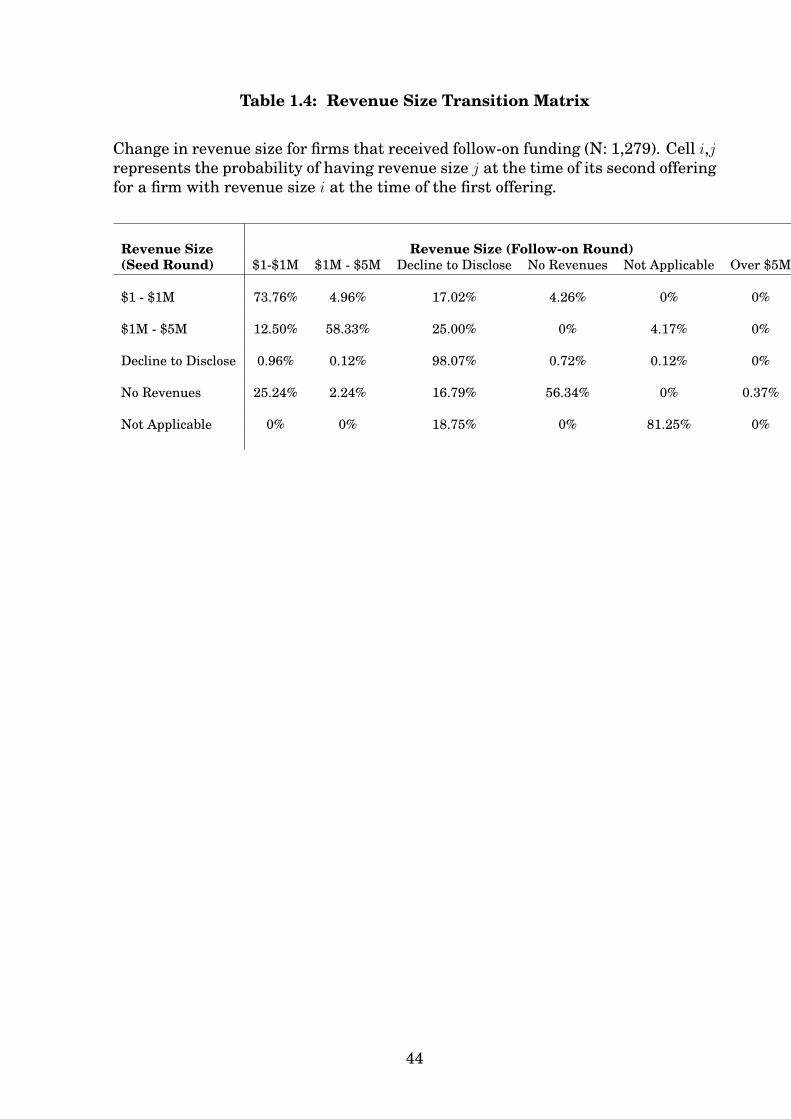
Table 1.4: Revenue Size Transition Matrix
Change in revenue size for firms that received follow-on funding (N: 1,279). Cell i,jrepresents the probability of having revenue size j at the time of its second offeringfor a firm with revenue size i at the time of the first offering.
Revenue Size Revenue Size (Follow-on Round)(Seed Round) $1-$1M $1M - $5M Decline to Disclose No Revenues Not Applicable Over $5M
$1 - $1M 73.76% 4.96% 17.02% 4.26% 0% 0%
$1M - $5M 12.50% 58.33% 25.00% 0% 4.17% 0%
Decline to Disclose 0.96% 0.12% 98.07% 0.72% 0.12% 0%
No Revenues 25.24% 2.24% 16.79% 56.34% 0% 0.37%
Not Applicable 0% 0% 18.75% 0% 81.25% 0%
44
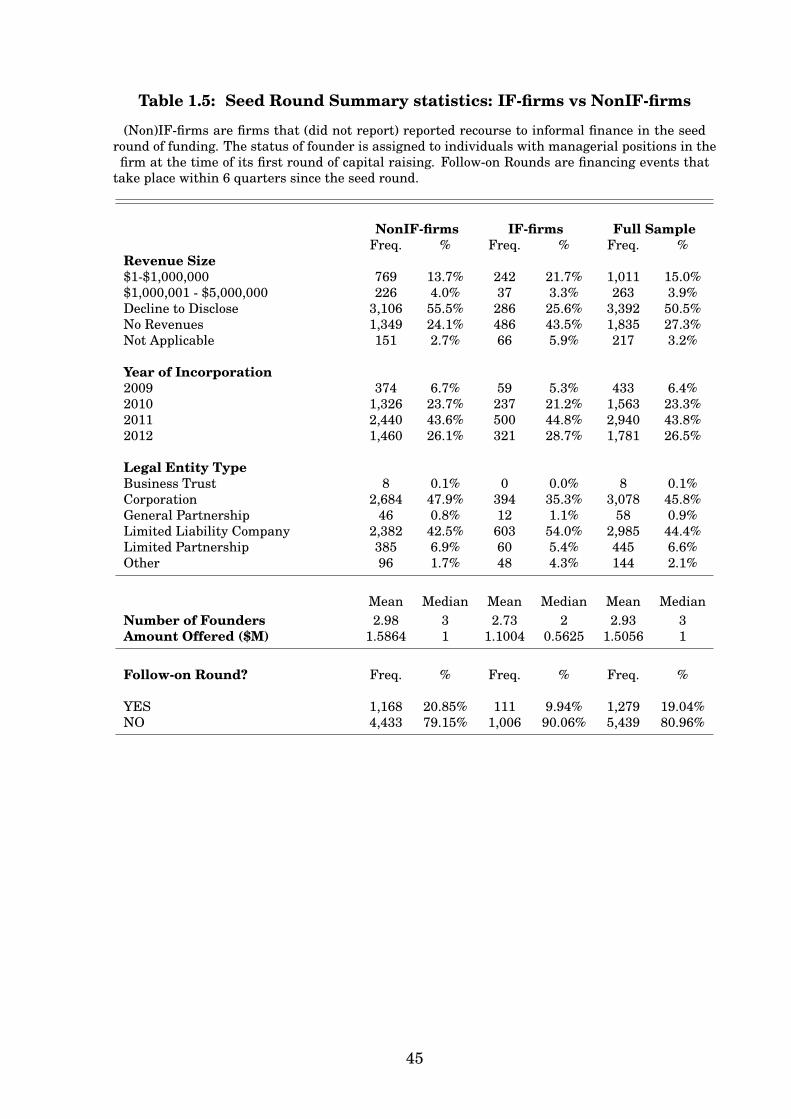
Table 1.5: Seed Round Summary statistics: IF-firms vs NonIF-firms
(Non)IF-firms are firms that (did not report) reported recourse to informal finance in the seedround of funding. The status of founder is assigned to individuals with managerial positions in thefirm at the time of its first round of capital raising. Follow-on Rounds are financing events that
take place within 6 quarters since the seed round.
NonIF-firms IF-firms Full SampleFreq. % Freq. % Freq. %
Revenue Size$1-$1,000,000 769 13.7% 242 21.7% 1,011 15.0%$1,000,001 - $5,000,000 226 4.0% 37 3.3% 263 3.9%Decline to Disclose 3,106 55.5% 286 25.6% 3,392 50.5%No Revenues 1,349 24.1% 486 43.5% 1,835 27.3%Not Applicable 151 2.7% 66 5.9% 217 3.2%
Year of Incorporation2009 374 6.7% 59 5.3% 433 6.4%2010 1,326 23.7% 237 21.2% 1,563 23.3%2011 2,440 43.6% 500 44.8% 2,940 43.8%2012 1,460 26.1% 321 28.7% 1,781 26.5%
Legal Entity TypeBusiness Trust 8 0.1% 0 0.0% 8 0.1%Corporation 2,684 47.9% 394 35.3% 3,078 45.8%General Partnership 46 0.8% 12 1.1% 58 0.9%Limited Liability Company 2,382 42.5% 603 54.0% 2,985 44.4%Limited Partnership 385 6.9% 60 5.4% 445 6.6%Other 96 1.7% 48 4.3% 144 2.1%
Mean Median Mean Median Mean MedianNumber of Founders 2.98 3 2.73 2 2.93 3Amount Offered ($M) 1.5864 1 1.1004 0.5625 1.5056 1
Follow-on Round? Freq. % Freq. % Freq. %
YES 1,168 20.85% 111 9.94% 1,279 19.04%NO 4,433 79.15% 1,006 90.06% 5,439 80.96%
45

Table 1.6: Ethnic/Linguistic Categories definition, founders’ team mixand follow-on funding
Panel A: Ethnic/Linguistic groups are identified as in Ambekar et al. (2009). The algorithm op-erates via a series of classifiers assigning name strings to subgroups at each level. Level 3 is onlydefined for West European and Greater Asian groups.
Level 1 Level 2 Level 3West European Italian
HispanicNordic
Greater FrenchEuropean German
East European East EuropeanBritish BritishJewish Jewish
Greater East AsianAsian East Asian Japanese
Indian Indian
African Muslim MuslimAfrican African
Panel B: Average ethnic mix of founders’ team for the full sample and for firms that accessfollow-on funding. On the left hand side I report average ethnic group representation in founders’teams. Standard error are in parenthesis. On the right hand side I report the proportion offirms that have more than 50% of Greater European origin founders (as by Level 1 classificationabove) and the proportion of firms where no ethnic group represents more than 50% of the founders.
Group (Level 2) Full Sample Follow-on Ethnic Majority Full Sample Follow-onAfrican 1.3% 1.3% European Majority 80.7% 81.2%
(0.0775) (0.0762)British 49% 50% No Ethnic Majority 14.1% 13.7%
(0.3701) (0.3495)East European 2.9% 3.3%
(0.1135) (0.1243)Greater East Asia 4.6% 4.6%
(0.1638) (0.1485)Indian Subcontinent 3.3% 4.4%
(0.1389) (0.1611)Jewish 18% 18%
(0.2794) (0.2644)Muslim 2.1% 2.7%
0.1084) (0.122)West European 15% 15%
(0.2657) (0.25)
46

Table 1.7: Small Family and Informal Finance
Estimates stem from a probit model (columns (1) and (2) ) and a linear probability model (column(3)) of informal finance IFi on the SmallFamily instrument Si and exogenous controls. IFi is adummy variable that takes value 1 when non-accredited investors are allowed to participate infirm i’ s seed round. Si is a dummy variable that takes value 1 when the proportion of foundersin firm i with rare last names is greater than the sample average. Controls are based on FIRM,SEED ROUND and FOUNDERS characteristics, which include, but are not limited to, the numberof firm’s founders (Team Size), dollar amount solicited in the seed round (Amount Offered) and theHot Deal dummy that takes value 1 if more than 80% of the amount offered was sold at the timeof the filing. An interaction term between year of incorporation and quarter of seed round is alsoincluded. Column (2) shows average marginal effects for the probit specification. Standard errorsin parentheses.
(1) (2) (3)Probit Probit LPM
Dependent Variable: IFi Coefficient AME Coefficient
Si -0.254*** -0.0503*** -0.0442**(0.0927) (0.0175) (0.0185)
FOUNDERS: Team Size 0.0168 0.00347 0.00373(0.0131) (0.00271) (0.00273)
SEED ROUND: Amount Offered -0.138*** -0.0286*** -0.0243***(0.0165) (0.00339) (0.00316)
SEED ROUND: Hot Deal -0.325*** -0.0666*** -0.0614***(0.0456) (0.00921) (0.00937)
Year of incorporation#Quarter of Issue Yes YesFIRM Yes YesFOUNDERS Yes YesSEED ROUND Yes Yes
Observations 6,718 6,718Log-Likelihood -2,476.01(Pseudo)R-squared 0.1773 0.155
Standard errors in parentheses*** p<0.01, ** p<0.05, * p<0.1
47

Table 1.8: Small Family and Growth
Panel A shows revenue size and size of the seed round deal for revenue disclosing firms with smallcombined family network (Si = 1) and for the rest of the sample (Si = 0). The instrument isassociated with smaller revenue size, but there is no significant difference in capital raised. InPanel B I focus on firms that secured follow-on funding (1,279 observations). Change in Deal Size iscomputed as amount offered in seed round divided by amount offered in follow-on round. Standarderrors in parentheses.
Panel A: Seed Round (Disclosed Revenues) Si = 0 Si = 1 DifferenceRevenue SizeNo Revenues 1,315 520
57.70% 62.65% -4.95%**(.0103) (.01679) (.0197)
$1-$1M 772 23933.87% 28.80% 5.1%***(.0099) (.0157) (.0186)
$1M-$5M 192 718.42% 8.55% -0.01%(.0058) (.0097) (.0113)
Amount Offered ($ Million)Mean 1.38 1.45 -0.074
(.0296) (.0495) (.0254)
Panel B: Follow-on vs Seed RoundChange in RevenuesYES 127 56
14.91% 13.11% 1.79%(.0122) (.0163) (.0204)
NO 852 42785.1% 86.9% -1.8%(.0122) (.01633) (.0204)
Change in Deal SizeMean 1.65 1.48 0.17
(.0633) (.0821) (.1063)Standard errors in parentheses*** p<0.01, ** p<0.05, * p<0.1
48

Figure 1.3: Founders: Year of First Employment.
Year of first employment as reported on online CVs for the subsample of founders matched withLinkedIn members (N: 4,422)
Table 1.9: Founders: Education
Highest education degree as reported on online CVs for the subsample of founders matched withLinkedIn members (N: 4,422)
Non Rare Surnames Rare SurnamesFreq. % Freq. %
Associate 34 0.9% 5 0.8%Bach. 1,070 28.1% 168 27.2%J.D. 127 3.3% 23 3.7%MBA 582 15.3% 88 14.2%MD 66 1.7% 11 1.8%Master 686 18.0% 120 19.4%No data 668 17.6% 104 16.8%Other 134 3.5% 25 4.0%PhD 248 6.5% 39 6.3%Private 189 5.0% 35 5.7%
Total 3804 618
Pearson χ2(9) = 2.5113 , Pr = 0.981
49
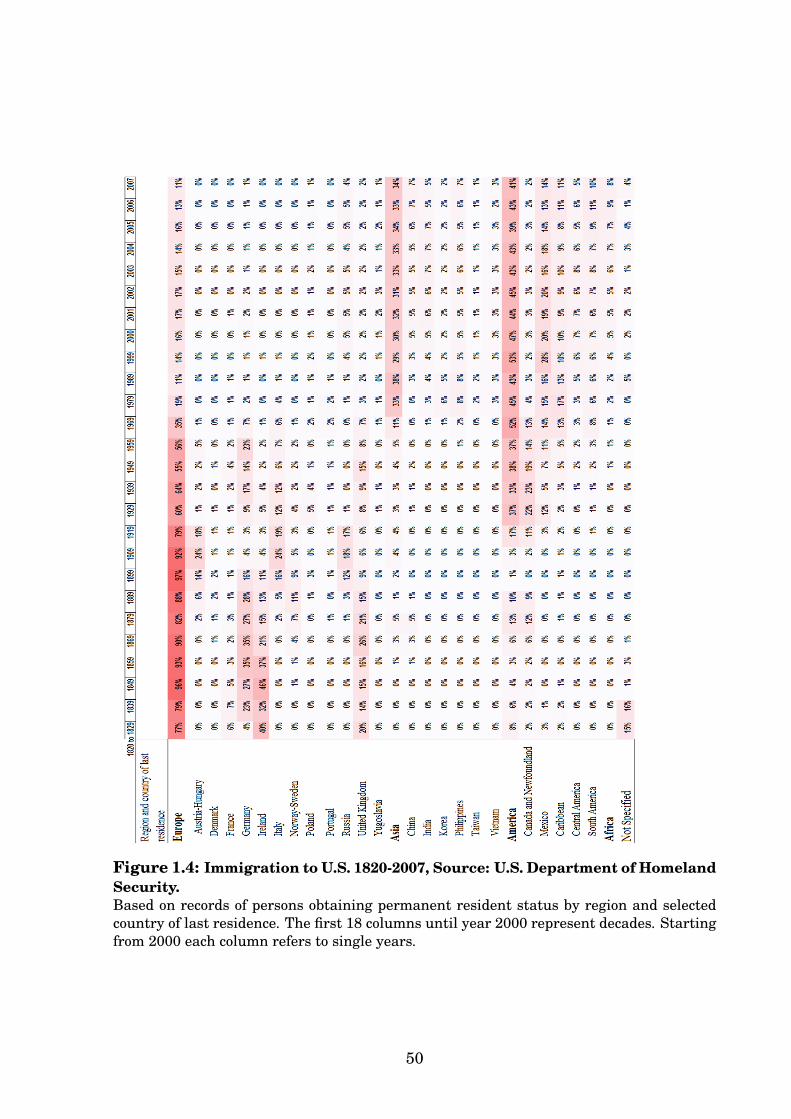
Figure 1.4: Immigration to U.S. 1820-2007, Source: U.S. Department of HomelandSecurity.Based on records of persons obtaining permanent resident status by region and selectedcountry of last residence. The first 18 columns until year 2000 represent decades. Startingfrom 2000 each column refers to single years.
50

Table 1.10: Ethnicity of Founders: Rare and Non Rare Surnames
Panel A: Level 2 ethnicity of founders with rare and non rare surnames. Total number of founders(excluding business entities): 18,716
Rare Surnames Non Rare SurnamesAfrican 4.93% 0.84%British 25.31% 55.6%East European 10.36% 2.15%Greater East Asian 3.74% 4.7%Indian Subcontinent 8.13% 2.43%Jewish 20.53% 18.58%Muslim 6.20% 1.41%West European 20.8% 14.29%
Panel B: Founders with first name included in the 1990 Census list of the 2,438 most commonfirst names are classified as American while other founders are classified as Early Generation
Rare Surnames Non Rare SurnamesAmerican Early Generation American Early Generation
Greater European 87.65% 45.33% 93.52% 67.66%Asian 6.12% 28.94% 4.84% 25.21%Greater African 6.23% 25.73% 1.64% 7.13%Observations 1,943 653 14,311 1,809
74.85% 25.15% 88.78% 11.22%
51

Table 1.11: Small Family and Future Financing Events
Estimates stem from a probit model (columns (1) and (2) ) and a linear probability model (column (3)) of probability offollow-on financing events Yi on the SmallFamily instrument Si and exogenous controls. Si is a dummy variable thattakes value 1 when the proportion of founders in firm i with rare last names is greater than the sample average. Controlsare based on FIRM, SEED ROUND and FOUNDERS characteristics, which include, but are not limited to, the number offirm’s founders (Team Size) and dollar amount solicited in the seed round (Amount Offered). An interaction term betweenyear of incorporation and quarter of seed round is also included. Column (2) shows average marginal effects for the probitspecification. Standard errors in parentheses.
Panel A. Yi: All Follow-on Financing Events(1) (2) (3)
Dependent Variable: Yi Probit AME LPM
Si 0.172** 0.0407** 0.0354*(0.0810) (0.0196) (0.0197)
FOUNDERS: Team Size 0.0320*** 0.00740*** 0.00898***(0.0120) (0.00276) (0.00291)
SEED ROUND: Amount Offered -0.0547*** -0.0126*** -0.0119***(0.0150) (0.00346) (0.00337)
Year of incorporation#Quarter of Issue Yes YesFIRM Yes YesFOUNDERS Yes YesSEED ROUND Yes Yes
Observations 6,718 6,718Log-Likelihood -2,756.57(Pseudo)R-squared 0.1514 0.137
Panel B. Yi: Follow-on Financing with Formal Investors Only(1) (2) (3)
Dependent Variable: Yi (Formal Only) Probit AME LPM
Si 0.182** 0.0409** 0.0355*(0.0828) (0.0191) (0.0191)
FOUNDERS: Team Size (Founders) 0.0333*** 0.00730*** 0.00878***(0.0122) (0.00268) (0.00283)
SEED ROUND: Amount Offered -0.0365** -0.00799** -0.00792**(0.0152) (0.00334) (0.00327)
Year of incorporation#Quarter of Issue Yes YesFIRM Yes YesFOUNDERS Yes YesSEED ROUND Yes Yes
Observations 6,718 6,718Log-Likelihood -2,621.56(Pseudo)R-squared 0.1556 0.134
Standard errors in parentheses*** p<0.01, ** p<0.05, * p<0.1
52

Table 1.12: Bivariate Probit Model: Full Sample
Estimates stem from a bivariate probit model (columns (1), (2), (5) and (6) ), a 2SLS (columns (3) and (7)) and a probit model (columns (4) and (8)) offollow-on financing on informal finance IFi. The dependent variable is an indicator function that takes value 1 if firm i receives follow-on funding within 6quarters since the seed round. IFi is a dummy variable that takes value 1 when non-accredited investors are allowed to participate in firm i’ s seed round.The SmallFamily instrument Si is employed in the biprobit and 2SLS models. Si is a dummy variable that takes value 1 when the proportion of foundersin firm i with rare last names is greater than the sample average. Controls are based on FIRM, SEED ROUND and FOUNDERS characteristics, whichinclude, but are not limited to, the number of firm’s founders (Team Size), dollar amount solicited in the seed round (Amount Offered) and the Hot Dealdummy that takes value 1 if more than 80% of the amount offered was sold at the time of the filing. An interaction term between year of incorporationand quarter of seed round is also included. Columns (2), (4), (6) and (8) show average marginal effects for the biprobit and probit specifications. Standarderrors in parentheses.
Dependent Variable: Follow-on (Both Investors Types) Follow-on with Formal Investors Only(1) (2) (3) (4) (5) (6) (7) (8)
BiProbit BiProbit 2SLS Probit BiProbit BiProbit 2SLS ProbitCoefficient AME Coefficient AME Coefficient AME Coefficient AME
IFi -0.7927*** -0.1476*** -0.1956*** -0.0709*** -1.3078*** -0.1903*** -0.2322*** -0.133***(0.3052) (0.046) (0.0698) (0.0121) (0.3258) (0.0336) 0.0674) (0.00965)
FOUNDERS: Team Size 0.0406*** 0.0094*** 0.011*** 0.00935*** 0.0417*** 0.0092*** 0.0108*** 0.00902***(0.0111) (0.0026) (0.0026) (0.00256) (0.0114) (0.0025) (0.0025) (0.00246)
SEED ROUND: Amt Offered -0.0703*** -0.0162*** -0.0166*** -0.0139*** -0.0591*** -0.013*** -0.0133*** -0.0103***(0.0164) (0.0039) (0.0038) (0.00347) (0.017) (0.004) (0.0037) (0.00331)
SEED ROUND: Hot Deal 0.0413 0.0096 0.007 0.0162* 0.0289 0.0064 0.0048 0.0133(0.0469) (0.0108) (0.0109) (0.00968) (0.0491) (0.0107) (0.0105) (0.0093)
Year of Inc.#Quarter of Issue Yes Yes Yes Yes Yes YesFIRM Yes Yes Yes Yes Yes YesFOUNDERS Yes Yes Yes Yes Yes YesSEED ROUND Yes Yes Yes Yes Yes Yes
Observations 6,717 6,718 6,718 6,718 6,718 6,718Log-Likelihood -5,219 -2,744.07 -5,039.6 -2,564.7R-squared 0.1237 0.1303
Standard errors in parentheses*** p<0.01, ** p<0.05, * p<0.1
53

Table 1.13: Bivariate Probit Model: Disclosed Revenues
The sample is restricted to revenue disclosing firms (3,326 observations). Estimates stem from a bivariate probit model (columns (1), (2), (5) and (6) ), a2SLS (columns (3) and (7)) and a probit model (columns (4) and (8)) of follow-on financing on informal finance IFi. The dependent variable is an indicatorfunction that takes value 1 if firm i receives follow-on funding within 6 quarters since the seed round. IFi is a dummy variable that takes value 1 whennon-accredited investors are allowed to participate in firm i’ s seed round. The SmallFamily instrument Si is employed in the biprobit and 2SLS models.Si is a dummy variable that takes value 1 when the proportion of founders in firm i with rare last names is greater than the sample average. Controlsare based on FIRM, SEED ROUND and FOUNDERS characteristics, which include, but are not limited to, the number of firm’s founders (Team Size),dollar amount solicited in the seed round (Amount Offered) and the Hot Deal dummy that takes value 1 if more than 80% of the amount offered was soldat the time of the filing. An interaction term between year of incorporation and quarter of seed round is also included. Columns (2), (4), (6) and (8) showaverage marginal effects for the biprobit and probit specifications. Standard errors in parentheses.
Dependent Variable: Follow-on (Both Investors Types) Follow-on with Formal Investors Only(1) (2) (3) (4) (5) (6) (7) (8)
BiProbit BiProbit 2SLS Probit BiProbit BiProbit 2SLS ProbitCoefficient AME Coefficient AME Coefficient AME Coefficient AME
IFi -0.5702 -0.0877 -0.1722** -0.0535*** -1.2098*** -0.1406*** -0.2179*** -0.0984***(0.4172) (0.0579) (0.0803) (0.0124) (0.4457) (0.0471) (0.0754) (0.0102)
FOUNDERS: Team Size 0.0504*** 0.0088*** 0.0119*** 0.00896** 0.06*** 0.0096*** 0.0127*** 0.00956***(0.0196) (0.0034) (0.0036) (0.00348) (0.0206) (0.0033) (0.0034) (0.00324)
SEED ROUND: Amt Offered -0.0367 -0.0064 -0.00514 -0.01** -0.0163 -0.0026 -0.0059 -0.00027(0.0287) (0.0051) (0.005) (0.00454) (0.031) (0.0051) (0.0048) (0.00423)
SEED ROUND: Hot Deal 0.0732 0.0129 0.0085 0.0185 0.0212 0.0034 0.0021 0.0125(0.0885) (0.0154) (0.0162) (0.0127) (0.0985) (0.0156) (0.0152) (0.012)
Year of Inc.#Quarter of Issue Yes Yes Yes Yes Yes YesFIRM Yes Yes Yes Yes Yes YesFOUNDERS Yes Yes Yes Yes Yes YesSEED ROUND Yes Yes Yes Yes Yes Yes
Observations 3,326 3,326 3,326 3,326 3,326 3,326Log-Likelihood -2,622.6 -1,049.08 -2,495.1 -921.93R-squared 0.1335 0.1363
Standard errors in parentheses*** p<0.01, ** p<0.05, * p<0.1
54

Table 1.14: Marginal Effect of Informal Finance on the Probability of Future Financing Events
Marginal effects of informal finance on follow-on financing events conducted with all investors types (row 1) ) and with formal investors only (row 2) ).Estimates stem from a bivariate probit model under different specifications. In section A) the model includes only Size controls (revenue size, legal entitytype and amount offered in the seed round) -column (2)- or size, location and industry controls -column (3). In section B), Instead of using the proportionof people belonging to each ethnic/linguistic group for each firm, the full model includes either a dummy variable that takes value 1 if the majority of thefounders have European descent - column (4)- or a dummy variable that takes value 1 if no ethnic group represents more than 50% of the founders team-column (5). In sections C) and D) I estimate the full model restricting the sample to firms where the majority of founders have European descent and toHot Deals. Standard errors are in parentheses.
FullModel
(1) (2) (3) (4) (5) (6) (7)
1) Yi: Both Investors Types -.1476*** -.164*** -.1582*** -.1582*** -.1543*** -.1541** -.1416(0.046) (0.0503) (0.0476) (0.0445) (0.0454) (0.07) (0.0874)
2) Yi: Formal Only -.19*** -.1919*** -.2*** -.202*** -.1983*** -.1722*** -.1984***(0.0336) (0.0421) (0.0343) (0.0338) (0.0344) (0.063) (0.0573)
A) CONTROLSSizeIndustry and Location
B) ETHNICITYEuropean Descent(>50%)No Ethnic Majority
C)European Descent(>50%) ONLY
D)Hot Deals ONLY
Observations 6,718 6,718 6,718 6,718 6,718 5,421 3,168Log-Likelihood (Both Investors Types) -5,219 -5,520.46 -5,351.82 -5,252.32 -5,254.05 -4,527.06 -2,383.31Log-Likelihood (Accredited Only) -5,039.58 -5,329.39 -5,170.02 -5,074.14 -5,076.31 -4,366.9 -2,313.34
55

Table 1.15: The California Subsample: Descriptive statistics and BusinessEntity Status (as of June 2015)
The table shows descriptive statistics and distributions by Entity Status (as of June 2015) forinformally funded (IF ) and non informally funded (NonIF ) firms operating in California andmatched with records from the California the Secretary of State (SoS) webpage. For the pur-pose of this table sectors are redefined as follows: Tech= Biotechnology,Computers,Other Tech-nology,Telecommunications; Energy= Coal Mining,Energy Conservation,Oil and Gas,Other En-ergy; Health=Health Insurance, Hospitals and Physicians,Other Health Care, Pharmaceuticals;RE=Construction,Lodging and Conventions,Residential, Other RE; Service=Environmental Ser-vices,Restaurants,Tourism and Travel Services,Business Services.
NonIF-firms IF-firmsDescriptive StatisticsSectorHealth 6.2% 1.2%Manufacturing 2.6% 3.1%Other Sector 32.2% 36.4%RE 7.6% 8.6%Service 5.9% 17.9%Energy 2.0% 1.2%Tech 43.4% 31.5%Revenue Size$1 - $1,000,000 14.2% 27.0%$1,000,001 - $5,000,000 2.6% 2.9%Decline to Disclose 61.5% 24.8%No Revenues 20.5% 43.8%Not Applicable 1.2% 1.5%
Statusactive 70.8% 71.5%canceled 5.9% 7.3%converted out 0.6% 1.5%dissolved 3.0% 2.2%forfaited/suspended 11.6% 13.1%merged out 0.7% 0.7%surrender 7.5% 3.6%
Total 909 137Distributions by Status: Pearson χ2
(6) = 4.8603 Prob = 0.562
56

Table 1.16: Survival vs Follow-on Financing Probability
Marginal effects of informal finance (IFi) on follow-on financing (Yi) and survival (Y Si ) and of Yi on
Y Si in the following two models: Prob[Yi = 1] = Φ[Xiβ + IFiλ] (Columns 1 and 3) and Prob[Y S
i =1] = Φ[Xiβ + Yiζ + IFiλ] (Columns 2 and 4). Y S
i = 1 if firm i is active/merged out.
Yi = Financing Event, All Investors Types Yi = Financing Event, Accredited Only(1) (2) (3) (4)Yi Y S
i Yi Y Si
IFi -0.066* 0.05 -0.156*** 0.06(0.0385) (0.04) (0.0295) (0.0393)
Yi 0.125*** 0.133***(0.0307) (0.0311)
Log-Likelihood -468.24 -563.43 -434.85 -562.91Observations 1,046 1,046 1,046 1,046
Table 1.17: Informal Finance and Control
Coefficient estimates (column (1)) and average marginal effects (column (2)) of informal finance(IFi) and Time from the probit model Prob[Ei,j = 1] = Φ[Ai,jθ + IFiϑ] where Ei,j = 1 if founder jof firm i still holds an executive position at the time of the third financing event and Ai,j is a setof controls that includes industry, revenue size, location, number of quarters between round 1 andround 3 (time) and founder’s ethnicity. Coefficients from a linear probability model in column (3).
(1) (2) (3)Probit AME LPM
IF 0.541** 0.197** 0.191**(0.2504) (0.0862) (0.0946)
Time -0.05*** -0.0183*** -0.0185***(0.0166) (0.006) (0.0063)
Log likelihood -533.89Observations 846 846R-squared 0.1054
Standard errors in parentheses*** p<0.01, ** p<0.05, * p<0.1
57

Chapter 2
Private Capital Markets and
Entrepreneurial Debt: Evidence
from Unregistered Securities
Offerings
2.1 Introduction
Despite the strong interest that entrepreneurship and its role in economic growth
attracts among the general public and policy makers, there is limited empirical
knowledge on the availability and use of different sources of funding for entrepreneurial
firms, in particular with regard to non-bank private capital, such as funds pro-
vided by family and friends, angel investors or venture capital firms. This is due to
the fragmentation of information sources commonly available, which mostly rely
on surveys (Kerr et al. [2014]), self reporting investors’ documentation or firms’
IPO filings (Kaplan and Strömberg [2003], Tian [2011]). The current picture of en-
trepreneurial finance therefore may be incomplete and possibly subject to sampling
and survivorship bias issues. In this paper we provide a unified empirical frame-
58

work that encompasses and characterizes all stages of entrepeneurial finance, from
family and friends funding to late venture capital rounds. We describe the use of
private capital by U.S. non listed firms between March 2009 and October 2014. Our
contribution resides in the broader evidence provided on the cross section of firms
that resort to entrepreneurial finance, since all industries, locations and funding
stages are represented, and on the deeper time series dimension of staged invest-
ment, as we follow start-ups’ financing events over time.
More importantly, we investigate firms’ choices in terms of financial contracts and
document the use of non-bank private debt in entrepreneurial finance. Contrary to
the common view, debt contracts are often used by start-ups for funding, although
equity is the dominant source of capital. Moreover we show that, as corporate fi-
nance theory would predict, later stage funding is more likely to be conducted with
debt as compared to early stage funding rounds. We provide suggestive evidence
that the reason for this difference stems from cash flow uncertainty and unpre-
dictability rather than lack of collateral.1
Because of market and regulatory frictions, entrepreneurial firms have limited
funding sources available. While the costs of issuing publicly traded securities
make this funding channel unaccessible for most start-ups, raising external capi-
tal outside of public markets, i.e. issuing unregistered securities, is typically con-
strained by law to protect investors from frauds. In order to overcome such restric-
tions and facilitate capital raising for small and young businesses, Regulation D
was introduced in the U.S. in the early 80s as an exemption to Securities Laws, ef-
fectively providing entrepreneurial finance and the venture capital industry with
a simplified legal framework. Regulation D allows companies to place securities
in private markets, provided that the offering meets certain requirements, such as
the ban on general solicitation. We use a novel dataset (Zaccaria [2015]) based on
SEC filings for private placements of unregistered securities (Form Ds) conducted
under Regulation D. Each Form D corresponds to a financing event in which a1For a review of theories on small firms’ capital structure see Chittenden et al. [1996]
59

firm raises funds in private markets and includes information on the firm (such as
location, age, industry) and on the offering (such as amount and type of security
sold). Machine readible data are available starting from 2009 when online filing
was made mandatory. We collect 58,059 Form D filings for over 39,000 firms that
started raising private capital in March 2009 or later. Examples of firms in our
dataset include well-known companies such as Uber and Airbnb, but our records
mostly comprise of ventures that operate in multiple sectors, including non-tech
sectors like manufacturing or retailing, and that, after raising funds, did not reach
the IPO stage or went out of business. As our data show, a very small proportion
of start-ups (2%) files for public listing of their securities after raising private capi-
tal and almost half of these firms operate in technology, biotech or pharmaceutical
industries, as compared to 34% in the full sample. The limelight that public offer-
ings grant to companies may help explain why, despite a more diverse initial dis-
tribution of start-ups in terms of industries, it is common to define entrepreneurial
finance as a predominantly “tech” phenomenon.
Another similarly widespread belief is that entrepreneurial funds are provided in
the form of equity capital, or, in other words, that entrepreneurial finance fills the
“equity gap”. In this paper, we show that, contrary to this view, private non-bank
debt capital is not uncommon among start-ups. In our dataset, 19% of the offer-
ings are conducted with debt alone or in combination with other securities. We
explore variation in the use of private debt through the financial growth cycle as
firms move from early to late stage funding. As Berger and Udell [1998] illustrate,
young and very small firms seek early stage outside funding with family, friends
and angel investors and subsequently approach institutional investors such as VC
firms to finance growth. Along this financing path, both firms’ size and age and in-
vestors’ funds and sophistication progress, potentially affecting both demand and
supply of credit at different stages. Using firm and offering information contained
in Form D, we define early stage funding as financing events where young firms (i.e.
less than 2 years old) raise small amounts of private capital, and split our dataset
60

accordingly in early and late stage financing events. We find that young firms are
significantly less likely to use private loans. Use of debt is negatively correlated
with uncertainty over future cash flows and presence on informal investors among
the buyers of offered securities. Interestingly, within early stage funding, availabil-
ity of collateral does not play a role in explaining variation in use of debt contracts.
This holds true when we use measures of business assets collateral such as the
industry long term tangible to total assets ratio and when we look at availability
of personal assets collateral, proxied by MSA level elasticity of house supply (Saiz
[2010]). The idea behind the latter measure is that in geographical areas where
house supply is more elastic, house prices are less sensitive to local demand shocks
and therefore real estate property is more suitable for being posted as collateral for
loans.
In this study we present new evidence on entrepreneurial finance in its initial
phases, thus connecting and complementing existing literature on entrepreneur-
ship on one side (Evans and Jovanovic [1989], Hurst and Lusardi [2004]) and on
venture capital (Da Rin et al. [2011]) on the other side. Robb and Robinson [2012]
show that non-bank external capital, i.e. entrepreneurial finance, is not commonly
used by newly established firms. Only 4% of the new firms in the Kauffman Firm
Survey (KFS) database access this form of funding during the first year of opera-
tions. Firms that use “outsider equity”, however, look very different from the rest
of the KFS sample. In particular the size of their financial assets is between 5 and
20 times larger, which suggests larger early stage investments and more aggres-
sive business plans, or simply that these firms operate in sectors where fast growth
is essential for success. This is not surprising: evidence on the more “mature” in-
vestment stage of the entrepreneurial finance spectrum shows that VC funding
is usually provided to firms with high growth ambitions and innovative business
models, which are more likely to be “transformational” rather than “substistence”
ventures (Schoar [2010]). We know however that VC funded firms often embark
in the private capital raising process well before the VC phase, raising funds with
61

family and friends, angels, seed-firms, incubators, peer to peer lenders. In Robb
and Robinson [2012], non-VC (early stage) capital is used by more than 87% of
firms that rely on outsider equity. Little is known about the “dawn” of these high-
growth, transformational start-ups, despite the fact that these are the biggest po-
tential contributors to employment and innovation. We provide novel evidence on
characteristics, financing choices and funding history of these firms, which can
constitute the basis for future empirical work.
The remainder of the chapter is organized as follows. Section 2 describes the data .
Section 3 focuses on use of private debt and its determinants. Section 4 concludes.
2.2 Entrepreneurial Finance, Regulation D and Private Capital Mar-
kets
Entrepreneurial finance can be widely defined as the process of allocating finan-
cial resources for new ventures. Compared to listed or long established companies,
start-ups undoubtedly have a limited range of funding source. Raising capital with
a public offering is usually not a viable financing option for small businesses be-
cause of the costs involved in the registration procedure and the degree of infor-
mation disclosure required by regulatory authorities. In the absence of a public
market for their financial claims, new ventures must raise funds for projects from
investors in private capital markets. Sale of securities outside supervised markets,
however, is typically restricted by law in order to protect investors from frauds.
In the United States, the legal framework in which entrepreneurial finance oper-
ates is defined by Regulation D, the private placement exemption to the Securities
Laws (1933, 1934) that was enacted in 1982 to facilitate capital raising for small
businesses.2 Under certain restrictions, such as the ban on public advertisment2Other exemptions exist, such as the ones offered in Section 4(a)(2), but are claimed with far less
62

of the offerings, Regulation D allows firms to raise funds by issuing unregistered
securities that are exempt from authorization and periodic disclosure requireme
nts. Securities can take any contractual form, such as pure debt, preferred stocks
or convertible notes. As in Ivanov and Bauguess [2013], we refer to the collections
of financing events conducted in compliance with Regulation D as private capi-
tal markets.3 When making their investments, founders’ family and friends, angel
investors, venture capital (VC) and private equity firms effectively purchase unreg-
istered securities in private capital markets. Thus, private capital markets include
all stages of entrepreneurial finance as defined by the industry and the academic
literature, from seed funding to the latest rounds of capital raising before an IPO.
Regulation D requires firms that sell securities in a private placement to file a
notification form (Form D) with the SEC, providing information on the firm (in-
cluding location, industry and name of directors) and on the offering (including
security used and dollar amount offered and sold) . Online filing was made manda-
tory since March 2009. In order to explore and characterize the full spectrum of
entrepreneurial finance we collect and process Form Ds for private non-financial
firms that started raising private capital after March 2009 (see Zaccaria [2015]).
Our dataset consists of 58,059 private placements, conducted by 39,230 firms be-
fore October 2014. In what follows, we present some descriptive statistics and
stylized facts on our private capital markets sample.
Figure 2.1 shows number of deals and total amount sold for each calendar year cov-
ered by our dataset. The majority of the deals are first rounds, namely financing
events of firms that tap private capital markets for the first time since incorpora-
tion. Most offerings are conducted by young firms (less than 3 years from incorpo-
ration) with less than 4 different investors (Table 2.1). Figure 2.2 shows the time
series for median and mean round size. With a mean value that exceeds that of the
median by a factor of 7 on average, the skewness of the round size distribution sig-
frequency, as showed by Ivanov and Bauguess [2013]3Regulation D also applies to listed firms’ private placements and investment funds’ sale of
shares. We exclude these financing events from our analysis.
63
nals that a large portion of the dataset comprises small deals, where firms raised
less than 1$ million . Unsurprisingly, Technology (27%), Energy and Utilities (9%),
Health Care (9%), and BioTech&Pharma (7%) dominate the industry breakdown,
but also the Commercial (7%), Real Estate (7%), Manufacturing (4%) and Services
sectors are represented (Table 2.2).
A key feature of Regulation D is the ban on general solicitation, i.e. firms cannot
freely advertise the offering via, for example, a website or a fund raising event.
During the observation period and until March 2015, U.S. legislation did not allow
for crowdfunding at the federal level, since sales of financial claims to the general
public on internet-based matching platforms were in violation of Securities Laws.4
In 2012 however, a new chapter of Regulation D, Rule 506(c), was introduced that
allows for general solicitation provided that all investors are accredited, namely
either financial institutions or high net worth individuals.5 Our data show that
Rule 506(c) was not popular: only 4% of the financing events after 2012 were con-
ducted under this exemption.6 Since the vast majority of the offerings, both before
and after the reform, were conducted with accredited investors only, it is possible
that lack of success of this new form of restricted crowdfunding is partly due to
the disclosure of information that advertising inevitably involves.7 Firms with in-
novative business models may be reluctant to publicly disclose their business plan4There is no violation of the Securities Laws if claims are sold with an in-kind repayment
promise, as these claims do not qualify as securities. This is the case for famous crowdfundingplatforms such as Kickstarter or Indiegogo. Federal laws on crowdfunding that allow for public saleof securities with no restrictions on the sophistication of the investors have been introduced by theJOBS Act (2012) and enacted by the SEC with the so called Regulation A+ in March 2015.
5 Individuals with an annual income greater than 200,000$ or net worth above 1$ milion qualifyas accredited.
6The most commonly used chapter of Regulation D is Rule 506(b), which, together with the banon general solicitation, imposes limits to non-accredited investors’ participation. This limit is setto 35 per offering but it does not appear to be binding in practice for our sample as more than 90%of the completed offerings are conducted with less than 20 investors in total. Private offerings inexemption of securities laws can be conducted also under Rule 504, Rule 505 and, since the endof year 2012, Rule 506(c). Rules 504 and 505 are applicable to smaller issuances ($1 million or$5 million) and, under certain circumstances, they relax constraints on non-accred ited investorsparticipation . However, only Rule 506(b) exempts from Blue Sky law registration. This seems tobe the reason why Rule 506(b) is used for almost the totality of the private placements. See Ivanovand Bauguess [2013]
7Another potential explanation is related to the fact that under Rule 506(c) the burden of theproof of investors’ accredited status is born by the issuer instead of the investors themselves.
64

and may prefer to illustrate the details of the venture privately only to interested
investors. Table 2.3 supports this interpretation and shows that the new restricted
crowdfunding option was less common among highly innovative industries, such as
technology and biotech.8
US based firms conducted 54,249 offerings in our dataset and the majority of them
(85%) are located in metropolitan areas (MSAs). About half of the financing events
takes place in only 10 of the 327 MSAs in our sample, with the Silicon Valley host-
ing 13% of the recorded deals (Table 2.4).9 Foreign located firms represent 7% of
the whole dataset. Geographic proximity and strong cultural ties seem to drive for-
eign participation in US private capital markets. Foreign firms are mostly located
in Canada (78%) followed by UK (5%), Australia (3%), Cayman Islands (2%), Israel
(2%) and Mexico (1%). Interestingly, only 3% of the offerings conducted by foreign
firms are located in continental Europe, despite the fact that this economic area
is substantially larger in terms of population and GDP as compared to the first 6
countries in Panel B of Table 2.4 combined.
Since IPOs are common exit options for investors, in an attempt to provide a mea-
sure of success for companies in our dataset we collect information on whether
firms filed form S-1, the SEC filing used to register securities by companies that
plan to go public. As of March 2016, only 2,5% of the offerings in our dataset
were conducted by firms that subsequently filed for public listing of their securi-
ties. Public listings are more common among BioTech&Pharma firms (26%) and
firms located in the Silicon Valley (18%) (see Table 2.5 and 2.6).
Tangent to this private capital markets overview, the question arises of the extent
to which firms actually comply with the Form D filing requirement. Although fail-
ing to file the form D does not result in the loss of the federal registration exemp-
tion, the SEC can seek to have the issuer enjoined from future use of Regulation8This evidence highlights the possible limitations of crowdfunding in supporting and promoting
business innovation.9We indicate as Silicon Valley the combined MSAs of San Francisco-Oakland-Fremont and San
Jose-Sunnyvale-Santa Clara.
65
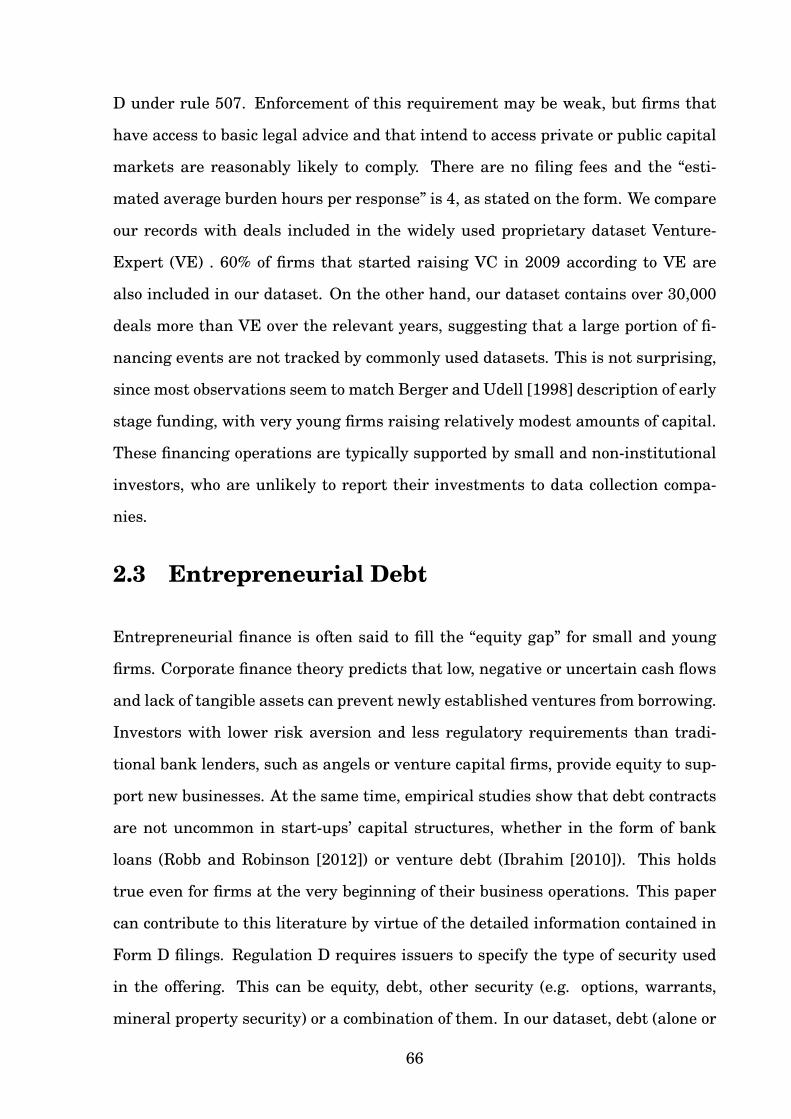
D under rule 507. Enforcement of this requirement may be weak, but firms that
have access to basic legal advice and that intend to access private or public capital
markets are reasonably likely to comply. There are no filing fees and the “esti-
mated average burden hours per response” is 4, as stated on the form. We compare
our records with deals included in the widely used proprietary dataset Venture-
Expert (VE) . 60% of firms that started raising VC in 2009 according to VE are
also included in our dataset. On the other hand, our dataset contains over 30,000
deals more than VE over the relevant years, suggesting that a large portion of fi-
nancing events are not tracked by commonly used datasets. This is not surprising,
since most observations seem to match Berger and Udell [1998] description of early
stage funding, with very young firms raising relatively modest amounts of capital.
These financing operations are typically supported by small and non-institutional
investors, who are unlikely to report their investments to data collection compa-
nies.
2.3 Entrepreneurial Debt
Entrepreneurial finance is often said to fill the “equity gap” for small and young
firms. Corporate finance theory predicts that low, negative or uncertain cash flows
and lack of tangible assets can prevent newly established ventures from borrowing.
Investors with lower risk aversion and less regulatory requirements than tradi-
tional bank lenders, such as angels or venture capital firms, provide equity to sup-
port new businesses. At the same time, empirical studies show that debt contracts
are not uncommon in start-ups’ capital structures, whether in the form of bank
loans (Robb and Robinson [2012]) or venture debt (Ibrahim [2010]). This holds
true even for firms at the very beginning of their business operations. This paper
can contribute to this literature by virtue of the detailed information contained in
Form D filings. Regulation D requires issuers to specify the type of security used
in the offering. This can be equity, debt, other security (e.g. options, warrants,
mineral property security) or a combination of them. In our dataset, debt (alone or
66

in combination with other securities) is used in 19% of the total private placement
deals, with this proportion oscillating between a maximum of 22% in 2009 and a
minimum of 17% in 2011.
In order to investigate heterogeneity in financing contracts among start-ups we
further characterize financing events as early and late stage rounds. In doing so,
we also provide novel evidence on the least explored side of entrepreneurial finance
spectrum, namely the pre-VC stage.
2.3.1 Early vs Late Stage
Start-ups early stage funding phase usually involves family and friends, angels,
seed firms or peer to peer lenders as investors and very young, small firms issuing
securities. Lacking any conventional definition and in the absence of information
on the exact identity of investors in our data, we identify early stage rounds as
private placements conducted by firms that are less than 2 years old and that
aim at raising less than $6M. The first criterion is intuitive. The second is based
on industry reports on the average size of a VC Series A funding round and it is
meant to rid the early stage group from deals conducted by firms that, although
young, already reached a mature stage at the time of the financing event.10 This
can happen for example with firms that originated from spin-offs of established
businesses or that undergo extremely fast growth right after incorporation. There
is a considerable overlap between the group identified with the first criterion and
the one identified with first and second : 48% of the total deals satisfy the age
requirement and 42% satisfy both age and round size rules. Of course, our criteria
merely attempt to draw quantitative boundaries around a finance concept, that of
early stage funding, which is itself hard to define numerically. Seed capital is the
amount of money needed to start off a business, but ventures’ investment schedules
are very firm, industry and time specific.10Average Series A VC deal size was $6.2 milion, $6.5 milion and $8.6milion in years 2012, 2013
and in the first three quarters of 2014 respectively, according to Prequin Venture Capital Dealsreport October 2014.
67

We split the dataset according to our definition into early and late stage financing
events. Only 13% of deals in the VE dataset match financing events classified as
early stage in this paper. Therefore our records include a vast sample of pre-VC
funding rounds we only had a glimpse at so far via survey data ( see for exam-
ple Kerr et al. [2014] or Lerner et al. [2015]). Tables 2.7 and 2.8 juxtapose early
and late stage financing events along various dimensions. Early stage rounds are
smaller, conducted with less investors and more likely subscribed by family and
friends of the firms’ founders.11
Firms raising early stage capital have smaller revenues and fewer board members
and are more likely to operate in commercial, services and real estate industries.
Figures 2.3a and 2.3b present the time series of median round size by sector and
funding stage. The amount of capital raised varies considerably across sectors
both in early and late stage deals (biotech&pharma offerings, for example, are
consistently larger than health care or energy offerings) but no pronounced trends
are detectable within sectors over time.
Seed capital is often seen as the “stepping stone” for reaching VC funding. 4,650
deals classified as late stage are conducted by firms that had previously raised
early funding. Transitions to late stage funding, however, are not common. Only
12% of firms involved in early stage deals reach the late stage within our observa-
tion period. Transitions are more common in the technology, biotech&pharma and
health care sectors and less frequent in commercial and real estate industries.
Early and late stage deals differ substantially in terms of securities used and there
is a large heterogeneity in this variation across sectors (Table 2.9). For example,
while technology and telecommunication firms use more debt in early rather than
late stage, the opposite is true for all other sectors, with airlines, commercial and
utility firms increasing reliance on debt by 20% or more in late stages. We investi-11As in Zaccaria 2015, we use the information on presence of non-accredited individuals among
an offering’s investors as the indicator that family and friends of the entrepreneurs participated inthe deal.
68

gate entrepreneurs’ choices on sources of funding further in the next section.
2.3.2 Determinants of Private Debt
We show that use of different financial contracts is related to the financing stages
in which the offering takes place. Pure equity is more commonly used by firms
in early funding stages while use of debt is associated with late stage financing
events. Specifically, late stage rounds are 3% more likely to be conducted with debt
contracts, after controlling for industry, revenue size and location (Table 2.10).
In order to examine the determinants of such difference in the use of debt in pri-
vate capital markets, we estimate two separate probit models for the probability
of an offering to be conducted with debt in early and late stage, and compare the
estimated coefficients for several factors (Table 2.11). Uncertainty over future cash
flows due to lack of any track record on profitability is a strong predictor for use of
debt. Offerings of firms in the pre-revenue phase are 4% less likely to be conducted
with debt contracts in both early and late stage deals. The number of directors,
which can be interpreted as a proxy for firm size, has opposite impact for early
(negative) and late (positive) stage deals, but the magnitude of the marginal ef-
fect is below 1% in both cases. While the number of investors that participated in
the offering has a negligible effect, the proportion of amount offered already sub-
scribed by the filing date is strongly correlated with the probability of debt being
used. In other words, deals that are “closed” faster are less likely to be conducted
with debt, and the intensity and significance of this variable is independent of the
financing stage. The presence of non-accredited investors participating in the of-
fering is negatively correlated with use of debt, with the effect being stronger in
late stage deals (-5%) as compared to early stage ones (-2%). Interestingly, in late
stage deals, firms that previously received outside capital from private investors,
i.e. transitioned firms, are no more likely to raise debt. Thus, presence of existing
outside investors that may help reduce information asymmetry does not seem to
69
drive the larger use of debt in late stages.
The major difference between the two estimated models resides in the role of col-
lateral for debt financing. We use the industry long term ratio of tangible assets
over total assets for S&P500 companies as a proxy for collateral availability. It is
reasonable to assume that in case of bankruptcy of the borrower, it would be easier
for the lender to seize a (tangible) piece of machinery rather than an (intangible)
algorithm. The proportion of tangible assets on balance sheet plays a relevant role
in late stage debt financing, while it has no significant impact in seed funding. This
result is robust to different model specifications and in particular it persists when
we restrict the sample to revenue generating firms. This evidence suggests that
while both cash flow uncertainty and lack of collateral affect firms’ debt capacity
in late stages of entrepreneurial finance, only the former explanation may be valid
for start-ups at the very beginning of the funding process.12
It can be argued, however, that start-ups founders use personal rather than busi-
ness assets as collateral for business loans in order to start of their ventures. This
would explain why use of debt is unrelated to industry specific tangible assets ra-
tios, without ruling out the collateral channel. In order to verify this hypothesis, we
use local elasticity of house supply (Saiz [2010]) as a proxy for availability of per-
sonal collateral assets (see Robb and Robinson [2012]).13 The idea is that in areas
where house supply is more elastic, house prices are less sensitive to local demand
shocks and therefore real estate property is more suitable for being posted as col-
lateral for loans. This can make borrowing a more accessible source of funding for
entrepreneurs. Table 2.12 shows that house supply elasticity has no significant
effect on debt, suggesting that personal collateral does not help explain variation
in the use of different financial contracts in early stage financing.12The sample is restricted to exclude firms that operate in Other sectors, for which the ratio of
tangible versus total assets cannot be computed. We obtained analogous results when including theOther sector and estimating the tangible to total assets ratio as an average of all other sectors.
13Due to changes in the definition of MSA by the Office of Management and Budget, we were onlyable to exactly match only 141 out of the 327 in the dataset.
70
Finally, we examine the effect of state-level bankruptcy exemptions (Cerqueiro and
Penas [2014], Robb and Robinson [2012]). Higher protection on personal assets in
bankruptcy laws is typically associated with higher denial of personal loans. If
debt is raised in private capital markets as a substitute for personal credit then
the (exogenous) variation in state-level bankruptcy exemptions should affect use
of debt via an “indirect” collateral channel. This conjecture is not supported by our
data, as showed in Table 2.12.
The evidence we present suggests that collateral does not play a major role in
early stage debt financing. One explanation for this result is that early stage firms
in our sample are too young for credit markets as they had not yet developed an
adequate asset base. Previous studies show, however, that bank debt is a very
common feature of firms’ capital structure in the very first year of operations and
across sectors. This debt is usually collateralized with either firms’ assets (possibly
purchased with the liquidity provided by the loan itself) or with personal assets of
the entrepreneurs. Use of early stage private debt, instead, is unrelated to avail-
ability of business or personal collateral. This may be due to the specific charac-
teristics of seed capital providers in private markets. Small early stage investors,
such as family, friends or angels, may be unable to seize collateral in an efficient
way, for example because of legal and opportunity costs of bankruptcy liquidation
procedures. The use of private early stage debt and the result on irrelevance of col-
lateral can be reconciled by arguing that borrowers may pledge social rather than
tangible collateral, relying on reputation built from personal connections (Stiglitz
[1990], Besley and Coate [1995]). This is possible in the context of private markets
because of the direct and non-intermediated nature of the relationship between
very young firms and small early stage capital providers (Bernstein et al. [2015]).
71

2.4 Conclusions
Corporate finance theory predicts that young firms face financial constraints dur-
ing the initial years of operation. In particular, lack of an adequate asset base
to serve as collateral is considered the main impediment in raising capital with
debt contracts. We explore financing decision of young firms in the context of pri-
vate capital markets, i.e. funding provided by individuals (family , friends, angel
investors) or unsupervised financial intermediaries (e.g. VC firms and peer-to-
peer lending platforms). We show that, contrary to various theoretical predictions,
debt is a recurrent source of entrepreneurial funding. Almost 20% of the financing
events in our dataset involve debt securities.
We further explore heterogeneity in financing contracts and document a signifi-
cantly lower occurrence of debt contracts in early stage financing events, i.e. fund-
ing rounds smaller than 6$ M conducted by firms that are less than 2 years old.
Interestingly, while uncertainty over future cash flows is significantly correlated
with use of debt, availability of collateral, in terms of both business and personal
assets, is irrelevant. This result is in contrast with evidence provided in previous
research on the determinants of bank credit for start-ups. The evidence that col-
lateral does not play a significant role in private debt markets, especially in early
stages, can be related to the peculiar nature of early stage investors and their per-
sonal connection with the entrepreneurs. On one hand liquidation costs may be
too high for such small investors and on the other hand entrepreneurs may pledge
social rather than tangible collateral.
We use a novel dataset based on SEC Form D filings for private placements. This
allows us to provide a complete picture of private capital markets for unlisted firms,
for example in terms of industry, location, management team, financing needs and
funding stage and to follow firms’ access to this market over time.
72
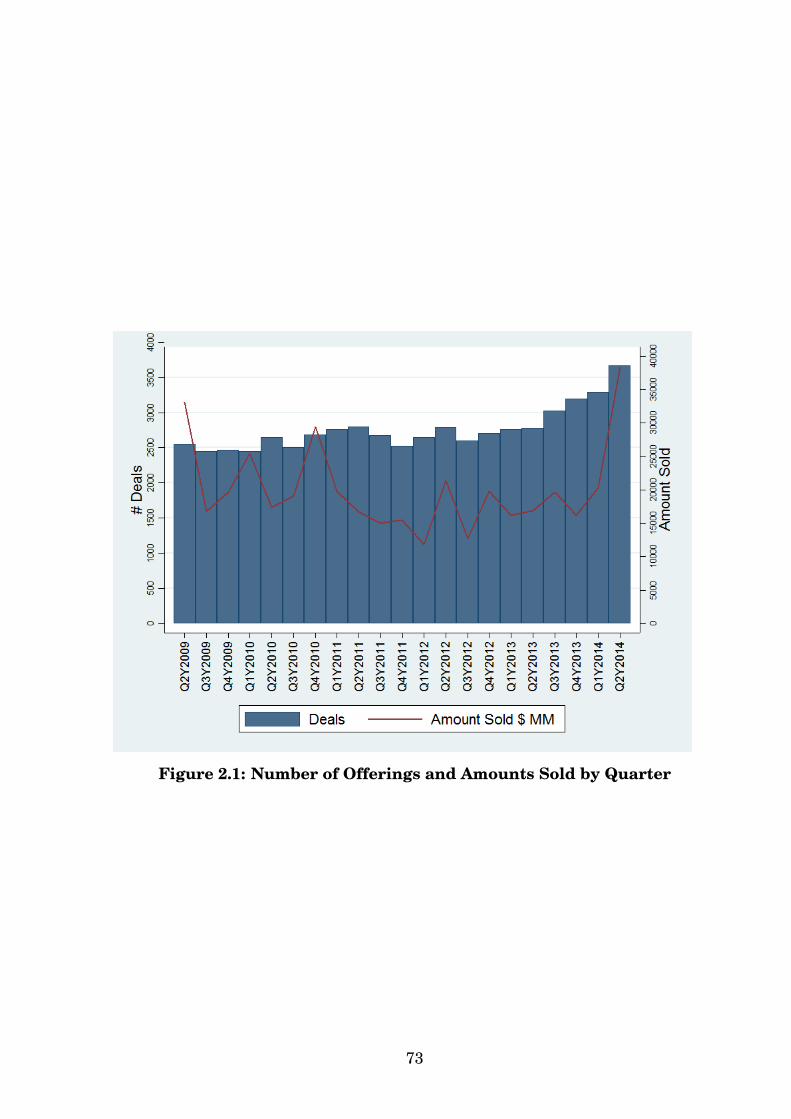
Figure 2.1: Number of Offerings and Amounts Sold by Quarter
73

Table 2.1: Deal and Firm Characteristics
Freq. Percent Cum.Round1st 39,230 68% 68%2nd 9,560 16% 84%3rd 4,224 7% 91%4th or later 5,045 9% 100%
Firm Age (yrs)0 11,962 21% 21%1 9,839 17% 38%2 6,215 11% 48%3 4,744 8% 56%4 or more 20,866 36% 92%NA 4,433 8% 100%
Investors4 or less 28,792 50% 50%5 to 10 12,970 22% 72%11 to 35 13,128 23% 95%more than 35 3,169 5% 100%
Firm Revenues SizeNo Revenues 10,071 17% 17%$1 - $1,000,000 7,262 13% 30%$1,000,001 - $5,000,000 2,655 5% 34%$5,000,001 - $25,000,000 1,376 2% 37%$25,000,001 - $100,000,000 439 1% 38%Over $100,000,000 390 1% 38%Decline to Disclose 34,869 60% 98%Not Applicable 997 2% 100%
Directors1 to 3 28,310 49% 49%4 to 6 18,305 32% 80%7 or more 11,444 20% 100%Total 58,059
74

Figure 2.2: Median and Mean Dollar Amount Sold per Offering
75
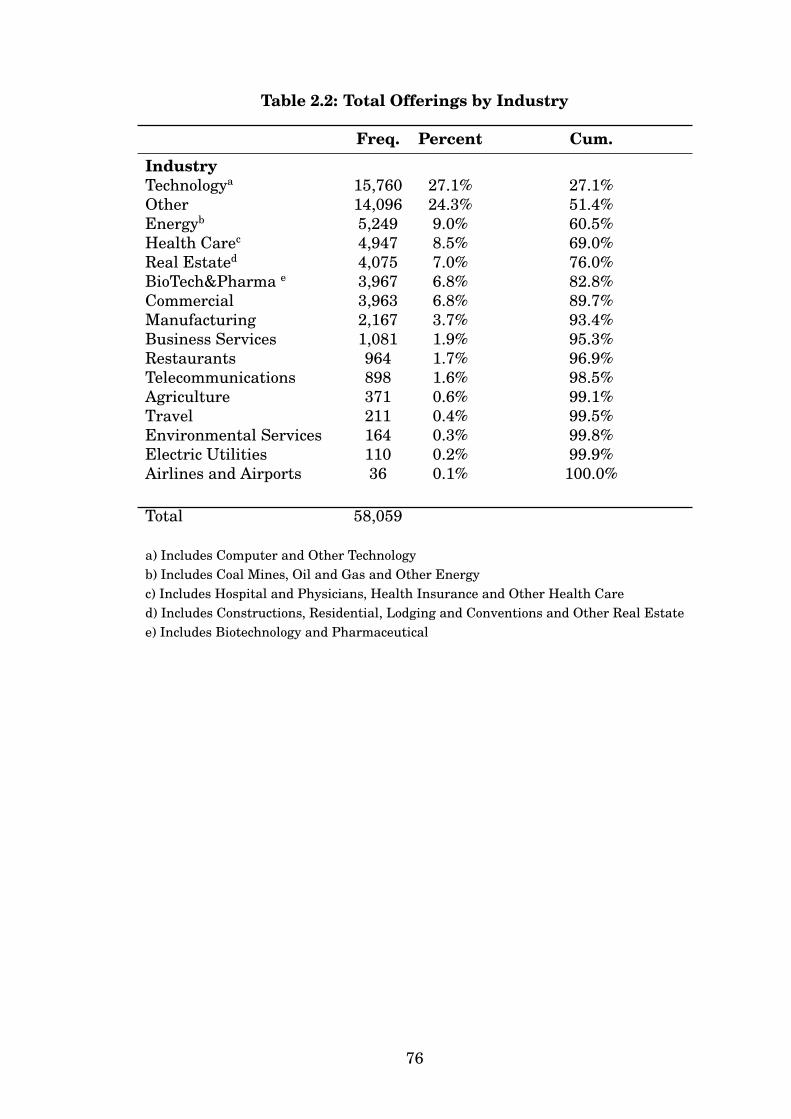
Table 2.2: Total Offerings by Industry
Freq. Percent Cum.IndustryTechnologya 15,760 27.1% 27.1%Other 14,096 24.3% 51.4%Energyb 5,249 9.0% 60.5%Health Carec 4,947 8.5% 69.0%Real Estated 4,075 7.0% 76.0%BioTech&Pharma e 3,967 6.8% 82.8%Commercial 3,963 6.8% 89.7%Manufacturing 2,167 3.7% 93.4%Business Services 1,081 1.9% 95.3%Restaurants 964 1.7% 96.9%Telecommunications 898 1.6% 98.5%Agriculture 371 0.6% 99.1%Travel 211 0.4% 99.5%Environmental Services 164 0.3% 99.8%Electric Utilities 110 0.2% 99.9%Airlines and Airports 36 0.1% 100.0%
Total 58,059
a) Includes Computer and Other Technologyb) Includes Coal Mines, Oil and Gas and Other Energyc) Includes Hospital and Physicians, Health Insurance and Other Health Cared) Includes Constructions, Residential, Lodging and Conventions and Other Real Estatee) Includes Biotechnology and Pharmaceutical
76

Table 2.3: Industry Breakdown and the General Solicitation Exemption
Rule 506 ( c) Other Exemptions
Freq. Percent Freq. PercentIndustryAgriculture 11 1.6% 125 0.7%Airlines and Airports 1 0.1% 9 0.1%BioTech&Pharma 28 4.0% 1,185 6.6%Business Services 22 3.2% 301 1.7%Commercial 52 7.5% 1,284 7.1%Electric Utilities 0 0.0% 13 0.1%Energy 80 11.5% 1,318 7.3%Environmental Services 1 0.1% 52 0.3%Health Care 39 5.6% 1,474 8.2%Manufacturing 34 4.9% 650 3.6%Other 165 23.8% 4,389 24.4%Real Estate 83 12.0% 1,575 8.7%Restaurants 12 1.7% 315 1.8%Technology 152 21.9% 5,087 28.2%Telecommunications 8 1.2% 194 1.1%Travel 6 0.9% 51 0.3%
Total 694 18,022Deals conducted under Rule 506(c) benefit from the lift on the ban on generalsolicitation, provided that all investors qualify as accredited.This table refers to deals conducted after January 2013
77
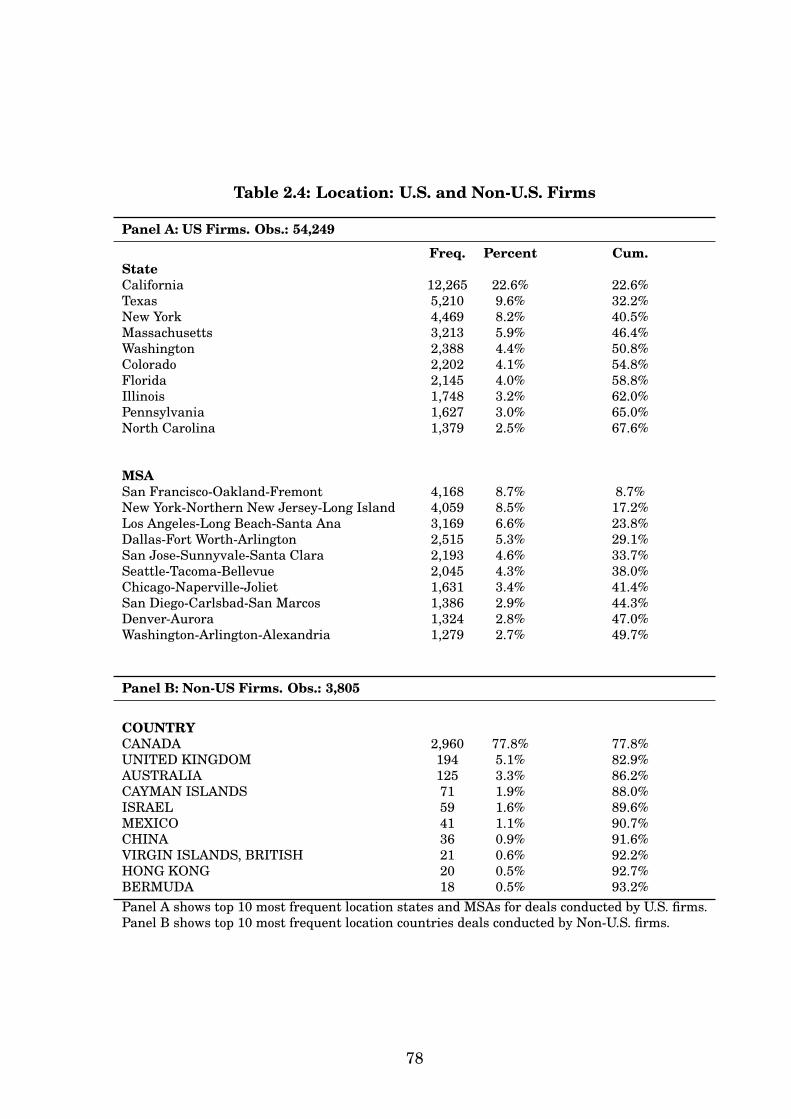
Table 2.4: Location: U.S. and Non-U.S. Firms
Panel A: US Firms. Obs.: 54,249
Freq. Percent Cum.StateCalifornia 12,265 22.6% 22.6%Texas 5,210 9.6% 32.2%New York 4,469 8.2% 40.5%Massachusetts 3,213 5.9% 46.4%Washington 2,388 4.4% 50.8%Colorado 2,202 4.1% 54.8%Florida 2,145 4.0% 58.8%Illinois 1,748 3.2% 62.0%Pennsylvania 1,627 3.0% 65.0%North Carolina 1,379 2.5% 67.6%
MSASan Francisco-Oakland-Fremont 4,168 8.7% 8.7%New York-Northern New Jersey-Long Island 4,059 8.5% 17.2%Los Angeles-Long Beach-Santa Ana 3,169 6.6% 23.8%Dallas-Fort Worth-Arlington 2,515 5.3% 29.1%San Jose-Sunnyvale-Santa Clara 2,193 4.6% 33.7%Seattle-Tacoma-Bellevue 2,045 4.3% 38.0%Chicago-Naperville-Joliet 1,631 3.4% 41.4%San Diego-Carlsbad-San Marcos 1,386 2.9% 44.3%Denver-Aurora 1,324 2.8% 47.0%Washington-Arlington-Alexandria 1,279 2.7% 49.7%
Panel B: Non-US Firms. Obs.: 3,805
COUNTRYCANADA 2,960 77.8% 77.8%UNITED KINGDOM 194 5.1% 82.9%AUSTRALIA 125 3.3% 86.2%CAYMAN ISLANDS 71 1.9% 88.0%ISRAEL 59 1.6% 89.6%MEXICO 41 1.1% 90.7%CHINA 36 0.9% 91.6%VIRGIN ISLANDS, BRITISH 21 0.6% 92.2%HONG KONG 20 0.5% 92.7%BERMUDA 18 0.5% 93.2%Panel A shows top 10 most frequent location states and MSAs for deals conducted by U.S. firms.Panel B shows top 10 most frequent location countries deals conducted by Non-U.S. firms.
78
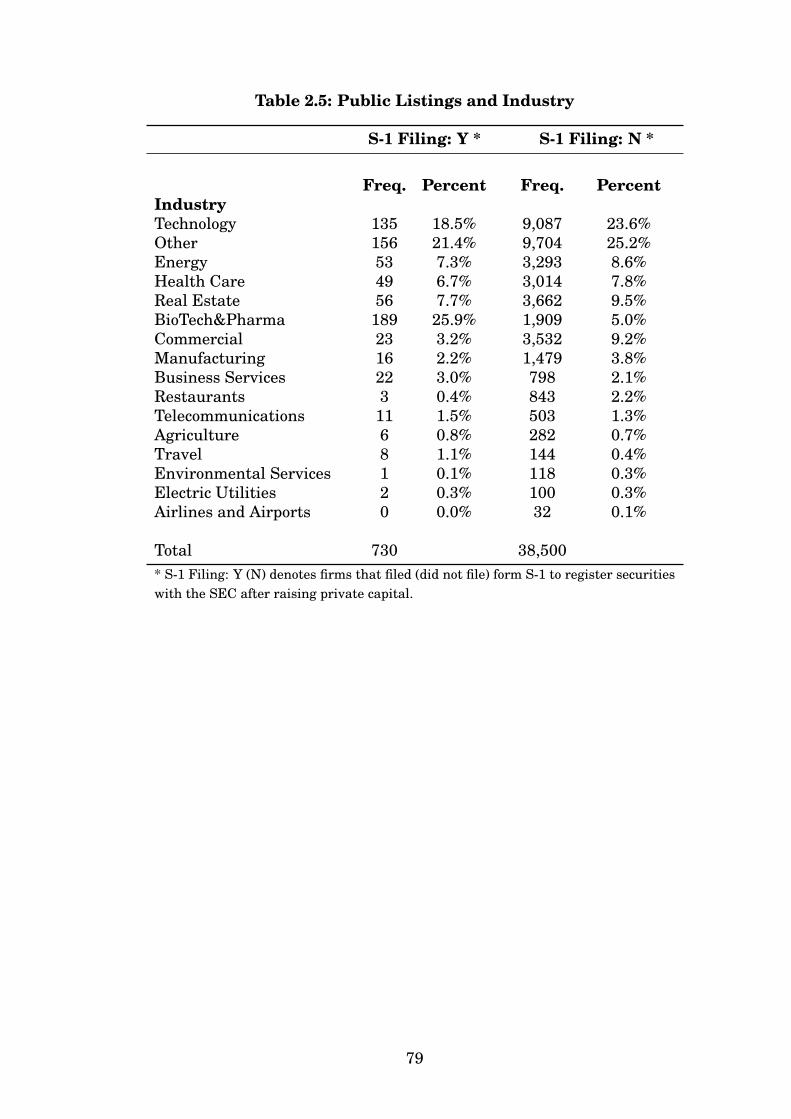
Table 2.5: Public Listings and Industry
S-1 Filing: Y * S-1 Filing: N *
Freq. Percent Freq. PercentIndustryTechnology 135 18.5% 9,087 23.6%Other 156 21.4% 9,704 25.2%Energy 53 7.3% 3,293 8.6%Health Care 49 6.7% 3,014 7.8%Real Estate 56 7.7% 3,662 9.5%BioTech&Pharma 189 25.9% 1,909 5.0%Commercial 23 3.2% 3,532 9.2%Manufacturing 16 2.2% 1,479 3.8%Business Services 22 3.0% 798 2.1%Restaurants 3 0.4% 843 2.2%Telecommunications 11 1.5% 503 1.3%Agriculture 6 0.8% 282 0.7%Travel 8 1.1% 144 0.4%Environmental Services 1 0.1% 118 0.3%Electric Utilities 2 0.3% 100 0.3%Airlines and Airports 0 0.0% 32 0.1%
Total 730 38,500* S-1 Filing: Y (N) denotes firms that filed (did not file) form S-1 to register securitieswith the SEC after raising private capital.
79
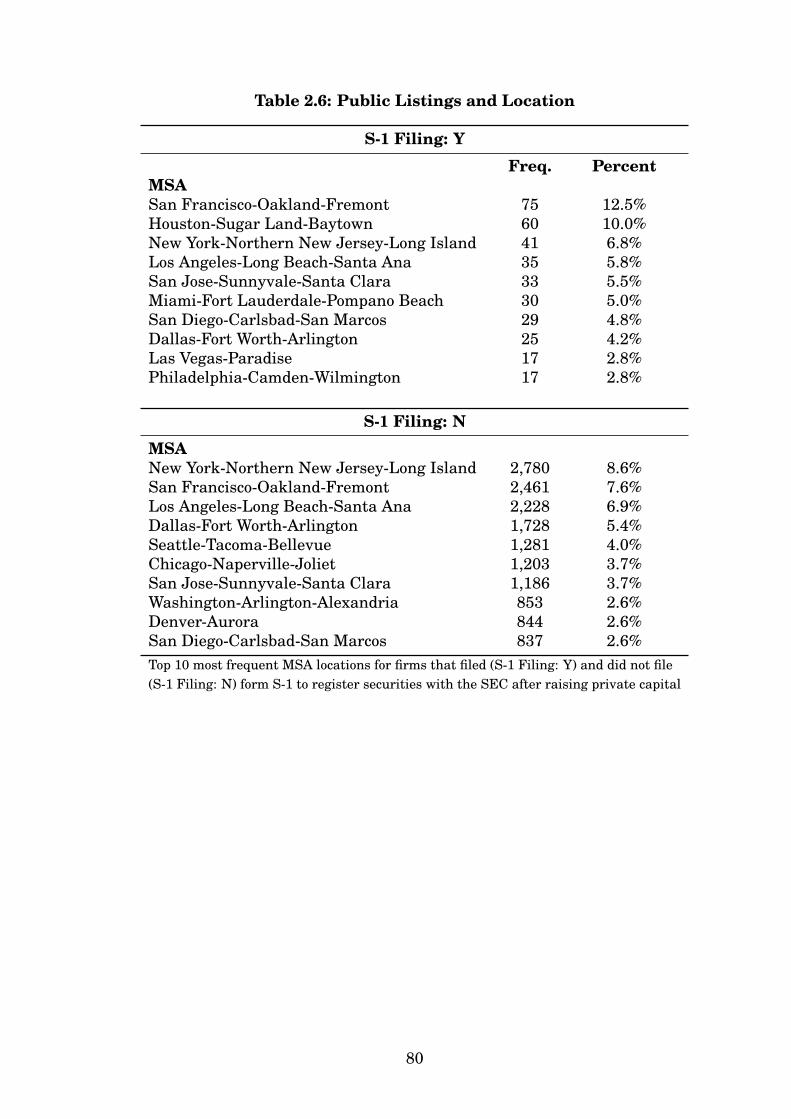
Table 2.6: Public Listings and Location
S-1 Filing: YFreq. Percent
MSASan Francisco-Oakland-Fremont 75 12.5%Houston-Sugar Land-Baytown 60 10.0%New York-Northern New Jersey-Long Island 41 6.8%Los Angeles-Long Beach-Santa Ana 35 5.8%San Jose-Sunnyvale-Santa Clara 33 5.5%Miami-Fort Lauderdale-Pompano Beach 30 5.0%San Diego-Carlsbad-San Marcos 29 4.8%Dallas-Fort Worth-Arlington 25 4.2%Las Vegas-Paradise 17 2.8%Philadelphia-Camden-Wilmington 17 2.8%
S-1 Filing: NMSANew York-Northern New Jersey-Long Island 2,780 8.6%San Francisco-Oakland-Fremont 2,461 7.6%Los Angeles-Long Beach-Santa Ana 2,228 6.9%Dallas-Fort Worth-Arlington 1,728 5.4%Seattle-Tacoma-Bellevue 1,281 4.0%Chicago-Naperville-Joliet 1,203 3.7%San Jose-Sunnyvale-Santa Clara 1,186 3.7%Washington-Arlington-Alexandria 853 2.6%Denver-Aurora 844 2.6%San Diego-Carlsbad-San Marcos 837 2.6%Top 10 most frequent MSA locations for firms that filed (S-1 Filing: Y) and did not file(S-1 Filing: N) form S-1 to register securities with the SEC after raising private capital
80

Table 2.7: Early vs Late Stage Deals: Descriptive Statistics
Early Stage Late Stage
Freq. Percent Freq. PercentRound1st 20,044 82% 19,186 57%2nd 3,093 13% 6,467 19%3rd 805 3% 3,419 10%4th or later 538 2% 4,507 5%
Investors4 or less 13,278 54% 15,514 46%5 to 10 5,116 21% 7,854 23%11 to 35 5,148 21% 7,980 24%more than 35 938 4% 2,231 7%Non-accredited investors 3,346 14% 3,133 9%
Firm Revenues SizeNo Revenues 6,163 25% 3,908 12%$1 - $1,000,000 3,432 14% 3,830 11%$1,000,001 - $5,000,000 938 4% 1,717 5%$5,000,001 - $25,000,000 324 1% 1,052 3%$25,000,001 - $100,000,000 51 0% 388 1%Over $100,000,000 23 0% 367 1%Decline to Disclose 12,978 53% 21,891 65%Not Applicable 571 2% 426 1%
Directors1 to 3 16,050 66% 12,260 37%4 to 6 6,711 27% 11,594 35%7 or more 1,719 7% 9,725 29%
Mean Median Mean Median
Round Size ($ Thousands) 969 350 11,852 1,335
81

Table 2.8: Early vs Late Stage Deals: Industry Breakdown
Industry Early Stage Late Stage Total
Agriculture 151 220 371% 0.62 0.66 0.64
Airlines and Airports 17 19 36% 0.07 0.06 0.06
BioTech&Pharma 998 2,969 3,967% 4.08 8.84 6.83
Business Services 534 547 1,081% 2.18 1.63 1.86
Commercial 2,024 1,939 3,963% 8.27 5.77 6.83
Electric Utilities 61 49 110% 0.25 0.15 0.19
Energy 2,217 3,032 5,249% 9.06 9.03 9.04
Environmental Services 64 100 164% 0.26 0.3 0.28
Health Care 1,659 3,288 4,947% 6.78 9.79 8.52
Manufacturing 843 1,324 2,167% 3.44 3.94 3.73
Other 5,994 8,102 14,096% 24.49 24.13 24.28
Real Estate 2,311 1,764 4,075% 9.44 5.25 7.02
Restaurants 573 391 964% 2.34 1.16 1.66
Technology 6,690 9,070 15,760% 27.33 27.01 27.14
Telecommunications 254 644 898% 1.04 1.92 1.55
Travel 90 121 211% 0.37 0.36 0.36
Total 24,480 33,579 58,059
82
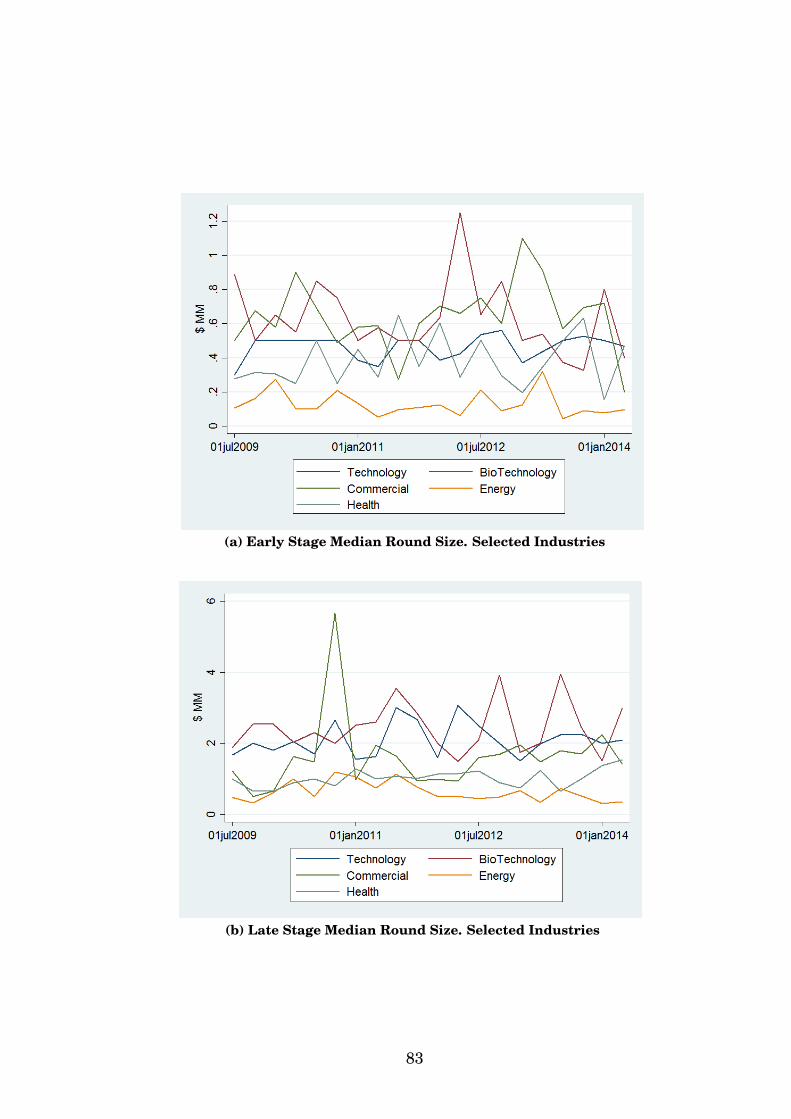
(a) Early Stage Median Round Size. Selected Industries
(b) Late Stage Median Round Size. Selected Industries
83

Table 2.9: Securities Issued and Use of Debt
Panel A: Securities Issued by Funding Stage
Security Early Stage Late Stage Total
Debt&Other 3,010 5,232 8,242% 12.3 15.58 14.2
Equity&Debt 572 799 1,371% 2.34 2.38 2.36
Equity&Debt&Other 424 713 1,137% 1.73 2.12 1.96
Equity&Other 18,221 24,251 42,472% 74.43 72.22 73.15
Other Security 2,253 2,584 4,837% 9.2 7.7 8.33Panel B: Use of Debt by Industry and Funding Stage
Early Stage Late StageIndustry Debt* Total Debt* Total
Agriculture 24 151 49 220% 15.89 22.27Airlines and Airports 3 17 8 19% 17.65 42.11BioTech&Pharma 201 998 785 2969% 20.14 26.44Business Services 78 534 116 547% 14.61 21.21Commercial 151 2024 521 1939% 7.46 26.87Electric Utilities 11 61 19 49% 18.03 38.78Energy 170 2217 427 3032% 7.67 14.08Environmental Services 10 64 17 100% 15.63 17Health Care 248 1659 656 3288% 14.95 19.95Manufacturing 168 843 368 1324% 19.93 27.79Other 932 5994 1263 8102% 15.55 15.59Real Estate 226 2311 362 1764% 9.78 20.52Restaurants 60 573 53 391% 10.47 13.55Tech 1643 6690 1933 9070% 24.56 21.31Telecommunications 63 254 146 644% 24.8 22.67Travel 18 90 21 121% 20 17.36* For each sector, the first row indicates the number of offerings conducted with debt (aloneor in combination with other securities),the second row indicates the frequency of suchofferings within the sector
84

Table 2.10: Use of Debt in Private Capital Markets
Estimates stem from a probit model Pr(Yi = 1) = Xi + εi where the dependent variable is adichotomous indicator that takes value 1 if debt securities are issued in offering i. Late Stageis a categorical variable that equals 1 if the offering is classified as Late Stage. Non Accred-ited is a categorical variable that equals 1 if the securities are offered to non-accredited in-vestors. Variables Directors and Investors indicate the number of firm’s directors and offering’sinvestors. The table shows both coefficients and average marginal effects for each regressor.
Coefficient AME
Late Stage 0.09204*** 0.09028*** 0.02988*** 0.0225***(0.01313) (0.01408) (0.003315) (0.00349)
Non Accredited -0.12818*** -0.03076***(0.02288) (0.00524)
Directors 0.00433* 0.00108*(0.00242) (0.00061)
Investors -0.00126*** -0.00031***(0.00037) (0.00009)
Amount Sold 0.00016 0.00004(0.00016) (0.00004)
Amount Sold/Amount Offered -0.30306*** -0.07593***(0.01798) (0.00448)
Industry FE Y Y Y YState FE Y Y Y YRevenue Size FE Y Y Y YEntity Type FE N Y N Y
Obs. 58,059 58,059Pseudo R-squared 0.0437 0.0626LR2 (df) 2426.59 (110) 3325.52 (117)
Standard errors in parentheses*** p<0.01, ** p<0.05, * p<0.1
85

Table 2.11: Use of Debt: Early and Late Stage Deals
Estimates stem from a probit model Pr(Yi = 1) = Xi + εi where the depen-dent variable is a dichotomous indicator that takes value 1 if debt securities are is-sued in offering i. The model is estimated separately for Early and Late Stagedeals. The table shows both coefficients and average marginal effects for each regressor.
Early Stage Late Stage
Coefficient AME Coefficient AME
Pre Revenue -0.18847*** -0.04109*** -0.16176*** -0.04239***(0.03030) (0.0063) (0.03492) (0.00866)
Tangible Assets 0.34257 0.07798 0.71136* 0.19608*(0.41895) (0.09536) (0.39416) (0.10863)
Transition -0.0382 -0.01053(0.02673) (0.00737)
Non Accredited -0.08093** -0.01794** -0.19235*** -0.04982***(0.03901) (0.00841) (0.03675) (0.00889)
Directors -0.02227*** -0.00507*** 0.02746*** 0.00757***(0.00627) (0.00143) (0.00314) (0.00086)
Investors -0.00199* -0.00045* -0.00043 -0.00012(0.00113) (0.00026) (0.00044) (0.00012)
Amount Sold/Amount Offered -0.26847*** -0.06111*** -0.22666*** -0.06248***(0.03489) (0.00792) (0.02685) (0.00738)
Industry FE Y Y Y YState FE Y Y Y YEntity Type FE Y Y Y Y
Obs. 17,531 24,217Pseudo R-squared 0.0938 0.0558LR2 (df) 1,484.36 (83) 1,408.46 (89)
Standard errors in parentheses*** p<0.01, ** p<0.05, * p<0.1
86
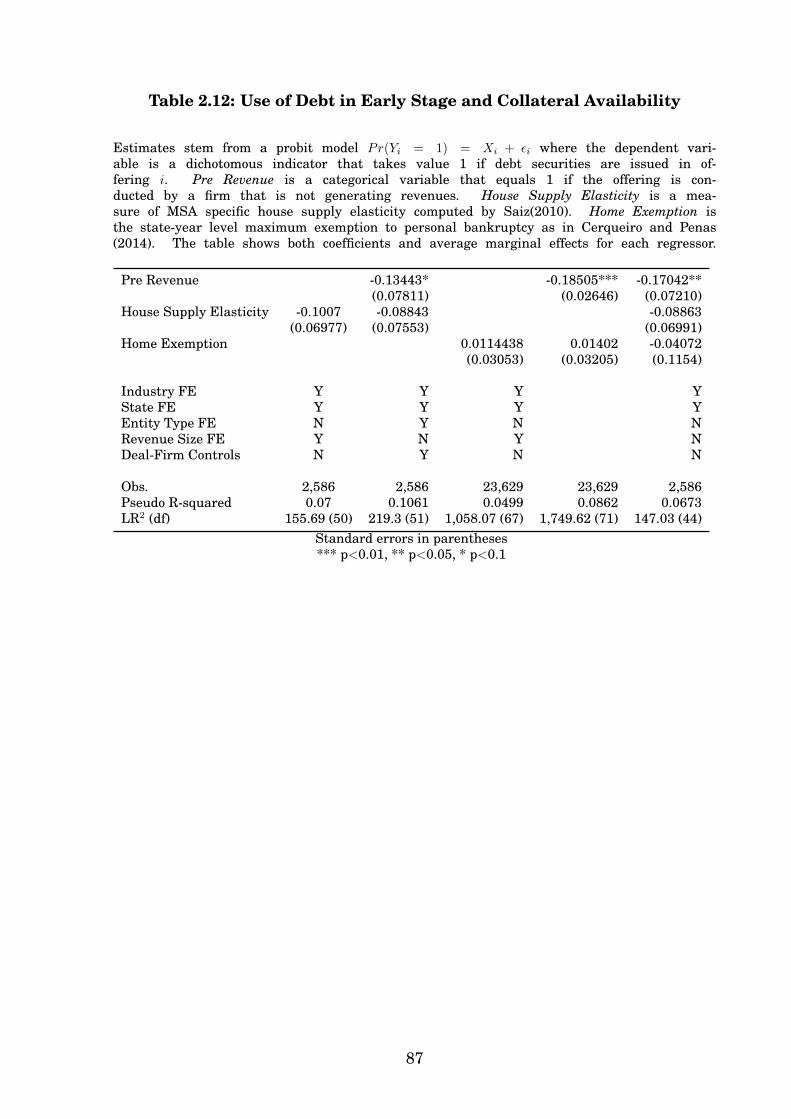
Table 2.12: Use of Debt in Early Stage and Collateral Availability
Estimates stem from a probit model Pr(Yi = 1) = Xi + εi where the dependent vari-able is a dichotomous indicator that takes value 1 if debt securities are issued in of-fering i. Pre Revenue is a categorical variable that equals 1 if the offering is con-ducted by a firm that is not generating revenues. House Supply Elasticity is a mea-sure of MSA specific house supply elasticity computed by Saiz(2010). Home Exemption isthe state-year level maximum exemption to personal bankruptcy as in Cerqueiro and Penas(2014). The table shows both coefficients and average marginal effects for each regressor.
Pre Revenue -0.13443* -0.18505*** -0.17042**(0.07811) (0.02646) (0.07210)
House Supply Elasticity -0.1007 -0.08843 -0.08863(0.06977) (0.07553) (0.06991)
Home Exemption 0.0114438 0.01402 -0.04072(0.03053) (0.03205) (0.1154)
Industry FE Y Y Y YState FE Y Y Y YEntity Type FE N Y N NRevenue Size FE Y N Y NDeal-Firm Controls N Y N N
Obs. 2,586 2,586 23,629 23,629 2,586Pseudo R-squared 0.07 0.1061 0.0499 0.0862 0.0673LR2 (df) 155.69 (50) 219.3 (51) 1,058.07 (67) 1,749.62 (71) 147.03 (44)
Standard errors in parentheses*** p<0.01, ** p<0.05, * p<0.1
87

Chapter 3
Discipline in the Securitization
Market
3.1 Introduction
The expansion of securitized credit in the years preceding the recent financial cri-
sis suggests a strong link between securitization practices and increases in de-
fault rates on loans. A popular explanation among academics, policy makers and
the general public hinges on an argument based on banks’ moral hazard and lax
screening standards . Consequently, emphasis has been placed on the need for
stricter regulatory requirements for banks, involving, for example, mandatory in-
formation disclosure. On the other hand, little attention has been paid to the im-
pact of the “buy side” of securitization transactions on loan performance. Yet, it
seems natural to conjecture that skills and incentives of buyers can potentially
affect originators’ behaviour. In this paper, I examine the effects of investors’ so-
phistication on screening standards and credit quality. In doing so, I propose a
definition of market discipline in the securitization market context based on in-
vestors’ ability to induce sound origination practices. More specifically, according
to the formalization provided, Buy Side sophistication is optimal in a market dis-
88

cipline sense if it preserves efficient risk allocation and credit expansion achieved
by securitization but prevents screening standards from deteriorating. My results
show that sophistication can be excessive and discourage safe lending and that
high risk free rates and low volatility contribute to discipline enforcement.
The ability of screening and monitoring loans in an efficient manner has been iden-
tified as one of the reasons for bank lending to firms and households (Diamond
[1984]): over time, banks can increase lending profitability by developing spe-
cific knowledge on their customer base, spotting sound investment opportunities
and collecting (soft) information, which is not available to other capital providers.
However, incentives to carry out proper due diligence on loan applications may be
distorted by loan selling and securitization practices. Moral hazard behaviour can
arise when banks offload credit risk onto outside investors leading to increases in
default rates (Petersen and Rajan [2002]). Thus, poor lending practices are a likely
outcome when secutitization is motivated by risk-sharing purposes.1 Risk-sharing
as the rational for trade has been proposed by Dewatripont and Tirole [1994] ,
Chemla and Hennessy [2010] and Malherbe [2010] and supported by many policy
makers : risk averse banks trade loans with risk neutral investors in order to de-
crease the volatility of their payoffs or to diverify their holdings. This paper relies
on this same mechanism as the rational for banks to sell the loans they originate,
but introduces heterogeneity among financial intermediaries in terms of risk aver-
sion, thus generating heterogeneity in the optimal insurance levels chosen by each
institution.
As due diligence is assumed to be not observable for loan buyers, the equilibrium
level of monitoring and screening may be lower than if loans were not sold (Pen-
nacchi [1988]), even when the optimal loan sale contract is designed to preserve1
Pennacchi [1988]and Acharya et al. [2013] provide both theoretical and empirical support for an
alternative explanation based on regulatory capital arbitrage
89

bank’s monitoring/screening incentives. Empirical evidence suggests that credit
standards have been significantly loosened in the last few years before the crisis
(Keys et al. [2010]). However, from the Seventies the mid years 2000 securitization
kept expanding at a solid pace and without major disruptions, despite it being re-
markably prone to adverse-selection type market failure. One possible explanation
has been proposed by Gorton and Pennacchi [1995] : during the years, investors
have become more and more able to acquire and process information (thanks to
the new information technology , regulation on transparency and rating agencies)
, thereby significantly reducing asymmetries. In my model, hard information (i.e.
all loan characteristics) is completely shared between originators and buyers, while
the only uncertainty left concerns the unobservable screening action. Importantly,
I assume that investors can process hard information by combining it with a sig-
nal they privately receive on the state of the economy. The precision of the signal
defines investors’ sophistication. This assumption is made to capture the institu-
tional nature of the securitization market, where buyers are professional investors
with (presumably) better forecasting skills than other agents. It follows that, in
this framework, the deterioration of credit quality induced by securitization can be
mitigated by investors’ sophistication. This intuition leads to the idea of market
discipline.
According to Flannery [2001], the concept of market discipline refers to the abil-
ity of the investors to judge a bank’s behaviour towards risk and to their actions’
impact (influence) on that behaviour. This interpretation mirrors the definition of
market discipline proposed by regulatory authorities (Basel II) as one of the three
pillars of the prudential supervisory architecture. The intuition for market disci-
pline is that if the investor has sufficient means to verify her counterparty risk
attitude and if she has the proper incentive to behave consequently (punishing the
bank for excessive risk taking), the bank will take into account investor’s actions
and engage in more investor-friendly activities (such us monitoring and screening).
Not surprisingly, most of the regulators’ attention concerning market discipline
90

was focused on information disclosure and transparency. Information availability
alone, however, may not be enough to prevent risk build up : also relevant are costs
and ability of processing information and investor’s incentives to adopt disciplining
behaviour. Theoretical literature on market discipline is quite exiguous. The most
relevant contribution (for this discussion) is Malherbe [2010] characterization of
market discipline, which links the ratio of observable but not verifiable informa-
tion to the influence on agents’ behaviour arising from the prospect of observing
the information.
This paper expands the existent literature on securitization by emphasizing the
impact of loan buyers on credit generation outcomes, rather than focussing on
banks or borrowers as in most of previous research. As investors ability to influence
financial intermediaries is considered crucial for market discipline enforcement, a
novel formalization of Basel’s “Third Pillar” arises naturally from this framework
and illustrates the interactions between investors skills (sophistication), origina-
tion practices, borrowing and loan performances.
In order to simplify the analysis, securitization transactions are modeled in their
primitive form as loan sales, i.e. I abstract from loan pooling and tranching prac-
tices as, in my framework, no further insight would be added to the main results2
This paper proceeds as follows. The model is described in Section 2 and solved in
Section 3. I discuss the results in Section 4. Section 5 concludes.
2The set up of the model allows for a disciplining mechanism that is economically equivalentto retaining the equity tranch in the originator’s balance sheet as skin in the game. On the otherhand, the possibility of catering a segmented market with multiple tranches of the same loan pooldoesn’t qualitatively affect my findings.
91

3.2 Model Set Up
The Banks
There is a continuum [0, 1] of banks . Each bank is indexed by x and is risk averse,
with utility function as follows : U (C) = E (C1−x). Risk aversion coefficient is
banks’ private information: this assumption is meant to capture the idea that at
any given point in time , banks privately observe the quality of their assets on
balance sheet, their liquidity position or ability to fulfill regulatory capital require-
ments, and these features determine their risk capacity.
Each bank is endowed with one unit of cash, which can be invested in a risk-free
asset or can be used to finance a project.
The Project
Each bank has access to a pool of projects and all pools have the same ex-ante
characteristics. All projects require one unit of cash to be implemented and have a
payoff X equal to R > 2 if they are successful and 0 if they fail. Success probability
depends on the state of the world ω ∈ {G,B}, with Prob (ω = G) = Prob (ω = B).
Define the average success probability as θω .
I will further assume that θω is higher in the good state of the world (θG > θB) and
that the net present value of the average project is positive in the good state and
negative in the bad state of the world (θG > 12
, θBR < 1 ).
In the analysis I will make use of the following definitions
θG − θB ≡ ∆
E (θ) ≡ θ̄
92

Screening
When issuing a loan, banks can pick a project randomly within their pool, or they
can choose to invest c (non monetary), screen the pool and improve the quality of
their investment loan by selecting the best project, thus shifting probability mass
from the failure to the success outcome. In particular, if banks screen, the project
will return R with probability θω + ε , where
ε < 1− θG
θ̄ + ε > 12
c < ε2
Define action a ∈ {S,NS} : banks’ utility function rewrites
U (C, x, c(a)) = E(C1−x)− c(a)
with c (NS) = 0 and c (S) = c.
The screening technology is efficient as c < εR, i.e. the investment cost is lower
than the extra expected return that it generates. Moreover , with “traditional
banking”, i.e. in the absence of a secondary market for loans, every bank that
chooses to invest in the project will screen as
(θ̄ + ε
)R(1−x) − c > θ̄R(1−x)
∀x ∈ [0, 1]
Finally, action a is not observable to outside investors.
93

The Risk-Free Asset
A risk-free asset is available to both investors and banks. Its return r is exoge-
nously fixed . I’ll assume
1 ≤ 1 + r < θ̄R
Thus, the return on the risk free asset is weakly positive and always lower than
the expected return on the risky asset.
Time Line and Negotiation
In this two-periods model, at time t = 0 each bank decides whether to invest in the
risk-free asset or in the project. If a bank invests in a project it attempts to sell
it on the market and trade occurs by random matching : each bank is paired with
one investor from a pool of measure I ≥ 1 (the “Buy Side” ).
The bank sets price P and makes a take-it-or-leave-it offer to the investor. If the
investor rejects the offer the loan will be held on balance sheet until payoffs are
realised. If the investor accepts the offer, the bank invests the cash received in the
transaction at the risk-free rate. Renegotiation costs (associated for example with
reputational concerns) are assumed to be high enough to prevent multiple rounds
of bargaining.
This trading protocol is intended to mimick a common practice in the market place
where banks usually approache the market with a sale proposal and a price guid-
ance for the deal, if the demand meets the offer the deal closes (with little, if any,
revision to the price guidance), otherwise the issuance fails.
Payoffs realise at t = 1 .
94

The Buy Side
Each risk-neutral, deep-pocketed investor in the Buy Side receives a signal y ∈
{H,L} on ω with the following characteristics
Prob (y = H | ω = G) = Prob (y = L | ω = B) = k
Parameter k ∈[
12, 1]
is the precision of signal y and identifies investors’ sophistica-
tion. This theoretical framework is applicable to securitization deals where hard
information is completely shared between originators and buyers, and the loan per-
formance depends both on screening (privately chosen by banks) and on macroe-
conomic variables, such as real estate prices, on which institutional investors may
have specific forecasting skills.
Based on signal y and price P , investors choose action i, that is they decide whether
to buy the loan or invest in the risk-free asset ( i.e. i ∈ {B,NB} ).
3.3 Solving the Model
In what follows, I’ll first solve for the equilibrium in the securitization subgame,
and then superimpose the participation constraint given by the utility gained by
banks investing in the risk free rate. The mass of banks choosing to invest in a
project and to undertake the efficient screening ation is a feature of final equilib-
ria. The extent to which investor sophistication can affect this quantity imposing
discipline to the banking sector is the main focus of the analysis.
95

Securitization Equilibrium Definition
According to the negotiation protocol , when a bank invests in the project, it will
choose whether to screen and which price to “show” to the market. Upon receiving
a sale proposal and after observing her signal, the investor will pick her action.
Thus, strategies are defined by
σB : x→ R+ × A
σi : (y, P )→ I
with
A ≡ {S,NS}
P ∈ R+
I ≡ {B,NB}
Importantly, a is payoff-relevant for the investor and the price asked by the bank
is the only potentially informative signal on a. The investor will form a belief
µ = Prob (a = S | P )
SECURITIZATION EQUILIBRIUM. The equilibrium in the securitization sub-
game is defined by [σ∗B, σ∗i ] and µ∗ = Prob (a∗ = S | P ∗) such that :
σ∗B : (P ∗ (x) , a∗ (x)) = argmaxP,a
U (P, c (a) , x, σ∗i )
σ∗i : i∗ (y, P ) = argmaxi
u (i, y, P ∗, µ∗)
With U (·) and u (·) being the expected utility functions for the bank and the investor
respectively.
96

Solving the Securitization Game
Define investors belief on ω = G , updated upon receiving y , as
Φy ≡ Prob (ω = G | y)
The investor will buy the securitized asset offered at price P if its net expected
return is greater than the net return on the risk-free security, so
i∗ (y, P ) = B if(Φy∆ + θB + µε
)R− P > rP
or, equivalently, if
Φy > P (1+r)∆R
− θB+µε∆≡ Φ̄ (P )
when Φy = Φ̄ (P ), I will allow investors to randomly select their strategy : Prob[i∗ = B | Φy = Φ̄ (P )
]=
q ∈ [0, 1] .
Investor optimal strategy depends on her belief on the state of the economy Φy and
on (a function of) the price asked for the loan. Everything else equal, investors are
more likely to buy when they are more optimistic about general economic condi-
tions. The effect of prices, instead, is less clear-cut: high prices reduce returns but
may signal better loan quality and higher expected payoffs.
Notice that, given precision k and since Prob (ω = G) = Prob (ω = B) = 12
, Φy can
only take values {1− k, k} both with ex-ante probability 12
3 .
Hence, given the Buy Side’s optimal investment rule, from the bank’s perspective
the probability of selling the loan at price P is
3Prob (y = H) = Prob (y = L) = 12k + (1− k) 1
2 = 12 ; ΦH = Prob(y=H|ω=G)Prob(ω=G)
Prob(y=H) =12k12
= k
;ΦL = 1− k
97

Figure 3.1: Probability of loan transactionProb (i∗ = B | P )
ξ ≡ Prob (i∗ = B | P ) =
1 Φ̄ (P ) < 1− k
12
(1 + q) Φ̄ (P ) = 1− k
12
1− k < Φ̄ (P ) < k
12q Φ̄ (P ) = k
0 Φ̄ (P ) > k
as illustrated in Figure 1
Recall that P belongs to the banks’ strategy set. It’s easy to see that no equilibrium
can be reached when ξ = 1 or ξ = 12, as banks’ utility is increasing in P . On the
other hand, ξ = 0 overlaps with a “traditional banking” equilibrium, and investors’
choices and sophistication have no effect on credit generation. Thus, in a securi-
tization equilibrium, investors will be pushed to indifference and ξ can either be
12
(1 + q) or 12q , or equivalently, Φ̄ (P ) ∈ {1− k, k}.
As Φ̄ (P ) is increasing in P , the statement above implies that banks will choose
either a “high” price or a “low” price : the higher the price, the higher the profits
if trade occurs but the lower the probability of trade occurring. Intuitively, more
98

(less) risk averse banks will opt for the lower (higher) but less (more) uncertain
payoff. Finally, the likelihood of trading will drive the choice of action a . Since
banks’ optimal action will depend on investors’ mixing strategies, it is useful to
split the support for q in 4 regions as follows:
1. q ∈ [q̄, 1] (Region 1)
2. q ∈(q, q̄)
(Region 2)
3. q ∈(0, q]
(Region 3)
4. q = 0
where q̄ = 1− 2cεR
and q = 1− 2cε
.
PROPOSITION 1
Suppose q ∈ [q̄, 1] . There exists x∗ such that
• if x ≥ x∗ : [(P ∗ = P 0, a∗ = NS) , i∗ (H,P 0) = B,Prob [i∗ (L, P 0) = B] = q] and µ∗ |
P 0 = 0
• if x < x∗ : [(P ∗ = P 1, a∗ = S) , P rob [i∗ (H,P 1) = B] = q, i∗ (L, P 1) = NB] and µ∗ |
P 1 = 1
When q is high enough, less (more) risk averse banks will ask a high (low) price for
the loan and will (not) screen available projects. Upon observing a high signal on
99

ω, investors will buy at the low (high) price with probability 1 (q ). Upon observing
a low signal on ω, investors will only buy at the low price, with probability q. Prices
are fully revealing of banks screening strategies.
Since I established that equilibria can only be achieved in Φ̄ (P ) ∈ {1− k, k}, I will
provide a proof of the proposition above by deriving the optimal startegies in the
two cases Φ̄ (P ) = 1− k and Φ̄ (P ) = k . The final equilibrium result is obtained by
maximising banks’ utilities, according to their risk aversion coefficients.
Case Φ̄ (P ) = 1− k
In this case, the probability of i∗ = B (i∗ = NB) is 12
(1 + q) (12
(1− q)). The payoff
to the bank if the investor buys the loan is P (1 + r) . If the investor doesn’t buy
the loan, the bank will receive either R or zero and the success probability will be
updated, based on the informational content of investors’ optimal action:
Prob (X = R | i∗ = NB, a = S) = θG + ε− k∆
Prob (X = R | i∗ = NB, a = NS) = θG − k∆
It follows that the bank’s utility with a = S :
1
2(1 + q) (P (1 + r))(1−x) +
1
2(1− q)
(θG + ε− k∆
)R(1−x) − c
while the bank’s utility with a = NS :
1
2(1 + q) (P (1 + r))(1−x) +
1
2(1− q)
(θG − k∆
)R(1−x)
100

Implying a∗ = NS if
x ≥ 1−ln(
2c(1−q)ε
)ln (R)
(3.1)
which holds ∀x ∈ [0, 1] .
Since a∗ = NS for all banks in the continuum, µ∗ = 0 and P ∗ =(
(1− k) + θB
∆
)∆R1+r≡
P0 . Moreover , the bank’s utility wil be
1
2(1 + q)
(P 0 (1 + r)
)(1−x)+
1
2(1− q)
(θG − k∆
)R(1−x) =
=1
2(1 + q)
((θG − k∆
)R)(1−x)
+1
2(1− q)
(θG − k∆
)R(1−x) ≡ U0 (k, x)
with ∂U0
∂k< 0
With Φ̄ (P ) = 1− k, the optimal strategy is (P = P 0, a = NS) for any x ∈ [0, 1]
Case Φ̄ (P ) = k
In this case, the probability of i∗ = B (i∗ = NB) is 12q ((1− 1
2q)). Payoffs and success
probability are same as above.
Bank’s utility with a = S :
1
2q (P (1 + r))(1−x) +
(1− 1
2q
)(θG + ε− k∆
)R(1−x) − c
Bank’s utility with a = NS :
1
2q (P (1 + r))(1−x) +
(1− 1
2q
)(θG − k∆
)R(1−x)
101

Implying a∗ = S if
(1− 1
2q
)εR(1−x) > c (3.2)
Condition 3.2) holds ∀x ∈ [0, 1] as c < ε2
. It follows that µ∗ = 1 and P ∗ =(k + θB+ε
∆
)∆R1+r≡ P
1 . Moreover , the bank’s utility will be
1
2q((k∆ + θB + ε
)R)(1−x)
+
(1− 1
2q
)(θG + ε− k∆
)R(1−x) − c ≡ U1 (k, x)
with ∂U1
∂k< 0 (See Appendix A).
With Φ̄ (P ) = k, the optimal strategy is (P = P 1, a = S) for any x ∈ [0, 1]
Each bank will choose P 0 or P 1, based on its own risk aversion coefficient x. Equi-
librium utility is
UESec (k, x) = max
[U1 (k, x) , U0 (k, x)
]
Define the function
F (k, x) = U1 (k, x)− U0 (k, x)
F (·) is continuous in x ∈ [0, 1] and observe that
F (k, 0) = R[q∆(k − 1
2
)+ ε]− c > 0
F (k, 1) = ε(1− 1
2q)− k∆
2− c− 1−θG
2< 0
This implies that there exists x∗ (k) ∈ [0, 1] such that F (k, x∗ (k)) = 0 and confirms
the existence of the proposed equilibrium (pictured in Figure 2)4.
When indifferent investors are relatively more likely to buy the loan (i.e. q is high),
more risk averse banks will offer a lower price in order to increase the chances4Uniqueness can be proven by showing that ∂F
∂x is continuous in x and ∂F∂x = 0 has at most one
solution in x ∈ [0, 1]
102

of their offer being accepted and of risk being transferred. Such high level of in-
surance is only compatible with no screening, as the bank is highly unlikely to
internalize the benefits of screening. Effectively, banks with risk aversion coeffi-
cient to the right of the threshold x∗ act as pure credit brokers. Banks with x < x∗
are less concerned with carrying risk on balance sheet and they are only willing to
sell the loan for a higher price, even though the probability of receiving the certain
payoff is lower. This low level of insurance ensures they use the efficient screening
technology. Notice that these results mirror standard optimal contracting solu-
tions for moral hazard problems: a lower degree of protection in a risk-sharing
driven transaction is cheaper for the risk-averse agent and induces higher effort.
Furthermore, when risk aversion coefficient is below the threshold x∗risk is more
likely to be born by relatively more risk averse agents (as compared to investors)
: the efficient action a = S occurs at the expenses of the efficient allocation of the
asset.
Finally notice that the difference between the two equilibrium prices is increasing
in investors’ sophistication. Even though more sophistication reduces the gains
from trade for all banks, this effect is mitigated by a higher price (P 1) for the rela-
tively less risk averse ones.
PROPOSITION 2
Suppose q ∈(0, q]
. There exists x∗ such that
• if x ≥ x∗ :[(P ∗ = P
′, a∗ = S
), i∗(H,P
′)= B,Prob
[i∗(L, P
′)= B
]= q]
and µ∗ |
P′
= 1
• if x < x∗ : [(P ∗ = P 1, a∗ = S) , P rob [i∗ (H,P 1) = B] = q, i∗ (L, P 1) = NB] and µ∗ |
P 1 = 1
103

Figure 3.2: Equilibrium 1k = 0, 6 , q = 0, 7 , R = 3 , θG = 0, 75 , θB = 0, 25 , ε = 0, 2 , c = 0, 1
This equilibrium can be easly proven by following the same reasoning as proposi-
tion 1. In particular , notice that equation 3.1) never holds when q < q, implying
a∗ = S and P ∗ =(
(1− k) + θB+ε∆
)∆R1+r≡ P
′ when Φ̄ (P ) = 1− k .
Condition 3.2) holds a fortiori with q < q . Define U (P ′, x, S) ≡ U′(x) . Banks’
utility in equilibrium is UESec = max
[U1 (x) , U
′(x)], with U1 (x) > U (x) for x < x∗.
This equilibrium is illustrated is Figure 3.
When indifferent investors are less likely to buy the loan, the insurance protection
that banks can get, even with the low price, is not high enough to make them forgo
the efficient screening technology : all banks will screen, and the most risk averse
ones will offer a lower price in order to improve the odds of risk sharing.
PROPOSITION 3
Suppose q ∈(q, q̄). If an equilibrium exists, it will be either of the type described in
proposition 1 or there will exist x′′ and x∗ such that
104

Figure 3.3: Equilibrium 2k = 1 , q = 0, 2 , R = 3 , θG = 0, 75 , θB = 0, 25 , ε = 0, 2 , c = 0, 1
• if x ≥ x∗ :[(P ∗ = P
′′, a∗ = NS
), i∗(H,P
′′)= B,Prob
[i∗(L, P
′′)= B
]= q]
and
µ∗ | P ′′ ∈ (0, 1)
• if x′′ < x < x∗ :[(P ∗ = P
′′, a∗ = S
), i∗(H,P
′′)= B,Prob
[i∗(L, P
′′)= B
]= q]
and µ∗ | P ′′ ∈ (0, 1)
• if x ≤ x′′ : [(P ∗ = P 1, a∗ = S) , P rob [i∗ (H,P 1) = B] = q, i∗ (L, P 1) = NB] and µ∗ |
P 1 = 1
See Appendix B.
The equilibrium in Proposition 3 differs from the previous ones because relatively
more risk averse banks may pool at price P ′′ (with Φ̄(P′′)
= 1−k ) , provided that a
consistent belief can be formed on Prob(a∗ = S | P ′′
). Since risk aversion coefficient
x is banks private information, price P ′′ is not fully revealing of each bank’s optimal
strategy a∗. Notice however that in this case the mass of banks choosing a∗ = S is
x∗ = 1−ln(
2c(1−q)ε
)ln (R)
105

Figure 3.4: Equilibrium 3k = 0, 6 , q = 0, 25 , R = 3 , θG = 0, 75 , θB = 0, 25 , ε = 0, 2 , c = 0, 1 , µ∗ = 0.6
which does not depend on sophistication k . An example of such equilibrium is
illustrated in Figure 4.
Finally, no securitization equilibrium exists when q = 0 .
The existence of a securitization market amplifies credit generation as it allows
risk averse agents who have access to projects to share risks held on their balance
sheet. Credit expansion however potentially comes at the expenses of credit quality
and efficiency, as not all banks choose to properly select the loans they issue (as
opposite to the traditional banking case). Next, I will show how the Buy Side
sophistication can avoid the loss in efficiency associated with the securitization
process, while retaining the benefits of additional borrowing.
Equilibrium and Market Discipline
According to the Basel Committee on Banking Supervision (2001), “market dis-
106

cipline imposes strong incentives on banks to conduct their business in a safe,
sound and efficient manner”. This definition can be easily rephrased within the
framework of this model : the Buy Side imposes discipline on banks if it induces
the majority of them to perform a proper due diligence on financed loans. Notice
that this definition abstracts from welfare considerations within the model. In
this sense, I am assuming that Market Discipline is part of the social planner’s
optimization problem because of positive externalities arising from screening effi-
ciency. In order to relate our previous results on securitization to market discipline,
I will proceed as follows. I will first impose the bank’s participation constraint
PC (x) = (1 + r)(1−x) on the securitization equilibrium. Each bank will choose be-
tween investing in the risk free asset or financing the loan (and trying to sell it on
the market ) . Once the participation constraint is introduced, it is possible to iden-
tify three distinct and exhaustive subsets in the continuum of banks, on the basis
of their investment decision and optimal actions. Specifically, one subset of banks
will finance the project and screen, one subset of banks will finance the project
and will not screen and the last subset will invest in the risk free asset. Finally,
I will investigate the effect of investors’ sophistication on the size of the subset of
banks that undertake the efficient action (screening). Investors’ sophistication will
implement market discipline if it induces the maximum possible mass of banks to
choose a∗ = S. This comparative statics exercise will be conducted for equilibria
arising in the different regions of q , as identified in the previous section.
Region 1 : q ∈ [q̄, 1].
Define x̂ as the coefficient that satisfies U1 (k, x̂) = PC (x̂) and xS as
xS ≡ min [x̂ (k) , x∗ (k)]
where x∗ (k) is defined as in proposition 1. Suppose x̂ (k) < x∗ (k) : all banks with
107

Figure 3.5: Equilibrium and market disciplinek = 0, 6 , q = 0, 7 , R = 3 , θG = 0, 75 , θB = 0, 25 , ε = 0, 2 , c = 0, 1, r = 5%
x < x̂ (k) will finance the project and choose σ∗B = (P 1, a = S) , while the remaining
ones will invest in the risk-free assets5. Suppose instead x̂ (k) > x∗ (k): banks with
x < x∗ (k)will finance the project and choose σ∗B = (P 1, a = S), while the remaining
ones will either finance the project and choose σ∗B = (P 0, a = NS)or will invest in
the risk-free asset.
Thus , xS represents the mass of banks that performed “due diligence” on the orig-
inated loan , or , loosely speaking , the quantity of “good credit” generated (see
Figure 5)
Market discipline is defined by the following statement :
Market discipline is achieved when xS is maximized .
Suppose x∗ (k) is increasing in k (in Appendix C, I provide a set of restrictions on
the parameters that ensures this condition is met) . It is immediate to see that ,
for any x ∈ [0, 1]
5as PC (x) > U0 (k, x) for x > x̂
108

PC (x) = (1 + r)(1−x) >1
2(1 + q)
(θBR
)(1−x)+
1
2(1− q) θBR(1−x) = U0 (1, x)
as θBR < 1 and 1 + r ≥ 1, implying that market discipline cannot be achieved at
k = 1. A perfectly informed Buy Side would impose too much discipline, preventing
some banks (the ones in the “middle” of the risk aversion range) from investing
in positive NPV projects. Sophistication will improve market discipline up to the
threshold level k∗ satisfying
U1 (k∗, x) = U0 (k∗, x) (3.3)
U0 (k∗, x) = PC (x) (3.4)
or, equivalently, the optimal k is k∗ = argmax[xS (k)
], implying x̂ (k∗) = x∗ (k∗)6 .
An analytic solution for k∗ cannot be computed for a generic q (a numerical simu-
lation is provided in Figure 6).
Since k∗ is increasing in q when ∂x∗
∂k> 0 (see Appendix D), k∗ (q = 1) will serve as
an upper bound for the more general case of 1− 2cεR≤ q ≤ 1.
When q = 1 , conditions 3.3) and 3.4) hold simultaneously for
k∗ = 1− 1 + r − θBRR∆
≡ k∗1 (3.5)
That is, the maximum value of k that achieves market discipline is k = k∗1 < 1, with
k∗1 decreasing in r and increasing in ∆.
Finally, if x∗ (k) is decreasing in k then, trivially, k∗ = 12.
6We assumed ∂x∗
∂k > 0 . Since ∂U1
∂k < 0 , then ∂x̂∂k < 0 . This implies that xS (k) is maximized when
x̂ (k∗) = x∗ (k∗)
109
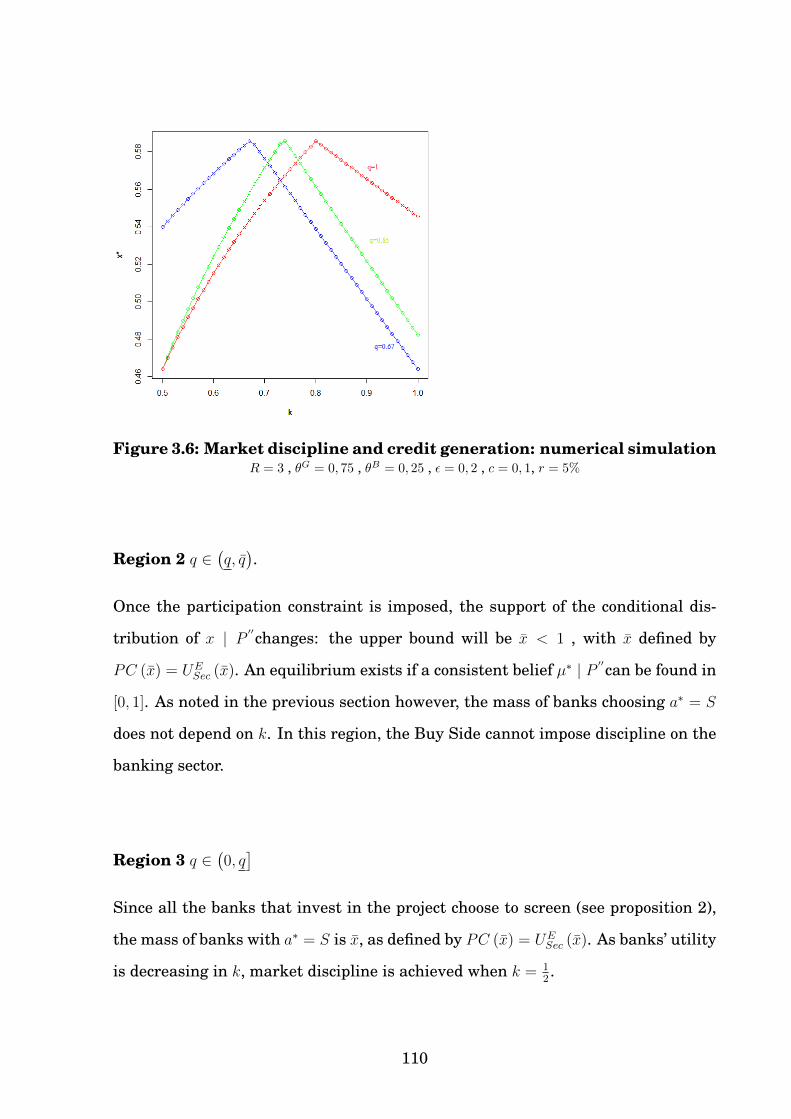
Figure 3.6: Market discipline and credit generation: numerical simulationR = 3 , θG = 0, 75 , θB = 0, 25 , ε = 0, 2 , c = 0, 1, r = 5%
Region 2 q ∈(q, q̄).
Once the participation constraint is imposed, the support of the conditional dis-
tribution of x | P ′′changes: the upper bound will be x̄ < 1 , with x̄ defined by
PC (x̄) = UESec (x̄). An equilibrium exists if a consistent belief µ∗ | P ′′can be found in
[0, 1]. As noted in the previous section however, the mass of banks choosing a∗ = S
does not depend on k. In this region, the Buy Side cannot impose discipline on the
banking sector.
Region 3 q ∈(0, q]
Since all the banks that invest in the project choose to screen (see proposition 2),
the mass of banks with a∗ = S is x̄, as defined by PC (x̄) = UESec (x̄). As banks’ utility
is decreasing in k, market discipline is achieved when k = 12.
110
Optimal precision k∗ is the level of sophistication that clears the most risk averse
banks off the securitization market, while preserving incentives for the rest of the
originators to issue and screen loans.
It emerges from the analysis above that the solution k∗ to the market discipline
maximization problem belongs to the set K∗ ≡[
12, k∗1], with k∗1 < 1. It is never
optimal to have a perfectly informed Buy Side participating to the securitization
market. Moreover, the upper bound of K∗approaches the lower bound 12when the
risk free rate increases and the volatility in the real sector (∆) decreases. Market
discipline is easier to implement (i.e. lower investors’ sophistication is needed)
when risk free rates are high and banks have less incentive to share risk.
3.4 Discussion
The first result illustrated above (k∗ < 1 ) states that market can impose too much
discipline and constrain good quality credit expansion. The intuition behind is that
high levels of sophistication increase the difference in the expected values of the
payoffs from securitization for banks that choose to screen. As a result, securitiza-
tion becomes relatively too risky for these agents as compared to investing in the
risk free rate and their resources will be subtracted from the credit market. On
the other hand, comparative statics on k∗1highlight the complementarity between
sophistication and risk free rates: market discipline can be achieved with little in-
vestors’ sophistication provided that interest rates are high enough. Furthermore,
monetary policy is shown to affect both quantity and quality of credit : for any
given level of sophistication, “too low” risk free rates increase the amount of loan
issued but decrease their average expected returns.
The analysis presented in the previous section allows investors to randomly select
a pure strategy, with q being the probability of i = B being selected. An alternative
interpretation of the results, based on market sentiment, can be provided. Suppose
that all investors are risk neutral and homogeneous in terms of sophistication, but
111

differ in their tie-breaking rule. When indifferent, optimists buy the risky assets,
while pessimists buy the risk-free asset. By setting q as the observable propor-
tion of optimists over pessimists among investors, it can be easily interpreted as
an indicator of market sentiment, and the analysis goes through unchanged. The
optimal sophistication required to obtain market discipline, under this interpreta-
tion, is increasing in market sentiment.
Finally, the model relies on the assumption that hard information is common knowl-
edge. This is compatible with a highly standardized origination process where a
limited amount of information is collected, which is easy to be transferred to in-
vestors. An example may be house mortgages: few indicators (such as LTV, DTI
ratios or appraisal value) are used in order to process the loan application and such
figures are typically shared with the buyers. On the other hand, the model seems
less applicable to more complex, project-specific lending. Also, overcollateralized
lending may distort screening incentives, regardless of subsequent securitization
(Manove et al. [2001]): market discipline (as defined in this paper) can’t play a role
in such context.
3.5 Conclusion
The goal of this paper is to examine how investors’ sophistication can affect effi-
ciency and credit quality by inducing a subset of participants in the banking sec-
tor to choose screening over not screening. A definition of market discipline, that
echoes the one used by regulators, is provided along these lines. Investors’ so-
phistication implements market discipline if it induces the largest possible mass of
banks to perform proper due diligence on the loans issued.
I present a model that builds on the standard argument of the trade-off between
risk sharing and moral hazard in loan sale or securitization transactions : risk
averse agents (banks) are willing to sell risky assets to outside buyers, but by do-
ing so they lose incentives to efficiently conduct proper due diligence (screening)
112

and improve expected returns. Two novel features are added to this framework.
First, the profitability of the projects depends not only on the banks’ choices in
terms of screening, but also on general macroeconomic conditions. I allow for out-
side investors to receive a signal on the aggregate state of the economy, which
guides their investment decisions. The precision of this signal defines the Buy Side
sophistication . Furthermore, I introduce heterogeneity in banks’ utility functions
thus generating heterogeneity in the equilibrium optimal screening decisions: the
amount of risk sold to investors depends on each bank’s risk aversion coefficient
and will ultimately drive the (unobservable) action choice.
My results show that it is never optimal (in a market-discipline sense) to have a
perfectly informed Buy Side participating in the securitization market, as it would
constrain high quality credit expansion. A strong informational advantage allows
buyers to extract too much rent from sellers, inducing some banks to resort to the
safe investment option. For high levels of sophistication, even relatively less risk
averse originators (who are more likely to screen projects) switch to the risk-free
asset.
Furthermore, optimal sophistication is (weakly) decreasing in the risk free rate
and (weakly) increasing in the volatility of the real sector. In other words, market
discipline is easier to achieve (i.e. lower investors’ sophistication is needed) when
risk free rates are high and when loans’ payoffs are less volatile.
Appendix A
∂U1
∂k= (1− x)
1
2q(k∆ + θB + ε
)−xR(1−x)∆−
(1− 1
2q
)∆R(1−x) (3.6)
113

Expression 3.6) is negative if
(1− x)(k∆ + θB + ε
)−x<
2− qq
or
Max[(1− x)
(k∆ + θB + ε
)−x]= (1− x) 2x < 1 = Min
[2− qq
](3.7)
and 3.7) always holds ∀x ∈ [0, 1]
Appendix B
Case Φ̄ (P ) = k. See proposition 1.
Case Φ̄ (P ) = 1− k. Suppose equilibrium price is P ′′. Optimal bank’s action is
• a∗ = S if x < 1−ln( 2c
(1−q)ε)ln(R)
≡ x∗. U(P′′, x, S
)≡ U
′′S (x)
• a∗ = NS otherwise. U(P′′, x,NS
)≡ U
′′NS (x)
Define x′′ as the solution to U1 (x) = U′′S (x)and notice that x′′ depends on P
′′. Fur-
thermore P ′′ must satisfy P (1+r)∆R− θB+µε
∆= 1−k. An equilibrium exists if there exists
a solution in [0, 1] to the following fixed point problem
Prob(a∗ = S | P ′′
)= µ∗ = x∗−x′′ (µ∗)
1−x′′ (µ∗)
and the banks equilibrium utility is UESec (x) = max
[U1 (x) , U
′′S (x) , U
′′NS (x)
].
Finally, if U1 (x∗) ≥ U′′S (x) for any µ ∈ [0, 1] then the equilibrium will be the same
as the one described in proposition 1.
114

Appendix C
Suppose ∆ > 1R− 2c
ε
and θBR > e−2. Then the following conditions are satisfied
1. ∂F (k,0)∂k
[F (k, 0)− F (k, 1)]− F (k, 0) > 0
2. q(k∆ + θB + ε
)−xln(k∆ + θB + ε
) [(1− x) ln
((k∆ + θB + ε
)R)
+ 2]+(1 + q)
((1− k) ∆ + θB
)−xln((1− k) ∆ + θB
) [(1− x) ln
(((1− k) ∆ + θB
)R)
+ 2]−
(ln (R))2 < 0⇒(∂2F∂x2
)∂k
< 0
Condition 1. ensures that the intercept with the x-axis of the chord that connects
F (k, 0) and F (k, 1) is increasing in k. Condition 2. implies that the convexity of the
function F (k, x) decreases in k . Hence, Conditions 1. and 2. imply ∂x∗
∂k> 0
Appendix D
Recall F (·) = U1 (·)− U0 (·) and F (x∗) = 0 . Observe that
∂F∂q< 0 if A (x) ≡
(θB + ε+ k∆
)1−x −(θB + (1− k) ∆
)1−x − ε < 0 .
Since
A (0) > 0
A (1) < 0
A (x) is continuous in x and A (x) = 0 has a unique solution in x ∈ [0, 1] ( as ∂A∂x
= 0
admits at most one solution in x ∈ [0, 1])
there exists xAsuch that
∂F∂q< 0 for x > xA and ∂F
∂q> 0 otherwise.
115

Notice that F (·) can be written as
12q[(θB + ε+ k∆
)1−x −(θB + (1− k) ∆
)1−x − ε]
+ 12
(θG − k∆
)+ ε− c
R1−x or
12q [A (x)] + 1
2
(θG − k∆
)+ ε− c
R1−x
which, evaluated at xA yields
12
(θG − k∆
)+ ε− c
R1−x > 0 , as θG − k∆ > 0 and εR1−x > c by assumption.
This implies
xA < x∗ , or equivalently ∂x∗
∂q< 0
as F (x) is monotonic and decreasing in x .
The market discipline optimal k is defined by
x∗ (q, k∗ (q)) = x̂ (q, k∗ (q))
hence
∂x∗
∂q+ ∂x∗
∂k∗∂k∗
∂q= ∂x̂∗
∂q+ ∂x̂
∂k∗∂k∗
∂q
Rearranging
∂k∗
∂q
(∂x∗
∂k∗− ∂x̂
∂k∗
)= ∂x̂
∂q− ∂x∗
∂q
Since ∂U1
∂k< 0 and ∂U1
∂q> 0 , then ∂x̂
∂k∗< 0 and ∂x̂
∂q> 0
Assuming ∂x∗
∂k∗> 0 , we have
∂x∗
∂k∗> 0.
116

Bibliography
Viral V Acharya, Philipp Schnabl, and Gustavo Suarez. Securitization without risk
transfer. Journal of Financial Economics, 107(3):515–536, 2013.
Anurag Ambekar, Charles Ward, Jahangir Mohammed, Swapna Male, and Steven
Skiena. Name-Ethnicity Classification from Open Sources. In Proceedings of the
15th ACM SIGKDD International Conference on Knowledge Discovery and Data
Mining, pages 49–58. ACM, 2009.
Joshua D Angrist and Jörn-Steffen Pischke. Mostly Harmless Econometrics: An
Empiricist’s Companion. Princeton University Press, 2008.
Meghana Ayyagari, Asli Demirgüç-Kunt, and Vojislav Maksimovic. Formal versus
Informal Finance: Evidence from China. Review of Financial Studies, 2010.
Morten Bennedsen, Kasper M Nielsen, Francisco Pérez-González, and Daniel
Wolfenzon. Inside the Family Firm: The Role of Families in Succession Deci-
sions and Performance. Quarterly Journal of Economics, 2007.
Morten Bennedsen, Francisco Pérez-González, and Daniel Wolfenzon. The Gov-
ernance of Family Firms, in Corporate Governance: A Synthesis of Theory, Re-
search, and Practice. 2010.
Allen N Berger and Gregory F Udell. The Economics of Small Business Finance:
The Roles of Private Equity and Debt Markets in the Financial Growth Cycle.
Journal of banking & finance, 22(6):613–673, 1998.
117

Shai Bernstein, Arthur G Korteweg, and Kevin Laws. Attracting Early Stage In-
vestors: Evidence from a Randomized Field Experiment. Journal of Finance,
2015.
Timothy Besley and Stephen Coate. Group Lending, Repayment Incentives and
Social Collateral. Journal of Development Economics, 1995.
Mike Burkart, Fausto Panunzi, and Andrei Shleifer. Family Firms. Journal of
Finance, 2003.
D.W. Bygrave and M Quill. Global Entrepreneurship Monitor: 2006 Financing
Report. London Business School and Babson College, 2006.
Geraldo Cerqueiro and María Fabiana Penas. How Does Personal Bankruptcy Law
Affect Start-ups? Working Paper, 2014.
Gilles Chemla and Christopher Hennessy. A theory of securitization: The role of
speculative markets. 2010.
Francis Chittenden, Graham Hall, and Patrick Hutchinson. Small Firm Growth,
Access to Capital Markets and Financial Structure: Review of Issues and an
Empirical Investigation. Small Business Economics, 1996.
Gregory Clark and Neil Cummins. Intergenerational Wealth Mobility in England,
1858–2012: Surnames and Social Mobility. The Economic Journal, 2015.
Marco Da Rin, Thomas F Hellmann, and Manju Puri. A survey of venture capital
research. Technical report, National Bureau of Economic Research, 2011.
Harold Demsetz and Kenneth Lehn. The Structure of Corporate Ownership:
Causes and Consequences. The Journal of Political Economy, 1985.
Mathias Dewatripont and Jean Tirole. The prudential regulation of banks. 1994.
Douglas W Diamond. Financial intermediation and delegated monitoring. The
Review of Economic Studies, 51(3):393–414, 1984.
118

Douglas B Downey. Number of Siblings and Intellectual Development: The Re-
source Dilution Explanation. American Psychologist, 2001.
Hélène Ducourant. Du Crédit à la Consommation à la Consommation de Crédits:
Autonomisation d’une Activité Économique. PhD thesis, Lille 1, 2009.
David S Evans and Boyan Jovanovic. An estimated model of entrepreneurial choice
under liquidity constraints. The Journal of Political Economy, pages 808–827,
1989.
William N Evans and Robert M Schwab. Finishing High School and Starting Col-
lege: Do Catholic Schools Make a Difference? The Quarterly Journal of Eco-
nomics, 1995.
Mark J Flannery. The faces of market discipline. Journal of Financial Services
Research, 20(2-3):107–119, 2001.
Anne Garceau, Louise Wideroff, Timothy McNeel, Marsha Dunn, and Barry I
Graubard. Population Estimates of Extended Family Structure and Size. Public
Health Genomics, 2008.
B.D. Goldfarb, G Hoberg, D Kirsch, and AJ Triantis. Does Angel Participation
Matter? RH Smith School Research Paper, 2012.
Anna Goodman, Ilona Koupil, and David W Lawson. Low fertility increases de-
scendant socioeconomic position but reduces long-term fitness in a modern post-
industrial society. Proceedings of the Royal Society of London: Biological Sci-
ences, 2012.
Gary B Gorton and George G Pennacchi. Banks and loan sales marketing nonmar-
ketable assets. Journal of monetary Economics, 35(3):389–411, 1995.
William H Greene. Gender Economics Courses in Liberal Arts Colleges: Further
Results. The Journal of Economic Education, 1998.
119

Maia Güell, José Vincente Rodríguez Mora, and Chris Telmer. Intergenerational
Mobility and the Informative Content of Surnames. Discussion paper no. 6316,
CEPR, London.
Isabelle Guérin, Bert D’Espallier, and Govindan Venkatasubramanian. Debt in
Rural South India: Fragmentation, Social Regulation and Discrimination. The
Journal of Development Studies, 2013.
Barton H Hamilton. Does Entrepreneurship Pay? An Empirical Analysis of the
Returns to Self-Employment. Journal of Political economy, 2000.
Keith Hampton, Lauren Sessions Goulet, Lee Rainie, and Kristen Purcell. Social
Networking Sites and Our Lives. Pew Research Center Report, 2011.
Sukjin Han and Edward J Vytlacil. Identification in a Generalization of Bivariate
Probit Models with Endogenous Regressors. Working Paper, 2013.
James J Heckman. Dummy Endogenous Variables in a Simultaneous Equation
System. Econometrica, 1978.
Thomas Hellmann and Veikko Thiele. Friends or Foes? The Interrelationship
Between Angel and Venture Capital Markets. Journal of Financial Economics,
2015.
Thomas Hellmann, Paul Schure, and Dan Vo. Angels and Venture Capitalists:
Complements or Substitutes? Said Business School Working Paper, 2013.
Erik Hurst and Annamaria Lusardi. Liquidity constraints, household wealth, and
entrepreneurship. Journal of political Economy, 112(2):319–347, 2004.
Erik Hurst and Ben Pugsley. The Non Pecuniary Benefits of Small Business Own-
ership. University of Chicago, Working Paper, 2010.
Darian M Ibrahim. Debt as Venture Capital. University of Illinois Law Review,
2010:1169, 2010.
120
Vladimir Ivanov and Scott Bauguess. Capital Raising in the U.S: An Analysis of
Unregistered Offerings Using Regulation D Exemption, 2009-2012. SEC, Divi-
sion of Economic and Risk Analysis, 2013.
Steven N Kaplan and Per Strömberg. Financial Contracting Theory Meets the
Real World: An Empirical Analysis of Venture Capital Contracts. The Review of
Economic Studies, 70(2):281–315, 2003.
William R Kerr. The Ethnic Composition of U.S. Inventors. Harvard Business
School Working Paper, 2008.
William R. Kerr, Josh Lerner, and Antoinette Schoar. The Consequences of En-
trepreneurial Finance: Evidence from Angel Financing. Review of Financial
Studies, January 2014.
Benjamin J Keys, Tanmoy Mukherjee, Amit Seru, and Vikrant Vig. Did securitiza-
tion lead to lax screening? evidence from subprime loans. The Quarterly Journal
of Economics, 125(1):307–362, 2010.
Samuel Lee and Petra Persson. Financing from family and friends. Working Paper,
2013.
Josh Lerner, Antoinette Schoar, Stanislav Sokolinski, and Karen E Wilson. The
Globalisation of Angel Investments. Bruegel Working Paper, 2015.
Frederic Malherbe. Market discipline and securitization. 2010.
Michael Manove, A Jorge Padilla, and Marco Pagano. Collateral versus project
screening: A model of lazy banks. Rand journal of economics, pages 726–744,
2001.
Susanna C Manrubia and Damián H Zanette. At the Boundary Between Biological
and Cultural Evolution: The Origin of Surname Distributions. 2002.
121

José Martí, Susana Menéndez-Requejo, and Olaf M Rottke. The Impact of Venture
Capital on Family Businesses: Evidence from Spain. Journal of World Business,
2013.
Claudio Michelacci and Olmo Silva. Why So Many Local Entrepreneurs? The
Review of Economics and Statistics, 2007.
Danny Miller, Isabelle Le Breton-Miller, Richard H Lester, and Albert A Cannella.
Are Family Firms Really Superior Performers? Journal of Corporate Finance,
2007.
George G Pennacchi. Loan sales and the cost of bank capital. The Journal of
Finance, 43(2):375–396, 1988.
Mitchell A Petersen and Raghuram G Rajan. Does distance still matter? the in-
formation revolution in small business lending. The Journal of Finance, 57(6):
2533–2570, 2002.
Alicia M Robb and David T Robinson. The Capital Structure Decisions of New
Firms. Review of Financial Studies, 2012.
Albert Saiz. The Geographic Determinants of Housing Supply. Quarterly Journal
of Economics, 125(3), 2010.
Antoinette Schoar. The divide between subsistence and transformational en-
trepreneurship. In Innovation Policy and the Economy, Volume 10, pages 57–81.
University of Chicago Press, 2010.
Joseph E Stiglitz. Peer Monitoring and Credit Markets. The World Bank Economic
Review, 1990.
Xuan Tian. The Role of Venture Capital Syndication in Value Creation for En-
trepreneurial Firms. Review of Finance, 2011.
Noam Wasserman. The Founder’s Dilemma. Princeton University Press, 2012.
122

Andrew Y Wong. Angel finance: The Other Venture Capital. Working Paper, 2002.
David L Word, Charles D Coleman, Robert Nunziata, and Robert Kominski. De-
mographic Aspects of Surnames from Census 2000. Unpublished manuscript,
http://citeseerx. ist. psu. edu/viewdoc/download, 2008.
Luana Zaccaria. Are Family and Friends the Wrong Investors? Evidence from U.S.
Start-ups. Working Paper, 2015.
123