Embed Size (px)
DESCRIPTION
The London Mayor’s Cycling Revolution. Keith Gardner, Transport for London IMPACTS Conference, Berlin June 2009. Contents. What is it like cycling in London today? How far have we come? How have we achieve the recent growth? What is our future target? What potential have we identified? - PowerPoint PPT Presentation
Citation preview
The London Mayor’s Cycling Revolution
Keith Gardner, Transport for London
IMPACTS Conference, Berlin
June 2009
2
Contents
• What is it like cycling in London today?
• How far have we come?
• How have we achieve the recent growth?
• What is our future target?
• What potential have we identified?
• What solutions have we identified?
• What gaps still remain?

3
What is it like cycling in London?
• Meet Charles and find out…
4
Contents
• What is it like cycling in London today?
• How far have we come?
• How have we achieve the recent growth?
• What is our future target?
• What potential have we identified?
• What solutions have we identified?
• What gaps still remain?
55
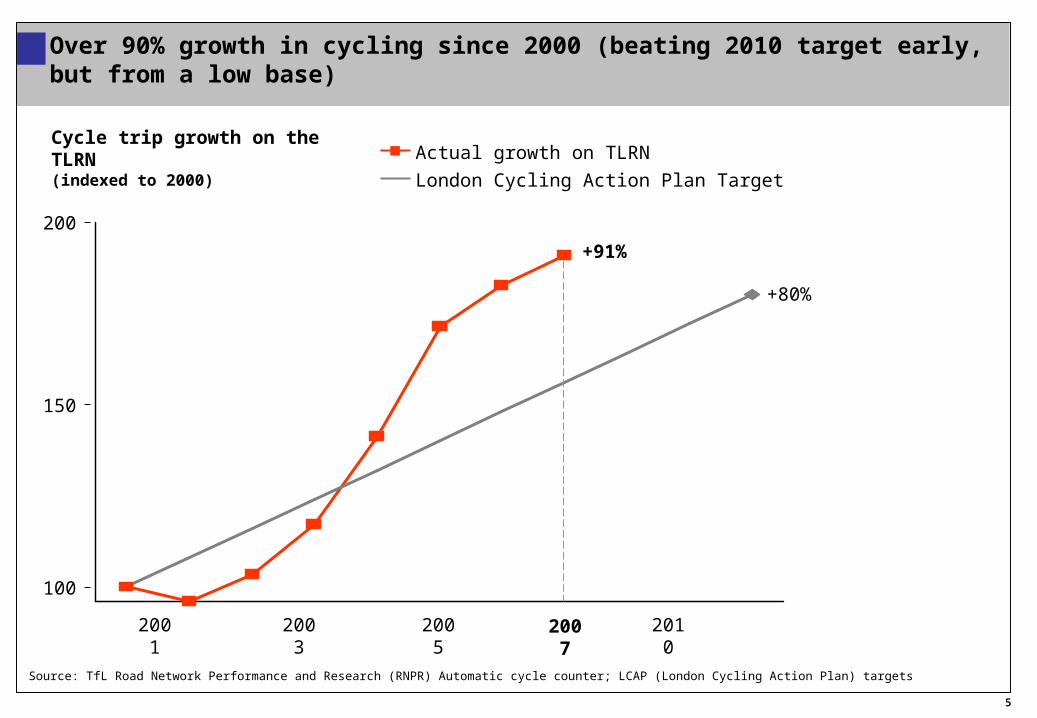
2001 2003 2005
+91%
2007
+80%
2010
Actual growth on TLRN
London Cycling Action Plan Target
100
150
200
Over 90% growth in cycling since 2000 (beating 2010 target early, but from a low base)
Cycle trip growth on the TLRN(indexed to 2000)
Source: TfL Road Network Performance and Research (RNPR) Automatic cycle counter; LCAP (London Cycling Action Plan) targets
6
Contents
• What is it like cycling in London today?
• How far have we come?
• How have we achieved the recent growth?
• What is our future target?
• What potential have we identified?
• What solutions have we identified?
• What gaps still remain?
7
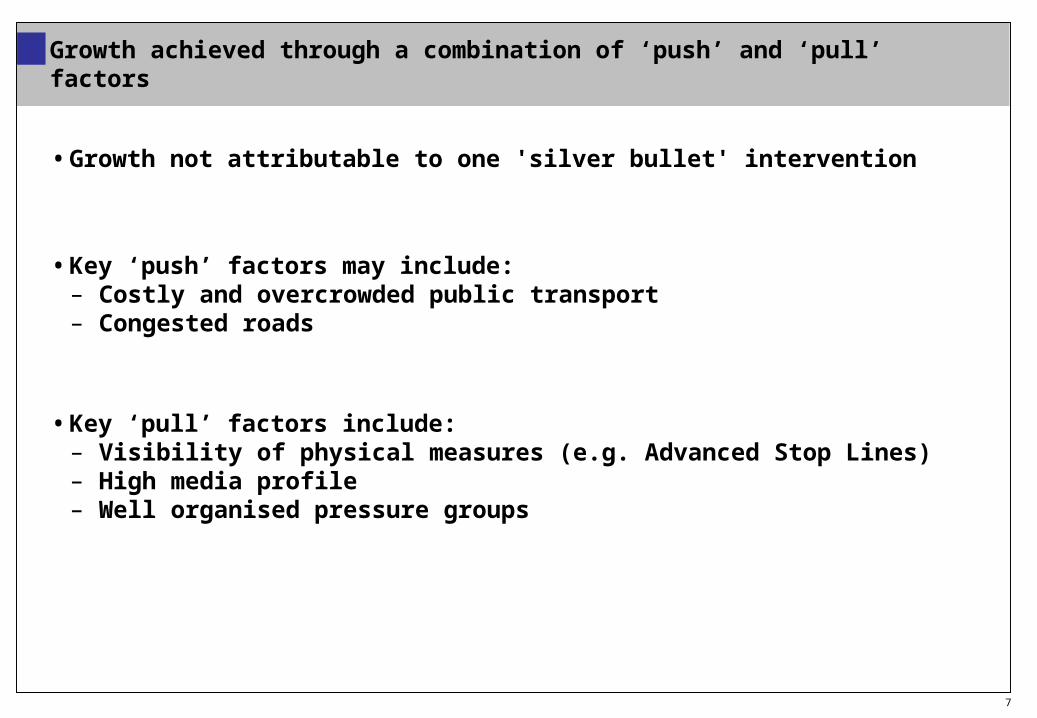
Growth achieved through a combination of ‘push’ and ‘pull’ factors
• Growth not attributable to one 'silver bullet' intervention
• Key ‘push’ factors may include:– Costly and overcrowded public transport– Congested roads
• Key ‘pull’ factors include:– Visibility of physical measures (e.g. Advanced Stop Lines)– High media profile– Well organised pressure groups

88
The London cycling action plan has been a powerful framework for promoting cycling in London
• 10,000 school cycle parking spaces
• Bikeability cycle training
• London cycle guides
• 550km of LCN+ cycle lanes
• Finsbury Park secure cycle parking station
London Cycling Action Plan, 2004
Recent tailing off suggests growth from current interventions may have peaked
9
Contents
• What is it like cycling in London today?
• How far have we come?
• How have we achieved the recent growth?
• What is our future target?
• What potential have we identified?
• What solutions have we identified?
• What gaps still remain?
1010
32% 37%
41%
5%1.2%
22%
45%
2000Mode share
1.6%
21%
32%41%
CurrentMode share
22%
2025Achievable potential
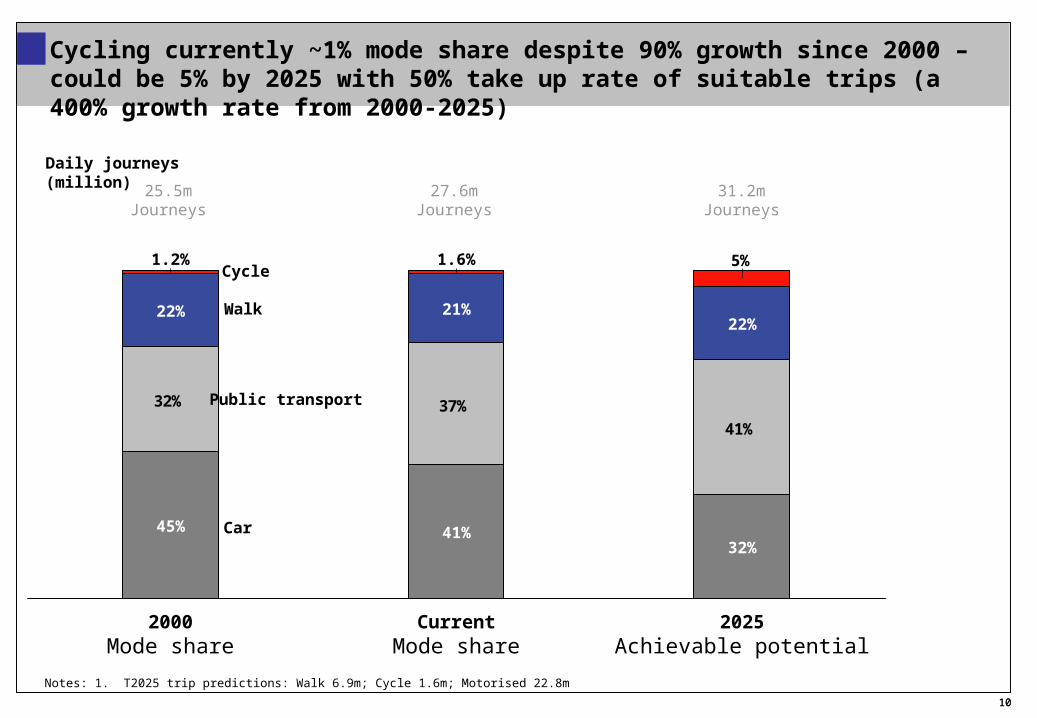
Cycling currently ~1% mode share despite 90% growth since 2000 – could be 5% by 2025 with 50% take up rate of suitable trips (a 400% growth rate from 2000-2025)
31.2mJourneys
Daily journeys (million)
Notes: 1. T2025 trip predictions: Walk 6.9m; Cycle 1.6m; Motorised 22.8m
25.5mJourneys
27.6mJourneys
Cycle
Walk
Public transport
Car
1111
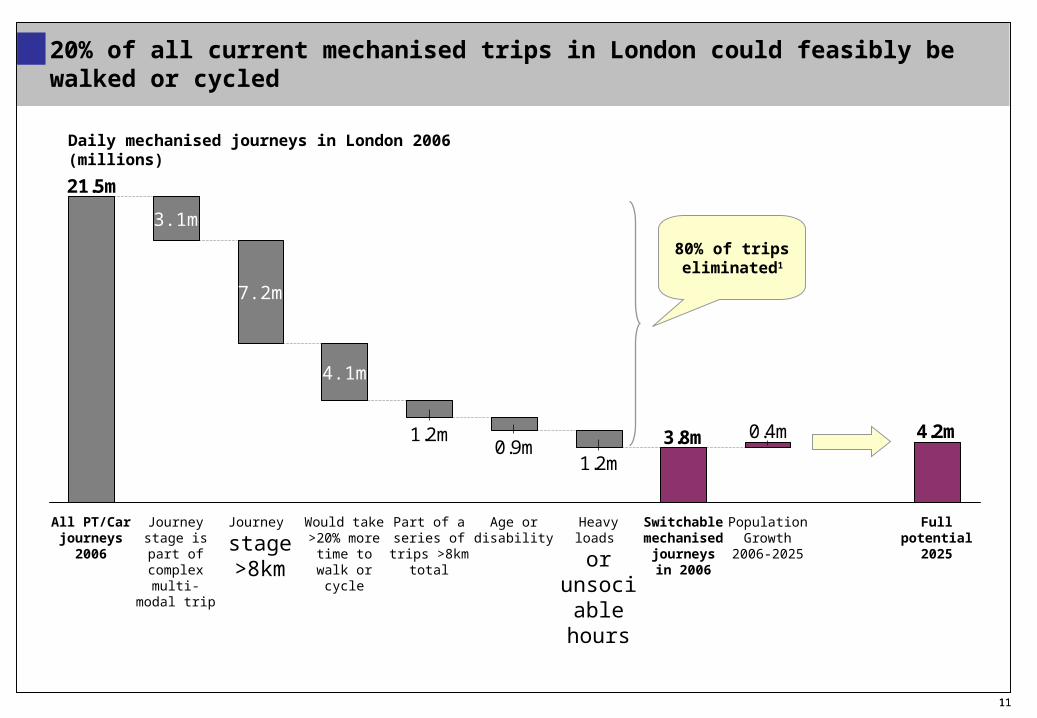
Daily mechanised journeys in London 2006 (millions)
1.5
4.2m0.4m3.8m1.2m
0.9m1.2m
21.5m
3.1m
Full potential 2025
Journey stage is part of complex
multi-modal trip
All PT/Car journeys
2006
7.2m
Journey
stage >8km
4.1m
Would take >20% more time to walk
or cycle
Part of a series of trips
>8km total
Age or disability
Heavy loads
orunsocia
ble hours
Switchable mechanised journeys in
2006
Population Growth 2006-
2025
80% of trips eliminated1
20% of all current mechanised trips in London could feasibly be walked or cycled
12
1960 1970 1980 1990 20000%
20%
40%
60%
80%
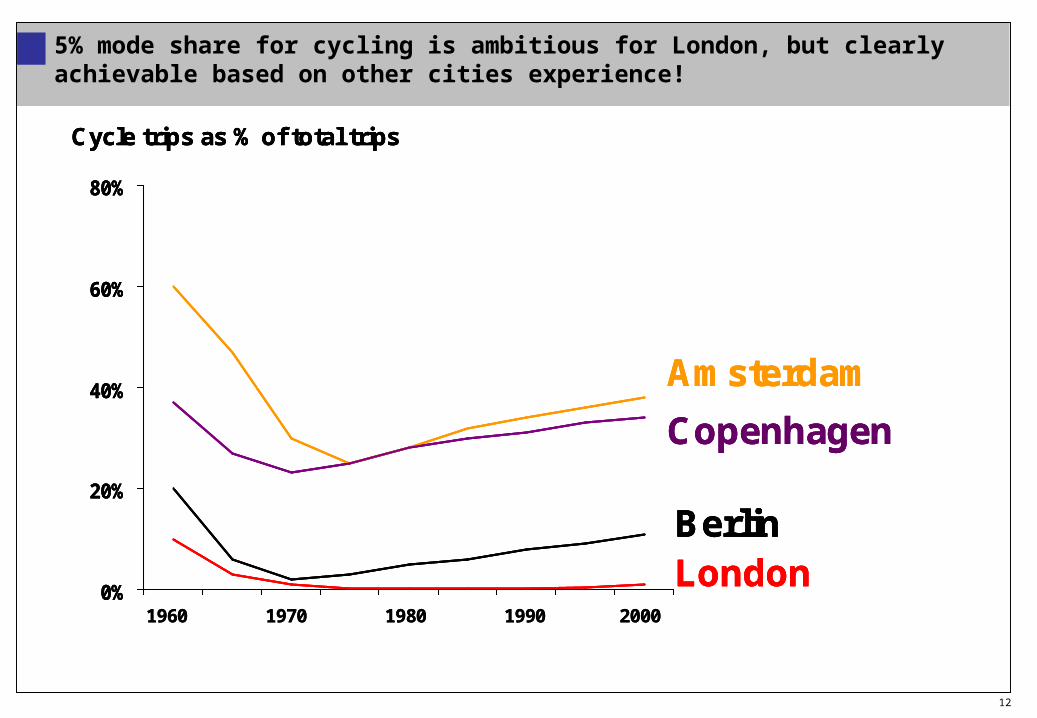
Cycle trips as % of total trips
Amsterdam
Copenhagen
BerlinLondon
1960 1970 1980 1990 20000%
20%
40%
60%
80%
Cycle trips as % of total trips
Amsterdam
Copenhagen
BerlinLondon0%
20%
40%
60%
80%
Cycle trips as % of total trips
Amsterdam
Copenhagen
BerlinLondon
5% mode share for cycling is ambitious for London, but clearly achievable based on other cities experience!

13
Contents
• What is it like cycling in London today?
• How far have we come?
• How have we achieved the recent growth?
• What is our future target?
• What potential have we identified?
• What solutions have we identified?
• What gaps still remain?
14
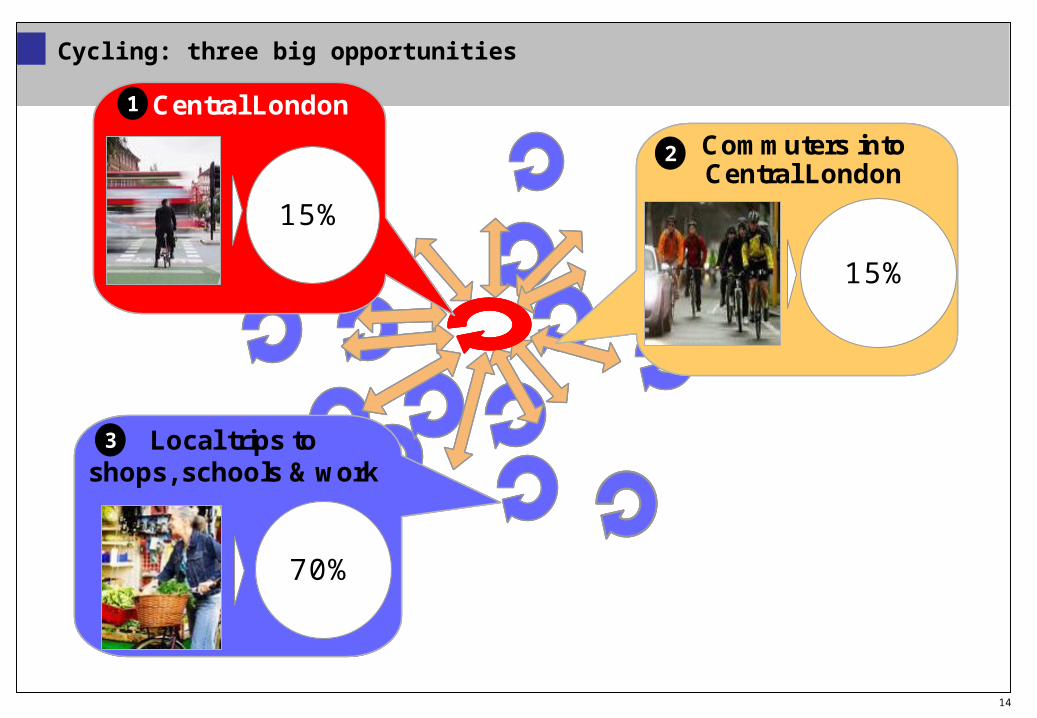
Cycling: three big opportunities
Local trips toshops, schools & work
70%
3
2 Commuters intoCentral London
15%
1 Central London
15%
Local trips toshops, schools & work
70%
3 Local trips toshops, schools & work
70%
3 Local trips toshops, schools & work
70%
3
2 Commuters intoCentral London
15%
2 Commuters intoCentral London
15%
2 Commuters intoCentral London
15%
1 Central London
15%
1 Central London
15%
1 Central London
15%
15
Contents
• What is it like cycling in London today?
• How far have we come?
• How have we achieved the recent growth?
• What is our future target?
• What potential have we identified?
• What solutions have we identified?
• What gaps still remain?
16
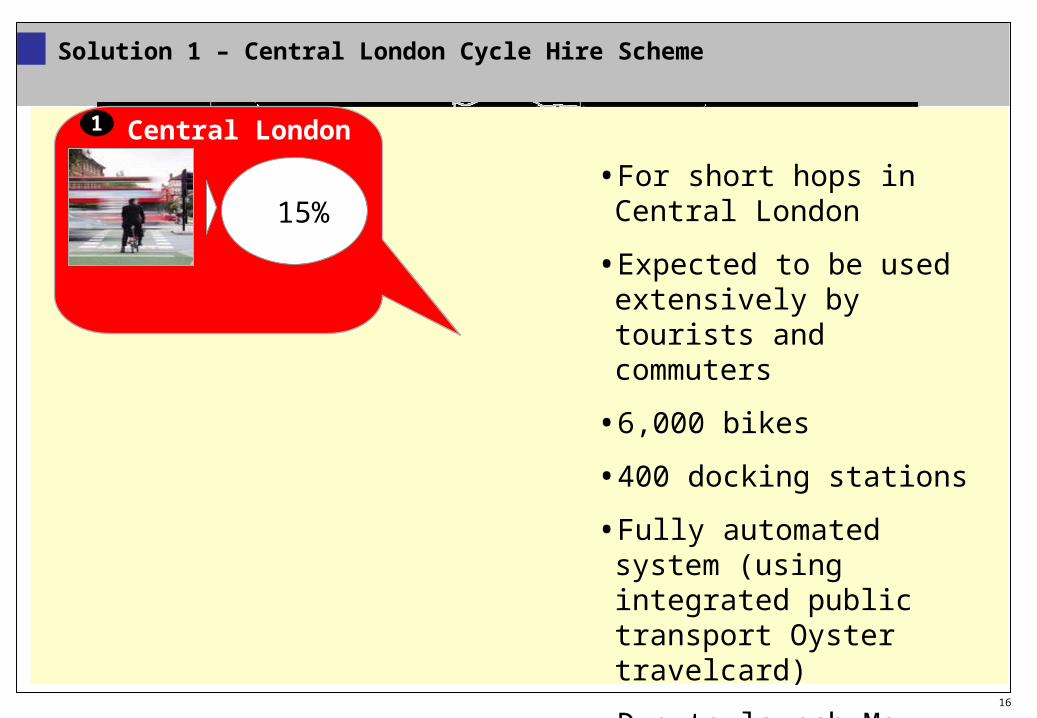
Solution 1 – Central London Cycle Hire Scheme
1 Central London
15%• For short hops in Central
London
• Expected to be used extensively by tourists and commuters
• 6,000 bikes
• 400 docking stations
• Fully automated system (using integrated public transport Oyster travelcard)
• Due to launch May 2010
17
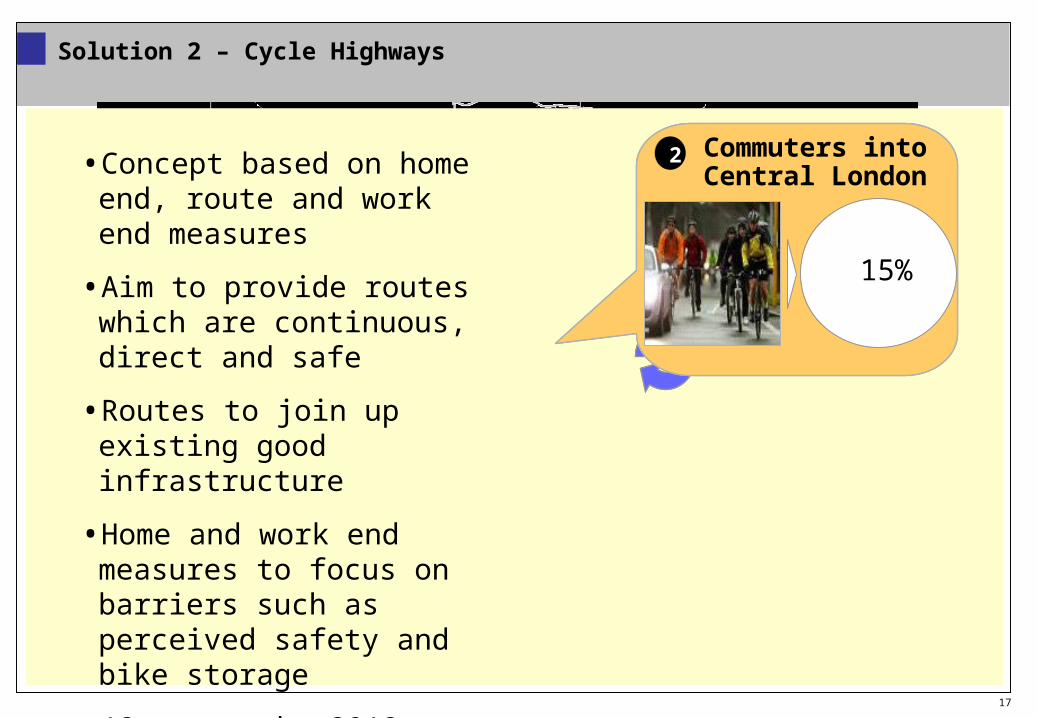
Solution 2 – Cycle Highways
2 Commuters intoCentral London
15%
33
2 Commuters intoCentral London
15%
2 Commuters intoCentral London
15%
2 Commuters intoCentral London
15%
• Concept based on home end, route and work end measures
• Aim to provide routes which are continuous, direct and safe
• Routes to join up existing good infrastructure
• Home and work end measures to focus on barriers such as perceived safety and bike storage
• 12 routes by 2012, first 2 by May 2010
18
Contents
• What is it like cycling in London today?
• How far have we come?
• How have we achieved the recent growth?
• What is our future target?
• What potential have we identified?
• What solutions have we identified?
• What gaps still remain?
19
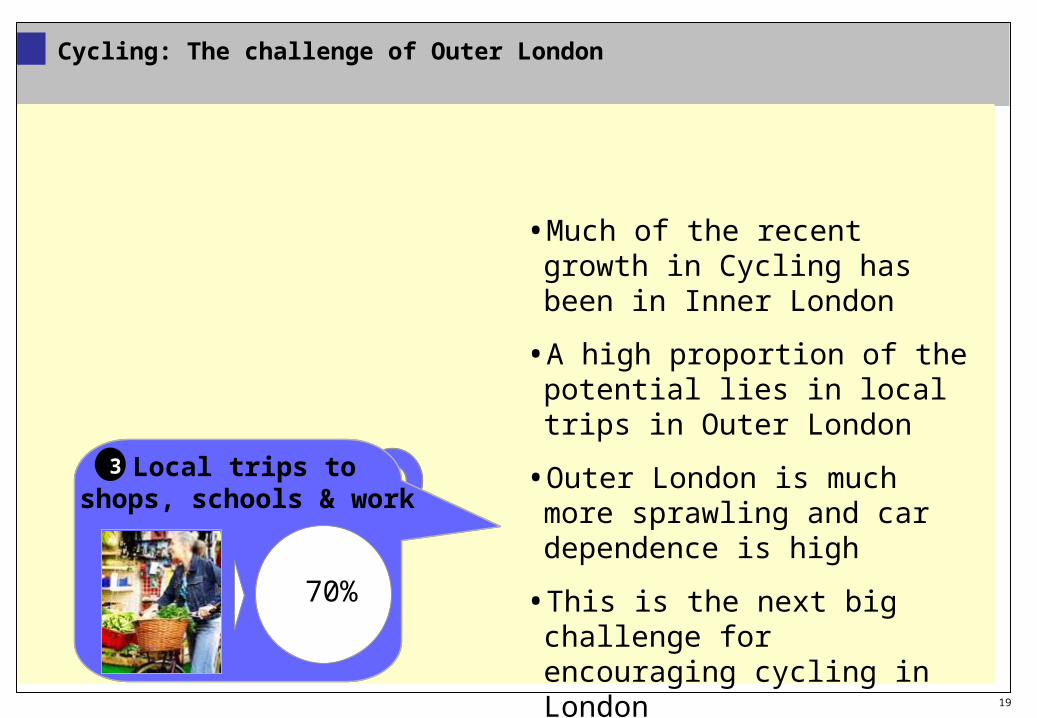
Cycling: The challenge of Outer London
Local trips toshops, schools & work
70%
3
2 Commuters intoCentral London
15%
1 Central London
15%
2 Commuters intoCentral London
15%
2 Commuters intoCentral London
15%
2 Commuters intoCentral London
15%
1 Central London
15%
1 Central London
15%
1 Central London
15%
Local trips toshops, schools & work
70%
3 Local trips toshops, schools & work
70%
3 Local trips toshops, schools & work
70%
3
• Much of the recent growth in Cycling has been in Inner London
• A high proportion of the potential lies in local trips in Outer London
• Outer London is much more sprawling and car dependence is high
• This is the next big challenge for encouraging cycling in London

20
Any Questions?