Embed Size (px)
Citation preview

Copyright © 2019 Aon Hewitt Limited. All rights reserved. aon.com Aon Hewitt Limited is authorised and regulated by the Financial Conduct Authority. Registered in England & Wales No. 4396810 Registered office: The Aon Centre | The Leadenhall Building | 122 Leadenhall Street | London | EC3V 4AN This report and any enclosures or attachments are prepared on the understanding that it is solely for the benefit of the addressee(s). Unless the Scheme Actuary or Aon Hewitt provide express prior written consent no part of this report should be reproduced, distributed or communicated to anyone else and, in providing this report, the Scheme Actuary and Aon Hewitt do not accept or assume any responsibility for any other purpose or to anyone other than the addressee(s) of this report.
Financial assumptions
Actuarial valuation
Actuarial valuation at 31 March 2019 - Assumptions Advice The London Borough of Enfield Pension Fund
Prepared for The London Borough of Enfield, as Administering Authority to The London Borough of Enfield Pension Fund
Prepared by Jonathan Teasdale FIA Laura Caudwell FIA
Date 3 June 2019
Actuarial Valuation as at 31 March 2019 – Financial Assumptions Advice
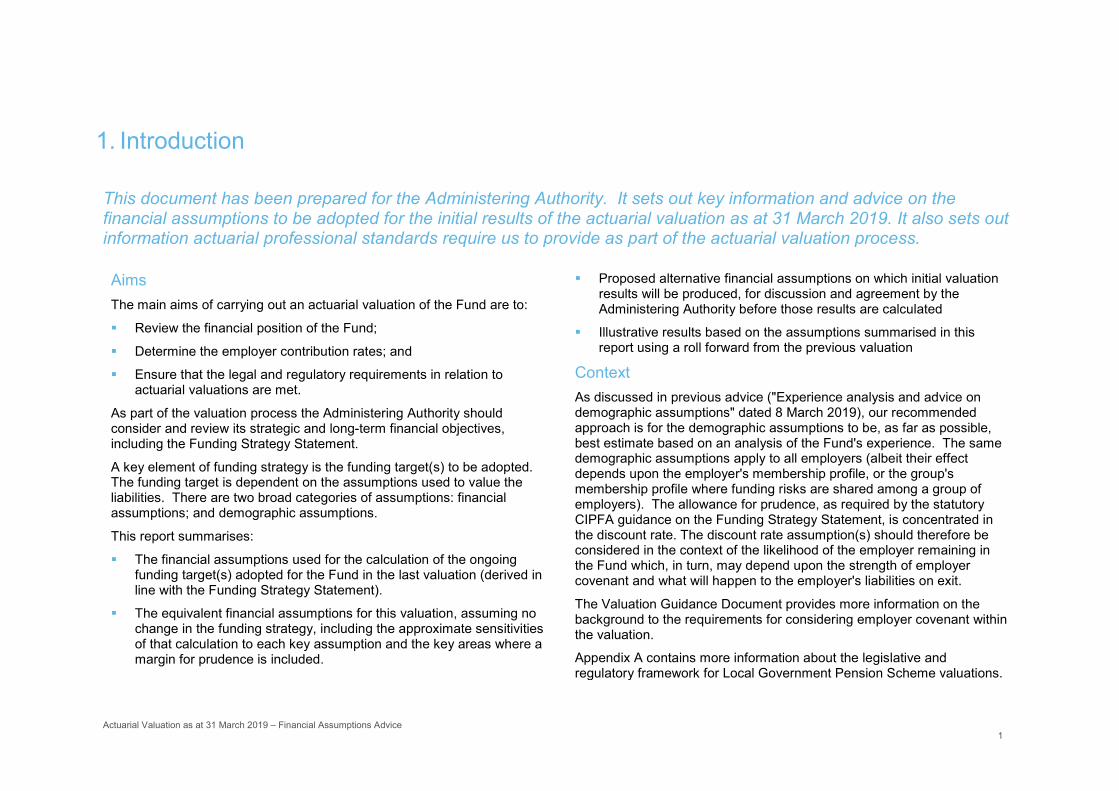
Executive summary
This document provides advice in relation to the assumptions to be used for the actuarial valuation of the London Borough of Enfield Pension Fund (the "Fund") as at 31 March 2019 and summarises any recommended changes to the current funding strategy as set out in the Funding Strategy Statement. The table below summarises our proposed financial assumptions and should be read in conjunction with the important information set out in the main body of this document.
The demographic assumptions have already been considered based on an analysis of the Fund membership's experience to 31 March 2018 and other factors as set out in previous advice papers ("Experience analysis and advice on demographic assumptions" dated 8 March 2019 and "Longevity Analysis using Demographic HorizonsTM" dated 7 March 2019). For completeness a summary of the demographic assumptions is included in Appendix C to this paper.
Last valuation Updated for this valuation
Reason for change Approximate Sensitivity
Discount rate – main scheduled bodies
4.5% pa
Based on a probability of funding success of 69%
4.7% pa
Based on a probability of funding success of 69%
Or
4.4% pa
Based on a probability of funding success of 74%
Changes reflect:
changes in Capital Market Assumptions;
the movement in financial markets;
change to the long-term solvency target and simplification of
calculation method;
and:
a reduction in the level of funding risk, i.e. an increase to the
probability of funding success, if 74% chosen
Increase in past service liabilities of around 4.5% for each 0.25% pa decrease.
Future service rate increase of around 1.5% of pay for each 0.25% of decrease
(equivalent to a reduction in the probability of funding
success of 6%).

Actuarial Valuation as at 31 March 2019 – Financial Assumptions Advice
Last valuation Updated for this valuation
Reason for change Approximate Sensitivity
In-Service Discount rate – ongoing orphan funding target
4.1% pa
Gilt yield (single rate based on duration of the
Fund’s liabilities) plus 2.0% pa
3.3% pa
Gilt yield (single rate based on duration of the
Fund’s liabilities) plus 2.0% pa
Change reflects change in underlying gilt yields
It should be noted there were no employers on this funding target in the 2016 valuation.
Increase in past service liabilities by around 1.0% (in
service) and 3.5% (left service) for each 0.25% pa decrease, for an employer
with same membership profile as the Fund as a whole.
The actual figures will depend on the maturity of the
employers subject to this funding target which can be
quite different in nature to the whole Fund.
Left-Service Discount rate – ongoing orphan funding target
2.5% pa
Gilt yield (single rate based on duration of the
Fund’s liabilities) plus 0.4% pa
1.6% pa
Gilt yield (single rate based on duration of the
Fund’s liabilities) plus 0.3% pa
Reflects fall in gilt yields and fall in assumed increase in future gilt yields.
RPI Inflation 3.1% pa
Long-term best-estimate view of inflation
3.2% pa
Long-term best-estimate view of inflation
Reflects change in Aon's best-estimate of future inflation over the next 30
years.
See CPI Inflation sensitivity for the approximate impact of
changing the inflation assumption.
CPI Inflation 2.0% pa
RPI Inflation less 1.1% pa
2.1% pa
RPI Inflation less 1.1% pa
Changed to reflect change in RPI above.
Aon’s best-estimate of the future difference over the next 30 years
between RPI and CPI is unchanged.
Increase in past service liabilities of around 3.75% for
each 0.25% pa increase (assuming pay increase
assumption does not change with inflation, but pension
increases do change).

Actuarial Valuation as at 31 March 2019 – Financial Assumptions Advice
Last valuation Updated for this valuation
Reason for change Approximate Sensitivity
Future service rate increase of 1.5% of pay for each
0.25% of increase.
Pay increases
3.5% pa plus promotional increases
CPI plus 1.5% pa, plus promotional increases
3.6% pa plus promotional increases
CPI plus 1.5% pa, plus promotional increases
No change other than the movement in the CPI Inflation assumption
Decrease in past service liabilities of around 0.75% for
each 0.25% pa decrease.
No impact on future service rate
Pension Increases, deferred revaluation and rate of revaluation of pension accounts
2.0% pa
Consistent with CPI Inflation assumption
2.1% pa
Consistent with CPI Inflation assumption
No change other than the movement in the CPI Inflation assumption
Allowed for in CPI Inflation sensitivity figures
Increases in Post 88 GMPs in payment
1.8% pa
Consistent with CPI inflation assumption,
allowing for a maximum increase of 3.0%
1.9% pa
Consistent with CPI inflation assumption,
allowing for a maximum increase of 3.0%
No change other than the movement in CPI inflation.
Changing this assumption is unlikely to have a material impact on the past service
liabilities as GMPs represent only a fairly small proportion of the past service liabilities.
Expenses 0.5% of pay 0.7% of pay
Updated to allow for Fund expenses from the 2017 and 2018 published fund accounts and the 2019 draft
accounts
No effect on past service liabilities

Actuarial Valuation as at 31 March 2019 – Financial Assumptions Advice
Last valuation Updated for this valuation
Reason for change Approximate Sensitivity
Demographic assumptions
Please see Appendix D. We have made several changes to the demographic assumptions. These include updating the mortality assumptions to reflect revised base tables, scaling factors and updating the future mortality improvements table to
recommend the CMI 2018 table. We have also slightly refined our retirement age assumptions, assumptions about the rate of withdrawal of active members and the rate at which people take ill-health retirement.
The main body of this paper explains the rationale for the proposed assumptions, including any recommended changes.
We set out later in this report approximate projected results as at 31 March 2019 based on the proposals in this document, and the demographic assumptions previously discussed with the administering authority for the 2019 valuation of the Fund. We also show illustrative figures based on adopting a different (higher) probability of funding success, as requested by the administering authority.
The figures are illustrative based on an approximate roll-forward of the 2016 valuation of the Fund using the same methodology as adopted for our approximate quarterly funding updates, but with adjustments to reflect the expected effect of proposed changes to the demographic assumptions and the approximate Fund pensionable pay experience (estimated based on contributions paid in fund accounts). The actual 2019 valuation results could be significantly different to these illustrative figures and the Administering Authority should take care when making any decisions regarding the specific valuation assumptions to be adopted.
The funding target applicable to each employer at the 2016 valuation was set out in our letter dated 27 March 2017 which accompanied the final valuation report. The Administering Authority should indicate, within the completed Valuation Information Model, the funding target which should apply to each employer for the purpose of the initial valuation results.

Actuarial Valuation as at 31 March 2019 – Financial Assumptions Advice
Contents 1. Introduction 1
2. Funding targets and setting the discount rate 2
3. Pay and price (pension) increase assumptions 7
4. Projected results for the Fund 10
Appendix A – Background to the valuation 14
Appendix B – Capital Market Assumptions (CMAs) 15
Appendix C: Asset split used for discount rate calculations 16
Appendix D: Summary of proposed demographic assumptions 17
Limitations of advice 24
Report framework 25
Actuarial Valuation as at 31 March 2019 – Financial Assumptions Advice 1
1. Introduction
This document has been prepared for the Administering Authority. It sets out key information and advice on the financial assumptions to be adopted for the initial results of the actuarial valuation as at 31 March 2019. It also sets out information actuarial professional standards require us to provide as part of the actuarial valuation process.
Aims The main aims of carrying out an actuarial valuation of the Fund are to:
Review the financial position of the Fund;
Determine the employer contribution rates; and
Ensure that the legal and regulatory requirements in relation to actuarial valuations are met.
As part of the valuation process the Administering Authority should consider and review its strategic and long-term financial objectives, including the Funding Strategy Statement.
A key element of funding strategy is the funding target(s) to be adopted. The funding target is dependent on the assumptions used to value the liabilities. There are two broad categories of assumptions: financial assumptions; and demographic assumptions.
This report summarises:
The financial assumptions used for the calculation of the ongoing funding target(s) adopted for the Fund in the last valuation (derived in line with the Funding Strategy Statement).
The equivalent financial assumptions for this valuation, assuming no change in the funding strategy, including the approximate sensitivities of that calculation to each key assumption and the key areas where a margin for prudence is included.
Proposed alternative financial assumptions on which initial valuation results will be produced, for discussion and agreement by the Administering Authority before those results are calculated
Illustrative results based on the assumptions summarised in this report using a roll forward from the previous valuation
Context As discussed in previous advice ("Experience analysis and advice on demographic assumptions" dated 8 March 2019), our recommended approach is for the demographic assumptions to be, as far as possible, best estimate based on an analysis of the Fund's experience. The same demographic assumptions apply to all employers (albeit their effect depends upon the employer's membership profile, or the group's membership profile where funding risks are shared among a group of employers). The allowance for prudence, as required by the statutory CIPFA guidance on the Funding Strategy Statement, is concentrated in the discount rate. The discount rate assumption(s) should therefore be considered in the context of the likelihood of the employer remaining in the Fund which, in turn, may depend upon the strength of employer covenant and what will happen to the employer's liabilities on exit.
The Valuation Guidance Document provides more information on the background to the requirements for considering employer covenant within the valuation.
Appendix A contains more information about the legislative and regulatory framework for Local Government Pension Scheme valuations.

Actuarial Valuation as at 31 March 2019 – Financial Assumptions Advice 2
2. Funding targets and setting the discount rate
Our recommendation is that the Administering Authority continues to adopt a risk-based approach to setting the funding strategy for the long-term secure employers, with stronger funding targets applied to less secure or shorter-term employers, to help achieve the right balance between risk and cost for the Fund given employer circumstances.
We propose to set the valuation assumptions to be 'best estimate' assumptions with the sole exception of the discount rate, which we propose is tailored to give the appropriate level of risk (or prudence) chosen by the Administering Authority. This is the same approach as adopted for the previous valuation of the Fund.
Long-term secure scheduled bodies The long-term secure scheduled bodies make up the majority of the Fund's liabilities. Under the recommended approach the Administering Authority needs to make three key decisions:
1. Solvency Target
This is the long-term level of funding the Fund is aiming to achieve.
2. Trajectory Period
To the extent that the Fund is not currently fully funded on the solvency target, this is the period over which the Administering Authority is aiming to reach that target.
3. Probability of Funding Success
To the extent that different paths can be taken to reach solvency, with differing levels of risk and cost, this determines the level of risk and hence the balance between risk and cost.
Once these key decisions are made, the Funding Target (and hence the discount rate) is determined as the level of assets required at the valuation date such that the Solvency Target is expected to be met by the end of the Trajectory Period with the required Probability of Funding Success, assuming the assumed investment strategy remains unchanged throughout the Trajectory Period.
To the extent that there is a shortfall relative to the Funding Target at the valuation date, there will be a need to agree deficit contributions over an agreed recovery period.
Solvency Target (Secure Scheduled Bodies) For long term secure scheduled bodies and bodies with a subsumption commitment from a secure scheduled body, we recommend that the solvency target be set to be 100% funded on a suitably prudent basis.
At the 2013 and 2016 valuations, in order to establish the solvency target the Probability of Maintaining Solvency was defined such that if the Fund is:
100% funded at the point that solvency is first reached (i.e. the end of the Trajectory Period) and
subject to economic conditions predicted by our Capital Market Assumptions
the Probability of Maintaining Solvency is the chance that it will be 100% funded or better at the end of a further appropriate long-term period

Actuarial Valuation as at 31 March 2019 – Financial Assumptions Advice 3
(set to be 25 years). At the 2016 valuation of the Fund the solvency target was set such that the Probability of Maintaining Solvency was 80%. For the 2019 valuation of the Fund we propose to simplify our approach to remove the additional modelling undertaken for the Solvency Target. In addition, rather than assume the Fund's current strategic asset allocation is retained indefinitely after the end of the Trajectory Period we have set the Solvency Target based on a long-term prudent investment return of CPI plus 2% p.a. Our assumption is that a long-term rate of CPI of 2% p.a. is reasonable given it is in line with the Bank of England's inflation target, giving a long-term solvency discount rate of 4%. We believe this is a prudent allowance for long-term investment returns for the Fund based on a long-term investment strategy that allows for continued investment in a mix of growth and matching assets intended to deliver a return above the rate of increases in pensions and pension accounts (CPI). 4% is not dissimilar to the solvency discount rates derived at the previous valuation and over the intervaluation period.
Trajectory Period (Secure Scheduled Bodies) This is the period from the valuation date over which the Fund aims to achieve the Solvency Target. At the 2016 valuation we set this period equal to 25 years. The Trajectory Period is a period over which it is considered to be appropriate for long term secure employers to aim to achieve their solvency target, set across those bodies collectively. It does not vary by employer and we would not necessarily expect this to change at each valuation. We propose that this is retained at 25 years for the 2019 valuation. It should be noted that shortening the Trajectory Period would be likely to lead to greater volatility in the discount rate (since the Trajectory Period is the period over which we model the Probability of Funding Success and the Fund predominantly invests in growth assets whose value can be volatile, particularly in the short-term). The Trajectory Period is different to the Recovery Period and the Administering Authority can and should review the Recovery Period at each valuation.
Probability of Funding Success (Secure Scheduled Bodies) The Probability of Funding Success is the selected chance of achieving the Solvency Target at the end of the Trajectory Period. It will determine the level of the Funding Target (and hence the discount rate and the level of prudence in the valuation basis), and therefore the required level of contribution to the Fund emerging from the valuation.
Our calculation approach makes a number of simplifications/approximations, and this may mean that the Probability of Funding Success does not exactly correspond to the probability of actually reaching full funding on the Solvency Target by the end of the Trajectory Period.
The higher the Probability of Funding Success, the higher the funding target (and hence the more prudent the discount rate), and the higher the level of contributions required. At the 2016 valuation of the Fund the Probability of Funding Success was chosen by the Administering Authority to be 69%. For the purposes of our calculations we have assumed that the asset allocation adopted (see Appendix C) is retained throughout the Trajectory Period.
Capital Market Assumptions The Solvency Target and Probability of Funding Success are evaluated using our Capital Market Assumptions (CMAs). The CMAs are Aon's asset class return, volatility and correlation assumptions. The return assumptions are best estimates of annualised returns, by which we mean annualised median returns.
That is, there is a 50% chance that actual returns will be above or below the assumptions. The assumptions are long-term assumptions, based on 25 year projection periods and are updated on a quarterly basis. Further detail on the CMAs are included in Appendix B.

Actuarial Valuation as at 31 March 2019 – Financial Assumptions Advice 4
Setting the discount rate for scheduled bodies At the 2016 valuation a single discount rate of 4.5% pa was used for scheduled bodies – based on a Probability of Funding Success of 69%.
If the approach described above is used as at 31 March 2019 based on the same Probability of Funding Success, then the discount rate would be 4.7% pa.
For comparison, our determination of the expected return on the assets (using the same asset allocation as used for the discount rate calculation) over 25 years is 6.1%.
This is based on the CMAs as at 31 March 2019 and allows for the liability profile of the Fund at the last valuation date and the asset allocation of the Fund as set out in Appendix C. The asset allocation has been taken from the long term asset allocation which was approved by the Pension Policy and Investment Committee in the 2018 review of the investment strategy of the fund. This is set out in Aon's paper titled 'Linking investment strategy and the valuation of liabilities' dated 26 June 2018. We understand that the Administering Authority wishes to investigate the impact of increasing the Probability of Funding Success. We have shown the impact of an increase of 5% to 74% in the projected results for the Fund set out in section 4.
The table below shows the sensitivity of the past service liabilities to changes in the discount rate.
Change to assumption Approximate impact on
past service liabilities
Approximate impact on
future service
Discount rate reduced by 0.25% pa
↑ by 4.5% ↑ by 1.5% pay
Discount rate increased by 0.25% pa
↓ by 4.5% ↓ by 1.5% pay
Setting the discount rate for Ongoing Orphan bodies 'Ongoing Orphan bodies' refers to certain admission bodies which may exit the Fund at some future point in time and where, once any liability on exit has been paid, it is expected that the Administering Authority will have no access to future contributions from that employer, or any other ongoing employer in the Fund, should a deficiency emerge in future, i.e. the liabilities will become orphan.
The discount rate for Ongoing Orphan bodies continues to be determined based on the assumed investment strategy before and after exit, rather than based on the Probability of Funding Success. As per the Funding Strategy Statement, for such bodies the assumed investment strategy is UK Government bonds (gilts) so the discount rate in relation to the period after assumed exit would then reflect market yields on gilts.
Previous valuation At the 2016 valuation the following discount rates were agreed for any employers subject to the Ongoing Orphan funding target, although the administering authority determined that there were no employers at that time which should be subject to that funding target at the valuation date:
In-service discount rate of 4.1% pa
Left-service discount rate of 2.5% pa
The in-service discount rate was set to be 2.0% above the long-term gilt yield at the valuation date. The left-service discount rate made some allowance for Aon's expectations of future increases in long term gilt yields over the 5 years following the valuation date, leading to an increase in the discount rate of 0.4% compared to prevailing gilt yields of 2.1% p.a.
Actuarial Valuation as at 31 March 2019 – Financial Assumptions Advice 5
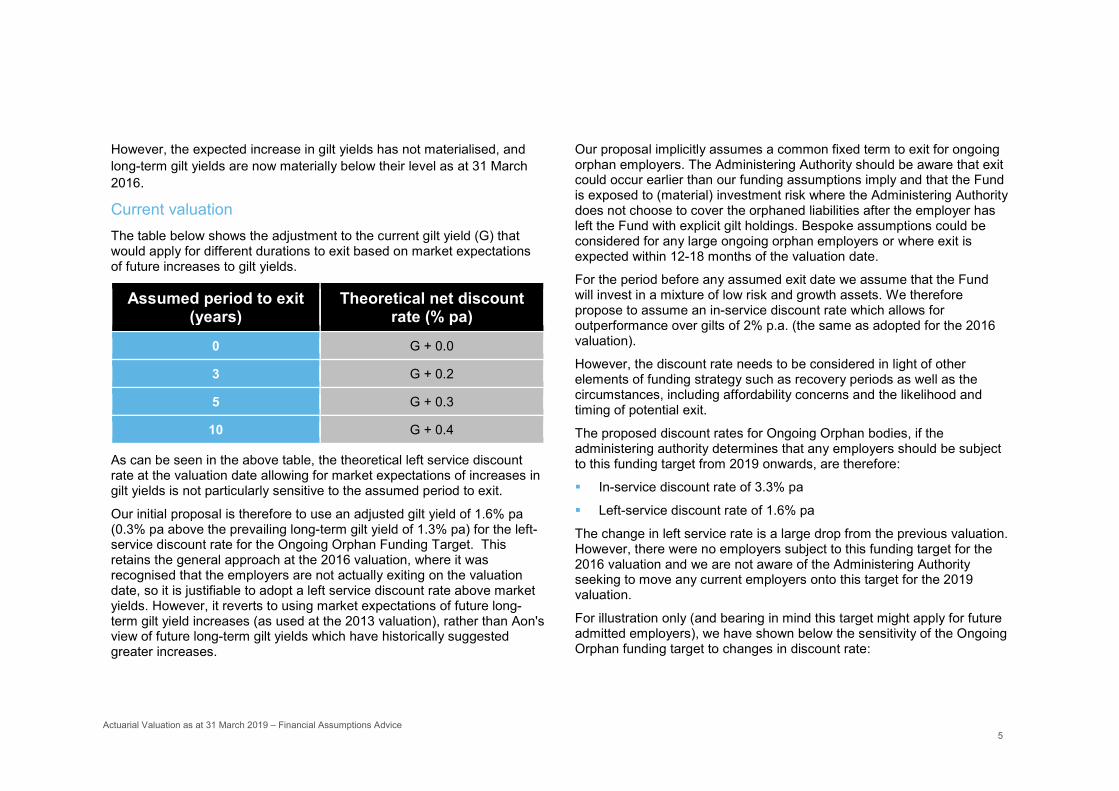
However, the expected increase in gilt yields has not materialised, and long-term gilt yields are now materially below their level as at 31 March 2016.
Current valuation The table below shows the adjustment to the current gilt yield (G) that would apply for different durations to exit based on market expectations of future increases to gilt yields.
Assumed period to exit (years)
Theoretical net discount rate (% pa)
0 G + 0.0
3 G + 0.2
5 G + 0.3
10 G + 0.4
As can be seen in the above table, the theoretical left service discount rate at the valuation date allowing for market expectations of increases in gilt yields is not particularly sensitive to the assumed period to exit.
Our initial proposal is therefore to use an adjusted gilt yield of 1.6% pa (0.3% pa above the prevailing long-term gilt yield of 1.3% pa) for the left-service discount rate for the Ongoing Orphan Funding Target. This retains the general approach at the 2016 valuation, where it was recognised that the employers are not actually exiting on the valuation date, so it is justifiable to adopt a left service discount rate above market yields. However, it reverts to using market expectations of future long- term gilt yield increases (as used at the 2013 valuation), rather than Aon's view of future long-term gilt yields which have historically suggested greater increases.
Our proposal implicitly assumes a common fixed term to exit for ongoing orphan employers. The Administering Authority should be aware that exit could occur earlier than our funding assumptions imply and that the Fund is exposed to (material) investment risk where the Administering Authority does not choose to cover the orphaned liabilities after the employer has left the Fund with explicit gilt holdings. Bespoke assumptions could be considered for any large ongoing orphan employers or where exit is expected within 12-18 months of the valuation date.
For the period before any assumed exit date we assume that the Fund will invest in a mixture of low risk and growth assets. We therefore propose to assume an in-service discount rate which allows for outperformance over gilts of 2% p.a. (the same as adopted for the 2016 valuation).
However, the discount rate needs to be considered in light of other elements of funding strategy such as recovery periods as well as the circumstances, including affordability concerns and the likelihood and timing of potential exit.
The proposed discount rates for Ongoing Orphan bodies, if the administering authority determines that any employers should be subject to this funding target from 2019 onwards, are therefore:
In-service discount rate of 3.3% pa
Left-service discount rate of 1.6% pa
The change in left service rate is a large drop from the previous valuation. However, there were no employers subject to this funding target for the 2016 valuation and we are not aware of the Administering Authority seeking to move any current employers onto this target for the 2019 valuation.
For illustration only (and bearing in mind this target might apply for future admitted employers), we have shown below the sensitivity of the Ongoing Orphan funding target to changes in discount rate:

Actuarial Valuation as at 31 March 2019 – Financial Assumptions Advice 6
Change to assumption
Approximate impact on immature
employer (1)
Approximate impact on
mature employer (2)
In service discount rate reduced by 0.25% pa
↑ by 4.5% (past service), 1% pay (future service)
↑ by 0.5% (past service), 0.75% pay
(future service)
Left service discount rate reduced by 0.25% pa
↑ by 3% (past service), 1% pay (future service)
↑ by 3.25% (past service), 1% pay (future service)
(1) Employer with only active members, average age of membership 40 years old
(2) Employer with 33% active membership, average age of actives 55 years old

Actuarial Valuation as at 31 March 2019 – Financial Assumptions Advice 7
3. Pay and price (pension) increase assumptions
This section sets out our recommendations for the pay, pension increase, and rate of revaluation of pension accounts assumptions for the valuation. Further information on how our recommendations are derived are set out in the Valuation Guidance Document.
For the LGPS assumptions are required for:
Increases to pensions in payment;
Increases to pensions in deferment;
Revaluation of pension accounts before retirement;
Increases to Guaranteed Minimum Pensions in payment and
Increases to Guaranteed Minimum Pensions in deferment.
These increases are linked to increases in the Consumer Prices Index (CPI), so we first need to propose an assumption for increases in the CPI.
There is a well-established RPI-linked investment market, but not for CPI-linked investments, so it makes sense for us first to establish a proposal for increases in the Retail Prices Index (RPI). In practice we set our RPI inflation assumptions equal to our best estimate view of inflation based on the CMAs using consensus forecasts.
We can separately deduce a relationship between CPI and RPI increases and from that relationship derive an assumption for CPI increases.
RPI increase assumption At the previous valuation, the RPI inflation rate assumption was set equal to our best estimate view of inflation based on the CMAs. We propose to adopt the same approach for the 2019 valuation. This leads to an assumption for increases in RPI of 3.2% pa.
The Valuation Guidance Document sets out more information on the key measures of future expectation of RPI.
Setting the assumption for increases in CPI Our best estimate of the difference between RPI and CPI for the current valuation is 1.1% pa, the same difference as at the last valuation. This leads to an assumption for the increase in CPI of 2.1% pa.
The Valuation Guidance Document (issued on 8 March 2019) sets out more information on the differences between RPI and CPI inflation and how Aon calculates a best-estimate assumption.
The Administering Authority should be mindful of the risk that actual price inflation is different to the valuation assumptions.
We set out in the following table the approximate sensitivity of the past service liabilities to changes in the assumption for CPI increases.
Change to assumption Approximate impact on
past service liabilities
Approximate impact on
future service
CPI increased by 0.25% pa* ↑ by 3.75% ↑ by 1.5% pay
CPI decreased by 0.25% pa* ↓ by 3.75% ↓ by 1.5% pay

Actuarial Valuation as at 31 March 2019 – Financial Assumptions Advice 8
* The following assumptions are all affected by a change in the CPI inflation assumption and are allowed for within the sensitivity above:
Increases to pensions in payment;
Increases to pensions in deferment;
Revaluation of pension accounts; and Increases to post 88 GMP in payment. Revaluation of pension accounts and pension increase assumption
Having established an assumption for CPI increases we can then relate that to assumptions for pension increases and account revaluations. Technically there is a small difference in the rates of increase that can apply to pensions versus the rate of revaluation that can apply to members' accounts, in that the former cannot be negative, but the latter can. This should lead to a small difference in proposed assumptions, but for practical reasons we propose ignoring this at this valuation, which is the same approach as was taken at the 2016 valuation.
Based on the above analysis, our proposed assumptions are as follows:
Increases to pensions in payment: 2.1% pa
Increases to pensions in deferment: 2.1% pa
Revaluation of pension accounts before retirement: 2.1% pa
Assumptions for increases on Guaranteed Minimum Pensions (accrued after 5 April 1988) are set consistent with the above analysis but allowing for a maximum increase of 3.0% pa. This leads to an assumption of 1.9% pa for these increases. However, it should be noted that LGPS funds will be responsible for paying full CPI increases for members reaching SPA between 6 April 2016 and 5 April 2021. We will allow for this in our valuation calculations.
Pay increases The pay increase assumption affects the rate at which active members’ liabilities accrued prior to 1 April 2014 are assumed to increase until retirement.
In setting the pay increase assumption, it is important to bear in mind that it is still a reasonably long-term assumption which is designed to apply over members' remaining working lifetimes and not just over the next few years.
The impact of the pay increase assumption will decline over time since, in the main, only benefits accrued prior to 1 April 2014 are linked to final pay.
Over the long term it is generally observed that pay growth is related to, and usually exceeds, general price inflation and is also related to industry and employer specific factors. Pay has generally been observed to exceed price inflation by between 1% and 2% pa over the long term. Additionally, pay progression for individuals is related to individual career progression through promotion and experience.
Our proposal therefore comprises an inflationary component which is related to price inflation, and a promotional element derived from an analysis of Fund experience.
Previous valuation At the previous valuation, pay was assumed to increase at 1.5% pa above the increase in CPI (plus an age-related promotional scale).
Current valuation Considerations in setting the assumption for this valuation include:
The local government pay deal agreed for 2018 to 2020 which includes increases of around 2% in 2018 and 2019 together with a new national pay spine and higher increases for the lower paid.

Actuarial Valuation as at 31 March 2019 – Financial Assumptions Advice 9
The impact of the national living wage and whether this will result in higher pay rises for lower paid members, noting that increases are expected to slow down after 2021.
The employer profile of the Fund experience, and the extent to which there is likely to be any material pay pressure in relation to the pre-2014 liabilities of any non-public sector employers.
If the approach used in the previous valuation is followed, the updated assumption will be 1.5% pa (plus an age-related promotional scale).
We have already analysed pay increases, including promotional scales, in our experience analysis and advised on the promotional scale.
The valuation results are sensitive to the choice of assumption:
Change to assumption Approximate impact on past service liabilities
Pay increase assumption reduced by 0.25% pa
↓ by 0.75% (no impact on future service rate)
Actuarial Valuation as at 31 March 2019 – Financial Assumptions Advice 10
4. Projected results for the Fund
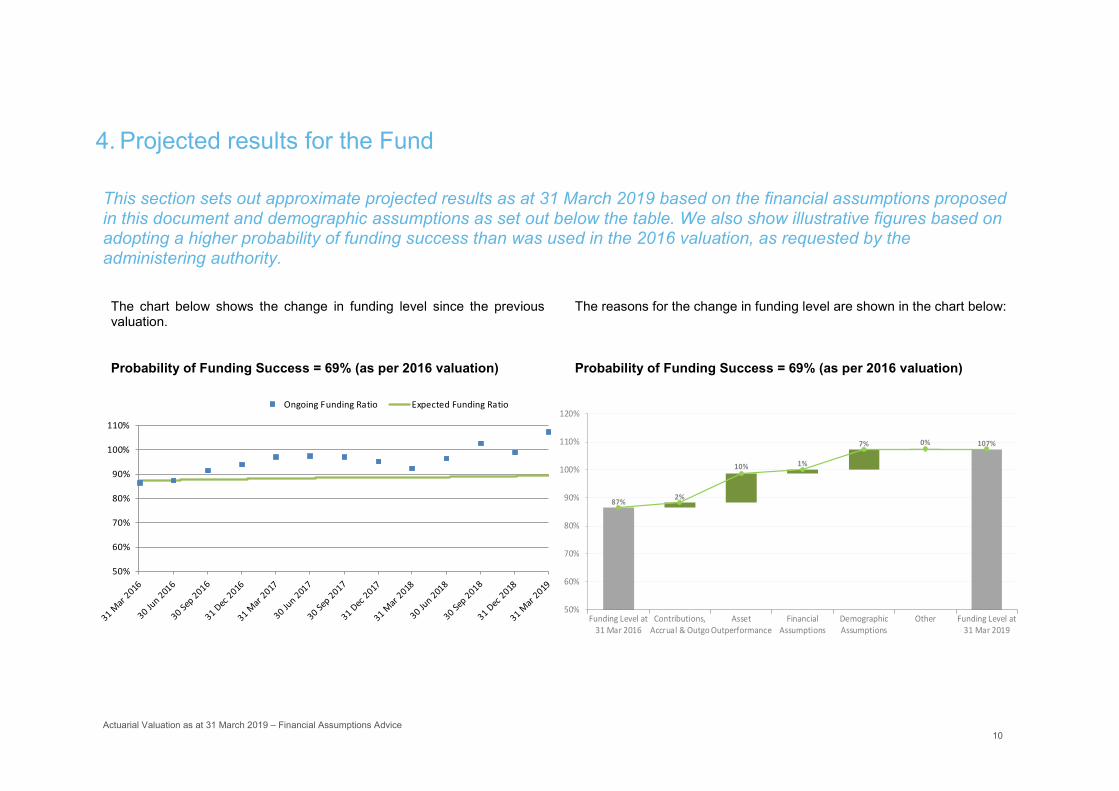
This section sets out approximate projected results as at 31 March 2019 based on the financial assumptions proposed in this document and demographic assumptions as set out below the table. We also show illustrative figures based on adopting a higher probability of funding success than was used in the 2016 valuation, as requested by the administering authority.
The chart below shows the change in funding level since the previous valuation.
Probability of Funding Success = 69% (as per 2016 valuation)
The reasons for the change in funding level are shown in the chart below:
Probability of Funding Success = 69% (as per 2016 valuation)
50%
60%
70%
80%
90%
100%
110%
Ongoing Funding Ratio Expected Funding Ratio
87% 2%
10% 1%
7% 0% 107%
50%
60%
70%
80%
90%
100%
110%
120%
Funding Level at31 Mar 2016
Contributions,Accrual & Outgo
AssetOutperformance
FinancialAssumptions
DemographicAssumptions
Other Funding Level at31 Mar 2019

Actuarial Valuation as at 31 March 2019 – Financial Assumptions Advice 11
Probability of Funding Success = 74%
The change to Probability of Funding Success, and the proposed demographic assumption changes, are shown only in the 31 March 2019 figures in the above charts.
Probability of Funding Success = 74%
50%
60%
70%
80%
90%
100%
110%
Ongoing Funding Ratio Expected Funding Ratio
87%2%
10% -5%7% 0% 101%
50%
60%
70%
80%
90%
100%
110%
Funding Level at31 Mar 2016
Contributions,Accrual & Outgo
AssetOutperformance
FinancialAssumptions
DemographicAssumptions
Other Funding Level at31 Mar 2019

Actuarial Valuation as at 31 March 2019 – Financial Assumptions Advice 12
2016 valuation results Updated 2016 basis Alternative 2019 basis
Probability of funding success 69% 69% 74%
Discount rate (% pa) 4.5 4.7 4.4
Estimated Funding Level 87% 107% 101%
Estimated Employer Future Service Rate (% of pay)
17.7 15.6 17.2
Estimated Shortfall Contributions (% of pay)
5.1** Nil* Nil*
Estimated Total Employer Rate (% of pay) 22.8** 15.6* 17.2*
Approximate allowance for cost cap - 0.9 0.9
Estimated total employer rate including cost cap allowance (% of pay)
22.8** 16.5* 18.1*
Notes: *For simplicity, assuming the surplus is not used to reduce contributions below the future service rate. For employers with funding levels of 100 to 105% this approach is consistent with the draft Funding Strategy Statement.
**This is the aggregate theoretical rate which would have applied across the whole fund if there was no stepping of shortfall contribution increases and contributions increased in line with the salary growth assumption.

Actuarial Valuation as at 31 March 2019 – Financial Assumptions Advice 13
The figures set out above are illustrative figures based on an approximate roll-forward of the 2016 valuation of the Fund to 31 March 2019 using the same methodology as adopted for our approximate quarterly funding updates. In particular, the allowance for the change in the financial assumptions is based only on the secure scheduled body funding target.
The actual 2019 valuation results could be significantly different to these illustrative figures and the Administering Authority should not make any decisions regarding the specific valuation assumptions to be adopted based on these figures.
In carrying out these approximate calculations we have made the following assumptions:
The estimated payroll of the Fund as at 31 March 2019 is £153.9M. This figure is estimated from employer and employee contributions paid to the fund over 2018/19. In order to estimate the payroll for 2019/20 to determine the contribution levels above we have assumed that pay is increased in April 2019 at a rate of 1.5% above the actual pension increase amount for 2019, i.e. an increase of 3.9%.
We have approximately allowed for the impact of the pension increase and CARE revaluation rate applicable in April 2019.
A broad allowance has been made for pay increase experience between 31 March 2016 and 31 March 2019, based on the data provided as at 31 March 2018 for the early data validation exercise and based on member and employer contributions paid as set out in the fund published and draft accounts.
No allowance has been made for any demographic experience over the inter-valuation period.
We have assumed that financial assumptions other than the discount rate will be in line with the proposals set out in this paper.
We have allowed for all of the demographic assumption changes listed in this paper.
No allowance has been made for the possible outcome of the McCloud/Sargeant court case. However, the potential impact at a scheme level of the cost cap process has been added for illustration in the table above. In relation to these issues, we will advise further on an appropriate approach for your Fund at a later stage of the valuation process having regard to progress with the court case and guidance from the Scheme Advisory Board.
No allowance for GMP equalisation has been made beyond the interim solution included in the 2016 valuation calculations. The extension of this solution to cover members reaching State Pension Age until 5 April 2021 will be included in the full valuation calculations when 2019 data has been provided, but the additional liability arising as a result is not expected to be material to this advice paper.

Actuarial Valuation as at 31 March 2019 – Financial Assumptions Advice 14
Appendix A – Background to the valuation
This appendix provides a general context for the valuation and sets out the legislative and regulatory background.
The Regulations
The triennial actuarial valuation and the setting of employer contribution rates must comply with the requirements of the LGPS Regulations and the broader regulatory framework.
The relevant regulation is Regulation 62 of the Local Government Pension Scheme Regulations 2013.
Regulation 62(6) states that
"(6) The actuary must have regard to—
(a) the existing and prospective liabilities arising from circumstances common to all those bodies;
(b) the desirability of maintaining as nearly constant a primary rate as possible;
(c) the current version of the administering authority’s funding strategy mentioned in regulation 58 (funding strategy statements); and
(d) the requirement to secure the solvency of the pension fund and the long term cost efficiency of the Scheme, so far as relating to the pension fund."
The Regulatory requirements in relation to the valuation are supplemented by:
Statutory Guidance issued by CIPFA in relation to the production and maintenance of a Funding Strategy Statement. (This was last updated in September 2016, although the Regulations still refer to the previous version of the guidance, issued in 2012.)
The Fund's Funding Strategy Statement, which includes input from relevant stakeholders, notably participating employers.
The Fund's Investment Strategy Statement.
Any requirements of the Pensions Regulator and/or Independent Body appointed pursuant to the Public Service Pensions Act 2013 (currently GAD).

Actuarial Valuation as at 31 March 2019 – Financial Assumptions Advice 15
Appendix B – Capital Market Assumptions (CMAs) The Capital Market Assumptions as at 31 March 2019 are described below
The CMAs are based on consensus or market based inputs unless we believe that the consensus view is clearly unrealistic. For example, analyst expectations for company earnings are often over-optimistic so caution is needed when interpreting them.
We use data from a wide range of sources when formulating the CMAs including, among others, Consensus Economics, the Institutional Brokers' Estimate System (I/B/E/S), the Bank of England, the Federal Reserve Bank of Philadelphia's Survey of Professional Forecasters, the European Central Bank and research produced by a range of prominent investment banks and research institutes.
The asset class assumptions are assumptions for market returns, with no allowance for managers outperforming the market. The exceptions to this are the private equity and hedge fund assumptions where, due to the nature of the asset classes, potential manager outperformance needs to be incorporated.
Assumptions are produced for bonds, equities, real estate/property and a range of alternative asset classes. The assumptions are formed at a regional level for the US, UK, Europe, Japan, Canada, Switzerland and Australia. We also produce equity and debt market assumptions for emerging markets. Equity and debt market composites (e.g. EAFE) are built from these individual regional building blocks.
The CMAs at 31 March 2019 will be provided separately to this paper, when they are available from our Global Investment Team.

Aon Hewitt Retirement & Investment
[Title] 16
Appendix C: Asset split used for discount rate calculations
The table below shows the long term asset split used in the discount rate calculations.
The asset allocation below is the asset allocation set out in our paper titled 'Linking investment strategy and the valuation of liabilities' dated 26 June 2018. We understand this was adopted by the Fund upon agreement by the Pension Policy and Investment Committee.
This asset allocation is assumed to be retained throughout the Trajectory Period.
Asset class Proportion (%)
Global Equities 35.0
Private equity / Venture capital 5.0
UK Index Linked Gilts 8.1
Corporate Bonds 6.4
Property 10.0
Infrastructure 6.0
Hedge Funds 10.0
Absolute Return Bonds 3.1
Multi Asset Credit 6.4
Inflation protecting illiquids 10.0

Actuarial Valuation as at 31 March 2019 – Financial Assumptions Advice 17
Appendix D: Summary of proposed demographic assumptions
Post-retirement mortality - base table
2016 2019 Rationale and reason for change Sensitivity
Actives retiring in normal health - Males - Females
95% of S2PMA_L
80% of S2PFA_L
110% of S2PMA
110% of S2PFA
Underlying "Light" base table updated to "All lives" table, and scaling factors updated in line with results of latest Demographic HorizonsTM analysis.
Continued use of the SAPS S2 tables.
Following completion of the Demographic Horizons analysis, it was observed that expected mortality rates for the London Borough of Enfield were
heavier than had previously been observed within the Fund.
It was also noted that there was not sufficient evidence to recommend
retaining different tables for normal and ill health retirements, and therefore a single "all pensioners" table has been used for all categories of retirement.
A 10% reduction in a scaling factor results in a 2.5% increase on the liabilities.
Actives retiring in ill health - Males - Females
80% of S2IMA
100% of S2IFA
110% of S2PMA
110% of S2PFA
Deferreds retiring in normal health - Males - Females
95% of S2PMA_L
80% of S2PFA_L
105% of S2PMA
105% of S2PFA
Deferreds retiring in ill health - Males - Females
80% of S2IMA
100% of S2IFA
105% of S2PMA
105% of S2PFA
Contingents of current actives: - Males - Females
95% of S2PMA_L
80% of S2PFA_L
110% of S2PMA
105% of S2PFA
Contingents of current deferreds: - Males - Females
95% of S2PMA_L
80% of S2PFA_L
105% of S2PMA
100% of S2PFA

Actuarial Valuation as at 31 March 2019 – Financial Assumptions Advice 18
2016 2019 Rationale and reason for change Sensitivity
Pensioners retiring in normal health, and current dependants - Males - Females
95% of S2PMA_L
80% of S2PFA_L
95% of S2PMA
95% of S2PFA
As above
As above Pensioners retiring in ill health - Males - Females
80% of S2IMA
100% of S2IFA
95% of S2PMA
95% of S2PFA
Contingents of current pensioners - Males - Females
95% of S2PMA_L
80% of S2PFA_L
100% of S2PMA
95% of S2PFA
Note: Improvements from 2007 in line with future improvement projections in the table below
Post-retirement mortality - future improvements
2016 2019 Rationale and reason for change Sensitivity
Male and female
CMI 2014 core projections with long-
term improvement rate of 1.5% p.a.
CMI 2018 core projections with long-
term improvement rate of 1.50% p.a., sk of 7.5
and parameter A of 0.0.
Update for latest CMI projections, no change in the long-term rate, consistent with the previous advice we
gave in the demographic assumptions advice.
The latest projection has new smoothing parameters, sk and A. The "core" CMI values for these parameters are sk = 7.0 and parameter A = 0.0. We propose to adopt a value for sk of 7.5, (slightly above the core parameter) to allow for the fact that mortality improvements have generally been higher for pension scheme members
than the general population.
Possible changes (e.g. changing sk by 0.5 or varying the
long-term improvement rate by 0.25% p.a.) would not have a major impact on results

Actuarial Valuation as at 31 March 2019 – Financial Assumptions Advice 19
Other demographic assumptions
The table below sets out the other demographic assumptions agreed/proposed for the initial calculations.
2016 2019 Rationale and reason for change Sensitivity
Pre-retirement mortality 90% of S2PMA
40% of S2PFA with same allowance for
mortality improvements as post
retirement mortality
45% of S2NMA
20% of S2NFA with same allowance for
mortality improvements as post
retirement mortality
Updated to reflect changes in the post retirement mortality improvements and to
allow for experience analysis.
Not a material sensitivity
Promotional salary increases Allowance for age-
related promotional increases.
Allowance for age-related promotional
increases (see sample rates below).
No change
Not a material sensitivity
Withdrawals Allowance for withdrawals from
service. On withdrawal, members are assumed to leave
with a deferred pension in the Fund.
Allowance for withdrawals from
service (see sample rates below). On
withdrawal, members are assumed to leave
with a deferred pension in the Fund.
Updated to allow for experience analysis
Not a material sensitivity
Take up of 50:50 scheme All members are assumed to remain in the scheme they are in
at the date of the valuation.
All members are assumed to remain in the scheme they are in
at the date of the valuation.
No change Not a material sensitivity

Actuarial Valuation as at 31 March 2019 – Financial Assumptions Advice 20
2016 2019 Rationale and reason for change Sensitivity
Retirement cash sum Each member is assumed to surrender pension on retirement,
such that the total cash received is 70%
of the permitted maximum.
Each member is assumed to surrender pension on retirement, such that the total cash received is 70% of the permitted maximum.
No change
Not applicable as no change proposed.
Retirement age
Member group Assumed age at retirement
Where possible this is based on the experience of these members.
For fully/taper protected (group 1&2) members, all group 1 members will be over
age 63 at the valuation, and so the retirement age assumption has been aligned with other
pre October 2006 joiners.
For pre 1 October 2006 joiners with no taper/full protection it is difficult to conclude anything from the experience due to small
numbers and early retirements. Therefore, for these categories of member we propose to
adopt the same assumptions across our LGPS portfolio and base this on an overall approximate average age at which benefits can be taken unreduced for a sample fund.
Changes that we could possibly
support would not result in material
change to the liabilities
Group 1 and Group 2 members
Rule of 85 age 63
Group 3 members (Ro85 age = 60)
65 63
Group 3 members (Ro85 age > 60)
65 65
Group 4 members (Joiners pre 1 April 2014)
65 65
Group 4 members (Joiners post 31 March 2014)
State Pension Age State Pension Age

Actuarial Valuation as at 31 March 2019 – Financial Assumptions Advice 21
2016 2019 Rationale and reason for change Sensitivity
Any part of a member’s pension payable from a later age than the assumed retirement age will
be reduced.
Family details Each man is assumed to be three years older than his wife/partner.
80% of non-pensioners are
assumed to be married or have a spouse, civil partner or co-habitee
('partner') at retirement or earlier death. 80%
of pensioners are assumed to be married
or have a partner at age 65.
No allowance for children's pensions.
Each man is assumed to be three years older than his wife/partner.
80% of non-pensioners are assumed to be married or have a
spouse, civil partner or co-habitee ('partner') at
retirement or earlier death. 80% of pensioners are
assumed to be married or have a partner at
age 65.
No allowance for children's pensions.
No change Not applicable as no change proposed.
Retirement due to ill-health Allowance for retirements due to ill-
health.
Proportions into the different benefit tiers
are: Tier 1 - 85% Tier 2 - 10% Tier 3 - 5%
Allowance for retirements due to ill-health (see below).
Proportions into the different benefit tiers
are: Tier 1 - 85% Tier 2 - 10% Tier 3 - 5%
No change Not applicable as no change proposed.

Actuarial Valuation as at 31 March 2019 – Financial Assumptions Advice 22
Sample rates The table below illustrates the proposed allowance for withdrawals from service, ill-health retirement and promotional pay increases at sample ages. All rates apply to both male and female members.
Current age Percentage promotional pay increase over year
Percentage leaving the Fund each year as a result of withdrawal from service
Percentage leaving the Fund each year as a result of ill-health retirement
20 5.97% 8.30% 0.00%
25 4.60% 7.40% 0.00%
30 2.44% 6.40% 0.01%
35 1.45% 5.50% 0.02%
40 1.35% 4.60% 0.03%
45 1.27% 3.70% 0.06%
50 0.00% 2.80% 0.16%
55 0.00% 1.80% 0.32%
60 0.00% 0.90% 0.63%
65 0.00% 0.00% 0.93%
Actuarial Valuation as at 31 March 2019 – Financial Assumptions Advice 23
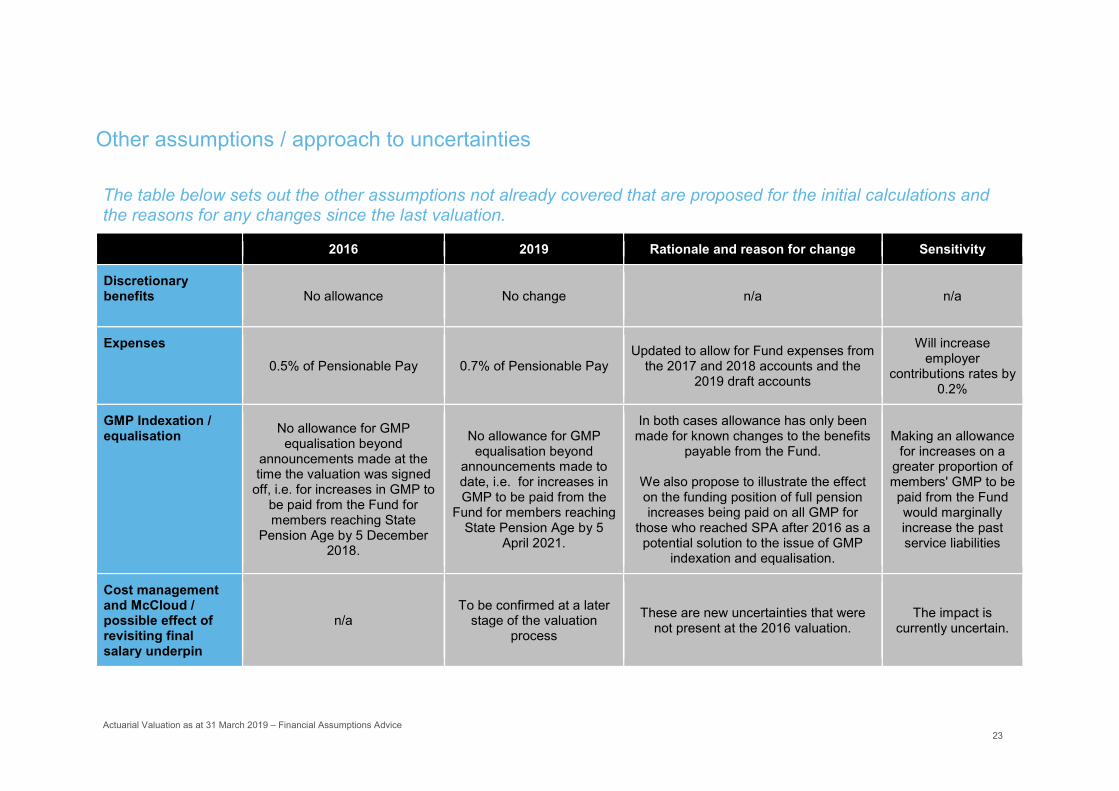
Other assumptions / approach to uncertainties
The table below sets out the other assumptions not already covered that are proposed for the initial calculations and the reasons for any changes since the last valuation.
2016 2019 Rationale and reason for change Sensitivity
Discretionary benefits
No allowance No change n/a n/a
Expenses 0.5% of Pensionable Pay 0.7% of Pensionable Pay
Updated to allow for Fund expenses from the 2017 and 2018 accounts and the
2019 draft accounts
Will increase employer
contributions rates by 0.2%
GMP Indexation / equalisation No allowance for GMP
equalisation beyond announcements made at the time the valuation was signed
off, i.e. for increases in GMP to be paid from the Fund for members reaching State
Pension Age by 5 December 2018.
No allowance for GMP equalisation beyond
announcements made to date, i.e. for increases in GMP to be paid from the
Fund for members reaching State Pension Age by 5
April 2021.
In both cases allowance has only been made for known changes to the benefits
payable from the Fund.
We also propose to illustrate the effect on the funding position of full pension increases being paid on all GMP for
those who reached SPA after 2016 as a potential solution to the issue of GMP
indexation and equalisation.
Making an allowance for increases on a
greater proportion of members' GMP to be paid from the Fund would marginally increase the past service liabilities
Cost management and McCloud / possible effect of revisiting final salary underpin
n/a To be confirmed at a later
stage of the valuation process
These are new uncertainties that were not present at the 2016 valuation.
The impact is currently uncertain.
Actuarial Valuation as at 31 March 2019 – Financial Assumptions Advice 24
Limitations of advice
The funding update and sensitivities to assumptions set out in this report are approximate only.
Funding update The funding updates shown are consistent with the ongoing calculations for the formal actuarial valuation as at 31 March 2016, provided to the Administering Authority in our report dated 27 March 2017. The assumptions used have been modified in so far as is necessary to maintain consistency with the valuation, reflecting changes in market conditions and other assumptions as set out elsewhere in this paper.
The assets have been rolled forward approximately based on quarterly Fund returns as provided by Northern Trust.
Assumption sensitivity The sensitivities to assumptions are also consistent with the ongoing calculations for the formal actuarial valuation as at 31 March 2016.
The information shown is approximate and becomes more approximate as the projection period lengthens. It reflects changes in market conditions but not fund-specific factors such as material changes in membership numbers or profile or changes in employer funding targets. It is designed to give a broad picture of the direction of funding changes since the actuarial valuation but does not have the same level of reliability as, and therefore does not replace the need for, formal actuarial valuations.
This report is intended to assist the Administering Authority in agreeing the assumptions to be used in initial calculations based on full membership data at 31 March 2019 and to understand the relative importance of individual assumptions. Final decisions on the assumptions used to determine the ongoing liabilities at 31 March 2019 and any resulting change in contributions must not be based solely on the contents of this report, but must wait until more accurate calculations have been carried out.
Actuarial Valuation as at 31 March 2019 – Financial Assumptions Advice 25
Report framework
This report has been prepared in accordance with the framework below.
TAS compliant This report, and the work relating to it, complies with ‘Technical Actuarial Standard 100: Principles for Technical Actuarial Work’ (‘TAS 100’) and 'Technical Actuarial Standard 300: Pensions’ (‘TAS 300’).
The compliance is on the basis that Administering Authority of the London Borough of Enfield Pension Fund is the addressee and the only user and that the report is only to be used to determine the assumptions to be adopted for the initial calculations of the valuation results as at 31 March 2019. If you intend to make any other decisions after reviewing this report, please let us know and we will consider what further information we need to provide to help you make those decisions.
The report has been prepared under the terms of the Agreement between the Administering Authority and Aon Hewitt Limited on the understanding that it is solely for the benefit of the addressee.
This report should be read in conjunction with:
Draft Funding Strategy Statement provided by Aon dated 25 April 2019
Actuarial valuation at 31 March 2019 – Terms of Reference dated 21 February 2019
Valuation Guidance document, issued on 8 March 2019
Our report titled "Longevity Analysis using Demographic HorizonsTM" dated 7 March 2019
Our report titled "Experience analysis and advice on demographic assumptions" as at 31 March 2019 dated 8 March 2019
CMAs at 31 March 2019 (will be provided when available)
If you require further copies of any of these documents, please let us know.