Embed Size (px)
Citation preview
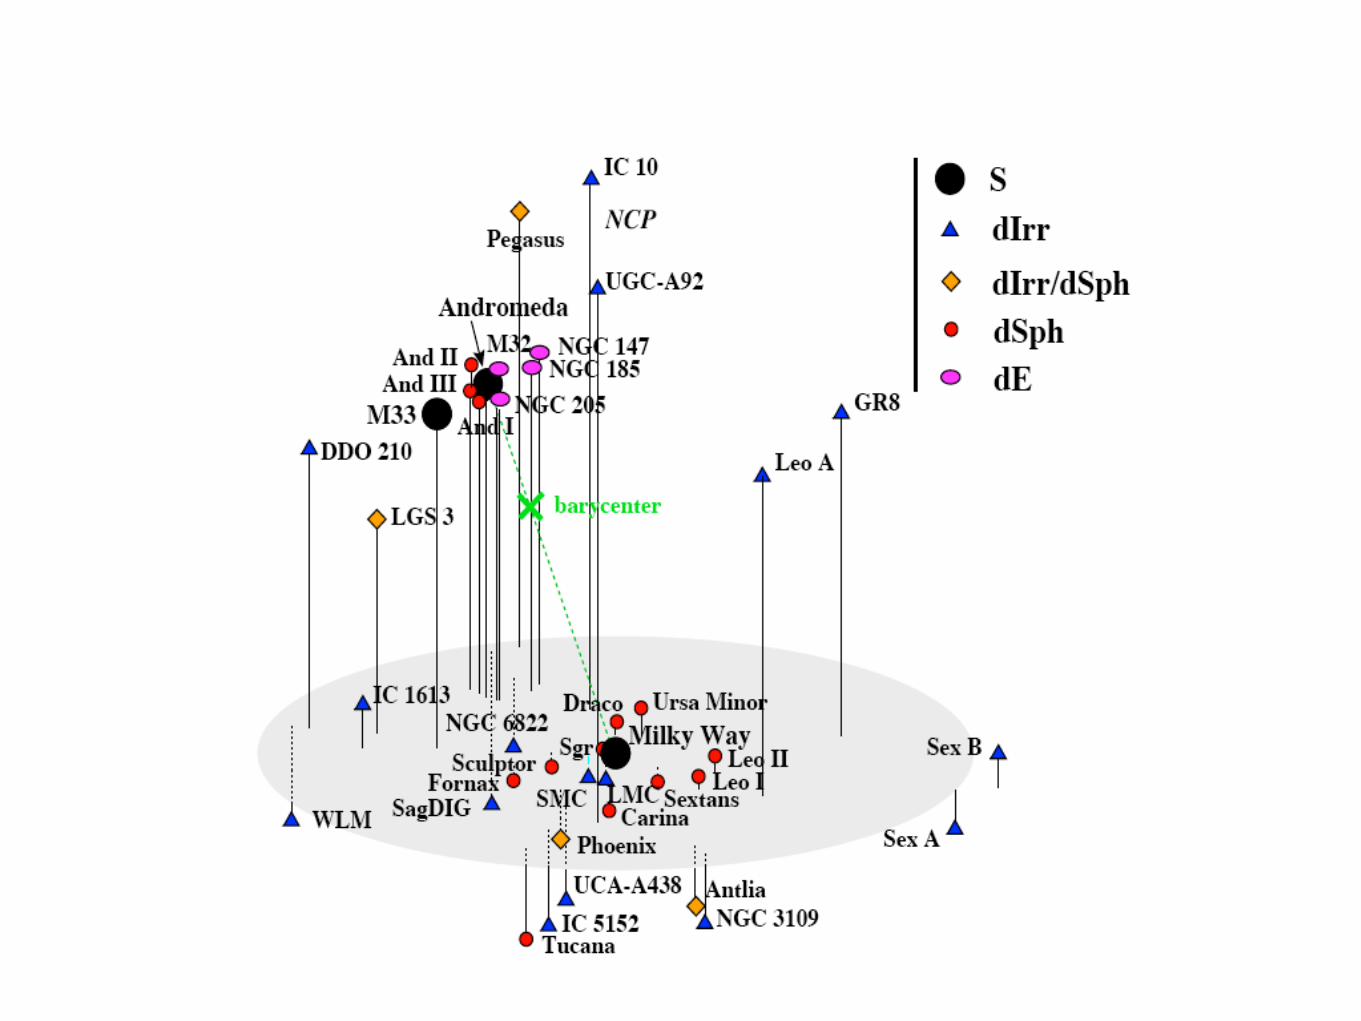
The Local Group
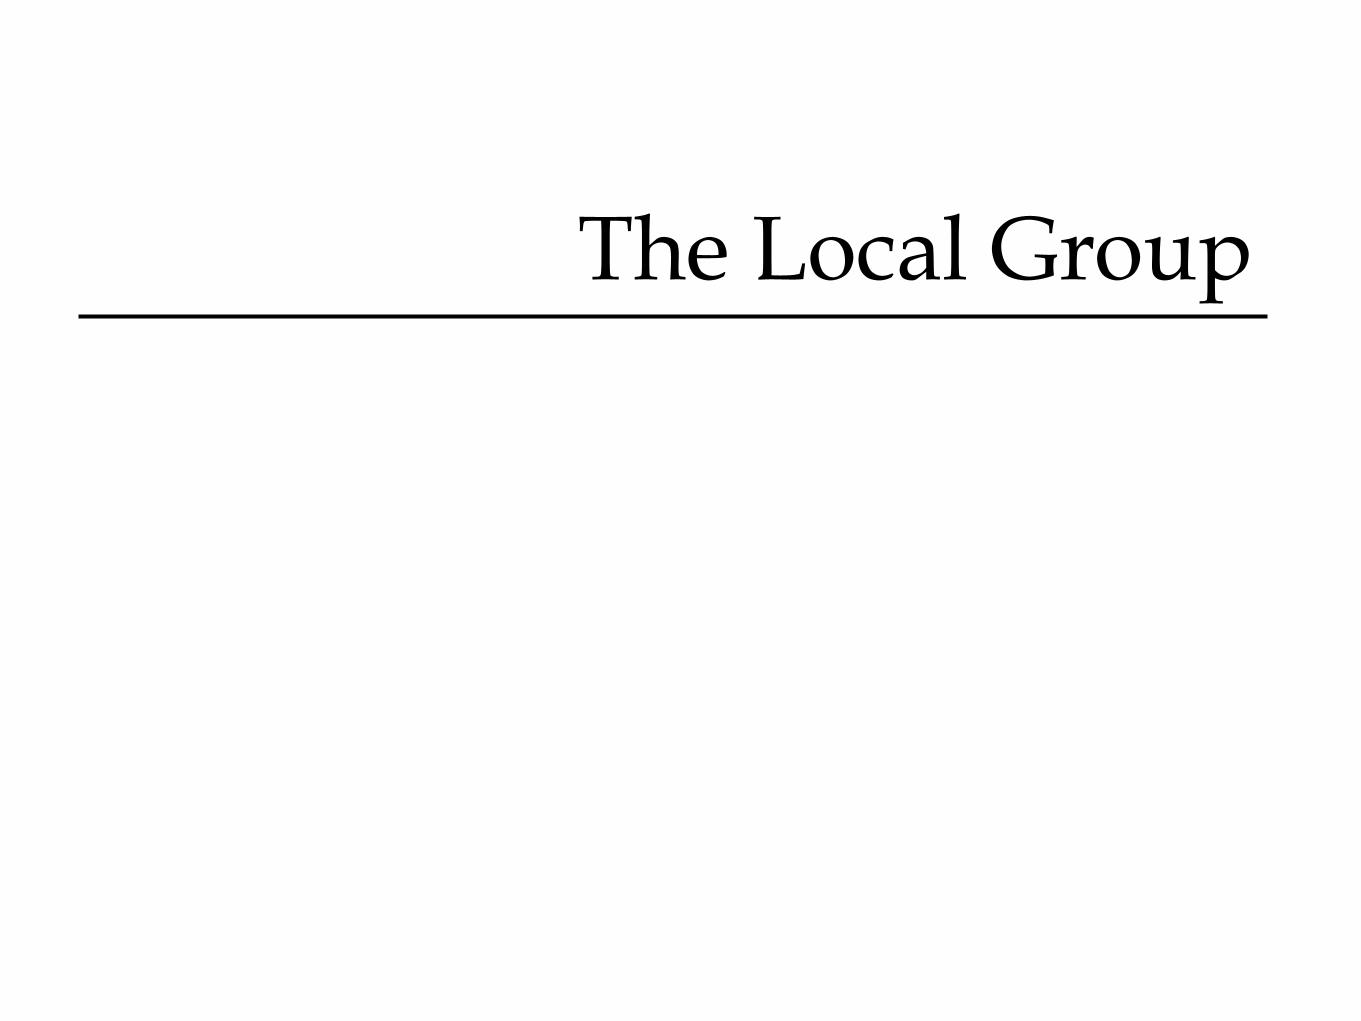
Fiducial Radius of the LG is about 1.0 Mpc: zero-velocity or radius of turn-around.
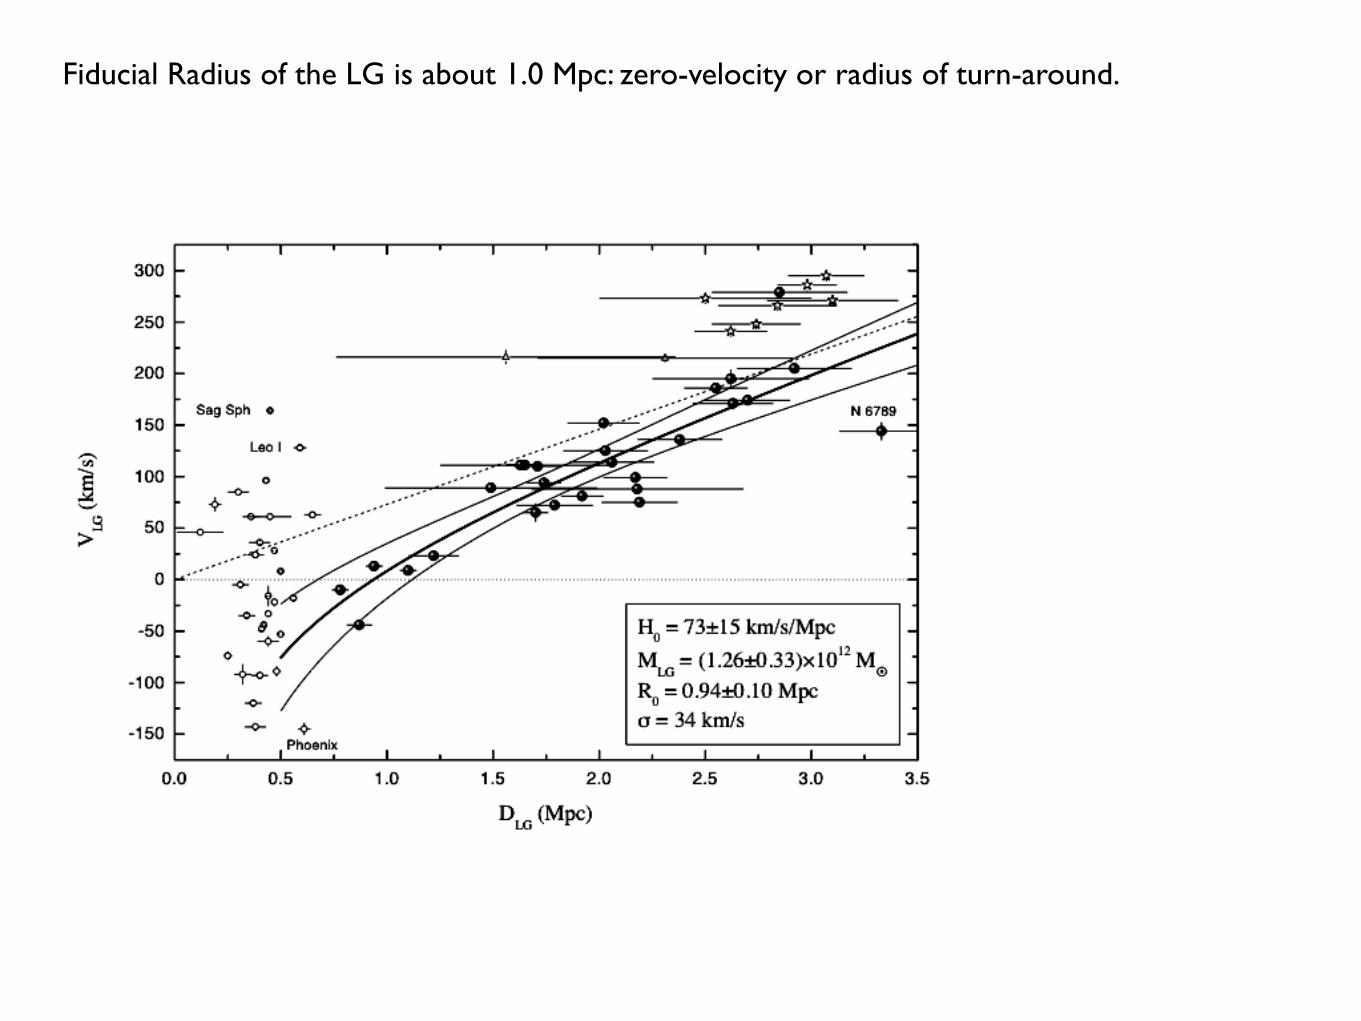
View of the Local Group in supergalactic coordinates
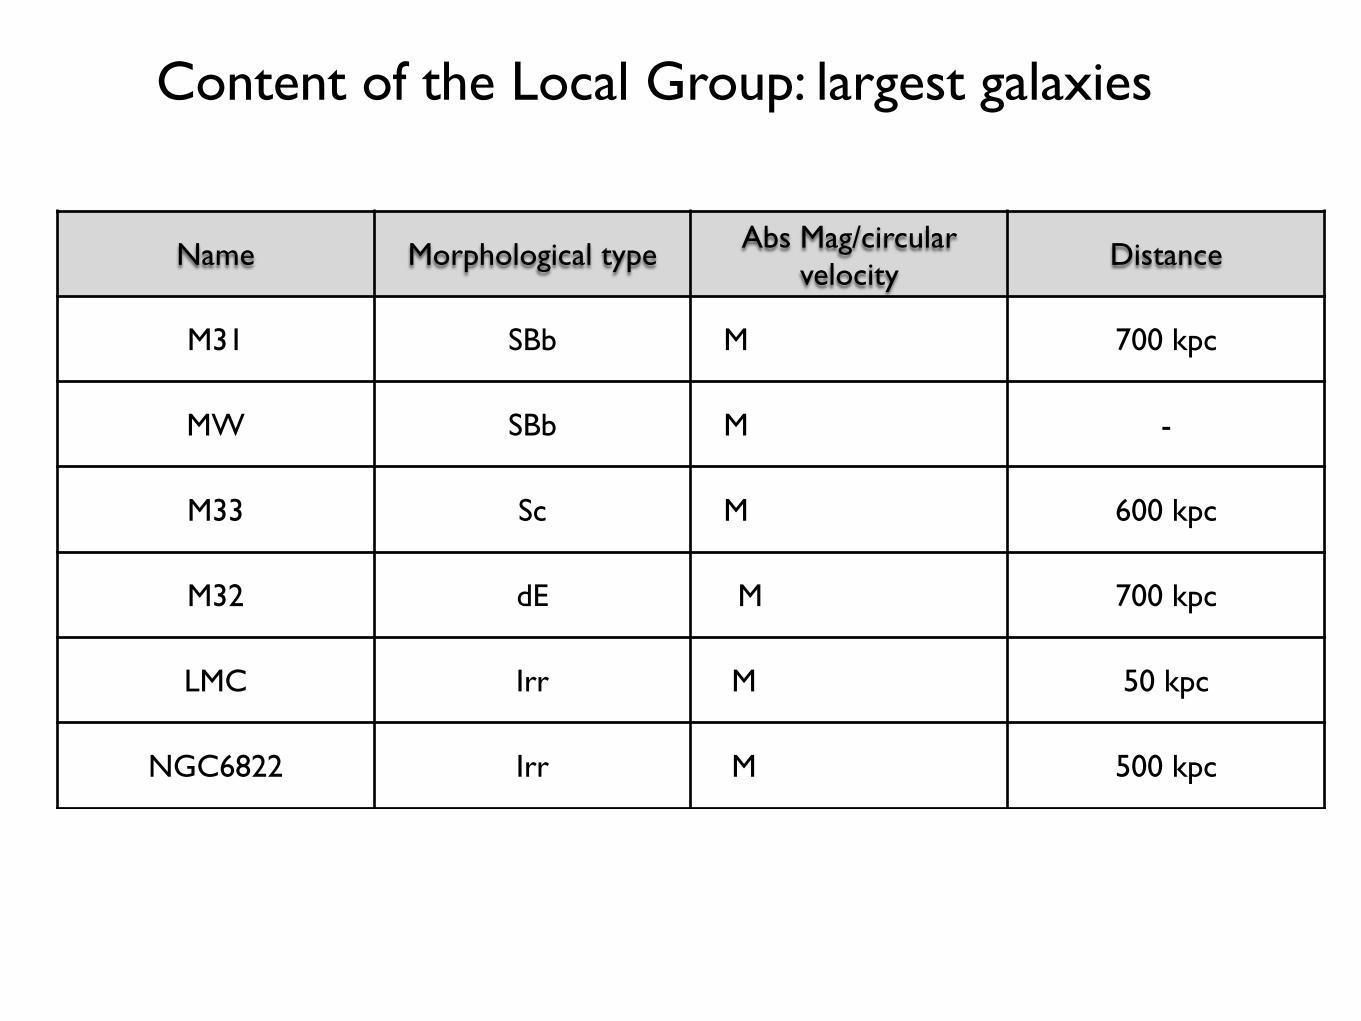
Content of the Local Group: largest galaxies
Name Morphological type Abs Mag/circular velocity
Distance
M31 SBb M 700 kpc
MW SBb M -
M33 Sc M 600 kpc
M32 dE M 700 kpc
LMC Irr M 50 kpc
NGC6822 Irr M 500 kpc
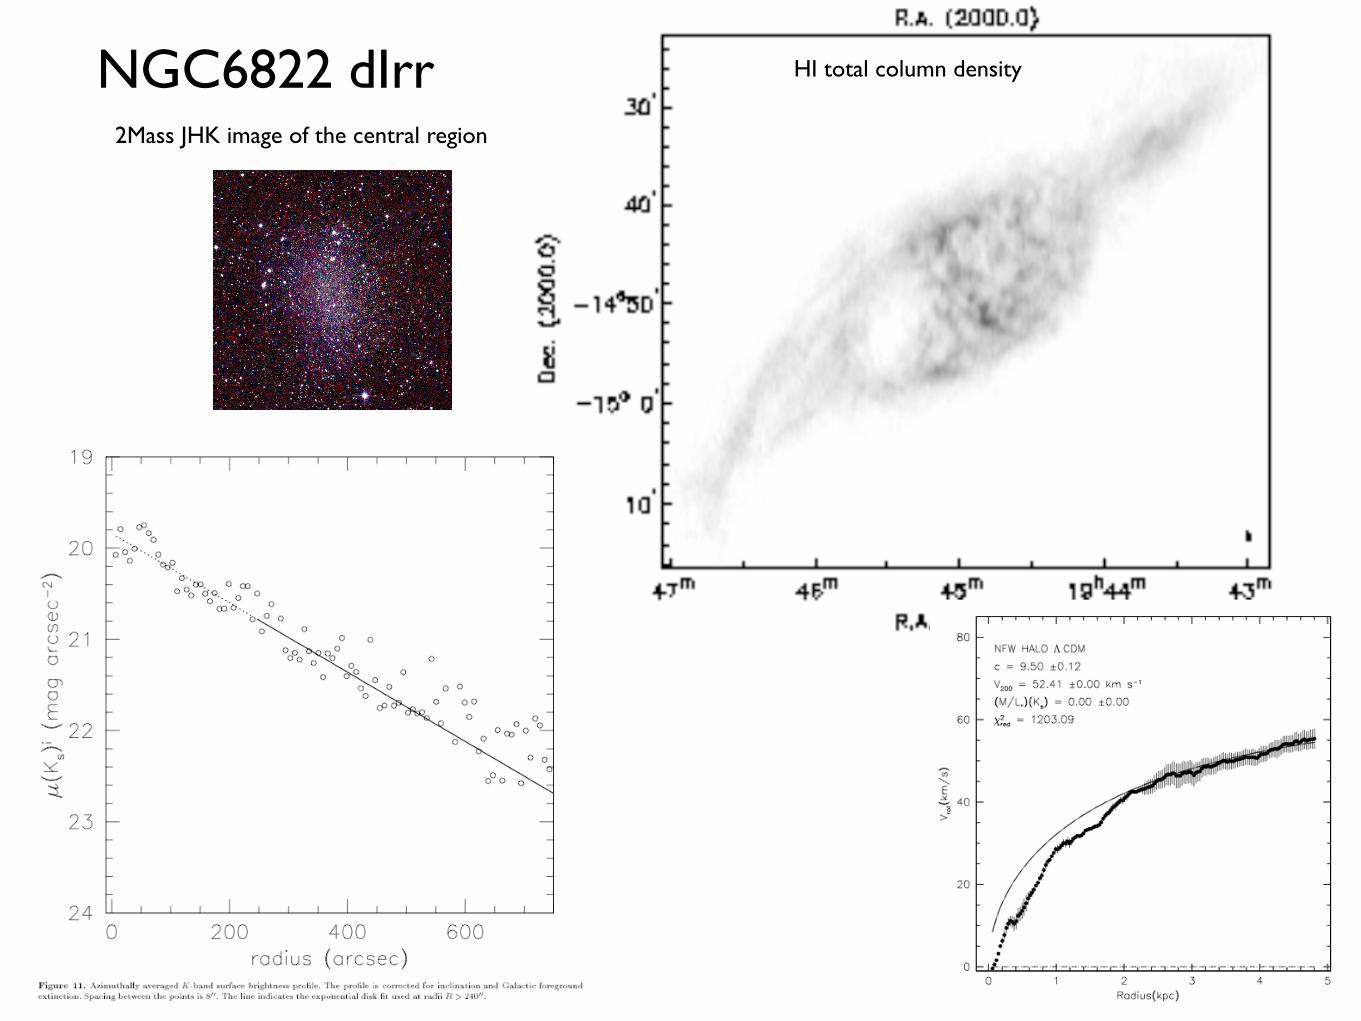
NGC6822 dIrr2Mass JHK image of the central region
HI total column density
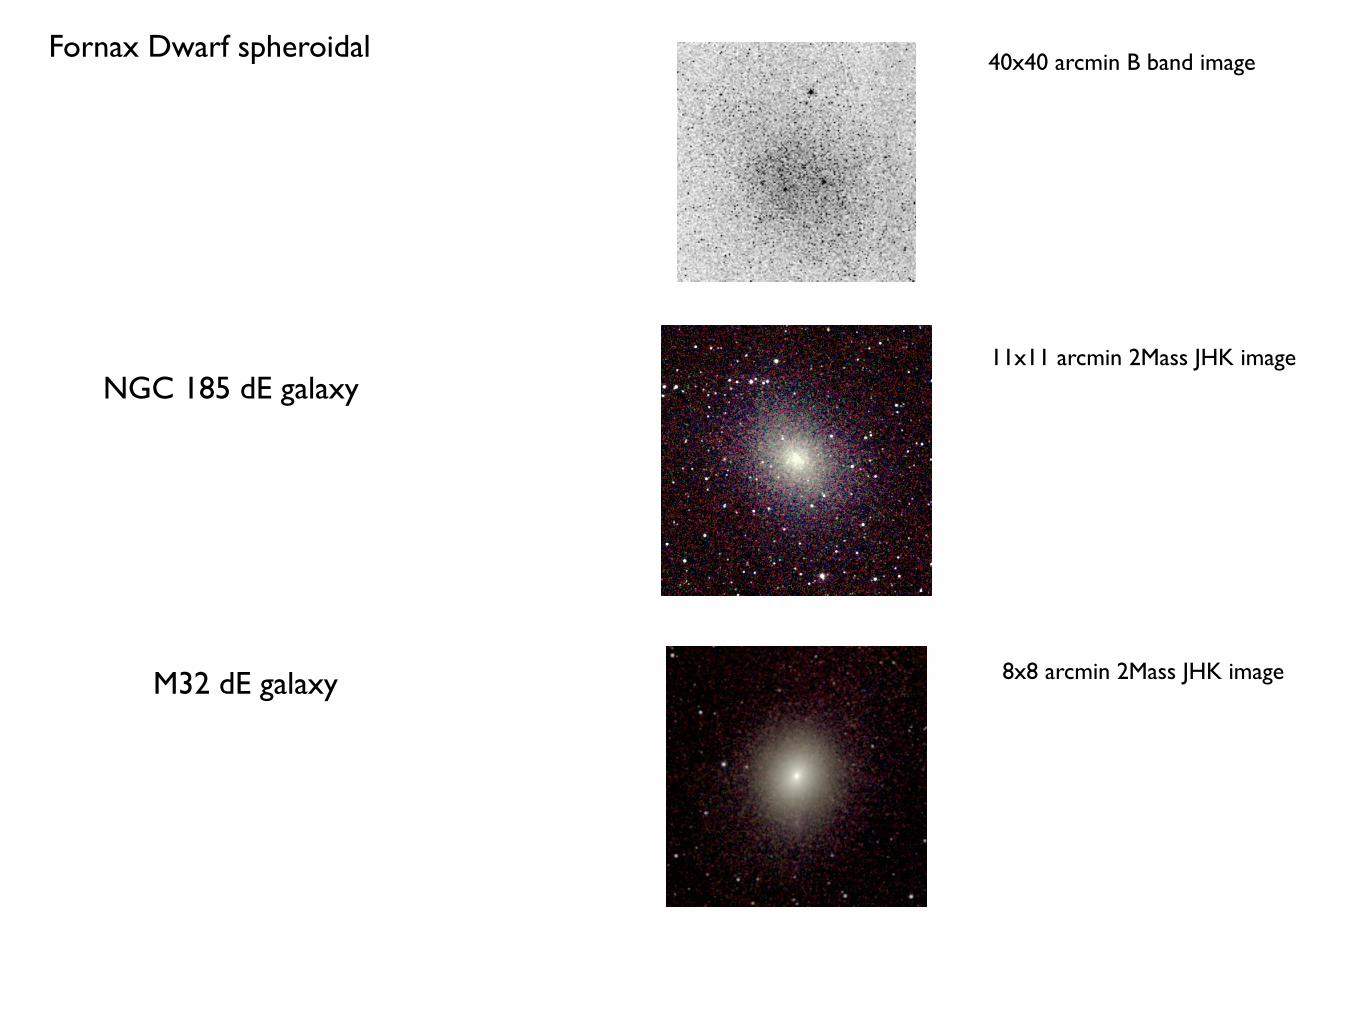
40x40 arcmin B band imageFornax Dwarf spheroidal
NGC 185 dE galaxy11x11 arcmin 2Mass JHK image
8x8 arcmin 2Mass JHK imageM32 dE galaxy
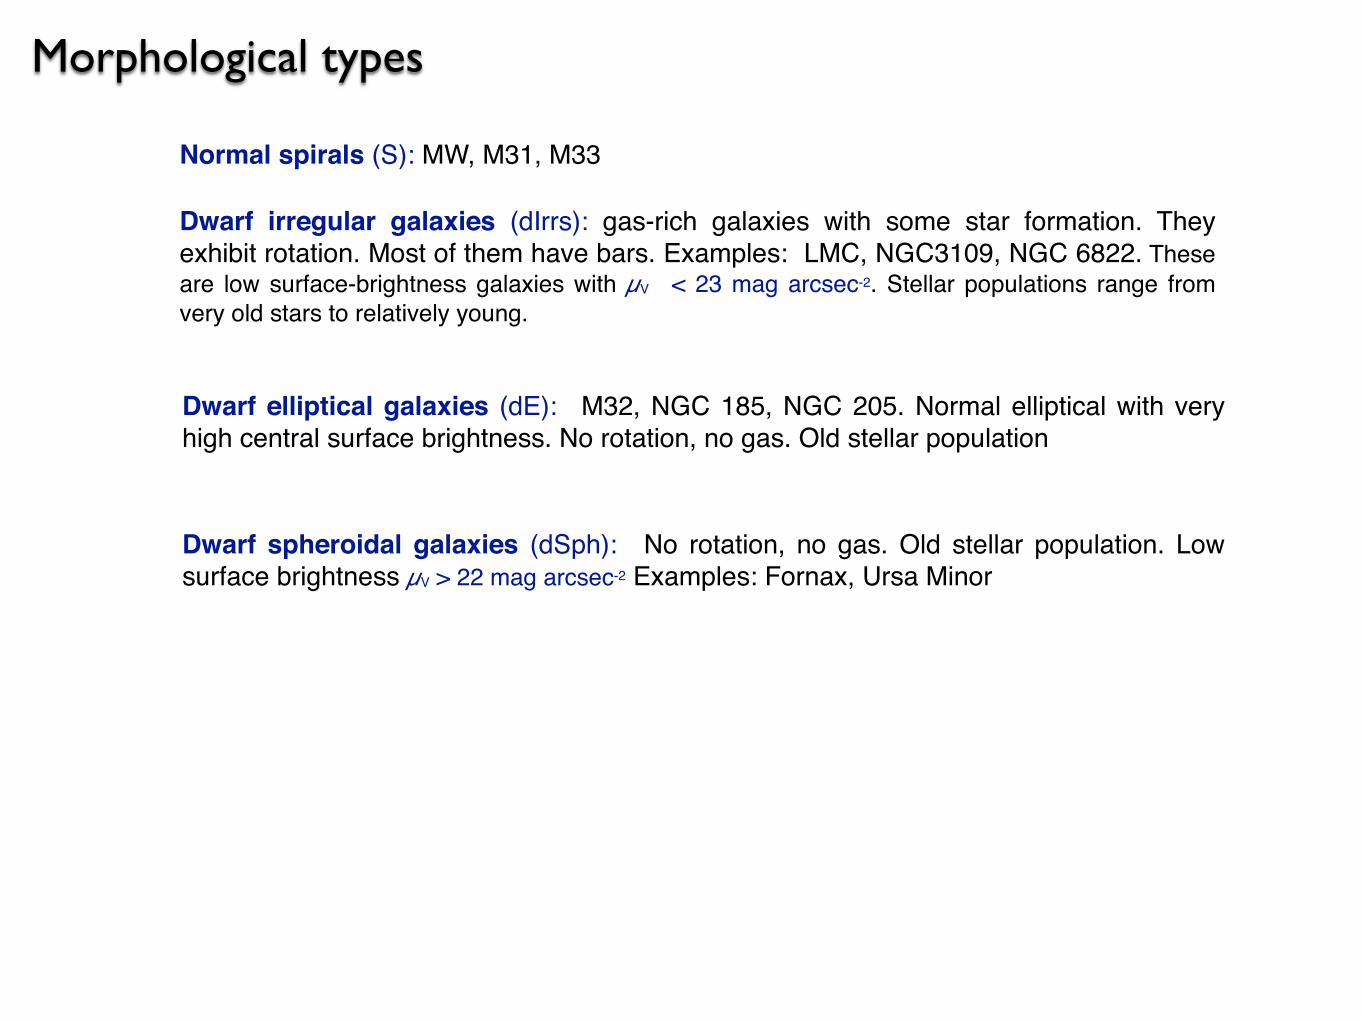
Morphological types
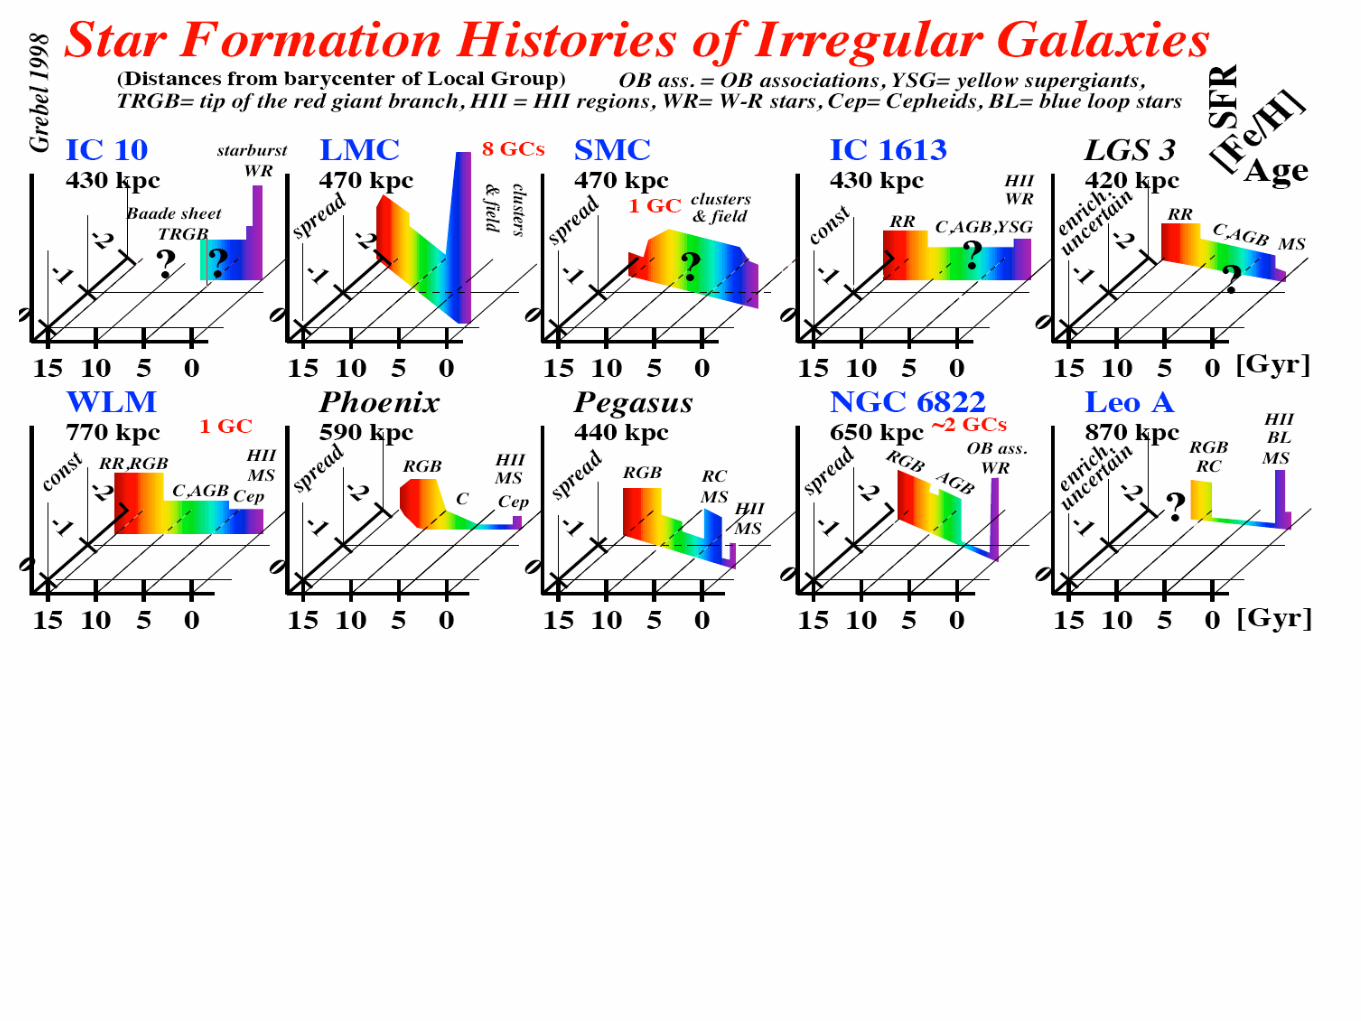
Dwarf irregular galaxies (dIrrs): gas-rich galaxies with some star formation. They exhibit rotation. Most of them have bars. Examples: LMC, NGC3109, NGC 6822. These are low surface-brightness galaxies with µV < 23 mag arcsec-2. Stellar populations range from very old stars to relatively young.
Normal spirals (S): MW, M31, M33
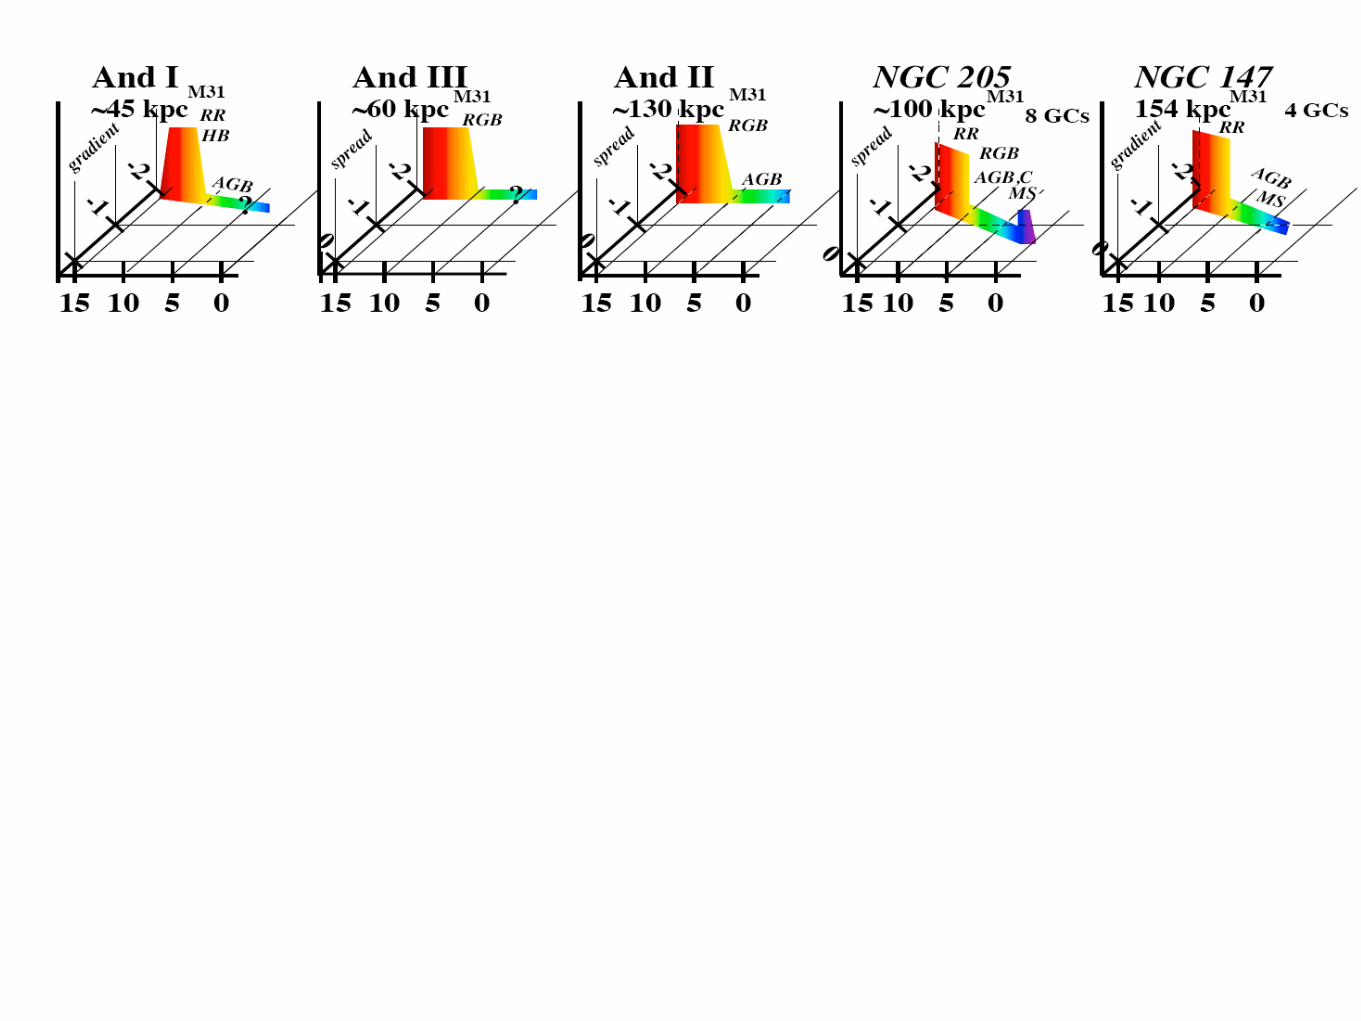
Dwarf elliptical galaxies (dE): M32, NGC 185, NGC 205. Normal elliptical with very high central surface brightness. No rotation, no gas. Old stellar population
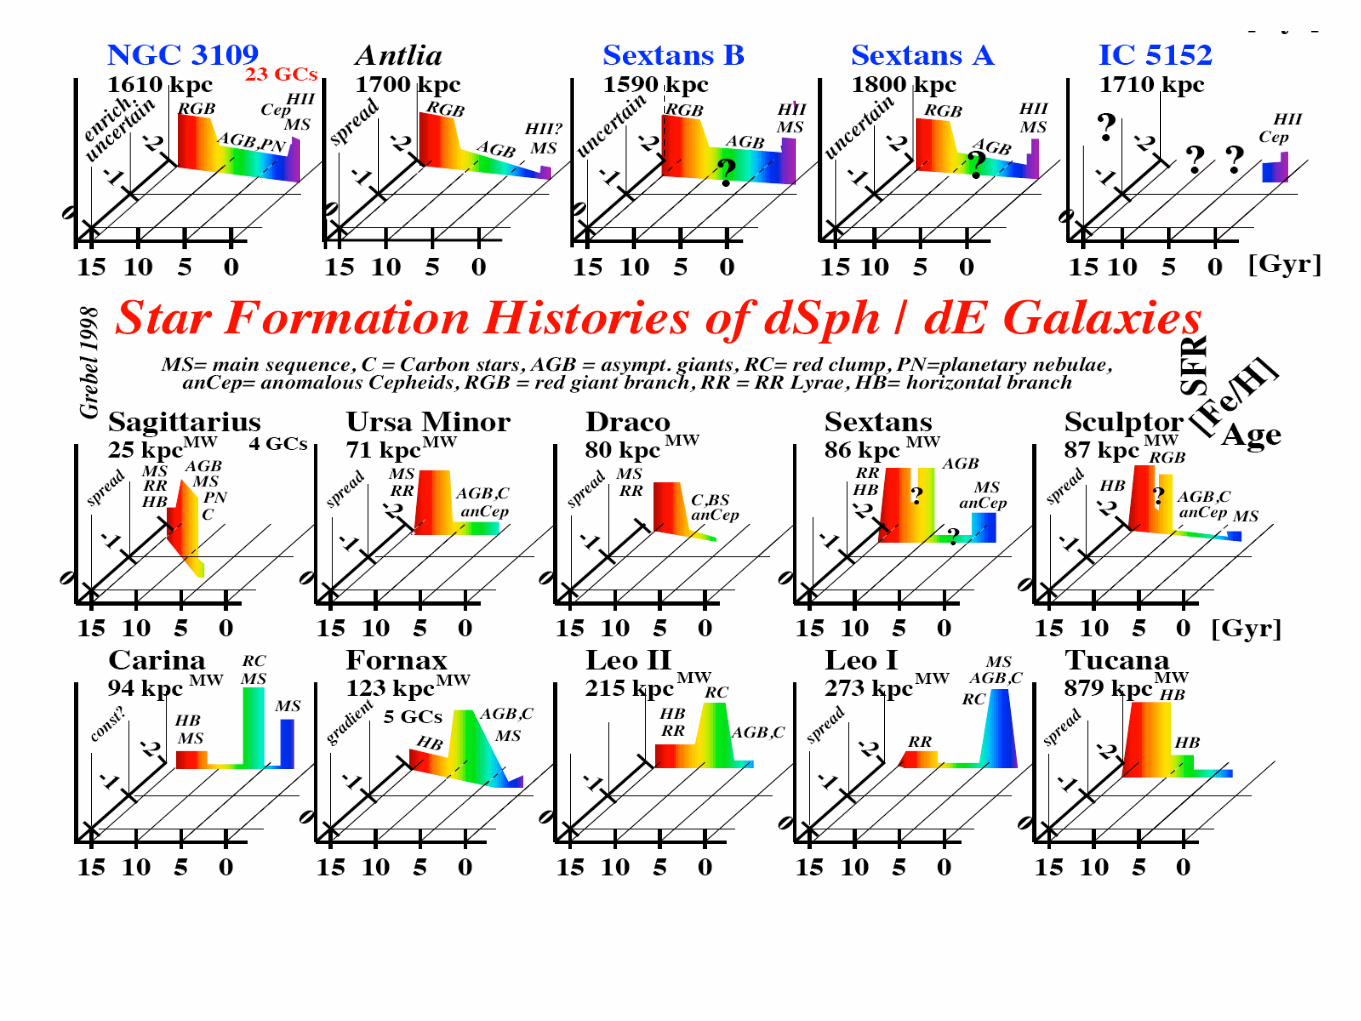
Dwarf spheroidal galaxies (dSph): No rotation, no gas. Old stellar population. Low surface brightness µV > 22 mag arcsec-2 Examples: Fornax, Ursa Minor
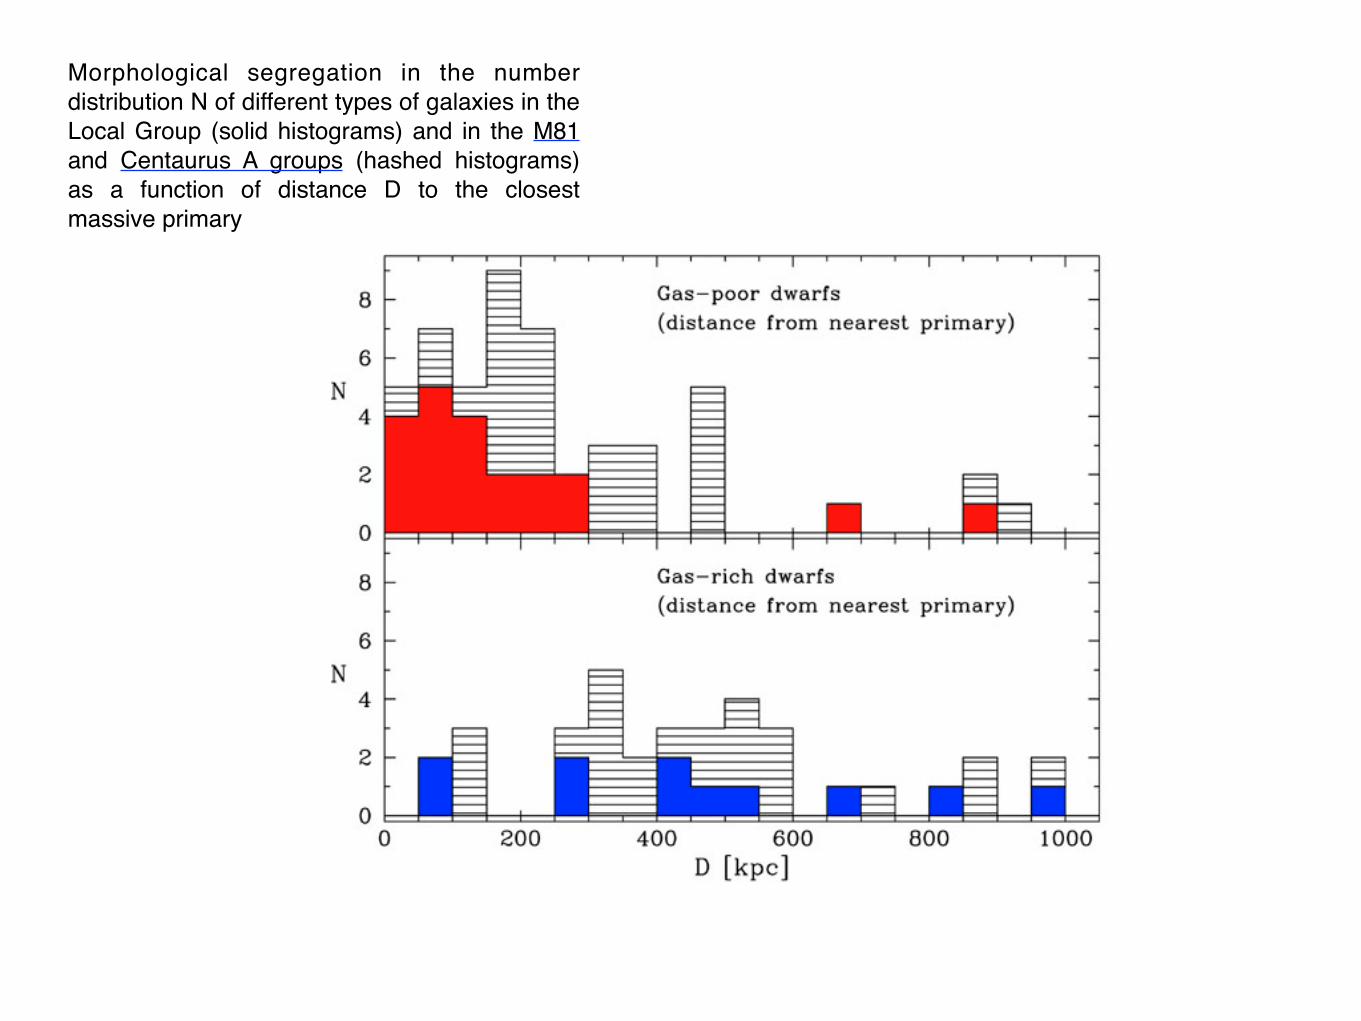
Morphological segregation in the number distribution N of different types of galaxies in the Local Group (solid histograms) and in the M81 and Centaurus A groups (hashed histograms) as a function of distance D to the closest massive primary
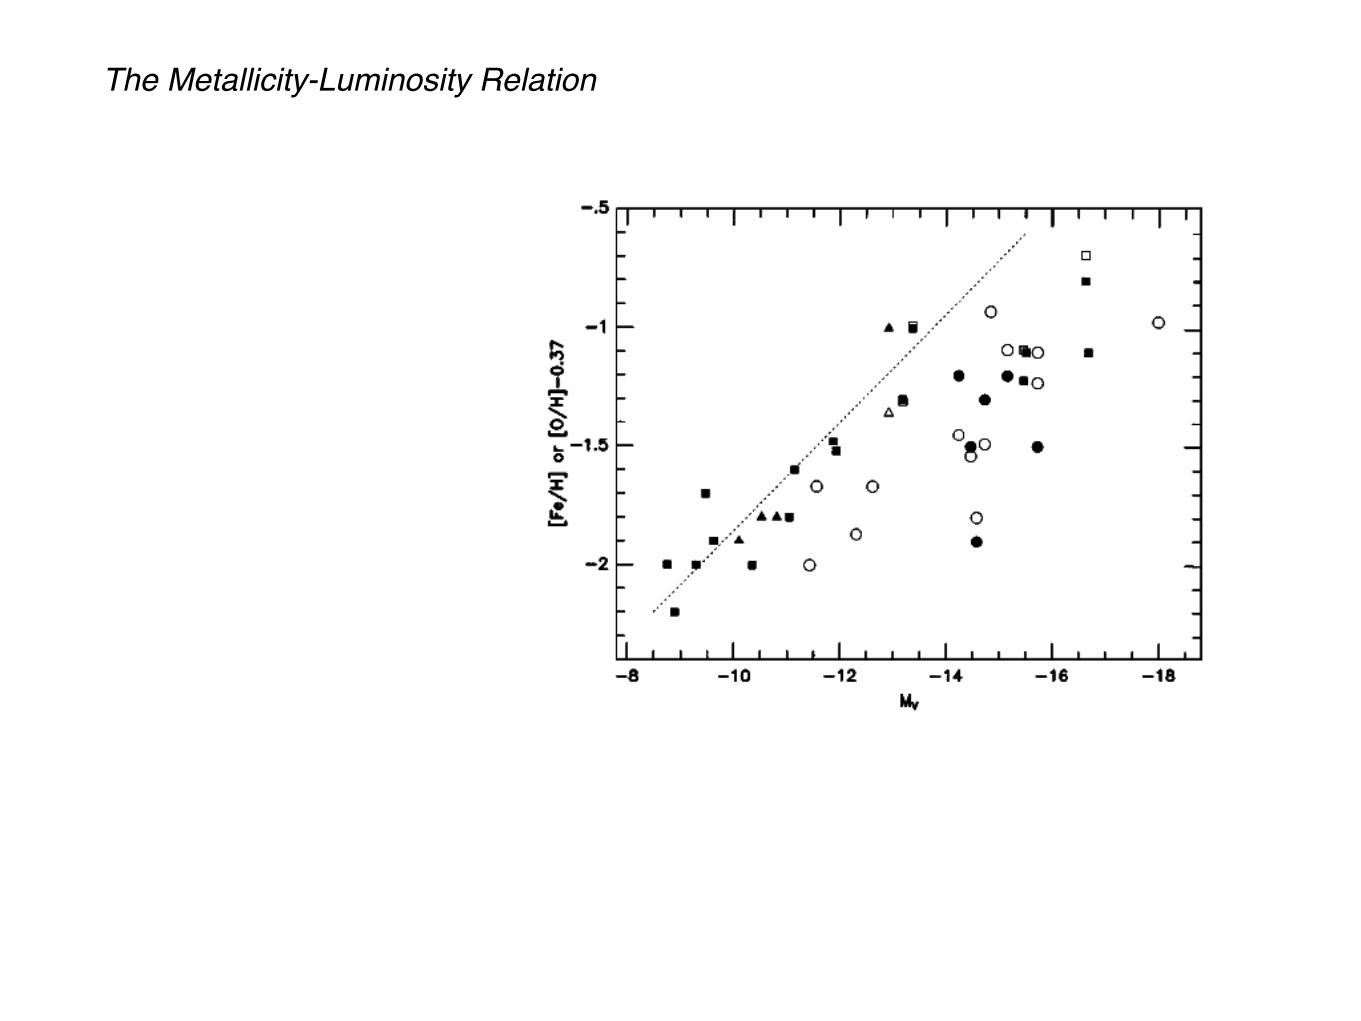
The Metallicity-Luminosity Relation
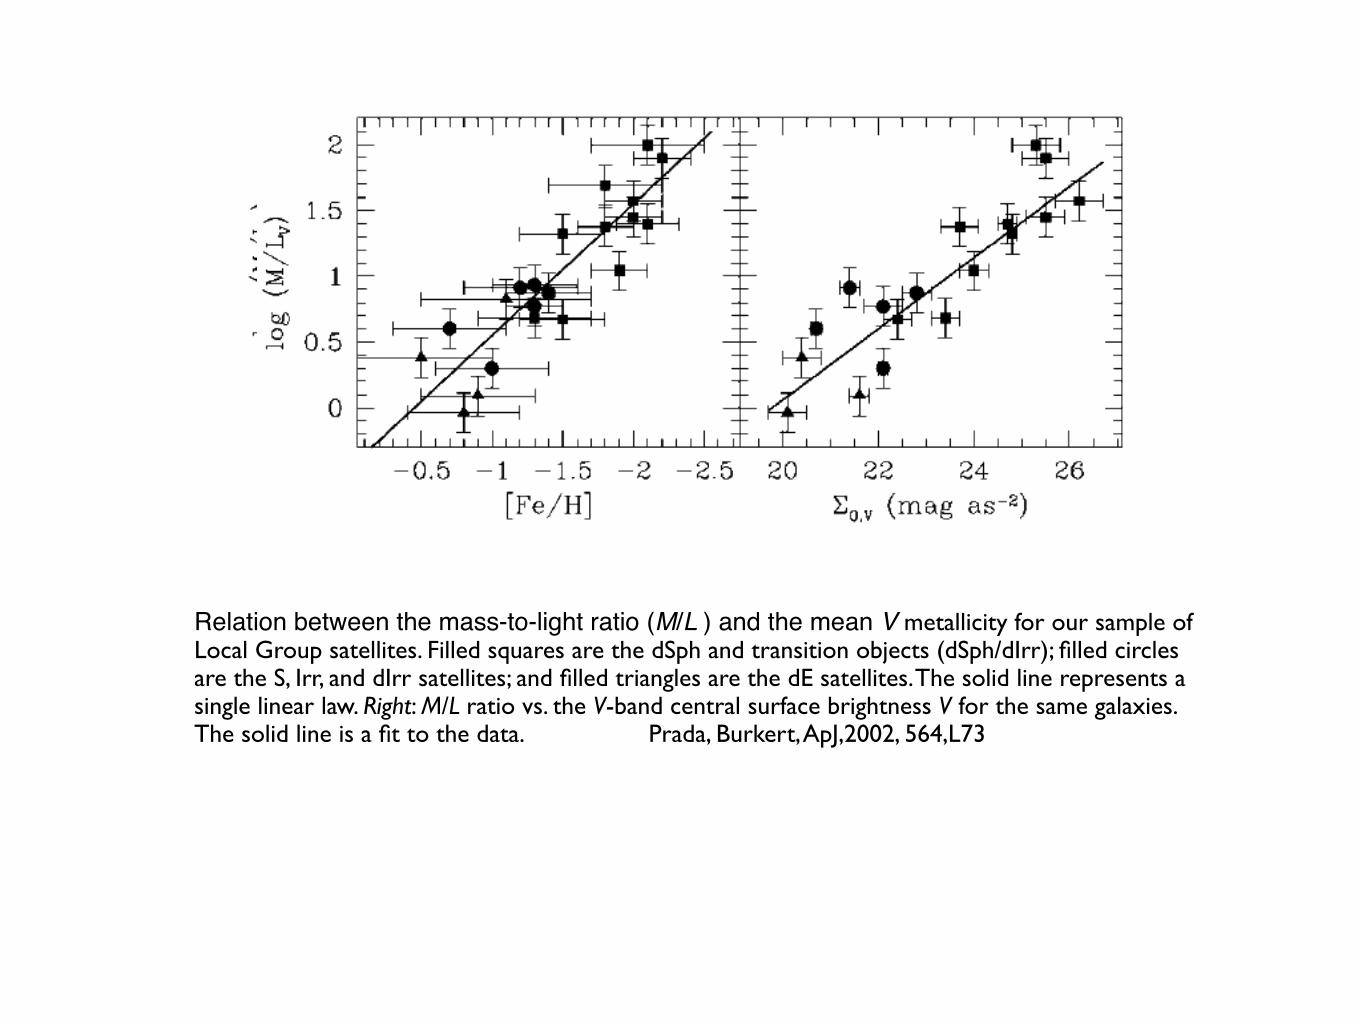
Relation between the mass-to-light ratio (M/L ) and the mean V metallicity for our sample of Local Group satellites. Filled squares are the dSph and transition objects (dSph/dIrr); filled circles are the S, Irr, and dIrr satellites; and filled triangles are the dE satellites. The solid line represents a single linear law. Right: M/L ratio vs. the V-band central surface brightness V for the same galaxies. The solid line is a fit to the data. Prada, Burkert, ApJ,2002, 564,L73
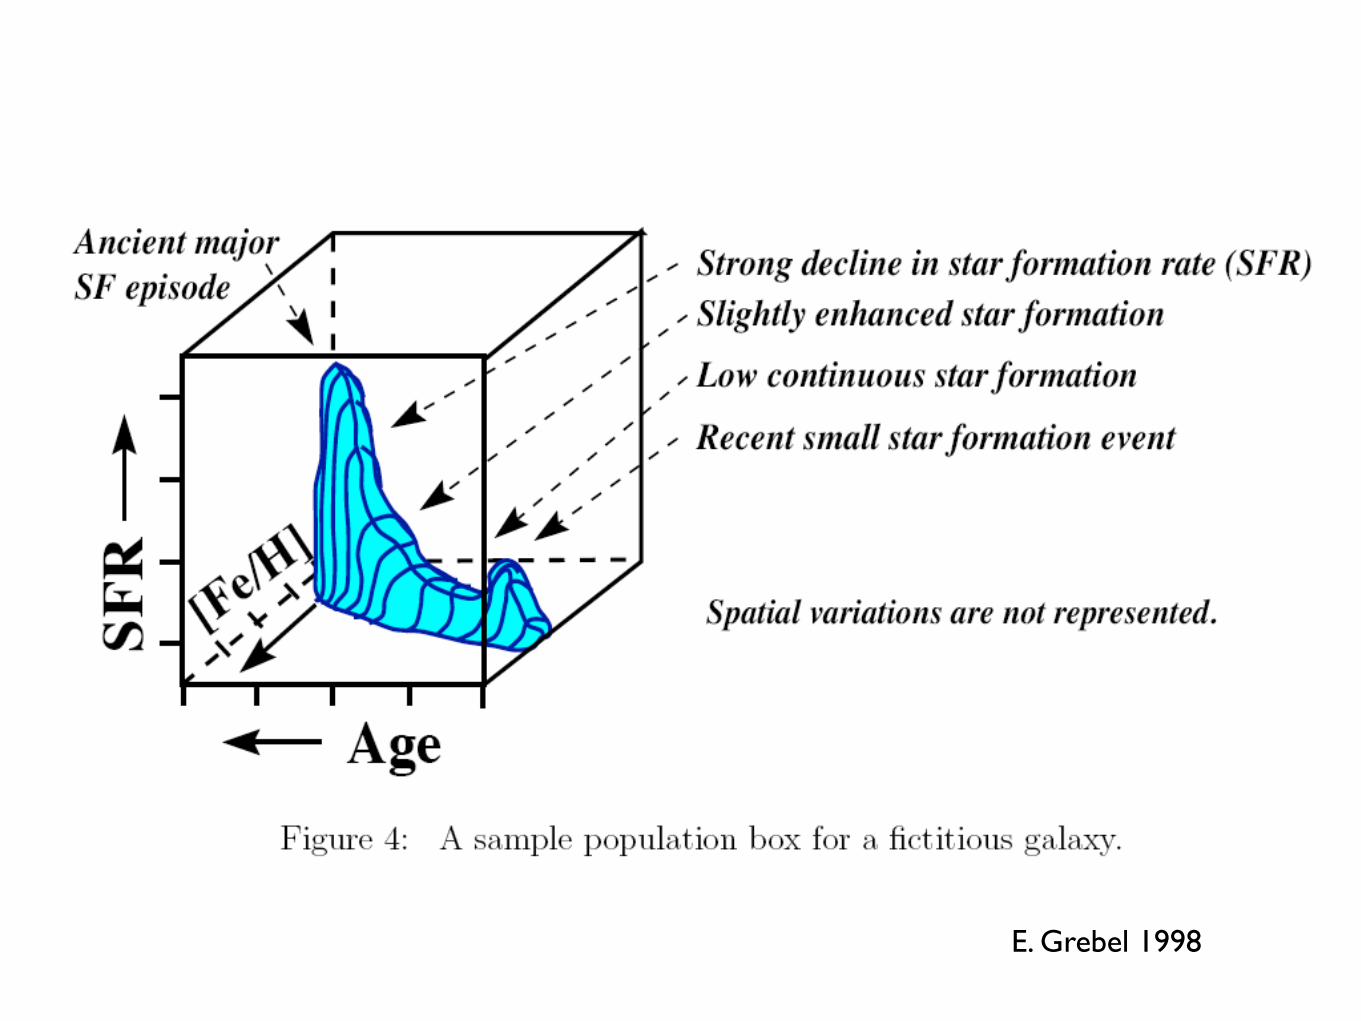
E. Grebel 1998
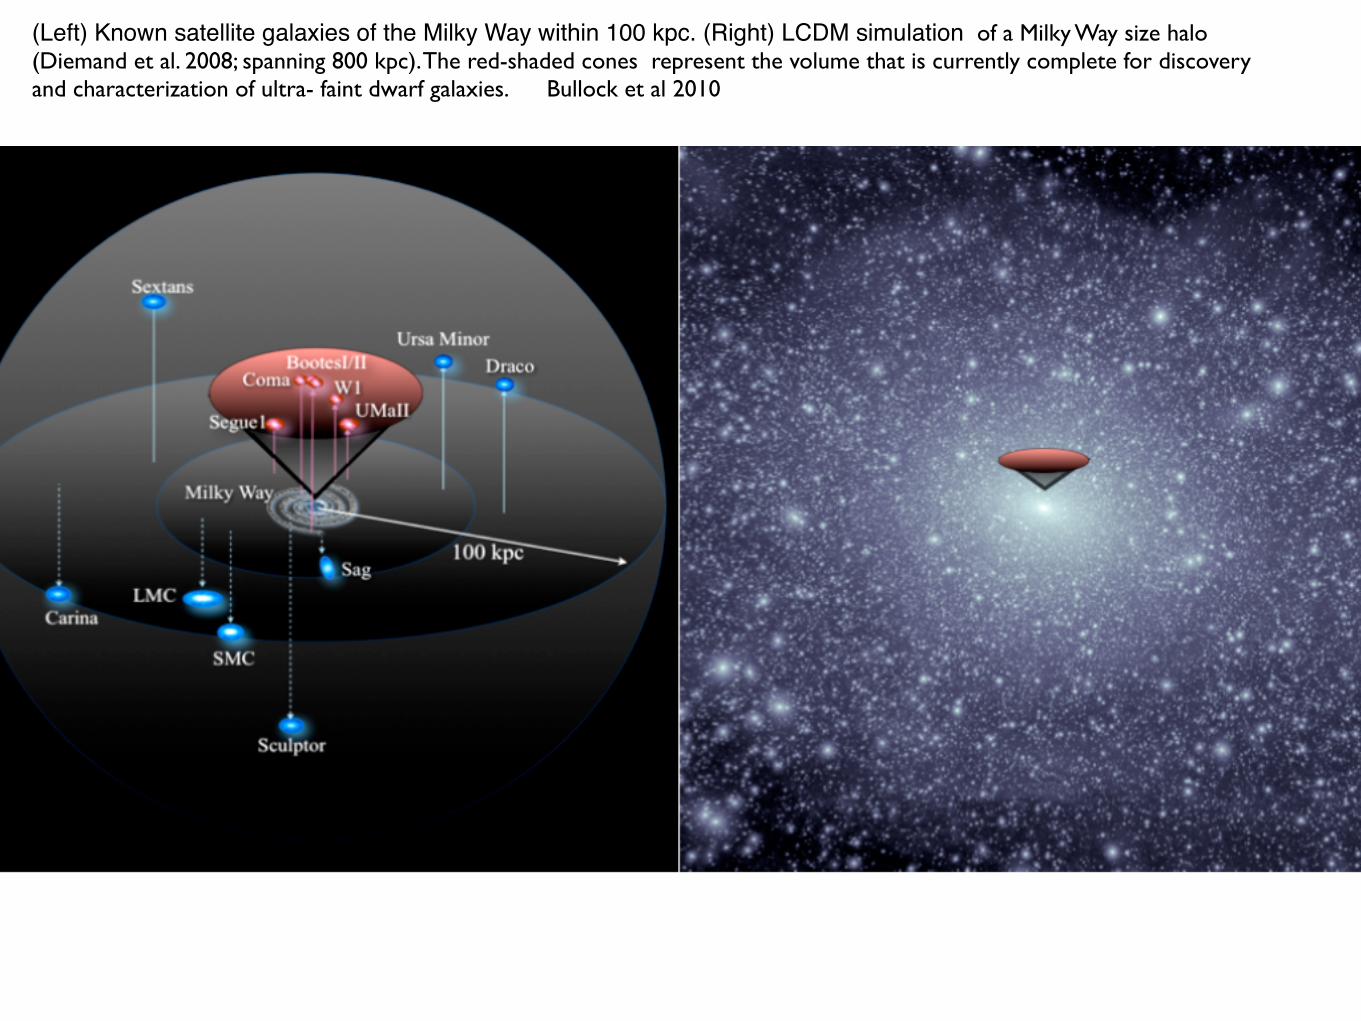
(Left) Known satellite galaxies of the Milky Way within 100 kpc. (Right) LCDM simulation of a Milky Way size halo (Diemand et al. 2008; spanning 800 kpc). The red-shaded cones represent the volume that is currently complete for discovery and characterization of ultra- faint dwarf galaxies. Bullock et al 2010
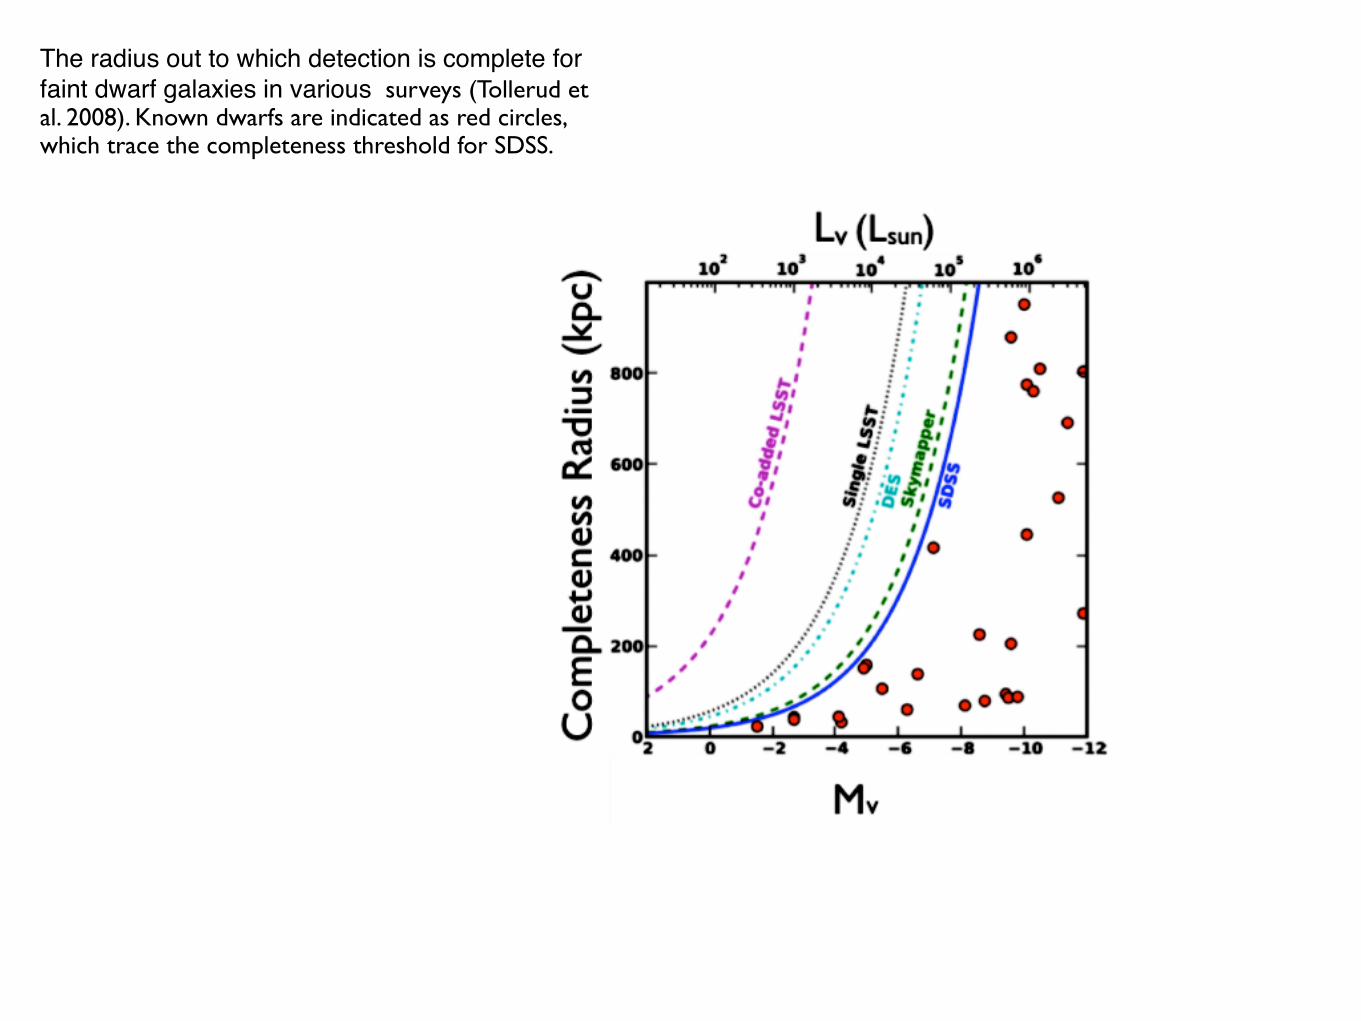
The radius out to which detection is complete for faint dwarf galaxies in various surveys (Tollerud et al. 2008). Known dwarfs are indicated as red circles, which trace the completeness threshold for SDSS.
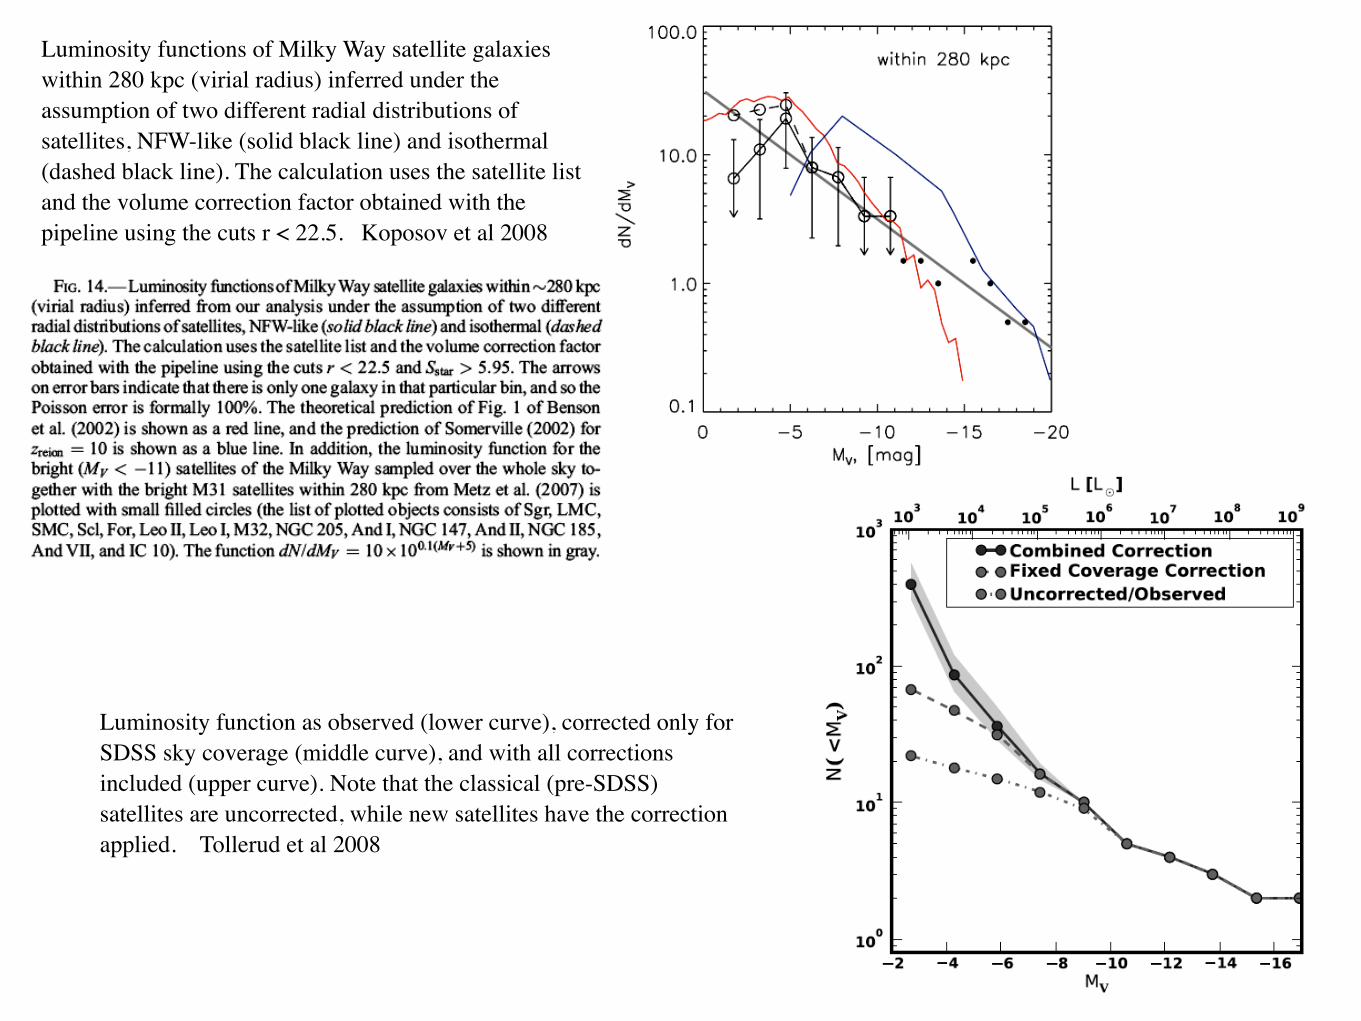
Luminosity functions of Milky Way satellite galaxies within 280 kpc (virial radius) inferred under the assumption of two different radial distributions of satellites, NFW-like (solid black line) and isothermal (dashed black line). The calculation uses the satellite list and the volume correction factor obtained with the pipeline using the cuts r < 22.5. Koposov et al 2008
Luminosity function as observed (lower curve), corrected only for SDSS sky coverage (middle curve), and with all corrections included (upper curve). Note that the classical (pre-SDSS) satellites are uncorrected, while new satellites have the correction applied. Tollerud et al 2008
Structure of Dwarf Spheroidals
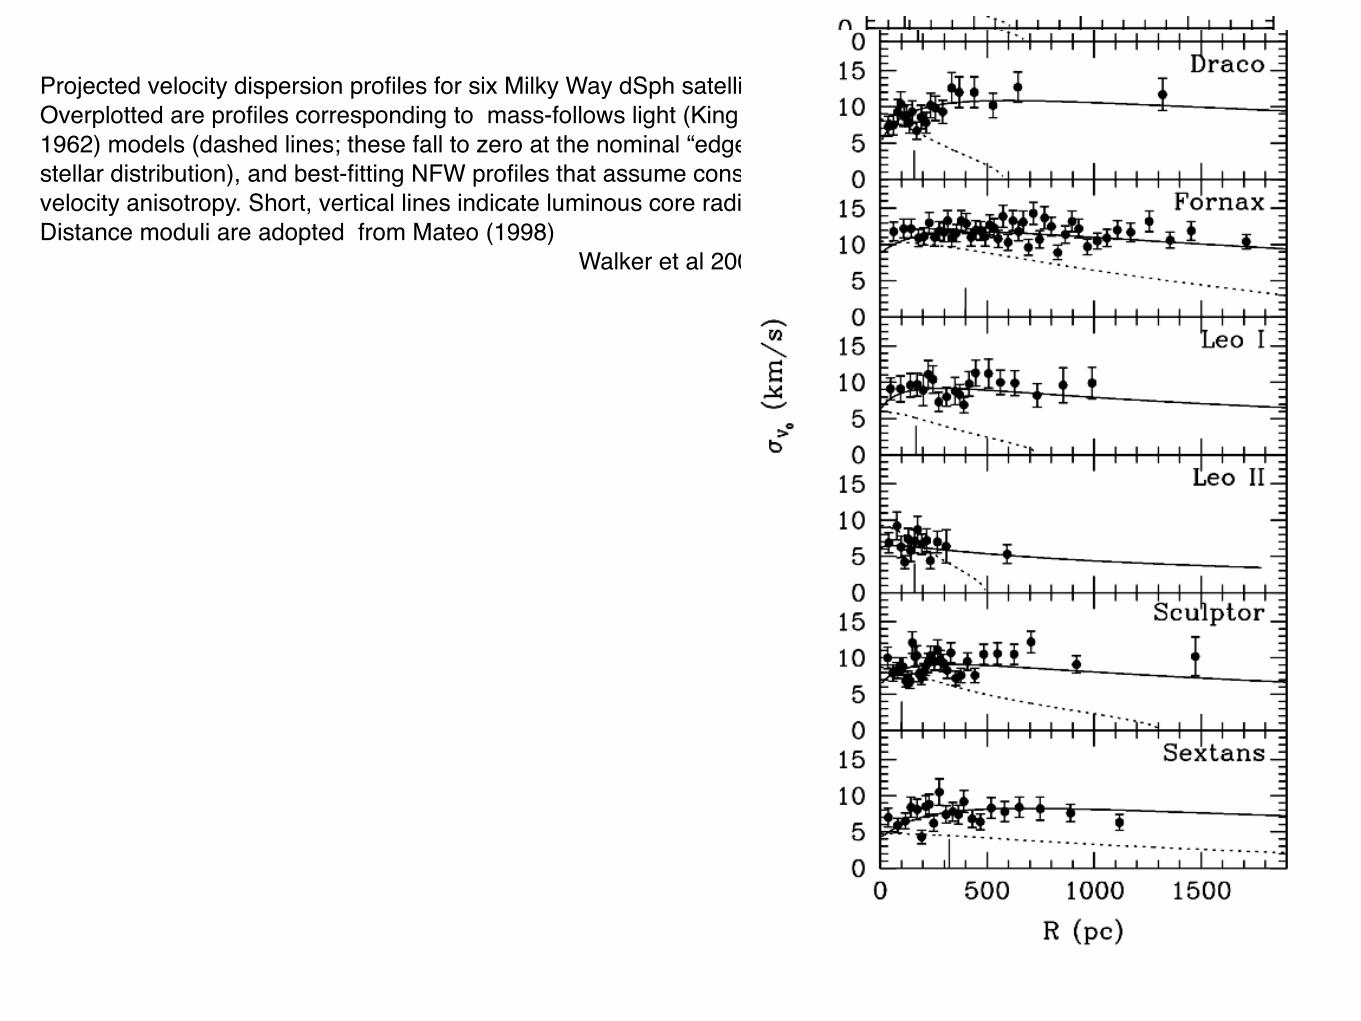
Projected velocity dispersion profiles for six Milky Way dSph satellites. Overplotted are profiles corresponding to mass-follows light (King 1962) models (dashed lines; these fall to zero at the nominal “edge” of stellar distribution), and best-fitting NFW profiles that assume constant velocity anisotropy. Short, vertical lines indicate luminous core radii. Distance moduli are adopted from Mateo (1998)! Walker et al 2007
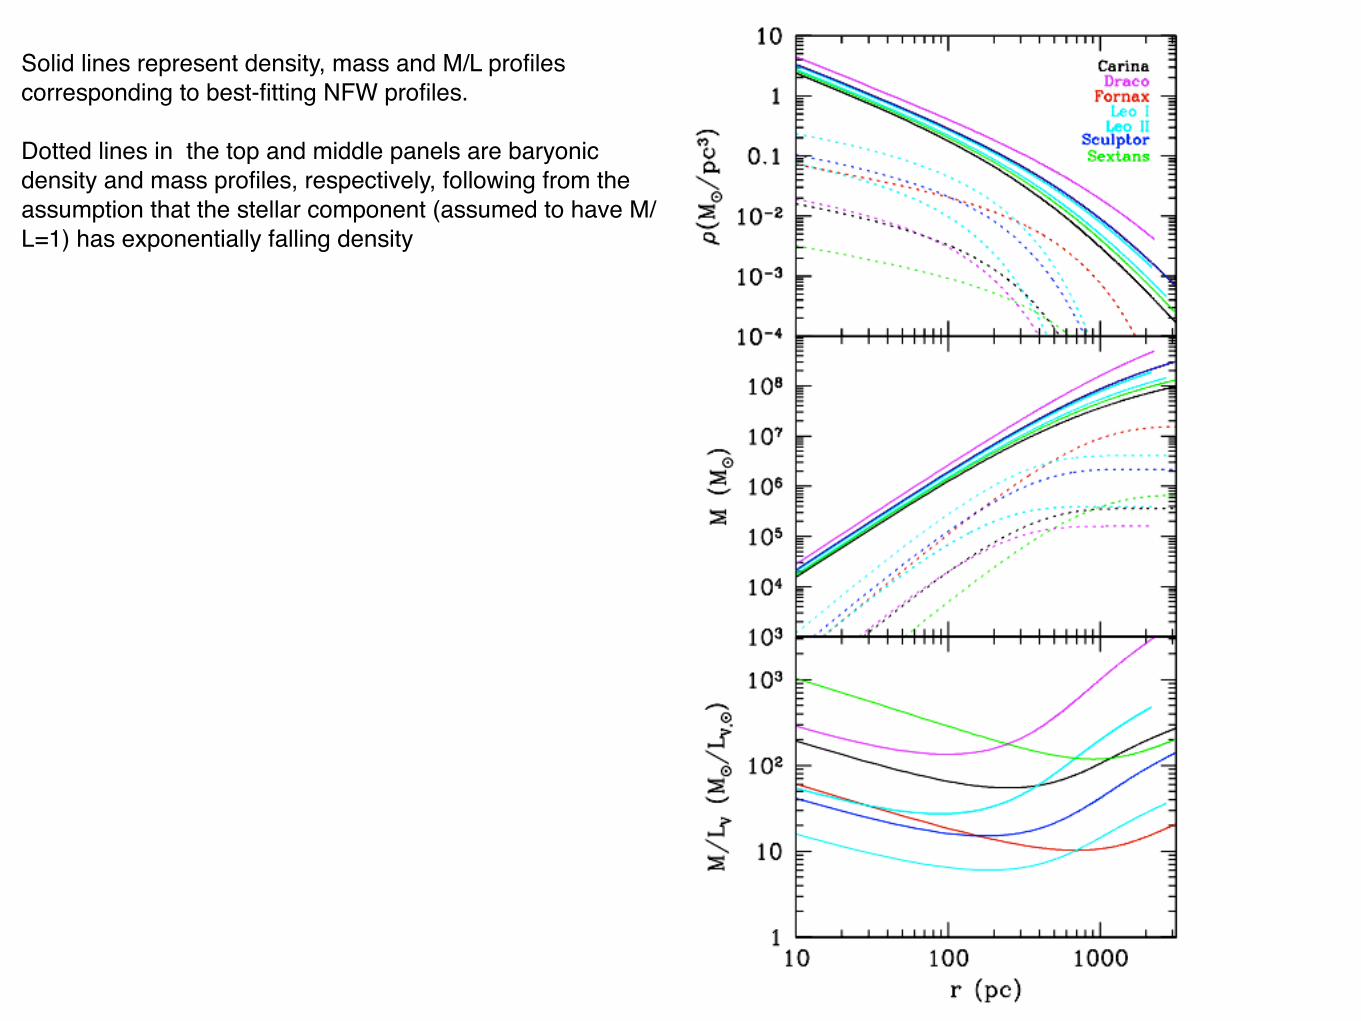
Solid lines represent density, mass and M/L profiles corresponding to best-fitting NFW profiles. !!Dotted lines in the top and middle panels are baryonic density and mass profiles, respectively, following from the assumption that the stellar component (assumed to have M/L=1) has exponentially falling density
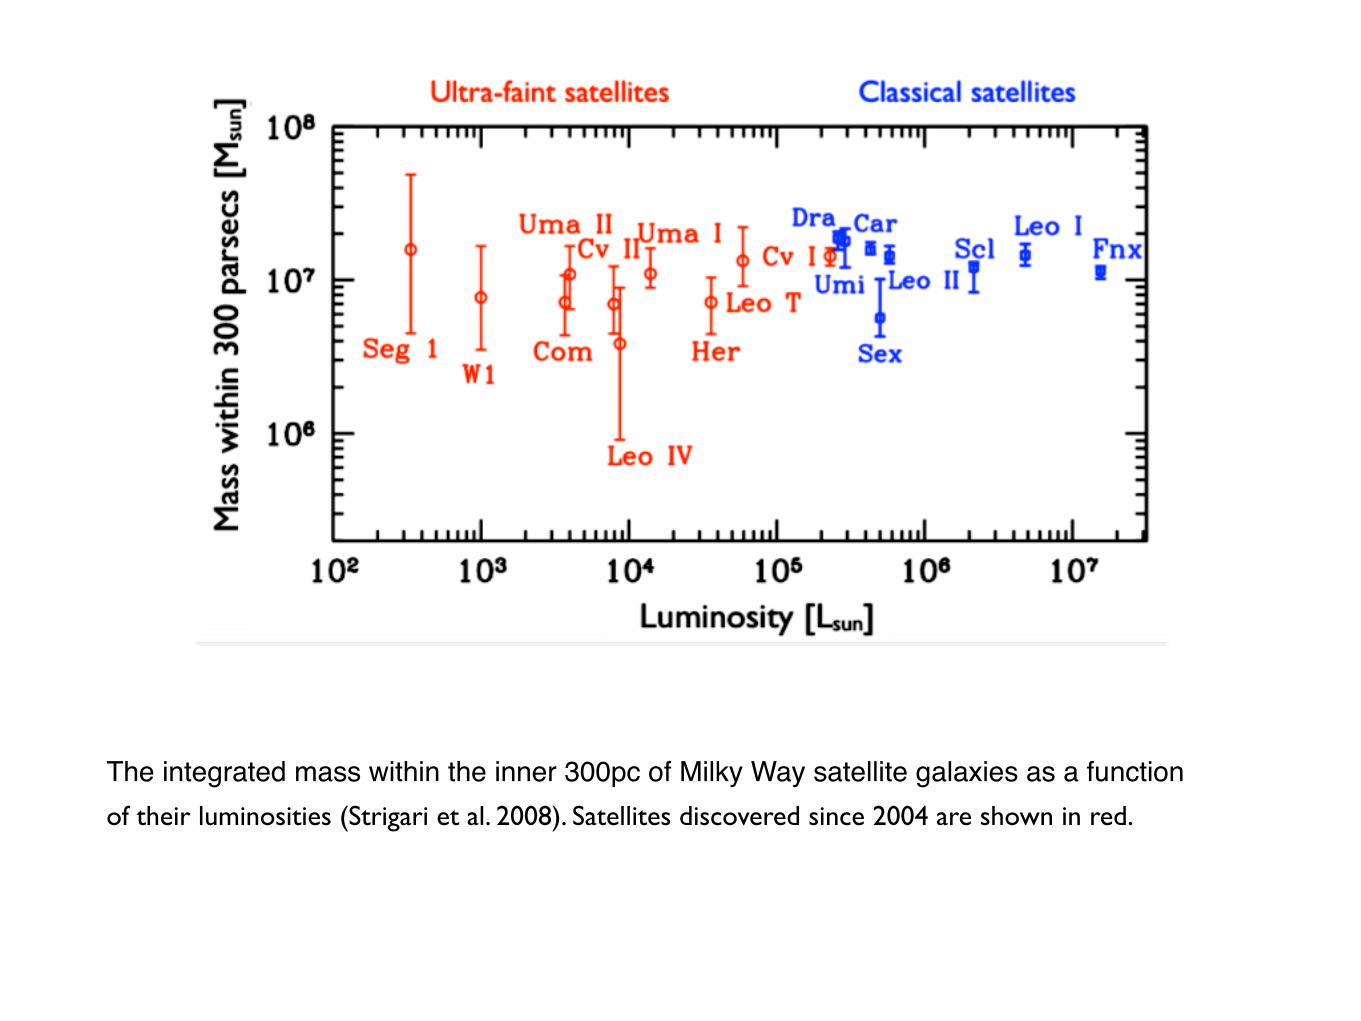
The integrated mass within the inner 300pc of Milky Way satellite galaxies as a function of their luminosities (Strigari et al. 2008). Satellites discovered since 2004 are shown in red.
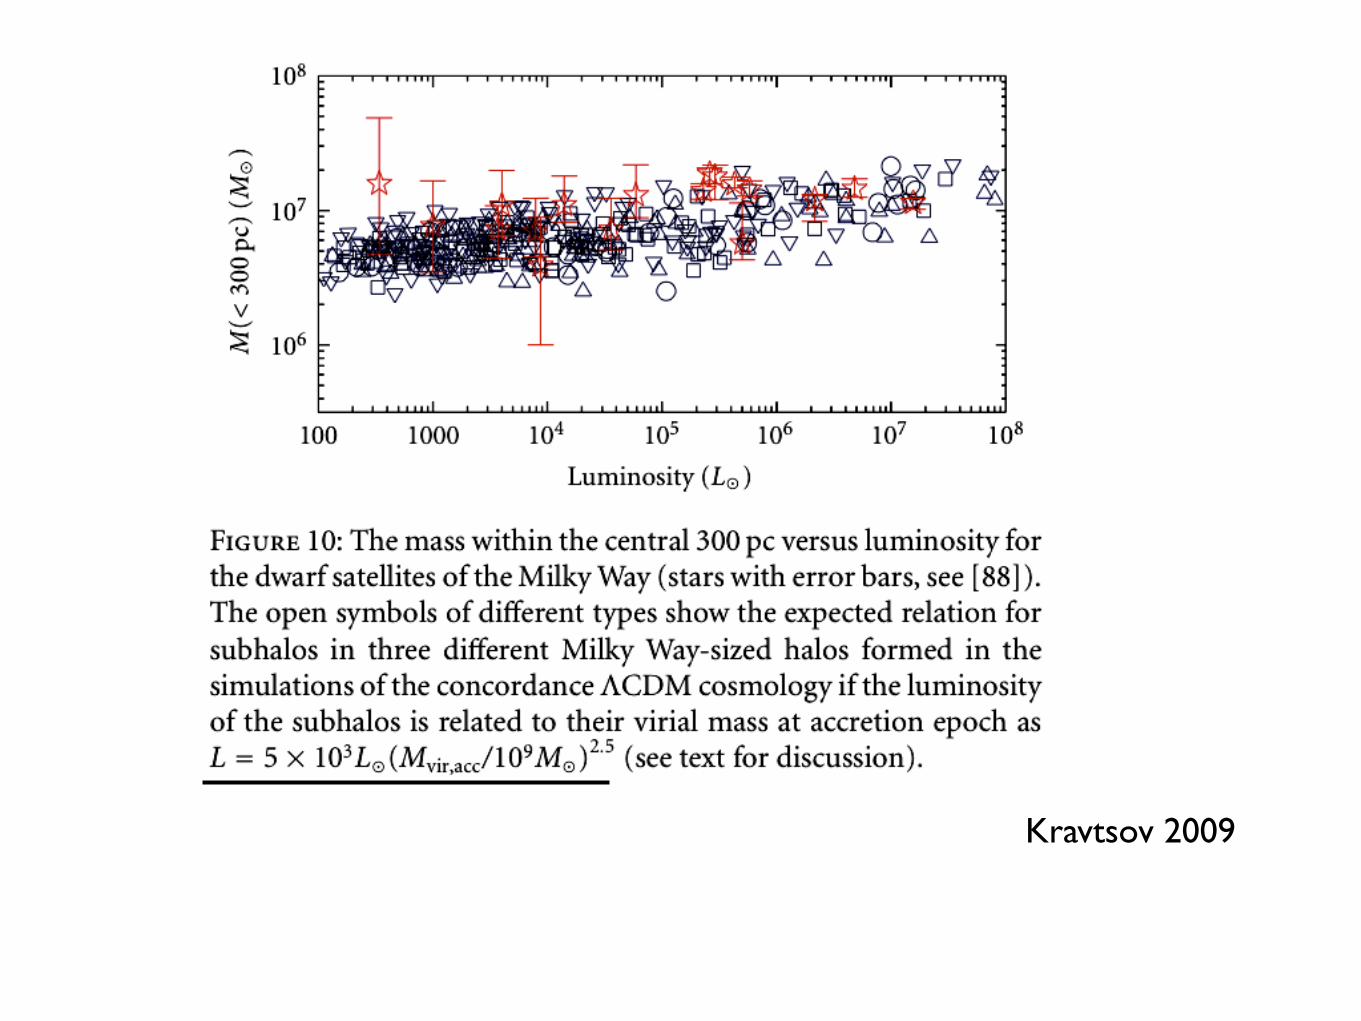
Kravtsov 2009
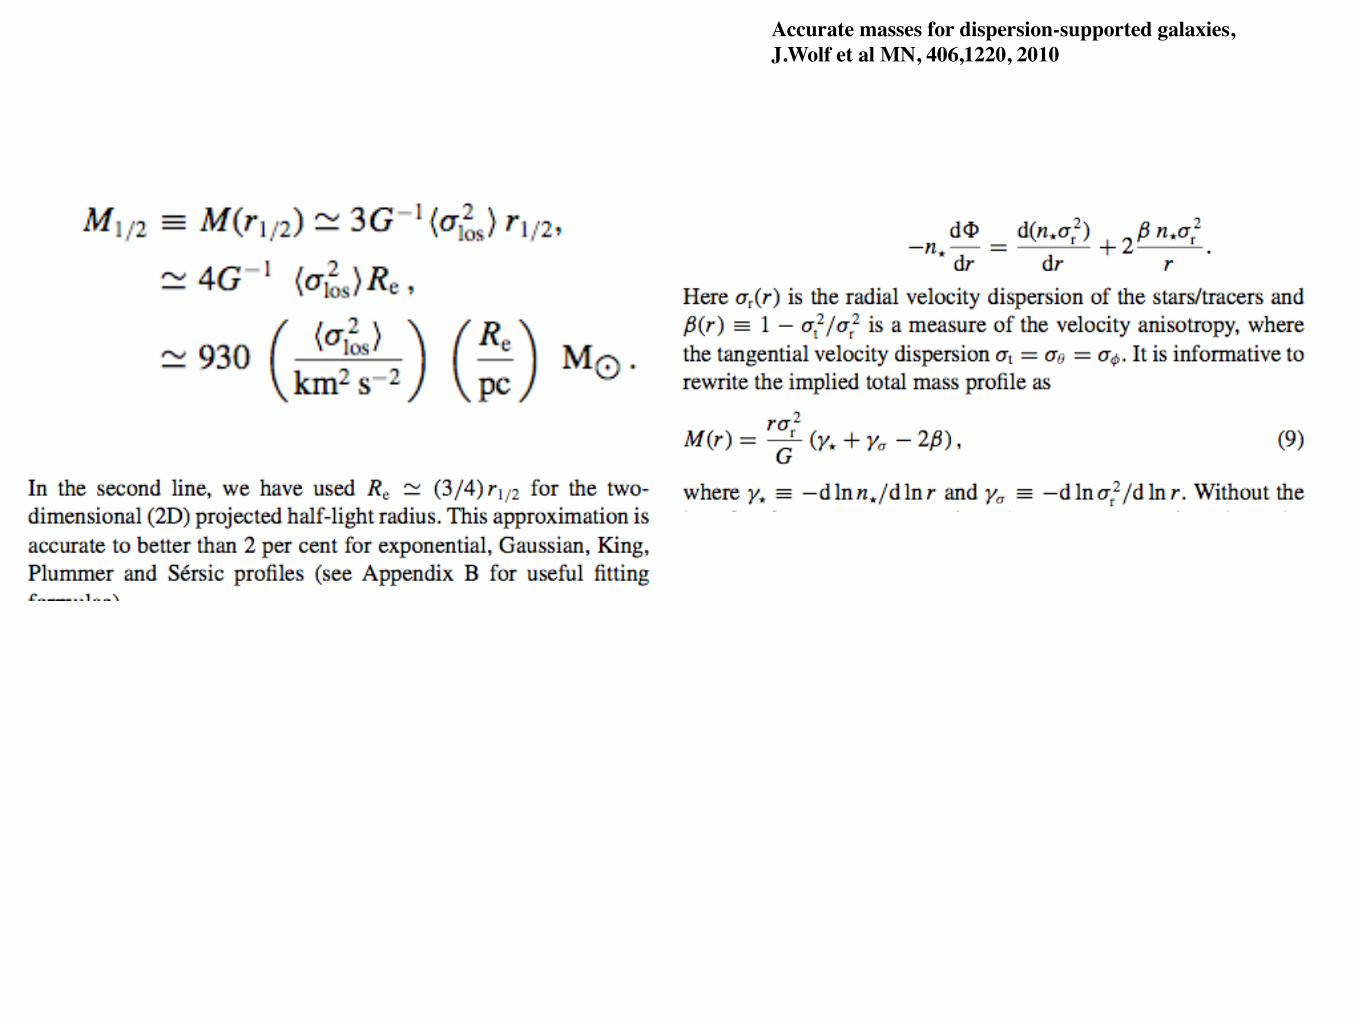
Accurate masses for dispersion-supported galaxies, J.Wolf et al MN, 406,1220, 2010
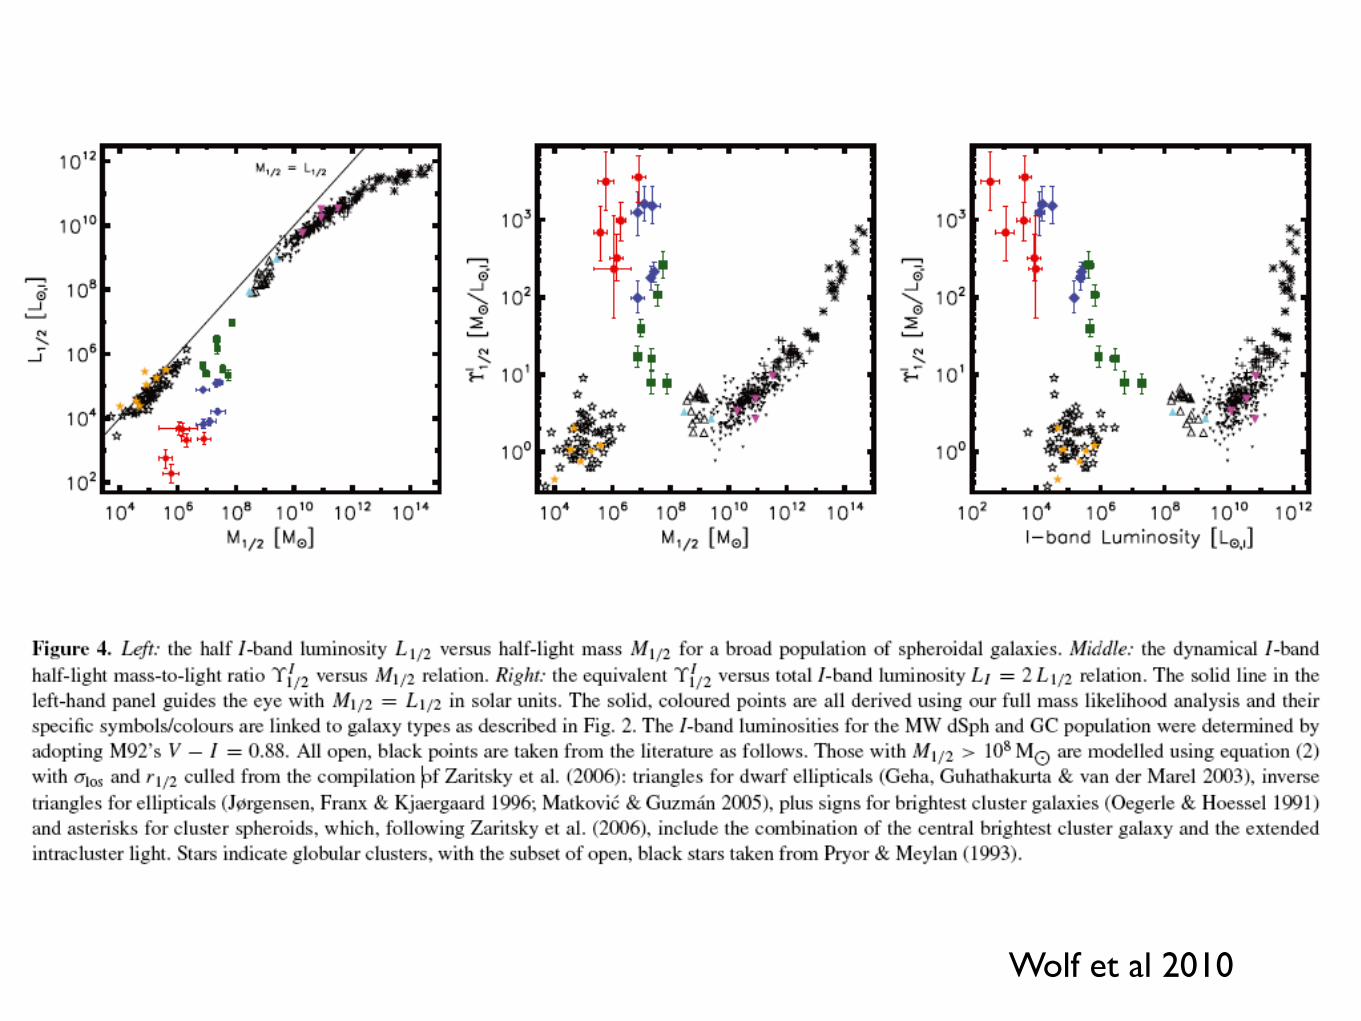
Wolf et al 2010
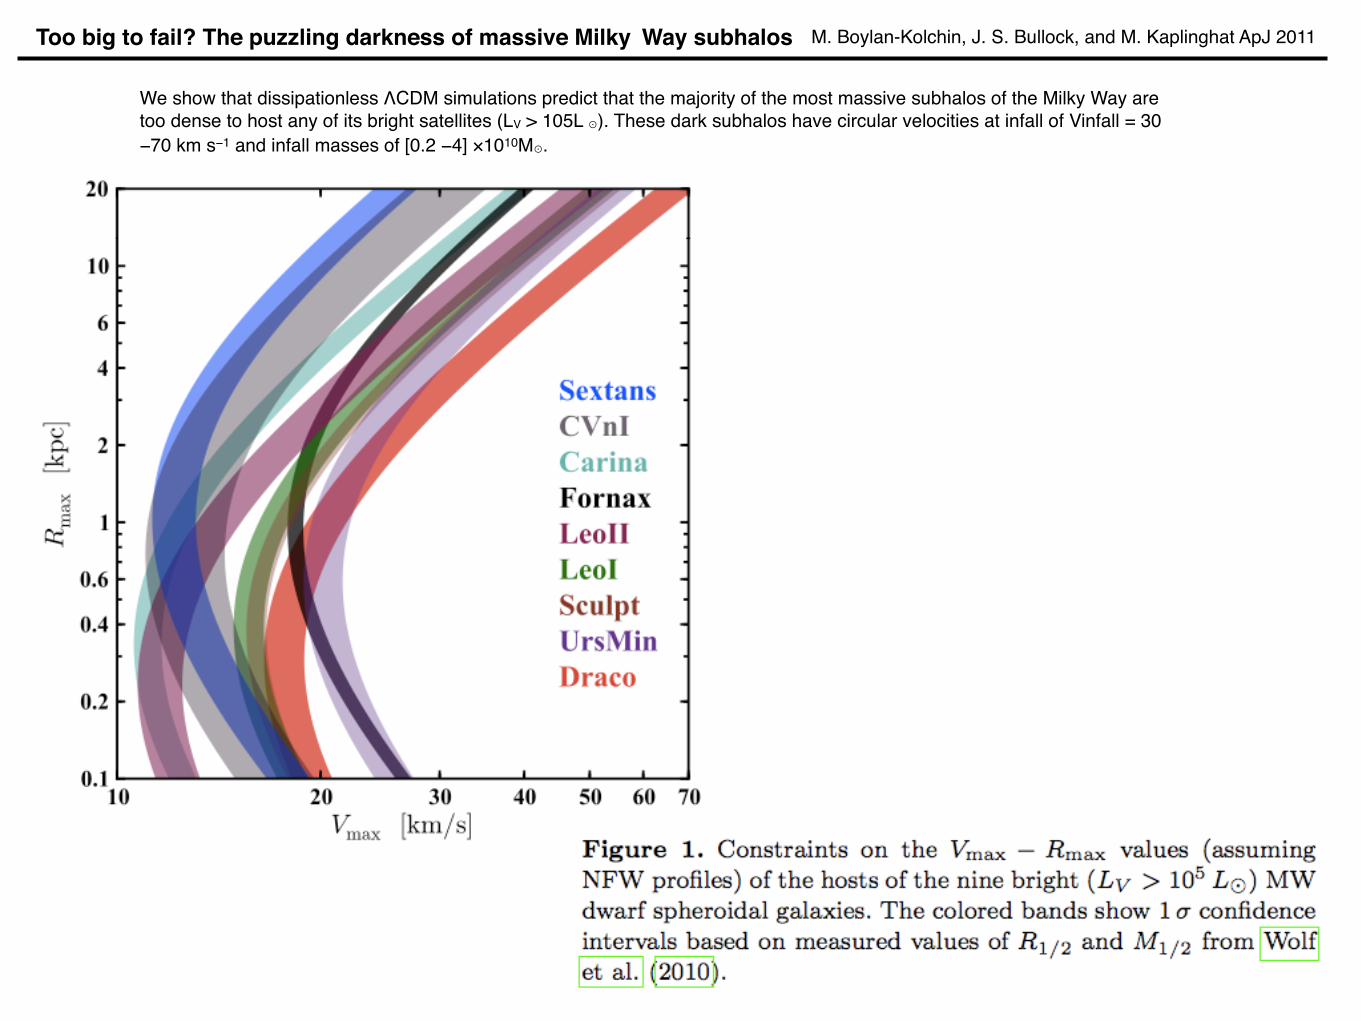
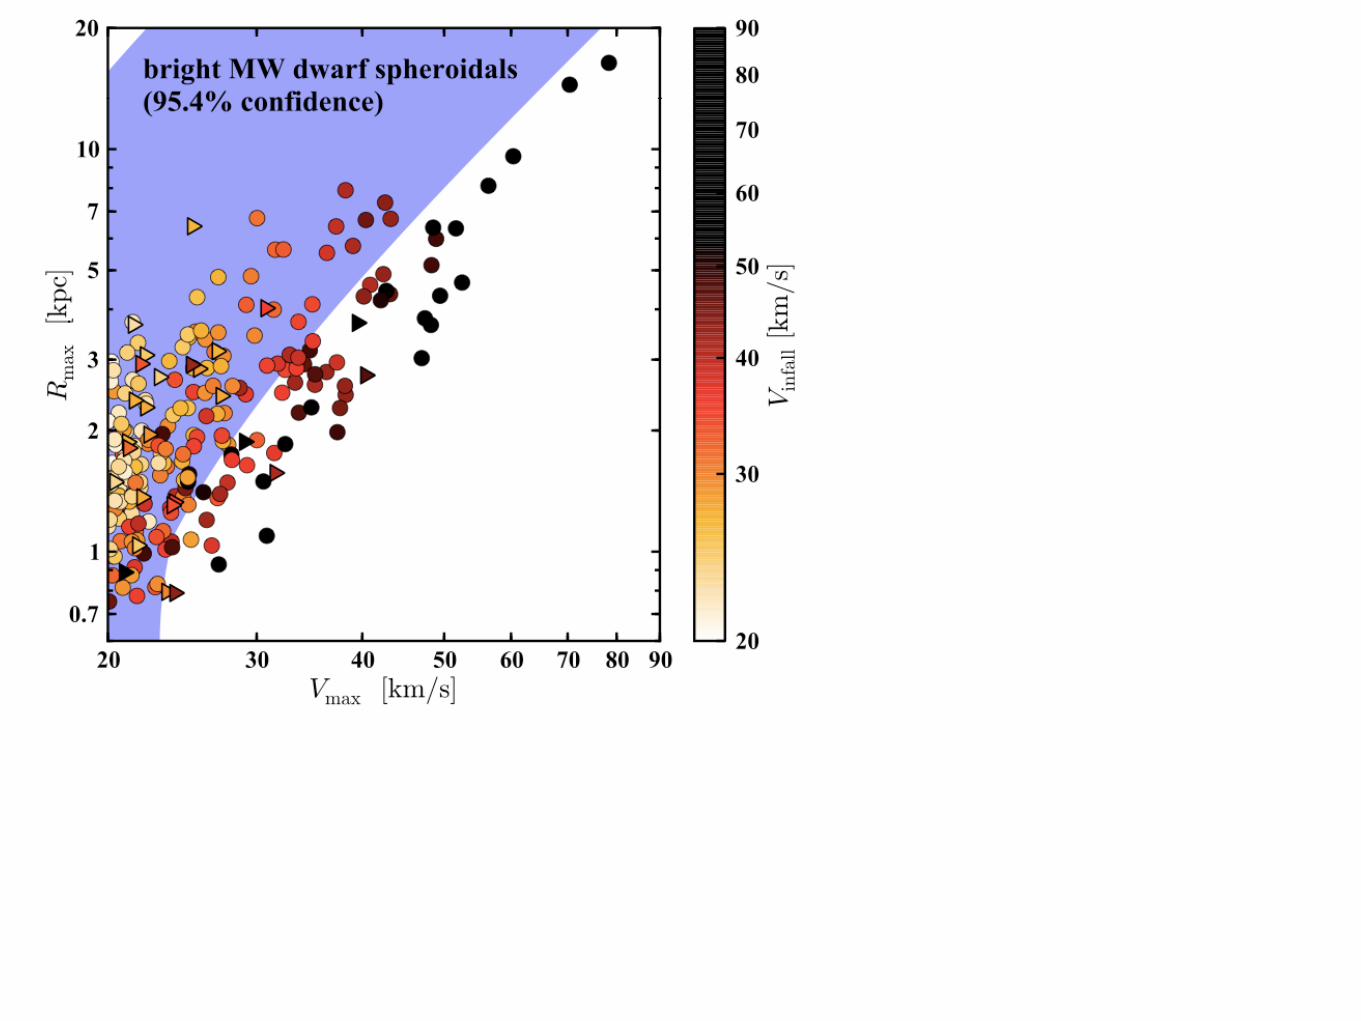
Too big to fail? The puzzling darkness of massive Milky Way subhalos M. Boylan-Kolchin, J. S. Bullock, and M. Kaplinghat ApJ 2011
We show that dissipationless ΛCDM simulations predict that the majority of the most massive subhalos of the Milky Way are too dense to host any of its bright satellites (LV > 105L ⊙). These dark subhalos have circular velocities at infall of Vinfall = 30 −70 km s−1 and infall masses of [0.2 −4] ×1010M⊙.
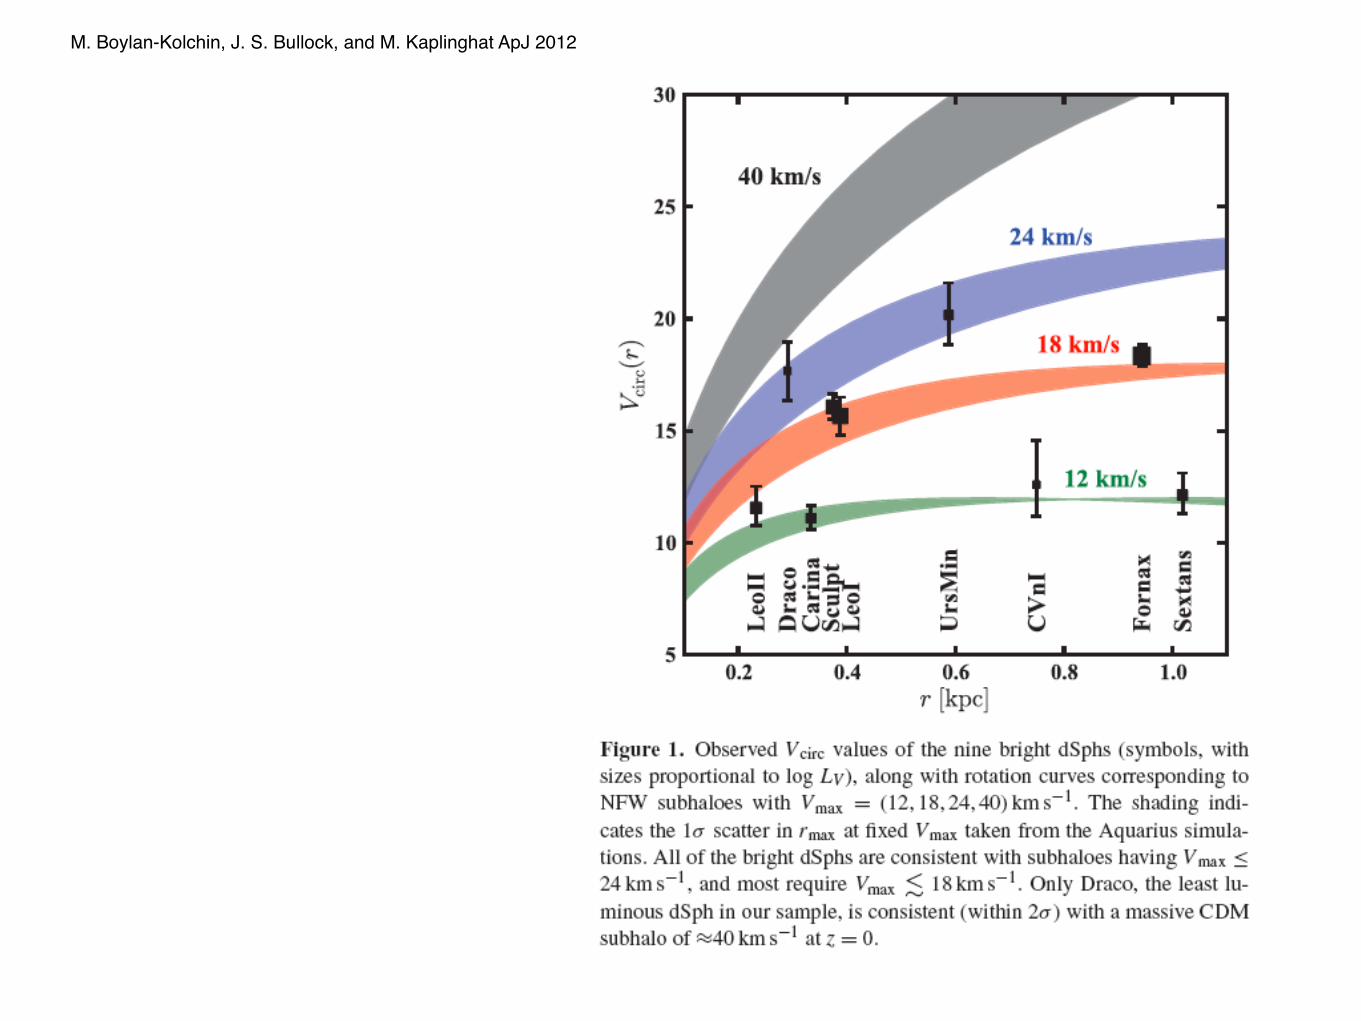
M. Boylan-Kolchin, J. S. Bullock, and M. Kaplinghat ApJ 2012
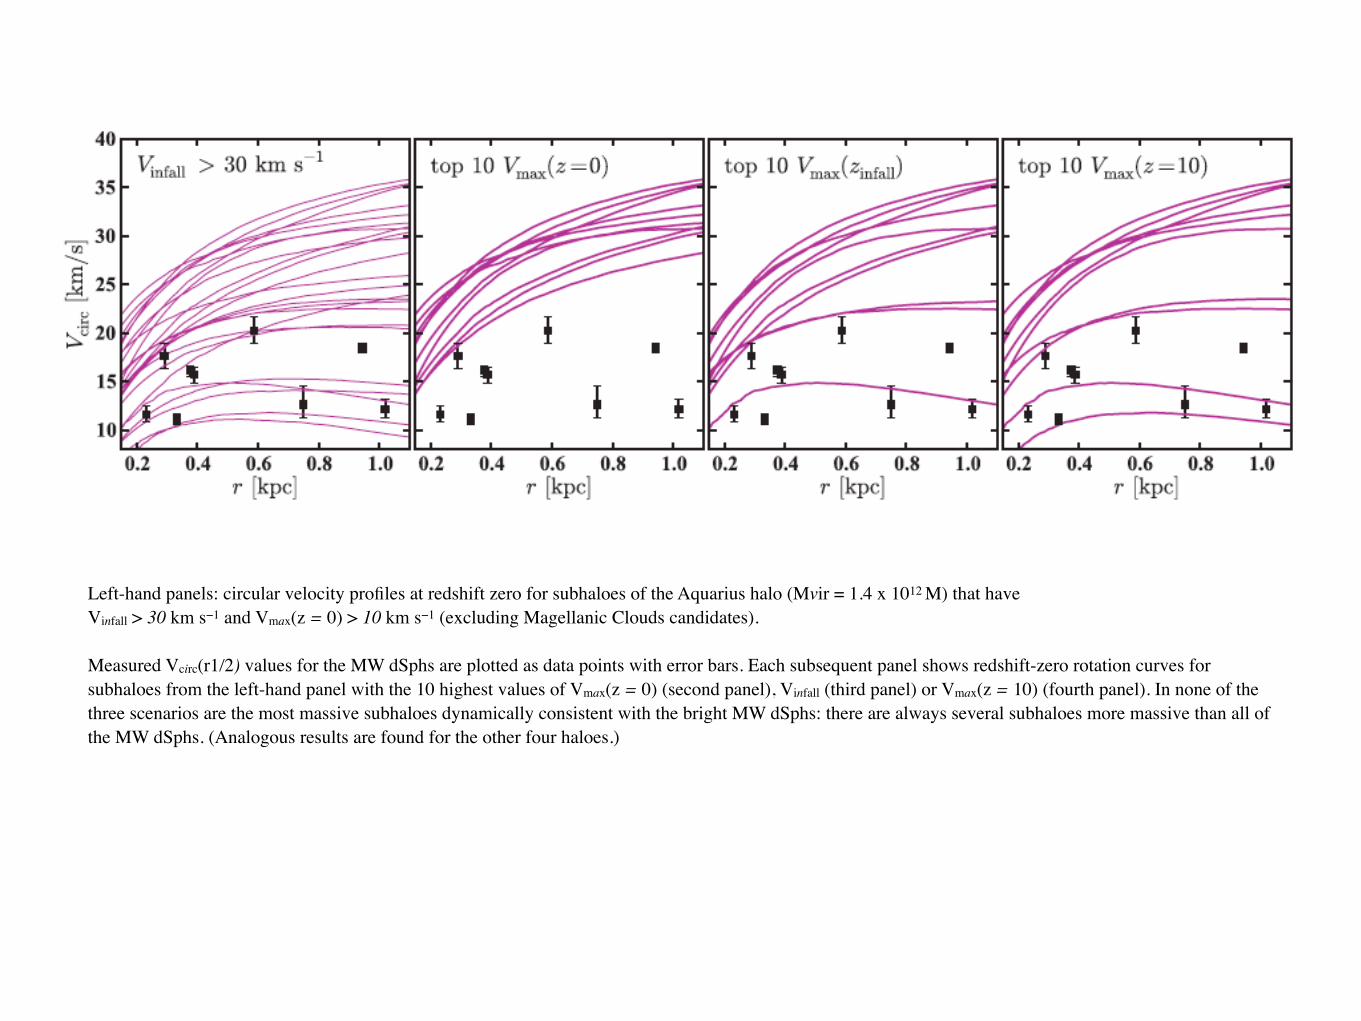
Left-hand panels: circular velocity profiles at redshift zero for subhaloes of the Aquarius halo (Mvir = 1.4 x 10¹² M) that have Vinfall > 30 km s−1 and Vmax(z = 0) > 10 km s−1 (excluding Magellanic Clouds candidates). !Measured Vcirc(r1/2) values for the MW dSphs are plotted as data points with error bars. Each subsequent panel shows redshift-zero rotation curves for subhaloes from the left-hand panel with the 10 highest values of Vmax(z = 0) (second panel), Vinfall (third panel) or Vmax(z = 10) (fourth panel). In none of the three scenarios are the most massive subhaloes dynamically consistent with the bright MW dSphs: there are always several subhaloes more massive than all of the MW dSphs. (Analogous results are found for the other four haloes.)
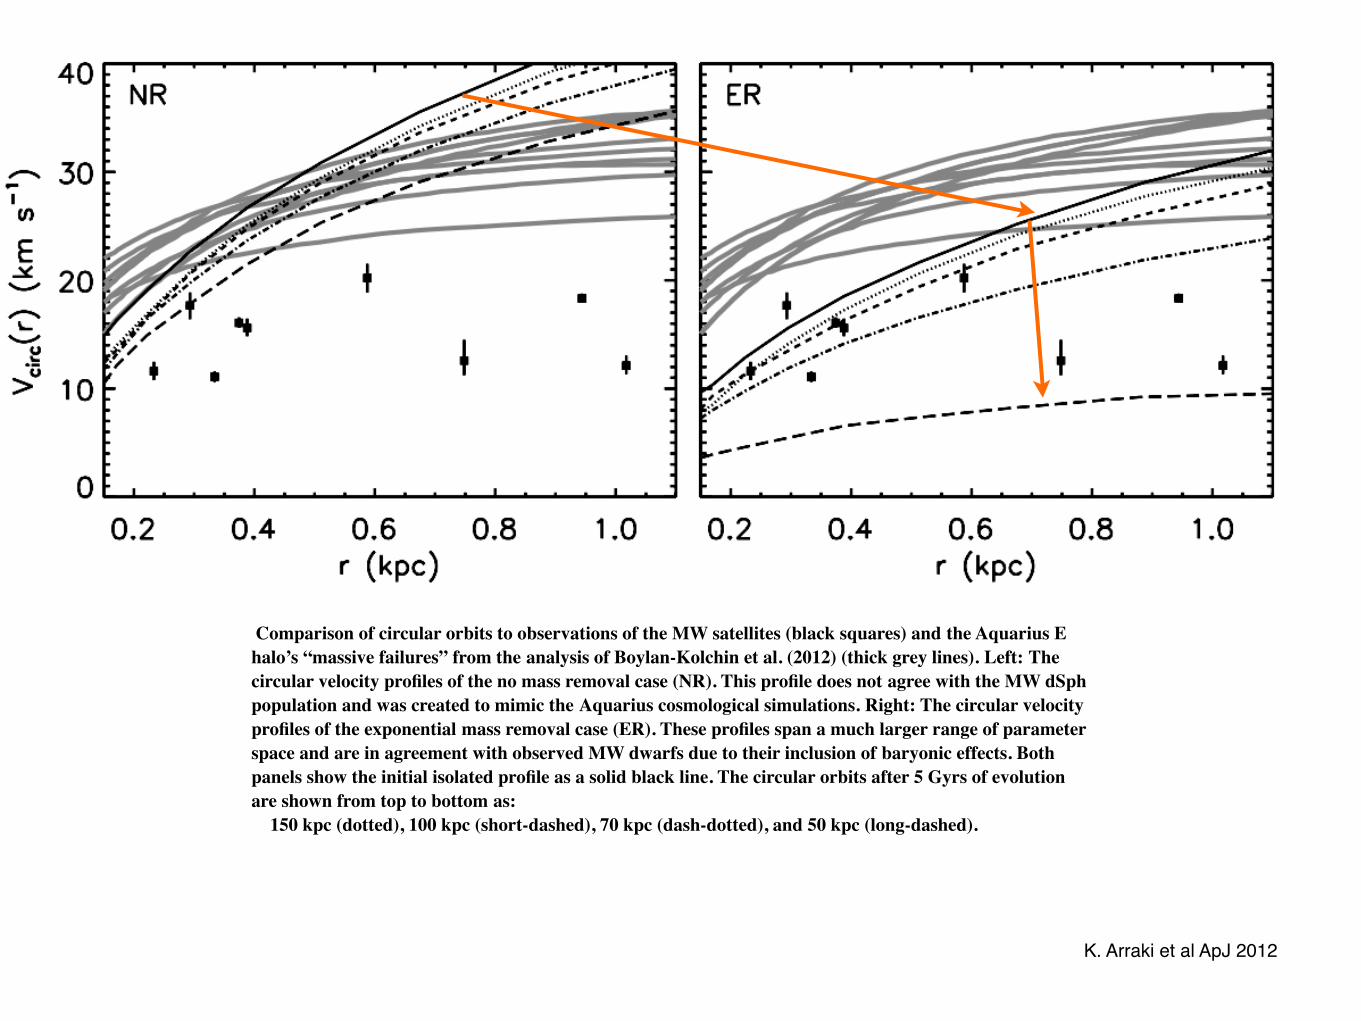
Comparison of circular orbits to observations of the MW satellites (black squares) and the Aquarius E halo’s “massive failures” from the analysis of Boylan-Kolchin et al. (2012) (thick grey lines). Left: The circular velocity profiles of the no mass removal case (NR). This profile does not agree with the MW dSph population and was created to mimic the Aquarius cosmological simulations. Right: The circular velocity profiles of the exponential mass removal case (ER). These profiles span a much larger range of parameter space and are in agreement with observed MW dwarfs due to their inclusion of baryonic effects. Both panels show the initial isolated profile as a solid black line. The circular orbits after 5 Gyrs of evolution are shown from top to bottom as: 150 kpc (dotted), 100 kpc (short-dashed), 70 kpc (dash-dotted), and 50 kpc (long-dashed).
K. Arraki et al ApJ 2012