Embed Size (px)
Citation preview
The Living Murray Icon Sites Monitoring 2013–14
18 February 2016
Prepared by: Victor Hughes, Stuart Little and Gill Whiting

The Living Murray icon sites 2013–14 Monitoring
Published by the Murray‒Darling Basin Authority
Postal Address: GPO Box 1801, Canberra ACT 2601Telephone: (02) 6279 0100 international + 61 2 6279 0100Facsimile: (02) 6248 8053 international + 61 2 6248 8053Email: [email protected]: www.mdba.gov.au
MDBA publication no.: 978-1-925221-45-9
All material and work produced by the Murray‒Darling Basin Authority constitutes Commonwealth copyright. MDBA reserves the right to set out the terms and conditions for the use of such material.
With the exception of the Commonwealth Coat of Arms, photographs, the Murray‒Darling Basin Authority logo or other logos and emblems, any material protected by a trade mark, any content provided by third parties, and where otherwise noted, all material presented in this publication is provided under a Creative Commons Attribution 3.0 Australia licence.
http://creativecommons.org/licenses/by/3.0/au© Murray‒Darling Basin Authority 2016.
The Murray‒Darling Basin Authority’s preference is that you attribute this publication (and any Murray‒Darling Basin Authority material sourced from it) using the following wording within your work:
Title: The Living Murray Icon Sites Monitoring 2013–14Source: Licensed from the Murray‒Darling Basin Authority under a Creative Commons Attribution 3.0 Australia Licence
As far as practicable, material for which the copyright is owned by a third party will be clearly labelled. The Murray‒Darling Basin Authority has made all reasonable efforts to ensure that this material has been reproduced in this publication with the full consent of the copyright owners.
Inquiries regarding the licence and any use of this publication are welcome by contacting the Murray‒Darling Basin Authority.
Cover image: River red gums at Chalka Creek, Hattah Lakes during the 2013–14 watering (photo by Heather Peachey, MDBA)
DisclaimerTo the extent permitted by law, the Murray‒Darling Basin Authority and the Commonwealth excludes all liability to any person for any consequences, including but not limited to all losses, damages, costs, expenses and any other compensation, arising directly or indirectly from using this report (in part or in whole) and any information or material contained within it.
AccessibilityThe Murray‒Darling Basin Authority makes its documents and information available in accessible formats. On some occasions the highly technical nature of the document means that we cannot make some sections fully accessible. If you encounter accessibility problems or the document is in a format that you cannot access, please contact us.
Page 1
The Living Murray icon sites 2013–14 Monitoring
Contents
Executive Summary.........................................................................................................................3
Introduction......................................................................................................................................4
Barmah Forest...............................................................................................................................11
Gunbower Forest...........................................................................................................................20
Hattah Lakes.................................................................................................................................29
Lindsay–Mulcra–Wallpolla Islands................................................................................................40
Chowilla Floodplain.......................................................................................................................50
Lower Lakes, Coorong and Murray Mouth....................................................................................60
River Murray Channel....................................................................................................................74
References....................................................................................................................................80
Appendix A: 2013–14 TLM Monitoring Activities by Icon Site.......................................................85
Page 2

The Living Murray icon sites 2013–14 Monitoring
Executive SummaryThis report brings together results from The Living Murray’s (TLM) 2013–14 monitoring at Barmah Forest, Gunbower Forest, Hattah Lakes, Lindsay–Mulcra–Wallpolla Islands, Chowilla Floodplain and the Lower Lakes, Coorong and Murray Mouth icon sites. This monitoring includes annual condition monitoring of vegetation, fish and waterbirds and intervention monitoring associated with 2013–14 environmental watering events.
In 2013–14 the focus of TLM environmental water delivery was Barmah Forest; the first time commissioning of environmental water management structures at Mulcra Island and Hattah Lakes; and the Lower Lakes, Coorong and Murray Mouth. To allow the ongoing construction of environmental water management structures, only small environmental waterings occurred at Gunbower Forest and the Chowilla Floodplain.
Based on reports prepared by icon site managers and monitoring service providers, this report summarises TLM monitoring at each icon site in the context of antecedent conditions and environmental watering, providing evidence on the status of biota and progress towards icon site ecological objectives.
Monitoring shows that in 2013–14 generally ecological conditions at these icon sites had either improved or remained stable. Some sites continued to see positive responses initiated by natural floods in 2010–11 and subsequent environmental waterings, while fish communities at a number of icon sites are still recovering from the blackwater event in 2011.
With the exception of Chowilla (which was kept dry to allow construction), the condition of floodplain vegetation was either maintained or improved, with sites that received water during the drought, or that were close to the River Murray, in better condition than surrounding areas.
The condition and diversity of wetland vegetation in 2013–14 varied across icon sites, depending on whether wetlands were inundated or were in a drying phase. High diversity was recorded in drying wetlands that provided a diverse ranges of habitats. While lower diversity was recorded at fully inundated wetlands because they only provide a single habitat. The presence of water in wetlands also resulted in improvements in waterbird numbers at several icon sites.
In 2013–14 environmental water delivery on the back of natural flows provided significant ecological benefits to the Lower Lakes, Coorong and Murray Mouth. Continuous barrage releases kept the Murray Mouth open all year around and improved salinity levels below target thresholds in the South Lagoon of the Coorong. The reduced salinities and freshwater flows into the Coorong contributed to the high diversity of fish species, such as congollis (Pseudaphritis urvillii) and common galaxias (Galaxias maculatus) moving through the barrages fishways.
Page 3
The Living Murray icon sites 2013–14 Monitoring
IntroductionThroughout the 1980s and 1990s significant environmental problems, such as salinity started to become apparent in the River Murray system. River regulation and over allocation were found to have severely affected the ecology of the River Murray and its wetlands (MDBA 2011).
In 1995 the Murray–Darling Basin Ministerial Council agreed to cap water extractions from the Murray–Darling Basin rivers. This agreement was known as the Cap Agreement. While this was a significant first step to balancing social, economic and environmental needs, by 2002 there was compelling evidence that the health of the river would continue to decline without intervention (MDBA 2011).
In response, The Living Murray (TLM) was established in 2002 as a First Step in restoring the health of the River Murray, to ensure a healthy working river for the benefit of all Australians. It is a joint partnership between the Australian, Australian Capital Territory, New South Wales, South Australian and Victorian governments. The First Step objectives included recovery of 500 gigalitres (GL) of water for the environment, building of water management infrastructure to maximise the benefits of that water, and delivery of the water to improve the health of the six icon sites. Water recovery began in 2007–08 and was almost complete in 2009–10. The low water allocations during the Millennium drought highlighted that further work need to be done in order to balance competing demands for water resources across the Murray–Darling Basin.
The Basin Plan which came into effect in November 2012, provides the framework for a coordinated approach to water use in the Murray–Darling Basin. Developed under the Water Act 2007 (Cwth), the Basin Plan seeks to ensure that enough water is available to support productive industries, farmers and communities into the future, while leaving sufficient water in the Basin’s river systems for a healthy environment. The Basin Plan provides for the recovery of an additional 2750 GL of water for the environment. The Living Murray icon sites are included as key environmental assets within the Basin Plan.
A central part of the Basin Plan is the Basin-wide Environmental Watering Strategy (2014) that sets out the expected environmental outcomes from the implementation of the Basin Plan. The Living Murray’s activities are consistent with the objectives of the Basin Environmental Watering Strategy and seek to align with Basin annual watering priorities. Living Murray environmental watering activities aim to maximise environmental outcomes while having regard to water quality and salinity targets of the Basin Plan.
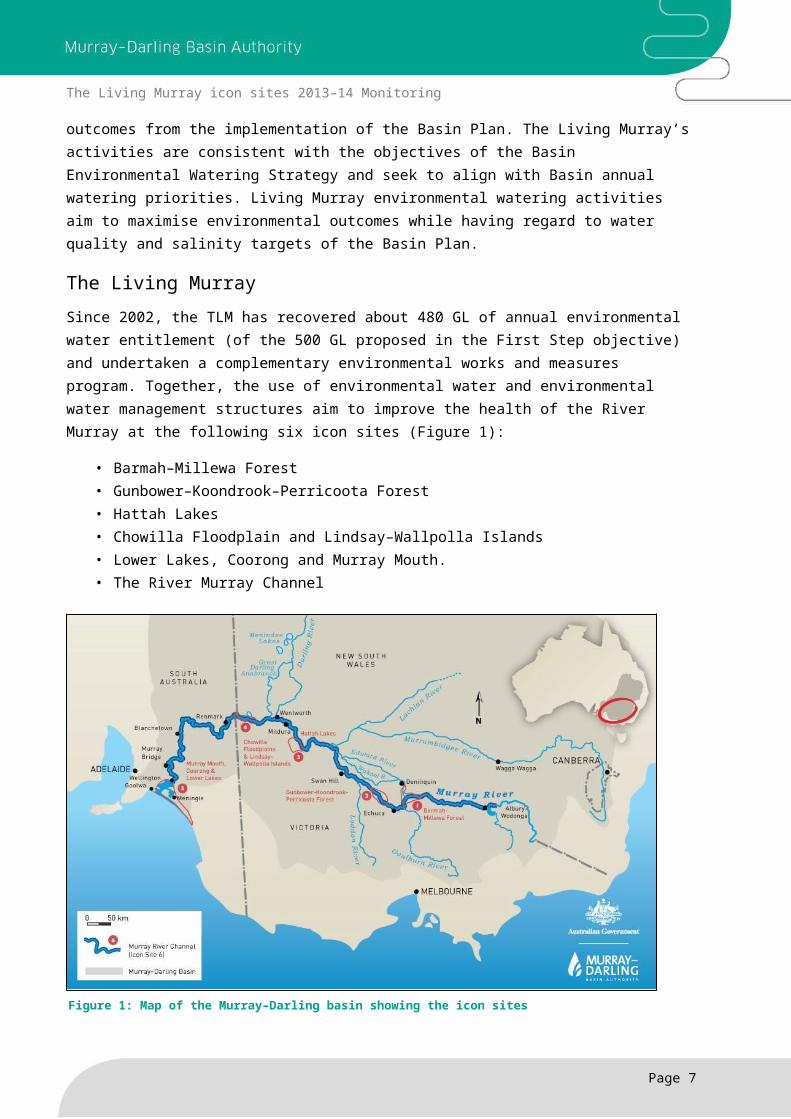
The Living MurraySince 2002, the TLM has recovered about 480 GL of annual environmental water entitlement (of the 500 GL proposed in the First Step objective) and undertaken a complementary environmental works and measures program. Together, the use of environmental water and environmental water management structures aim to improve the health of the River Murray at the following six icon sites (Figure 1):
• Barmah–Millewa Forest • Gunbower–Koondrook–Perricoota Forest• Hattah Lakes
Page 4
The Living Murray icon sites 2013–14 Monitoring
• Chowilla Floodplain and Lindsay–Wallpolla Islands• Lower Lakes, Coorong and Murray Mouth.• The River Murray Channel
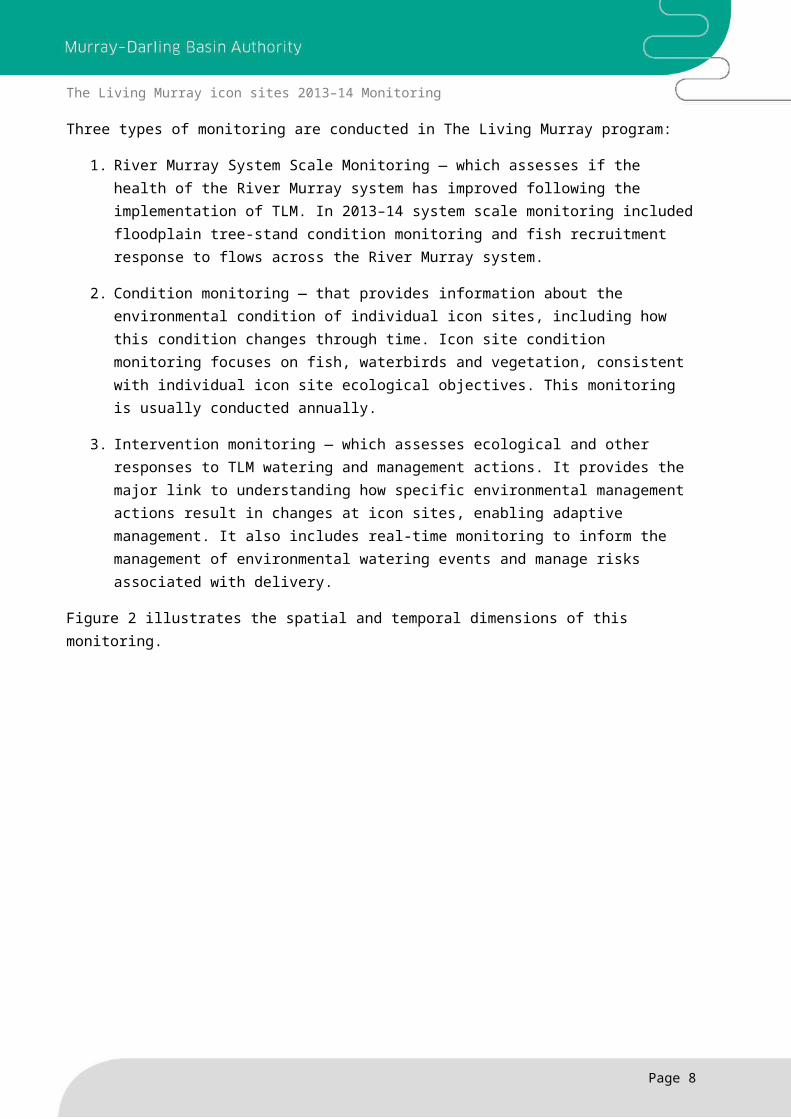
Three types of monitoring are conducted in The Living Murray program:
1. River Murray System Scale Monitoring — which assesses if the health of the River Murray system has improved following the implementation of TLM. In 2013–14 system scale monitoring included floodplain tree-stand condition monitoring and fish recruitment response to flows across the River Murray system.
2. Condition monitoring — that provides information about the environmental condition of individual icon sites, including how this condition changes through time. Icon site condition monitoring focuses on fish, waterbirds and vegetation, consistent with individual icon site ecological objectives. This monitoring is usually conducted annually.
3. Intervention monitoring — which assesses ecological and other responses to TLM watering and management actions. It provides the major link to understanding how specific environmental management actions result in changes at icon sites, enabling adaptive management. It also includes real-time monitoring to inform the management of environmental watering events and manage risks associated with delivery.
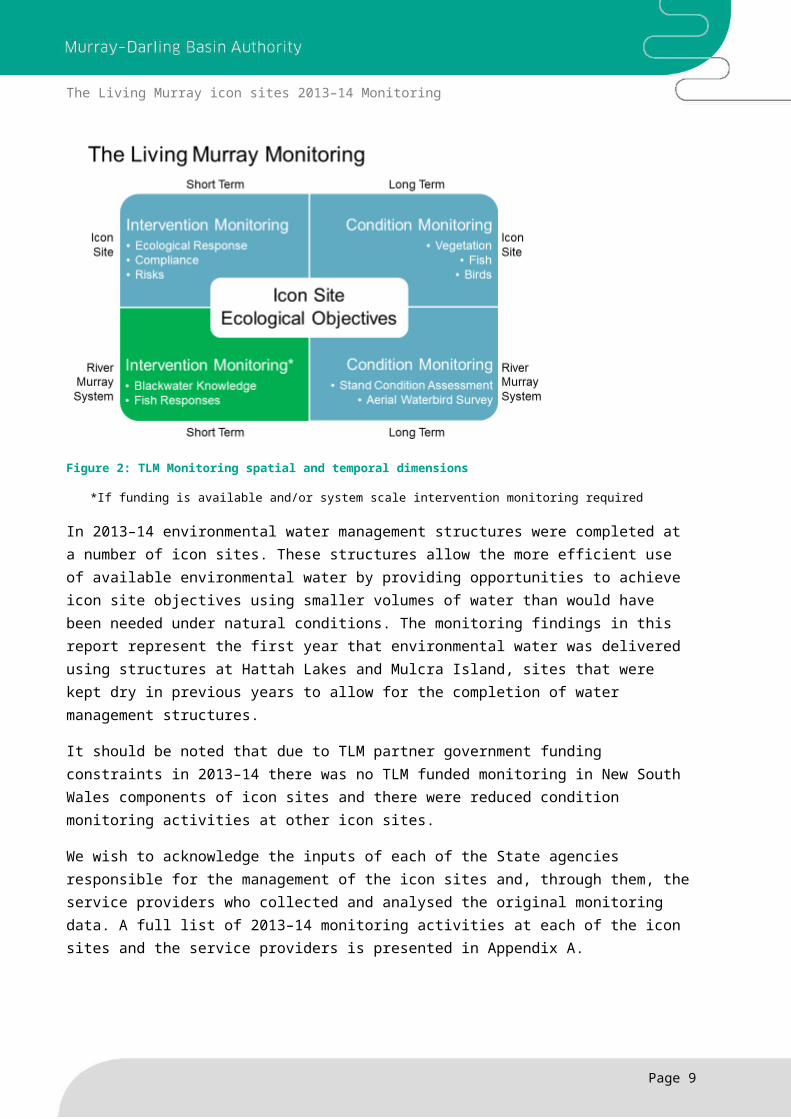
Figure 2 illustrates the spatial and temporal dimensions of this monitoring.
Page 5
Figure 1: Map of the Murray–Darling basin showing the icon sites
The Living Murray icon sites 2013–14 Monitoring
Figure 2: TLM Monitoring spatial and temporal dimensions
*If funding is available and/or system scale intervention monitoring required
In 2013–14 environmental water management structures were completed at a number of icon sites. These structures allow the more efficient use of available environmental water by providing opportunities to achieve icon site objectives using smaller volumes of water than would have been needed under natural conditions. The monitoring findings in this report represent the first year that environmental water was delivered using structures at Hattah Lakes and Mulcra Island, sites that were kept dry in previous years to allow for the completion of water management structures.
It should be noted that due to TLM partner government funding constraints in 2013–14 there was no TLM funded monitoring in New South Wales components of icon sites and there were reduced condition monitoring activities at other icon sites.
We wish to acknowledge the inputs of each of the State agencies responsible for the management of the icon sites and, through them, the service providers who collected and analysed the original monitoring data. A full list of 2013–14 monitoring activities at each of the icon sites and the service providers is presented in Appendix A.
Page 6
The Living Murray icon sites 2013–14 Monitoring
River Murray climatic conditions and flow
Antecedent conditionsThe Murray–Darling Basin was affected by a severe drought between 2000 and 2010 (the ‘millennium drought’), which reduced average inflows over those 10 years compared to the long-term average. In 2010–11 there was significant rainfall resulting in good inflows and natural flooding across the Murray–Darling Basin.
2011–12 was also a relatively wet year, with total River Murray inflows of 11,700 GL, down from 2010–11 (17,700 GL) but above the long-term average of 9,300 GL. It is of note that River Murray system inflows during March 2012 were approximately 2,200 GL; the highest ever recorded for the month, more than doubling the record set in March 2011 of about 1,000 GL.
In 2012–13 system inflows were 9,600 GL, slightly above the long term average. In the southern Basin floods occurred early in the year, but the rest of the year was drier than usual with much of the basin receiving below average rainfall. The summer was the hottest on record for Australia (MDBA 2013).
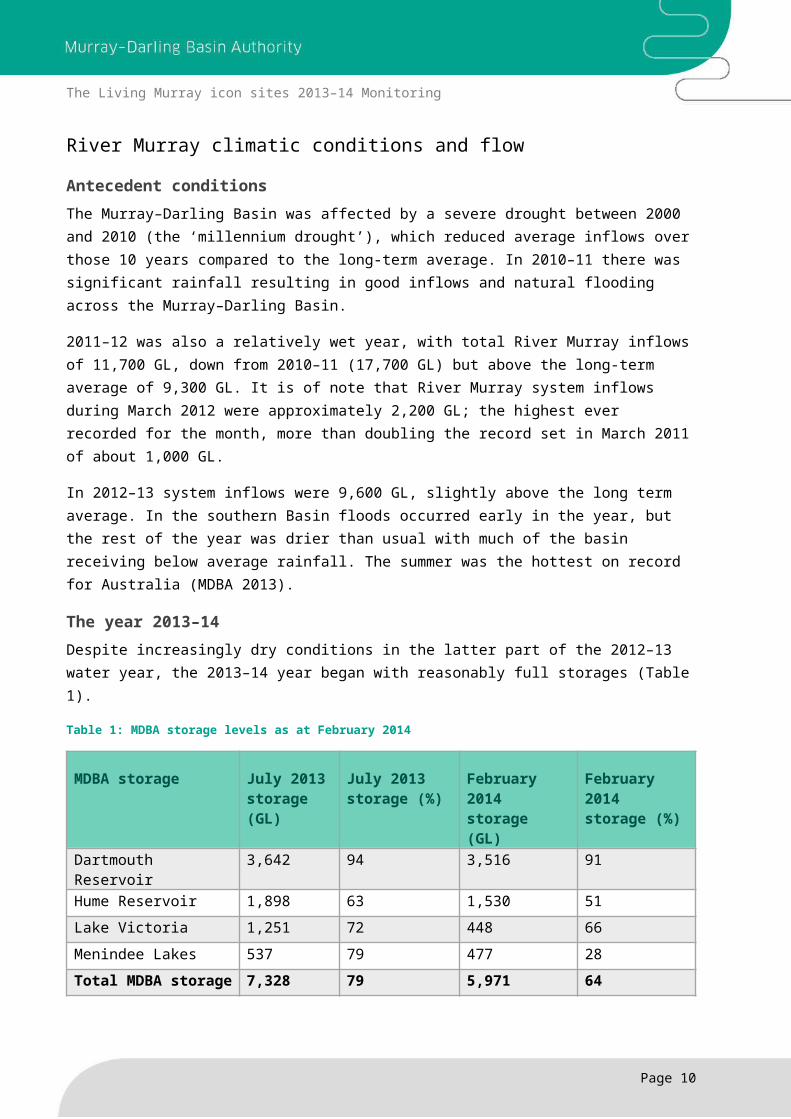
The year 2013–14Despite increasingly dry conditions in the latter part of the 2012–13 water year, the 2013–14 year began with reasonably full storages (Table 1).
Table 1: MDBA storage levels as at February 2014
MDBA storage July 2013 storage (GL)
July 2013 storage (%)
February 2014 storage (GL)
February 2014 storage (%)
Dartmouth Reservoir 3,642 94 3,516 91
Hume Reservoir 1,898 63 1,530 51
Lake Victoria 1,251 72 448 66
Menindee Lakes 537 79 477 28
Total MDBA storage 7,328 79 5,971 64
There was above-average rainfall through July and August 2013 in the upper River Murray catchments, particularly in northern Victoria and Southern NSW. Although September 2013 rainfall was close to average, the high storage levels meant that storages soon approached capacity. Hume Reservoir began spilling from mid-August and continued until late September, which, combined with high tributary inflows from the Ovens River, resulted in good flows in the mid-reaches of the River Murray that lasted till late October 2013.
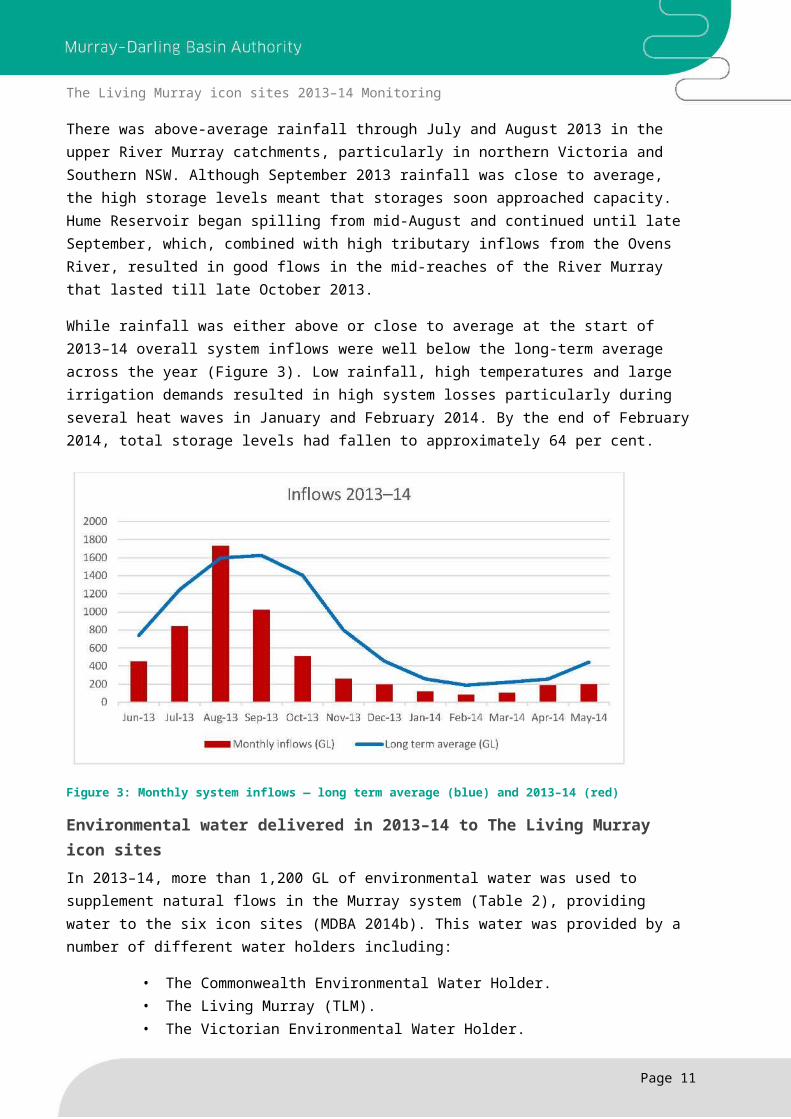
While rainfall was either above or close to average at the start of 2013–14 overall system inflows were well below the long-term average across the year (Figure 3). Low rainfall, high temperatures and large irrigation demands resulted in high system losses particularly during several heat waves in January and February 2014. By the end of February 2014, total storage levels had fallen to approximately 64 per cent.
Page 7
The Living Murray icon sites 2013–14 Monitoring
Figure 3: Monthly system inflows — long term average (blue) and 2013–14 (red)
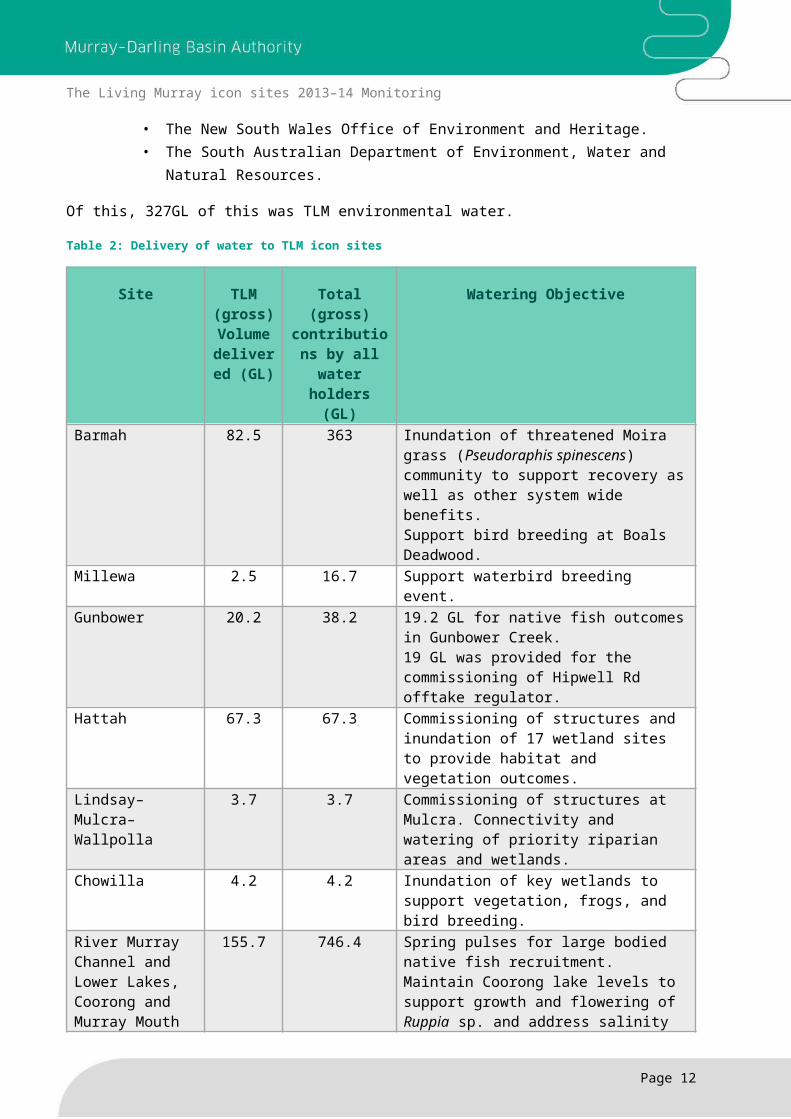
Environmental water delivered in 2013–14 to The Living Murray icon sitesIn 2013–14, more than 1,200 GL of environmental water was used to supplement natural flows in the Murray system (Table 2), providing water to the six icon sites (MDBA 2014b). This water was provided by a number of different water holders including:
• The Commonwealth Environmental Water Holder.• The Living Murray (TLM).• The Victorian Environmental Water Holder.• The New South Wales Office of Environment and Heritage.• The South Australian Department of Environment, Water and Natural Resources.
Of this, 327GL of this was TLM environmental water.
Table 2: Delivery of water to TLM icon sites
Site TLM (gross) Volume
delivered (GL)
Total (gross) contributions by all water holders (GL)
Watering Objective
Barmah 82.5 363 Inundation of threatened Moira grass (Pseudoraphis spinescens) community to support recovery as well as other system wide benefits.Support bird breeding at Boals Deadwood.
Millewa 2.5 16.7 Support waterbird breeding event.Gunbower 20.2 38.2 19.2 GL for native fish outcomes in
Gunbower Creek. 19 GL was provided for the commissioning of Hipwell Rd offtake regulator.
Hattah 67.3 67.3 Commissioning of structures and inundation
Page 8
The Living Murray icon sites 2013–14 Monitoring
Site TLM (gross) Volume
delivered (GL)
Total (gross) contributions by all water holders (GL)
Watering Objective
of 17 wetland sites to provide habitat and vegetation outcomes.
Lindsay–Mulcra–Wallpolla
3.7 3.7 Commissioning of structures at Mulcra. Connectivity and watering of priority riparian areas and wetlands.
Chowilla 4.2 4.2 Inundation of key wetlands to support vegetation, frogs, and bird breeding.
River Murray Channel and Lower Lakes, Coorong and Murray Mouth
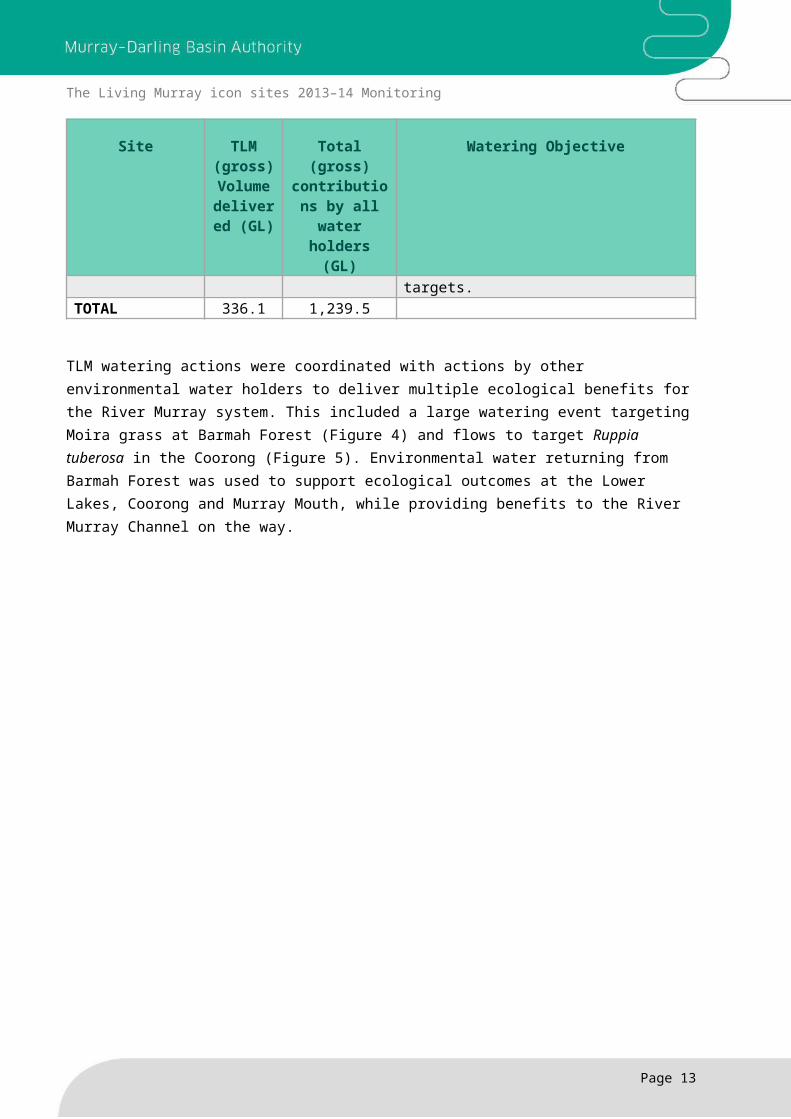
155.7 746.4 Spring pulses for large bodied native fish recruitment.Maintain Coorong lake levels to support growth and flowering of Ruppia sp. and address salinity targets.
TOTAL 336.1 1,239.5
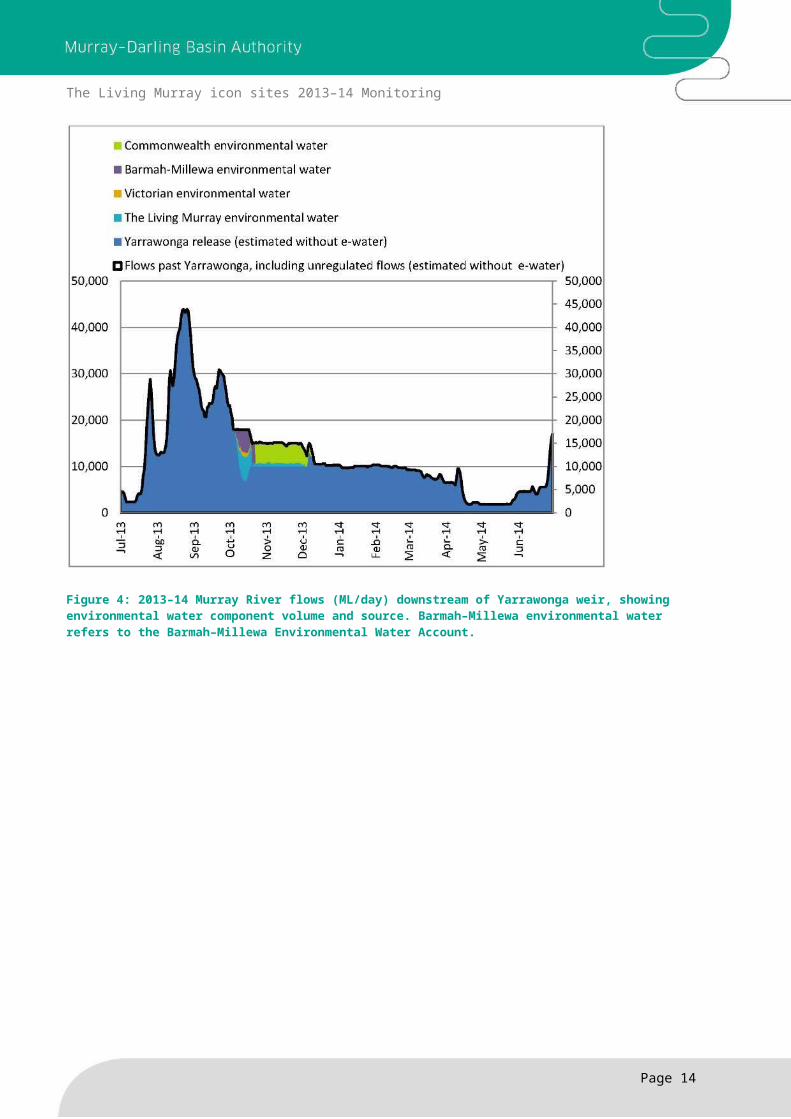
TLM watering actions were coordinated with actions by other environmental water holders to deliver multiple ecological benefits for the River Murray system. This included a large watering event targeting Moira grass at Barmah Forest (Figure 4) and flows to target Ruppia tuberosa in the Coorong (Figure 5). Environmental water returning from Barmah Forest was used to support ecological outcomes at the Lower Lakes, Coorong and Murray Mouth, while providing benefits to the River Murray Channel on the way.
Page 9
The Living Murray icon sites 2013–14 Monitoring
Figure 4: 2013–14 Murray River flows (ML/day) downstream of Yarrawonga weir, showing environmental water component volume and source. Barmah–Millewa environmental water refers to the Barmah–Millewa Environmental Water Account.
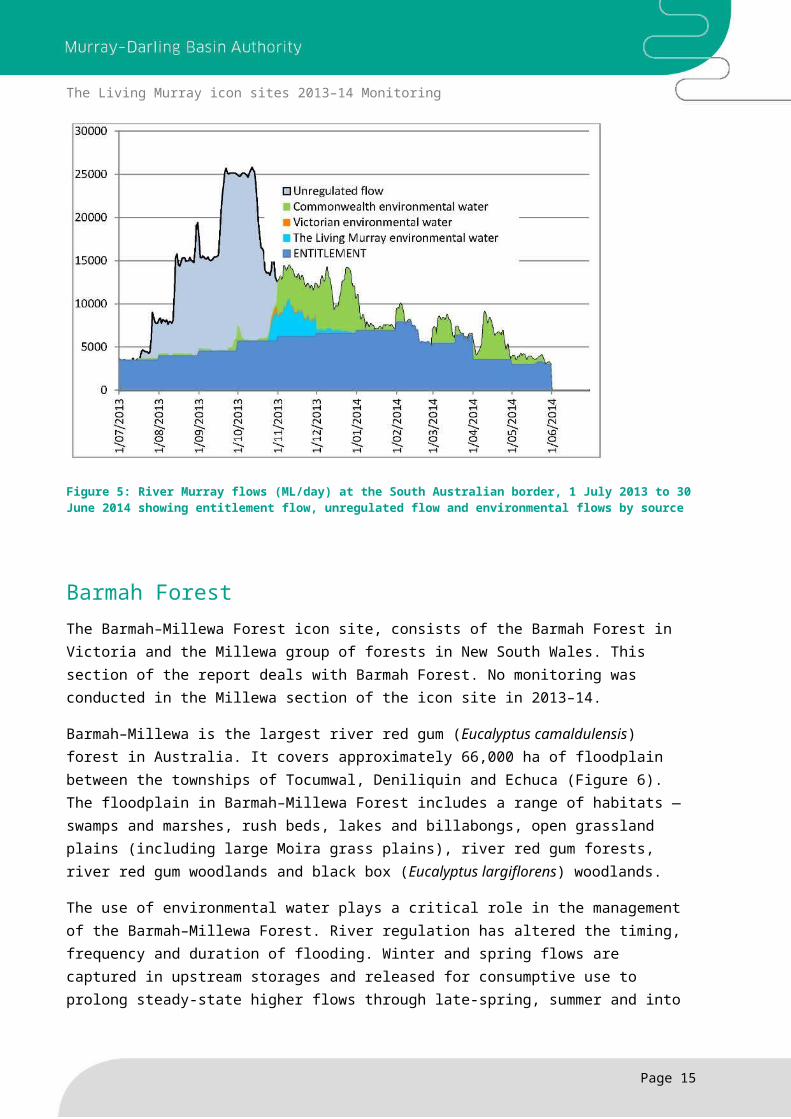
Figure 5: River Murray flows (ML/day) at the South Australian border, 1 July 2013 to 30 June 2014 showing entitlement flow, unregulated flow and environmental flows by source
Page 10
The Living Murray icon sites 2013–14 Monitoring
Barmah ForestThe Barmah–Millewa Forest icon site, consists of the Barmah Forest in Victoria and the Millewa group of forests in New South Wales. This section of the report deals with Barmah Forest. No monitoring was conducted in the Millewa section of the icon site in 2013–14.
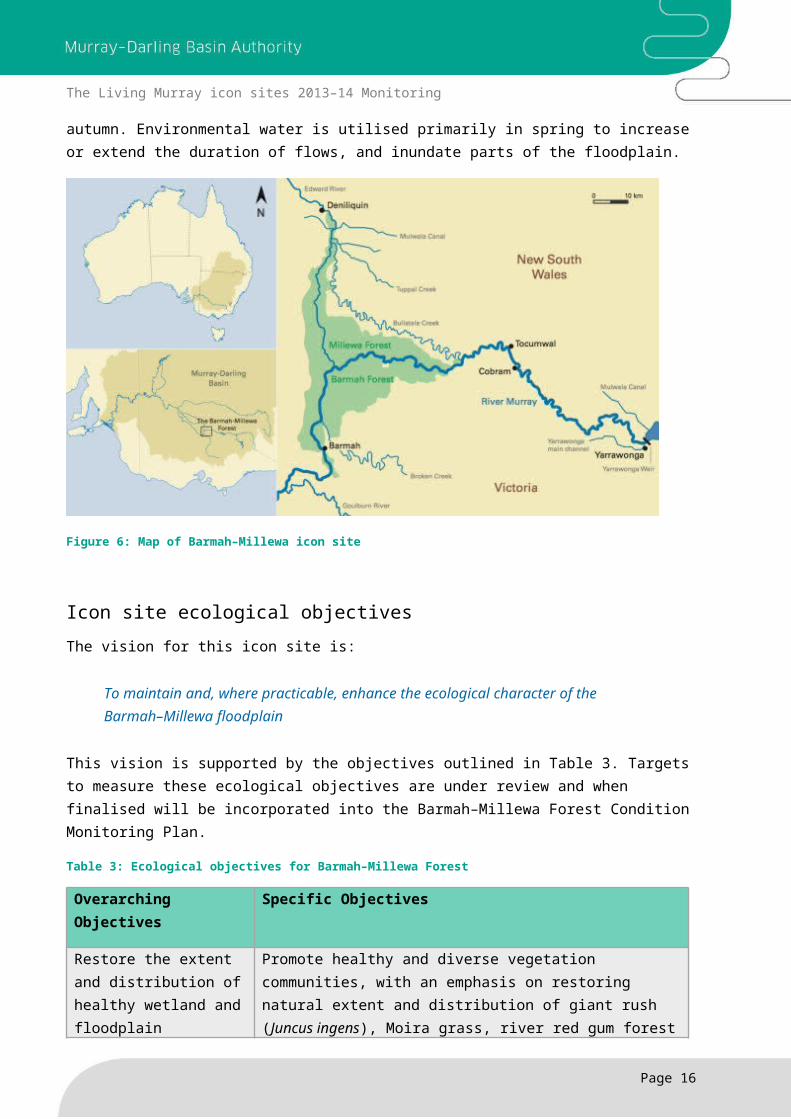
Barmah–Millewa is the largest river red gum (Eucalyptus camaldulensis) forest in Australia. It covers approximately 66,000 ha of floodplain between the townships of Tocumwal, Deniliquin and Echuca (Figure 6). The floodplain in Barmah–Millewa Forest includes a range of habitats — swamps and marshes, rush beds, lakes and billabongs, open grassland plains (including large Moira grass plains), river red gum forests, river red gum woodlands and black box (Eucalyptus largiflorens) woodlands.
The use of environmental water plays a critical role in the management of the Barmah–Millewa Forest. River regulation has altered the timing, frequency and duration of flooding. Winter and spring flows are captured in upstream storages and released for consumptive use to prolong steady-state higher flows through late-spring, summer and into autumn. Environmental water is utilised primarily in spring to increase or extend the duration of flows, and inundate parts of the floodplain.
Figure 6: Map of Barmah–Millewa icon site
Icon site ecological objectivesThe vision for this icon site is:
Page 11
The Living Murray icon sites 2013–14 Monitoring
To maintain and, where practicable, enhance the ecological character of the Barmah–Millewa floodplain
This vision is supported by the objectives outlined in Table 3. Targets to measure these ecological objectives are under review and when finalised will be incorporated into the Barmah–Millewa Forest Condition Monitoring Plan.
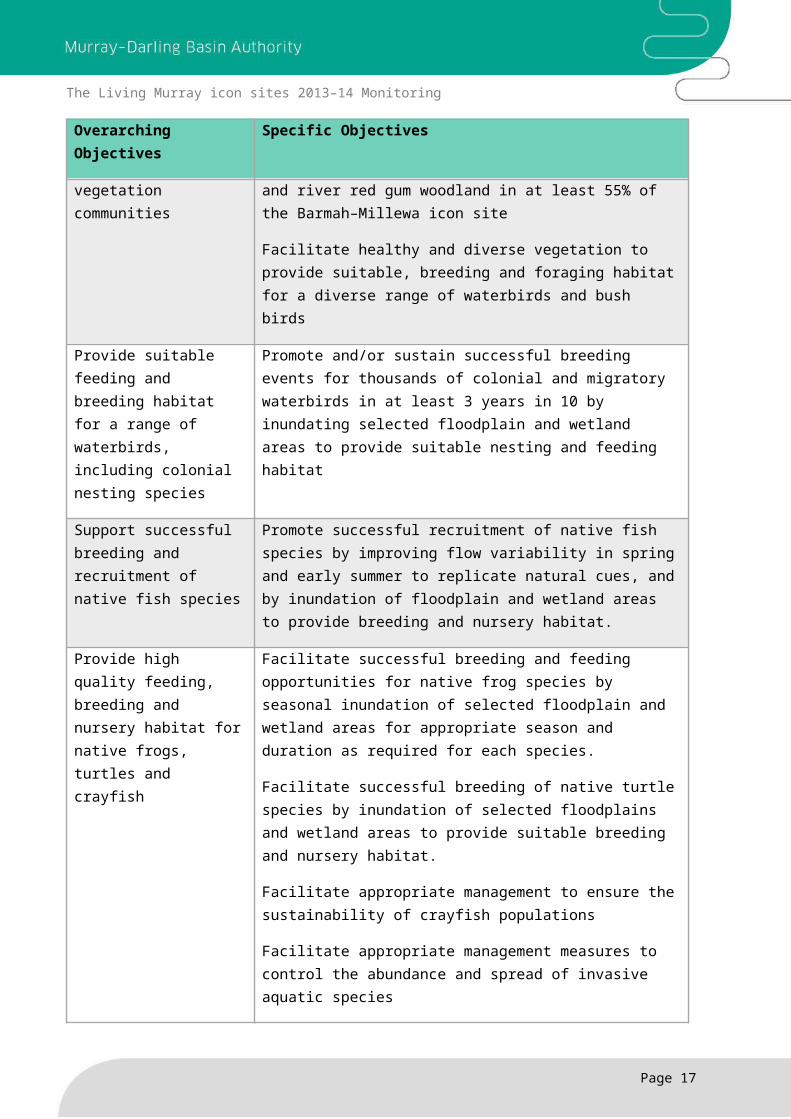
Table 3: Ecological objectives for Barmah–Millewa Forest
Overarching Objectives Specific Objectives
Restore the extent and distribution of healthy wetland and floodplain vegetation communities
Promote healthy and diverse vegetation communities, with an emphasis on restoring natural extent and distribution of giant rush (Juncus ingens), Moira grass, river red gum forest and river red gum woodland in at least 55% of the Barmah–Millewa icon site
Facilitate healthy and diverse vegetation to provide suitable, breeding and foraging habitat for a diverse range of waterbirds and bush birds
Provide suitable feeding and breeding habitat for a range of waterbirds, including colonial nesting species
Promote and/or sustain successful breeding events for thousands of colonial and migratory waterbirds in at least 3 years in 10 by inundating selected floodplain and wetland areas to provide suitable nesting and feeding habitat
Support successful breeding and recruitment of native fish species
Promote successful recruitment of native fish species by improving flow variability in spring and early summer to replicate natural cues, and by inundation of floodplain and wetland areas to provide breeding and nursery habitat.
Provide high quality feeding, breeding and nursery habitat for native frogs, turtles and crayfish
Facilitate successful breeding and feeding opportunities for native frog species by seasonal inundation of selected floodplain and wetland areas for appropriate season and duration as required for each species.
Facilitate successful breeding of native turtle species by inundation of selected floodplains and wetland areas to provide suitable breeding and nursery habitat.
Facilitate appropriate management to ensure the sustainability of crayfish populations
Facilitate appropriate management measures to control the abundance and spread of invasive aquatic species
Facilitate appropriate geomorphology management in selected waterways.
Page 12
The Living Murray icon sites 2013–14 Monitoring
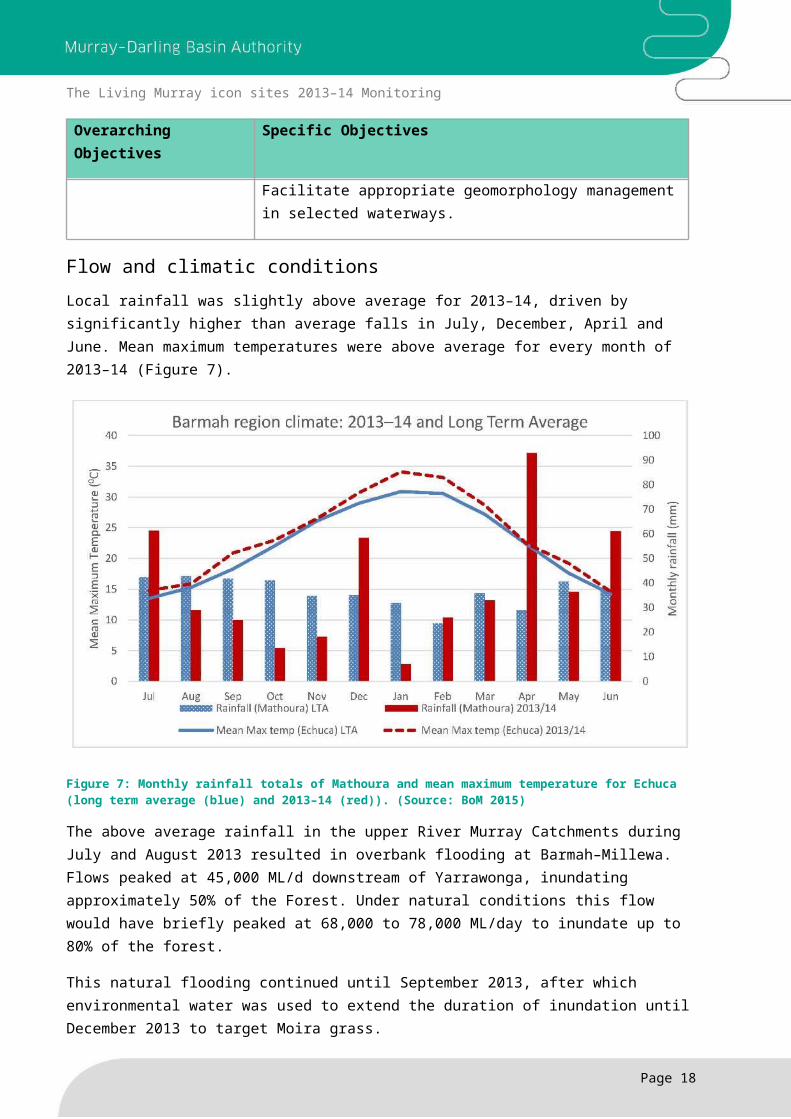
Flow and climatic conditionsLocal rainfall was slightly above average for 2013–14, driven by significantly higher than average falls in July, December, April and June. Mean maximum temperatures were above average for every month of 2013–14 (Figure 7).
Figure 7: Monthly rainfall totals of Mathoura and mean maximum temperature for Echuca (long term average (blue) and 2013–14 (red)). (Source: BoM 2015)
The above average rainfall in the upper River Murray Catchments during July and August 2013 resulted in overbank flooding at Barmah–Millewa. Flows peaked at 45,000 ML/d downstream of Yarrawonga, inundating approximately 50% of the Forest. Under natural conditions this flow would have briefly peaked at 68,000 to 78,000 ML/day to inundate up to 80% of the forest.
This natural flooding continued until September 2013, after which environmental water was used to extend the duration of inundation until December 2013 to target Moira grass.
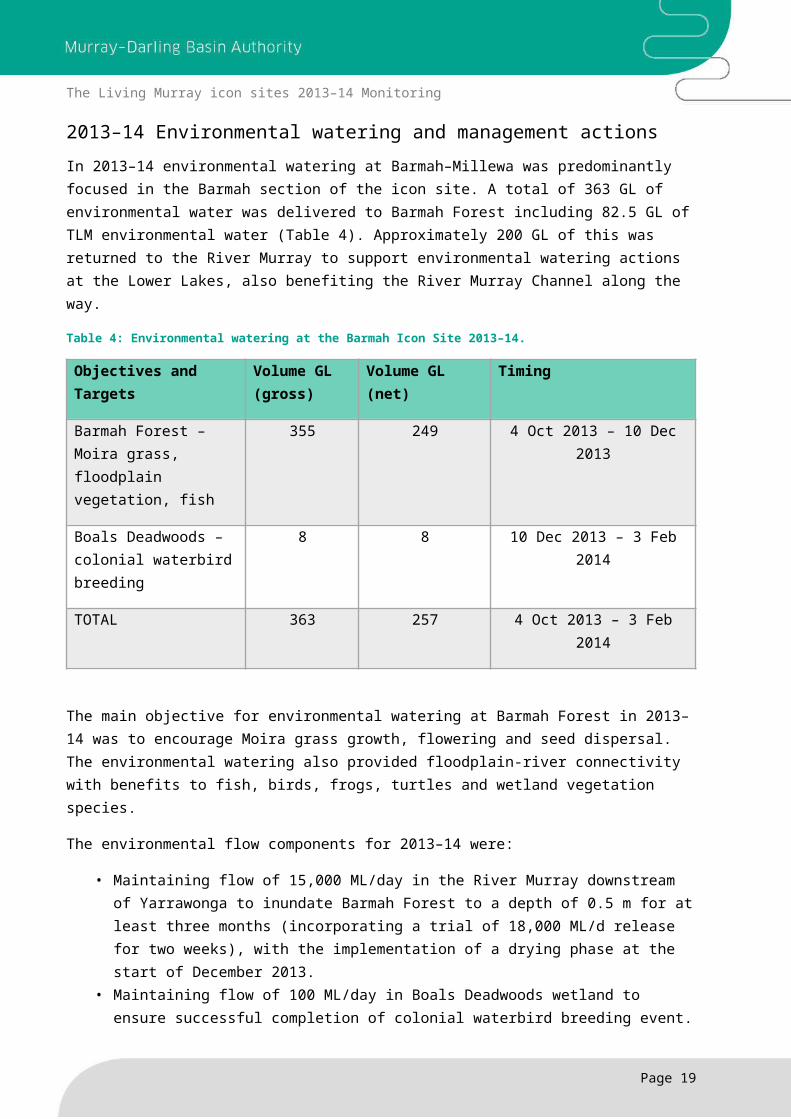
2013–14 Environmental watering and management actionsIn 2013–14 environmental watering at Barmah–Millewa was predominantly focused in the Barmah section of the icon site. A total of 363 GL of environmental water was delivered to Barmah Forest including 82.5 GL of TLM environmental water (Table 4). Approximately 200 GL of this was returned to the River Murray to support environmental watering actions at the Lower Lakes, also benefiting the River Murray Channel along the way.
Table 4: Environmental watering at the Barmah Icon Site 2013–14.
Objectives and Targets Volume GL (gross)
Volume GL (net) Timing
Barmah Forest – Moira 355 249 4 Oct 2013 – 10 Dec 2013
Page 13
The Living Murray icon sites 2013–14 Monitoring
Objectives and Targets Volume GL (gross)
Volume GL (net) Timing
grass, floodplain vegetation, fish
Boals Deadwoods – colonial waterbird breeding
8 8 10 Dec 2013 – 3 Feb 2014
TOTAL 363 257 4 Oct 2013 – 3 Feb 2014
The main objective for environmental watering at Barmah Forest in 2013–14 was to encourage Moira grass growth, flowering and seed dispersal. The environmental watering also provided floodplain-river connectivity with benefits to fish, birds, frogs, turtles and wetland vegetation species.
The environmental flow components for 2013–14 were:
• Maintaining flow of 15,000 ML/day in the River Murray downstream of Yarrawonga to inundate Barmah Forest to a depth of 0.5 m for at least three months (incorporating a trial of 18,000 ML/d release for two weeks), with the implementation of a drying phase at the start of December 2013.
• Maintaining flow of 100 ML/day in Boals Deadwoods wetland to ensure successful completion of colonial waterbird breeding event.
• Creating some flow variability (a dip, then increase) in the River Murray downstream of Yarrawonga in mid-November to initiate spawning of golden perch (Macquaria ambigua) and silver perch (Bidyanus bidyanus).
• Implementing a drying regime in late-summer and autumn 2014 to seasonally dry the floodplain wetlands.
The Moira grass plain target of approximately 0.5 m water level for three months in spring was achieved, providing conditions to promote flowering and seed-set in Moira grass. As flows were limited to 15,000 ML/day to prevent third party impacts, the level was achieved by closing the regulators on the Millewa side of the Forest. A flow of 23,000–25,000 ML/day would have been required to provide sufficient depth for Moira grass in both Millewa and Barmah forests.
Description of monitoring
Condition monitoringBuilding on existing long-term data sets at Barmah Forest, TLM vegetation waterbirds and fish condition monitoring commenced in 2006–07. In 2013–14 condition monitoring activities included understorey vegetation and waterbird monitoring and native fish surveys. TLM’s stand condition assessment (MDBA, 2015b) was also used to provide data on the condition of river red gum and black box forests and woodlands. No monitoring of bush birds was undertaken in Barmah Forest in 2013–14.
Page 14
The Living Murray icon sites 2013–14 Monitoring
Intervention monitoringIntervention monitoring activities (funded by TLM and other sources) undertaken during the environmental watering in 2013–14 (GBCMA 2013) included:
• Monitoring water depths, water quality, inundation extent and flows.• Mapping the spatial extent of Moira Grass and monitoring the response of Moira grass. • Monitoring of fish spawning in the River Murray near Barmah Forest.• Aerial surveillance of waterbird nesting sites and complimentary ground surveys to assess
waterbird response to environmental watering.• Detecting and observing waterbirds, frogs, other fauna, vegetation and inundation using
remote cameras and acoustic recorders.• Investigations into the environmental requirements of southern pygmy perch (Nannoperca
australis).
2013–14 Monitoring results
VegetationThe specific ecological objectives related to vegetation are:
Promote healthy and diverse vegetation communities, with an emphasis on restoring natural extent and distribution of giant rush, Moira grass, river red gum forest and river red gum woodland in at least 55% of the Barmah–Millewa icon site, and
Facilitate healthy and diverse vegetation to provide suitable breeding and foraging habitat for a diverse range of waterbirds and bush birds.
Field inspections undertaken during the 2013–14 environmental watering event recorded the response of Moira grass at Barmah to environmental watering and mapped the extent and spread of Moira Grass.
Moira grass flowered at all monitored wetland sites in Barmah and achieved the growth and flowering expected in response to environmental watering (Ward 2014). However, there was no evidence of germination from a seed-bank during the watering event. The reason for this is unclear and will require further research.
Moira grass mapping at Barmah shows that there is currently less than 44 ha of Moira grass dominated grassland patches in the treeless plains of the forest, with an additional 105 ha containing lower cover of Moira grass. This area represents less than 5% of the area previously mapped in the 1940s (Ward 2014d). A small increase in the spatial extent was observed in 2013–14, believed to be the result of vegetative growth from rootstock rather than the establishment of new plants from seed.
Page 15
The Living Murray icon sites 2013–14 Monitoring
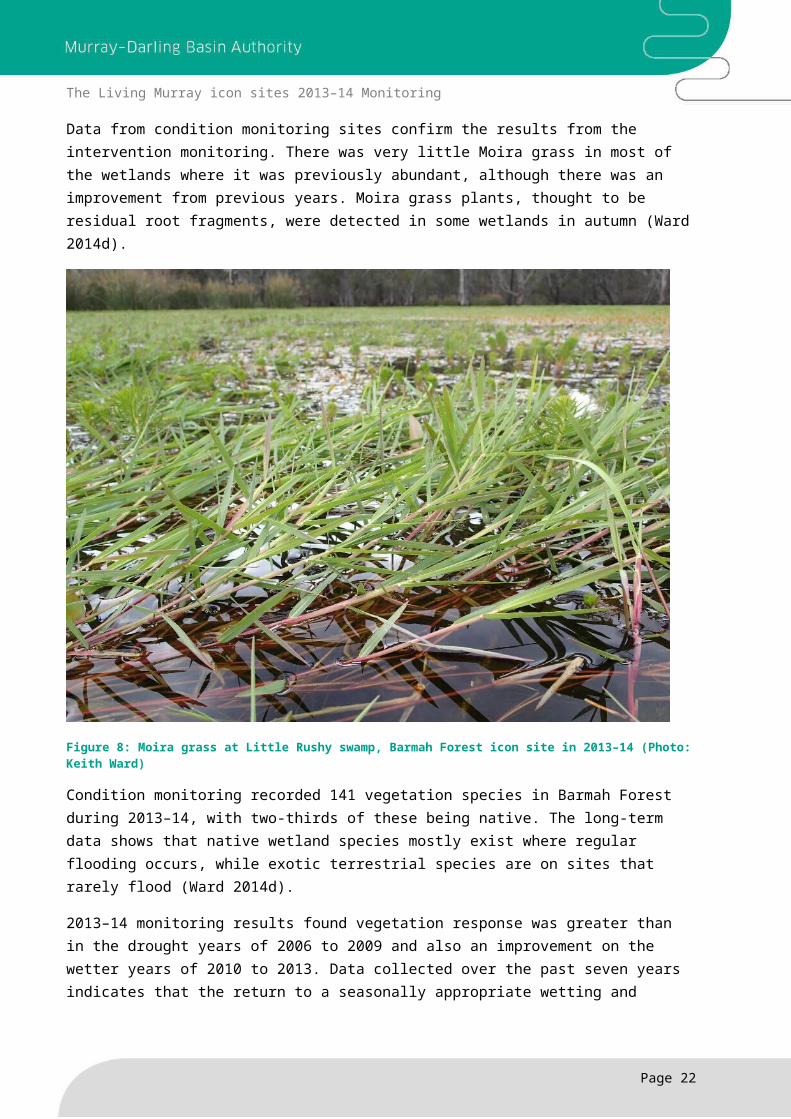
Data from condition monitoring sites confirm the results from the intervention monitoring. There was very little Moira grass in most of the wetlands where it was previously abundant, although there was an improvement from previous years. Moira grass plants, thought to be residual root fragments, were detected in some wetlands in autumn (Ward 2014d).
Figure 8: Moira grass at Little Rushy swamp, Barmah Forest icon site in 2013–14 (Photo: Keith Ward)
Condition monitoring recorded 141 vegetation species in Barmah Forest during 2013–14, with two-thirds of these being native. The long-term data shows that native wetland species mostly exist where regular flooding occurs, while exotic terrestrial species are on sites that rarely flood (Ward 2014d).
2013–14 monitoring results found vegetation response was greater than in the drought years of 2006 to 2009 and also an improvement on the wetter years of 2010 to 2013. Data collected over the past seven years indicates that the return to a seasonally appropriate wetting and drying regime is promoting an increasingly stronger response in diversity and cover of native wetland vegetation.
Giant rush at colonial waterbird nesting sites was in good condition and supported successful waterbird breeding outcomes.
Page 16
The Living Murray icon sites 2013–14 Monitoring
The results of the 2014 stand condition assessment showed that the majority of the river red gum forests and woodlands in Barmah Forest are classified as being in either Good (~37%) or Moderate (~60%) condition. Therefore in 2013–14 the specific objective for river red gum forest and river red gum woodland was met (MDBA 2015b).
Less than 3% (691 ha) of the entire river red gum forest area was considered to be in Poor, Degraded or Severely Degraded condition (MDBA, 2015). This result is similar to 2011–12 and is an improvement over the condition reported in 2012–13, when 4% less was in Good condition and 4% more in Moderate. The result is also a significant improvement from 2009–10 when 31% was in Good condition, 65% in Moderate condition and more than 4% in Poor, Degraded and Severely Degraded condition.
WaterbirdsThe specific ecological objective for waterbirds is to:
Promote and/or sustain successful breeding events of multiple thousands of colonial and migratory waterbirds in at least three years in ten, by inundating selected floodplain and wetland areas to provide suitable nesting and feeding habitat.
Monitoring was undertaken to identify locations of colonial waterbird breeding events using aerial and ground surveys. Ground surveys were also used to detect breeding of cryptic waterbird species. Surveys were supported by remote cameras that enable monitoring of waterbird breeding success during inundation.
In 2013–14, approximately 2,125 nests of colonial nesting waterbirds were observed in Barmah Forest. Numbers of white ibis (Threskiornis moluccus) nests (~1,125) were generally similar to 2011–12 while straw-necked ibis (Threskiornis spinicollis) nests (~260) were less. Although overall breeding numbers remained well below the 1% of species population figure that Barmah Forest has been recognised to support under the Convention on Wetlands of International Importance (Ramsar) listing, two large breeding events in three years indicate that watering is contributing to meeting the TLM ecological objective.
While the number of darters (Anhinga novaehollandiae) (5 nests) and little black cormorants (Phalacrocorax sulcirostris) (80 nests) breeding has remained relatively constant in recent years, one of the largest successful little pied cormorant (Microcarbo melanoleucos) breeding event (>600 nests) for many years was recorded.
Breeding of eastern great egret (Ardea modesta) (~30 nests) was of particular significance because it represented the sole egret colony in Victoria in 2013–14.
100 non-active nests were also observed. The presence of adult and fledged juvenile Nankeen night herons (Nycticorax caledonicus) in the vicinity of these nests suggests a strong possibility that the nesting was by that species.
Trail cameras and acoustic recorders detected the presence of the endangered little bittern (Ixobrychus dubius) and Australasian bittern (Botaurus poiciloptilus) in Barmah Forest during the watering event.
Page 17
The Living Murray icon sites 2013–14 Monitoring
Investigations of the number of pairs of vulnerable-listed white-bellied sea-eagles (Haliaeetus leucogaster) in Barmah–Millewa Forest continued in 2013–14. Four juveniles from three pairs of breeding adults were observed. The continuing survival and development of several 1 and 2 year-old immature white-bellied sea-eagles at widespread locations within the forest indicates successful recruitment.
FishThe specific ecological objective for fish is to:
Promote successful recruitment of native fish species by improving flow variability in spring and early summer to replicate natural cues, and by inundation of floodplain and wetland areas to provide breeding and nursery habitat.
Monitoring of fish spawning in the River Murray detected the best spawning results for golden perch since 2005. Further spawning occurred when flows were deliberately varied during a time of stable flow (Z Tonkin pers. comm. 18 Aug 2014, Raymond et al. 2014). There was also evidence of spawning by Murray cod (Maccullochella peelii), trout cod (Maccullochella macquariensis), silver perch, Australian smelt (Retropinna semoni), carp gudgeon (Hypseleotris spp) and flat-headed gudgeon (Philypnodon grandiceps) (Raymond et al. 2014).
Nine native and five non-native species were recorded in and around Barmah–Millewa Forest during the 2013–14 condition monitoring surveys. Greater numbers of fish were recorded in 2013–14 than in the two previous years. This was predominantly because of increased numbers of Australian smelt and common carp (Cyprinus carpio) in the River Murray and large increases in the number of eastern gambusia (Gambusia holbrooki) and goldfish (Carassius auratus) in creeks (Raymond et al. 2014).
The fish community was significantly impacted by a hypoxic blackwater event caused by a natural flood in 2010–11. In the period between 2007 and 2010 it was dominated by native species. Following the blackwater event numbers of native fish declined while alien species increased. In 2013–14 numbers of native fish increased, but the same was also true for alien species (Raymond et al. 2014).
Targeted surveys for southern pygmy perch did not observe this species in any of the Barmah Forest wetlands in 2013–14, continuing their absence since 2007. This species had been in decline over the previous decade (Stoffels & Weatherman 2014).
Murray crayfish (Euastacus armatus) populations remain low declining slightly relative to 2012–13. This reflects the slow recovery of this species from the 2011 blackwater event in the River Murray. Murray crayfish are still absent from areas where they were once common (Raymond et al. 2014).
Page 18
The Living Murray icon sites 2013–14 Monitoring
Overall Status of Barmah ForestThe condition of vegetation at Barmah Forest has generally improved with around 97% of river red gum forests and woodlands assessed as being in good or moderate condition. Understorey vegetation diversity has improved with the return to a more seasonally appropriate wet–dry regime in 2013–14 which appears to be promoting an increasingly stronger response. However, grazing impacts may threaten the persistence of species such as Moira grass. Giant rush at colonial waterbird nesting sites was in good condition and supported successful waterbird breeding outcomes.
Waterbird objectives have been met with two large breeding events over the past three years. However, overall breeding numbers have remained well below the 1% of species population figure that Barmah Forest has been recognised to support under the Ramsar listing. The Forest remains an important breeding site for many hundreds of waterfowl, particularly Pacific black duck (Anas superciliosa) and grey teal (Anas gracilis).
While the first major spawning event of golden perch in the River Murray identified since 2006–07 occurred in 2013–14, the Barmah Forest fish community as a whole has shown little improvement since TLM monitoring commenced in 2006–07. This is despite an improvement in flow conditions in recent years. Southern pygmy perch has not been recorded since the commencement of the drought and there is concern that this specialist fish species may now be locally extinct. Murray crayfish populations are slowly increasing following the hypoxic blackwater event of 2010–11.
Page 19
The Living Murray icon sites 2013–14 Monitoring
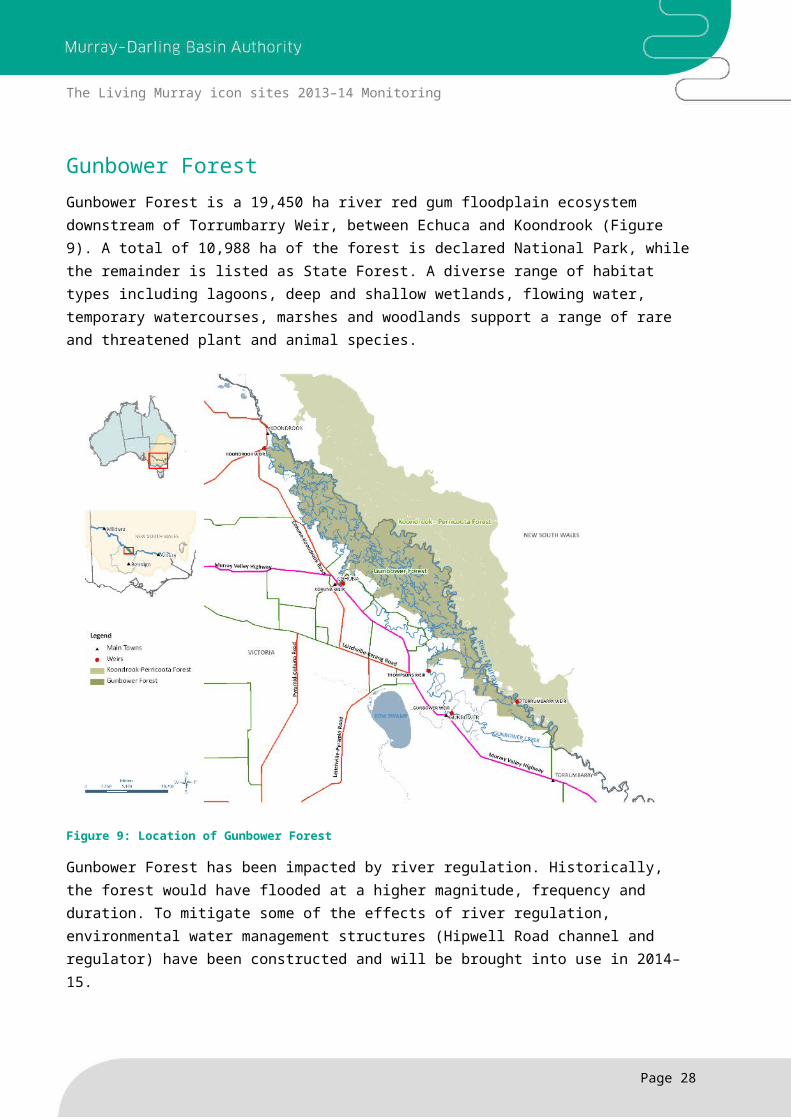
Gunbower ForestGunbower Forest is a 19,450 ha river red gum floodplain ecosystem downstream of Torrumbarry Weir, between Echuca and Koondrook (Figure 9). A total of 10,988 ha of the forest is declared National Park, while the remainder is listed as State Forest. A diverse range of habitat types including lagoons, deep and shallow wetlands, flowing water, temporary watercourses, marshes and woodlands support a range of rare and threatened plant and animal species.
Figure 9: Location of Gunbower Forest
Gunbower Forest has been impacted by river regulation. Historically, the forest would have flooded at a higher magnitude, frequency and duration. To mitigate some of the effects of river regulation, environmental water management structures (Hipwell Road channel and regulator) have been constructed and will be brought into use in 2014–15.
Gunbower Creek forms the southern border of the Forest and provides important habitat for a range of fish. The creek is used to deliver irrigation water to the Torrumbarry Irrigation District, resulting in unseasonably high water levels in summer and low levels in winter. This has impacted significantly on the ability of fish to complete their lifecycles. The creek is also used to deliver environmental water to Gunbower Forest.
Page 20
The Living Murray icon sites 2013–14 Monitoring
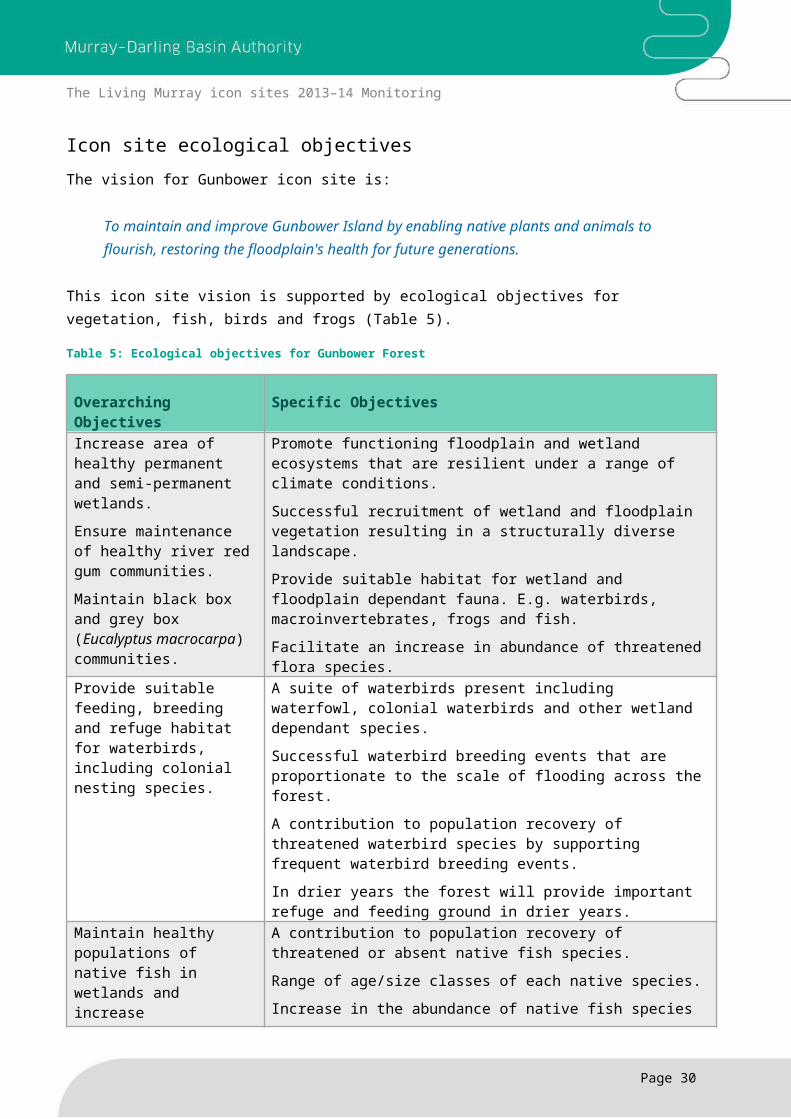
Icon site ecological objectivesThe vision for Gunbower icon site is:
To maintain and improve Gunbower Island by enabling native plants and animals to flourish, restoring the floodplain's health for future generations.
This icon site vision is supported by ecological objectives for vegetation, fish, birds and frogs (Table 5).
Table 5: Ecological objectives for Gunbower Forest
Overarching Objectives Specific Objectives
Increase area of healthy permanent and semi-permanent wetlands.
Ensure maintenance of healthy river red gum communities.
Maintain black box and grey box (Eucalyptus macrocarpa) communities.
Promote functioning floodplain and wetland ecosystems that are resilient under a range of climate conditions.
Successful recruitment of wetland and floodplain vegetation resulting in a structurally diverse landscape.
Provide suitable habitat for wetland and floodplain dependant fauna. E.g. waterbirds, macroinvertebrates, frogs and fish.
Facilitate an increase in abundance of threatened flora species.
Provide suitable feeding, breeding and refuge habitat for waterbirds, including colonial nesting species.
A suite of waterbirds present including waterfowl, colonial waterbirds and other wetland dependant species.
Successful waterbird breeding events that are proportionate to the scale of flooding across the forest.
A contribution to population recovery of threatened waterbird species by supporting frequent waterbird breeding events.
In drier years the forest will provide important refuge and feeding ground in drier years.
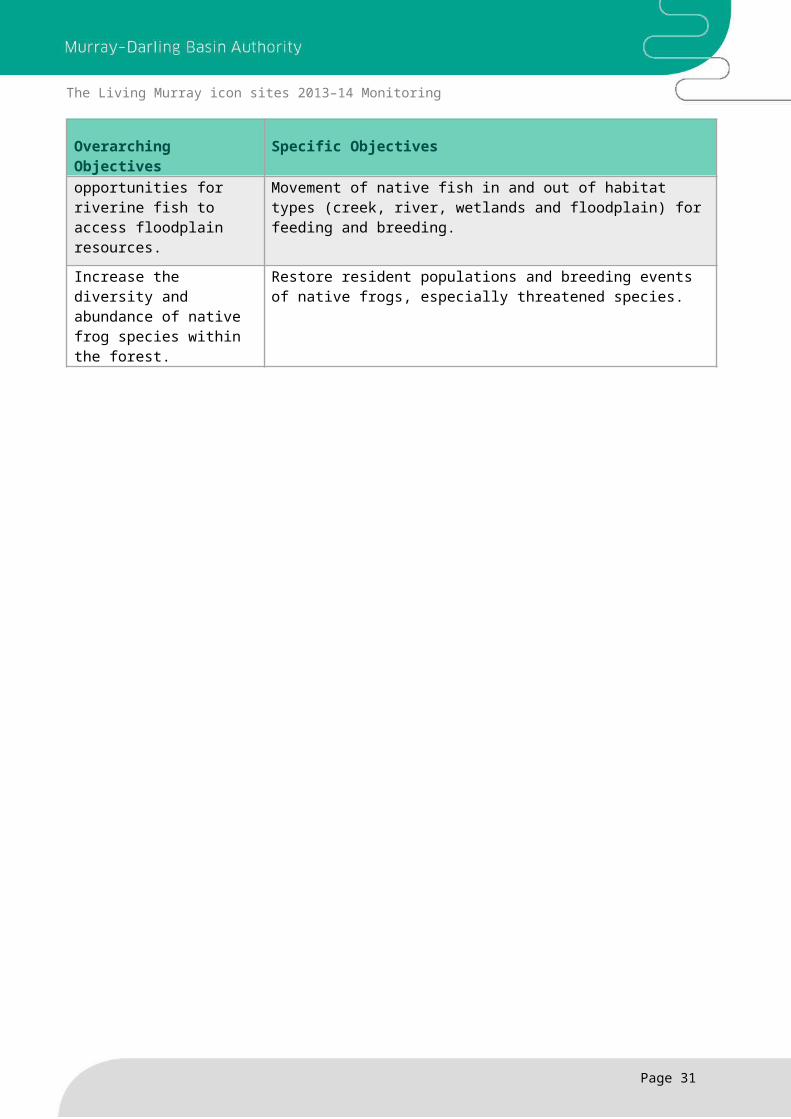
Maintain healthy populations of native fish in wetlands and increase opportunities for riverine fish to access floodplain resources.
A contribution to population recovery of threatened or absent native fish species.
Range of age/size classes of each native species.
Increase in the abundance of native fish species
Movement of native fish in and out of habitat types (creek, river, wetlands and floodplain) for feeding and breeding.
Increase the diversity and abundance of native frog species within the forest.
Restore resident populations and breeding events of native frogs, especially threatened species.
Page 21
The Living Murray icon sites 2013–14 Monitoring
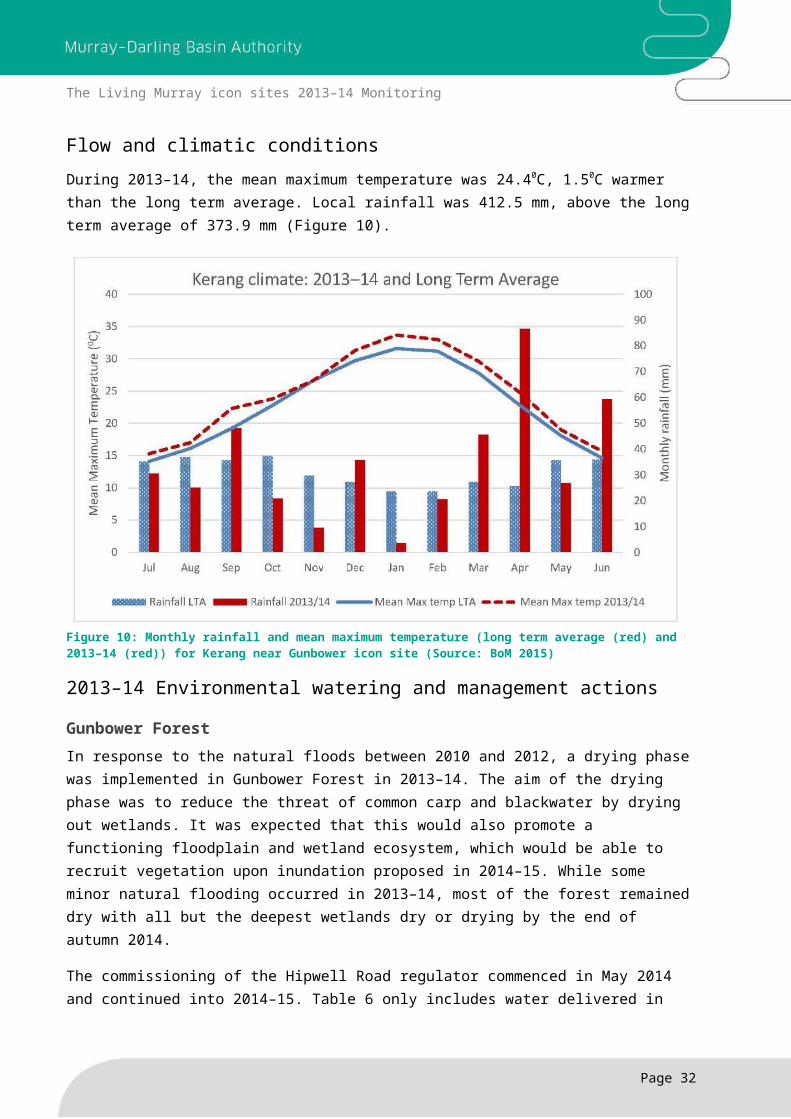
Flow and climatic conditionsDuring 2013–14, the mean maximum temperature was 24.40C, 1.50C warmer than the long term average. Local rainfall was 412.5 mm, above the long term average of 373.9 mm (Figure 10).
Figure 10: Monthly rainfall and mean maximum temperature (long term average (red) and 2013–14 (red)) for Kerang near Gunbower icon site (Source: BoM 2015)
2013–14 Environmental watering and management actions
Gunbower ForestIn response to the natural floods between 2010 and 2012, a drying phase was implemented in Gunbower Forest in 2013–14. The aim of the drying phase was to reduce the threat of common carp and blackwater by drying out wetlands. It was expected that this would also promote a functioning floodplain and wetland ecosystem, which would be able to recruit vegetation upon inundation proposed in 2014–15. While some minor natural flooding occurred in 2013–14, most of the forest remained dry with all but the deepest wetlands dry or drying by the end of autumn 2014.
The commissioning of the Hipwell Road regulator commenced in May 2014 and continued into 2014–15. Table 6 only includes water delivered in 2013–14. The monitoring associated with this event will be reported in the 2014–15 report.
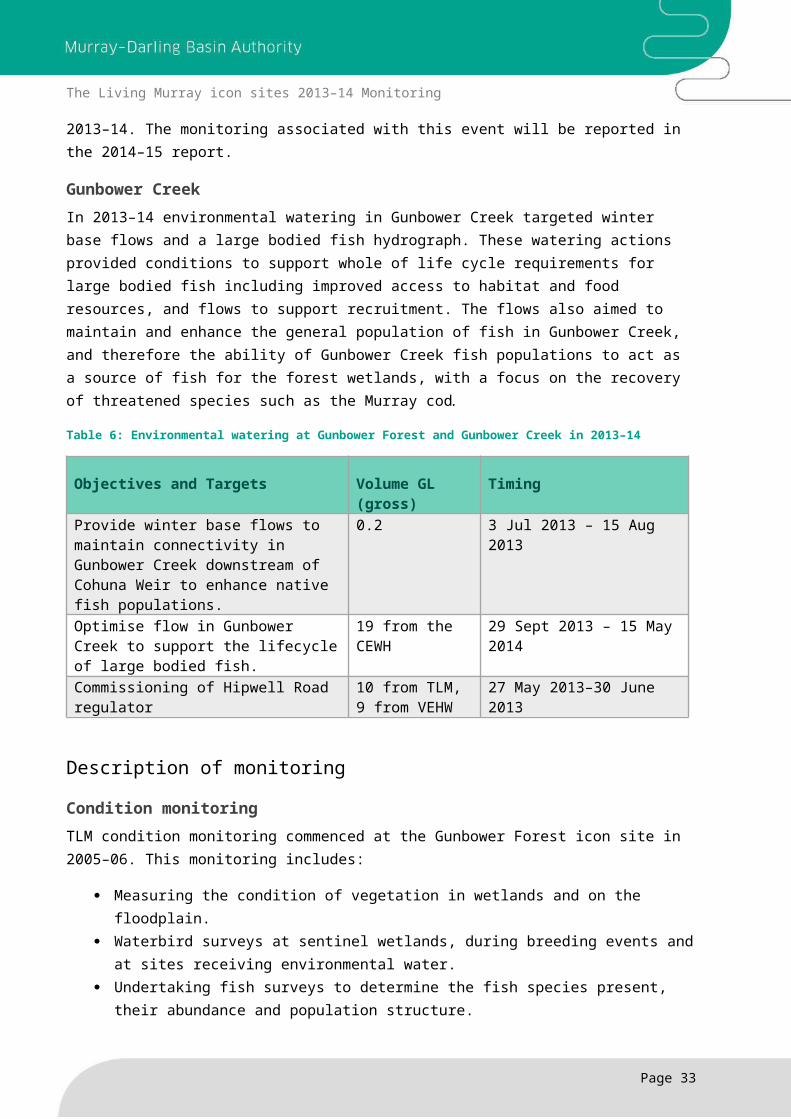
Gunbower CreekIn 2013–14 environmental watering in Gunbower Creek targeted winter base flows and a large bodied fish hydrograph. These watering actions provided conditions to support whole of life cycle requirements for large bodied fish including improved access to habitat and food resources, and flows to support recruitment. The flows also aimed to maintain and enhance the general population of fish in Gunbower Creek, and therefore the ability of Gunbower Creek fish
Page 22
The Living Murray icon sites 2013–14 Monitoring
populations to act as a source of fish for the forest wetlands, with a focus on the recovery of threatened species such as the Murray cod.
Table 6: Environmental watering at Gunbower Forest and Gunbower Creek in 2013–14
Objectives and Targets Volume GL (gross)
Timing
Provide winter base flows to maintain connectivity in Gunbower Creek downstream of Cohuna Weir to enhance native fish populations.
0.2 3 Jul 2013 – 15 Aug 2013
Optimise flow in Gunbower Creek to support the lifecycle of large bodied fish.
19 from the CEWH
29 Sept 2013 – 15 May 2014
Commissioning of Hipwell Road regulator
10 from TLM,9 from VEHW
27 May 2013–30 June 2013
Description of monitoring
Condition monitoringTLM condition monitoring commenced at the Gunbower Forest icon site in 2005–06. This monitoring includes:
Measuring the condition of vegetation in wetlands and on the floodplain. Waterbird surveys at sentinel wetlands, during breeding events and at sites receiving
environmental water. Undertaking fish surveys to determine the fish species present, their abundance and
population structure.
Intervention monitoringDuring 2013–14 the following intervention monitoring activities were undertaken at Gunbower Forest:
• Tracking daily flows to assess how different flow components impact on water quality.• Mapping the quality and quantity of fish habitat in Gunbower Creek to determine if habitat
availability is limiting spawning and recruitment potential of native fish.• Monitoring groundwater and salinity levels.• Assessing the movement, spawning response, and larval survival of large bodied fish
species, in response to environmental flows.• Measuring of water depths to determine the optimum depth and duration of flooding to
encourage breeding of colonial nesting waterbirds.
2013–14 Monitoring results
VegetationThe overarching ecological objective for wetlands is to:
Increase the area of healthy permanent and semi-permanent wetlands.
Page 23
The Living Murray icon sites 2013–14 Monitoring
In 2014 the wetlands were dominated by characteristic flora and low weed cover. However few rare and threatened species were recorded and no wetlands supported the full range of species expected in a healthy wetland. The floristic composition of the wetlands shifted away from that recorded in 2013 when dry, towards the composition recorded in the wetter years of 2005, 2006 and 2010. These results suggest the wetlands were in slightly better condition in 2014 than 2013 (Bennetts 2014).
The condition of the wetlands in 2014 possibly reflects the prolonged inundation event caused by natural inflows between 2010 and 2012, which created turbid and anoxic conditions, introduced common carp into systems, and impacted on the establishment of aquatic vegetation (Bennetts 2014).
The overarching ecological objectives for floodplain vegetation are:
Ensure maintenance of healthy river red gum communities.Maintain black box and grey box communities.
2013–14 monitoring results suggest that the understorey vegetation increased in characteristic species richness and cover following above average rainfall and flooding in 2010–2011 but since that time has returned to levels comparable to those recorded in 2005 (during the drought). The tree canopy results however suggest the river red gum population has declined in health since 2005, with only minor improvement after 2010, while the Black and Grey Box populations have declined in health between 2005 and 2013–14 (Bennetts 2014; Bennetts and Jolly 2014).
BirdsThe overarching ecological objective for birds at Gunbower is to:
Provide suitable feeding, breeding and refuge habitat for waterbirds, including colonial nesting species.
The first specific objective for birds is for:
A suite of waterbirds present including waterfowl, colonial waterbirds and other wetland dependant species.
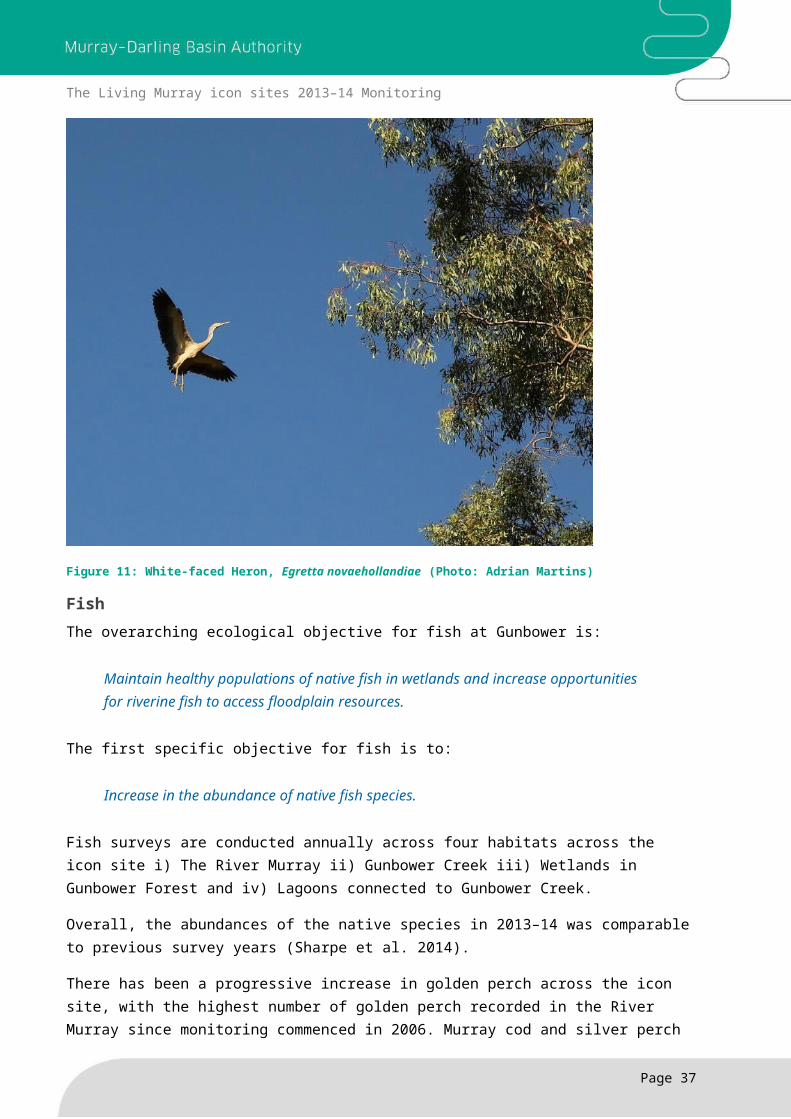
During 2013–14 the greatest number of species and number of individuals present were recorded in spring 2013 survey. Seventeen species present including waterfowl (3 duck spp.), colonial waterbirds (e.g. cormorant spp.) and other wetland dependant fauna (e.g. Australian pelican Pelecanus conspicillatus, heron spp (Fig 11) and Eurasian coot Fulica atra) (Webster, R & Martins, A 2013).
Waterbird numbers peaked at Gunbower in 2011–12 following the breaking of the millennium drought and following natural flooding. In 2013 numbers returned to pre-drought levels (Webster, R 2014).
Page 24
The Living Murray icon sites 2013–14 Monitoring
The second and third specific objectives for birds are for:
Successful waterbird breeding events that are proportionate to the scale of flooding across the forest.A contribution to population recovery of threatened waterbird species by supporting frequent waterbird breeding events.
In 2013–14, because a drying phase was implemented in Gunbower Forest, these objectives weren’t targeted. Accordingly, there was no colonial waterbird breeding or significant contribution to the population of threatened species. There was however a small number of waterfowl identified as breeding, though the level of success is unknown (Webster, R & Martins, A 2013).
The fourth specific objective for birds is that:
In drier years the forest will provide important refuge and feeding ground.
Throughout much of the year, the wetlands provided foraging habitat for the vulnerable white-bellied sea-eagle, with one individual identified in the winter, spring and summer surveys. During the summer survey, large common carp were visibly present at Black Swamp and other wetlands that contained small amounts of receding water and therefore may have been a substantial food source for eagles (Webster, R & Martins, A 2014).
Figure 11: White-faced Heron, Egretta novaehollandiae (Photo: Adrian Martins)
Page 25
The Living Murray icon sites 2013–14 Monitoring
FishThe overarching ecological objective for fish at Gunbower is:
Maintain healthy populations of native fish in wetlands and increase opportunities for riverine fish to access floodplain resources.
The first specific objective for fish is to:
Increase in the abundance of native fish species.
Fish surveys are conducted annually across four habitats across the icon site i) The River Murray ii) Gunbower Creek iii) Wetlands in Gunbower Forest and iv) Lagoons connected to Gunbower Creek.
Overall, the abundances of the native species in 2013–14 was comparable to previous survey years (Sharpe et al. 2014).
There has been a progressive increase in golden perch across the icon site, with the highest number of golden perch recorded in the River Murray since monitoring commenced in 2006. Murray cod and silver perch abundance were similar to the 2006–2009 surveys, while the abundance of freshwater catfish (Tandanus tandanus) declined to its lowest level since monitoring commenced, with only three individuals recorded in 2014 (Sharpe et al. 2014).
Abundances of un-specked hardyhead (Craterocephalus stercusmuscarum fulvus), carp gudgeon, Murray–Darling rainbowfish (Melanotaenia fluviatilis), flatheaded gudgeon and Australian smelt in the River Murray in 2014 were the highest since monitoring began. However in the wetlands, only three of these species were recorded — carp gudgeon, flatheaded gudgeon and Australian smelt. (Sharpe et al. 2014).
The second specific objective for fish is for there to be a:
Range of age/size classes of each native species.
Monitoring in 2014 indicates that all large bodied native species — Murray cod, golden perch, silver perch and freshwater catfish — exhibited populations which were severely fragmented in size structure (Sharpe et al. 2014).
While there was little recruitment of golden perch, silver perch or freshwater catfish in 2013–14, recruitment of the Murray cod was observed at Gunbower Creek. Murray cod spawned below Cohuna Weir in response to the delivery of the large bodied fish hydrograph, as evidenced by the young-of-year present in the April 2014 survey.
Overall, most small bodied native species exhibited robust population structures with the full range of size/age classes well represented. Despite the drying phase of the forest in 2013–14 populations of exotic fish — common carp and Goldfish (Carassius auratus) — continued to be very robust (Sharpe et al. 2014).
Page 26
The Living Murray icon sites 2013–14 Monitoring
Based on these results, condition monitoring indicates that progress toward this objective is considered neutral (Sharpe et al. 2014).
The third specific objective for fish is for:
A contribution to population recovery of threatened or absent native fish species.
Threatened fish species at Gunbower Island include silver perch, freshwater catfish, Murray Cod, trout cod, un-specked hardyhead and Murray–Darling rainbowfish. In 2013–14 there was no recovery of silver perch, freshwater catfish and trout cod and a limited recovery of Murray cod (Sharpe et al. 2014).
Some native fish species continue to be locally extinct in the Gunbower system, including the southern pygmy perch, common galaxias, southern purple spotted gudgeon (Mogurnda adspersa) and olive perchlet (Ambassis agassizii). Targeted recovery plans specific to Gunbower Island are required to enable the recovery of those species in the Gunbower system (Sharpe et al. 2014).
Based on these results, progress toward this objective is considered neutral (Sharpe et al. 2014).
For silver perch, golden perch, Murray cod and trout cod, recovery potential is severely limited and unlikely until barriers to re-colonisation of Gunbower Creek from the River Murray at Koondrook Weir and Headworks regulator are removed by installing fish passages. Likewise, flow regimes that impact on the survival of larvae and juveniles for threatened or absent species have been identified as a key factor limiting the status and recovery of populations in Gunbower Creek (Mallen-Cooper, Stuart and Sharpe. 2013 cited in Sharpe et al. 2014)
The fourth specific objective for fish is for:
Movement of native fish in and out of habitat types (creek, river, wetlands and floodplain) for feeding and breeding.
The diversity of native fish in wetlands (3 species) was low compared to that found in the creek (10 species) and river (9 species). Low species diversity in the wetland is indicative of the 2013–14 drying cycle of the forest), restricted movement due to fish barriers and/or limited source populations (Sharpe et al. 2014).
Overall status of Gunbower ForestIn 2013–14, the vegetation in Gunbower Forest continued to show limited signs of improved health following the large natural flooding of 2010–12.
Vegetation continued to recover, although slowly, during water recession. Wetlands appeared to have improved slightly in condition over the last twelve months, especially in areas that dried out. Where water remained, the low diversity of aquatic flora suggests that factors such as high levels of turbidity and common carp continued to influence the health of these systems.
The red gum and box vegetation in the forest also had higher species richness and cover of characteristic flora in 2014 than 2013. The canopy health results were mixed, but this is thought
Page 27
The Living Murray icon sites 2013–14 Monitoring
to result from the history of logging in the forest and consequent number of competing saplings. Despite these results, no wetland sites and only a small number of red gum and box sites assessed were considered to support healthy species richness, and tree health was found to be generally low and / or declining.
The Gunbower Island fish community remains relatively diverse, reflecting the range of habitat types available to native fish across the icon site, including wetlands of the forest and fast flowing habitat in the creek. While each commonly occurring fish species was recorded in 2014, populations amongst the large bodied native species exhibited very limited or no recruitment and some species contracted in abundance and distribution. This was particularly evident in freshwater catfish, golden perch and silver perch.
The key environmental watering action of 2013–14 was the implementation of the large bodied fish hydrograph. This comprised the delivery of environmental water through Gunbower Creek to support the lifecycle of native fish species, particularly the Murray cod. This water delivery played a key role in reducing the excessive short-term variation in water levels during the spawning season with winter flows a key contributor to the long term survival of young of the year fish (Sharpe and Stuart I 2015).
Amongst the small bodied species, populations appear stable in creek, lagoon and river habitats whilst in the wetlands, the diversity of species decreased in 2014. This decrease may be due to the wetlands receding and isolating the remaining fish populations, and also the limited access to food resources for these populations.
Other than the more common species such as ducks and cormorants, there was little bird breeding in Gunbower Forest as the area of suitable habitat for nesting and feeding was limited.
Page 28
The Living Murray icon sites 2013–14 Monitoring
Hattah LakesSituated in northwest Victoria, the Hattah Lakes Icon Site consists of approximately 13,000 ha of wetlands and the adjoining River Murray floodplain (Figure 12). The floodplain is defined by the extent of the 1956 flood — the largest flood on record, beyond which the ecosystem changes into dry Mallee communities.
Figure 12: Hattah Lakes icon site showing jurisdictional boundaries and 1956 flood extent (1 in 100 year flood).
Hattah Kulkyne National Park supports a range of flora and fauna representative of the Mallee region of northwest Victoria. This includes a number of species listed as rare and vulnerable under either Victorian or Commonwealth legislation. The wetlands also support a number of migratory bird species listed under international agreements, with 12 of the wetlands being listed under the Ramsar convention.
The regulation and extraction of water from the River Murray have significantly reduced the frequency with which water reaches Hattah Lakes, and the level and duration of flooding that occurs. To address this, environmental water management structures were constructed between 2011 and 2013. These structures include a pumping station which allows water to be pumped from the River Murray into the site, and regulators which hold the water within the site. This allows natural floods to be replicated at lower River Murray levels and using less water than would have been required under natural conditions.
Page 29

The Living Murray icon sites 2013–14 Monitoring
Icon site objectivesThe vision for the Hattah Lakes icon site is:
Preserve and where possible enhance the biodiversity values of Hattah Lakes; and restore healthy examples of all original wetland and floodplain communities which represents the communities which would be expected under natural flow conditions.
Ecological objectives for Hattah Lakes are listed in Table 7. The current targets associated with these objectives are under review and due to be finalised in 2015–16.
Table 7: Ecological objectives Hattah Lakes
Overarching Objectives Specific Objectives
Restore a mosaic of healthy wetland and floodplain communities to maintain the ecological character of the Ramsar site.
Restore a mosaic of hydrological regimes, which represent pre-regulation conditions (to maximise biodiversity).
Maintain and, where practical, restore the ecological character of the Ramsar site with respect to the Strategic Management Plan (2003).
Restore the macrophyte zone around at least 50% of the lakes to increase fish and bird habitat.
Improve the quality and extent of deep freshwater meadow and permanent open freshwater wetlands so that species typical of these ecosystems are represented.
Maintain high quality habitat for native fish in wetlands and support successful breeding events.
Increase distribution, number and recruitment of local wetland fish—including hardyhead, Australian smelt and gudgeon by providing appropriately managed habitat.
Maximise use of floodplain habitat for recruitment of all indigenous freshwater fish.
Provide feeding and breeding habitat for a range of waterbird species, including threatened and migratory species.
Provide conditions for successful breeding of colonial nesters at least twice every ten years.
Maintain habitat for the freckled duck (Stictonetta naevosa), grey falcon (Falco hypoleucos) and Targets under development white-bellied sea-eagle in accordance with action statements.
Increase successful breeding events for colonial waterbirds to at least two years in 10 (including spoonbills, egrets, night herons and bitterns).
Provide suitable habitat for a range of migratory bird species (including Latham’s snipe, red-necked stint and sharp-tailed sandpiper).
Flow and climatic conditionsDuring 2013–14, the mean maximum temperature at Ouyen (the nearest weather station) was 25.3°C., about 1.6°C higher than the long term average. Rainfall at Ouyen was 267.1 mm, about 64 mm below the long term average. Rainfall was below average in all months except February and April (Fig 13).
Page 30
The Living Murray icon sites 2013–14 Monitoring
Figure 13: Monthly rainfall and mean maximum temperature (long-term average (blue) and 2013–14 (red)) for Ouyen, near the Hattah lakes icon site (Source: BoM 2015)
The Hattah–Kulkyne National Park is situated in a semi-arid landscape — rainfall is highly variable temporally and spatially. Individual locations frequently have one year of above average rainfall followed by several years below average. These rainfall patterns emphasise the importance of overbank/flood events for wetlands in this region.
During 2013–14 flow in the River Murray only briefly exceeded the threshold for water entering the Hattah lakes system and a very small amount of water — probably less than 50 ML — entered the system naturally. Without the use of the environmental water management infrastructure, Hattah Lakes would have remained dry in 2013–14.
2013–14 Environmental Watering and management actions Table 8: Environmental watering at the Hattah Lakes Icon Site in 2013–14.details the environmental water delivered to the Hattah Lakes icon site in 2013–14.
The focus of the first environmental watering (October 2013 to January 2014) was the first commissioning the environmental water management structures (up to 43.5 m AHD) at Hattah Lakes. Approximately 67.3 GL of TLM environmental water was pumped into the site, filling 17 lakes without moving onto the floodplain and targeting red gum woodland communities. At the conclusion of the pumping 6 GL of water was released back into the River Murray.
Page 31
The Living Murray icon sites 2013–14 Monitoring
A second event, delivering at total of 61GL (27.3GL TLM, 19.1 GL CEWH and 14.6GL VEWH), commenced in May 2014 and concluded in January 2015. This watering provided top-up flows (up to 45m AHD) to target fringing river red gum and black box communities and further tested the environmental water management structures. The monitoring associated with this event will be reported in the 2014–15 report.
Table 8: Environmental watering at the Hattah Lakes Icon Site in 2013–14.
Objectives and Targets Volume GL (gross)
Volume GL (net)
Timing
Commission structures to 43.5 m AHD, water red gum woodland and fill Lake Bitterang
67.3 (TLM) 61.3 Oct 2013–Jan 2014
Description of monitoring
Condition monitoringTLM Condition monitoring commenced at Hattah Lakes in 2006–07. The following condition monitoring activities were undertaken at this site in 2013–14 (Henderson et al. 2014):
• Monitoring the condition of floodplain trees (river red gum, black box); vegetation communities (wetland and floodplain) and lignum (Muehlenbeckia florulenta).
• Fish surveys to determine the abundance, diversity and extent of the distribution of native fish in the River Murray, Chalka Creek and across six floodplain wetlands.
• Winter, spring and summer waterbird surveys across six wetlands.
Intervention monitoringThe following intervention monitoring activities were conducted in 2013–14:
• Monitoring regent parrot (Polytelis anthopeplus) nesting and breeding, a statutory requirement as part of the approval to construct environmental water management structures at Hattah Lakes.
• Assessing the species composition and survival rate of fish (including eggs and larvae) that passed through the pumping station.
• Measuring the vegetation community response to watering of a wetland that had been dry for a long period (Lake Bitterang).
• Determining the effect of watering on diversity and abundance of waterbirds.• Establishing a project to monitor the response of floodplain vegetation
communities to environmental watering.• Establishing a project to monitor the reproductive response of black box
vegetation communities to environmental watering by measuring seed fall.
2013–14 Monitoring results
VegetationThe overarching ecological objective for vegetation at Hattah Lakes is:
Page 32
The Living Murray icon sites 2013–14 Monitoring
To restore a mosaic of healthy wetland and floodplain communities to maintain the ecological character of the Ramsar site
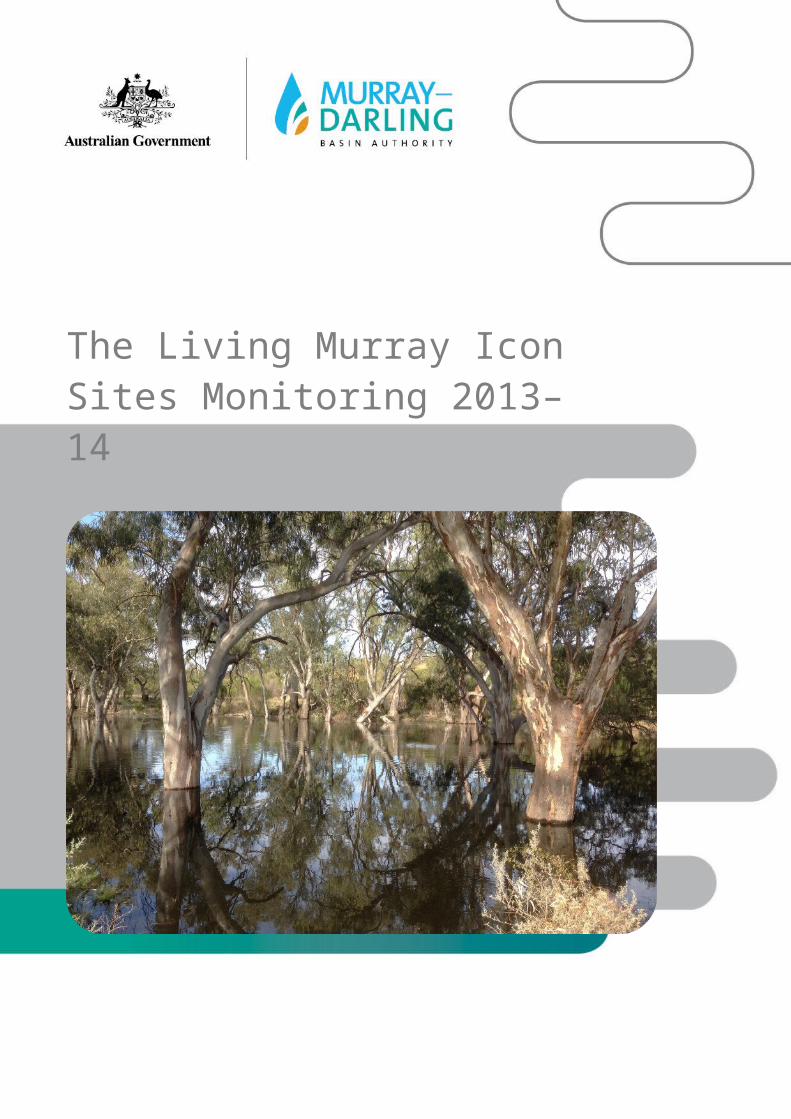
Wetland vegetationPlant diversity and composition has fluctuated since wetland monitoring started in 2007–08, reflecting the wetting and drying of the landscape. The highest vegetation diversity has been recorded in drying wetlands which provide a range of habitats from dry floodplain, to damp floodplain, to completely inundated wetland. Conversely, the lowest diversity is correlated with inundated wetlands as they only provide a single habitat type, open water (Henderson et al. 2014).
Monitoring during the 2013–14 environmental watering event recorded 53 species, the lowest diversity since this monitoring started in 2007–08. This low diversity was expected because all the Hattah Lakes, except Lake Kramen and Lake Cantala, were full and therefore only providing open water habitat. The next lowest number of species was recorded during the natural flood event in 2010–11. Weediness, the proportion of species that are weeds, has been less than 20% in all years monitored. In 2013–14 weediness was 10% of species (Henderson et al. 2014).
Plant species recorded at Hattah Lakes are classified into functional groups that range from terrestrial species that occur in dry habitats to aquatic submerged species. During the dry or drying phase of wetlands, communities are dominated by terrestrial functional groups. In contrast in 2013–14 because most of the surveyed wetlands were inundated, the community composition was dominated by floating plants, which was a similar composition to that recorded during the natural floods in 2010–11 (Henderson et al. 2014).
Figure 14: Little Hattah Lake, December 2013 (Photo: Heather Peachey MDBA)
Page 33
The Living Murray icon sites 2013–14 Monitoring
Floodplain VegetationIn 2013–14 a total of 115 species were identified in red gum and black box communities at Hattah Lakes. This is similar to 2012–13 results.
The total number of species is strongly associated with the availability of water. For example in 2007–08 when the floodplain only received rainfall, species diversity was low with 78 species identified. Following environmental watering in 2009–10 species numbers increased to 114, then to 139 following natural flooding in 2010–11. In 2011–12, when no environmental watering was undertaken, 107 species were identified.
Species diversity was lowest in the red gum community during 2010–11 following the natural flood event (36 species) and highest in 2011–12 (101 species). In contrast, the diversity of the black box community remained relatively constant from 2009–10 to 2013–14 (63, 54, 86, 57, 62). The highest diversity of 86 species was recorded in 2011–12, the year following the natural flood event.
The decrease in the number of species recorded in the red gum community in 2010–11 can be attributed to inundation of this community during the natural flood. As the black box community tends to be found at higher elevations and was not inundated by this flood, an increase in species diversity in the black box community could be the result of the higher than average rainfall in 2010–11 and 2011–12.
The analysis of functional groups suggests that the red gum community responds in a very similar way to wetlands, with terrestrial plant groups dominating during non-wet years. During the flood or wet years the abundance of terrestrial plants decreases, with more floating plants and wet-tolerant species. In contrast, the black box communities show very little change in functional group distribution, suggesting that natural flood of 2010–11 and the environmental watering in 2013–14 had little effect on the community composition of black box.
River red gum forests and woodlandsThe targets for red gum woodland and forest are:
Maintain 85% of red gum trees with crown extent ≥ 4Annual mortality < 2 %
Crown extent is the measurable foliage cover in the canopy. A crown extents of ≥ 4 is equivalent to a crown extent of greater than 40%.
The frequency of river red gum trees with a crown condition ≥ 4 increased from 65% of trees in this condition in 2008–09 to 96% in 2011–12, 98% in 2012–13 and 95% in 2013–14. This means that the target of greater than 85% of trees with a crown extent ≥ 4 has been met for these three years.
Whilst crown condition can be used as an indicator of tree health the ongoing viability of a population can be assessed by comparing the age class distribution against a reference distribution curve (Robinson, 2013).
Page 34
The Living Murray icon sites 2013–14 Monitoring
An analysis of three years blocks of data (2006–08, 2009–11 and 2012–14) found the overall class-size distribution was very similar across all, with one important deviation in 2012–14. This group showed a very large proportion of trees in the 0–15 cm size class with most of these trees between 0–1 cm diameter at breast height (DBH), representing newly germinated seedlings. This suggests that the germination of red gums seedlings may be the result of the natural flood event in 2010–11 (Henderson et al. 2014).While this represents a successful germination event, the survival of seedlings to maturity (approximately 10 years) is considered as successful recruitment.
Net population gain/loss is calculated as the difference between annual recruitment and mortality of mature trees (trees reaching 10 years old — 10–13cm DBH). While recruitment remained at similar levels across all years of monitoring, in the 2009–11 period mortality rates were greater than recruitment rates resulting in a net population loss during this time. Following the natural floods of 2010–11 mortality decreased, resulting in a net population gain in 2012–13 and 2013–14. This gain can be attributed to the natural flooding and the environmental watering in 2013–14.
Black boxThe targets for black box swampy woodland are:
80% of black box trees with Crown extent of ≥ 4Annual mortality < 2 %.
The methods used to assess black box communities are the same as those for red gum communities. The only difference is in the crown extent target, where only 80% of trees sampled need to have a canopy cover ≥ 4 to meet the target.
In 2008–09 49.5% of individual black box trees were assessed as having a canopy extent of ≥ 4. Over the last three survey years, 2011–12 to 2013–14, there has been very little change in the crown extent score, with 84.6%, 85.1% and 84.2% of individual trees sampled with canopy extent ≥ 4. This means the target of greater than 80% of trees with a crown extent ≥ 4 has been met for these three years.
Like the river red gum, three year blocks data (2006–08, 2009–11 and 2012–14) were analysed to determine the ongoing viability of black box communities by comparing the age class distribution against a reference distribution curve (Robinson, 2013).The age-class distribution of black box suggests that there has not been a significant change in the population size distribution between 2006–08 and 2012–14. As with the river red gum population, the size frequency 0–15 cm DBH class shows an increase in the number of individuals present, suggesting some seedling recruitment. Analysis of the 1–15 cm group indicates that the majority of trees were in the 0–1 cm DBH size class. As black box communities were not inundated by natural flooding in 2010–11 due to higher elevation on the floodplain, this may be a response to heavier than average rainfall during 2011–2012 or the influence of groundwater (Henderson et al. 2014). There has been a net gain in the black box population mainly due to very low mortality at the sampled sites.
Page 35
The Living Murray icon sites 2013–14 Monitoring
LignumThe target for lignum shrubland is:
≥ 70% of Lignum plants will have a Lignum Condition Score (LCI) ≥ 4 (Moderate or better)
Two measures, viability and colour, are used calculate a Lignum Condition Score (LCI). Viability is the percentage of visible plant material that is not dry or dead, while colour is the colour of the viable crown defined against a set scale. These indicators are combined to calculate a LCI, with a score of 1 to 3 categorised as poor condition, 4 to 6 moderate condition, 7 to 9 good condition and 10 to 11 very good (Henderson et al. 2014).
In 2013–14 79.3% of the lignum had a LCI ≥ 4 and thus the target was met. This is an increase from the 68.7% in 2012–13. In 2013–14 there was a decrease in the number of lignum plants in good condition accompanied by an increase of plants in moderate condition. This change is thought to be associated with the drying of the floodplain since 2010–11. Lignum monitoring occurred in spring 2013, before the 2013–14 watering event could have influenced plant condition. There has been no lignum identified in the very good category since 2009–10.
FishThe overarching ecological objective for fish is:
Maintain high quality habitat for native fish in wetlands and support successful breeding events.
While the more specific objectives include:
Increase distribution, number and recruitment of local wetland fish – including hardyhead (Craterocephalus spp), Australian smelt and gudgeon by providing appropriately managed habitat.
Since monitoring commenced in 2005–06, 15 different species of fish have been recorded at Hattah Lakes. Diversity is closely linked to water levels in lakes, with low diversity when the lakes are dry and higher diversity when the water levels are high and there is connectivity with the River Murray.
The greatest diversity of fish species was recorded in 2010–11 following the natural floods, when 14 of the 15 known species were recorded. This included two species — spangled perch (Leiopotherapon unicolor) and dwarf flat-headed gudgeon (Philypnodon macrostomus) — that were only recorded in that year. Two non-native species, oriental weatherloach (Misgurnus anguillicaudatus) and eastern gambusia, were also recorded in 2010–11 for the first time. The second highest diversity was recorded in 2013–14 when 13 fish species –9 native and 4 non-native were found.
Page 36
The Living Murray icon sites 2013–14 Monitoring
Fish diversity in the lakes was very similar to that found in the main River Murray channel. Monitoring showed that the larvae and juvenile fish of three important large-bodied fish species — Murray cod, golden perch and silver perch — were entrained through the pumps. On drawdown both golden perch and Murray cod were recorded moving from the lakes to the River Murray at Messengers Regulator. The pumping of environmental water to Hattah Lakes appears to have provided a relatively close simulation to the natural flood event in terms of species entrained, but the size class was limited to the sizes that can fit through the intake grids.
The high diversity associated with 2010–11 and 2013–14 suggests that the diversity of fish increases when there is greater lateral connectivity between the main River Murray channel and the floodplain.
While fish were not monitored for breeding, the presence of large numbers of piscivorous birds may indicate that fish bred successfully within the lakes. These results suggest that the overarching objective was met, and that the more specific objective of increasing distribution, number and recruitment of native fish was partially met in 2013–14.
BirdsThe overarching ecological objectives for birds are:
Provide feeding and breeding habitat for a range of waterbird species, including threatened and migratory species.Provide conditions for successful breeding of colonial nesters at least twice every ten years.
While the more specific objectives include:
Provide feeding and breeding habitat for a range of waterbird species including threatened and migratory species.
In 2013–14 limited resources were available for waterbird monitoring. On the advice of bird ecologists, it was decided to undertake quarterly bird surveys and monitor only for the presence of waterbirds in relation to the watering event, and not for breeding.
In July 2013 there was water in three lakes (Hattah, Bulla and Mournpall) and 15 species of waterbird were present. However, prior to the start of the environmental watering event in October 2013, all the lakes apart from Lake Mournpall were dry and only 7 species were recorded, all at Lake Mournpall. This decrease was expected as all the lakes except one were dry.
In response to the 2013–14 environmental watering in April 2014 waterbird diversity increased to 20 species. Three cormorant species including the darter were observed at wetlands. Cormorant species were observed breeding on the lakes, including the pied cormorant (Phalacrocorax varius), a species rarely seen breeding at Hattah.
Page 37
The Living Murray icon sites 2013–14 Monitoring
It was observed the use of the lakes changed as their characteristics changed. As the lakes started filling, dabbling ducks, grazing waterfowl and grebes were the most common birds using them. As the depth increased in the larger lakes, these guilds were replaced with piscivores, notably the cormorant species.
The non-uniform topography of the floodplain resulted in a range of water depths across the floodplain. This provided a range of aquatic habitat ranging from deep water in the large lakes, to shallow lakes and to very shallow muddy habitat in the flood-runners. This range of habitat ensured that a range of waterbird guilds were catered for (for the whole year, 25 waterbird species from five guilds groups were observed) and thus the habitat elements of the overarching objectives were met (Henderson et al. 2014).
Overall status of the Hattah Lakes Icon SiteBetween 2005 and 2010 relatively small quantities of environmental water was used to maintain some wetlands and the associated species during an extended period of drought. A relatively constant diversity of wetland vegetation was recorded in the years prior to the 2010–11 flood event. In the year of the natural flood the diversity halved possibly as a result of much deeper inundation of the littoral zone. In the two years following the 2010–11 flood, as the floodplain dried diversity returned to levels recorded before the flood. Diversity then decreased again during the 2013–14 watering event.
Prior to 2010–11, the vegetation, particularly trees, were drought stressed (Walters et al. 2011). During natural floods in 2010–11, much of the red gum forest and woodland received flood water with an improvement in canopy condition the following year (Henderson et. al 2014). While this floodwater did not reach the black box woodlands, above average rainfall during the year resulted in an improvement in black box canopy condition. The canopy condition of both red gum and black box trees has remained at similar levels from 2010–11 to 2013–14. Monitoring in 2013–14 indicates the establishment of seedlings has improved, particularly in the red gum forest and woodlands, suggesting that a damp soil environment aided the survival of seedlings. Black box seedling recruitment was not as pronounced.
The fauna diversity monitored at this site is limited to fish and waterbirds. Diversity of fish was very low in wetlands from 2005 to 2010. This is because there were a limited number of wetlands that held water and a lack of connectivity to the River Murray. However, following the 2010–11 flood, native fish diversity nearly doubled. The non-native fish diversity also doubled, with the oriental weatherloach and eastern gambusia recorded for the first time in the lakes. High diversity was maintained the following year, but as the wetlands were dried during the construction of the environmental water management structures, the diversity decreased again.
Fish diversity increased again following the environmental watering in 2013–14, with the diversity in Hattah Lakes very similar to that found in the River Murray. The pumping of environmental water to Hattah Lakes appears to have provided a relatively close simulation to the natural flood event in terms of species transferred from river to lakes.
Waterbird abundance and diversity was monitored over a changing floodplain habitat. Waterbird ecology operates at the continental scale and the provision of suitable habitat at one location may not mean an increase in abundance of birds. During the extended drought prior to 2010–11, small quantities of environmental water were pumped into Hattah Lakes and periodically filled wetlands. This meant that the conditions for ducks and pelicans were ideal. Around the edges of
Page 38
The Living Murray icon sites 2013–14 Monitoring
wetlands, the large waders such as herons have also been regularly recorded. Following environmental watering in 2013–14 and greater inundation of the floodplain, there was a large influx of cormorant species that bred on some of the lakes. This included the pied cormorant that is not often recorded breeding in Victoria.
The provision of water to the lakes at Hattah–Kulkyne National Park in 2013–14 had a marked effect on the waterbird assemblages. Over the previous five years, monitoring indicated that the most dominant species were from the duck guild and pelicans. However, following environmental watering, there was a significant increase in the abundance of the piscivore guild. This was mainly due to an increase in three species of cormorant i.e. darter, great cormorant (Phalacrocorax carbo) and pied cormorant. Although bird breeding was not monitored, nests and juveniles were observed for all three species.
Page 39
The Living Murray icon sites 2013–14 Monitoring
Lindsay–Mulcra–Wallpolla IslandsThe Lindsay–Mulcra–Wallpolla Islands in northwest Victoria are formed by three islands along the River Murray between Mildura and the South Australian border (Figure 15). They are part of the Chowilla Floodplain and Lindsay–Wallpolla Islands icon site, which has components in South Australia, New South Wales and Victoria.
The three islands support a range of flora and fauna representative of the Mallee region of northwest Victoria. This includes a number of species listed as rare and vulnerable under either state or federal legislation. The Islands are listed in the Directory of Important Wetlands in Australia.
Figure 15: Lindsay, Mulcra and Wallpolla Islands
The environmental water management structures at Lindsay–Mulcra–Wallpolla Islands consist mainly of small structures that have replaced pipes and drains to improve flow through the system (Figure 16).
At Lindsay Island the environmental water management structures include refurbished regulators on the northern and southern inlets of the Lindsay River that were completed in 2013 and the Mullaroo regulator and fishway scheduled for completion in 2015.
At Mulcra Island environmental water management structures include regulators to improve connections between the River Murray and Potterwalkagee Creek, and the largest structure at this site the Lower Potterwalkagee Regulator, which enables inundation of low lying floodplain and wetlands.
There are no environmental water management structures at Wallpolla Island.
Page 40
The Living Murray icon sites 2013–14 Monitoring
Figure 16: Mulcra Island and the eastern side of Lindsay Island (outlined in black) showing the position of the completed and proposed water management infrastructure (pink dots)
Icon site ecological objectivesThe vision for the Lindsay–Wallpolla–Mulcra Islands is:
To maintain and restore a mosaic of healthy floodplain communities across Lindsay, Mulcra and Wallpolla Islands which will ensure that indigenous plant and animal species and communities survive and flourish throughout the site.
Ecological objectives for Lindsay Wallpolla and Mulcra Islands are listed in Table 9. The current targets associated with these objectives are under review and due to be finalised in 2015–16.
Table 9: Ecological objectives for Lindsay–Mulcra–Wallpolla
Overarching objectives Specific objectives
Increase the diversity, extent and abundance of wetland vegetation
Provide a diversity of structural aquatic habitats.
Increase diversity and abundance of wetland aquatic vegetation.
Maintain and improve the populations of threatened flora and fauna that are flow dependent.
Restore productivity linkages between the river and floodplain habitats.
Increase abundance, diversity and extent of distribution of native fish
Increase abundance, diversity and extent of distribution of native fish.
Provide habitat for a range of waterbirds, including migratory species and colonial nesters
Provide occasional breeding and roosting habitat for colonial waterbirds.
Provide habitat suitable for migratory birds, especially species
Page 41
The Living Murray icon sites 2013–14 Monitoring
Overarching objectives Specific objectives
listed under the Japan–Australia Migratory Bird Agreement, the China–Australia Migratory Bird Agreement and the Republic of Korea–Australia Migratory Bird Agreement.
Flow and climatic conditionsThe Lindsay–Mulcra–Wallpolla Islands are situated in a semi-arid landscape. Rainfall at Lake Victoria (the nearest weather station) during 2013–14 was 272.9 mm, about 10 mm above the long term mean. The mean monthly maximum temperatures were greater than the long-term average for every month of 2013–14. Further, the mean annual maximum temperature for 2013–14 was 25.4°C, 1.7°C hotter than the long-term average (Figure 17).
Figure 17: Monthly rainfall and mean maximum temperature (long term average (blue) and 2013–14 (red)) for Lake Victoria, near the Lindsay–Mulcra–Wallpolla icon site (Source: BoM 2015)
As is common in semi-arid regions, rainfall in the Mallee is highly variable temporally and spatially. Individual locations frequently have one year of above average rainfall followed by several years below average. These rainfall patterns emphasise the importance of overbank/flood events for wetlands in this region.
Page 42
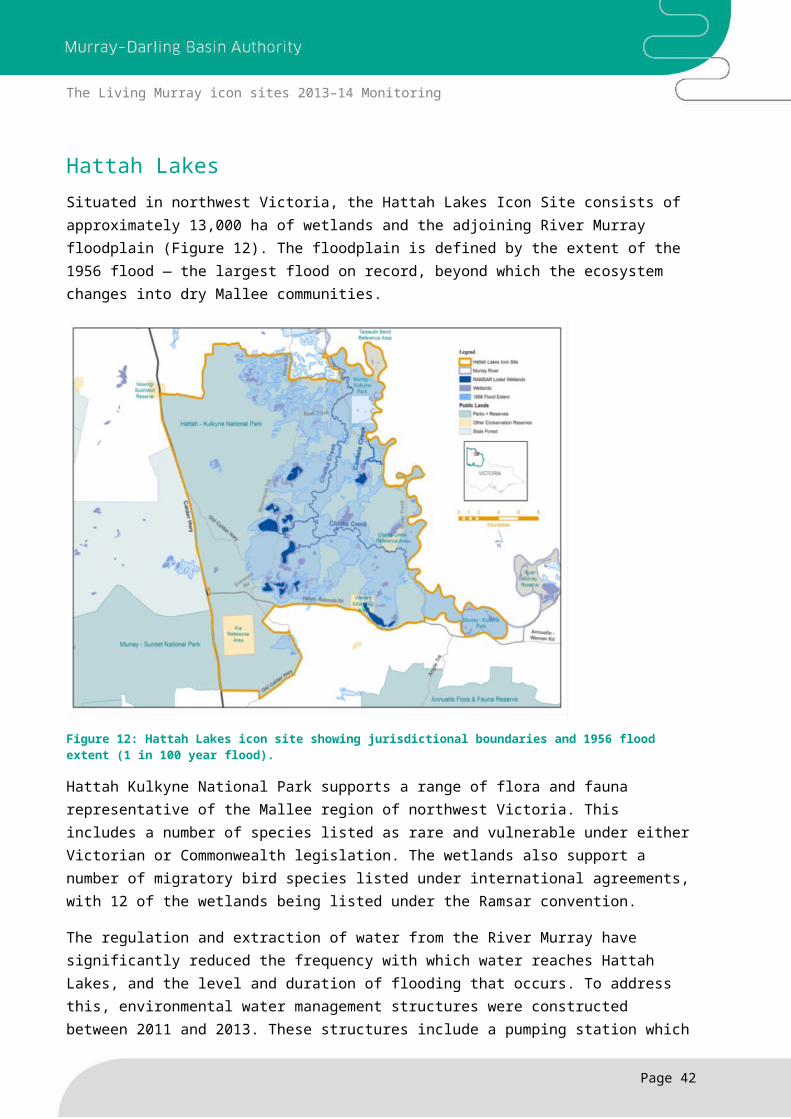
The Living Murray icon sites 2013–14 Monitoring
Flow in this reach of the River Murray is influenced by regulation of the River Murray rather than local climatic conditions. For example higher flows may be the result of heavy rainfall in the upper River Murray catchment and/or the release of water from storages. The hydrology of the Lindsay–Mulcra–Wallpolla anabranch systems are also influenced by the Locks 6 to 10 weir operations (Henderson M et al. 2014).
2013–14 Environmental Watering and management actions In 2013–14 environmental watering at this icon site focused on Mulcra Island and the first commissioning of the Lower Potterwalkagee and Horseshoe Lagoon environmental water management structures. 3.745GL of TLM environmental water was delivered in 2013–14 (Table 10). This watering action was undertaken in conjunction with the Lock 8 and Lock 9 weir pool manipulation event coordinated by the New South Wales Office of Water.
In addition to commissioning the structures, the environmental watering provided connectivity between the River Murray and the floodplain, benefitting wetlands, native fish and river red gums.
Due to the refurbishment of the Lindsay inlet regulators and the construction of the Mullaroo Creek Regulator and Fishway, there was no environmental watering at Lindsay Island in 2013–14.
Table 10: Environmental watering at the LMW icon site in 2013–14
Objectives and Targets Volume GL (gross)
Timing
1. Commission the infrastructure on the Potterwalkagee Creek to 25m AHD including filling the Mulcra Horseshoe and Snake Lagoon
2. Connectivity between the River Murray and floodplains inundating wetlands, river red gums and lignumand providing connectivity for native fish
3.7(TLM) Jul 2013–Aug 2013
Description of monitoring
Condition monitoringTLM Condition monitoring commenced at the Lindsay–Mulcra–Wallpolla (LMW) Islands in 2006–07. The following condition monitoring activities were undertaken at this site in 2013–14 (Henderson et al. 2014):
• Monitoring the condition of floodplain trees (river red gum, black box); vegetation communities (wetland and floodplain); lignum and cumbungi.
• Fish surveys to determine the abundance, diversity and extent of the distribution of native fish.
• Winter, spring and summer waterbird surveys.
Page 43
The Living Murray icon sites 2013–14 Monitoring
Intervention monitoringIntervention monitoring activities in 2013–14 mainly focused on the commissioning of the environmental water management structures at Mulcra Island (Figure 18). Activities included:
• Water quality monitoring.• Tracking fish movement in Potterwalkagee Creek and fish use of the Mulcra
floodplain.• Monitoring waterbird and frog diversity.
At Lindsay Island intervention monitoring focused on tracking the movement of large-bodied fish (Murray cod, golden perch and freshwater catfish) through the Mullaroo Creek and Lindsay River.
2013–14 Monitoring results
Wetland vegetationThe specific ecological objective for wetland vegetation is to:
Increase the diversity, extent and abundance of wetland vegetation
From 2007–08 to 2009–10 plant diversity increased from 69 species to 135 species. This increase is attributed to the environmental water delivery to wetlands in the icon site in those years. In 2010–11 only six plant species were recorded. The floodplain was inundated naturally in that year, therefore only aquatic species were present. By the following year, on the drying wetlands, 129 species were recorded. The changes in diversity are expected because as the wetlands change from wet to dry, the habitat changes from fully aquatic through to damp/moist environments to fully dry environments. During 20133–14, 97 species were recorded. This decrease may not represent a drop in diversity, but could be the result of some of the ephemeral wetlands drying completely resulting in the loss of aquatic species.
Figure 18: Horseshoe Lagoon at Mulcra Island during the 2013 commissioning of water management structures (Photo: Ben Dyer, MDBA)
Page 44
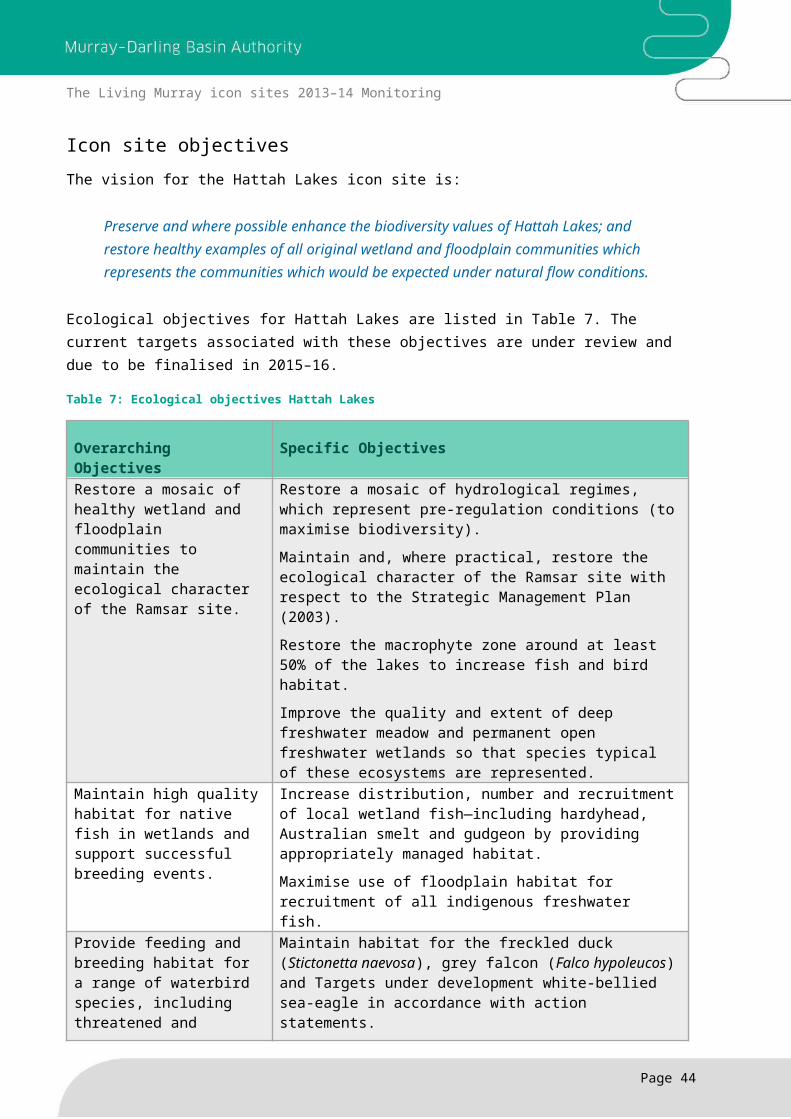
The Living Murray icon sites 2013–14 Monitoring
Floodplain vegetation
River red gum forests and woodlandsFloodplain vegetation under river red gum showed a similar trend to that of the wetlands, with species diversity increasing between 2007–08 and 2009–10, followed by very low diversity in 2010–11 during the natural flood year and higher diversity in 2011–12. As with the wetland sites, environmental watering prior to natural flooding may have increased the damp/moist environment therefore increasing the number of potential environments for plants to grow.
The targets for red gum woodland and forest are:
Maintain 85% of river red gum trees with crown extent ≥ 4Annual mortality < 2 %
Crown extent is the measurable foliage cover in the canopy. A crown extents of ≥ 4 is equivalent to a crown extent of greater than 40%.The frequency of river red gums with a crown extent ≥ 4 increased from 74% in 2008–09 to 97% in 2012–13. In 2013–14 the frequency of trees with a crown extent ≥ 4 were similar to 2012–13. Therefore the condition of the red gum has remained constant over this time and the target for red gums has been achieved.
Whilst crown condition can be used as an indicator of tree health the ongoing viability of a population can be assessed by comparing the age class distribution against a reference distribution curve (Robinson 2013).
An analysis of three years blocks of data (2006–08, 2009–11 and 2012–14) found the overall class-size distribution was very similar across all, with one important deviation in the 2012–14. This group showed a very large proportion of trees in the 0–15 cm size class with most of these trees between 0–1 cm diameter at breast height (DBH), representing newly germinated seedlings. This suggests that the germination of red gums seedlings may be the result of the natural flood event in 2010–11 and higher than average rainfall in 2011–12 (Henderson et al. 2014).While this represents a successful germination event, the survival of seedlings to maturity (approximately 10 years) is considered as successful recruitment.
Net population gain/loss is calculated as the difference between annual recruitment and mortality of mature trees (trees reaching 10 years old — 10–13cm DBH). Between 2007–08 and 2013–14, the river red gum populations across the icon site have remained stable, with the survival of trees to maturity similar to the rates of mortality. This stability is thought to have been influenced by the natural flood of 2010–11 and higher than average rain fall in 2011–13 (Henderson, 2014).
Black BoxUnderstorey diversity in black box communities increased following the floods of 2010–11. Black box woodlands are generally at higher elevations, therefore it is possible that water reaching the black box community was very shallow and did not drown low growing species. It may also be possible that new propagules were carried by floodwaters (Henderson, 2014).
Page 45
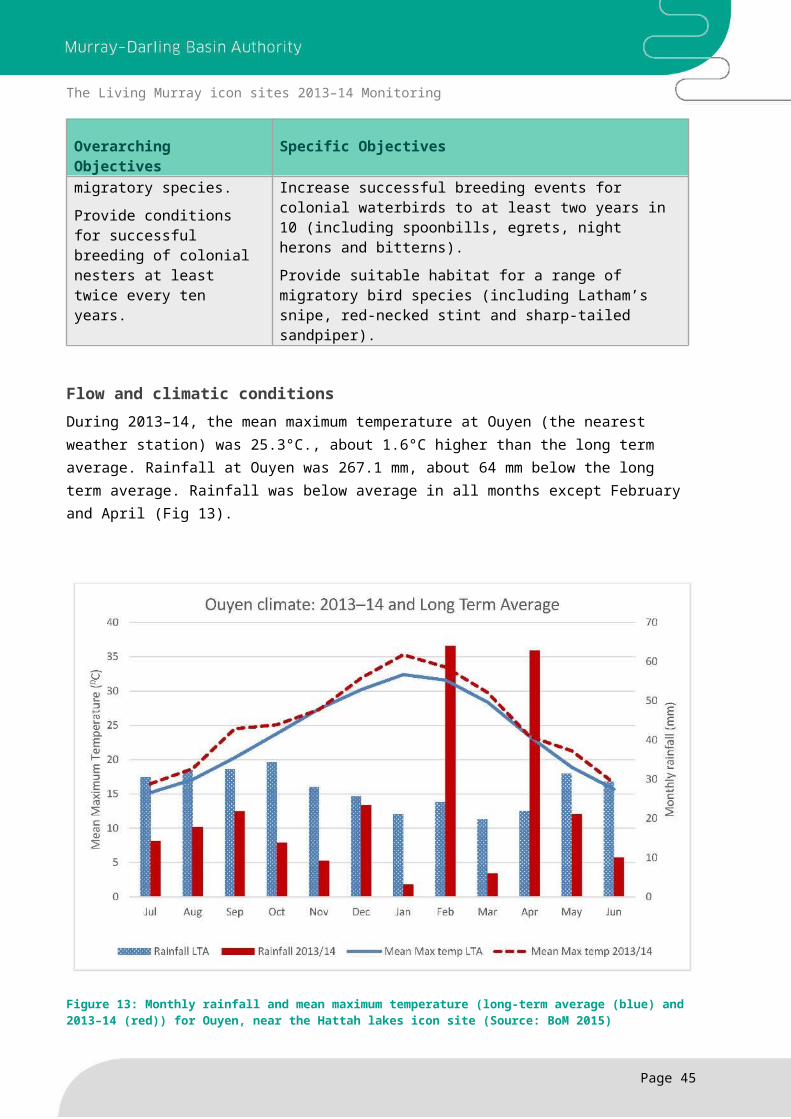
The Living Murray icon sites 2013–14 Monitoring
The targets for black box swampy woodland are:
80% of black box trees with Crown extent of ≥ 4 Annual mortality < 2 %.
The methods used to assess black box communities are the same as the assessment of red gum communities. The only difference is in the crown extent target, where only 80% of trees sampled require a canopy cover ≥ 4 to meet the target.
As with the red gum communities, there was a relatively large increase in frequency of trees from 60% in 2008–09 to 86% in 2011–12. Over the last three years of monitoring (2011–12 to 2013–14) the frequency of trees with a crown extent ≥ 4 has remained constant.
The analysis of black box swampy woodland population demographics shows a change in the structure of the population between 2006–08 and 2012–14. There was a decrease in the number of trees in the 0–15cm diameter at breast height (DBH) class, with a similar increase in the number of trees in the 15–30cm DBH class. This suggests limited germination during the last three years, even though tree condition appears to have improved, coupled with a steady recruitment of juvenile trees to mature trees. (Henderson, 2014).
For black box swampy woodland net population gain/loss calculations show that annual mortality and recruitment rates were similar in 2012–14. This suggests that the population has remained stable (Henderson, 2014).
LignumThe current target for lignum shrublands is for:
≥ 70% of lignum plants with a Lignum Condition Score (LCI) ≥ 4
Two measures, viability and colour, are used calculate a Lignum Condition Score (LCI). Viability is the percentage of visible plant material that is not dry or dead, while colour is the colour of the viable crown defined against a set scale. These indicators are combined to calculate a LCI, with a score of 1 to 3 categorised as poor condition, 4 to 6 moderate condition, 7 to 9 good condition and 10 to 11 very good (Henderson et al. 2014).
In 2008–09 the number of lignum plants with a LCI score < 4 was below 70%. From 2009–10 to 2013–14, the frequency of plants with an LCI ≥ 4 increased above 70%, therefore the target for lignum has been met for these years. The current data shows that there is an increase in the overall condition of lignum that appears to be linked to increased rainfall between 2010 and 2012, and natural flooding in 2010–11, with a slight decline in condition in the following years as the floodplain dried.
FishThe specific ecological objective for fish is to:
Increase abundance, diversity and extent of distribution of native fish.
Page 46
The Living Murray icon sites 2013–14 Monitoring
To determine the condition of fish, five metrics (alpha diversity, beta diversity, extent, nativeness and expectedness) are assessed at four habitat types (riverine, anabranch (slow flow), channel (fast flow) and wetland). Sampling has occurred since 2006–7, except at wetlands which were dry between 2006–7 and 2009–10.
The metrics have shown very little variation over time – so that results for 2013–14 are similar to those for previous years. There are occasional significant differences between years – for example alpha diversity in anabranch habitats was lower 2012–13 than other years, recovering in 2013–14. The greatest variation was in the wetland habitat, reflecting lack of water in the dry period before 2010–11, and the subsequent drying of the wetland after the 2010–11 flood.
Between 2006 and 2014, 12 native and 5 non-native species have been recorded at the icon site. The 2013–14 fish survey recorded 18,414 fish from 15 species (12 native and 3 non-native) at Lindsay–Wallpolla Island.
Following the floods in 2010–11, two species not previously sampled during monitoring have been recorded — the threatened freshwater catfish and the spangled perch. Also, the non-native oriental weatherloach has not been recorded since the flood in 2010–11.
The abundance of native fish decreased in the 2012–13 following natural flooding. At the same time the number of eastern gambusia and common carp increased. Since 2012–13 the abundance of both native and non-native have returned to numbers similar to before the 2010–11 flood.
One of the intervention monitoring projects at Mulcra Island tracked the movement of fish into Potterwalkagee Creek during the environmental watering event. The most notable response was the aggregation of common carp and goldfish below Lower Potterwalkagee Creek regulator, with the highest density of common carp found four weeks after the start of the Lock 8 weir pool raising and once stop logs were in place in the regulator. Common carp on the upstream side of the regulator moved onto the floodplain and spawned. In contrast, golden perch moved out of the Potterwalkagee Creek, back to the River Murray. This suggests that while inundation of the Mulcra floodplain may provide nursery habitat for native fish larvae that drifts from the River Murray, it also provides ideal spawning habitat for non-native species.
WaterbirdsThe specific ecological objective for waterbirds is to:
Provide habitat for a range of waterbirds, including migratory species and colonial nesters
The presence of waterbirds at the Lindsay–Mulcra–Wallpolla Islands depends on the presence of water in the wetlands. During 2013–14, most of the wetlands were in a drawdown phase which means that they were either dry or drying. This limited the available waterbird habitat. Due to Horseshoe Lagoon containing water, it showed the greatest diversity of waterbirds across the islands.
Page 47
The Living Murray icon sites 2013–14 Monitoring
Following the natural floods of 2010–11 the deep wetlands were able to support large numbers of piscivores such as darter and cormorant. In addition the temporary shallow marshes provided very good habitat for the large wading birds such as spoonbill and heron. As the floodplain dried the diversity of habitat decreased with water retreating to the deeper wetlands. This led to a waterbird community dominated by ducks and grebes.
Monitoring since 2006–07 has found that migratory shorebirds have been notably absent with resident populations of black-winged stilt (Himantopus himantopus), black-fronted dotterel, red-kneed dotterel and masked lapwing present in small numbers.
Overall status of the Icon SiteThe condition of the icon site has improved since the natural flood of 2010–11. Prior to this, environmental watering targeted specific wetlands and reaches in the icon site to mitigate complete loss of wetlands to drought. The areas provided with water showed evidence of maintaining diversity within the wetlands. However, areas not provided with water continued to show the effects of drought and river regulation.
Since TLM condition monitoring started in 2006–07, the condition of floodplain and wetland vegetation has generally improved. This is demonstrated by the improvement of the stand condition of trees and by the increase in diversity of wetland and floodplain vegetation.
Since the natural flood in 2010–11, the condition of the stand condition of trees has remained relatively constant, with over 85% of sampled trees with a crown extent >4. While overall understorey diversity has increased since 2007–08, following the natural floods in 2010–11, understorey diversity in red gum woodlands decreased, whereas diversity in the black box woodland continued to increase. This may be due to the lower lying red gum woodland experiencing deeper flooding that drown low growing plants.
Lignum shrublands and black box woodland showed the greatest stress as a result of the drought, with trees and shrubs dying in some areas. Following natural flooding in 2010–11, there was a general recovery of the water stressed communities. However, this water was too late for some of the black box and lignum that had crossed a survival threshold. However, the surviving trees and shrubs appeared to recover vigour. In the years following flooding the diversity of the understorey vegetation increased. It is not known whether the new propagules were brought in with the floodwater or grew from seed banks.
Since condition monitoring started at the icon site, fish diversity has remained relatively constant. Through the drought years (2000 to 2009–10) habitat was restricted to low flow in the larger creeks and to wetlands supplied with environmental water. This provided a range of habitats that maintained fish diversity. The long-term diversity and abundance has not changed, but there have been annual fluctuations in which species are abundant.
In 2012–13 two native fish species that have not been found at this icon site for a long time, the freshwater catfish and spangled perch, were recorded. These two species were recorded again in 2013–14.
Waterbird diversity has fluctuated with water availability in wetlands. Wetlands in the Lindsay–Mulcra–Wallpolla Islands tend to hold water for less than a year, therefore waterbird populations are very transient. The exception is Lake Wallawalla which has maintained good populations of ducks, pelicans and large waders (Henderson 2014).
Page 48
The Living Murray icon sites 2013–14 Monitoring
Waterbird populations also fluctuated as wetland habitat has changed. Most of the guilds are represented in most years, with the abundance and diversity changing as the habitat conditions change. Monitoring since 2006–07 found that migratory shorebirds have been notably absent with resident populations of black-winged stilt, black-fronted dotterel, red-kneed dotterel and masked lapwing present in small numbers.
Page 49
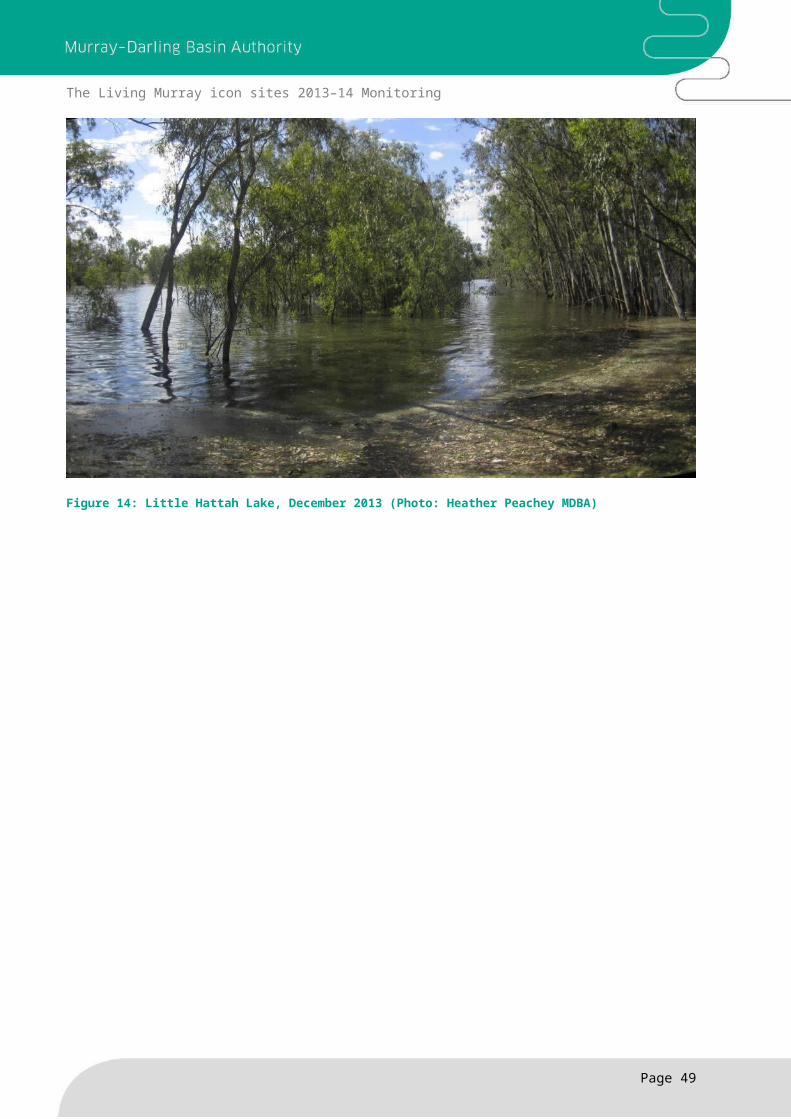
The Living Murray icon sites 2013–14 Monitoring
Chowilla FloodplainThe Chowilla Floodplain and anabranch system (Figure 19) is a significant ecological asset of the Murray–Darling Basin and is part of the Riverland Ramsar wetland of international importance. The Floodplain is part of Chowilla and Lindsay–Wallpolla Islands icon site which has components in South Australia, New South Wales and Victoria.
The Chowilla Floodplain covers a total area of 17,781 hectares, straddling the South Australian – New South Wales border (Fig 17).
Figure 19: Chowilla Floodplain
Chowilla has highly diverse terrestrial and aquatic habitats; supports populations of rare, endangered and nationally threatened species and contains heritage-protected sites of cultural significance. The floodplain is also highly valued by the community for its recreational values.
The Chowilla Floodplain has undergone a severe decline in environmental condition because of reduced frequency and extent of floodplain inundation, resulting from river regulation and increasing water extraction. This decline was further exacerbated with the low system inflows during the millennium drought.
To address the decline in condition, a series of environmental water management structures were under construction in 2013–14, including the Chowilla Creek environmental regulator. The regulator will enable inundation of 30–50% of the floodplain.
Page 50
The Living Murray icon sites 2013–14 Monitoring
Page 51
The Living Murray icon sites 2013–14 Monitoring
Icon site objectivesThe vision for the Chowilla Floodplain Icon Site is:
To maintain and restore a diverse and healthy floodplain environmental that will provide for the long-term ecosystem and community needs and serve as a showcase for the lower River Murray floodplain management (MDBA 2012).
There are three high-level ecological objectives for the Chowilla Floodplain:• maintain high-value wetlands• maintain the current area of river red gum forest• maintain at least 20% of the original area of black box vegetation
Specific objectives, which underpin these high-level objectives, were developed to quantify changes in the condition of the Chowilla Floodplain (Table 11).
Table 11: Chowilla icon site specific ecological objectives
Functional Group Specific ObjectivesVegetation Maintain viable river red gum populations within 70% of river red gum
woodland.
Maintain viable black box populations within 45% of black box woodland.
Maintain viable river cooba (Acacia stenophylla) populations within 50% of existing river cooba and mixed red gum and river cooba woodland areas.
Maintain viable lignum populations in 40% of existing areas.
Improve the abundance and diversity of grass and herblands.
Improve the abundance and diversity of flood dependant understorey vegetation.
Improve the abundance and diversity of submerged and emergent aquatic vegetation.
Maintain or improve the area and diversity of grazing sensitive plant species.
Limit the extent of invasive (increaser) species including weeds
Fish Populations Maintain or increase the diversity and extent of distribution of native fish species.
Maintain successful recruitment of small and large bodied native fish.
Frog Populations Maintain sustainable communities of the eight riparian frog species recorded at Chowilla.
Improve the distribution and abundance of the nationally listed southern bell frog (Litoria raniformis) at Chowilla.
Bird Populations Create conditions conducive to successful breeding of colonial waterbirds in a minimum of three temporary wetland sites at a
Page 52
The Living Murray icon sites 2013–14 Monitoring
Functional Group Specific Objectivesfrequency of not less than one in three years.
Create conditions conducive to successful breeding of colonial waterbirds in a minimum of three temporary wetland sites at a frequency of not less than one in three years.
Maintain or improve the diversity and abundance of key bird species.
Maintain the current abundance and distribution of regent parrots.
Maintain the current abundance and distribution of the bush stone-curlew (Burhinus grallarius).
Flow and climatic conditionsThe nearest weather station to Chowilla Floodplain with a long term record is at Lake Victoria in NSW (36 km away). Rainfall at Lake Victoria during 2013–14 was 272.9 mm, about 10 mm above the long term mean. The mean monthly maximum temperatures were greater than the long-term average for every month of 2013–14 (Fig 16).
2013–14 flow conditions in South Australia are described in section 1.
2013–14 Environmental Watering and management actions Due to construction activities in 2013–14, there was no large scale environmental watering at Chowilla. However TLM environmental water was allocated for use at nine priority wetland sites at Chowilla (Table 12). These sites were selected based on the outcomes of condition monitoring, which indicated declining condition of long-lived vegetation. The overarching objective for the watering was to consolidate the improvements in condition that had resulted from high flows and environmental watering in recent years. In turn this would improve the floodplain’s capacity to respond to future high flows or delivery of environmental water via the Chowilla water management structures, and increase the capacity of the floodplain to withstand, and recover from future droughts.
During 2013–14 water was delivered to six of the nine sites. Three sites — Coppermine Waterhole, Chowilla Island Loop and Woolshed Creek — were not watered due to potential impact on construction activities.
Table 12: Environmental watering at Chowilla Floodplain
Actions Objectives and Targets Volume Timing Provision of environmental water to priority wetlands
Improve the proportion of trees that are classified in good.Achieve further reductions in the proportion of trees that are classified in stressed condition.Provide conditions conducive to the ongoing survival of seedlings/saplings that have established.Provide conditions conducive to achieving further gains in the condition and viability of lignum populations.
4.2GL Brandy Bottle (9–23 Oct 2013)Lake Littra (16 Oct–12 Nov 2013)Gum Flat (28 Nov–22 Dec 2013)Punkah Island (6–29 Jan 2014)Werta Wert (7 Jan–1 Feb 2014)Chowilla Horseshoe
Page 53

The Living Murray icon sites 2013–14 Monitoring
Actions Objectives and Targets Volume Timing
Provide habitat for breeding events for waterbirds and amphibians.Conditions conducive to ongoing improvements in the diversity / distribution of flood dependent and aquatic understorey vegetation.
(28 Feb–10 Mar 2014)
Description of monitoring
Condition monitoring activitiesThe following condition monitoring was undertaken in the Chowilla Floodplain icon site in 2013–14:
• Assessment of condition and population demographics of floodplain trees (river red gum, black box, river cooba).
• Ground surveys for stand condition monitoring• Assessment of lignum condition.• Assessment of the species present in vegetation communities on the floodplain and in
wetlands.• Survey of fish communities to determine the species present, distribution, abundance and
population structure.• Seasonal surveys of terrestrial bird species present and their abundance.• Surveys of waterbird species and abundance at wetlands holding or receiving water.• Surveys of frog populations in wetlands (species presence and breeding activity).
Intervention Monitoring The following intervention monitoring activities were undertaken in 2013–14:
• Maintenance of the surface water monitoring network including telemetry upgrades to allow real time access to water level; flow; salinity; and dissolved oxygen data across the Chowilla Floodplain
• Installation of an automatic weather station to collect rainfall; barometric pressure; temperature; humidity; wind direction and velocity; and solar radiation.
• Collection and analysis of water quality data to assess changes and improve the long-term management of hypoxic blackwater
• Tracking the movement of Murray cod to ascertain their behaviour before and after the construction and use of the Chowilla Environmental Regulator and identification of the hydraulic habitats used by these fish.
• Undertaking a baseline audit of soil parameters prior to the operation of the Chowilla Environmental Regulator and monitoring risks of soil salinisation from regulator operations.
Page 54
The Living Murray icon sites 2013–14 Monitoring
Monitoring Results 2013–14
VegetationThe specific ecological objectives for floodplain trees communities are:
Maintain viable river red gum populations within 70% of river red gum woodland.Maintain viable black box populations within 45% of black box woodland.Maintain viable river cooba populations within 50% of existing river cooba and mixed Red Gum and river cooba woodland areas.
Viable populations are assessed using a combination of tree condition and population demographic assessments.
Tree condition assessments have been undertaken at sites near temporary creeks and wetlands across the Chowilla Floodplain since 2008. In general, tree condition index values improved between 2008 and 2012 in response to targeted environmental watering and the natural flood that occurred in 2010–11. Tree condition peaked in 2011–12 and began to decline in 2012–13 in response to drier conditions. It further declined in 2013–14.
The results from the November 2013 surveys show a decline in the proportion of river red gum, black box and river cooba trees with a tree condition index of 10 or more. The ecological targets for each species (70% of trees with a tree condition index of 10 or more) were not met in 2013–14.
The age-class distribution of woodland trees is an indicator of recruitment and survival, and the growth of young trees must at least match the mortality of old trees if a stand is to remain viable (George, Walker and Lewis 2005). Assessments of population demographics on the Chowilla Floodplain (Wallace, 2013b) indicate that there is insufficient recruitment to sustain existing forest and woodland communities. The population demographics assessment demonstrates at the floodplain scale there is likely to be insufficient saplings entering the population to sustain the existing population, and a substantial proportion of the standing trees are dead.
The decline in condition trajectory since the 2012 natural flooding at the site shows the importance of frequent watering to reinstate condition once trees have declined to a poor condition and to build resilience so that trees can better withstand the next dry period. The population demographics assessment highlights the importance of creating conditions that trigger germination events and support ongoing survival of young trees.
Other specific ecological objectives for understorey and wetland vegetation are:
Improve the abundance and diversity of grass and herblandsImprove the abundance and diversity of flood dependent understorey vegetationMaintain or improve the area and diversity of grazing sensitive plant speciesLimit the extent of invasive (increaser) species including weedsMaintain viable lignum populations in 40% of existing areas
Page 55
The Living Murray icon sites 2013–14 Monitoring
Progress towards these objectives is assessed by collecting and comparing understorey and wetland vegetation species across 108 sampling sites (115 sites from 2013 onwards). The abundance and diversity of vegetation types are strongly linked to the availability of water. In the absence of natural flooding or environmental watering, decreases in the abundance of floodplain and amphibious species and a corresponding increase in abundance of salt tolerant species, terrestrial species and bare soil are expected. The opposite is expected if there has been recent overbank flooding or watering (Gehrig et al. 2014).
Changes in the abundance and diversity of floodplain vegetation over time reflect the availability of water. Between 2006 and 2009 there was a general decline in species richness, punctuated by a spike in 2007 following environmental watering at two large wetlands. An increase in 2010 followed another watering of those wetlands. A natural overbank flood in 2010–11 resulted in a further increase in abundance in 2011. Drier years in 2012, 2013 and 2014 saw a decline in species richness on floodplain sites. However, in 2013 seven new sampling sites at temporary wetlands were included in the survey. When these were included, the abundance and diversity in 2013 and 2014 were slightly higher than in 2012 (Gehrig et al. 2014).
The floodplain communities (at the 108 original sites) in 2014 were similar to those observed in the 2008 surveys, where both species richness and functional group diversity was low.
The changes in the floristic composition in 2014 were mostly driven by significant increases in the abundance of bare soil and the terrestrial species Carpobrotus rossii. There was also a marked decrease in amphibious and floodplain species and an increase in salt tolerant taxa compared to 2013, which is expected given the drier conditions. This indicates that, for the first time since 2011, the ecological objectives relating to diversity of grass and herblands and flood dependent understorey vegetation were not met (Gehrig et al. 2014).
Grazing sensitive species were abundant in comparison to all other surveyed years (excluding 2011) and there was no significant increase in the abundance of invasive (increaser) species, indicating that the ecological objectives relating to these species were again met in 2014 (Gehrig et al. 2014).
The ecological objective for lignum is 70% of plants with a condition index score of 6 or more (i.e. categorised as good condition or above). The proportion of lignum plants in good condition has increased from about 10% in 2008–09 to over 20% in 2009–10 to about 40% in 2011–12 and 2012–13. The increase to 50% in 2013–14 represents a return to continued improvement, even though the 70% target has yet to be met (Wallace, 2014). The improvement in lignum condition over time results from both the targeted application of small amounts of environmental water in dry years, and the natural flood in 2010–11.
Page 56
The Living Murray icon sites 2013–14 Monitoring
Figure 20: Chowilla Horseshoe wetland during the 2013–14 watering (Photo: Jan Whittle)
FishThe specific ecological objectives for fish are:
Maintain or increase the diversity and extent of distribution of native fish speciesMaintain successful recruitment of small and large bodied native fish
Progress towards the ecological objectives for fish is assessed through surveys of key habitats (River Murray channel, fast-flowing, slow-flowing, and backwaters) to determine the species present, their distribution, abundance and population structure.
A total of 6,950 fish, from 14 species (11 native and 3 non-native) were captured in the 2014 condition monitoring surveys. The most abundant species were bony herring (Nematalosa erebi), common carp, Murray rainbowfish and carp gudgeon. Three species of conservation significance were collected, namely Murray cod (listed as ‘vulnerable’ under the EPBC Act), freshwater catfish and silver perch (Wilson, Zampatti and Leigh 2014).
Condition monitoring of the fish assemblage in the Chowilla region from 2014 indicates that the objective of maintaining or increasing the diversity and extent of distribution of native fish species was met. Over the 10 year sampling period the diversity and distribution of native species has been maintained, and in years following flooding (2011 and 2012) the extent of distribution and diversity at the different habitats has increased (Wilson, Zampatti and Leigh 2014).
Page 57

The Living Murray icon sites 2013–14 Monitoring
The presence of native species such as Murray cod, golden perch, silver perch, Australian smelt and freshwater catfish and high species diversity characterised the fast-flowing habitats within the Chowilla Floodplain. In contrast the slow-flowing backwaters were characterised by the presence of non-native species and low species diversity. These results highlight the importance of fast-flowing habitats within Chowilla in maintaining the diversity and distribution of native fish populations (Wilson, Zampatti and Leigh 2014).
A total of 40 Murray cod were collected in 2014. Five were captured in March 2014 and the remaining 35 were captured during targeted sampling in May 2014 (Wilson, Zampatti and Leigh 2014).
Data from 2014 suggests that the objective of maintaining successful recruitment of small and large bodied native fish has been met for most species. Length-frequency distributions indicate that small–medium bodied native species unspecked hardyhead, Murray rainbowfish, Australian smelt and bony herring successfully recruited in 2014. Low-level recruitment was also detected for large-bodied species Murray cod and golden perch (Wilson, Zampatti and Leigh 2014). Freshwater catfish recruitment was not evident in 2014 (Wilson, Zampatti and Leigh 2014).
BushbirdsThe specific ecological objectives for bush birds are:
Maintain or improve the diversity and abundance of key bird speciesEach of the bush bird species known to historically utilise Chowilla will be recorded at ≥ 3 sites in any three year periodAbundance and distribution of threatened birds is maintained at or above levels recorded during 2004–2010
This survey has not yet been undertaken for 3 complete survey years (with 4 seasonal surveys each). The assessment is based on the two complete survey years and a single survey conducted in 2011. For the assessment purposes, an expected species list was used that comprises 170 bird species observed during the 2008 biological survey and the 2011–2014 bush bird surveys.
To meet the objective related to species historically utilising Chowilla each species on the expected species list must be observed at least once in a three year period at 3 or more black box sites and 2 or more river red gum woodland sites. Of the 170 species on the expected species list, 125 species were observed in the limited survey period. This comprised 82 species at black box sites and 87 species at river red gum (Kieskamp 2014). In this limited survey period this ecological objective wasn’t met.
However the objective of maintaining the abundance and distribution of threatened birds above levels recorded during 2004–2010, was met in 2013–14.Three of the four threatened or rare species on the expected list (regent parrot, freckled duck and white-bellied sea-eagle) were observed at similar or higher levels than in 2010. The bush stone-curlew was not observed during either the 2010 or the 2013–2014 survey. This is likely due to the cryptic and nocturnal nature of this species. However, in 2014 it was recorded in small numbers by a separate and specifically designed survey (using call playback), carried out at night by volunteers of the Friends of Riverland Park.
Page 58
The Living Murray icon sites 2013–14 Monitoring
WaterbirdsThe specific ecological objectives for waterbirds are:
Maintain or improve the diversity and abundance of key bird speciesCreate conditions conducive to successful breeding of colonial waterbirds in a minimum of three temporary wetland sites at a frequency of not less than one in three yearsEach of the bird species expected to utilise wetlands at Chowilla are recorded at ≥ 3 wetlands in a 3 year period.
Waterbird surveys are conducted using point counts at wetland complexes that are holding water. In the period 2008–13, the total number of species recorded at any wetland varied between 30 and 40. On average, only 36 of the 65 species expected to occur were recorded. In the period 2008–13, the total number of species recorded at ≥ 3 wetlands varied between 17 and 30. On average, only 24 of the 65 species expected were recorded at ≥ 3 wetlands, therefore the objective related to the waterbird species expected to utilise wetlands was not met. This outcome was as anticipated given only small wetland areas were inundated during 2013–14.
Two habitat targets are considered in assessing the objective related to conditions conducive to breeding of colonial nesting waterbirds:
A habitat mosaic comprising shallow water, open water, mud flat, and littoral zones is provided simultaneously at a minimum of three large wetlands at least once every three years by 2020 Minimum inundation periods required for successful breeding by a range of water bird species are provided during 80% of flood events
The habitat characteristic targets were achieved during the 2010–11 high flows. Subsequent flows and environmental watering have maintained the habitat mosaic target, however minimum inundation periods have not been achieved since 2010–11.
Overall status of the icon siteIn 2013–14, the condition of river red gum, black box, river cooba and lignum was predominantly poor or on a declining trajectory. In the absence of natural flooding or watering, understorey vegetation communities also showed decreases in the abundance of floodplain and amphibious species and a corresponding increase in the abundance of salt tolerant species, terrestrial species and bare soil.
In 2013–14 icon site ecological objectives for floodplain vegetation, lignum and tree condition were not met, indicating the importance of environmental water to improve or maintain the condition of trees and lignum, and to build resilience so that vegetation can withstand the next dry period.
Page 59
The Living Murray icon sites 2013–14 Monitoring
Tree population demographics indicate that there is likely to be insufficient saplings entering the population to sustain the existing populations of river red gum and black box. There are a substantial proportion of the standing trees across the floodplain that are dead. These results highlight the importance of creating conditions that trigger germination events and support ongoing survival of young trees.
Condition monitoring over 10 years indicate that the diversity and distribution native fish in Chowilla has been maintained and that in the years following natural flooding, the extent of distribution and diversity at different habitats appears to increase.
Intervention monitoring has further confirmed that maintenance of habitats and connectivity within Chowilla, and between Chowilla and the River Murray, is critical for the conservation of the regionally significant Murray cod population.
Both the river red gum and the black box woodlands have their own bird communities and both these habitats depend on periodic inundation for their survival. Of the 170 species on the expected bush bird species list, 82 species were seen at ≥ three out of five black box sites and 87 species were seen at ≥ two out of three river red gum sites in a three year period.
Of the four threatened or rare species on the expected list (regent parrot, bush stone-curlew, freckled duck and white-bellied sea-eagle), all 4 species were seen at similar or higher levels than in 2010.
Monitoring undertaken at sites receiving environmental water in 2013–14 indicated positive responses of birds and frogs. Five frog species were recorded including a significant breeding response by southern bell frog with over 1,000 tadpoles caught at one site in the Brandy Bottle waterhole. Significant responses by aquatic vegetation, lignum, river red gum, black box and river cooba were also recorded at the watered sites
Page 60
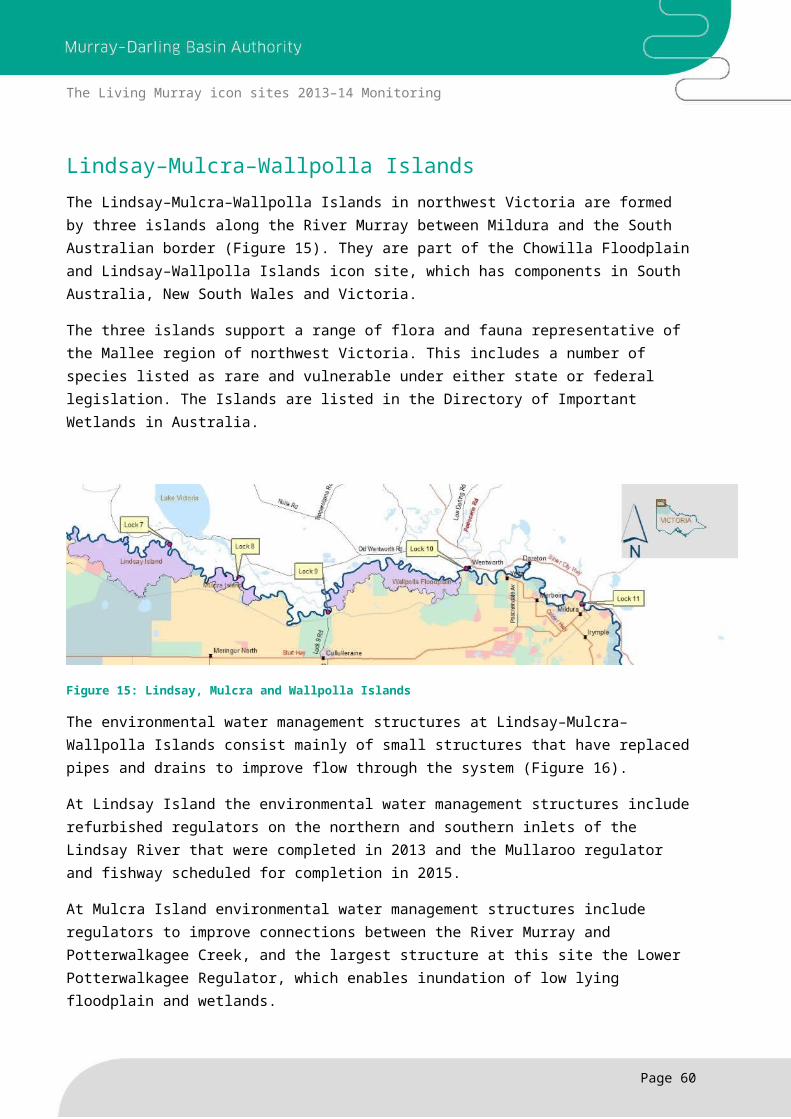
The Living Murray icon sites 2013–14 Monitoring
Lower Lakes, Coorong and Murray MouthLakes Alexandrina and Albert (the Lower Lakes), the Coorong and Murray Mouth (LLCMM) is an ecologically and culturally significant site. The LLCMM region (Figure 21) covers an area of approximately 140,000 hectares; it is a Ramsar-listed wetland of international importance, is also one of eighteen key indicator sites of the Murray–Darling Basin (MDB) and a Living Murray icon site.
The site has a unique mosaic of twenty three individual wetlands and provides habitat for nationally and internationally significant species. The icon site, which contains the Meeting of the Waters registered Ngarrindjeri heritage site, is central to the life and culture of the Ngarrindjeri people, who continue to live on their traditional country. The ecological health of the icon site has been severely degraded by river regulation, over-extraction, and to a lesser extent, a reduction in the diversion of drainage water from the South East of South Australia into the Coorong South Lagoon. These impacts have been exacerbated in recent times by a prolonged period of drought spanning nearly a decade (2000 to 2010).
Figure 21: Map of the Lower Lakes, Coorong and Murray Mouth icon site
Page 61
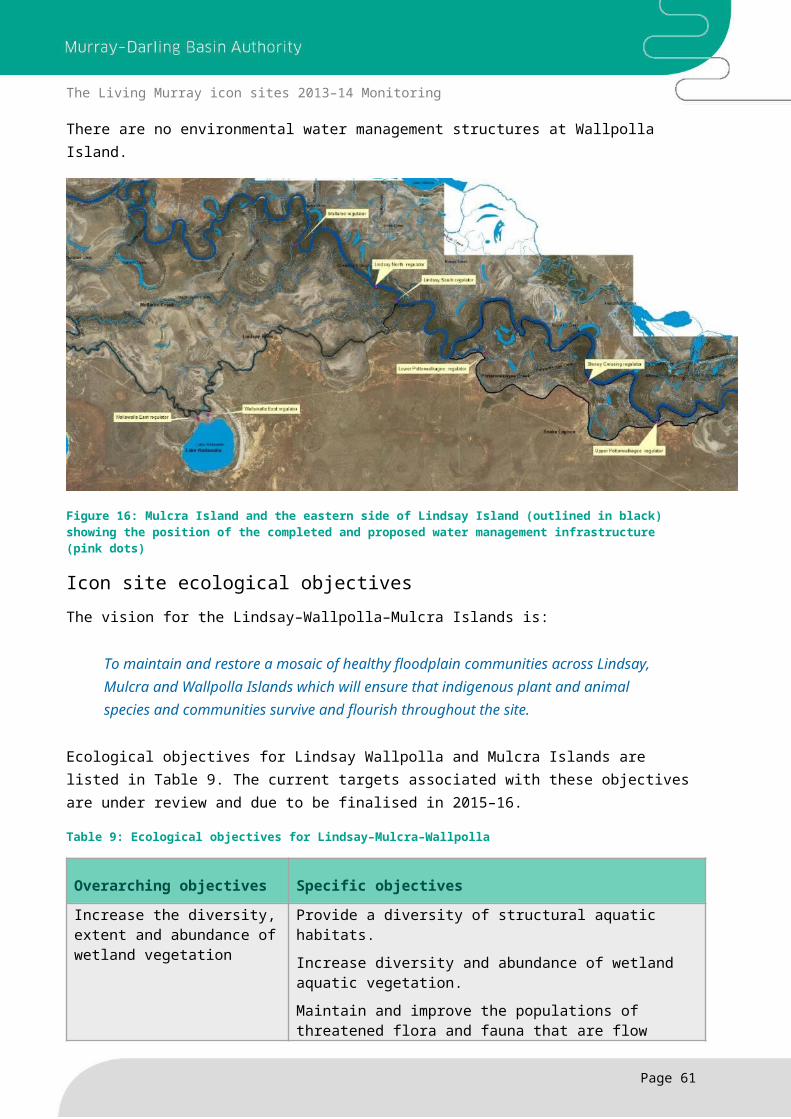
The Living Murray icon sites 2013–14 Monitoring
Icon site objectivesThe Lower Lakes, Coroong and Murray Mouth (LLCMM) icon site ecological objectives are:
• an open Murray Mouth• more frequent estuarine fish spawning and recruitment; and• enhanced migratory waterbird habitat in the Lower Lakes and Coorong.
These ecological objectives are supported by ecological targets (Table 13), with each target contributing to a least one objective. In line with the recommendations from a review of TLM condition monitoring (Robinson 2014) these targets are undergoing refinement in 2014–15.
Table 13: Summary of ecological targets and relationship to LLCMM Icon Site objectives
Target ID#
Ecological Target Icon Site Objective: Open Mouth
Icon Site Objective: Fish Recruitment
Icon Site Objective: Bird Habitat
B1 Maintain or improve bird populations in the Lower Lakes, Coorong and Murray Mouth
Yes No Yes
F1 Maintain or improve recruitment success of diadromous fish in the Lower Lakes and Coorong
Yes Yes No
F2 Maintain or improve recruitment success of endangered fish species in the Lower Lakes
No Yes No
F3 Provide optimum conditions to improve recruitment success of small-mouthed hardyhead (Atherinosoma microstoma) in the South Lagoon
No Yes No
F4 Maintain or improve populations of black bream (Acanthopagrus butcheri), greenback flounder (Rhombosolea tapirine) and mulloway (Argyrosomus japonicas) in the Coorong
Yes Yes No
I1 Maintain or improve invertebrate populations in mudflats (both exposed and submerged)
Yes Yes Yes
I2 Provide freshwater flows that provide food sources for Goolwa cockles (Plebidonax deltoids).
Yes No No
M1 Facilitate frequent changes in exposure and submergence of mudflats
Yes No Yes
M2 Maintain habitable sediment conditions in mudflats
No No Yes
V1 Maintain or improve Ruppia megacarpa colonisation and reproduction
No Yes Yes
V2 Maintain or improve Ruppia tuberosa No Yes Yes
Page 62
The Living Murray icon sites 2013–14 Monitoring
Target ID#
Ecological Target Icon Site Objective: Open Mouth
Icon Site Objective: Fish Recruitment
Icon Site Objective: Bird Habitat
colonisation and reproductionV3 Maintain or improve aquatic and
littoral vegetation in the Lower LakesNo Yes Yes
W1 Establish and maintain variable salinity regime with >30% of area below sea water salinity concentrations in estuary and North Lagoon
No Yes Yes
W2 Maintain a permanent Murray Mouth opening through freshwater outflows with adequate tidal variations to improve water quality and maximise connectivity
Yes Yes Yes
W3 Maximise fish passage connectivity between the Lower Lakes and Coorong
No Yes No
W4 Maximise fish passage connectivity between the Coorong and the sea
Yes Yes No
Flow and climatic conditionsDuring 2013–14 rainfall at Hindmarsh Island (within the LLCMM icon site) was 326.2 mm (long term average 389.2 mm) (Figure 22).
Figure 22: Monthly rainfall and mean maximum temperature (long-term average and 2013–14) for Hindmarsh Island (Lower Lakes, Coorong, Murray Mouth icon site) (Source: BoM 2015)
Page 63
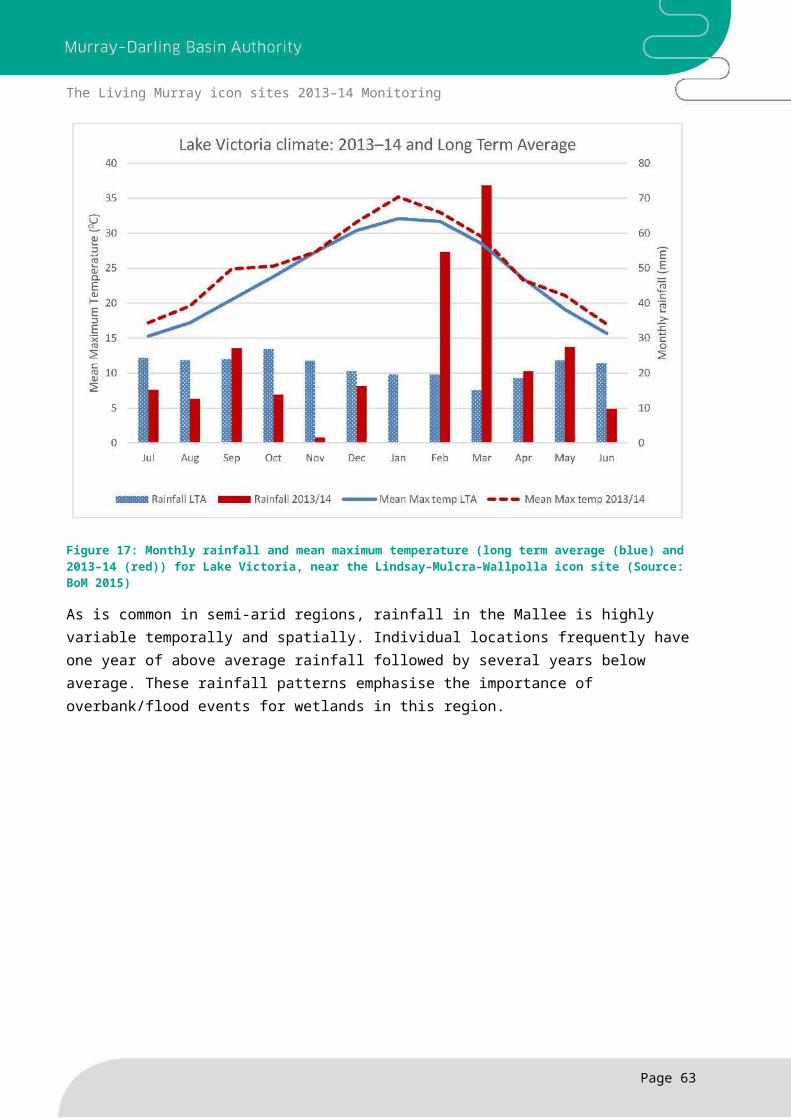
The Living Murray icon sites 2013–14 Monitoring
Large natural flows from July to mid October 2013 were followed by the delivery of 746.4 GL of environmental water to the LLCMM icon site from late October to the end of June 2013.
Barrage releases (Figure 22) were maintained throughout the year with the maximum outflow delivered during late winter and spring. Releases were greater than 2 GL/day for 171 days (47% of the year) (DEWNR 2014a) with a peak discharge during the month of October at approximately 396 GL (Figures 21). The total barrage discharge for the year was approximately 1,300 GL which is above the minimum annual flow (730 to 1,090 GL) required to keep the Murray Mouth open while also maintaining the salinity threshold in Lake Alexandrina below 1000 EC (electrical conductivity in microSiemens/centimetre) 95% of the time (2000 GL/yr three year rolling average) (MDBA, 2014a). However barrage releases fell slightly short of the minimum target to prevent the Coorong remaining in a degraded ecosystem state (DEWNR 2014a). The minimum target for this is 2,500 GL over a two year period, and the combined flows throughout 2012–13 to 2013–14 were 2,337 GL.
Figure 23: Flows at South Australian border and Barrage releases in 2013–14
The Murray Mouth remained open throughout the year without the need to dredge and fishways also remained in operation for the entire year. This was achieved through large natural flows at the start of the 2013–14 followed by environmental water.
From July to September 2013 water levels in Lake Alexandrina fluctuated between 0.6 and 0.82 m AHD (Australian Height Datum) due to variable tide and flow conditions. From September to mid November 2013, water levels were raised gradually from around 0.62 m AHD to a maximum of 0.8 m AHD. Water levels were then dropped from mid-November 2013 over several weeks, in order to push more water out of the barrages to assist Ruppia tuberosa recruitment in the Coorong. From early December 2013 to January 2014, lake levels were raised to 0.8 m AHD in
Page 64
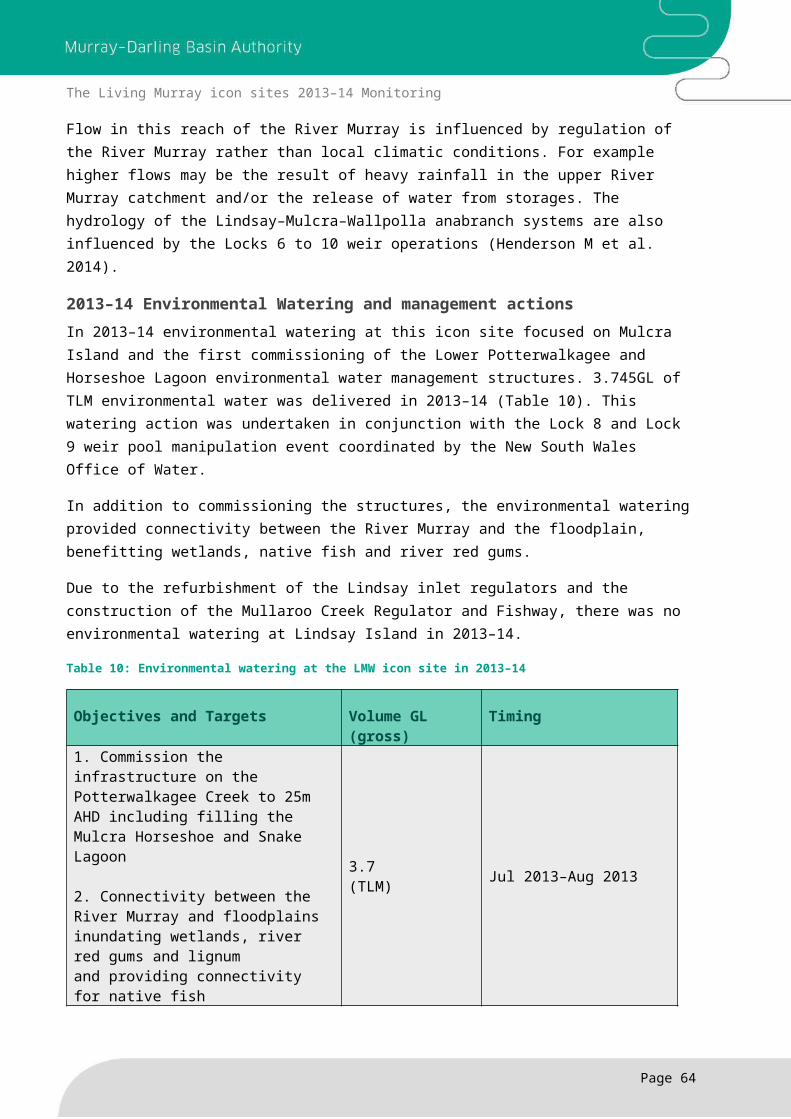
The Living Murray icon sites 2013–14 Monitoring
preparation for a period of reduced flow as a result of the Lake Victoria regulator upgrade. From this period, lake levels were then gradually reduced from mid-January to March 2014 in order to maintain minimum barrage outflow during this dry period.
During 2013–14 average salinity in Lake Alexandrina varied between 400 and 800 EC units with the exception of short increases due to reverse head conditions that occurred in the Goolwa Channel from July to September 2013. The ecological target of maintaining average salinity below 1,000 EC was therefore maintained for the majority of the year. Average salinity in Lake Albert in July 2013 was around 3,000 EC and continued to decline by the end of the year to around 2,200 EC. Salinity levels in Lake Albert were not as low as those recorded before the drought which averaged 1,500 EC.
Salinity in the Coorong South Lagoon in July 2013 averaged 80 parts per thousand (ppt) and by mid-March 2014 had peaked at 95 ppt. However, from this point onwards to the end of the year salinity levels decreased to around 60 ppt in June 2014, allowing the threshold target of <100 ppt to also be met for 2013–14.
Page 65
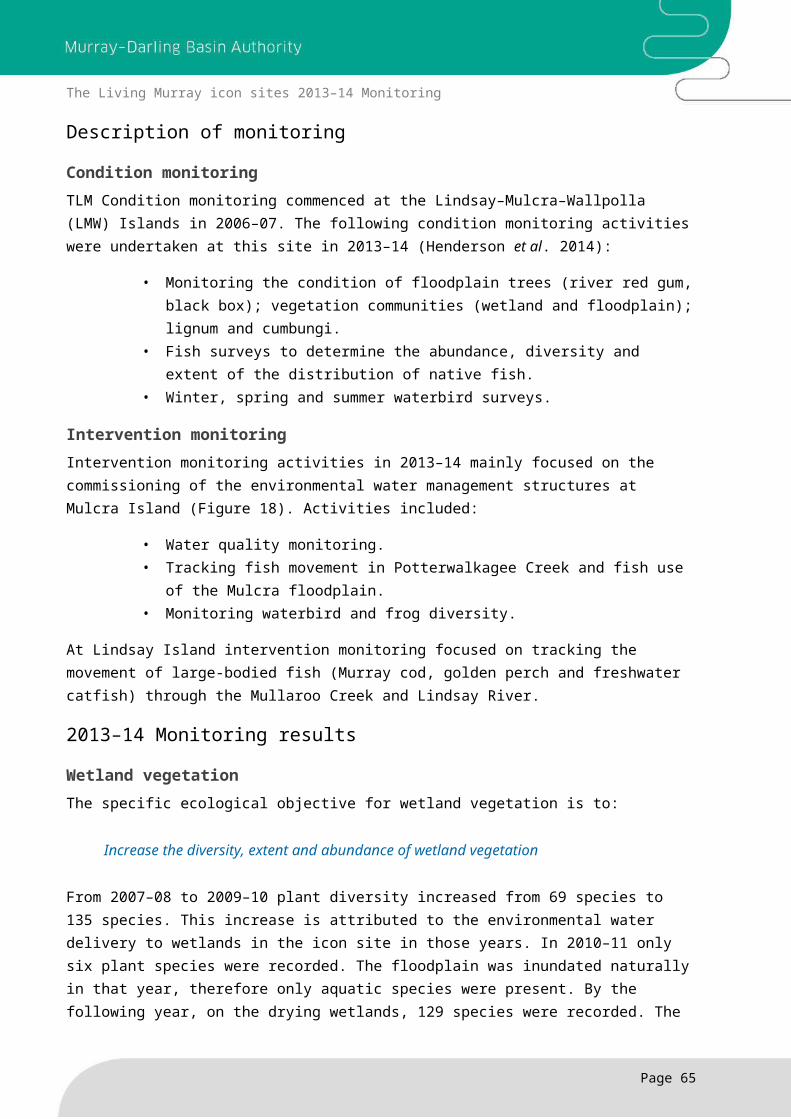
The Living Murray icon sites 2013–14 Monitoring
2013–14 Environmental watering and management actions The Environmental Watering and management actions undertaken at the Icon site for 2013–14 are in Table 14. Approximately 746.4 GL of environmental water was delivered, 155 GL of TLM water (MDBA, 2014b) and 579 GL from the Commonwealth Environmental Water Holder (CEWH) with the balance shared between SA environmental water licenses, the Nature Foundation and private donations (DEWNR, 2014b).
Table 15: LLCMM Environmental Watering 2013–14
Actions Targeted Objectives Planned Volume GL
(gross)
Timing Actual Delivery GL
A) Maintain lake levels in the range of 0.4–0.8 m AHD
Inundate fringing lower lakes wetlands during spring/summer
Provide a drying cycle in autumn to promote vegetation establishment & reduce lakeshore erosion
Trigger breeding events for threatened fish, frogs, plants and invertebrates
Balance lake levels for prioritising barrages releases during mid-late spring & summer
N/A Jul 2013–Jun 2014(12 months)
0.6–0.8m AHD
B1) Spring/summer (October–February) barrage water delivery (pulse)
Maintain fishway operations between October & February
Provide connectivity between Lake Alexandrina & the Coorong Estuary during peak diadromous fish migration (congolli & common galaxias)
Provide water to the Coorong during late spring & summer to promote Ruppia tuberosa germination & reproduction
Maintain salinity thresholds at <100ppt during summer
Provide suitable water levels to provide accessible feeding grounds for water birds (waders)
540 Oct 2013–Feb 2014 (5 months)
438.8 GL
Page 66
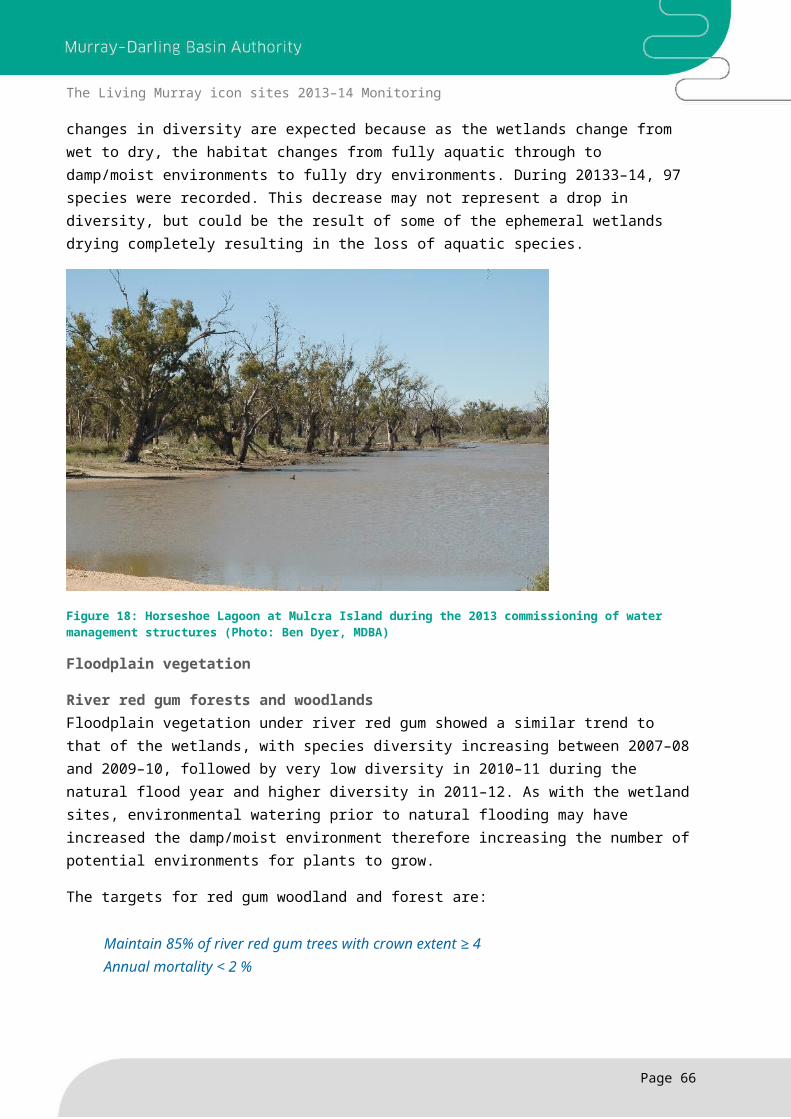
The Living Murray icon sites 2013–14 Monitoring
Actions Targeted Objectives Planned Volume GL
(gross)
Timing Actual Delivery GL
B2) Provide continuous barrage releases for remainder of year (July–September and March–June)
Provide winter flows for lamprey migration in July 2013 9 July 2013 3.4 GL
B2) (part 2) Provide continuous barrage releases for remainder of year (July–September and March–June)
Ensure fishways are in operation in addition to the period for Action B1
Provide connectivity between Lake Alexandrina and the Coorong Estuary for migration of diadromous fish
Provide year-round estuarine conditions in the North Lagoon downstream of the barrages
Maintain South Lagoon salinity thresholds at <100ppt during summer
64 Aug – Sept and Mar–Jun
304.2 GL
C) Provide a re-fill volume in the Lower Lakes to allow for a lake level cycle in autumn 2014
Provide for a lake level cycle to be implemented in autumn 2014 (0.75 to 0.5 to 0.75 m AHD)
Promote flushing of salt in lake Albert
Increase aquatic plant diversity and establish fish communities in fringing wetlands of Lake Albert
Promote the growth and re-establishment of lakeshore vegetation plantings for erosion control
200 Mid-late March 2014(3 weeks)
No specific delivery volume for a lake level cycle
Page 67
The Living Murray icon sites 2013–14 Monitoring
Description of monitoringThe TLM condition and intervention monitoring projects undertaken in 2013–14 are summarised below. Information from the Coorong Lower Lakes Murray Mouth (CLMM) Murray Futures monitoring program, and other monitoring and research programs in the region, is also used to report on icon site ecological objectives and targets.
Condition monitoringIn 2013–14 the following condition monitoring projects were undertaken:
• Summer survey of waterbirds around the shorelines of the Coorong and Lower Lakes.
• Monthly waterbird surveys in the Lower Lakes.• Monitoring of small-bodied threatened fish in the Lower Lakes (Murray hardyhead
(Craterocephalus fluviatilis), Yarra pygmy perch (Nannoperca obscura) and southern pygmy perch).
• Monitoring of estuarine fish in the Coorong (small-mouthed hardyhead, black bream, and greenback flounder).
• Surveys of Lower Lakes aquatic vegetation in wetlands and lakeshore sites across three locations — Lake Alexandrina, Lake Albert and the Goolwa Channel — during spring and autumn
• Summer monitoring of benthic macroinvertebrates in the Murray Mouth Coorong and the Lower Lakes.
Intervention monitoring In 2013–14 the following Intervention monitoring projects were undertaken:
• Monitoring of Ruppia tuberosa in the Coorong South Lagoon.• Monitoring at Murray Barrage fishways between October 2013 and February
2014.
2013–14 Monitoring Results
WaterbirdsThe target: “To maintain or improve bird populations in the Lower Lakes, Coorong and Murray Mouth” (B1) is assessed using the results of the annual census of waterbird populations in both the Coorong (January 2014) and Lower Lakes (January–February 2014).
The results of the 2013–14 census of waterbirds using the Coorong shows an increase in waterbird numbers compared to the previous year. In contrast, the number of waterbirds using the Lower Lakes decreased between the 2013 and 2014 assessments. This decrease in numbers may be due to relatively high stable water levels in the Lower Lakes reducing foraging opportunities for shorebirds (Paton and Bailey 2014b).
Three species significantly contributed to the increase in numbers in the Coorong in 2014; grey teal, red-necked stint (Calidris ruficollis), and sharp-tailed sandpiper (Calidris acuminata) (Paton and Bailey 2014b). The curlew sandpiper (Calidris ferruginea) and red-capped plover (Charadrius ruficapillus) were also notably more abundant compared to the previous year. However, great
Page 68
The Living Murray icon sites 2013–14 Monitoring
cormorants and Eurasian coots declined in 2014 despite increasing numbers in the previous years, and banded stilt (Cladorhynchus leucocephalus) and silver gull (Chroicocephalus novaehollandiae) numbers continued to steadily decline (Paton and Bailey 2014b).
Both the Coorong and Lower Lakes continue to provide complementary resources that support different waterbird communities; and the Coorong remains unique as it supports migratory and resident shorebirds. However the patterns in distribution may suggest that suitable habitat and resources for waterbirds in the Coorong is recovering while habitat and resources in the Lower Lakes may be slowly deteriorating (Paton and Bailey 2014b).
Overall, the abundances of waterbirds using the Coorong and Lower Lakes have increased in 2013–14. Therefore the target B-1— To Maintain or improve bird populations in the Lower Lakes, Coorong and Murray Mouth 'has been met, and the objective of ‘enhanced migratory waterbird habitat in the Lower Lakes and Coorong’ has been met.
Fish
Threatened Fish in the Lower LakesSurveys targeting the three threatened fish species (Murray hardyhead, southern pygmy perch and Yarra pygmy perch) captured all three species in the Lower Lakes in 2013–14.
Murray hardyhead showed substantial levels of recruitment with signs of recolonisation at two areas of the Lower Lakes (Goolwa Channel and Dog Lake). In contrast, the only Yarra pygmy perch and southern pygmy perch recorded were reintroduced fish, released as part of the Critical Fish Habitat project.
There was some evidence of southern pygmy perch recruitment, however the sample catch was too small to suggest that the population is successfully recruiting. Yarra pygmy perch showed no sign of recruitment, suggesting a failed population recovery.
The target F-2 — Maintain or improve recruitment success of endangered fish species in the Lower Lakes has been partially met for 2013–14 with the return of a self-sustaining population of Murray hardyheads (Wedderburn and Barnes 2014).
Page 69
The Living Murray icon sites 2013–14 Monitoring
Figure 24: Release of water from the Lower Lakes via the Goolwa barrage and fishway during 2013–14 (Photo: Kirsty Wedge)
Fish in the CoorongBlack bream and greenback flounder from commercial catches in the Murray Estuary and North Lagoon of the Coorong were sampled to determine the age/size structures of the population. In order to establish annual recruitment indices the abundance of juvenile young-of-year black bream and greenback flounder was also monitored.
The monitoring of black bream in 2013–14 shows that population abundance continues to be low with little recruitment success and a population structure heavily biased towards adult fish. However black bream have increased their distribution to the southern parts of the Coorong including the South Lagoon, following higher flows through the barrages between 2010–11 and 2013–14. This increase in distribution is likely the result of more favourable salinities and associated environmental conditions, driven by frequent small-scale freshwater inflow (Ye, Bucater and Short 2014).
Abundance and distribution of juvenile greenback flounder was maintained in 2013–14. Juvenile fish in the Estuary were less abundant than during the drought (2008–09) but in comparison, abundance in the North Lagoon was higher than the drought years of 2008–09 and 2009–10. The distribution of young-of-year greenback flounder has been steadily increasing throughout the North Lagoon since the return of flows in 2010–11. Recruitment success has also increased slightly (similar to black bream results) with the reduction in salinities post 2010 (Ye, Bucater and Short in press).
Despite the increasing distribution of black bream and juvenile greenback flounder, the absence of significant recruitment of these species means that target F-4 Maintain or improve populations
Page 70
The Living Murray icon sites 2013–14 Monitoring
of black bream, greenback flounder and mulloway in the Coorong was only partially been met in 2013–14.
Sampling of small-mouthed hardyhead occurs in the North and South Lagoons of the Coorong targeting the main spawning and recruitment season (spring/summer) and new recruits in February. In 2013–14 there was a small decline in adult populations in the South Lagoon, but a higher abundance of new recruits in the North Lagoon compared to 2012–13 monitoring (Ye, Bucater and Short 2014).
Since the return of flows in spring 2010, the population of small-mouthed hardyhead has increased in abundance, distribution and recruitment, particularly in the southern parts of the Coorong (Ye, Bucater and Short 2014). This result indicates that target F-3 — Provide optimum conditions to improve recruitment success of small-mouthed hardyhead in the South Lagoon has been met.
The success of small-mouthed hardyhead can be attributed to broadly decreased salinities (<100 ppt), the result of barrage releases and other freshwater induced environmental changes such as freshwater releases into the South Lagoon from Salt Creek.
Diadromous FishThe migrating fish community was sampled monthly at all fishways on the Murray Barrages between October 2013 and February 2014. Individuals from either of two species — congolli and common galaxias — were selected at random and measured to represent the size structure of the population of these key species.
In 2013–14, the fish community was similar to 2011–12, however the overall abundance was lower, primarily due to the decreased abundance of sandy sprat which favours marine over freshwater influenced environments. A total of 30 fish species were caught across the six sites along the Murray Barrages with the community consisting of freshwater, diadromous, estuarine and marine species. Variable salinities similar to those present in 2006–07, 2011–12 and 2013–14 would have contributed to the high species diversity. This contrasts to the communities recorded during the drought (2007 to 2010) when marine and some estuarine species were dominant and diadromous and freshwater species were either absent or present in low numbers.
The number of congolli and common galaxias, species that migrate between the river and the sea to spawn, were high in 2013–14. This is a marked improvement from the declines in recruitment and abundance observed during the drought years. The maintenance of freshwater inflows since 2010 can be attributed to the increase in both of these species. The target F-1 Maintain or improve recruitment success of diadromous fish in the Lower Lakes and Coorong has been achieved.
MacroinvertebratesMacroinvertebrate population and habitat sampling was undertaken across the icon site from November 2013 to February 2014. The results of the population sampling showed that there was an improvement in invertebrate populations in mudflats in the Murray Mouth and North Lagoon. In contrast, other areas including the South Lagoon and Lower Lakes had low species diversity and abundance, and had not increased from previous years (Dittmann et al. 2014). The areas showing no improvement contained predominantly young larvae in very low numbers.
Page 71
The Living Murray icon sites 2013–14 Monitoring
Macroinvertebrate habitat in both the Coorong and Lower Lakes is influenced by a variety of environmental conditions including water levels, submersion times, sediment grain size and organic matter. Sediment organic matter and grain size range were similar to previous years, however sediments in the Lower Lakes were permanently submerged above 0.5m AHD (Dittmann et al. 2014) and therefore not subjected to a suitable exposure/submergence regime.
The target M-1 — 'Facilitate frequent changes in exposure and submergence of mudflats', was not met in the Lower Lakes (Dittmann et al. 2014) and the target I-1 — 'Maintain or improve invertebrate populations in mudflats' was only met in the Murray Mouth and North Lagoon regions. The targets M-2 — 'Maintain sediment size range in mudflats' and M-3 — 'Maintain organic content for mudflats' were both met, as the results were the same as previous monitoring years (Dittmann et al. 2014).
Vegetation
Lower Lakes VegetationVegetation surveys were undertaken at 11 wetland and 25 lakeshore sites across three locations — Lake Alexandrina, Lake Albert and the Goolwa Channel. The sites were monitored during spring (October 2013) and autumn (March 2014) and the cover and abundance of each species was recorded.
There has been an increase in the cover and species diversity of submergent, floating, amphibious and emergent plants since the return of higher water levels since 2010. This is in contrast to results from the drought period (2007 to 2010) which showed that sites were dominated by terrestrial and floodplain plant species (Frahn et al. 2014). A notable increase in some key species were recorded around the shoreline of Lake Alexandrina between spring 2013 and autumn 2014. The shorelines of Lake Albert were dominated by Typha and Pharagmites species.
However, whilst there has been an increase in plant communities, not all sites have re-established with submergent, amphibious, floating and emergent species. The vegetation community has not returned to levels observed prior to the onset of drought conditions, therefore the target V-3 — Maintain or improve aquatic and littoral vegetation in the Lower Lakes has not been met in 2013–14 (Frahn et al. 2014).
Stands of Melaleuca halmaturorum were assessed for age class structure and recruitment with 2013–14 results showing that recruitment occurred at two of the four sampled sites (Frahn et al. 2014). Seedlings observed at one site in 2008 were inundated by the return of water levels and do not appear to have survived.
Coorong — RuppiaRuppia tuberosa monitoring was undertaken during January 2014, at 19 sites in the South Lagoon and 4 sites in the southern end of the North Lagoon. At each site the presence of Ruppia shoots, seeds and turions are counted.
The distribution and abundance of Ruppia shoots in 2014 has increased in the southern Coorong compared to the previous year. Seeds detected were more intact, suggesting greater viability, however the number of seeds and turions detected in the sediment showed very little change relative to 2012–13 (Paton and Bailey 2014a).
Page 72
The Living Murray icon sites 2013–14 Monitoring
The decline in Coorong water levels by November 2013 left many Ruppia plants exposed before they had completed flowering, and therefore their ability to successfully reproduce and set seed was compromised. Other environmental factors have also influenced flowering including the impact of filamentous green algae, strong winds and grazing by waterfowl (Paton and Bailey 2014a).
Overall the ecological condition of Ruppia slightly improved in 2013–14 compared to the previous two years due to wider distribution and because water levels in the Coorong were maintained at higher levels for longer during spring allowing plants to successfully flower. However, despite this small improvement, the overall recovery of the species still falls short of meeting the target V2 Maintain or improve Ruppia tuberosa colonisation and reproduction.
Murray Mouth and estuarine conditionsIn 2013–14, the Murray Mouth remained open for 365 days without the need for dredging. Barrage flows were maintained for the entire period, helping to minimise the incursion of sand into the Murray Mouth region. The icon site objective of ‘an open Murray Mouth’ has been met.
With regard to the target W-1 – Assessment of estuarine conditions between Goolwa Barrage and Pelican Point, monitoring showed that salinities continued to be low in the Murray Mouth and a section of the North Lagoon, similar to previous monitoring since 2010. Water quality also showed some improvement with higher dissolved oxygen (DO) concentrations. The Lower Lakes remained fresh with sediments submerged and Dissolved Oxygen levels within a normal range compared to previous years (Dittmann et al. 2014).
Overall status of icon siteThe delivery of environmental water during 2013–14 had an overall positive effect on the ecology of the LLCMM icon site. Although some effects were only small in scale, there is still a positive trend in the responses observed. For some species there still remains little evidence of recruitment which may be attributed in part to localised environmental factors including salinity, water level and availability of food resources, particularly in the Coorong.
The icon site objectives of keeping the Murray Mouth open, providing for more frequent estuarine fish spawning and recruitment and enhanced migratory waterbird habitat in the Lower Lakes and Coorong continued to be achieved for 2013–14. As with the years following the end of the drought in 2010, there remains a positive trajectory in continuing to meet these objectives.
In comparison to 2012–13, the recruitment success of diadromous fish particularly congolli and common galaxias increased. There was also slight improvement in the distribution of Ruppia, although recruitment was minimal. The only negative change in 2013–14 compared to the previous year, is that the mudflats of the Lower Lakes were not exposed in mid-late summer and instead remained submerged. The elevated water level prevented shorebirds from accessing macroinvertebrates within the sediments.
In 2013–14 lake levels were managed within the desired operating range albeit without levels dropping sufficiently to expose mudflats. Murray hardyhead showed evidence of breeding with substantial new recruits although for the other two threatened species (Yarra pygmy perch and southern pygmy perch) no recruits were detected (Wedderburn and Barnes 2014). Frogs were recorded as part of other monitoring, however southern bell frog was not recorded (Mason, 2014). Invertebrate populations in the Lower Lakes recorded low species diversity and no
Page 73
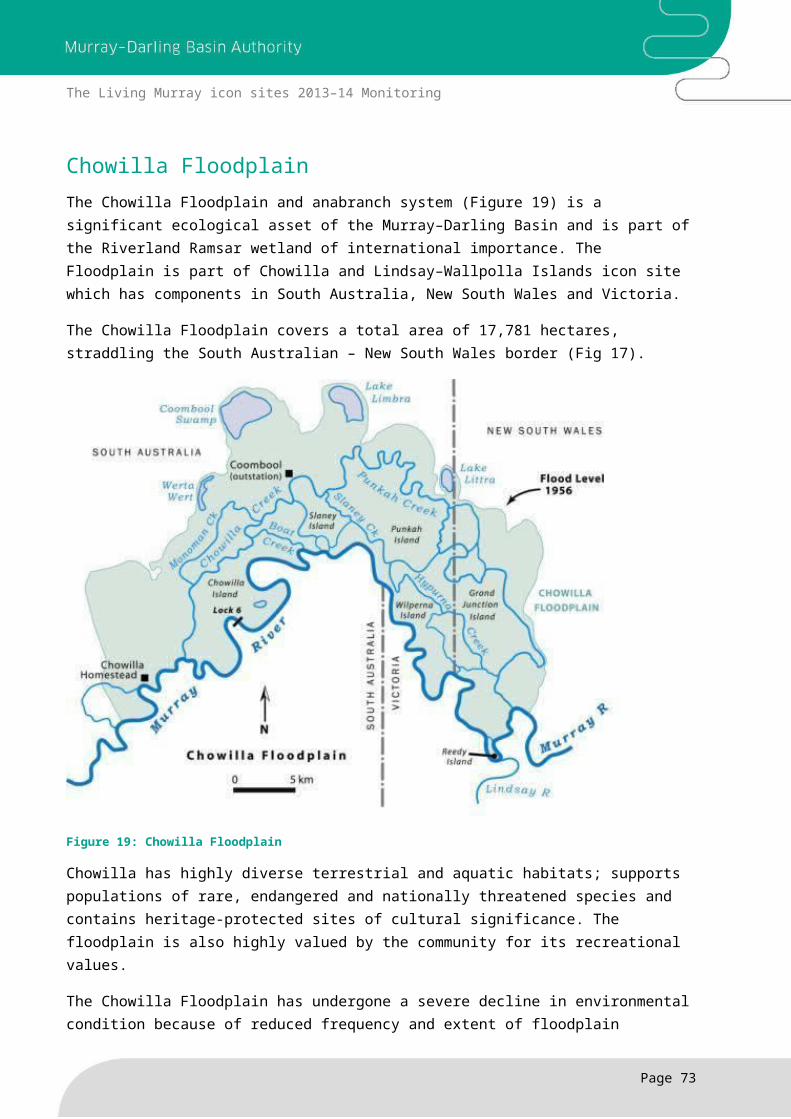
The Living Murray icon sites 2013–14 Monitoring
increase in abundance. High and moderate salinity tolerant zooplankton were present in the highest densities in Lake Albert (Oliver et al. 2014).
Barrage releases were maintained throughout the 2013–14 year due to natural flows followed by delivery of environmental water during October 2013–June 2014. The majority of releases through the barrages occurred during late winter and spring, with the highest volumes delivered in October 2013. Environmental water was delivered to the LLCMM icon site on the back of the natural flows. This flow continued to taper off throughout the summer months and then began to increase in late March 2014.
The targeted objective for environmental water delivery was a spring/summer delivery, aiming to achieve Ruppia germination and recruitment. Despite a decline in Coorong water levels by November 2013, there was a slight increase in the distribution and cover of Ruppia in the Coorong South Lagoon. Flowering was recorded in November and early December 2013, along with a slight increase in the net seedbank recorded in January 2014 (Paton and Bailey 2014a).
Salinity levels in the Coorong South Lagoon were maintained below the target threshold of 100 ppt. The success of small-mouthed hardyhead can be attributed to decreased salinities and the maintenance of freshwater inflows can be attributed to the increase in congolli and common galaxias. More favourable salinities and flows also contributed to the high diversity of fish species observed moving through the barrage fishways, and the increasing distribution and modest increases in recruitment success of black bream and young-of-year greenback flounder.
Page 74
The Living Murray icon sites 2013–14 Monitoring
River Murray Channel
Overview of Icon SiteThe River Murray Channel Icon Site includes the river channel from Hume Dam near Albury to Wellington in South Australia. It includes the beds, banks, in-stream habitat and the riparian zone (MDBC 2006).
Icon site objectivesThe Murray–Darling Basin Ministerial Council agreed to the following ecological objectives for this site (MDBC 2006):
i. Increasing the frequency of higher flows in spring that are ecologically significantii. Overcoming barriers to fish migration of native fish between the sea and Hume Damiii. Maintaining current levels of channel stability
In June 2011, The Living Murray Committee (TLMC) agreed that the ecological objectives for the site should be revised to focus on the use of environmental water and move away from non-environmental objectives. In July 2014, TLMC agreed for TLM watering planning purposes to the following interim objectives for the River Murray Channel icon site:
Objective 1: Contribute to the protection and restoration of biodiversity within the River Murray Channel Icon Site
• Sub-objective 1.1: Contribute to the protection and restoration of healthy, resilient populations of native fish.
• Sub-objective 1.2: Contribute to the protection and restoration of healthy, resilient riparian habitat.
• Sub-objective 1.3: Contribute to the protection and restoration of healthy, resilient wetland habitat.
Objective 2: Contribute to the protection and restoration of ecosystem functions including connectivity, carbon/nutrient exchange, wetting and drying cycles.
• Sub-objective 2.1: Contribute to the protection and restoration of lateral and longitudinal River Murray Channel connectivity.
• Sub-objective 2.2: Contribute to the protection and restoration of carbon and nutrient cycling in the River Murray Channel Icon Site.
• Sub-objective 2.3: Contribute to the protection and restoration of wetting & drying cycles within the River Murray Channel Icon site.
Flow and climatic conditionsThe 2013–14 flow and climatic conditions for the River Murray are described in the introductory section of this report.
Page 75
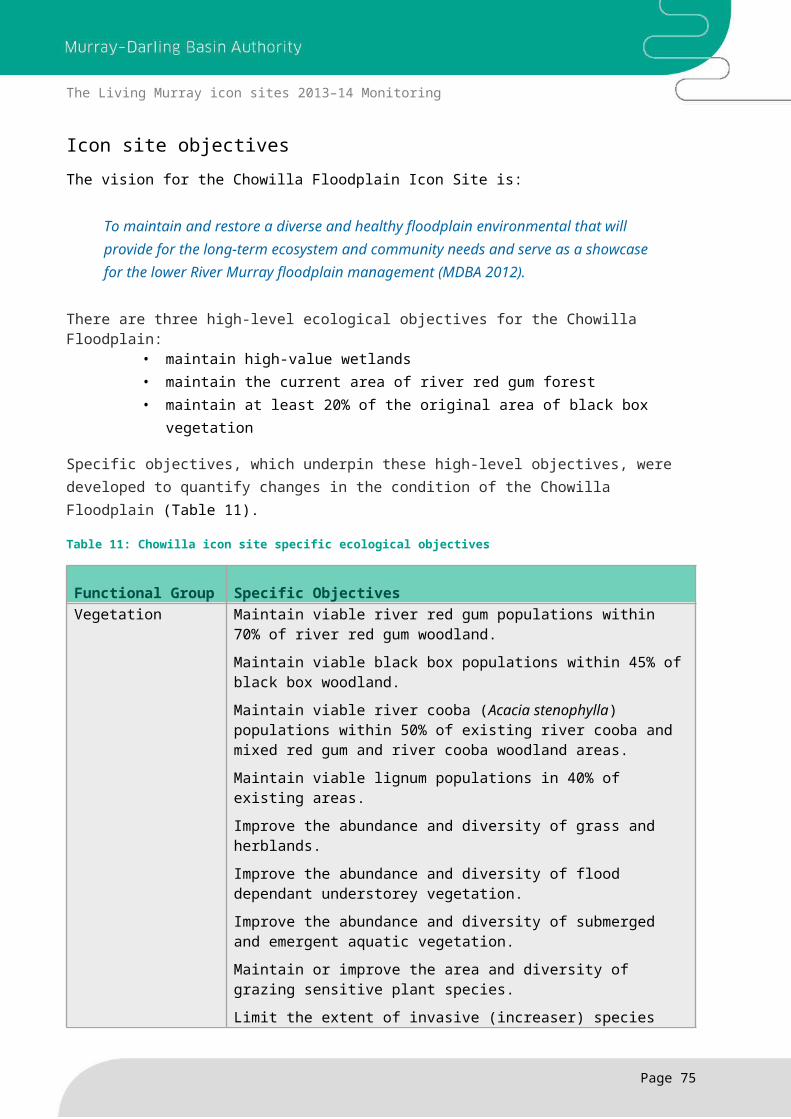
The Living Murray icon sites 2013–14 Monitoring
Environmental Watering and management actionsWhile there were no specific TLM watering actions in 2013–14 in the River Murray Channel above the South Australian border, delivery of environmental water to other icon sites provided benefits to this site, including providing flows to stimulate the breeding of Murray cod and golden perch. Water returning from the Barmah–Millewa Forest and Hattah Lakes also transported carbon and other nutrients to the River Murray Channel (MDBA 2014).
In the Lower River Murray Channel (below Lock 6/South Australian border) TLM environmental water delivered with other environmental water, provided flows to cue spawning of golden perch and silver perch.
2013–14 Monitoring resultsDue to the spatial scale of the River Murray Channel icon site, the suite of monitoring activities undertaken differs from other icon sites. TLM monitoring at this site in 2013–14 includes system scale stand condition assessment; monitoring fish movement as part of the Sea to Hume fishways program and other icon site fish surveys that include sampling in the River Murray.
Stand condition AssessmentThe condition of stands of river red gum and black box forests and woodlands at icon sites is assessed using a combination of ground surveys and satellite imagery. There are approximately 98,500 ha of river red gum and black box stands within the River Murray channel icon site. Stand condition is classified as being in one of five conditions: Good, Moderate, Poor, Degraded or Severely Degraded.
Between 2010–11 and 2011–12 all forest types showed an increase in the area in Good condition, in response to flooding throughout the River Murray system (Cunningham et al. 2013). Between 2011–12 and 2012–13 there was a decline in the area in Good condition and in the area in Poor, Degraded and Severely Degraded condition, with a consequent increase in the area in Moderate condition. This trend continued in 2013–14 (Table 15). This shift from Good to Moderate is thought to result from drier conditions, with few overbank flows since the floods of 2010–11.
Table 16: Condition of River Murray Channel river red gum and black box stands from 2011–12 to 2013–14
Year Percentage in Good condition
Percentage in Moderate condition
Percentage in Poor, Degraded and Severely Degraded condition
2011–12 31 27 42
2012–13 23 43 34
2013–14 20 53 27
Page 76
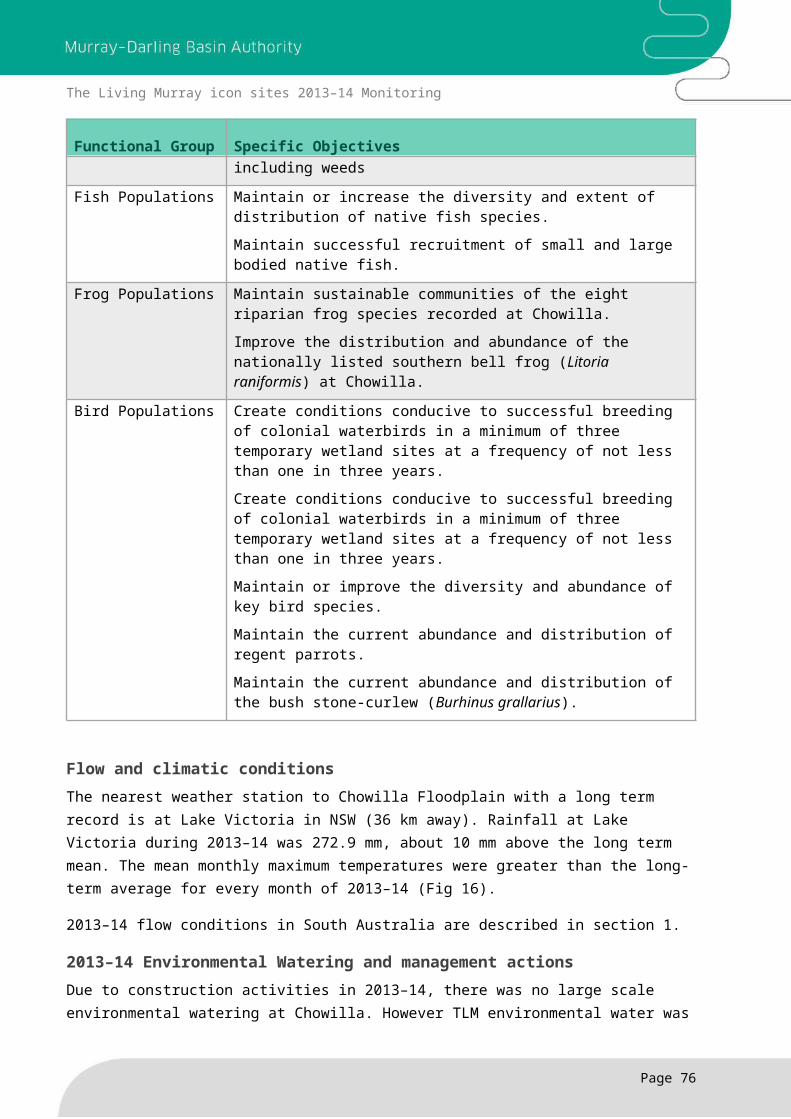
The Living Murray icon sites 2013–14 Monitoring
The condition of vegetation varies with the community type and this is correlated with elevation above river and hence probability of inundation (Figure 25). For example, the proportion of vegetation in Good condition is highest in river red gum forest, second highest in river red gum woodland, third highest in mixed river red gum–black box woodland, and lowest in black box woodland. The inverse relationship occurs with communities in Poor, Degraded and Severely degraded condition; the highest percentage is for black box woodland, the lowest for river red gum forest.
Figure 25: Relative condition of vegetation by community type
The trajectory of condition of vegetation community types is also associated with elevation above the river. Following the 2010–11 floods, the condition of all community types improved, however each community type has changed differently over time. After the floods, all community types recorded a 2% (approximate) reduction in stressed classes (Poor/Degraded/Severely Degraded). All community types recorded an increase in the Good class, but the increase was greatest in community types closest to the river and lowest in those furthest from the river. In the years since the flood, the proportion in stressed classes has been largely unchanged, and change has been characterised by declines in the Good class and increases in the Moderate class.
Fish
Sea to Hume Fishway Monitoring The Sea-to-Hume fishway program was established to overcome the barriers to fish migration and dispersal, directly addressing objective (ii) of the original MDBC ecological objectives for the River Murray Channel icon site. The program involved the construction of fishways on the barrages and weirs on the River Murray channel from the Murray Mouth to Hume Dam. The construction program was completed in 2014 and fishways now provide passage over 2,200 kilometres of the River Murray.
Page 77
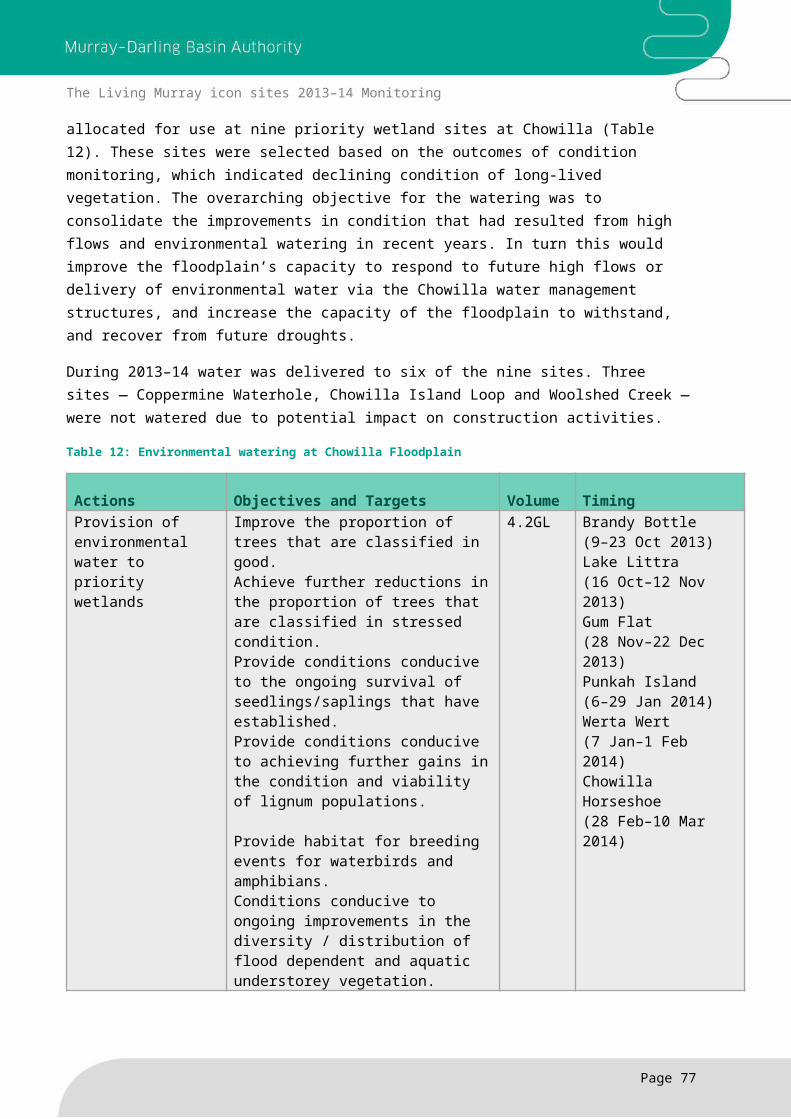
The Living Murray icon sites 2013–14 Monitoring
Between 2002 and 2013 over 24,000 fish were implanted with Passive Integrated Transponder (PIT) tags to help track their movement along the channel. These tags are recognised by PIT tag readers installed at the fishways that record fish as they pass through the fishways.
Results of fishway monitoring between 2003 and 2013 at Locks 1, 5 and 6 have identified 14 species of fish using the fishways with the most common species being common carp, Australian smelt and golden perch (Baumgartner, Zampatti and Jones 2014). It has also recorded fish of a wide range of sizes – from 20 mm to 1 m – as successfully negotiating the fishways (Baumgartner, Zampatti and Jones 2014). The range of species and sizes passing through the fishways are a positive indicator of the success of the program in restoring connectivity in the River Murray.
Hume to Yarrawonga Re-snaggingIn the River Murray snags (trees, branches and roots) provide important habitat for native fish. Since European settlement large numbers of snags have been removed from the River Murray. In the 1970s more than 20,000 snags were removed between Hume Dam and Yarrawonga.
Between 2007 and 2009, a TLM project reintroduced snags into the Hume to Yarrawonga reach. Monitoring conducted each year between 2007 and 2013 showed that there had been a threefold increase in Murray Cod populations, which was attributed to the re-snagging (Lyon et al. 2012).
System Scale Intervention – Large Bodied FishIn 2013, a project commenced to analyse data collected between 1999 and 2014 to investigate links between flow regimes and the growth, recruitment and population responses of large-bodied fish in the Yarrawonga to Tocumwal reach of the River Murray (Tonkin et al. 2014). The project found:
• Trout cod, Murray cod and golden perch grew more in years with high discharge and high flow variability that was predominantly in spring, summer and autumn. The results also indicate that periods of high fish growth in the River Murray coincided with delivery of environmental water.
• Golden perch populations are largely driven by connectivity that facilitates adult migration. Increases in population size are associated with high flow events which enhance connectivity.
• The population size of adult Murray cod was comparatively steady through the sampling period (1999–2014), despite several spikes in juvenile numbers. This reach has a large population of adult Murray cod, and it is likely that suitable habitat for larger fish is fully occupied, meaning the juveniles either emigrate or are preyed upon by larger fish.
• Trout cod population patterns were similar to that of Murray cod, with several peaks in juvenile numbers. However between 2008 and 2012 a greater proportion of trout cod appear to be surviving to become adults (>300 mm) as there was a population increase of adult fish over that period (Tonkin et al. 2014).It is probable that flow conditions during this period maximised the available habitat for trout cod (noting that trout cod occupy different habitat to Murray cod)
Monitoring in the lower Murray–Darling (Zampatti et al. 2014) showed that golden perch spawn and recruit in response to flow events that operated at the system scale and migrate over large distances to other river systems within the southern Murray–Darling Basin. In 2014, throughout
Page 78
The Living Murray icon sites 2013–14 Monitoring
the mid and lower River Murray, and the Lower Darling river, golden perch populations were dominated by a cohort of fish spawned in the Darling River in 2009.
Icon site 2013–14 River Murray Fish Monitoring Results
Several icon sites monitored fish in the River Murray channel during 2013–14. Some insights regarding the condition of fish within the channel can be made from the findings at those icon sites.
Barmah–Millewa Forest The fish community of the River Murray channel is in the process of recovery from the significant hypoxic blackwater event caused by natural flooding in late 2010 — early 2011. Prior to 2010–11 the fish community was numerically dominated by native species. In 2010–11 there was a decline in the number of native fish and a concurrent increase in the number of alien species, particularly common carp (this increase is consistent with carp population modelling which shows declines in drought and increases during floods). From 2010–11 to 2012–13 alien species remained dominant. In 2013–14 native species became dominant once more, principally because of a large number of Australian smelt. Other small bodied native species have yet to recover from the 2010–11 population decline (Raymond et al. 2014).
Murray cod and trout cod, golden perch, silver perch, carp gudgeons, flat-headed gudgeon and Australian smelt all spawned in the River Murray channel during the spring and summer of 2013–14. This was the first major spawning of golden perch in the last eight years and monitoring indicated that flow manipulation may have contributed to the initiation and extension of spawning in this species. The capture of Murray cod larvae from the River Murray channel at the Morning Glory site in the past three years, after their absence in 2010–11, indicates that either some adult Murray cod persisted in this reach during the 2011 black water event or downstream larval drift is re-colonising the region (Raymond et al. 2014).
Murray cod and trout cod population structures exhibited a broad range of cohorts indicative of recruitment events over previous years, suggestive of long-term population stability (Raymond et al. 2014).
While the abundance of Murray crayfish within the Barmah–Millewa Forest has improved since the 2011 blackwater event, they continue to be absent from the River Murray at Morning Glory. The slow recovery of Murray crayfish is probably because of their small home range and limited dispersal (Raymond et al. 2014).
Gunbower ForestAt Gunbower, the River Murray Channel fish community was numerically dominated by native species. This has been the case in most of the years since sampling commenced in 2009–10, with the exception of 2010–11 when a decline in the number of natives was coupled with an increase in the number of common carp. The most numerous species were Australian smelt and Murray–Darling rainbowfish, both of which have exhibited a marked increase in overall abundance since 2010–11. Since 2010–11 there has been a decline in the number of common carp recorded, although this species is still more common than any large-bodied native species.
Of the threatened fish species at Gunbower, including silver perch, freshwater catfish, Murray cod, trout cod, un-specked hardyhead and Murray–Darling rainbowfish, only the latter has shown an increase in abundance since 2010–11 (Sharpe et al. 2014).
Page 79

The Living Murray icon sites 2013–14 Monitoring
Page 80
The Living Murray icon sites 2013–14 Monitoring
References
IntroductionMDBA, 2011 The Living Murray Story – one of Australia’s largest river restoration projects, MDBA, Canberra.
MDBA, 2013, River Murray System Annual Operating Plan 2013–14, MDBA, Canberra.
MDBA, 2014, The Living Murray 2013–14 Environmental Water Report, MDBA, Canberra.
Meteorological Data BoM 2015: Meteorological data for all charts in the icon site sections was retrieved from the Bureau of Meteorology website using the closest weather station with long-term data. The website was viewed in October 2015.
http://www.bom.gov.au/climate/data/index.shtml
Barmah Forest
Personal CommunicationsTonkin, Z 2014, Electronic communications to Keith Ward, 18 August 2014, Project Manager Instream Habitat and Environmental Flows, Arthur Rylah Institute for Environmental Research, Department of Environment and Primary Industries, Heidelberg, Victoria.
LiteratureGBCMA 2013, Goulburn Broken Catchment Management Authority Barmah Forest Adaptive Management Monitoring Plan 2013–14, GBCMA, Shepparton.
MDBA 2015b, Stand Condition Assessment of Forests and Woodlands of Barmah Forest – 2014
Raymond, S, Duncan, M, Robinson, W & Tonkin, Z 2014, Barmah–Millewa Fish Condition Monitoring: 2006 to 2014, client report prepared for the Murray–Darling Basin Authority by Arthur Rylah Institute for Environmental Research Unpublished, Department of Environment and Primary Industries, Heidelberg, Victoria.
Stoffels, R, & Weatherman, K 2014, Floodplain fish communities of the Barmah and Killawarra Forests: pygmy perch status; knowledge needs; management suggestions. Final Report, prepared for the Goulburn–Broken Catchment Management Authority by the Murray–Darling Freshwater Research Centre, MDFRC Publication 21/2014, May, 37 pp.
Ward, PA (2014), Monitoring understorey vegetation response to flooding in Barmah Forest: 2013–14 – Final Report, report prepared for Murray–Darling Basin Authority by the Victorian Department of Primary Industries & Environment, Melbourne, 252pp.
Gunbower ForestBennetts, K 2014, Gunbower Forest Sentinel Wetland and Understorey Survey autumn 2014. Report for the North Central Catchment Management Authority, by Fire, Flood and Flora.
Page 81
The Living Murray icon sites 2013–14 Monitoring
Bennetts, K & Jolly, K 2014, Gunbower Forest TLM Stand and Tree Condition Assessments 2014. Unpublished report for the North Central Catchment Management Authority, Fire, Flood and Flora, Cape Woolamai, Victoria.
Mallen-Cooper M, Stuart IG, Sharpe C, 2014, Gunbower Island Native Fish Recovery Plan. Report prepared for the North Central Catchment Management Authority by Fishway Consulting Services.
Stuart, I & Sharpe, C 2015a, Golden perch tagging and potential for re-colonisation in the lower Gunbower Creek. Report prepared by CPS Environmental Research for the North Central Catchment Management Authority.
Sharpe, C, Campbell-Brown, S, Vilizzi, L & Stanislawski, K 2014, Gunbower Island Annual Fish Surveys: 2014, report prepared for the North Central Catchment Management Authority by CPS Environmental Research.
Webster, R. 2014. Bird populations within Gunbower National Park/State Forest: 2008–2013. Unpublished report to North Central Catchment Management Authority. Ecosurveys Pty Ltd, Deniliquin.
Webster, R. and Martins, A. 2013. Quarterly Report: Waterbird Monitoring within Gunbower National Park/State Forest — Spring 2013. Unpublished report to North Central Catchment Management Authority. Ecosurveys Pty Ltd, Deniliquin.
Hattah LakesHenderson, M, Freestone, F, Vlamis, T, Cranston, G, Huntley, S, Campbell, C & Brown, P 2014, The Living Murray Condition Monitoring at Hattah Lakes 2013–14: Part A – Main Report. Final Report prepared for the Mallee Catchment Management Authority by The Murray–Darling Freshwater Research Centre, MDFRC Publication 03/2014, June.
Robinson 2013, The Living Murray: Towards assessing whole of icon site condition, In: Report to the Murray–Darling Basin Authority.
Walters SJ, Henderson MW, Wood DB, Sharpe CP, Vilizzi L, Johns CV, Campbell CJ and McCarthy B (2011) The Living Murray Condition Monitoring at Hattah Lakes 2010/11: Part A — Main Report. Final Report prepared for the Department of Sustainability and Environment by The Murray–Darling Freshwater Research Centre, MDFRC Publication 25/2011.
Lindsay–Mulcra–WallpollaHenderson, M, Freestone, F, Vlamis, T, Cranston, G, Huntley, S, Campbell C & Brown P 2014, The Living Murray Condition Monitoring at Lindsay, Mulcra and Wallpolla Islands 2013–14 Part A – Main report, Final report prepared for the Mallee Catchment Management Authority by The Murray–Darling Freshwater Research Centre.
Robinson, W, 2013, The Living Murray: Towards assessing whole of icon site condition, In: Report to the Murray–Darling Basin Authority.
ChowillaGehrig, S.L., Marsland, K.B., Nicol, J.M. and Weedon, J.T. (2014). Chowilla Icon Site – Floodplain Vegetation Monitoring 2014 Interim Report. South Australian Research and
Page 82
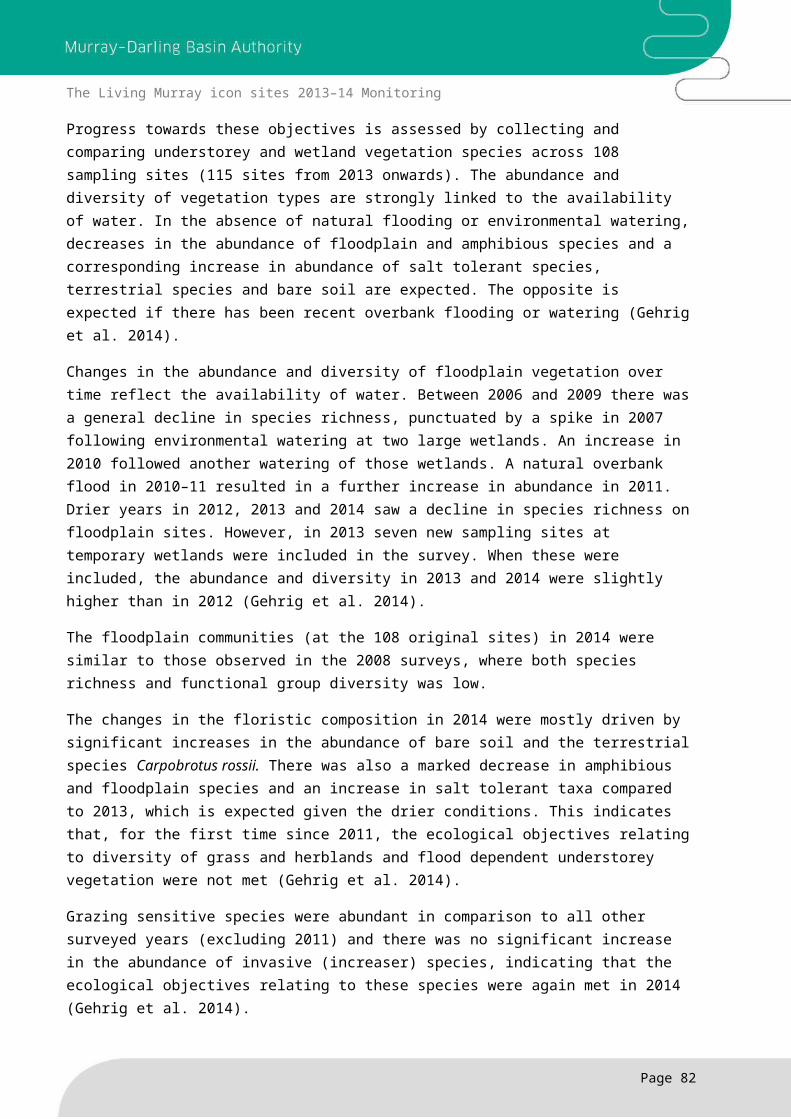
The Living Murray icon sites 2013–14 Monitoring
Development Institute (Aquatic Sciences), Adelaide. SARDI Publication. SARDI Research Report Series No. 5. 68pp.
George, A.K., Walker, K.F., & Lewis, M.M. (2005). Population status of eucalypt trees on the River Murray floodplain, South Australia. River Research & Applications 21, 271 282.
Kieskamp, H. (2014) Chowilla Floodplain Bushbird Survey 2013–14
Wilson, P.J., Zampatti, B.P. and Leigh, S.J. (2014). Chowilla Icon Site Fish Assemblage Condition Monitoring 2014. South Australian Research and Development Institute (Aquatic Sciences), Adelaide. SARDI Publication No. F2008/000907-5. SARDI Research Report Series No. 785. 50pp.
Wallace, T. A. 2013. Assessment of River Red Gum and Black Box population demographics at the Chowilla Floodplain Icon Site. Report prepared by Riverwater Life Pty Ltd for the Department of Environment, Water and Natural Resources South Australian Government. June 2013. 11 pp
Wallace, T. (2014) Chowilla Floodplain Icon Site Tree Condition Monitoring Summary 2012–14
Lower Lakes, Coorong and Murray Mouth
Department of Environment, Water and Natural Resources (DEWNR) 2014a, Report on Delivery of South Australia's River Murray Annual Operating Plan 2013–14, Department of Environment, Water and Natural Resources, South Australia.
Department of Environment, Water and Natural Resources (DEWNR) 2014b, South Australia’s River Murray Environmental Watering Report 2013–14, DEWNR, South Australia.
Dittmann, S, Navong, N, Ramsdale, T & McGuire, A 2014, Benthic Macroinvertebrate Survey 2013–14: Lower Lakes, Coorong and Murray Mouth Icon Site, report prepared for the Department of Environment, Water and Natural Resources and the Murray–Darling Basin Authority by Flinders University,
Frahn, K.A, Gehrig, SL, Nicol, JM & Marsland KB 2014, Lower Lakes Vegetation Condition Monitoring – 2013/2014. South Australian Research and Development Institute (Aquatic Sciences), Adelaide, SARDI Publication Number F2009/000370-6. SARDI Research Report Series No. 795, pp 83.
Mason, K 2014, Frog Monitoring in the Coorong, Lower Lakes and Murray Mouth Region 2013/14, Department of Environment Water and Natural Resources, Murray Bridge, South Australia.
Murray–Darling Basin Authority (MDBA) 2014a, The Lower Lakes, Coorong and Murray Mouth Icon Site Environmental Water Management Plan 2014, MDBA, Canberra.
Murray–Darling Basin Authority (MDBA) 2014b, The Living Murray 2013–14 Environmental Watering Report, MDBA, Canberra.
Oliver, RL, Lorenz, Z, Nielsen, DL, & Shiel, RJ 2014, Multivariate Analyses of the Microalgae, Zooplankton and Water Quality Monitoring Data from the Coorong, Lower Lakes and Murray
Page 83
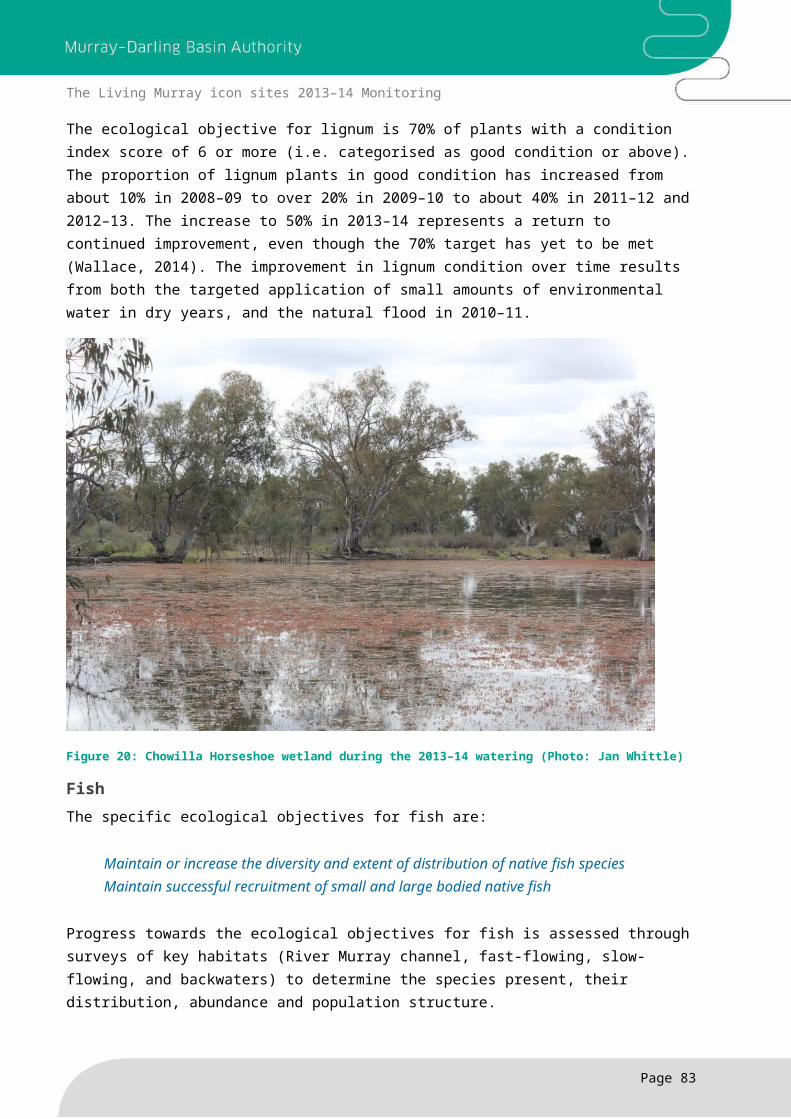
The Living Murray icon sites 2013–14 Monitoring
Mouth: Analysing environmental perturbations in a connected river, lake and estuarine system, CSIRO, Land and Water Flagship, Australia.
Paton, DC, & Bailey, CP 2014a, Intervention monitoring of Ruppia tuberosa in the southern Coorong summer 2013–14, Report prepared for the Department of Environment, Water and Natural Resources, by the University of Adelaide, Adelaide.?.
Paton, DC, & Bailey CP 2014b, Condition monitoring of the Lower Lakes, Murray Mouth and Coorong Icon Site: Waterbirds 2014, Report prepared for the Department of Environment, Water and Natural Resources by the University of Adelaide, Adelaide.
Robinson, W 2014, The Living Murray Condition Monitoring Plan Refinement Project: Summary Report. Technical report to the MDBA, December 2014, pp 75.
Wedderburn, S & Barnes, T 2014, Condition Monitoring of Threatened Fish Species at Lake Alexandrina and Lake Albert (2013–2014), The University of Adelaide, Adelaide, p 71.
Ye, Q, Bucater, L & Short, D 2014, Coorong fish condition monitoring 2008–2014: Black bream (Acanthopagrus butcheri), greenback flounder (Rhombosolea tapirina) and smallmouth hardyhead (Atherinosoma microstoma) populations, South Australian Research and Development Institute (Aquatic Sciences), Adelaide.
River Murray ChannelBaumgartner L, Zampatti, B, Jones, M (2014). The Sea to Lake Hume: Restoring Fish Passage in the Murray (Draft report). Murray–Darling Basin Authority, Canberra
Cunningham SC, Griffioen P, White M & Mac Nally R, 2013, Mapping the Condition of River Red Gum (Eucalyptus camaldulensis Dehnh.) and Black Box (Eucalyptus largiflorens F.Muell.) Stands in The Living Murray Icon Sites, Stand Condition Report 2012, Murray–Darling Basin Authority, Canberra.
Department of Environment, Water and Natural Resources (DEWNR) 2013, Chowilla Floodplain Icon Site 2011/12 Synthesis Report, DEWNR Technical Report 2011/12, Government of South Australia, Department of Environment, Water and Natural Resources, Adelaide, South Australia.
Lyon, J, Kearns, J, Bird, T, Tonkin, Z, O’Mahony, J, Nicol, S, Hackett, G, Raymond, S & Kitchingman, A 2014, Monitoring of Resnagging between Lake Hume and Yarrawonga: Final Report 2014, unpublished client report to the Murray–Darling Basin Authority, Arthur Rylah Institute for Environmental Research, Department of Environment and Primary Industries, Heidelberg, Victoria.
Murray–Darling Basin Authority (MDBA) 2014, The Living Murray 2013–14 Environmental Watering Report, MDBA, Canberra.
Murray–Darling Basin Commission (MDBC) 2006, The River Murray Channel Icon Site Environmental Management Plan 2006–2007, MDBA Canberra.
Raymond, S, Duncan, M, Robinson, W & Tonkin, Z 2014, ‘Barmah–Millewa Fish Condition Monitoring: 2006 to 2014’, unpublished client report for the Murray–Darling Basin Authority by the Arthur Rylah Institute for Environmental Research, Department of Environment and Primary Industries, Heidelberg, Victoria.
Page 84
The Living Murray icon sites 2013–14 Monitoring
Sharpe, C, Campbell-Brown, S, Vilizzi, L & Stanislawski, K 2014, Gunbower Island Annual Fish Surveys: 2014, report prepared for the North Central Catchment Management Authority by CPS Environmental Research.
Tonkin, Z, Lyon, J, Kitchingman, A, Kearns, J, O’Mahony, J, Bird, T, Nicol, S, Maloney, P & Hackett, G 2014, ‘System Scale higher trophic order responses to environmental watering: Growth, recruitment and population responses of large-bodied native fish to flows in the mid-River Murray’, unpublished client report for Murray–Darling Basin Authority by the Arthur Rylah Institute for Environmental Research, Department of Environment and Primary Industries, Heidelberg, Victoria.
B. P. Zampatti, P. J. Wilson, L. Baumgartner, W. Koster, J.P. Livore, N. McCasker, J. Thiem, Z. Tonkin and Q. Ye. (2014). Reproduction and recruitment of golden perch (Macquaria ambigua ambigua) in the Southern Murray–Darling Basin in 2013–14: An exploration of river-scale response, connectivity and population dynamics, South Australian Research and Development Institute (Aquatic Sciences), Adelaide, SARDI Publication No. F2014/000756-1. SARDI Research Report Series No.820. 62pp.
Page 85
The Living Murray icon sites 2013–14 Monitoring
Appendix A: 2013–14 TLM Monitoring Activities by Icon Site
Barmah Forest
Monitoring Activity/Project Service Provider
Understorey vegetation monitoring P WardFish condition assessment Arthur Rylah Institute Waterbird monitoring – ground surveys and aerial surveillance
Goulburn Broken Catchment Management Authority
Stand condition field assessments Fire, Flood and FloraInundation mapping Department of Environment and Primary
Industries Water quality and flows Goulburn Broken Catchment
Management Authority Moira Grass response and extent mapping Goulburn Broken Catchment
Management AuthorityFish spawning response in River Murray Arthur Rylah InstituteRemote cameras and acoustic recorders – waterbirds, frogs and other fauna
Goulburn Broken Catchment Management Authority
Investigation into environmental requirements of the southern pygmy perch
Murray–Darling Freshwater Research Centre
Gunbower Forest
Monitoring Activity/Project Service Provider
Sentinel wetland and understorey surveys Fire, Flood and FloraTree condition assessment Fire, Flood and FloraAnnual fish surveys CPS Environmental ResearchQuarterly waterbird surveys Ecosurveys Pty LtdStand condition field assessments Fire, Flood and Flora Water level, extent and quality, and groundwater monitoring
North Central Catchment Management Authority
Availability of habitat for native fish Arthur Rylah InstituteCapturing vegetation response to environmental flows
North Central Catchment Management Authority
Optimising flows in Gunbower Creek to enhance spawning opportunities for Murray cod
CPS Enviro Research and Kingfisher Research P\L
Impact of carp on the establishment of aquatic macrophytes
Fire, Flood and Flora
Fish movement project design Kingfisher Research P/LGolden Perch tagging and potential for colonisation in the lower Gunbower Creek
CPS Enviro Research and Kingfisher Research
Water depth monitoring to optimise breeding of colonial nesting waterbirds
North Central Catchment Management Authority
Litter Loads for Blackwater Risk Assessment Murray–Darling Freshwater Research Centre
Page 86
The Living Murray icon sites 2013–14 Monitoring
Hattah Lakes
Monitoring Activity/Project Service Provider
Floodplain and wetland vegetation surveys Murray–Darling Freshwater Research Centre
Tree condition, distribution and size class structure
Murray–Darling Freshwater Research Centre
Fish surveys Murray–Darling Freshwater Research Centre
Wetland waterbird survey Murray–Darling Freshwater Research Centre
Stand condition assessment surveys Murray–Darling Freshwater Research Centre
Regent Parrot monitoring Department of Environment and Primary Industries, Victoria
Fish egg and larval survey of the River Murray around Hattah Lakes pumping station
Department of Environment and Primary Industries, Victoria
Fish and vegetation responses to operation of Hattah regulators
Murray–Darling Freshwater Research Centre
Understorey vegetation monitoring design Arthur Rylah Institute Waterbird response to environmental water Mallee Catchment Management AuthorityPilot study investigating propagule dispersal Murray–Darling Freshwater Research
Centre Black box seed set and fall monitoring design Arthur Rylah Institute Groundwater and salinity monitoring Mallee Catchment Management Authority
Lindsay–Wallpolla–Mulcra Islands
Monitoring Activity/Project Service Provider
Floodplain and wetland vegetation condition Murray–Darling Freshwater Research Centre
Tree condition Murray–Darling Freshwater Research Centre
Fish surveys Murray–Darling Freshwater Research Centre
Waterbird surveys Murray–Darling Freshwater Research Centre
Monitoring of the first operation of the Lower Potterwalkagee Regulator Mulcra Island
Mallee Catchment Management Authority
Tracking fish movement in Potterwalkagee Creek Mulcra Island
Murray–Darling Freshwater Research Centre
Waterbird abundance and breeding at Mulcra Island
Mallee Catchment Management Authority
Frog diversity and breeding at Mulcra Island Murray–Darling Freshwater Research Centre
Fish movement in the Lindsay River and Arthur Rylah Institute
Page 87
The Living Murray icon sites 2013–14 Monitoring
Monitoring Activity/Project Service Provider
Mullaroo Creek Lindsay Island Vegetation Offsets Monitoring Murray–Darling Freshwater Research
Centre Groundwater and salinity monitoring Mulcra and Lindsay Islands
Mallee Catchment Management Authority
Chowilla Floodplain
Monitoring Activity/Project Service Provider
Tree condition assessment The University for AdelaideStand condition surveys Department of Environment, Water and
Natural Resources, South Australia and The University for Adelaide
Lignum condition monitoring Department of Environment, Water and Natural Resources, South Australia and The University for Adelaide
Understorey and aquatic vegetation condition monitoring
South Australian Research and Development Institute
Fish condition assessment South Australian Research and Development Institute
Bushbird condition assessments H Kieskamp
Waterbird surveys Department of Environment, Water and Natural Resources, South Australia
Groundwater monitoring Department of Environment, Water and Natural Resources, South Australia
Surface water monitoring Department of Environment, Water and Natural Resources, South Australia
Water quality and management of hypoxic blackwater monitoring
The University for Adelaide
Movement, habitat use, of Murray Cod in relation to hydrological manipulation within the Chowilla Anabranch
South Australian Research and Development Institute
Monitoring risks of soil salinisation from Chowilla regulator operations
Department of Environment, Water and Natural Resources, South Australia
Page 88
The Living Murray icon sites 2013–14 Monitoring
Lower Lakes, Coorong, and Murray Mouth
Monitoring Activity/Project Service Provider
Lower Lakes and Coorong Waterbird Census
The University of Adelaide
Monthly waterbird surveys in the Lower Lakes
Coorong Nature Tours
Lower Lakes threatened fish condition monitoring
The University of Adelaide
Monitoring of estuarine fish in the Coorong Black bream (Acanthopagrus butcheri), greenback flounder (Rhombosolea tapirina) and smallmouthed hardyhead (Atherinosoma microstoma) populations
South Australian Research and Development Institute
Lower Lakes aquatic vegetation condition monitoring
South Australian Research and Development Institute
Benthic invertebrate and mudflat monitoring
Flinders University
Ruppia tuberosa in the southern Coorong The University of AdelaideFish assemblage structure, movement and recruitment in the Coorong and Lower Lakes
South Australian Research and Development Institute
An assessment of threatened fish populations in Lake Alexandrina and Lake Albert, South Australia
The University of Adelaide
Page 89