Embed Size (px)
Citation preview
TheLittleBiodiversityFinanceBookA guide to proactive investment in natural capital (PINC)
3
ACKNOWLEDGEMENTS
This publication is supported by the CBD Secretariat
and produced with the financial assistance of the Prince Albert II of Monaco Foundation
The editorial costs were supported by the Ashden Trust. The core costs of the Global Canopy Programme are supported entirely by voluntary donations from foundations including The Rufford Maurice Laing Foundation, The Waterloo Foundation, The John Ellerman Foundation, The Millichope Foundation, CHK Charities, Ernest Kleinwort Charitable Trust and donations from individuals. We thank all of them for this valuable support.
We are continually aiming to improve the Little Biodiversity Finance Book and your feedback is welcome. Please send comments to Charlie Parker [email protected]
Authors: Charlie Parker, Matthew Cranford
For more information contact: [email protected]
Contributions to the text were gratefully received from:CBD SecretariatBecca Madsen, Ecosystem MarketplaceJosh Donlan, Advanced Conservation StrategiesJonah Busch, Conservation InternationalPeiter van Eijk, Wetlands InternationalLeif Pedersen, Rainforest AllianceJessica Brown, Overseas Development InstituteJosh Bishop, IUCNFAS TeamNathaniel Caroll, Ecosystem Marketplace
© Global Canopy Foundation 2010
This is the first edition of the Little Biodiversity Finance Book First Published October 2010.
Published by: Global Canopy Programme, John Krebs Field Station, Oxford OX2 8QJ, UK.
Designed by Companywww.company-london.com
The Global Canopy Programme is an alliance of 37 scientific institutions in 19 countries, which lead the world in forest canopy research, education and conservation. Today, our three main programmes - in science, policy and finance aim to define and explore the range and economic value of forest ecosystem services and to share our findings with decision-makers in government and finance.
Visit www.globalcanopy.org for more information.
TEÓFILO DE LA TORRE ARGÜELLO, ENVIRONMENT MINISTER OF COSTA RICA
In its effort to establish a model of sustainable development, Costa Rica faced the challenge of protecting its biological wealth while promoting the country’s economic and social development. The courageous decision to keep roughly 26% of land area protected allows Costa Rica to preserve representative samples of its rich biodiversity while generating significant income from the sustainable use of the ecosystem services this area provides. A study published by the International Centre for Economic Policy for Sustainable Development of the National University of Costa Rica shows that, by the year 2009, the total contribution of national parks and biological reserves to the national economy was approximately USD 1.5 million. This was generated from activities such as tourism, the protection of water resources for hydropower generation, community water supply, scientific research, and other environmental services.
Nonetheless, the investment that the Costa Rican government has made to protect and conserve ecosystem services and biodiversity remains inadequate. It has not been possible to meet the demand for the benefits ecosystem services can provide or the human resources, infrastructure, technology, and capacity building that protected areas require to ensure their permanence and sustainability. Meeting the commitments made under the Convention on Biological Diversity (CBD), the United Nations Framework Convention on Climate Change (UNFCCC) and other relevant conventions such as the Convention on International Trade in Endangered Species (CITES) and The Ramsar Convention is especially challenging. The need for maintaining and expanding current levels of bilateral and multilateral cooperation has never been as pronounced.
A striking example of this cooperation is expected to emerge from the implementation of the Forever Costa Rica Project, which was submitted as an Expression of Interest to the CBD LifeWeb Initiative last year. The Project’s primary objective is to achieve the goals of the Programme of Work on Protected Areas of the Convention on Biological Diversity (Decision VII/28). The CBD LifeWeb Initiative provides a clear window of opportunity to access various financial resources at the global level.
To date, Costa Rica’s social and environmental achievements are undoubtedly the result of robust environmental policy that recognizes the value of ecosystem services and biodiversity for economic development. Similarly, the establishment of transparent, participatory, and inclusive mechanisms for the use of national financial resources and international cooperation is crucial, including the development of a local Environmental Service Market in partnership with the government and the private sector. In this light, we urge other countries to establish or offer financial support for similarly constructive models which demonstrate clear local and global benefits.
4 5
DR. NORBERT RÖTTGEN, ENVIRONMENT MINISTER OF GERMANY
Biological diversity is the foundation of all human societies and a prerequisite for sustainable economic development. This fact is amply demonstrated by the ongoing global study on “The Economics of Ecosystems and Biodiversity” (TEEB). TEEB also shows that the cost of sustaining biodiversity and ecosystem services is lower than the cost of allowing the further deterioration of biodiversity and ecosystem services Nevertheless, and despite the concerted efforts of the international community to protect biodiversity and the provision of corresponding ecosystem services, biodiversity loss continues to occur at an unprecedented rate. On a global scale, we are falling short of our goals to reduce and eventually halt the rate of biodiversity loss. Financing is clearly one of our greatest impediments to implementing these commitments. The financing gap for biodiversity conservation continues to widen. Mobilizing financial resources for biodiversity conservation has always been one Germany’s priorities in the context of the Convention on Biological Diversity (CBD). The cost of inaction is too great to ignore this global problem.
The range of financing mechanisms and platforms outlined in this book conveys the current international commitment to biodiversity. However, much work remains to meet the levels of funding required to achieve the objectives of the CBD. The current state of biodiversity decline calls for immediate and effective action of the international community. Without the cooperation between governments, donors, NGOs and local communities, the private sector and increased financial support for conservation projects, achieving the goals of the CBD will be impossible. In the field of climate change, Germany has already developed an innovative financing instrument, the International Climate Initiative of the Federal Ministry for the Environment, Nature Conservation and Nuclear Safety. This initiative is funded through revenues of the sale of carbon emission allowances. However, the fight against climate change will not be effective if we do not succeed in achieving the conservation and sustainable management of large, carbon-rich ecosystems. Acting against climate change and conserving biodiversity are two sides of the same coin.
We therefore also make use of the International Climate Initiative to support projects for the conservation of climate-relevant biodiversity in developing, newly industrialising and transition countries. As the Little Biodiversity Finance Book illustrates, as part of these efforts we support projects profiled through the CBD s LifeWeb clearing-house that serve to strengthen the implementation of the Convention s programme of work on protected areas. I welcome the publication of the Little Biodiversity Finance Book which highlights a multitude of innovative and practical ways in which we can generate finance for the conservation and sustainable use of biodiversity. I am convinced that it comes at a very opportune moment and I am certain that this useful book will be widely used.
6 7
MR. AHMED DJOGHLAF, EXECUTIVE SECRETARY OF THE CBD
Today biodiversity is being lost more quickly than ever. The current rate of extinction is estimated to be up to 1,000 times higher than the natural background rate. If this trend does not change, it is expected that an area of 1.3 billion hectares worldwide – about 1.5 times the United States – will completely lose its original biodiversity levels by 2050.
It is no exaggeration to say that our quality of life will suffer tremendously if we continue to lose biodiversity at this rate. We depend on biodiversity for everything from food, fuel and medicines, to air and water purification and the pollination of wild plants and crops. But despite the great importance of biodiversity to human wellbeing, the far-reaching consequences of biodiversity loss are not adequately reflected in the levels of financing currently being spent on biodiversity.
The lack of sufficient financial resources is one of the main obstacles to achieving the Convention’s objectives. At the ninth meeting of the Convention on Biological Diversity, the Conference of the Parties (COP) adopted a strategy to enhance international financial flows and domestic funding for biodiversity. As part of this strategy, COP 9 invited Parties to come forward with new and innovative financing mechanisms and requested the Executive Secretary to support the diffusion of such initiatives. Along the same lines, COP 10 in Nagoya this year is expected to encourage Parties to implement the strategy at the national level, take an active part in ongoing processes to enhance innovative biodiversity financing, and engage in a global discussion on the need and possible modalities of innovative financing systems.
We are increasingly seeing encouraging signs of new and innovative sources of biodiversity financing, such as Payments for Ecosystem Services (PES), and related investments of the private sector. For example, Mexico has generated over USD 300 million for forest conservation in the past seven years through its ‘Payments of Hydrological Environmental Services of Forests’ scheme. Such excellent initiatives, which exist in many countries, should be scaled up and replicated widely.
The Little Biodiversity Finance Book is an excellent sourcebook for these efforts to draw on. It provides a simple and easy introduction to existing financial mechanisms in support of biodiversity. As such, it will be an indispensible tool, making biodiversity financing options more accessible for both newcomers to this field and national and international policy makers. Clearly, no task could be more timely or important. As the slogan of the International Year of Biodiversity 2010 reminds us: Biodiversity is life… biodiversity is OUR life.
DR. CHRISTIAN MERSMANN, MANAGING DIRECTOR OF THE GLOBAL MECHANISM OF THE UNCCCD
The UN Convention to Combat Desertification (UNCCD) recognises that promoting biological diversity and combating desertification are inextricably linked .Preserving biodiversity is essential if we are to prevent the degradation of land, particularly in vulnerable dryland areas, on which human well-being and sustainable development depends.
The CBD community has developed an array of policy and financial instruments to conserve biodiversity and protect the world’s ecosystems. Government institutions, civil society organisations, businesses and communities are now testing these mechanisms, from public infrastructure investments to businesses paying farmers for environmental services.
Given the synergies between the CBD and UNCCD, many biodiversity financing instruments and mechanisms are relevant for efforts to prevent and mitigate desertification and promote sustainable land management. This publication provides a comprehensive yet concise and understandable overview of financial mechanisms, and we welcome it in helping to facilitate understanding, encourage discussion, and inspire decision makers and land users.
The Global Mechanism, as a subsidiary body of the UNCCD, is exploring some of these financial mechanisms in an integrated national context. As called for by the 2008-2018 UNCCD Strategy, we provide strategic and technical support to governments’ efforts to develop investment frameworks that support the implementation of the UNCCD National Action Programmes. We are eager to continue sharing our experiences with the CBD community for the development of biodiversity country resource mobilisation strategies and pursue financing synergies at country level.
The international community is increasingly recognising the value of biodiversity and ecosystem services, while public and private investments in agriculture, food security and climate change adaptation and mitigation are on the rise. These trends present a perfect opportunity for the Rio Conventions and their partners to provide leadership and guidance – in a spirit of transparency, efficiency and harmony – to develop resource mobilisation strategies in a broader sustainable development context. As a UNCCD institution, we look forward to taking up that challenge.
8 9
© N
igel
Dic
kin
son
/Alp
ha
Pre
sse
10 11
THINK PINCWHY THE WORLD NEED’S PROACTIVE INVESTMENT IN NATURAL CAPITAL
The English playwright Oscar Wilde once commented that the cynic knows the price of everything but the value of nothing. Today’s cynics are those who claim biodiversity is priceless, yet are not prepared to pay for it. Biodiversity and the vast ecosystem services it provides, underpins climate, food, energy, health and livelihood security for humanity at local to global scales. You can count these securities off on each finger and literally hold the future of the earth in the palm of your hand.
Our societal dilemma is that we do not pay the true cost of the things we use. A bar of chocolate consumed in a Parisian café does not reflect the costs of the biodiversity lost in Asian forest destruction caused by the demand for palm oil contained within it. Latin beefsteaks consumed in Sao Paulo or New York, do not bear the environmental costs of the carbon emissions caused by the deforestation of the amazon for cattle pasture. Beautiful flowers bought by consumers in Europe do not account for the over fertilised lakes of Africa that are their hidden collateral damage.
In this UN year of Biodiversity a quiet revolution is occurring. Whilst the Millennium Development Goals for stemming biodiversity loss may be missed, the financial crisis is forcing a re-think of how products and services are valued. Investors are thinking, ‘if we got it so wrong with one property, what else out there is incorrectly valued?’ There is a growing realisation that wealth creation cannot continue based on financial and social capital alone, but must recognise natural capital too – for without this, national accounts, business accounts and consumer accounts – long term, are ultimately built on sand.
This book charts the current status of biodiversity finance globally. We have discovered there is much we do not know. The full scale and effectiveness of financing for biodiversity remains elusive. Looking back at today’s cash flows for biodiversity, bears no reflection of what is needed or may be delivered tomorrow. An economic paradigm predicated largely on existence values has failed biodiversity. A morpho butterfly’s beauty will never outbid the Mona Lisa. The change coming, is a realisation that a more workable means of capturing value for biodiversity, at least in global markets, could be based on the USD trillion ecosystem services it provides to us all.
The Little Biodiversity Finance Book is also a guide for much needed ‘Proactive Investment in Natural Capital’. PINC provides a conceptual framework for future financing for biodiversity and the ecosystem services it provides which underpin wealth creation (Trivedi et al., 2009). It is a natural follow on from REDD (Reducing Emissions from Deforestation and forest Degradation in developing countries), which is essentially valuing one such service, namely the carbon cycle. REDD under the UNFCCC however, cannot capture the value of the numerous other services that ecosystems provide.
This opportunity falls to economic innovators, perhaps stimulated by government interventions through, for example, the CBD and proposed instruments such as the ‘Green Development Mechanism’.
Such a utilitarian view of biodiversity should not be allowed to erode the inestimable value it has for the human spirit but should secure it for future generations. It must also equitably enhance the wellbeing of the rural poor, whose livelihoods are closer to natural capital, than those of city dwellers, increasingly removed from it. It is those who live with biodiversity, who do so much to sustain the natural capital upon which the rest of the world depends and they should be rewarded for maintaining it.
Inside this book you will find the seeds of a new economy. One in which the contribution of the biosphere to our wellbeing becomes an opportunity for positive economic flows. This new economy could see the emergence of ‘biodiversity superpowers’ rich in natural capital and able to bargain their ecological muscle for aid or trade. This offers a comparative advantage to emerging economies, especially in developing countries that have retained much of their biodiversity intact.
Andrew W. MitchellFounder and DirectorGlobal Canopy Programme
12 13
HOW DOES THIS BOOK HELP?
With hundreds of billions of dollars needed for development and climate change mitigation and adaptation, it initially seems a difficult task to finance biodiversity at the level required. The Little Biodiversity Finance Book aims to dispel this impression by clearly laying out options for financing biodiversity and ecosystem services and by highlighting the need and potential for synergies not only between financing mechanisms, but also between financing sources earmarked for development, climate change and biodiversity.
The aim of the Little Biodiversity Finance Book is to help key stakeholders including governments, NGOs, the private sector, indigenous peoples and local communities to compare existing and future options for biodiversity and ecosystem finance in a clear and consistent way. To do this, this publication introduces an overarching framework that organises financial mechanisms under three main headings: revenue generation, delivery and institutional arrangements. These modules can be thought of as independent building blocks that can be arranged in a ‘mix and match’ approach, choosing the most suitable options from each module to create a more effective, efficient, and equitable financial system.
To allow assessment and comparison of the various options within each module we present a set of common criteria, derived from core principles that have emerged within the biodiversity negotiations and the considerable background work by NGOs, IGOs and policy makers. These criteria have been presented graphically using icons that are introduced within each section and shown on the inside back cover for quick reference.
As a non-partisan analysis, the Little Biodiversity Finance Book does not favour one proposal over another. We do hope, however, that our work will aid understanding and encourage dialogue on this vitally important yet globally unrecognised and unrewarded area.
This publication is a first attempt to understand and evaluate the range of options for financing biodiversity and ecosystem services. In compiling it, we have realised that whilst there is a wealth of information on this subject there is still much that we do not yet know or understand. In particular we found that evidence of the current scale of finance was barely available, as were estimates for the current financial needs for protecting global biodiversity and ecosystem services. To address these gaps we aim to build on the work of this study and encourage you to send us your feedback so that we can continue to develop this resource
© L
iving W
ater Intern
ational
15
CONTENTS UNDERSTANDING BIODIVERSITY
What is biodiversity?What is the Value of Natural Capital?The current Scale of Financing: Mind the gap
OVERARCHING FRAMEWORK
GENERATIONGeneration FrameworkGeneration Proposals
DELIVERYDelivery FrameworkDelivery Proposals
INSTITUTIONAL ARRANGEMENTSInstitutional Arrangements Institutional Arrangement Proposals
COMPARATIVE ANALYSISGenerationDeliveryInstitutional Arrangements
WHERE DO WE GO FROM HERE?
ANNEXESBibliographyList of Acronyms
15162022
31
374053
858899
115120131
143144150152
155
159160163
© L
iving W
ater Intern
ational
UNDERSTANDINGBIODIVERSITY
WHAT IS BIODIVERSITY?
Biodiversity in its broadest sense is the richness of life on earth. More specifically, though, biodiversity is defined under the Convention on Biological Diversity (CBD) as: ‘The variability among living organisms from all sources including, inter alia, terrestrial, marine and other aquatic ecosystems and the ecological complexes of which they are part; this includes diversity within species, between species and of ecosystems.’1
Biodiversity occurs at all levels - genetic, species, and ecosystem – and it is often best illustrated by considering the wide variety of plant, animal, and microorganism species that exist across the planet. To date, around 1.8 million different species have been discovered and documented, but this number only scratches the surface; estimates of the total number of species on earth and in the oceans range from 2 - 100 million, with a best working estimate of around 8 to 9 million different species alive on our planet (Vié et al., 2009).
UNDERSTANDING BIODIVERSITY, NATURAL CAPITAL AND ECOSYSTEMS SERVICES
In this publication we will refer to three concepts: natural capital, biodiversity and ecosystem services (ES). Since these terms are often used interchangeably (and incorrectly) they require explanation.
NATURAL CAPITAL In general terms, ‘capital’ is defined as the stock of materials or information that exists within a system at any given time (Costanza et al., 1997). Some common forms of capital are financial capital, man-made capital and social capital. The important concept within all forms of capital, however, is that when put to use they yield a flow of goods and/or services (Costanza and Daly, 1992); much as an investor will use financial capital to generate profits, a stock of trees or population or fish will provide a future flow of timber or food. A final distinction to draw is the difference between living natural capital and dead natural capital. Living natural capital is sustained by solar energy, and includes all ecosystems. It can be harvested for goods and also yield ecosystem services when properly maintained. Dead natural capital includes
1. The CBD uses the term biological diversity which for simplicity we will shorten to ‘biodiversity’ throughout this publication.
18
minerals and fossil fuels that do not provide any services other than their use, i.e. burning of fossil fuels for energy. For the purpose of this publication, natural capital will refer only to the stock of the earth’s living ecosystems.
ECOSYSTEM SERVICESLike man-made capital - such as a power station that provides electricity, or a water treatment facility that improves water quality - natural capital provides a vital flow of ecosystem goods and services. Ecosystem goods and services are functions of an ecosystem that directly or indirectly benefit human wellbeing (Daly and Farley, 2004, Voldoire and Royer, 2004) and play a vital role in livelihoods and economies from local to global scales (see page 18).
Ecosystem goods are portions of the natural capital itself - such as timber or fish - that are harvested from ecosystems. It is well documented that overharvesting of ecosystem goods will lead to a depletion in natural capital and ultimately an unsustainable supply of both ecosystem goods and services (Millennium Ecosystem Assessment, 2005). Ecosystem services are flows of services such as watershed protection or climate regulation that can be derived from natural capital. Unlike ecosystem goods, the use of ecosystem services does not necessarily affect the sustainability of these services into the future. For simplicity and following standard terminology we will refer to both ecosystem goods and ecosystem services as ecosystem services throughout this publication.
BIODIVERSITYThe diversity of species within ecosystems is key to the provision of vital ecosystem services; much as a financial investor might diversify their portfolio of assets, it is also important to maintain the biodiversity of our natural capital. There is a consensus among ecologists that, in general, biologically diverse ecosystems provide a greater flow of ecosystem services than non-diverse systems (Hooper et al., 2005, Flombaum and Sala, 2008). There is also strong evidence that more biologically diverse ecosystems are more resilient to changing physical environments. In the face of the impending impacts of climate change it will be vital to maintain biologically diverse ecosystems to ensure the reliable provision of ecosystem services from the world’s stocks of natural capital.
19
THE FOREST ECO-UTILITY
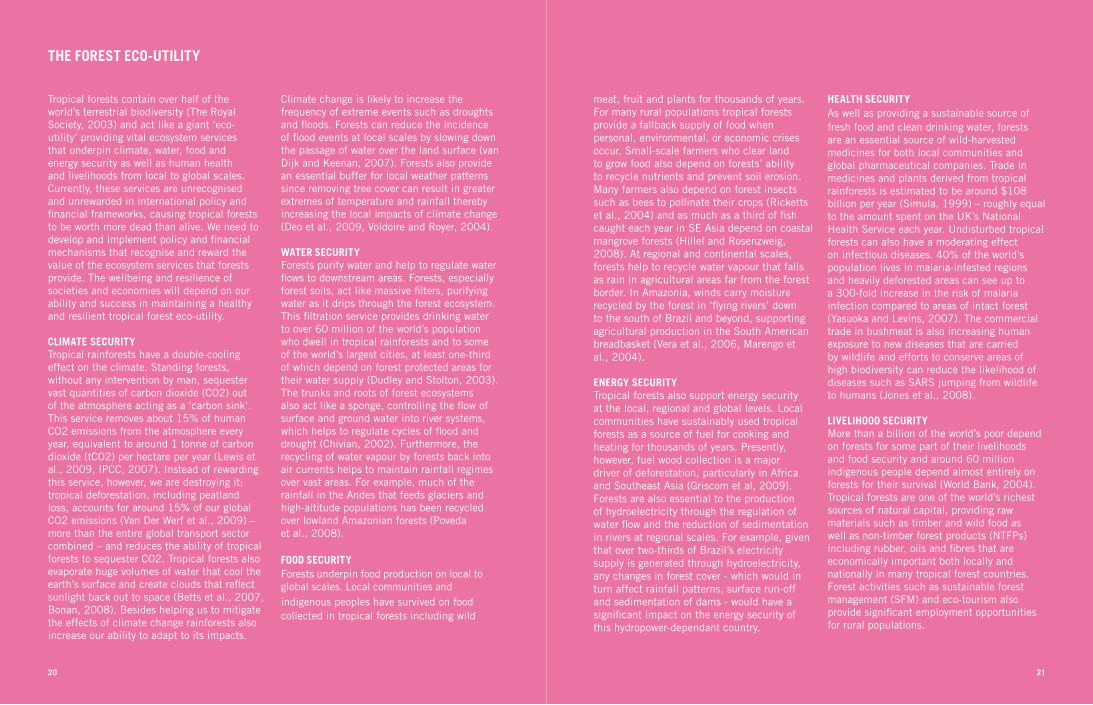
Tropical forests contain over half of the world’s terrestrial biodiversity (The Royal Society, 2003) and act like a giant ‘eco-utility’ providing vital ecosystem services that underpin climate, water, food and energy security as well as human health and livelihoods from local to global scales. Currently, these services are unrecognised and unrewarded in international policy and financial frameworks, causing tropical forests to be worth more dead than alive. We need to develop and implement policy and financial mechanisms that recognise and reward the value of the ecosystem services that forests provide. The wellbeing and resilience of societies and economies will depend on our ability and success in maintaining a healthy and resilient tropical forest eco-utility.
CLIMATE SECURITYTropical rainforests have a double-cooling effect on the climate. Standing forests, without any intervention by man, sequester vast quantities of carbon dioxide (CO2) out of the atmosphere acting as a ‘carbon sink’. This service removes about 15% of human CO2 emissions from the atmosphere every year, equivalent to around 1 tonne of carbon dioxide (tCO2) per hectare per year (Lewis et al., 2009, IPCC, 2007). Instead of rewarding this service, however, we are destroying it: tropical deforestation, including peatland loss, accounts for around 15% of our global CO2 emissions (Van Der Werf et al., 2009) – more than the entire global transport sector combined – and reduces the ability of tropical forests to sequester CO2. Tropical forests also evaporate huge volumes of water that cool the earth’s surface and create clouds that reflect sunlight back out to space (Betts et al., 2007, Bonan, 2008). Besides helping us to mitigate the effects of climate change rainforests also increase our ability to adapt to its impacts.
Climate change is likely to increase the frequency of extreme events such as droughts and floods. Forests can reduce the incidence of flood events at local scales by slowing down the passage of water over the land surface (van Dijk and Keenan, 2007). Forests also provide an essential buffer for local weather patterns since removing tree cover can result in greater extremes of temperature and rainfall thereby increasing the local impacts of climate change (Deo et al., 2009, Voldoire and Royer, 2004).
WATER SECURITYForests purify water and help to regulate water flows to downstream areas. Forests, especially forest soils, act like massive filters, purifying water as it drips through the forest ecosystem. This filtration service provides drinking water to over 60 million of the world’s population who dwell in tropical rainforests and to some of the world’s largest cities, at least one-third of which depend on forest protected areas for their water supply (Dudley and Stolton, 2003). The trunks and roots of forest ecosystems also act like a sponge, controlling the flow of surface and ground water into river systems, which helps to regulate cycles of flood and drought (Chivian, 2002). Furthermore, the recycling of water vapour by forests back into air currents helps to maintain rainfall regimes over vast areas. For example, much of the rainfall in the Andes that feeds glaciers and high-altitude populations has been recycled over lowland Amazonian forests (Poveda et al., 2008).
FOOD SECURITYForests underpin food production on local to global scales. Local communities and indigenous peoples have survived on food collected in tropical forests including wild
meat, fruit and plants for thousands of years. For many rural populations tropical forests provide a fallback supply of food when personal, environmental, or economic crises occur. Small-scale farmers who clear land to grow food also depend on forests’ ability to recycle nutrients and prevent soil erosion. Many farmers also depend on forest insects such as bees to pollinate their crops (Ricketts et al., 2004) and as much as a third of fish caught each year in SE Asia depend on coastal mangrove forests (Hillel and Rosenzweig, 2008). At regional and continental scales, forests help to recycle water vapour that falls as rain in agricultural areas far from the forest border. In Amazonia, winds carry moisture recycled by the forest in ‘flying rivers’ down to the south of Brazil and beyond, supporting agricultural production in the South American breadbasket (Vera et al., 2006, Marengo et al., 2004).
ENERGY SECURITYTropical forests also support energy security at the local, regional and global levels. Local communities have sustainably used tropical forests as a source of fuel for cooking and heating for thousands of years. Presently, however, fuel wood collection is a major driver of deforestation, particularly in Africa and Southeast Asia (Griscom et al, 2009). Forests are also essential to the production of hydroelectricity through the regulation of water flow and the reduction of sedimentation in rivers at regional scales. For example, given that over two-thirds of Brazil’s electricity supply is generated through hydroelectricity, any changes in forest cover - which would in turn affect rainfall patterns, surface run-off and sedimentation of dams - would have a significant impact on the energy security of this hydropower-dependant country.
HEALTH SECURITYAs well as providing a sustainable source of fresh food and clean drinking water, forests are an essential source of wild-harvested medicines for both local communities and global pharmaceutical companies. Trade in medicines and plants derived from tropical rainforests is estimated to be around $108 billion per year (Simula, 1999) – roughly equal to the amount spent on the UK’s National Health Service each year. Undisturbed tropical forests can also have a moderating effect on infectious diseases. 40% of the world’s population lives in malaria-infested regions and heavily deforested areas can see up to a 300-fold increase in the risk of malaria infection compared to areas of intact forest (Yasuoka and Levins, 2007). The commercial trade in bushmeat is also increasing human exposure to new diseases that are carried by wildlife and efforts to conserve areas of high biodiversity can reduce the likelihood of diseases such as SARS jumping from wildlife to humans (Jones et al., 2008).
LIVELIHOOD SECURITYMore than a billion of the world’s poor depend on forests for some part of their livelihoods and food security and around 60 million indigenous people depend almost entirely on forests for their survival (World Bank, 2004). Tropical forests are one of the world’s richest sources of natural capital, providing raw materials such as timber and wild food as well as non-timber forest products (NTFPs) including rubber, oils and fibres that are economically important both locally and nationally in many tropical forest countries. Forest activities such as sustainable forest management (SFM) and eco-tourism also provide significant employment opportunities for rural populations.
20 21
WHAT IS THE VALUE OF NATURAL CAPITAL?
Despite the importance of natural capital, humanity continues to destroy ecosystems at an alarming rate resulting in a substantial and largely irreversible loss in biodiversity (Sukhdev, 2008). Various estimates have been put forward for the value of natural capital and ecosystem services. Perhaps the most often quoted value is that put forward by Costanza et al. (1997), who estimated that the value of the world’s natural capital and ecosystem services was on average USD 33 trillion per year. Although this estimate was widely recognised (even by its critics) as an important catalyst for better understanding the value of nature, it received significant criticism for the approach and methods used (Toman, 1998; Pearce, 1998; Bockstael et al., 2000). Much of the criticism arose from the authors’ attempt to value the total global stock of natural capital.
More recently a study commissioned by the European Commission looked at the value of biodiversity loss due to not meeting the 2010 biodiversity target (Braat and ten Brink, 2007). The study conservatively estimated that the loss of ecosystem services and biodiversity is valued at around EUR 550 billion per annum and if biodiversity continues to be lost at the projected rate, the accumulated cost of ecosystem services lost since 2000 could grow to EUR 14 trillion in the year 2050.
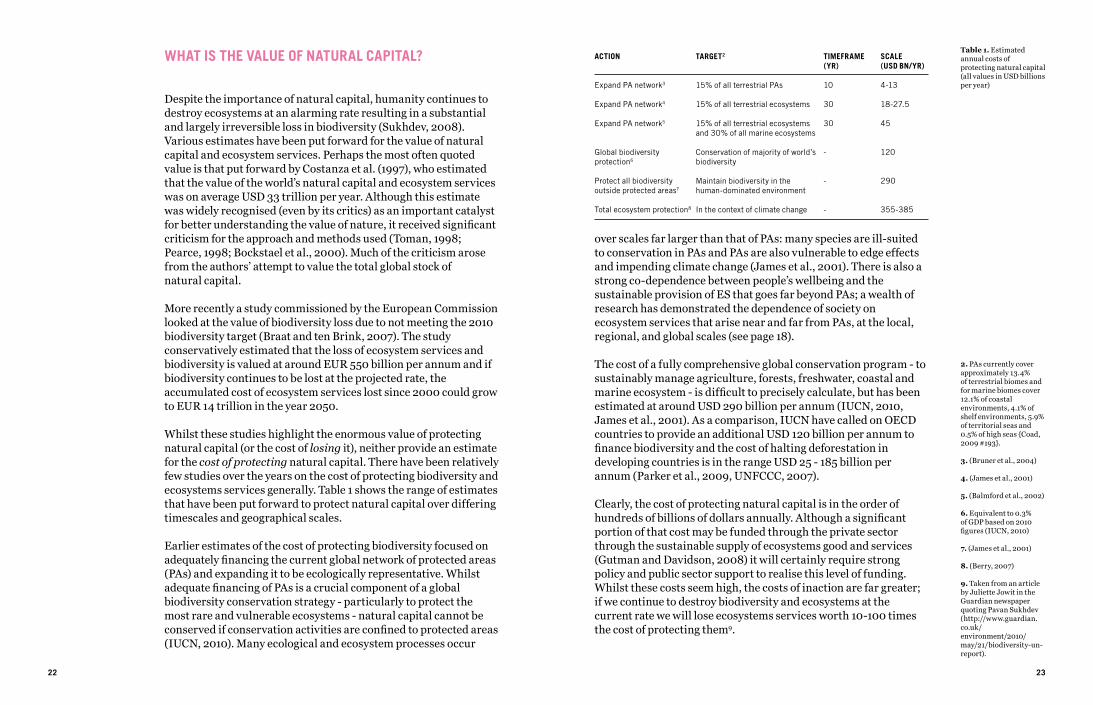
Whilst these studies highlight the enormous value of protecting natural capital (or the cost of losing it), neither provide an estimate for the cost of protecting natural capital. There have been relatively few studies over the years on the cost of protecting biodiversity and ecosystems services generally. Table 1 shows the range of estimates that have been put forward to protect natural capital over differing timescales and geographical scales.
Earlier estimates of the cost of protecting biodiversity focused on adequately financing the current global network of protected areas (PAs) and expanding it to be ecologically representative. Whilst adequate financing of PAs is a crucial component of a global biodiversity conservation strategy - particularly to protect the most rare and vulnerable ecosystems - natural capital cannot be conserved if conservation activities are confined to protected areas (IUCN, 2010). Many ecological and ecosystem processes occur
22
Table 1. Estimated annual costs of protecting natural capital (all values in USD billions per year)
2. PAs currently cover approximately 13.4% of terrestrial biomes and for marine biomes cover 12.1% of coastal environments, 4.1% of shelf environments, 5.9% of territorial seas and 0.5% of high seas {Coad, 2009 #193}.
3. (Bruner et al., 2004)
4. (James et al., 2001)
5. (Balmford et al., 2002)
6. Equivalent to 0.3% of GDP based on 2010 figures (IUCN, 2010)
7. (James et al., 2001)
8. (Berry, 2007)
9. Taken from an article by Juliette Jowit in the Guardian newspaper quoting Pavan Sukhdev (http://www.guardian.co.uk/environment/2010/may/21/biodiversity-un-report).
over scales far larger than that of PAs: many species are ill-suited to conservation in PAs and PAs are also vulnerable to edge effects and impending climate change (James et al., 2001). There is also a strong co-dependence between people’s wellbeing and the sustainable provision of ES that goes far beyond PAs; a wealth of research has demonstrated the dependence of society on ecosystem services that arise near and far from PAs, at the local, regional, and global scales (see page 18).
The cost of a fully comprehensive global conservation program - to sustainably manage agriculture, forests, freshwater, coastal and marine ecosystem - is difficult to precisely calculate, but has been estimated at around USD 290 billion per annum (IUCN, 2010, James et al., 2001). As a comparison, IUCN have called on OECD countries to provide an additional USD 120 billion per annum to finance biodiversity and the cost of halting deforestation in developing countries is in the range USD 25 - 185 billion per annum (Parker et al., 2009, UNFCCC, 2007).
Clearly, the cost of protecting natural capital is in the order of hundreds of billions of dollars annually. Although a significant portion of that cost may be funded through the private sector through the sustainable supply of ecosystems good and services (Gutman and Davidson, 2008) it will certainly require strong policy and public sector support to realise this level of funding. Whilst these costs seem high, the costs of inaction are far greater; if we continue to destroy biodiversity and ecosystems at the current rate we will lose ecosystems services worth 10-100 times the cost of protecting them9.
23
TARGET2
15% of all terrestrial PAs
15% of all terrestrial ecosystems
15% of all terrestrial ecosystems and 30% of all marine ecosystems
Conservation of majority of world’s biodiversity
Maintain biodiversity in the human-dominated environment
In the context of climate change
TIMEFRAME(YR)
10
30
30
-
-
-
SCALE (USD BN/YR)
4-13
18-27.5
45
120
290
355-385
ACTION
Expand PA network3
Expand PA network4
Expand PA network5
Global biodiversity protection6
Protect all biodiversity outside protected areas7
Total ecosystem protection8
THE CURRENT SCALE OF FINANCING: MIND THE GAP
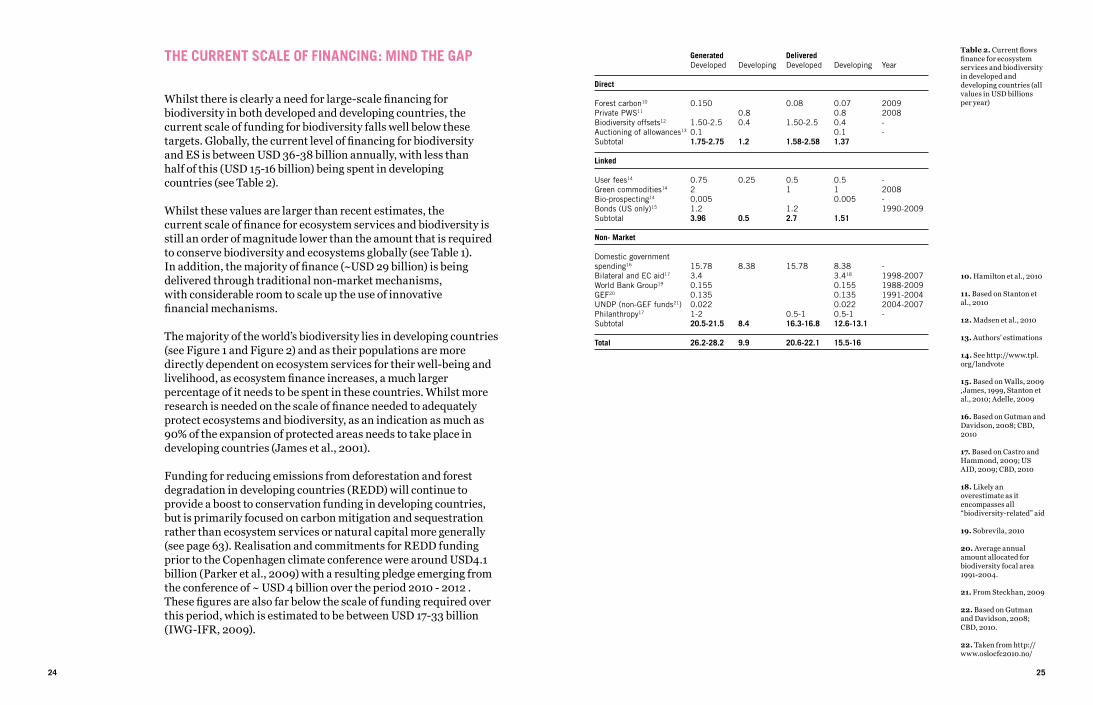
Whilst there is clearly a need for large-scale financing for biodiversity in both developed and developing countries, the current scale of funding for biodiversity falls well below these targets. Globally, the current level of financing for biodiversity and ES is between USD 36-38 billion annually, with less than half of this (USD 15-16 billion) being spent in developing countries (see Table 2).
Whilst these values are larger than recent estimates, the current scale of finance for ecosystem services and biodiversity is still an order of magnitude lower than the amount that is required to conserve biodiversity and ecosystems globally (see Table 1). In addition, the majority of finance (~USD 29 billion) is being delivered through traditional non-market mechanisms, with considerable room to scale up the use of innovative financial mechanisms.
The majority of the world’s biodiversity lies in developing countries (see Figure 1 and Figure 2) and as their populations are more directly dependent on ecosystem services for their well-being and livelihood, as ecosystem finance increases, a much larger percentage of it needs to be spent in these countries. Whilst more research is needed on the scale of finance needed to adequately protect ecosystems and biodiversity, as an indication as much as 90% of the expansion of protected areas needs to take place in developing countries (James et al., 2001).
Funding for reducing emissions from deforestation and forest degradation in developing countries (REDD) will continue to provide a boost to conservation funding in developing countries, but is primarily focused on carbon mitigation and sequestration rather than ecosystem services or natural capital more generally (see page 63). Realisation and commitments for REDD funding prior to the Copenhagen climate conference were around USD4.1 billion (Parker et al., 2009) with a resulting pledge emerging from the conference of ~ USD 4 billion over the period 2010 - 2012 . These figures are also far below the scale of funding required over this period, which is estimated to be between USD 17-33 billion (IWG-IFR, 2009).
24
10. Hamilton et al., 2010
11. Based on Stanton et al., 2010
12. Madsen et al., 2010
13. Authors’ estimations
14. See http://www.tpl.org/landvote
15. Based on Walls, 2009 ,James, 1999, Stanton et al., 2010; Adelle, 2009
16. Based on Gutman and Davidson, 2008; CBD, 2010
17. Based on Castro and Hammond, 2009; US AID, 2009; CBD, 2010
18. Likely an overestimate as it encompasses all “biodiversity-related” aid
19. Sobrevila, 2010
20. Average annual amount allocated for biodiversity focal area 1991-2004.
21. From Steckhan, 2009
22. Based on Gutman and Davidson, 2008; CBD, 2010.
22. Taken from http://www.oslocfc2010.no/
Generated Delivered Developed Developing Developed Developing Year
Direct
Forest carbon10 0.150 0.08 0.07 2009 Private PWS11 0.8 0.8 2008 Biodiversity offsets12 1.50-2.5 0.4 1.50-2.5 0.4 - Auctioning of allowances13 0.1 0.1 - Subtotal 1.75-2.75 1.2 1.58-2.58 1.37
Linked
User fees14 0.75 0.25 0.5 0.5 -Green commodities14 2 1 1 2008 Bio-prospecting14 0.005 0.005 - Bonds (US only)15 1.2 1.2 1990-2009Subtotal 3.96 0.5 2.7 1.51
Non- Market
Domestic government spending16 15.78 8.38 15.78 8.38 - Bilateral and EC aid17 3.4 3.418 1998-2007 World Bank Group19 0.155 0.155 1988-2009 GEF20 0.135 0.135 1991-2004 UNDP (non-GEF funds21) 0.022 0.022 2004-2007Philanthropy17 1-2 0.5-1 0.5-1 - Subtotal 20.5-21.5 8.4 16.3-16.8 12.6-13.1 Total 26.2-28.2 9.9 20.6-22.1 15.5-16
25
Table 2. Current flows finance for ecosystem services and biodiversity in developed and developing countries (all values in USD billions per year)
WHAT ARE PAYMENTS FOR ECOSYSTEM SERVICES (PES)?
The basic idea behind payments for ecosystem services (PES) is that those who provide ecosystem services should be compensated for the cost of doing so. In contrast, the current economic system only rewards the conversion of ecosystems for alternative land uses, thereby reducing the flow of valuable services these ecosystems provide. Payments for ecosystems services were developed to incentivize land users to properly manage and conserve their natural environment thus ensuring the flow of ecosystem services (Pagiola and Platais, 2002).
TRADITIONAL PESPES were defined by Wunder (2005) as: A voluntary transaction where a well-defined ES is being bought by an ES buyer from an ES provider if and only if the ES provider secures ES provision (conditionality). In reality, however, a true PES scheme is hard to find (Muradian et al., 2009); regulatory (as opposed to voluntary) conservation policies are being more commonly considered as PES, and payments for biodiversity or ecosystem services are no longer limited to purely direct financial incentives, but can be indirect or non-financial incentives. Furthermore, ecosystem services are often not well defined; conservation of habitat is considered a proxy for ecosystem services provision and there is often little differentiation between payments for ES and payments for biodiversity.
REDEFINING PESWith such a rapid proliferation of PES and PES-like schemes over the past 10-15 years, the term “PES” has been
stretched to suit various purposes. It is now often used to describe markets, rather than payments for ecosystem services, or for programmes that place more focus on social, rather than environmental, outcomes. New definitions of PES have therefore emerged to match theory to practice (Pascual et al., 2010). The general re-conceptualisation of PES recognises the reality that PES schemes are often used as policy tools with multiple objectives, and implies an alternative conceptual framework for PES as a type of common-pool resource management regime. In this case, PES are not a single type of policy, but a spectrum of arrangements with varying degrees of commodification of ecosystem services, differing importance of financial incentives, and a range of indirect and direct transfers of incentives (Muradian et al., 2010).
PES IN THE LITTLE BIODIVERSITY FINANCE BOOKNo matter how PES are defined, it is important to understand how PES will operate as a financial mechanism for biodiversity conservation and ecosystem service provision. PES schemes - as with all financial mechanisms - will require a way to generate revenue, a form of institutional arrangement to transfer and manage these funds and a mechanism to deliver finance (see Figure 3). The term ‘PES’, however, is often used to describe all three parts of a financing mechanism, when it more precisely refers to the payment or incentive used as a delivery mechanism. For example, Costa Rica’s national programme generated revenue from a variety of mechanisms
including a tax, managed funds through a central national institution, and delivered finance through conditional, financial incentives. The national programme incorporates all three components, but the actual payments for ecosystem services are only the final, delivery component of this overall process.
For simplicity, this book uses the term PES sparingly. Under the revenue generation section, ‘PES’ refers to
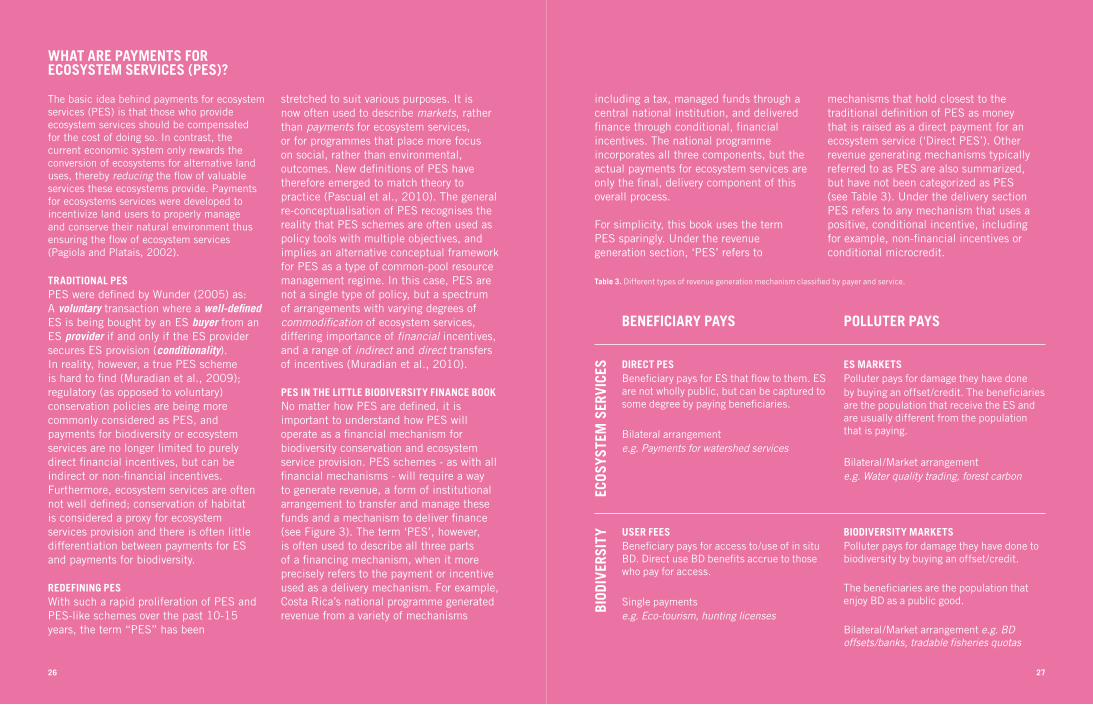
mechanisms that hold closest to the traditional definition of PES as money that is raised as a direct payment for an ecosystem service (‘Direct PES’). Other revenue generating mechanisms typically referred to as PES are also summarized, but have not been categorized as PES (see Table 3). Under the delivery section PES refers to any mechanism that uses a positive, conditional incentive, including for example, non-financial incentives or conditional microcredit.
Table 3. Different types of revenue generation mechanism classified by payer and service.
BENEFICIARY PAYS
DIRECT PESBeneficiary pays for ES that flow to them. ES are not wholly public, but can be captured to some degree by paying beneficiaries.
Bilateral arrangemente.g. Payments for watershed services
USER FEESBeneficiary pays for access to/use of in situ BD. Direct use BD benefits accrue to those who pay for access.
Single paymentse.g. Eco-tourism, hunting licenses
POLLUTER PAYS
ES MARKETSPolluter pays for damage they have done by buying an offset/credit. The beneficiaries are the population that receive the ES and are usually different from the population that is paying.
Bilateral/Market arrangement e.g. Water quality trading, forest carbon
BIODIVERSITY MARKETSPolluter pays for damage they have done to biodiversity by buying an offset/credit.
The beneficiaries are the population that enjoy BD as a public good.
Bilateral/Market arrangement e.g. BD offsets/banks, tradable fisheries quotas
ECOS
YSTE
M S
ERVI
CES
BIOD
IVER
SITY
26 27
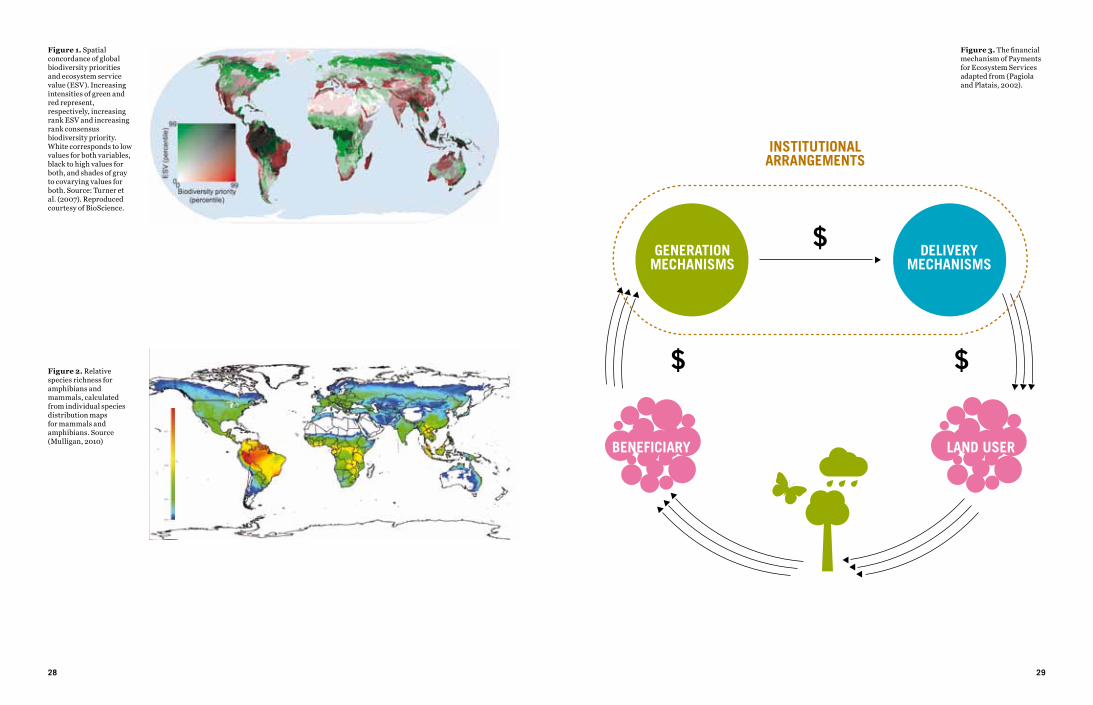
Figure 3. The financial mechanism of Payments for Ecosystem Services adapted from (Pagiola and Platais, 2002).
Figure 1. Spatial concordance of global biodiversity priorities and ecosystem service value (ESV). Increasing intensities of green and red represent, respectively, increasing rank ESV and increasing rank consensus biodiversity priority. White corresponds to low values for both variables, black to high values for both, and shades of gray to covarying values for both. Source: Turner et al. (2007). Reproduced courtesy of BioScience.
Figure 2. Relative species richness for amphibians and mammals, calculated from individual species distribution maps for mammals and amphibians. Source (Mulligan, 2010)
28 29
24. tated in the preamble to the Convention (http://www.cbd.int/convention/articles.shtml?a=cbd-00).
25. From Article 20 of the Convention (http://www.cbd.int/convention/articles.shtml?a=cbd-20)
30 31
THE STORY SO FAR...The Convention on Biological Diversity (CBD) is a global, legally binding treaty for the conservation and sustainable use of biodiversity. The CBD was established in 1992 at the UN Conference on Environment and Development, also known as the ‘Earth Summit’ held in Rio de Janeiro. The CBD is one of the three “Rio Conventions” along with the UN Framework Convention on Climate Change (UNFCCC) and the UN Convention to Combat Desertification (UNCCD).
The CBD came into force at the end of 1993, and has three main objectives:
• The conservation of biodiversity, • The sustainable use of its components, and • The fair and equitable sharing of benefits arising out of the utilization of genetic resources.
With regards to finance the Convention acknowledges that:“the provision of new and additional financial resources and appropriate access to relevant technologies can be expected to make a substantial difference in the world‘s ability to address the loss of biological diversity”
and that “special provision is required to meet the needs of developing countries” 24.
Article 20 of the Convention specifically requests each Party to:“provide, in accordance with its capabilities, financial support and incentives in respect of those national activities which are intended to achieve the objectives of this Convention, in accordance with its national plans, priorities and programmes”
And developed country Parties are also required to:“provide new and additional financial resources to enable developing country Parties to meet the agreed full incremental costs to them of implementing measures which fulfil the obligations of this Convention”25 .
Since the Convention entered into force, its Conference of the Parties (COP) has expressed in a multitude of decisions the urgent need for adequate financing for biodiversity. At COP 9 in Bonn in
2008, the Parties reviewed the availability of financial resources and expressed concern that the lack of resources continued to be one of the main obstacles to achieving the Convention’s objectives as well as realising the Millennium Development Goals (MDGs). At the same meeting, the Parties provided guidance to the Global Environment Facility (GEF), the Convention’s sole financial mechanism, adopting a four-year outcome-oriented framework of programme priorities related to the utilization of GEF funds for the fifth replenishment period 2011-201426. At COP 9 the Parties also adopted a strategy for resource mobilisation to significantly enhance international financial flows and domestic funding for biological diversity with the goal of achieving a substantial reduction in the current funding gaps for biodiversity27. The strategy for resource mobilisation contained the specific goal of exploring “new and innovative financial mechanisms at all levels with a view to increasing funding to support the three objectives of the Convention”28 .
In support of the strategy for resource mobilization, COP 10 is expected to encourage Parties to implement the strategy for resource mobilisation at the national level and to take an active part in ongoing processes to enhance innovative financial mechanisms for biodiversity. COP 10 will also engage Parties in a global discussion on the need and possible modalities of innovative financing mechanisms for biodiversity and ES.
26. The four year programme of the GEF was adopted in Decision IX/31
27. The strategy for resource mobilization is annexed to decision IX/11 (http://www.cbd.int/decision/cop/?id=11654).
28. Goal 4 of Decision IX/11.
THE OVERARCHING FRAMEWORK
THE BUILDING BLOCKS
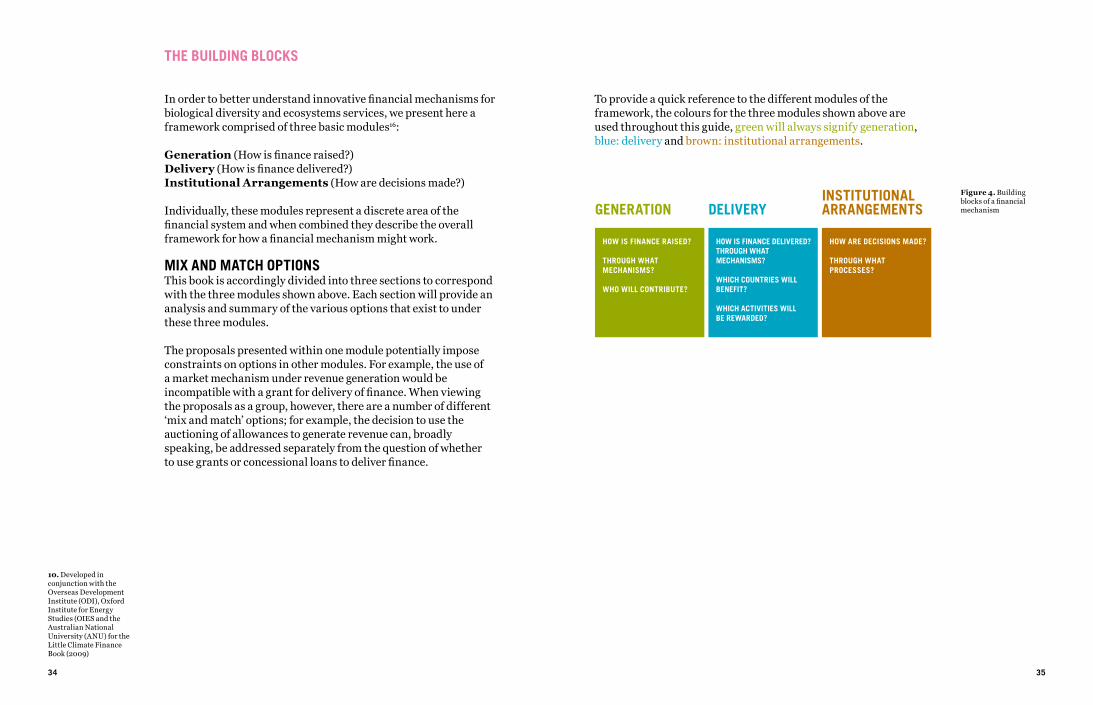
In order to better understand innovative financial mechanisms for biological diversity and ecosystems services, we present here a framework comprised of three basic modules16:
Generation (How is finance raised?)Delivery (How is finance delivered?)Institutional Arrangements (How are decisions made?)
Individually, these modules represent a discrete area of the financial system and when combined they describe the overall framework for how a financial mechanism might work.
MIX AND MATCH OPTIONSThis book is accordingly divided into three sections to correspond with the three modules shown above. Each section will provide an analysis and summary of the various options that exist to under these three modules.
The proposals presented within one module potentially impose constraints on options in other modules. For example, the use of a market mechanism under revenue generation would be incompatible with a grant for delivery of finance. When viewing the proposals as a group, however, there are a number of different ‘mix and match’ options; for example, the decision to use the auctioning of allowances to generate revenue can, broadly speaking, be addressed separately from the question of whether to use grants or concessional loans to deliver finance.
10. Developed in conjunction with the Overseas Development Institute (ODI), Oxford Institute for Energy Studies (OIES and the Australian National University (ANU) for the Little Climate Finance Book (2009)
34
To provide a quick reference to the different modules of the framework, the colours for the three modules shown above are used throughout this guide, green will always signify generation, blue: delivery and brown: institutional arrangements.
35
Figure 4. Building blocks of a financial mechanism
INSTITUTIONALARRANGEMENTS
HOW ARE DECISIONS MADE? THROUGH WHAT PROCESSES?
HOW IS FINANCE RAISED? THROUGH WHAT MECHANISMS? WHO WILL CONTRIBUTE?
GENERATION DELIVERY
HOW IS FINANCE DELIVERED?THROUGH WHAT MECHANISMS?
WHICH COUNTRIES WILL BENEFIT?
WHICH ACTIVITIES WILL BE REWARDED?

36 37
© T
om Sw
ain

GENERATION
41
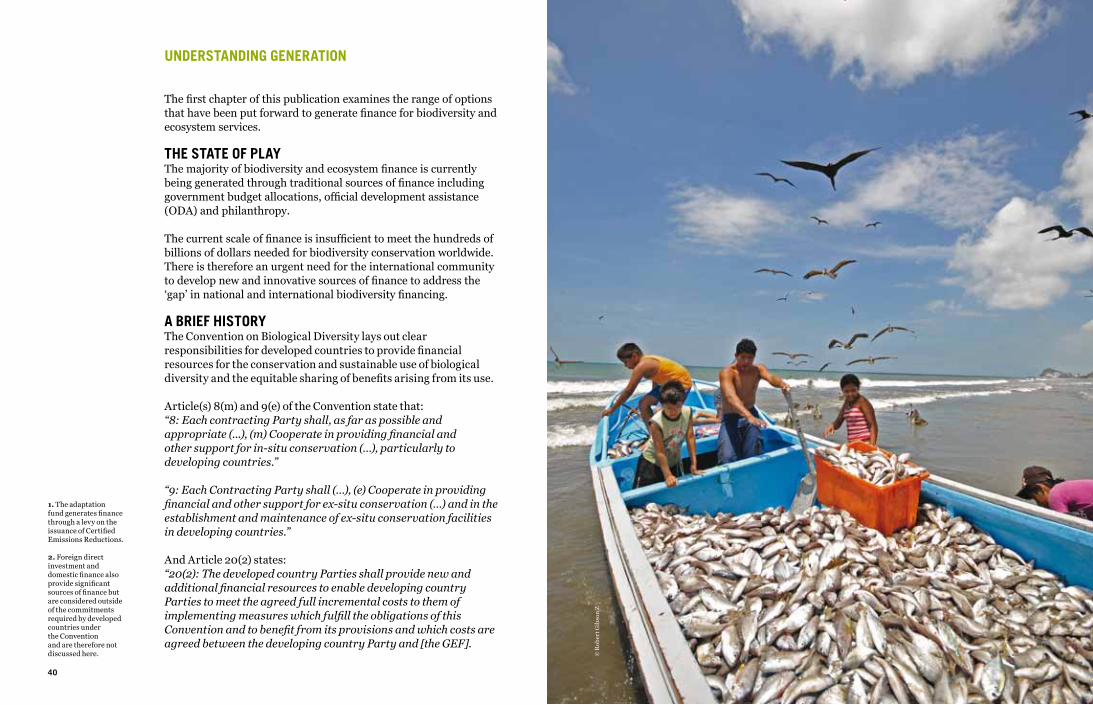
UNDERSTANDING GENERATION
The first chapter of this publication examines the range of options that have been put forward to generate finance for biodiversity and ecosystem services.
THE STATE OF PLAYThe majority of biodiversity and ecosystem finance is currently being generated through traditional sources of finance including government budget allocations, official development assistance (ODA) and philanthropy.
The current scale of finance is insufficient to meet the hundreds of billions of dollars needed for biodiversity conservation worldwide. There is therefore an urgent need for the international community to develop new and innovative sources of finance to address the ‘gap’ in national and international biodiversity financing.
A BRIEF HISTORYThe Convention on Biological Diversity lays out clear responsibilities for developed countries to provide financial resources for the conservation and sustainable use of biological diversity and the equitable sharing of benefits arising from its use.
Article(s) 8(m) and 9(e) of the Convention state that: “8: Each contracting Party shall, as far as possible and appropriate (...), (m) Cooperate in providing financial and other support for in-situ conservation (…), particularly to developing countries.”
“9: Each Contracting Party shall (…), (e) Cooperate in providing financial and other support for ex-situ conservation (…) and in the establishment and maintenance of ex-situ conservation facilities in developing countries.”
And Article 20(2) states:“20(2): The developed country Parties shall provide new and additional financial resources to enable developing country Parties to meet the agreed full incremental costs to them of implementing measures which fulfill the obligations of this Convention and to benefit from its provisions and which costs are agreed between the developing country Party and [the GEF].
1. The adaptation fund generates finance through a levy on the issuance of Certified Emissions Reductions. 2. Foreign direct investment and domestic finance also provide significant sources of finance but are considered outside of the commitments required by developed countries under the Convention and are therefore not discussed here.
40
© R
ober
t Gib
son
Z
GENERATION FRAMEWORK
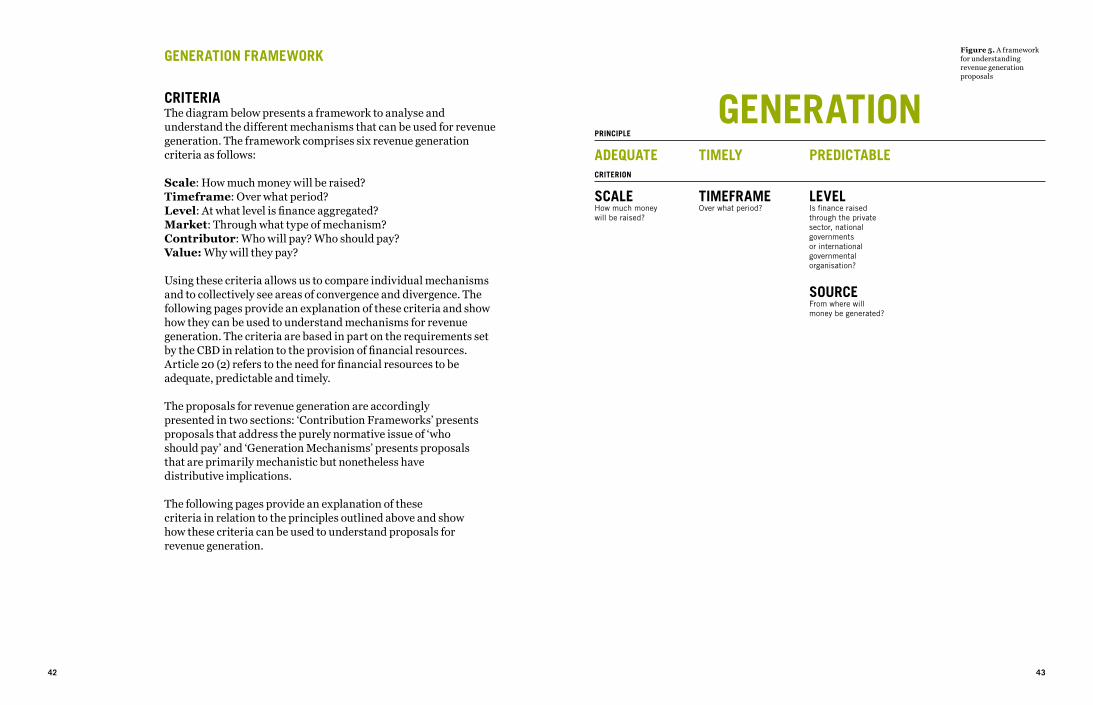
CRITERIAThe diagram below presents a framework to analyse and understand the different mechanisms that can be used for revenue generation. The framework comprises six revenue generation criteria as follows:
Scale: How much money will be raised?Timeframe: Over what period?Level: At what level is finance aggregated? Market: Through what type of mechanism? Contributor: Who will pay? Who should pay?Value: Why will they pay?
Using these criteria allows us to compare individual mechanisms and to collectively see areas of convergence and divergence. The following pages provide an explanation of these criteria and show how they can be used to understand mechanisms for revenue generation. The criteria are based in part on the requirements set by the CBD in relation to the provision of financial resources. Article 20 (2) refers to the need for financial resources to be adequate, predictable and timely.
The proposals for revenue generation are accordingly presented in two sections: ‘Contribution Frameworks’ presents proposals that address the purely normative issue of ‘who should pay’ and ‘Generation Mechanisms’ presents proposals that are primarily mechanistic but nonetheless have distributive implications.
The following pages provide an explanation of these criteria in relation to the principles outlined above and show how these criteria can be used to understand proposals for revenue generation.
Figure 5. A framework for understanding revenue generation proposals
4342
ADEQUATE
SCALEHow much money will be raised?
PRINCIPLE
CRITERION
PREDICTABLE
LEVELIs finance raised through the private sector, national governments or international governmental organisation?
SOURCEFrom where will money be generated?
TIMELY
TIMEFRAMEOver what period?
GENERATION
SCALE
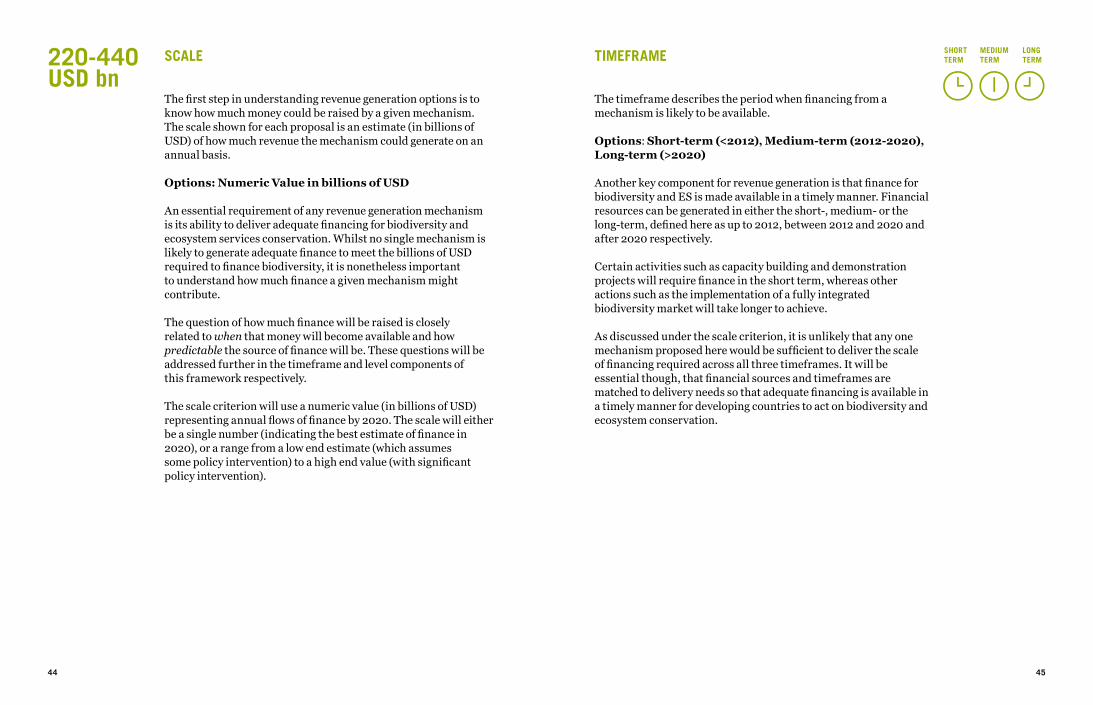
The first step in understanding revenue generation options is to know how much money could be raised by a given mechanism. The scale shown for each proposal is an estimate (in billions of USD) of how much revenue the mechanism could generate on an annual basis.
Options: Numeric Value in billions of USD An essential requirement of any revenue generation mechanism is its ability to deliver adequate financing for biodiversity and ecosystem services conservation. Whilst no single mechanism is likely to generate adequate finance to meet the billions of USD required to finance biodiversity, it is nonetheless important to understand how much finance a given mechanism might contribute.
The question of how much finance will be raised is closely related to when that money will become available and how predictable the source of finance will be. These questions will be addressed further in the timeframe and level components of this framework respectively.
The scale criterion will use a numeric value (in billions of USD) representing annual flows of finance by 2020. The scale will either be a single number (indicating the best estimate of finance in 2020), or a range from a low end estimate (which assumes some policy intervention) to a high end value (with significant policy intervention).
44 45
220-440USD bn
SHORT MEDIUM LONG TERM TERM TERMTIMEFRAME
The timeframe describes the period when financing from a mechanism is likely to be available.
Options: Short-term (<2012), Medium-term (2012-2020), Long-term (>2020)
Another key component for revenue generation is that finance for biodiversity and ES is made available in a timely manner. Financial resources can be generated in either the short-, medium- or the long-term, defined here as up to 2012, between 2012 and 2020 and after 2020 respectively.
Certain activities such as capacity building and demonstration projects will require finance in the short term, whereas other actions such as the implementation of a fully integrated biodiversity market will take longer to achieve.
As discussed under the scale criterion, it is unlikely that any one mechanism proposed here would be sufficient to deliver the scale of financing required across all three timeframes. It will be essential though, that financial sources and timeframes are matched to delivery needs so that adequate financing is available in a timely manner for developing countries to act on biodiversity and ecosystem conservation.
46
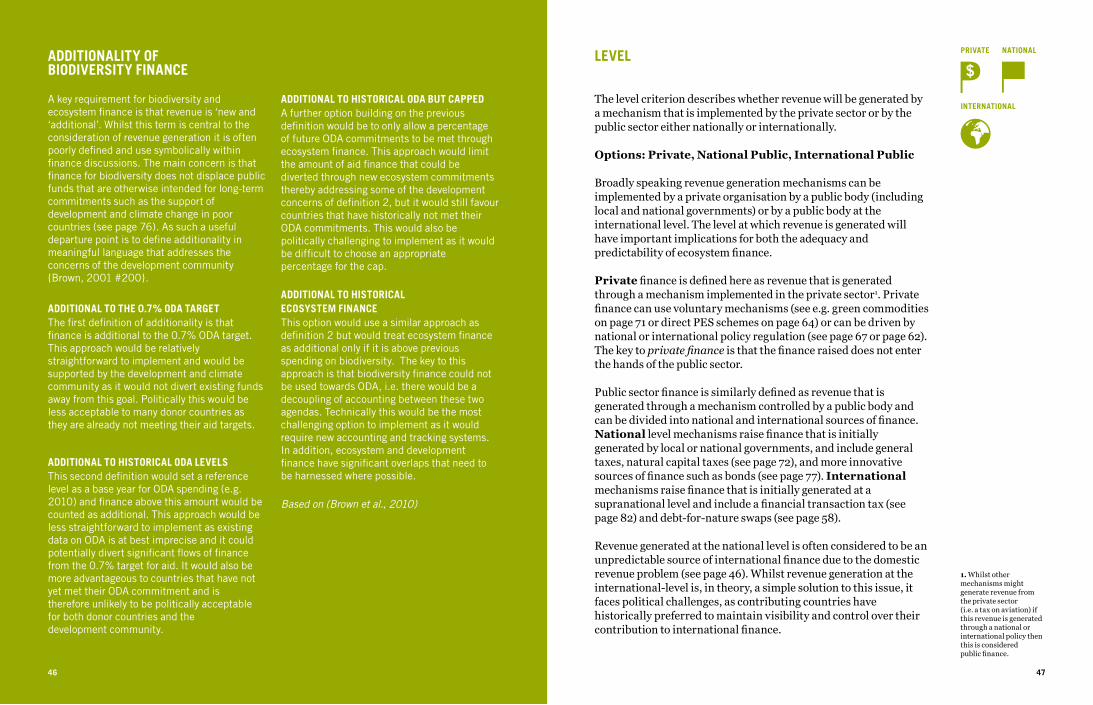
LEVEL
The level criterion describes whether revenue will be generated by a mechanism that is implemented by the private sector or by the public sector either nationally or internationally.
Options: Private, National Public, International Public
Broadly speaking revenue generation mechanisms can be implemented by a private organisation by a public body (including local and national governments) or by a public body at the international level. The level at which revenue is generated will have important implications for both the adequacy and predictability of ecosystem finance.
Private finance is defined here as revenue that is generated through a mechanism implemented in the private sector1. Private finance can use voluntary mechanisms (see e.g. green commodities on page 71 or direct PES schemes on page 64) or can be driven by national or international policy regulation (see page 67 or page 62). The key to private finance is that the finance raised does not enter the hands of the public sector.
Public sector finance is similarly defined as revenue that is generated through a mechanism controlled by a public body and can be divided into national and international sources of finance. National level mechanisms raise finance that is initially generated by local or national governments, and include general taxes, natural capital taxes (see page 72), and more innovative sources of finance such as bonds (see page 77). International mechanisms raise finance that is initially generated at a supranational level and include a financial transaction tax (see page 82) and debt-for-nature swaps (see page 58).
Revenue generated at the national level is often considered to be an unpredictable source of international finance due to the domestic revenue problem (see page 46). Whilst revenue generation at the international-level is, in theory, a simple solution to this issue, it faces political challenges, as contributing countries have historically preferred to maintain visibility and control over their contribution to international finance.
47
ADDITIONALITY OF BIODIVERSITY FINANCE
A key requirement for biodiversity and ecosystem finance is that revenue is ‘new and ‘additional’. Whilst this term is central to the consideration of revenue generation it is often poorly defined and use symbolically within finance discussions. The main concern is that finance for biodiversity does not displace public funds that are otherwise intended for long-term commitments such as the support of development and climate change in poor countries (see page 76). As such a useful departure point is to define additionality in meaningful language that addresses the concerns of the development community {Brown, 2001 #200}.
ADDITIONAL TO THE 0.7% ODA TARGETThe first definition of additionality is that finance is additional to the 0.7% ODA target. This approach would be relatively straightforward to implement and would be supported by the development and climate community as it would not divert existing funds away from this goal. Politically this would be less acceptable to many donor countries as they are already not meeting their aid targets.
ADDITIONAL TO HISTORICAL ODA LEVELSThis second definition would set a reference level as a base year for ODA spending (e.g. 2010) and finance above this amount would be counted as additional. This approach would be less straightforward to implement as existing data on ODA is at best imprecise and it could potentially divert significant flows of finance from the 0.7% target for aid. It would also be more advantageous to countries that have not yet met their ODA commitment and is therefore unlikely to be politically acceptable for both donor countries and the development community.
ADDITIONAL TO HISTORICAL ODA BUT CAPPEDA further option building on the previous definition would be to only allow a percentage of future ODA commitments to be met through ecosystem finance. This approach would limit the amount of aid finance that could be diverted through new ecosystem commitments thereby addressing some of the development concerns of definition 2, but it would still favour countries that have historically not met their ODA commitments. This would also be politically challenging to implement as it would be difficult to choose an appropriate percentage for the cap.
ADDITIONAL TO HISTORICAL ECOSYSTEM FINANCEThis option would use a similar approach as definition 2 but would treat ecosystem finance as additional only if it is above previous spending on biodiversity. The key to this approach is that biodiversity finance could not be used towards ODA, i.e. there would be a decoupling of accounting between these two agendas. Technically this would be the most challenging option to implement as it would require new accounting and tracking systems. In addition, ecosystem and development finance have significant overlaps that need to be harnessed where possible.
Based on (Brown et al., 2010)
46
1. Whilst other mechanisms might generate revenue from the private sector (i.e. a tax on aviation) if this revenue is generated through a national or international policy then this is considered public finance.
NATIONALPRIVATE
INTERNATIONAL
48 4948
REVENUE CAPTURE AND THE DOMESTIC REVENUE PROBLEM
Ecosystem finance faces two key challenges when revenue is raised through national government mechanisms. The first is often referred to as revenue capture, which occurs when national governments use revenue that is generated from ecosystem finance mechanisms for other policy priorities.
Development agencies and national governments have traditionally discouraged earmarking government revenues because it reduces flexibility in the use of domestic revenue. Whilst this argument is relevant for general taxes and levies that indiscriminately raise finance (as discussed under the “payer” criterion, see page 48), it is less applicable to mechanisms that are directly linked to ecosystem use; earmarking revenues raised through environmental mechanisms for environmental purposes can have significant political and economic advantages (OECD 2005). For example, polluter-pays mechanisms, such as a natural capital tax (see 65) or the national auctioning of allowances (see 64), can receive increased political and public acceptance if they are being used explicitly to finance sustainable development activities. Similarly revenue generated through beneficiary-pays mechanisms such as direct PES (see 58) should be used to ensure the continued provision of those ecosystem services being paid for.
The second issue for ecosystem finance is a variation of political capture known as the domestic revenue problem. The domestic revenue problem arises when money that is intended for international purposes enters national-level budgets. Due largely to the competing concerns of other national interests, domestic revenue is less likely to be transferred
to international causes as it is seen to be nationally owned (Doornbosch and Knight 2008; Müller 2008). Although governments can set aside revenue that is generated nationally for international purposes, this funding is still unpredictable as both national policies and national circumstances can change.
A potential solution to these problems is to use off-budget funding streams (Müller and Gomez-Echeverri 2009). Keeping revenue that is intended for public use off-budget makes it relatively simple later on for governments to disburse this revenue for its intended use. Another partial solution to the issue of political capture is to implement mechanisms through the private sector or intergovernmental organisations. Since these financing streams are outside the direct hands of national governments they are also less likely to be re-appropriated. Government action is still required, however, to ensure that private-sector mechanisms are effective (e.g. certification standards for green commodities) and international mechanisms must consider other pressing international issues in the allocation of their finance (see page 79).
48
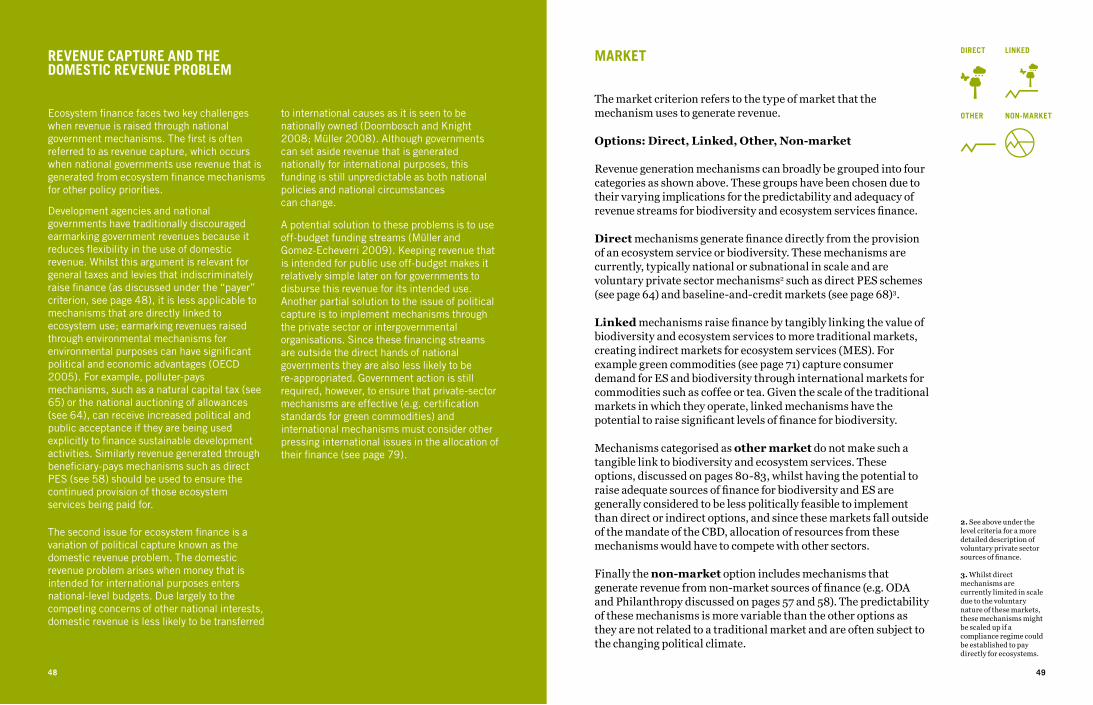
MARKET
The market criterion refers to the type of market that the mechanism uses to generate revenue.
Options: Direct, Linked, Other, Non-market
Revenue generation mechanisms can broadly be grouped into four categories as shown above. These groups have been chosen due to their varying implications for the predictability and adequacy of revenue streams for biodiversity and ecosystem services finance.
Direct mechanisms generate finance directly from the provision of an ecosystem service or biodiversity. These mechanisms are currently, typically national or subnational in scale and are voluntary private sector mechanisms2 such as direct PES schemes (see page 64) and baseline-and-credit markets (see page 68)3.
Linked mechanisms raise finance by tangibly linking the value of biodiversity and ecosystem services to more traditional markets, creating indirect markets for ecosystem services (MES). For example green commodities (see page 71) capture consumer demand for ES and biodiversity through international markets for commodities such as coffee or tea. Given the scale of the traditional markets in which they operate, linked mechanisms have the potential to raise significant levels of finance for biodiversity.
Mechanisms categorised as other market do not make such a tangible link to biodiversity and ecosystem services. These options, discussed on pages 80-83, whilst having the potential to raise adequate sources of finance for biodiversity and ES are generally considered to be less politically feasible to implement than direct or indirect options, and since these markets fall outside of the mandate of the CBD, allocation of resources from these mechanisms would have to compete with other sectors.
Finally the non-market option includes mechanisms that generate revenue from non-market sources of finance (e.g. ODA and Philanthropy discussed on pages 57 and 58). The predictability of these mechanisms is more variable than the other options as they are not related to a traditional market and are often subject to the changing political climate.
DIRECT
OTHER
LINKED
NON-MARKET
2. See above under the level criteria for a more detailed description of voluntary private sector sources of finance.
3. Whilst direct mechanisms are currently limited in scale due to the voluntary nature of these markets, these mechanisms might be scaled up if a compliance regime could be established to pay directly for ecosystems.
50 51
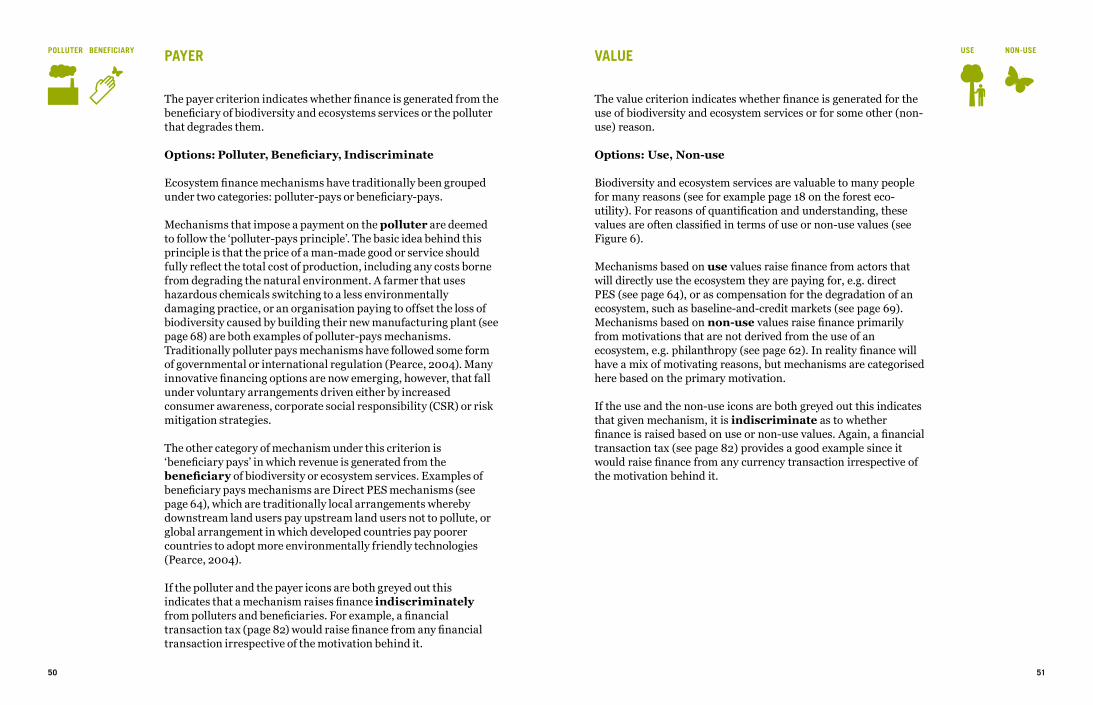
PAYER
The payer criterion indicates whether finance is generated from the beneficiary of biodiversity and ecosystems services or the polluter that degrades them.
Options: Polluter, Beneficiary, Indiscriminate
Ecosystem finance mechanisms have traditionally been grouped under two categories: polluter-pays or beneficiary-pays.
Mechanisms that impose a payment on the polluter are deemed to follow the ‘polluter-pays principle’. The basic idea behind this principle is that the price of a man-made good or service should fully reflect the total cost of production, including any costs borne from degrading the natural environment. A farmer that uses hazardous chemicals switching to a less environmentally damaging practice, or an organisation paying to offset the loss of biodiversity caused by building their new manufacturing plant (see page 68) are both examples of polluter-pays mechanisms. Traditionally polluter pays mechanisms have followed some form of governmental or international regulation (Pearce, 2004). Many innovative financing options are now emerging, however, that fall under voluntary arrangements driven either by increased consumer awareness, corporate social responsibility (CSR) or risk mitigation strategies.
The other category of mechanism under this criterion is ‘beneficiary pays’ in which revenue is generated from the beneficiary of biodiversity or ecosystem services. Examples of beneficiary pays mechanisms are Direct PES mechanisms (see page 64), which are traditionally local arrangements whereby downstream land users pay upstream land users not to pollute, or global arrangement in which developed countries pay poorer countries to adopt more environmentally friendly technologies (Pearce, 2004).
If the polluter and the payer icons are both greyed out this indicates that a mechanism raises finance indiscriminately from polluters and beneficiaries. For example, a financial transaction tax (page 82) would raise finance from any financial transaction irrespective of the motivation behind it.
VALUE
The value criterion indicates whether finance is generated for the use of biodiversity and ecosystem services or for some other (non-use) reason.
Options: Use, Non-use
Biodiversity and ecosystem services are valuable to many people for many reasons (see for example page 18 on the forest eco-utility). For reasons of quantification and understanding, these values are often classified in terms of use or non-use values (see Figure 6).
Mechanisms based on use values raise finance from actors that will directly use the ecosystem they are paying for, e.g. direct PES (see page 64), or as compensation for the degradation of an ecosystem, such as baseline-and-credit markets (see page 69). Mechanisms based on non-use values raise finance primarily from motivations that are not derived from the use of an ecosystem, e.g. philanthropy (see page 62). In reality finance will have a mix of motivating reasons, but mechanisms are categorised here based on the primary motivation.
If the use and the non-use icons are both greyed out this indicates that given mechanism, it is indiscriminate as to whether finance is raised based on use or non-use values. Again, a financial transaction tax (see page 82) provides a good example since it would raise finance from any currency transaction irrespective of the motivation behind it.
BENEFICIARYPOLLUTER USE NON-USE
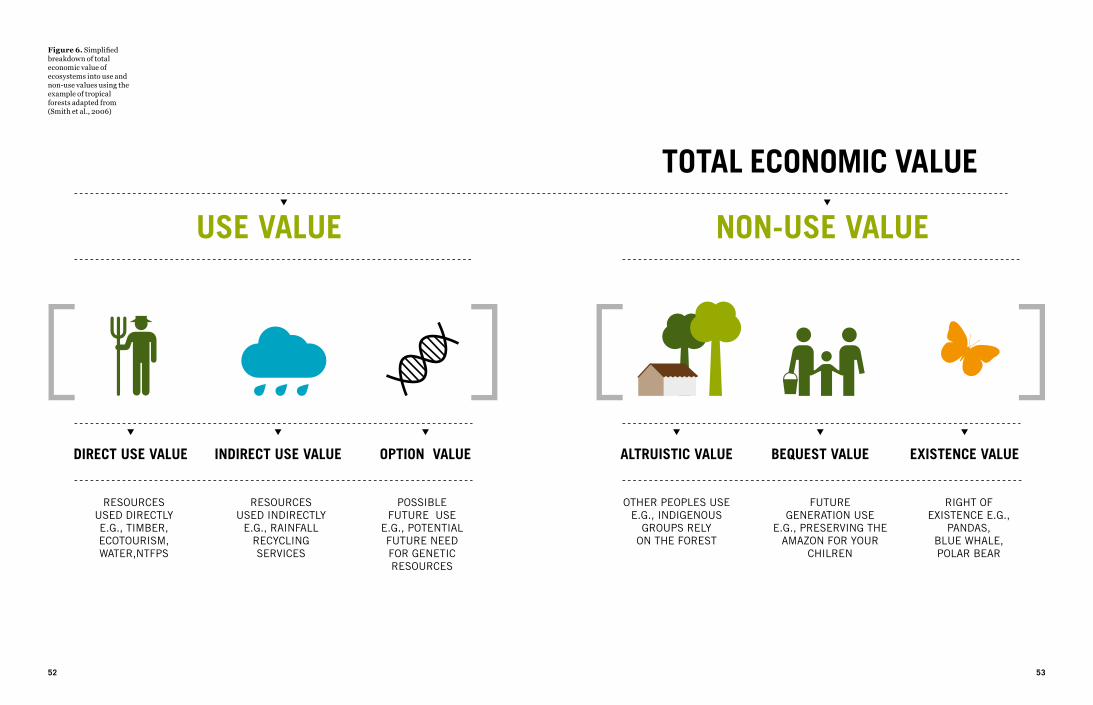
Figure 6. Simplified breakdown of total economic value of ecosystems into use and non-use values using the example of tropical forests adapted from (Smith et al., 2006)
TOTAL ECONOMIC VALUE
52 53
54 55
GENERATION PROPOSALS
56 57
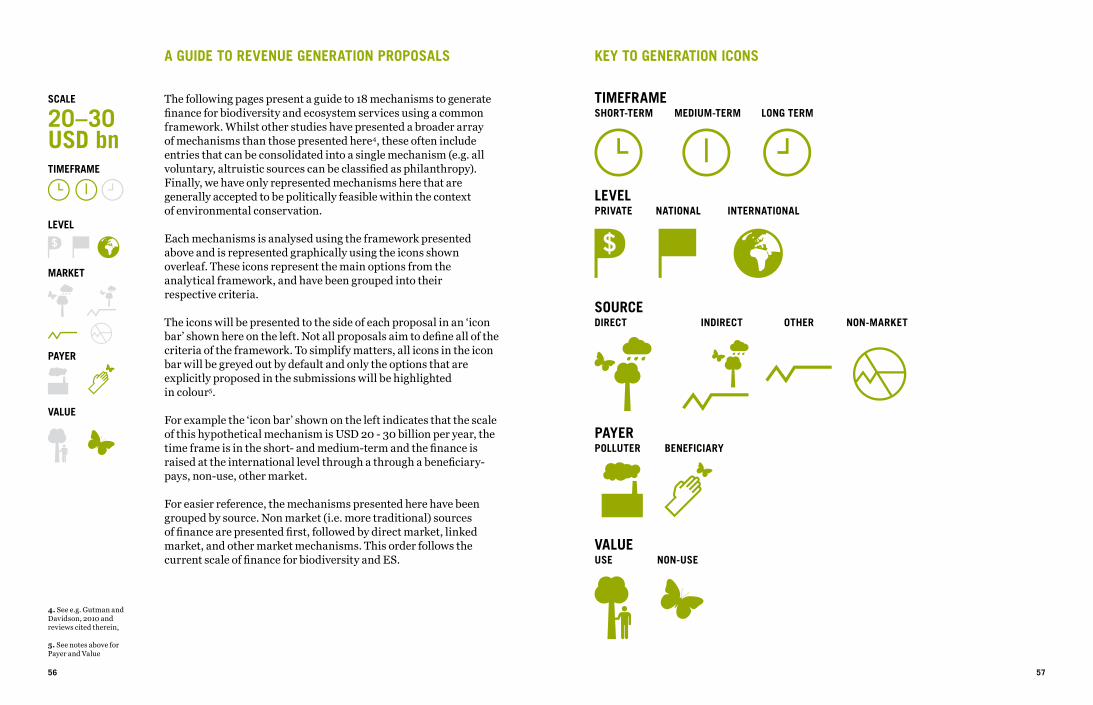
A GUIDE TO REVENUE GENERATION PROPOSALS
The following pages present a guide to 18 mechanisms to generate finance for biodiversity and ecosystem services using a common framework. Whilst other studies have presented a broader array of mechanisms than those presented here4, these often include entries that can be consolidated into a single mechanism (e.g. all voluntary, altruistic sources can be classified as philanthropy). Finally, we have only represented mechanisms here that are generally accepted to be politically feasible within the context of environmental conservation.
Each mechanisms is analysed using the framework presented above and is represented graphically using the icons shown overleaf. These icons represent the main options from the analytical framework, and have been grouped into their respective criteria.
The icons will be presented to the side of each proposal in an ‘icon bar’ shown here on the left. Not all proposals aim to define all of the criteria of the framework. To simplify matters, all icons in the icon bar will be greyed out by default and only the options that are explicitly proposed in the submissions will be highlighted in colour5.
For example the ‘icon bar’ shown on the left indicates that the scale of this hypothetical mechanism is USD 20 - 30 billion per year, the time frame is in the short- and medium-term and the finance is raised at the international level through a through a beneficiary-pays, non-use, other market.
For easier reference, the mechanisms presented here have been grouped by source. Non market (i.e. more traditional) sources of finance are presented first, followed by direct market, linked market, and other market mechanisms. This order follows the current scale of finance for biodiversity and ES.
TIMEFRAME
SCALE
20–30USD bn
MARKET
PAYER
VALUE
LEVEL
4. See e.g. Gutman and Davidson, 2010 and reviews cited therein,
5. See notes above for Payer and Value
KEY TO GENERATION ICONS
TIMEFRAMESHORT-TERM MEDIUM-TERM LONG TERM
LEVELPRIVATE
SOURCEDIRECT INDIRECT OTHER NON-MARKET
INTERNATIONALNATIONAL
PAYERPOLLUTER BENEFICIARY
VALUEUSE NON-USE
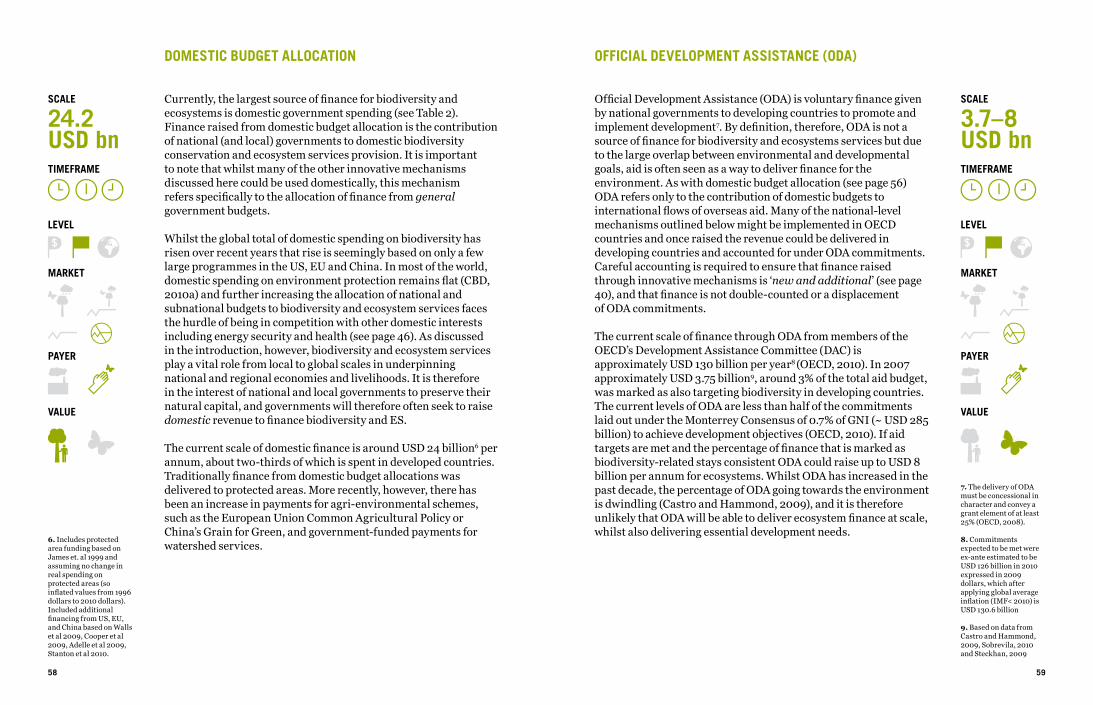
DOMESTIC BUDGET ALLOCATION
Currently, the largest source of finance for biodiversity and ecosystems is domestic government spending (see Table 2). Finance raised from domestic budget allocation is the contribution of national (and local) governments to domestic biodiversity conservation and ecosystem services provision. It is important to note that whilst many of the other innovative mechanisms discussed here could be used domestically, this mechanism refers specifically to the allocation of finance from general government budgets.
Whilst the global total of domestic spending on biodiversity has risen over recent years that rise is seemingly based on only a few large programmes in the US, EU and China. In most of the world, domestic spending on environment protection remains flat (CBD, 2010a) and further increasing the allocation of national and subnational budgets to biodiversity and ecosystem services faces the hurdle of being in competition with other domestic interests including energy security and health (see page 46). As discussed in the introduction, however, biodiversity and ecosystem services play a vital role from local to global scales in underpinning national and regional economies and livelihoods. It is therefore in the interest of national and local governments to preserve their natural capital, and governments will therefore often seek to raise domestic revenue to finance biodiversity and ES.
The current scale of domestic finance is around USD 24 billion6 per annum, about two-thirds of which is spent in developed countries. Traditionally finance from domestic budget allocations was delivered to protected areas. More recently, however, there has been an increase in payments for agri-environmental schemes, such as the European Union Common Agricultural Policy or China’s Grain for Green, and government-funded payments for watershed services.
58
7. The delivery of ODA must be concessional in character and convey a grant element of at least 25% (OECD, 2008).
8. Commitments expected to be met were ex-ante estimated to be USD 126 billion in 2010 expressed in 2009 dollars, which after applying global average inflation (IMF< 2010) is USD 130.6 billion
9. Based on data from Castro and Hammond, 2009, Sobrevila, 2010 and Steckhan, 2009
OFFICIAL DEVELOPMENT ASSISTANCE (ODA)
Official Development Assistance (ODA) is voluntary finance given by national governments to developing countries to promote and implement development7. By definition, therefore, ODA is not a source of finance for biodiversity and ecosystems services but due to the large overlap between environmental and developmental goals, aid is often seen as a way to deliver finance for the environment. As with domestic budget allocation (see page 56) ODA refers only to the contribution of domestic budgets to international flows of overseas aid. Many of the national-level mechanisms outlined below might be implemented in OECD countries and once raised the revenue could be delivered in developing countries and accounted for under ODA commitments. Careful accounting is required to ensure that finance raised through innovative mechanisms is ‘new and additional’ (see page 40), and that finance is not double-counted or a displacement of ODA commitments.
The current scale of finance through ODA from members of the OECD’s Development Assistance Committee (DAC) is approximately USD 130 billion per year8 (OECD, 2010). In 2007 approximately USD 3.75 billion9, around 3% of the total aid budget, was marked as also targeting biodiversity in developing countries. The current levels of ODA are less than half of the commitments laid out under the Monterrey Consensus of 0.7% of GNI (~ USD 285 billion) to achieve development objectives (OECD, 2010). If aid targets are met and the percentage of finance that is marked as biodiversity-related stays consistent ODA could raise up to USD 8 billion per annum for ecosystems. Whilst ODA has increased in the past decade, the percentage of ODA going towards the environment is dwindling (Castro and Hammond, 2009), and it is therefore unlikely that ODA will be able to deliver ecosystem finance at scale, whilst also delivering essential development needs.
59
6. Includes protected area funding based on James et. al 1999 and assuming no change in real spending on protected areas (so inflated values from 1996 dollars to 2010 dollars). Included additional financing from US, EU, and China based on Walls et al 2009, Cooper et al 2009, Adelle et al 2009, Stanton et al 2010.
TIMEFRAME
SCALE
24.2USD bn
MARKET
PAYER
VALUE
LEVEL
TIMEFRAME
SCALE
3.7–8USD bn
MARKET
PAYER
VALUE
LEVEL
60 61
CASE STUDYCOSTA RICA‘S PSA
Costa Rica is world renowned for its experimentation with innovative policy to protect its natural resources. In 1996, Costa Rica enacted the Forest Law 7575, which introduced incentive-based measures to compensate forest owners for the conservation of forest functions that provide environmental services to society (De Camino et al., 2000). The law explicitly recognised four environmental services provided by forest ecosystems: (i) mitigation of greenhouse gas emissions; (ii) hydrological services, including provision of water for human consumption, irrigation, and energy production; (iii) biodiversity conservation; and (iv) provision of scenic beauty for recreation and ecotourism. To secure these services, a system of payments for environmental services (Pagos por Servicios Ambientales)(PSA) was introduced. The PSA programme is managed by the National Forestry Finance Fund (Fondo Nacional de Financiamiento Forestal)(FONAFIFO) and compensates owners of forests and forest plantations for conserving, managing or restoring forests.
REVENUE GENERATION Prior to introducing the PSA programme, there was concern over Costa Rica’s high rates of deforestation and dwindling timber supplies. In response, the government introduced a series of forest certificates to encourage timber plantations. These were essentially positive tax incentives financed by the government’s general budget. The Forest Law built on this foundation, but introduced two crucial changes. First, the justification for paying forest owners was no longer for timber (an ecosystem good), but rather for the provision of ecosystem services. Secondly, the source of financing was changed from the government
budget to an earmarked tax and payments from beneficiaries.
The PSA program receives revenue from three main sources. Firstly, the Forest Law implemented a tax on fossil fuel sales and earmarked 3.5% of these revenues for the PSA program10. The fossil fuel tax provides about USD 10 million a year to the programme, equivalent to about a quarter of the total revenue for the PSA. Another portion of revenue is raised from the international community, through ODA and philanthropy, to secure the biodiversity benefits of the PSA programme. Because these sources were never intended to be ongoing, efforts to collect revenues from tourism and establish an endowment fund are being explored. The third main source of revenue is a levy on water payments. This mechanism previously relied on voluntary water agreements with large water users including hydropower companies, agribusinesses, a bottling company, and a hotel company. In 2005, however, the government revised its water tariff structure and introduced an additional conservation fee. That fee raises around USD 19 million annually, 25% of which is used for the PSA programme (with 50% for the Ministry of Environment and Energy’s Water Department and 25% for Protected Area financing). Finally, some financing is generated intermittently through large agreements to pay for forest carbon credits.
DELIVERYThe PSA programme delivers finance through performance-based payments (see page 101) to landowners across the country. Payments for forest protection, management, and regeneration are made over a 5-year period, while agroforestry
payments are made over 3 years and reforestation payments made over ten years (Daniels et al., 2010). By 2008 over 10,000 contracts had been issued under the PSA programme, with USD 206 million paid out to private landowners (an average of USD 17.2 million per year since 1997; Porras, 2010a) protecting 668,369 hectares of land (Daniels et al., 2010).
The programme has been challenged, however, to demonstrate equity in its application. Poor farmers have faced high transaction costs and difficulty in securing contracts, with larger operations securing contracts on a first-come, first-served basis (Porras, 2010a). Acting on these concerns, the PSA went through a series of changes in 2004 to lower barriers to participation for the poorer farmers with smaller landholdings. One change made was to give preference to applicants from regions with a low Social Development Index (SDI). These regions are now well represented in the allocation of PSA, and represent 25% of all contracts (Porras, 2010b).
Although there have been limited efforts to create a truly ‘pro-poor’ PSA system, the PSA system is associated with significant benefits at local, national and global levels, including the protection of the quality of water, carbon sequestration, conservation of biodiversity, health and infrastructure improvement, and the reduction of poverty in certain areas (Hartshorn et al., 2005).
INSTITUTIONAL ARRANGEMENTSThe Forest Law mandated that FONAFIFO - a semi-autonomous institution with independent legal status - collect revenues and implement the PSA programme. FONAFIFO’s status gives it a relative degree of autonomy in making personnel decisions and in managing funds, but it remains subject to a variety of governmental restrictions. Its governing board includes a representative from the private sector, but is dominated by three representatives from the public sector, representing the Ministry of Environment and Energy, the Ministry of Agriculture, and the National Banking System. Further, the Ministry of Finance must approve FONAFIFO’s budget.
Based on (Brown and Bird, 2010) and (Pagiola, 2008)
10. Fiscal Reform Law No.8114 introduced in 2001 reduced FONAFIFO’s share of fuel tax revenues to just 3.5%, but guaranteed this amount. (pp. 713 in Pagiola, 2008)
60 61
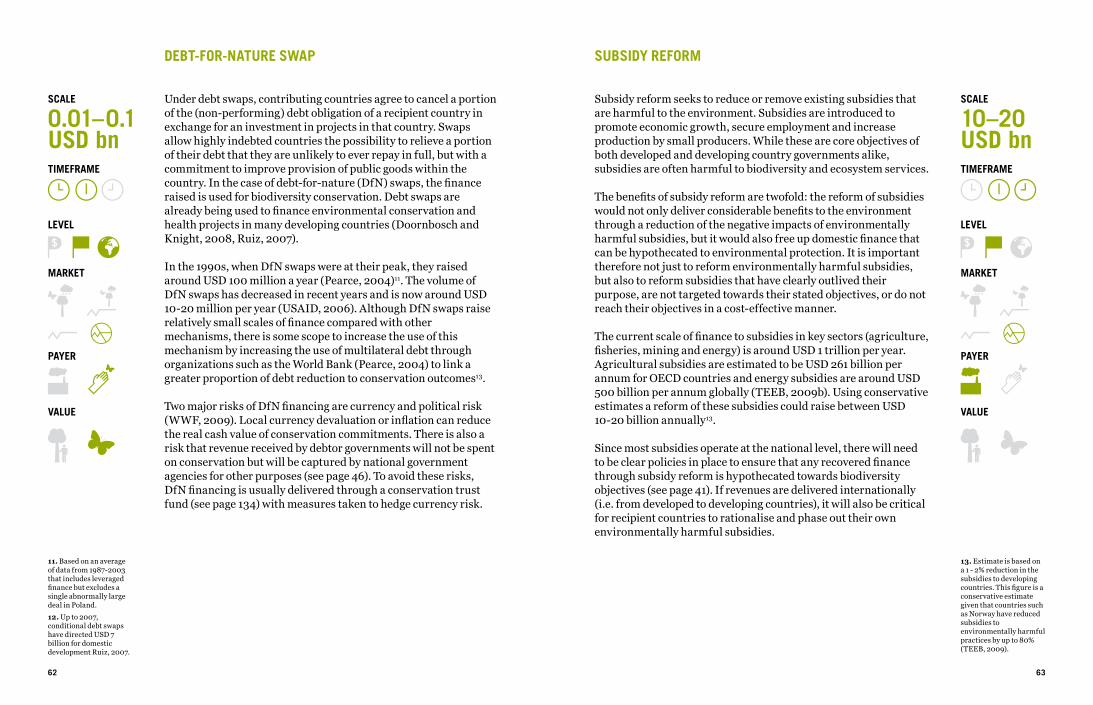
DEBT-FOR-NATURE SWAP
Under debt swaps, contributing countries agree to cancel a portion of the (non-performing) debt obligation of a recipient country in exchange for an investment in projects in that country. Swaps allow highly indebted countries the possibility to relieve a portion of their debt that they are unlikely to ever repay in full, but with a commitment to improve provision of public goods within the country. In the case of debt-for-nature (DfN) swaps, the finance raised is used for biodiversity conservation. Debt swaps are already being used to finance environmental conservation and health projects in many developing countries (Doornbosch and Knight, 2008, Ruiz, 2007).
In the 1990s, when DfN swaps were at their peak, they raised around USD 100 million a year (Pearce, 2004)11. The volume of DfN swaps has decreased in recent years and is now around USD 10-20 million per year (USAID, 2006). Although DfN swaps raise relatively small scales of finance compared with other mechanisms, there is some scope to increase the use of this mechanism by increasing the use of multilateral debt through organizations such as the World Bank (Pearce, 2004) to link a greater proportion of debt reduction to conservation outcomes13.
Two major risks of DfN financing are currency and political risk (WWF, 2009). Local currency devaluation or inflation can reduce the real cash value of conservation commitments. There is also a risk that revenue received by debtor governments will not be spent on conservation but will be captured by national government agencies for other purposes (see page 46). To avoid these risks, DfN financing is usually delivered through a conservation trust fund (see page 134) with measures taken to hedge currency risk.
SUBSIDY REFORM
Subsidy reform seeks to reduce or remove existing subsidies that are harmful to the environment. Subsidies are introduced to promote economic growth, secure employment and increase production by small producers. While these are core objectives of both developed and developing country governments alike, subsidies are often harmful to biodiversity and ecosystem services.
The benefits of subsidy reform are twofold: the reform of subsidies would not only deliver considerable benefits to the environment through a reduction of the negative impacts of environmentally harmful subsidies, but it would also free up domestic finance that can be hypothecated to environmental protection. It is important therefore not just to reform environmentally harmful subsidies, but also to reform subsidies that have clearly outlived their purpose, are not targeted towards their stated objectives, or do not reach their objectives in a cost-effective manner.
The current scale of finance to subsidies in key sectors (agriculture, fisheries, mining and energy) is around USD 1 trillion per year. Agricultural subsidies are estimated to be USD 261 billion per annum for OECD countries and energy subsidies are around USD 500 billion per annum globally (TEEB, 2009b). Using conservative estimates a reform of these subsidies could raise between USD 10-20 billion annually13.
Since most subsidies operate at the national level, there will need to be clear policies in place to ensure that any recovered finance through subsidy reform is hypothecated towards biodiversity objectives (see page 41). If revenues are delivered internationally (i.e. from developed to developing countries), it will also be critical for recipient countries to rationalise and phase out their own environmentally harmful subsidies.
11. Based on an average of data from 1987-2003 that includes leveraged finance but excludes a single abnormally large deal in Poland.
12. Up to 2007, conditional debt swaps have directed USD 7 billion for domestic development Ruiz, 2007.
13. Estimate is based on a 1 - 2% reduction in the subsidies to developing countries. This figure is a conservative estimate given that countries such as Norway have reduced subsidies to environmentally harmful practices by up to 80% (TEEB, 2009).
62
TIMEFRAME
SCALE
0.01–0.1USD bn
MARKET
PAYER
VALUE
LEVEL
TIMEFRAME
SCALE
10–20USD bn
MARKET
PAYER
VALUE
LEVEL
63
PHILANTHROPY
Philanthropy as a source of finance includes contributions from private foundations, businesses-related foundations, and conservation NGOs such as the Nature Conservancy and the World Wildlife Fund. Large philanthropic foundations generate revenue through an initial endowment that is managed in perpetuity (Persson et al., 2009). The finance available for charitable distribution from these endowments is directly dependent on the success of the commercial investments made by the foundations, since the investment returns are then used to deliver philanthropic grants. Conservation NGOs on the other hand generate revenue from a variety of sources including subscription fees, foundations and government contributions.
The scale of finance available from grants is not likely to be large. For example, in 2007 the Bill and Melinda Gates Foundation distributed in total around USD 1.9 billion in charitable grants and the Rockefeller Foundation’s long- term intention is to provide the equivalent of around USD 225 million in grants annually (Persson et al., 2009). The combined annual budget of five international environmental NGOs was estimated as USD 2 billion in recent years (Gutman and Davidson, 2008). Although these figures represent only a sample of private sector philanthropy, they go to a diverse set of priorities beyond biodiversity financing; therefore only a fraction of these flows are likely to go towards biodiversity and ecosystems14.
Whilst the sustainability and predictability of philanthropic grants from the private sector is difficult to estimate, downturns in the global economy will likely negatively impact the level of investment from philanthropy. Although private philanthropy is unlikely to deliver finance at the same scale as other sources of private finance it can be used for activities that offer no or low returns on investment.
14. The figure of USD 1–2 billion used here comes from Gutman and Davidson, 2008 but is not considered to be a precise estimate of philanthropic finance.
64
COMPLEMENTING CLIMATE AND BIODIVERSITY FINANCE
Currently forest loss accounts for around 15% of global carbon dioxide (CO2) emissions (Van Der Werf et al., 2009), and the loss of biodiversity is costing at least USD 740 per annum, and that cost is increasing each year (Braat and ten Brink, 2009). REDD is an international mechanism being negotiated under the United Nations Framework Convention on Climate Change (UNFCCC) to reduce emissions from deforestation and forest degradation in developing countries. The basic idea behind REDD is simple; countries that are willing and able to reduce emissions from deforestation should be compensated for doing so (Scholz and Schmidt, 2008).
REDD negotiations have come a long way since the idea was first proposed under the UNFCCC at COP 11 in Montreal in 2005. Parties to the climate Convention now broadly agree on the framework for a REDD mechanism and a draft text was all but agreed in Copenhagen in 2009. If an international mechanism is successfully agreed under the UN climate change negotiations, it would be a significant and unprecedented step forward in the fight against deforestation and the broader fight against climate change. In general, a well-designed REDD mechanism is likely to deliver substantial benefits for biodiversity and ES since reducing deforestation and degradation implies a decline in habitat destruction and thus in biodiversity loss (Karousakis, 2009). Some elements of the REDD mechanism, however, if not designed correctly, may create potential risks - or perverse outcomes - for biodiversity, for example the current definition of forests under the UNFCCC fails to recognise the conversion of natural forest to plantations, a practice that result in significant losses in biodiversity and ecosystem services.
Under the Bali Action Plan15 REDD was given the broad objective to “promote co-benefits and complement the aims and objectives of other relevant international conventions and agreements” of which a notable example is the CBD (Karousakis, 2009). The current negotiating text under the UNFCCC16 is more explicit and includes safeguards that should be taken under consideration when designing and implementing REDD, one of these aims specifically to address the issue of converting natural forests to plantations.
If REDD is to fully meet the objectives of the CBD, however, the CBD should develop a set of guidelines for national stakeholders on how to mainstream biodiversity considerations into the implementation of REDD (Benick et al., 2010). In addition the CBD could outline a series of efforts that can be undertaken which would help to incorporate biodiversity co-benefits into REDD in an efficient and informed manner.
There are two basic ways in which REDD finance and biodiversity finance can work together. Firstly, by improving our understanding of the spatial distribution and overlaps of ecosystem services and biodiversity hotspots with climate change multiple policy goals. Some areas that could be prioritised are forests, agriculture, peatlands and coastal zones (CBD, 2010b). Secondly, biodiversity finance can be used to stimulate additional climate finance by reducing the incremental cost of mitigation and adaptation activities in developing countries in areas that have high marginal costs (see page 111).
15. The Bali Action Plan can be found online at http://unfccc.int/files/meetings/cop_13/application/pdf/cp_bali_action.pdf16. Document FCCC/AWGLCA/2009/L.7/Add.6 is the final negotiation text emerging from Copenhagen, but Parties did not come to a Decision on REDD at this meeting.
65
TIMEFRAME
SCALE
1–3USD bn
MARKET
PAYER
VALUE
LEVEL
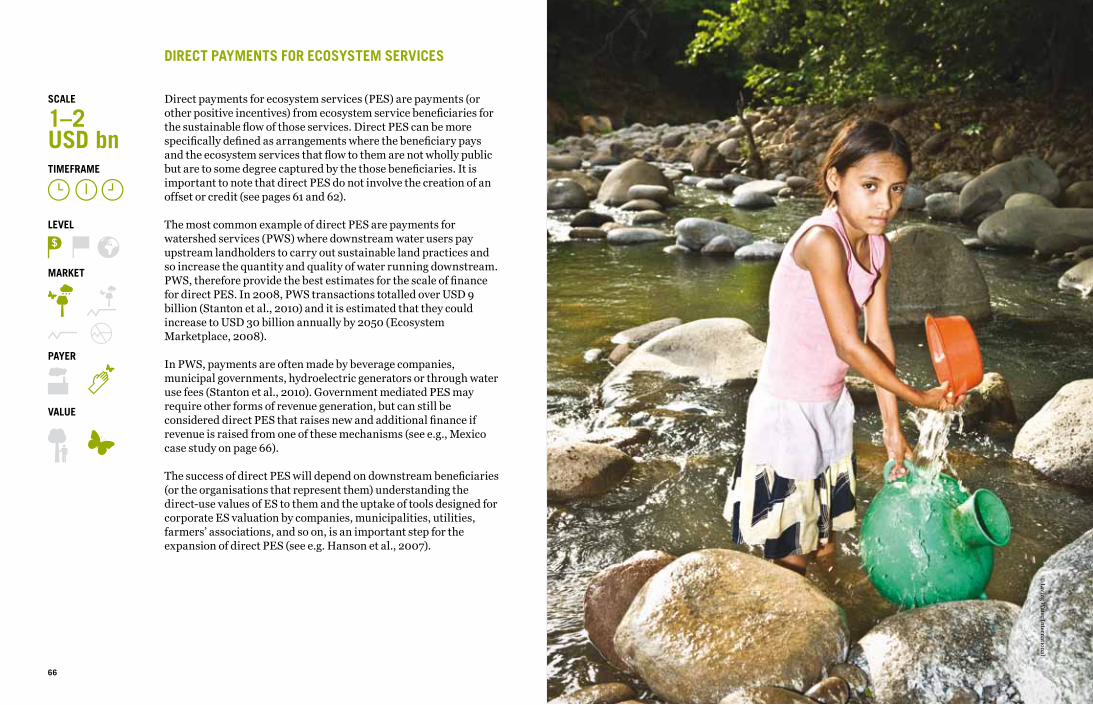
DIRECT PAYMENTS FOR ECOSYSTEM SERVICES
Direct payments for ecosystem services (PES) are payments (or other positive incentives) from ecosystem service beneficiaries for the sustainable flow of those services. Direct PES can be more specifically defined as arrangements where the beneficiary pays and the ecosystem services that flow to them are not wholly public but are to some degree captured by the those beneficiaries. It is important to note that direct PES do not involve the creation of an offset or credit (see pages 61 and 62).
The most common example of direct PES are payments for watershed services (PWS) where downstream water users pay upstream landholders to carry out sustainable land practices and so increase the quantity and quality of water running downstream. PWS, therefore provide the best estimates for the scale of finance for direct PES. In 2008, PWS transactions totalled over USD 9 billion (Stanton et al., 2010) and it is estimated that they could increase to USD 30 billion annually by 2050 (Ecosystem Marketplace, 2008).
In PWS, payments are often made by beverage companies, municipal governments, hydroelectric generators or through water use fees (Stanton et al., 2010). Government mediated PES may require other forms of revenue generation, but can still be considered direct PES that raises new and additional finance if revenue is raised from one of these mechanisms (see e.g., Mexico case study on page 66).
The success of direct PES will depend on downstream beneficiaries (or the organisations that represent them) understanding the direct-use values of ES to them and the uptake of tools designed for corporate ES valuation by companies, municipalities, utilities, farmers’ associations, and so on, is an important step for the expansion of direct PES (see e.g. Hanson et al., 2007).
66 67
TIMEFRAME
SCALE
1–2USD bn
MARKET
PAYER
VALUE
LEVEL
© L
iving W
ater Intern
ational
68 69
PAYMENTS FROM LOCAL TO GLOBAL SCALES
Whilst payments for ecosystem services (PES) have traditionally been implemented at the project level, due perhaps to a growing awareness of the regional and international benefits of ecosystem services (see page 18), examples of PES schemes are emerging that have been scaled up to the national and even international level.
LOCAL: QUITO WATER FUND, ECUADOR17
Quito is one of the many major cities in the world that depend on upstream ecological reserves for its water supply; with about 80% of the city’s drinking water coming from the Antisana and the Cayambe-Coca ecological reserves. In 2000 the Ecuadorian government established the Quito Fater Fund (Fondo para la protección del Agua; FONAG) as a trust fund to support conservation activities in these two reserves and the Guyallbamba watershed to protect Quito’s water resources.
FONAG receives contributions from a blend of public and private sources including a private brewing company, a water bottling company, and the municipal water and electrical utilities of Quito18. To date, FONAG has achieved an endowment of USD 6 million and has invested USD 2.3 million in watershed conservation, while leveraging USD 7 million in additional contributions to the projects financed. The fund provides a successful model for other cities around the world where water supply is dependent on the sustainable management of upstream land. Similar funds are being developed throughout the world, including 11 other cities in Colombia, Ecuador and Peru.
The two major lessons from FONAG, echoed by other watershed conservation and PES experience around the world are, firstly, that
programme proponents must raise awareness of the importance of watershed protection by tangibly demonstrating the value of upstream land management to downstream water users. Secondly, with that value demonstrated, the key ecosystem service beneficiaries must be identified, prioritized and informed of why they should contribute funds to the PES programme and how they can do so.
NATIONAL: MEXICO’S PAYMENTS FOR HYDROLOGICAL SERVICES19
Water scarcity is one of Mexico’s most pressing environmental challenges. Nearly all of the country’s 188 most important aquifers are overexploited or at full capacity. To address this issue, in 2003, Mexico established a programme of payments for hydrological environmental services (‘Pagos por Servicios Ambientales Hidrológicos’; PSAH). The programme aims to secure Mexico’s water supply by paying locals to conserve well-preserved forests that are at risk of deforestation.
The PSAH programme maintains a direct link between ecosystem service buyers and providers on a national scale by raising revenue from national water fees20. The fees have raise on average USD 27.3 million annually (equivalent to approximately 4% of total water revenues) and have been used to directly finance the PSAH programme.
As Mexico’s PSAH programme was the first such national PES mechanism to be implemented it had to overcome two key challenges. The first hurdle was to earmark the revenues from the scheme to pay for forest conservation. A related issue was that some officials perceived water scarcity as a problem of man-made infrastructure, not natural capital, Following a scientific study that highlighted the importance of forests in some
17. Based on (Stanton et al., 2010);(Arias et al., 2010); (FONAG)
18. The water utility contributes 1% of total water sales to the fund and is an example of direct PES. Additional funds are generated through philanthropy and ODA and are given to support other environmental and social benefits of the conservation projects beyond protection of watershed services
19. Based on (Muñoz-Piña et al., 2008).
20. Mexico’s water bodies are considered national property, so the government is allowed to charge for their use.
21. Based on (UNDP, 2010); (Positive, 2010); (BBC, 2010)
areas, and applying the precautionary principle for the rest of the country, Mexico’s PSAH programme went ahead. It is now working alongside Mexico‘s Programme of Payments for Carbon, Biodiversity and Agro-forestry Services (PSA-CABSA, established 2004) as an integral component of Mexico’s ecosystem finance policy.
INTERNATIONAL: YASUNI ITT21
The Yasuni National Park, in Ecuador, is one of the world’s most biologically diverse reserves and is home to several indigenous groups, including the Tagaeri and Taromenane indigenous peoples who remain in voluntary isolation. The Ishpingo-Tambococha-Tiputini (ITT) concession located in the Yasuni Park holds 846 million barrels of oil, representing 20% of the country’s total oil reserves, and although that oil could generate USD 7.2 billion for Ecuador, extraction would endanger the National Park and the livelihoods and wellbeing of the people living within its boundaries.
In 2007, Ecuador’s President Rafael Correa offered to ban oil extraction from the concession and preserve the rainforest standing over it if the international community compensates Ecuador for at least half of the foregone oil revenue amounting to USD 3.6 billion over 13 years. On August 3, 2010, a deal was struck between the Government of Ecuador and the United Nations Development
Program (UNDP) to establish a trust fund administered by UNDP to handle finance raised to compensate Ecuador’s foregone oil revenues.In exchange for contributions to the Yasuni Fund, the Ecuadorian Government will provide Yasuni Guarantee Certificates (Certificados Guarantias de Yasuni; CGYs) that will indicate the amount of finance contributed (in USD) and the amount of carbon emissions avoided by not burning the fossil fuels that have forgone extraction. The conservation of the Yasuni Natioanal Park will also deliver enormous benefits for biodiversity and for the indigenous peoples of the Yasuni.
68 69
CAP-AND-TRADE MARKET
Biodiversity and ecosystem service cap-and-trade markets involve the trade or exchange of allowances within in a national or sub-national market. Allowances essentially give polluters the right to negatively impact biodiversity or ecosystem services; they can be based on measurements of the level of ecosystem service impacted by the polluter (e.g. tonnes of carbon emitted or level of nitrogen emitted into watercourse), an area of habitat impacted (e.g. hectares of forest) or the status of one or more species of interest. Under a cap-and-trade market, the total number of allowances allocated to entities within a market is capped to limit the overall impact on the environment. Polluters within that market can then either mitigate their impact directly or trade allowances with another entity that has a surplus of allowances.
An example of ecosystem service cap-and-trade markets are the water quality trading (WQT) programs popular in the US. WQT programmes traded USD 11 million in 2008 (Stanton et al., 2010) and with significant government action this figure could increase by one or two orders of magnitude globally by 2020 (Ecosystem Marketplace, 2008).
Examples of biodiversity cap-and-trade mechanisms (also known as tradable rights) include tradable development rights (TDRs), individual fishing quotas (IFQs), and territorial use rights for fisheries (TURFs). Cap-and-trade mechanisms for fisheries are used extensively, with IFQ transactions estimated to total USD 5-10 billion globally (Ecosystem Marketplace, 2008).
The scale of finance under a cap-and-trade mechanism is difficult to estimate. The figures referred to above represent secondary transactions in a cap-and-trade market, and are not indicative of the scale of finance invested in abating impacts on biodiversity. The two most important factors for both the scale of finance and the environmental effectiveness under a cap-and-trade mechanism are the strictness of the overall cap and the method of allocation of allowances. Placing a strict cap on allowances incentivises polluters to take stronger actions to reduce their impact on biodiversity and ecosystem services, and innovative mechanisms for the allocation of allowances including auctions can raise additional ecosystem finance (see page 71).
70
22. See http://cdm.unfccc.int/index.html or The Little Climate Finance Book.
BASELINE-AND-CREDIT MARKET
Baseline-and-credit markets are arrangements in which the polluter pays for the negative impact they impose on the environment by purchasing credits or offsets. The Clean Development Mechanism of the Kyoto Protocol is an example of a baseline-and-credit market22. Under this system a credit or offset representing the right to pollute is generated through the sustainable management of an ecosystem. A polluter can then purchase this credit to meet their (voluntary or legal) obligations to offset any negative impact they impose on an ecosystem. Baseline-and-credit mechanisms must establish a business-as-usual level (known as the baseline) before an offset can be awarded.
The most common examples of baseline-and-credit markets are the voluntary forest carbon market and biodiversity offsetting (see page 70). Forest carbon markets collectively raised USD 150 million in 2009 (Hamilton et al., 2010) and could generate USD 7 billion in 2020 (Eliasch, 2008); biodiversity offsets raised at least USD 1.5-2.5 billion annually in 2009 and could generate USD 10 billion in 2020 (Ecosystem Marketplace, 2008). Whilst some level of revenue can be raised through voluntary mechanisms, regulation is required to increase the scale of finance that can be raised through these schemes (eftec et al., 2010).
The single most important factor for a baseline-and-credit mechanism is the strictness of the baseline. If baselines are set too low then offsets can be generated that offer no real benefit to the environment. Similarly if baselines are set too high, there will be less incentive for offset providers to sustainably manage their resources.
71
TIMEFRAME
SCALE
USD bn
MARKET
PAYER
VALUE
LEVEL
TIMEFRAME
SCALE
3.8–17USD bn
MARKET
PAYER
VALUE
LEVEL
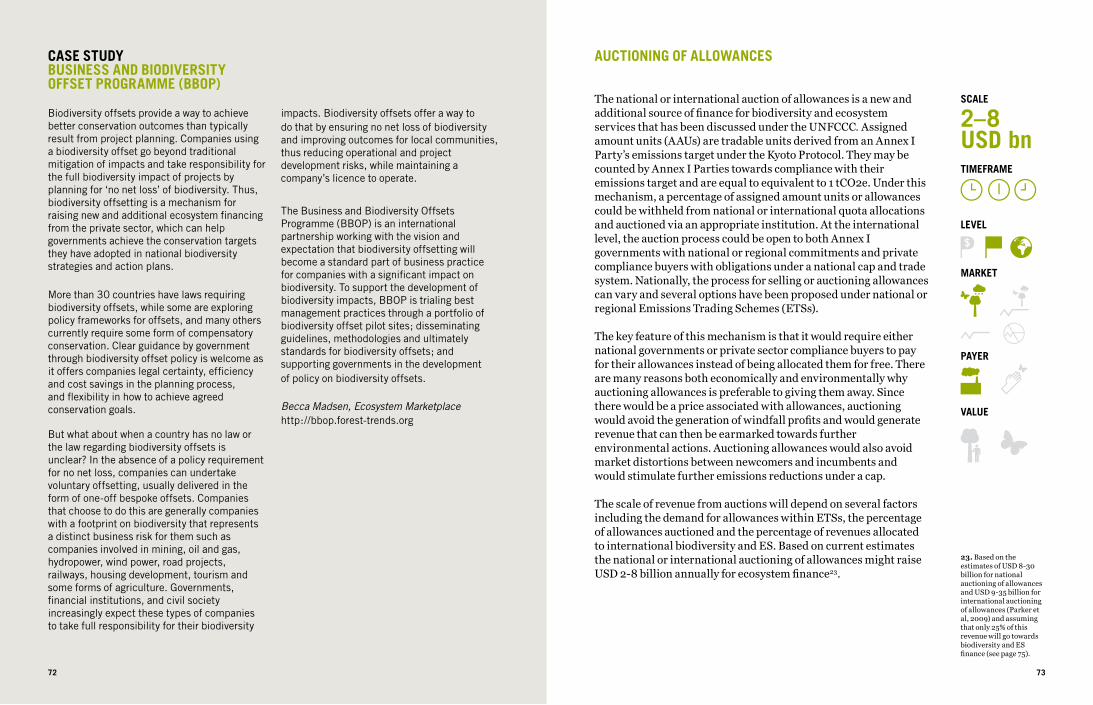
72 73
CASE STUDYBUSINESS AND BIODIVERSITY OFFSET PROGRAMME (BBOP)
Biodiversity offsets provide a way to achieve better conservation outcomes than typically result from project planning. Companies using a biodiversity offset go beyond traditional mitigation of impacts and take responsibility for the full biodiversity impact of projects by planning for ‘no net loss’ of biodiversity. Thus, biodiversity offsetting is a mechanism for raising new and additional ecosystem financing from the private sector, which can help governments achieve the conservation targets they have adopted in national biodiversity strategies and action plans.
More than 30 countries have laws requiring biodiversity offsets, while some are exploring policy frameworks for offsets, and many others currently require some form of compensatory conservation. Clear guidance by government through biodiversity offset policy is welcome as it offers companies legal certainty, efficiency and cost savings in the planning process, and flexibility in how to achieve agreed conservation goals.
But what about when a country has no law or the law regarding biodiversity offsets is unclear? In the absence of a policy requirement for no net loss, companies can undertake voluntary offsetting, usually delivered in the form of one-off bespoke offsets. Companies that choose to do this are generally companies with a footprint on biodiversity that represents a distinct business risk for them such as companies involved in mining, oil and gas, hydropower, wind power, road projects, railways, housing development, tourism and some forms of agriculture. Governments, financial institutions, and civil society increasingly expect these types of companies to take full responsibility for their biodiversity
impacts. Biodiversity offsets offer a way to do that by ensuring no net loss of biodiversity and improving outcomes for local communities, thus reducing operational and project development risks, while maintaining a company’s licence to operate.
The Business and Biodiversity Offsets Programme (BBOP) is an international partnership working with the vision and expectation that biodiversity offsetting will become a standard part of business practice for companies with a significant impact on biodiversity. To support the development of biodiversity impacts, BBOP is trialing best management practices through a portfolio of biodiversity offset pilot sites; disseminating guidelines, methodologies and ultimately standards for biodiversity offsets; and supporting governments in the development of policy on biodiversity offsets.
Becca Madsen, Ecosystem Marketplacehttp://bbop.forest-trends.org
AUCTIONING OF ALLOWANCES
The national or international auction of allowances is a new and additional source of finance for biodiversity and ecosystem services that has been discussed under the UNFCCC. Assigned amount units (AAUs) are tradable units derived from an Annex I Party’s emissions target under the Kyoto Protocol. They may be counted by Annex I Parties towards compliance with their emissions target and are equal to equivalent to 1 tCO2e. Under this mechanism, a percentage of assigned amount units or allowances could be withheld from national or international quota allocations and auctioned via an appropriate institution. At the international level, the auction process could be open to both Annex I governments with national or regional commitments and private compliance buyers with obligations under a national cap and trade system. Nationally, the process for selling or auctioning allowances can vary and several options have been proposed under national or regional Emissions Trading Schemes (ETSs).
The key feature of this mechanism is that it would require either national governments or private sector compliance buyers to pay for their allowances instead of being allocated them for free. There are many reasons both economically and environmentally why auctioning allowances is preferable to giving them away. Since there would be a price associated with allowances, auctioning would avoid the generation of windfall profits and would generate revenue that can then be earmarked towards further environmental actions. Auctioning allowances would also avoid market distortions between newcomers and incumbents and would stimulate further emissions reductions under a cap.
The scale of revenue from auctions will depend on several factors including the demand for allowances within ETSs, the percentage of allowances auctioned and the percentage of revenues allocated to international biodiversity and ES. Based on current estimates the national or international auctioning of allowances might raise USD 2-8 billion annually for ecosystem finance23.
23. Based on the estimates of USD 8-30 billion for national auctioning of allowances and USD 9-35 billion for international auctioning of allowances (Parker et al, 2009) and assuming that only 25% of this revenue will go towards biodiversity and ES finance (see page 75).
TIMEFRAME
SCALE
2–8USD bn
MARKET
PAYER
VALUE
LEVEL
72 73
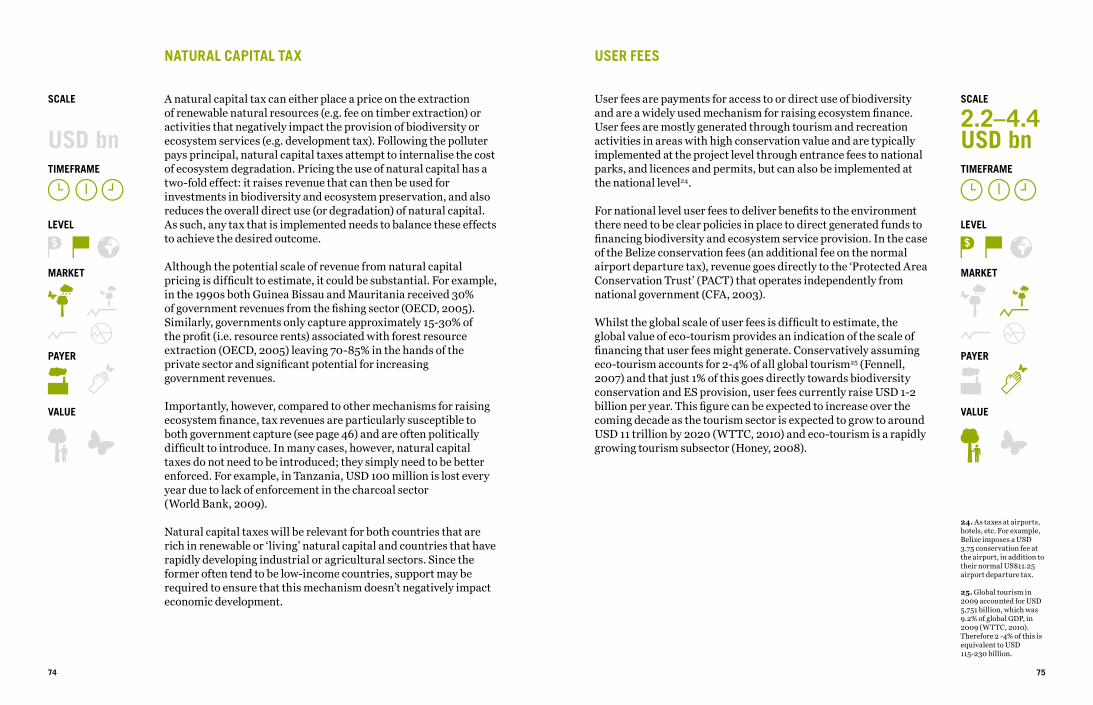
NATURAL CAPITAL TAX
A natural capital tax can either place a price on the extraction of renewable natural resources (e.g. fee on timber extraction) or activities that negatively impact the provision of biodiversity or ecosystem services (e.g. development tax). Following the polluter pays principal, natural capital taxes attempt to internalise the cost of ecosystem degradation. Pricing the use of natural capital has a two-fold effect: it raises revenue that can then be used for investments in biodiversity and ecosystem preservation, and also reduces the overall direct use (or degradation) of natural capital. As such, any tax that is implemented needs to balance these effects to achieve the desired outcome.
Although the potential scale of revenue from natural capital pricing is difficult to estimate, it could be substantial. For example, in the 1990s both Guinea Bissau and Mauritania received 30% of government revenues from the fishing sector (OECD, 2005). Similarly, governments only capture approximately 15-30% of the profit (i.e. resource rents) associated with forest resource extraction (OECD, 2005) leaving 70-85% in the hands of the private sector and significant potential for increasing government revenues.
Importantly, however, compared to other mechanisms for raising ecosystem finance, tax revenues are particularly susceptible to both government capture (see page 46) and are often politically difficult to introduce. In many cases, however, natural capital taxes do not need to be introduced; they simply need to be better enforced. For example, in Tanzania, USD 100 million is lost every year due to lack of enforcement in the charcoal sector (World Bank, 2009). Natural capital taxes will be relevant for both countries that are rich in renewable or ‘living’ natural capital and countries that have rapidly developing industrial or agricultural sectors. Since the former often tend to be low-income countries, support may be required to ensure that this mechanism doesn’t negatively impact economic development.
74
24. As taxes at airports, hotels, etc. For example, Belize imposes a USD 3.75 conservation fee at the airport, in addition to their normal US$11.25 airport departure tax.
25. Global tourism in 2009 accounted for USD 5,751 billion, which was 9.2% of global GDP, in 2009 (WTTC, 2010). Therefore 2 -4% of this is equivalent to USD 115-230 billion.
USER FEES
User fees are payments for access to or direct use of biodiversity and are a widely used mechanism for raising ecosystem finance. User fees are mostly generated through tourism and recreation activities in areas with high conservation value and are typically implemented at the project level through entrance fees to national parks, and licences and permits, but can also be implemented at the national level24.
For national level user fees to deliver benefits to the environment there need to be clear policies in place to direct generated funds to financing biodiversity and ecosystem service provision. In the case of the Belize conservation fees (an additional fee on the normal airport departure tax), revenue goes directly to the ‘Protected Area Conservation Trust’ (PACT) that operates independently from national government (CFA, 2003).
Whilst the global scale of user fees is difficult to estimate, the global value of eco-tourism provides an indication of the scale of financing that user fees might generate. Conservatively assuming eco-tourism accounts for 2-4% of all global tourism25 (Fennell, 2007) and that just 1% of this goes directly towards biodiversity conservation and ES provision, user fees currently raise USD 1-2 billion per year. This figure can be expected to increase over the coming decade as the tourism sector is expected to grow to around USD 11 trillion by 2020 (WTTC, 2010) and eco-tourism is a rapidly growing tourism subsector (Honey, 2008).
75
TIMEFRAME
SCALE
USD bn
MARKET
PAYER
VALUE
LEVEL
TIMEFRAME
SCALE
2.2–4.4USD bn
MARKET
PAYER
VALUE
LEVEL
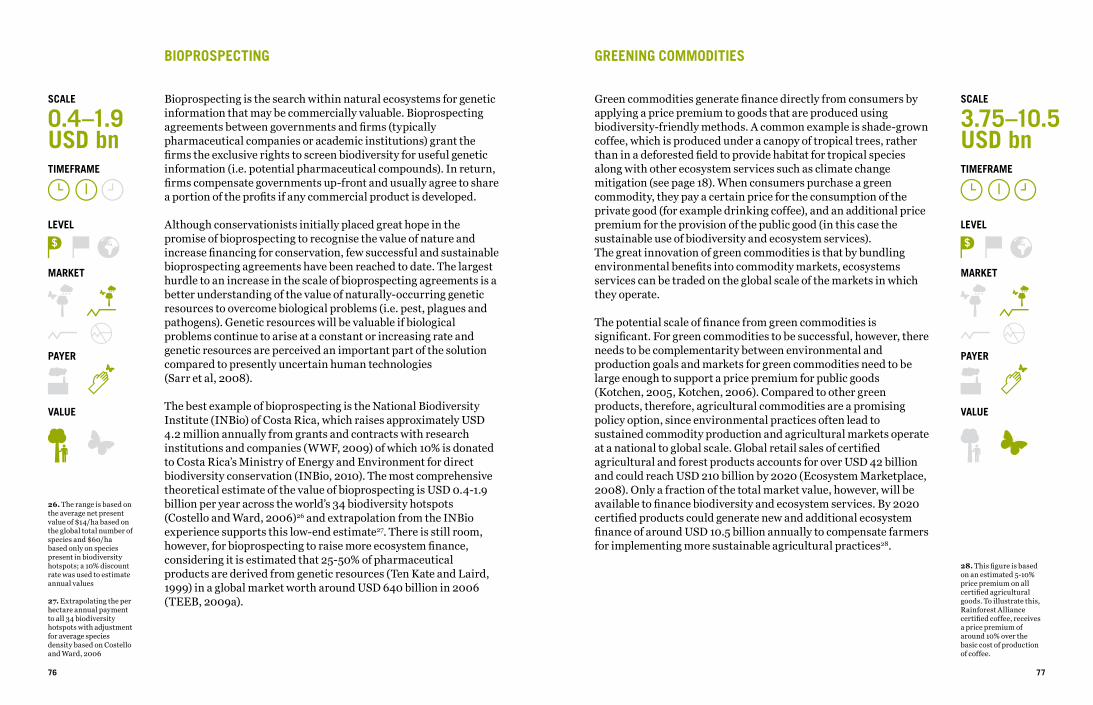
BIOPROSPECTING
Bioprospecting is the search within natural ecosystems for genetic information that may be commercially valuable. Bioprospecting agreements between governments and firms (typically pharmaceutical companies or academic institutions) grant the firms the exclusive rights to screen biodiversity for useful genetic information (i.e. potential pharmaceutical compounds). In return, firms compensate governments up-front and usually agree to share a portion of the profits if any commercial product is developed.
Although conservationists initially placed great hope in the promise of bioprospecting to recognise the value of nature and increase financing for conservation, few successful and sustainable bioprospecting agreements have been reached to date. The largest hurdle to an increase in the scale of bioprospecting agreements is a better understanding of the value of naturally-occurring genetic resources to overcome biological problems (i.e. pest, plagues and pathogens). Genetic resources will be valuable if biological problems continue to arise at a constant or increasing rate and genetic resources are perceived an important part of the solution compared to presently uncertain human technologies (Sarr et al, 2008).
The best example of bioprospecting is the National Biodiversity Institute (INBio) of Costa Rica, which raises approximately USD 4.2 million annually from grants and contracts with research institutions and companies (WWF, 2009) of which 10% is donated to Costa Rica’s Ministry of Energy and Environment for direct biodiversity conservation (INBio, 2010). The most comprehensive theoretical estimate of the value of bioprospecting is USD 0.4-1.9 billion per year across the world’s 34 biodiversity hotspots (Costello and Ward, 2006)26 and extrapolation from the INBio experience supports this low-end estimate27. There is still room, however, for bioprospecting to raise more ecosystem finance, considering it is estimated that 25-50% of pharmaceutical products are derived from genetic resources (Ten Kate and Laird, 1999) in a global market worth around USD 640 billion in 2006 (TEEB, 2009a).
26. The range is based on the average net present value of $14/ha based on the global total number of species and $60/ha based only on species present in biodiversity hotspots; a 10% discount rate was used to estimate annual values
27. Extrapolating the per hectare annual payment to all 34 biodiversity hotspots with adjustment for average species density based on Costello and Ward, 2006
76
28. This figure is based on an estimated 5-10% price premium on all certified agricultural goods. To illustrate this, Rainforest Alliance certified coffee, receives a price premium of around 10% over the basic cost of production of coffee.
GREENING COMMODITIES
Green commodities generate finance directly from consumers by applying a price premium to goods that are produced using biodiversity-friendly methods. A common example is shade-grown coffee, which is produced under a canopy of tropical trees, rather than in a deforested field to provide habitat for tropical species along with other ecosystem services such as climate change mitigation (see page 18). When consumers purchase a green commodity, they pay a certain price for the consumption of the private good (for example drinking coffee), and an additional price premium for the provision of the public good (in this case the sustainable use of biodiversity and ecosystem services). The great innovation of green commodities is that by bundling environmental benefits into commodity markets, ecosystems services can be traded on the global scale of the markets in which they operate.
The potential scale of finance from green commodities is significant. For green commodities to be successful, however, there needs to be complementarity between environmental and production goals and markets for green commodities need to be large enough to support a price premium for public goods (Kotchen, 2005, Kotchen, 2006). Compared to other green products, therefore, agricultural commodities are a promising policy option, since environmental practices often lead to sustained commodity production and agricultural markets operate at a national to global scale. Global retail sales of certified agricultural and forest products accounts for over USD 42 billion and could reach USD 210 billion by 2020 (Ecosystem Marketplace, 2008). Only a fraction of the total market value, however, will be available to finance biodiversity and ecosystem services. By 2020 certified products could generate new and additional ecosystem finance of around USD 10.5 billion annually to compensate farmers for implementing more sustainable agricultural practices28.
77
TIMEFRAME
SCALE
0.4–1.9USD bn
MARKET
PAYER
VALUE
LEVEL
TIMEFRAME
SCALE
3.75–10.5USD bn
MARKET
PAYER
VALUE
LEVEL
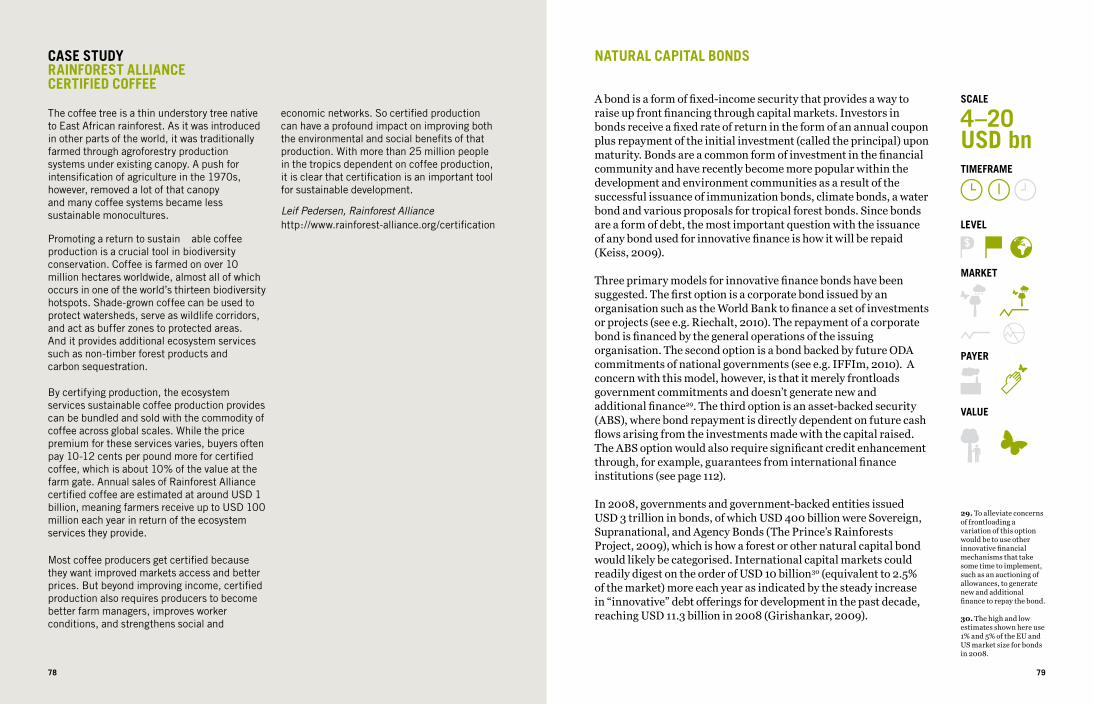
78 7978
CASE STUDYRAINFOREST ALLIANCE CERTIFIED COFFEE
The coffee tree is a thin understory tree native to East African rainforest. As it was introduced in other parts of the world, it was traditionally farmed through agroforestry production systems under existing canopy. A push for intensification of agriculture in the 1970s, however, removed a lot of that canopy and many coffee systems became less sustainable monocultures.
Promoting a return to sustain able coffee production is a crucial tool in biodiversity conservation. Coffee is farmed on over 10 million hectares worldwide, almost all of which occurs in one of the world’s thirteen biodiversity hotspots. Shade-grown coffee can be used to protect watersheds, serve as wildlife corridors, and act as buffer zones to protected areas. And it provides additional ecosystem services such as non-timber forest products and carbon sequestration.
By certifying production, the ecosystem services sustainable coffee production provides can be bundled and sold with the commodity of coffee across global scales. While the price premium for these services varies, buyers often pay 10-12 cents per pound more for certified coffee, which is about 10% of the value at the farm gate. Annual sales of Rainforest Alliance certified coffee are estimated at around USD 1 billion, meaning farmers receive up to USD 100 million each year in return of the ecosystem services they provide.
Most coffee producers get certified because they want improved markets access and better prices. But beyond improving income, certified production also requires producers to become better farm managers, improves worker conditions, and strengthens social and
economic networks. So certified production can have a profound impact on improving both the environmental and social benefits of that production. With more than 25 million people in the tropics dependent on coffee production, it is clear that certification is an important tool for sustainable development.
Leif Pedersen, Rainforest Alliancehttp://www.rainforest-alliance.org/certification
NATURAL CAPITAL BONDS
A bond is a form of fixed-income security that provides a way to raise up front financing through capital markets. Investors in bonds receive a fixed rate of return in the form of an annual coupon plus repayment of the initial investment (called the principal) upon maturity. Bonds are a common form of investment in the financial community and have recently become more popular within the development and environment communities as a result of the successful issuance of immunization bonds, climate bonds, a water bond and various proposals for tropical forest bonds. Since bonds are a form of debt, the most important question with the issuance of any bond used for innovative finance is how it will be repaid (Keiss, 2009).
Three primary models for innovative finance bonds have been suggested. The first option is a corporate bond issued by an organisation such as the World Bank to finance a set of investments or projects (see e.g. Riechalt, 2010). The repayment of a corporate bond is financed by the general operations of the issuing organisation. The second option is a bond backed by future ODA commitments of national governments (see e.g. IFFIm, 2010). A concern with this model, however, is that it merely frontloads government commitments and doesn’t generate new and additional finance29. The third option is an asset-backed security (ABS), where bond repayment is directly dependent on future cash flows arising from the investments made with the capital raised. The ABS option would also require significant credit enhancement through, for example, guarantees from international finance institutions (see page 112).
In 2008, governments and government-backed entities issued USD 3 trillion in bonds, of which USD 400 billion were Sovereign, Supranational, and Agency Bonds (The Prince’s Rainforests Project, 2009), which is how a forest or other natural capital bond would likely be categorised. International capital markets could readily digest on the order of USD 10 billion30 (equivalent to 2.5% of the market) more each year as indicated by the steady increase in “innovative” debt offerings for development in the past decade, reaching USD 11.3 billion in 2008 (Girishankar, 2009).
29. To alleviate concerns of frontloading a variation of this option would be to use other innovative financial mechanisms that take some time to implement, such as an auctioning of allowances, to generate new and additional finance to repay the bond.
30. The high and low estimates shown here use 1% and 5% of the EU and US market size for bonds in 2008.
TIMEFRAME
SCALE
4–20USD bn
MARKET
PAYER
VALUE
LEVEL
78
80 818080
DESIGNING A NATURAL CAPITAL BOND
With the promise of finance from REDD, tropical forest bonds are the frontrunner to be the first natural capital bond. Numerous organisation have started to explore how to design a forest bond, providing valuable lessons for natural capital bonds generally. The Prince’s Rainforests Project, highlighted four key elements in the design of a rainforest bond; credit risk, term or maturity, repayment schedule, and yield versus similar securities (The Prince’s Rainforests Project, 2009).
CREDIT RISK A natural capital bond would need to obtain the highest credit risk rating (AAA) from major credit rating agencies in order to access large pools of institutional investment capital. Institutions such as the World Bank and the IFC carry AAA-ratings, as do most developed country governments. A bond backed by such parties would therefore earn a similar rating.
TERM Bonds are issued with anything from one-year to 40-year maturities. A natural capital bond would probably use a term of 10 or more years, because of the financing needs of natural capital and the likely demand from institutional investors.
REPAYMENT SCHEDULEMost bonds offer a fixed annual interest payment, or coupon, to investors. A Rainforest Bond could be designed to generate the type of repayment schedules that are most attractive to investors and to the governments backing it. The burden of interest payments can also be shifted across time by issuing multiple bonds and paying coupons out of a sinking fund.
YIELD A natural capital bond would need to offer investors a yield that is competitive to other AAA-rated fixed income securities. In 2006 the International Finance Facility for Immunisation (IFFIm) sold a US$1 billion bond (rated AAA) with an annual yield of 5.019%, 31 basis points above the benchmark five-year US Treasury bond. In 2007 the World Bank issued a €1.5 billion three-year bond that had a yield of 4.25%, five basis points above the underlying government benchmark.
Based on (Forum for the Future, 2009) and (The Prince’s Rainforests Project, 2009)
INTERNATIONAL FINANCE: FROM THE “A” TO “BCD”
Over the past two decades, the discourse on aid has evolved to focus on three critical and interrelated objectives. Halting global biodiversity loss is the core focus of the UN Convention on Biological Diversity (CBD) and encompasses conservation and sustainable use of ecosystems across a broad landscape of protected areas and human-affected landscapes. Climate change has been described as the greatest market failure the world has ever seen31. Enshrined under the UN Framework Convention on Climate Change (UNFCCC), 192 countries focus their efforts on ways to limit global warming and to adapt to the effects of climate change. In addition to these issues, international development is also concerned with ending poverty. The Millennium Development Goals (MDGs), which range from halving extreme poverty to providing universal primary education, all by the date of 2015 – are a blueprint on how to do that.
Reaching each of these targets will require significant amounts of financing, most of which will need to be delivered in developing countries: IUCN is calling for OECD countries to contribute around USD 120 billion32 in international biodiversity assistance; the World Bank estimates that by 2030, developing countries will need an additional USD 280 billion to mitigate and adapt to climate
change33; and the UN Millennium Project estimates that – on top of the needs for ecosystem preservation and combating climate change – achieving the MDGs will require additional finance of USD 133 billion34 by 2015.
Even if we reach the Aid target of 0.7% of gross national income, achieving all of the targets for Biodiversity, Climate and Development in developing countries will require 2-3 times more. Whilst developing countries will be able to meet some of the challenge domestically, the significant international finance will still be needed. Meeting these goals is in interest of all nations and to achieve them will require the coordination of international finance in both the generation of revenue and the delivery of these funds. International mechanisms, such as the auctioning of allowances, a financial transaction tax and a tax on international aviation or shipping, have the potential to raise vast sums of finance and do not suffer from the revenue capture problems of domestic government financing or ODA (see page 46). Implementing them in a timely and effective manner, however, will require strong political will, and international coordination among the champions of biodiversity, climate change and development goals.
31. Attributed to Lord Nicolas Stern
32. IUCN calls OECD countries to contribute at least 0.3% of their gross domestic product (GDP) in addition to the 0.7% ODA target (IUCN, 2010).
33. The World Development Report 2010 (World Bank, 2010) estimated needs in developing countries of 140-175 for mitigation and 30-100 for adaptation (2005 dollars). The mid-range values of these estimates were taken and inflated to 2010 dollars (inflation data from IMF, 2010).
34. Needs for meeting MDGs were estimated to be USD 195 (2003 dollars) in 2015 (UN Millennium Project, 2005). That estimation specifically did not consider financing related to climate change and ecosystem preservation. The estimate was inflated (IMF, 2010) to USD 264 billion (2010 dollars) and compared to expected ODA of USD 130.6 billion in 2010 (OECD, 2010; originally expressed as USD 126 billion in 2009 dollars. The shortfall is USD 133.3 billion (2010 dollars), which is 0.33% of OECD-DAC countries’ gross national income (GNI) in 2010, which when added to the current spending equal to 0.32% of that GNI, the total would be close to the 0.7% target. It is assumed that once reached, the 0.7% should be maintained, true to the long-standing goal.
80
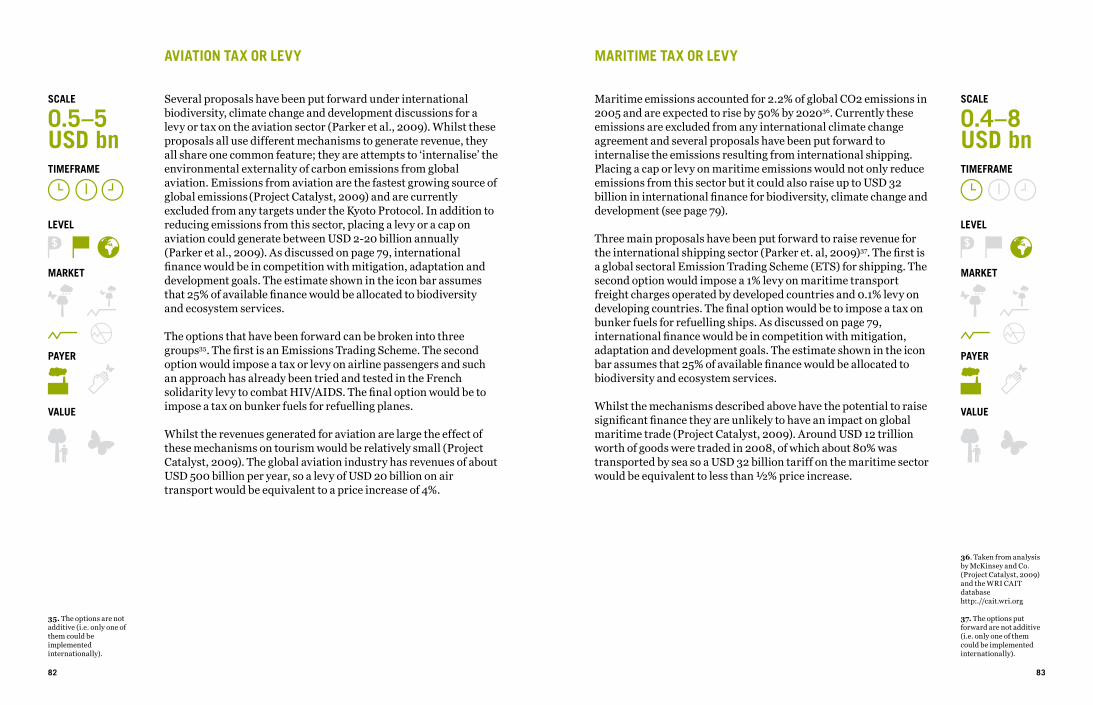
AVIATION TAX OR LEVY
Several proposals have been put forward under international biodiversity, climate change and development discussions for a levy or tax on the aviation sector (Parker et al., 2009). Whilst these proposals all use different mechanisms to generate revenue, they all share one common feature; they are attempts to ‘internalise’ the environmental externality of carbon emissions from global aviation. Emissions from aviation are the fastest growing source of global emissions (Project Catalyst, 2009) and are currently excluded from any targets under the Kyoto Protocol. In addition to reducing emissions from this sector, placing a levy or a cap on aviation could generate between USD 2-20 billion annually (Parker et al., 2009). As discussed on page 79, international finance would be in competition with mitigation, adaptation and development goals. The estimate shown in the icon bar assumes that 25% of available finance would be allocated to biodiversity and ecosystem services.
The options that have been forward can be broken into three groups35. The first is an Emissions Trading Scheme. The second option would impose a tax or levy on airline passengers and such an approach has already been tried and tested in the French solidarity levy to combat HIV/AIDS. The final option would be to impose a tax on bunker fuels for refuelling planes.
Whilst the revenues generated for aviation are large the effect of these mechanisms on tourism would be relatively small (Project Catalyst, 2009). The global aviation industry has revenues of about USD 500 billion per year, so a levy of USD 20 billion on air transport would be equivalent to a price increase of 4%.
35. The options are not additive (i.e. only one of them could be implemented internationally).
82
36. Taken from analysis by McKinsey and Co. (Project Catalyst, 2009) and the WRI CAIT database http:.//cait.wri.org
37. The options put forward are not additive (i.e. only one of them could be implemented internationally).
MARITIME TAX OR LEVY
Maritime emissions accounted for 2.2% of global CO2 emissions in 2005 and are expected to rise by 50% by 202036. Currently these emissions are excluded from any international climate change agreement and several proposals have been put forward to internalise the emissions resulting from international shipping. Placing a cap or levy on maritime emissions would not only reduce emissions from this sector but it could also raise up to USD 32 billion in international finance for biodiversity, climate change and development (see page 79).
Three main proposals have been put forward to raise revenue for the international shipping sector (Parker et. al, 2009)37. The first is a global sectoral Emission Trading Scheme (ETS) for shipping. The second option would impose a 1% levy on maritime transport freight charges operated by developed countries and 0.1% levy on developing countries. The final option would be to impose a tax on bunker fuels for refuelling ships. As discussed on page 79, international finance would be in competition with mitigation, adaptation and development goals. The estimate shown in the icon bar assumes that 25% of available finance would be allocated to biodiversity and ecosystem services.
Whilst the mechanisms described above have the potential to raise significant finance they are unlikely to have an impact on global maritime trade (Project Catalyst, 2009). Around USD 12 trillion worth of goods were traded in 2008, of which about 80% was transported by sea so a USD 32 billion tariff on the maritime sector would be equivalent to less than ½% price increase.
83
TIMEFRAME
SCALE
0.5–5USD bn
MARKET
PAYER
VALUE
LEVEL
TIMEFRAME
SCALE
0.4–8USD bn
MARKET
PAYER
VALUE
LEVEL
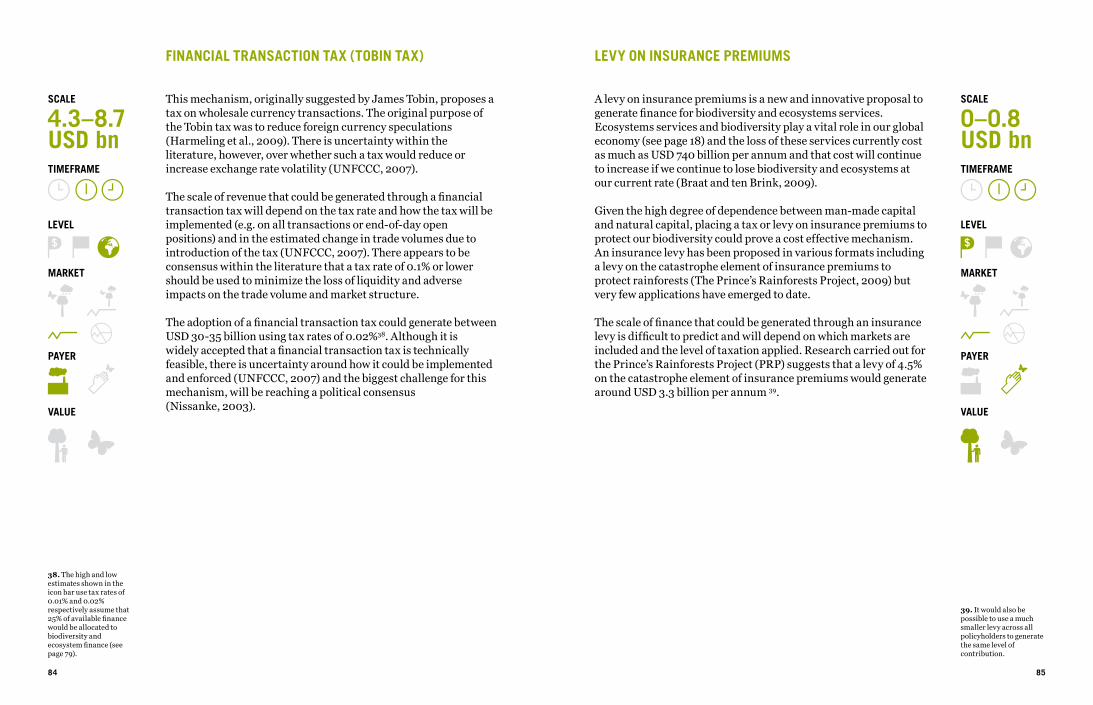
FINANCIAL TRANSACTION TAX (TOBIN TAX)
This mechanism, originally suggested by James Tobin, proposes a tax on wholesale currency transactions. The original purpose of the Tobin tax was to reduce foreign currency speculations (Harmeling et al., 2009). There is uncertainty within the literature, however, over whether such a tax would reduce or increase exchange rate volatility (UNFCCC, 2007).
The scale of revenue that could be generated through a financial transaction tax will depend on the tax rate and how the tax will be implemented (e.g. on all transactions or end-of-day open positions) and in the estimated change in trade volumes due to introduction of the tax (UNFCCC, 2007). There appears to be consensus within the literature that a tax rate of 0.1% or lower should be used to minimize the loss of liquidity and adverse impacts on the trade volume and market structure.
The adoption of a financial transaction tax could generate between USD 30-35 billion using tax rates of 0.02%38. Although it is widely accepted that a financial transaction tax is technically feasible, there is uncertainty around how it could be implemented and enforced (UNFCCC, 2007) and the biggest challenge for this mechanism, will be reaching a political consensus (Nissanke, 2003).
38. The high and low estimates shown in the icon bar use tax rates of 0.01% and 0.02% respectively assume that 25% of available finance would be allocated to biodiversity and ecosystem finance (see page 79).
84
39. It would also be possible to use a much smaller levy across all policyholders to generate the same level of contribution.
LEVY ON INSURANCE PREMIUMS
A levy on insurance premiums is a new and innovative proposal to generate finance for biodiversity and ecosystems services. Ecosystems services and biodiversity play a vital role in our global economy (see page 18) and the loss of these services currently cost as much as USD 740 billion per annum and that cost will continue to increase if we continue to lose biodiversity and ecosystems at our current rate (Braat and ten Brink, 2009).
Given the high degree of dependence between man-made capital and natural capital, placing a tax or levy on insurance premiums to protect our biodiversity could prove a cost effective mechanism. An insurance levy has been proposed in various formats including a levy on the catastrophe element of insurance premiums to protect rainforests (The Prince’s Rainforests Project, 2009) but very few applications have emerged to date.
The scale of finance that could be generated through an insurance levy is difficult to predict and will depend on which markets are included and the level of taxation applied. Research carried out for the Prince’s Rainforests Project (PRP) suggests that a levy of 4.5% on the catastrophe element of insurance premiums would generate around USD 3.3 billion per annum 39.
85
TIMEFRAME
SCALE
4.3–8.7USD bn
MARKET
PAYER
VALUE
LEVEL
TIMEFRAME
SCALE
0–0.8USD bn
MARKET
PAYER
VALUE
LEVEL

DELIVERY
UNDERSTANDING DELIVERY
The first chapter examined the different proposals for generating finance for biodiversity and ecosystems services; this second chapter explores the different options for delivering biodiversity finance in developing countries. As funds for biodiversity and ecosystems increase conservation and sustainable use, the international community will need appropriate financial instruments to deliver funding on the ground.
THE STATE OF PLAYPublic and private sector finance can use a variety of mechanisms including grants, debt and non-financial incentive to deliver financial resources; the choice of these instruments will depend on how and why the revenue is being delivered. Currently, finance is delivered through a fragmented approach with very little coordination at the international level outside the GEF. Under the CBD mandate, finance that is delivered through the Global Environment Facility (GEF) is done so using unconditional grants (see page 102).
A BRIEF HISTORYArticles 21 and 20 of the Convention state the following regarding the delivery of financial resources:
“Article 21(1): There shall be a mechanism for the provision of financial resources to developing country Parties for purposes of this Convention (…). Voluntary contributions may also be made by the developed country Parties and by other countries and sources. The mechanism shall operate within a democratic and transparent system of governance.”
“Article 20(3): The developed country Parties may also provide, and developing countries avail themselves of, financial resources related to the implementation of this Convention through bilateral, regional and other multilateral channels.”
In addition, a set of processes is being used by Parties under the CBD to define and communicate national financing priorities for biodiversity and ecosystem services, including the needs for establishing an ecologically representative network of protected areas.
88
National Biodiversity Strategies and Action Plans (NBSAPs) Article 6 of the Convention states that each Contracting Party shall, in accordance with its particular conditions and capabilities develop national strategies, plans or programmes for the conservation and sustainable use of biological diversity. To date, 170 Parties to the CBD (88%) have developed National Biodiversity Strategies and Action Plans (NBSAPs) or equivalent instruments, and 14 more have them under preparation. Some Parties are also developing biodiversity strategies and/or action plans at the sub-national level.
Ecological gap analyses under the PoWPAThe CBD Programme of Work on Protected Areas (PoWPA)1, adopted at COP 7 in 2004 Decision VII/28, is the most comprehensive plan of action for the development of participatory, ecologically representative and effectively managed national and regional systems of protected areas, integrating other land uses and contributing to human well-being. Parties were guided to begin this process by completing a gap analysis of their protected area systems with the full and effective participation of indigenous and local communities and relevant stakeholders by the end of 2006. Through their national gap analyses, which have been in large part supported by UNDP and the GEF, countries identified high priority areas to expand or improve their protected area networks.
National and subnational gap analyses are an essential step in the implementation of protected areas and might also serve as a useful tool for other UN conventions. It has been suggested that to facilitate early action on REDD, and to avoid duplication of effort, data already accrued for many developing countries within the CBD can be used to determine the best locations to deliver REDD finance (CBD, 2009).
89
1. For more information, visit www.cbd.int/protected
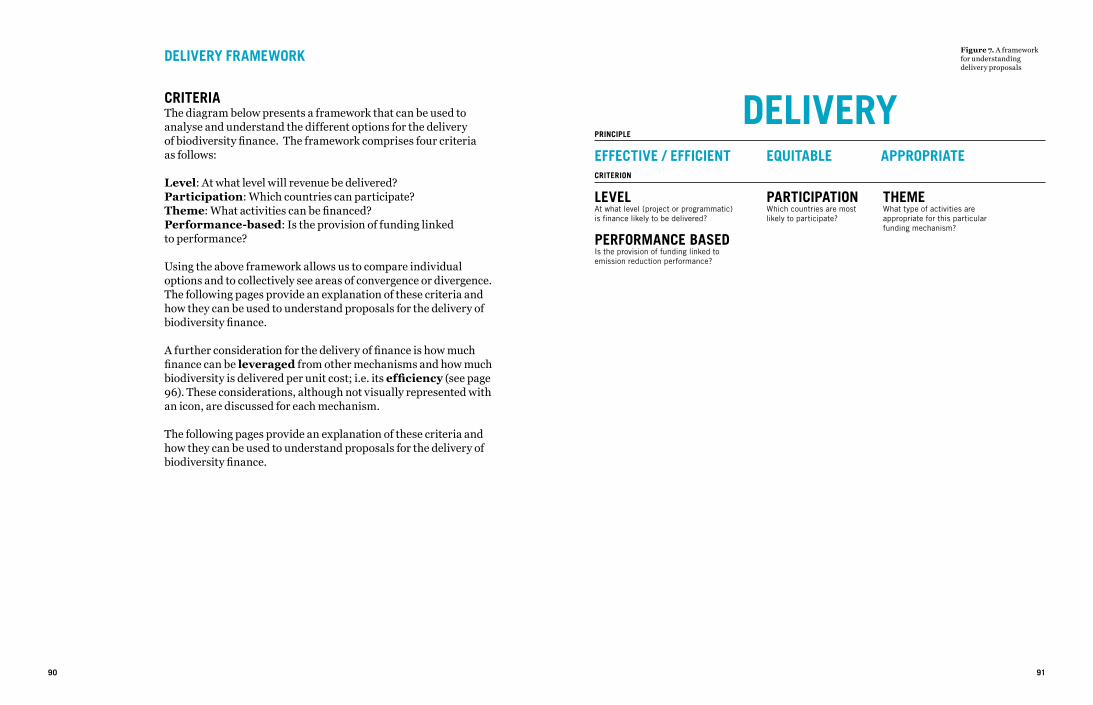
90 91
DELIVERY FRAMEWORK
CRITERIAThe diagram below presents a framework that can be used to analyse and understand the different options for the delivery of biodiversity finance. The framework comprises four criteria as follows:
Level: At what level will revenue be delivered? Participation: Which countries can participate? Theme: What activities can be financed? Performance-based: Is the provision of funding linked to performance?
Using the above framework allows us to compare individual options and to collectively see areas of convergence or divergence. The following pages provide an explanation of these criteria and how they can be used to understand proposals for the delivery of biodiversity finance.
A further consideration for the delivery of finance is how much finance can be leveraged from other mechanisms and how much biodiversity is delivered per unit cost; i.e. its efficiency (see page 96). These considerations, although not visually represented with an icon, are discussed for each mechanism.
The following pages provide an explanation of these criteria and how they can be used to understand proposals for the delivery of biodiversity finance.
Figure 7. A framework for understanding delivery proposals
EFFECTIVE / EFFICIENT
LEVELAt what level (project or programmatic) is finance likely to be delivered?
PERFORMANCE BASEDIs the provision of funding linked to emission reduction performance?
PRINCIPLE
CRITERION
EQUITABLE
PARTICIPATIONWhich countries are most likely to participate?
APPROPRIATE
THEME What type of activities are appropriate for this particular funding mechanism?
DELIVERY
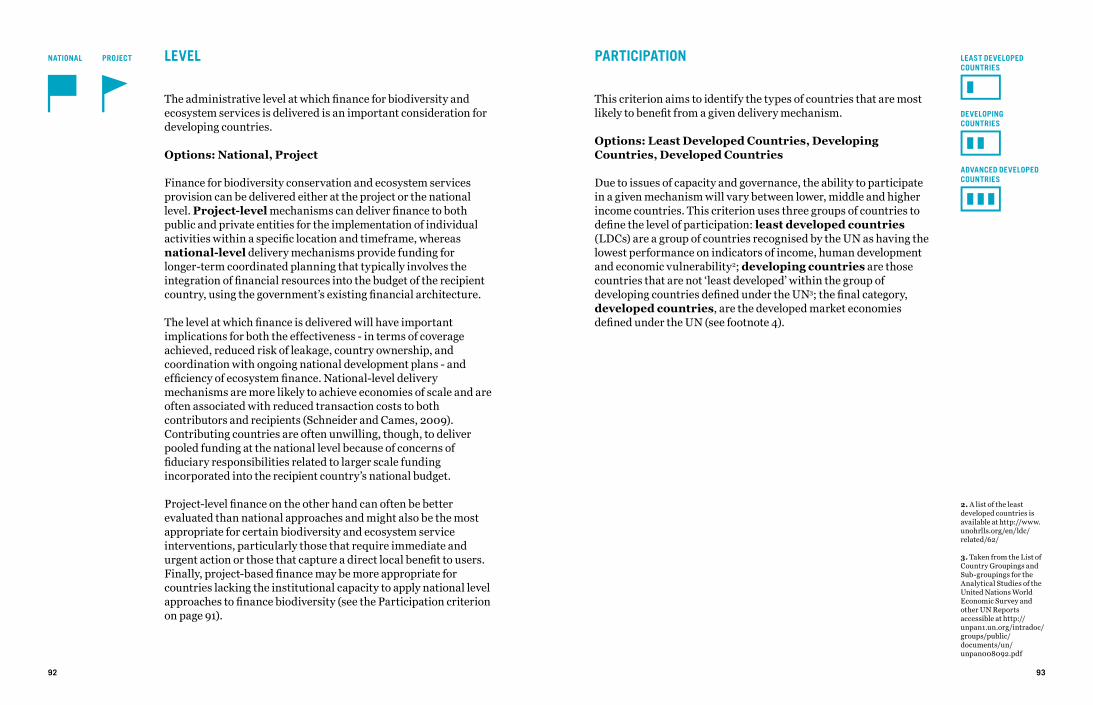
LEVEL
The administrative level at which finance for biodiversity and ecosystem services is delivered is an important consideration for developing countries.
Options: National, Project
Finance for biodiversity conservation and ecosystem services provision can be delivered either at the project or the national level. Project-level mechanisms can deliver finance to both public and private entities for the implementation of individual activities within a specific location and timeframe, whereas national-level delivery mechanisms provide funding for longer-term coordinated planning that typically involves the integration of financial resources into the budget of the recipient country, using the government’s existing financial architecture.
The level at which finance is delivered will have important implications for both the effectiveness - in terms of coverage achieved, reduced risk of leakage, country ownership, and coordination with ongoing national development plans - and efficiency of ecosystem finance. National-level delivery mechanisms are more likely to achieve economies of scale and are often associated with reduced transaction costs to both contributors and recipients (Schneider and Cames, 2009). Contributing countries are often unwilling, though, to deliver pooled funding at the national level because of concerns of fiduciary responsibilities related to larger scale funding incorporated into the recipient country’s national budget.
Project-level finance on the other hand can often be better evaluated than national approaches and might also be the most appropriate for certain biodiversity and ecosystem service interventions, particularly those that require immediate and urgent action or those that capture a direct local benefit to users. Finally, project-based finance may be more appropriate for countries lacking the institutional capacity to apply national level approaches to finance biodiversity (see the Participation criterion on page 91).
92
PARTICIPATION
This criterion aims to identify the types of countries that are most likely to benefit from a given delivery mechanism.
Options: Least Developed Countries, Developing Countries, Developed Countries
Due to issues of capacity and governance, the ability to participate in a given mechanism will vary between lower, middle and higher income countries. This criterion uses three groups of countries to define the level of participation: least developed countries (LDCs) are a group of countries recognised by the UN as having the lowest performance on indicators of income, human development and economic vulnerability2; developing countries are those countries that are not ‘least developed’ within the group of developing countries defined under the UN3; the final category, developed countries, are the developed market economies defined under the UN (see footnote 4).
93
NATIONAL PROJECT
2. A list of the least developed countries is available at http://www.unohrlls.org/en/ldc/related/62/
3. Taken from the List of Country Groupings and Sub-groupings for the Analytical Studies of the United Nations World Economic Survey and other UN Reports accessible at http://unpan1.un.org/intradoc/groups/public/documents/un/unpan008092.pdf
LEAST DEVELOPED COUNTRIES
DEVELOPING COUNTRIES
ADVANCED DEVELOPED COUNTRIES
94 95
CASE STUDYTHE BOLSA FLORESTA
The Bolsa Floresta Programme, in the Brazilian state of Amazonas, is a voluntary programme to reduce deforestation and promote sustainable development by rewarding the communities of the Amazon for its conservation. The programme was established in 2007 by the Government of the State of Amazonas, through its Secretariat for Environment and Sustainable Development, and is implemented by the Amazonas Sustainable Foundation5 (Fundação Amazonas Sustentáve; FAS) – an independent and non-profit NGO.
The Bolsa Floresta Program has four main components that support forest-friendly livelihoods and provide incentives for continued forest preservation:
• The Bolsa Floresta Income supports sustainable production of non-timber forest products (NTFP) such as nuts, fruits, vegetable oils, wood, honey, fish and others. The goal of the Income programme is to improve the efficiency of production chains, thus allowing more value to flow to the producer. All activities that do not lead to deforestation are eligible for this component.
• The Bolsa Floresta Social supports infrastructure improvements related to education, health, communication and transportation. The activities and projects are developed in partnership with government agencies and NGOs. The goal of the Social programme is to break the cycle of deforestation by providing key services that would otherwise be financed
4. An exchange rate of BRL 2 to USD 1 has been used throughout.
by converting tropical forests to other uses.
• The Bolsa Floresta Family is a monthly payment of USD 25 per month4 to the mothers of families that live in protected areas that agree to a zero deforestation goal. The payment is not intended to be the main source of household income, but is a supplement to reward households for forest conservation and provision of ecosystem services.
• The Bolsa Floresta Association aims to strengthen community-based organizations in the region. It provides additional financial support equivalent to 10% of the amount paid to all families registered in Bolsa Floresta Family in each protected area.
GENERATION OF FINANCEThe long-term financial sustainability of the Bolsa Floresta Program is guaranteed by an endowment fund of around USD 32 million, managed by FAS. The fund was established using grants from three major donors (Government of the State of Amazonas, Bradesco Bank and Coca-Cola Brazil). FAS uses the interest from the fund to pay for the Family component. In 2009, the Bolsa Floresta program also received USD 10 million from the Amazon Fund which it will earmark to finance the execution of the Income and Association components. It is estimated that this will benefit approximately 10,000 families across 10 million hectares of state protected areas.
DELIVERY OF FINANCEThe Family component of the Bolsa Floresta Programme currently delivers funds through unconditional grants (see page 102) from an endowment fund managed by FAS. Grants are delivered to the mother of each household - as mothers are often better at managing savings and are more likely to use the funds appropriately. Payments are delivered directly to the bank account of individual families registered in the program. The mothers have a bank card, which they can then use when they go to towns or cities.
The Association component, which provides a payment of an equivalent to 10% of the amount paid to all households thought the Family component (an average of USD 30,000 per year) into the Protected Area and is delivered to the Association by annual work plans.
Finance under the Income component, will be delivered to communities across 15 Protected Areas under the Programme to enhance the effectiveness of their economic activities. An estimated USD 70,000 per Protected Area per year has been set aside for this purpose.The Social component uses non-financial incentives to deliver finance through infrastructure projects such as schools, hospitals and transport networks.
It is important to mention that all the investments made in the Protected Areas are made in a participatory manner affix through local workshops, where FAS staff provides methodological assistance and facilitation and community members make investment decisions.
INSTITUTIONAL ARRANGEMENTSThe governance of the Bolsa Floresta Programme is designed to ensure credibility, transparency and participation. The management of the programme including management of the fund is coordinated by FAS, which has a board of directors from various representative segments of society (government, business, scientific, social and environmental) and a president. Accounting and audit for the programme are performed by third party organisations and statements of accounts are regularly forwarded to the District Attorney.
Virgilio Viana , João Tezza , Gabriel Ribenboim and Thais Megid Pinto , FAS
http://www.fas-amazonas.org/en/secao/forest-allowance-program
94 95
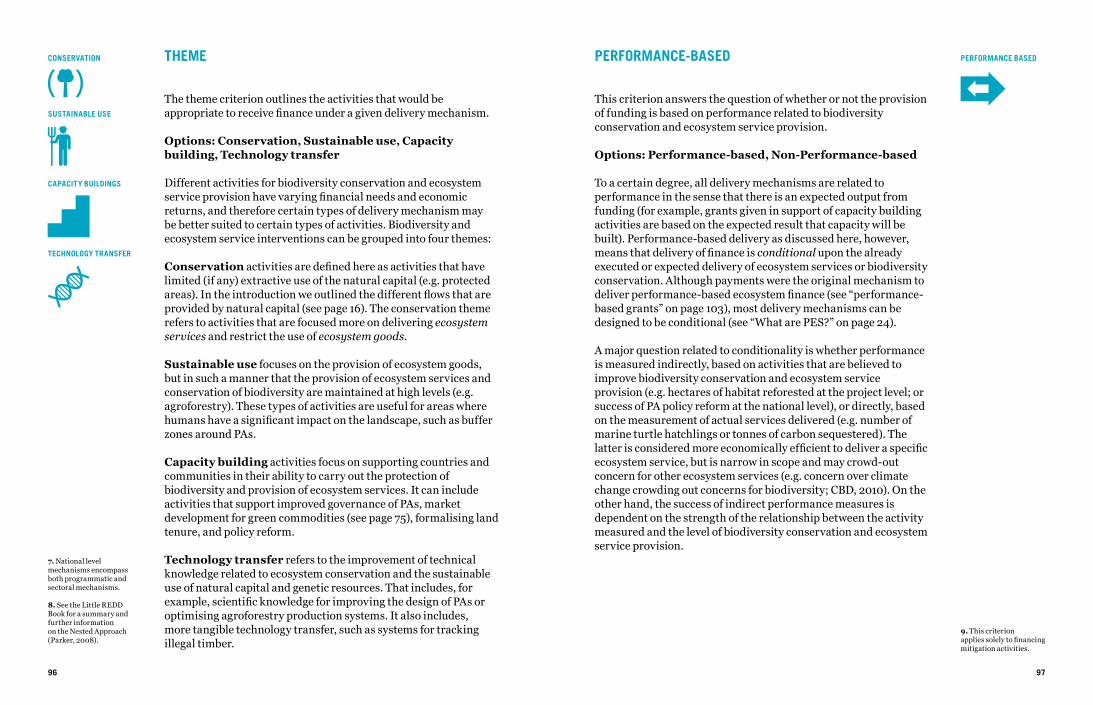
THEME
The theme criterion outlines the activities that would be appropriate to receive finance under a given delivery mechanism.
Options: Conservation, Sustainable use, Capacity building, Technology transfer
Different activities for biodiversity conservation and ecosystem service provision have varying financial needs and economic returns, and therefore certain types of delivery mechanism may be better suited to certain types of activities. Biodiversity and ecosystem service interventions can be grouped into four themes:
Conservation activities are defined here as activities that have limited (if any) extractive use of the natural capital (e.g. protected areas). In the introduction we outlined the different flows that are provided by natural capital (see page 16). The conservation theme refers to activities that are focused more on delivering ecosystem services and restrict the use of ecosystem goods.
Sustainable use focuses on the provision of ecosystem goods, but in such a manner that the provision of ecosystem services and conservation of biodiversity are maintained at high levels (e.g. agroforestry). These types of activities are useful for areas where humans have a significant impact on the landscape, such as buffer zones around PAs.
Capacity building activities focus on supporting countries and communities in their ability to carry out the protection of biodiversity and provision of ecosystem services. It can include activities that support improved governance of PAs, market development for green commodities (see page 75), formalising land tenure, and policy reform.
Technology transfer refers to the improvement of technical knowledge related to ecosystem conservation and the sustainable use of natural capital and genetic resources. That includes, for example, scientific knowledge for improving the design of PAs or optimising agroforestry production systems. It also includes, more tangible technology transfer, such as systems for tracking illegal timber.
CONSERVATION
96
PERFORMANCE BASEDPERFORMANCE-BASED
This criterion answers the question of whether or not the provision of funding is based on performance related to biodiversity conservation and ecosystem service provision.
Options: Performance-based, Non-Performance-based
To a certain degree, all delivery mechanisms are related to performance in the sense that there is an expected output from funding (for example, grants given in support of capacity building activities are based on the expected result that capacity will be built). Performance-based delivery as discussed here, however, means that delivery of finance is conditional upon the already executed or expected delivery of ecosystem services or biodiversity conservation. Although payments were the original mechanism to deliver performance-based ecosystem finance (see “performance-based grants” on page 103), most delivery mechanisms can be designed to be conditional (see “What are PES?” on page 24).
A major question related to conditionality is whether performance is measured indirectly, based on activities that are believed to improve biodiversity conservation and ecosystem service provision (e.g. hectares of habitat reforested at the project level; or success of PA policy reform at the national level), or directly, based on the measurement of actual services delivered (e.g. number of marine turtle hatchlings or tonnes of carbon sequestered). The latter is considered more economically efficient to deliver a specific ecosystem service, but is narrow in scope and may crowd-out concern for other ecosystem services (e.g. concern over climate change crowding out concerns for biodiversity; CBD, 2010). On the other hand, the success of indirect performance measures is dependent on the strength of the relationship between the activity measured and the level of biodiversity conservation and ecosystem service provision.
97
7. National level mechanisms encompass both programmatic and sectoral mechanisms. 8. See the Little REDD Book for a summary and further information on the Nested Approach (Parker, 2008).
9. This criterion applies solely to financing mitigation activities.
SUSTAINABLE USE
CAPACITY BUILDINGS
TECHNOLOGY TRANSFER
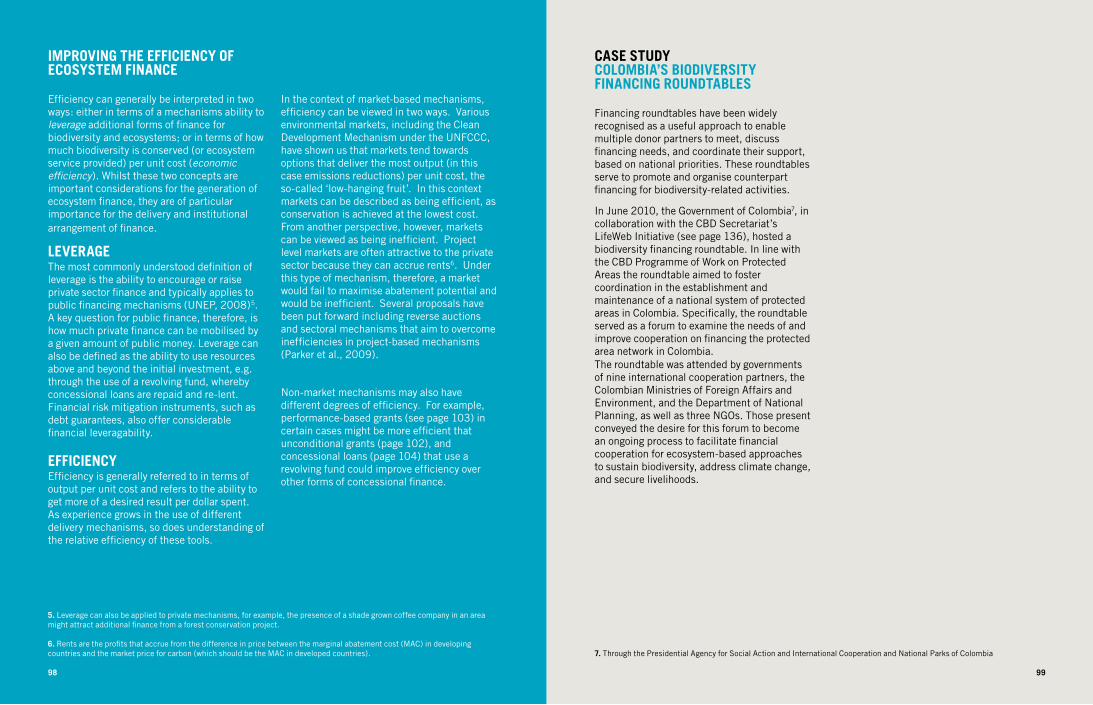
98 99
IMPROVING THE EFFICIENCY OF ECOSYSTEM FINANCE
Efficiency can generally be interpreted in two ways: either in terms of a mechanisms ability to leverage additional forms of finance for biodiversity and ecosystems; or in terms of how much biodiversity is conserved (or ecosystem service provided) per unit cost (economic efficiency). Whilst these two concepts are important considerations for the generation of ecosystem finance, they are of particular importance for the delivery and institutional arrangement of finance.
LEVERAGEThe most commonly understood definition of leverage is the ability to encourage or raise private sector finance and typically applies to public financing mechanisms (UNEP, 2008)5. A key question for public finance, therefore, is how much private finance can be mobilised by a given amount of public money. Leverage can also be defined as the ability to use resources above and beyond the initial investment, e.g. through the use of a revolving fund, whereby concessional loans are repaid and re-lent. Financial risk mitigation instruments, such as debt guarantees, also offer considerable financial leveragability.
EFFICIENCYEfficiency is generally referred to in terms of output per unit cost and refers to the ability to get more of a desired result per dollar spent. As experience grows in the use of different delivery mechanisms, so does understanding of the relative efficiency of these tools.
5. Leverage can also be applied to private mechanisms, for example, the presence of a shade grown coffee company in an area might attract additional finance from a forest conservation project.
6. Rents are the profits that accrue from the difference in price between the marginal abatement cost (MAC) in developing countries and the market price for carbon (which should be the MAC in developed countries).
In the context of market-based mechanisms, efficiency can be viewed in two ways. Various environmental markets, including the Clean Development Mechanism under the UNFCCC, have shown us that markets tend towards options that deliver the most output (in this case emissions reductions) per unit cost, the so-called ‘low-hanging fruit’. In this context markets can be described as being efficient, as conservation is achieved at the lowest cost. From another perspective, however, markets can be viewed as being inefficient. Project level markets are often attractive to the private sector because they can accrue rents6. Under this type of mechanism, therefore, a market would fail to maximise abatement potential and would be inefficient. Several proposals have been put forward including reverse auctions and sectoral mechanisms that aim to overcome inefficiencies in project-based mechanisms (Parker et al., 2009).
Non-market mechanisms may also have different degrees of efficiency. For example, performance-based grants (see page 103) in certain cases might be more efficient that unconditional grants (page 102), and concessional loans (page 104) that use a revolving fund could improve efficiency over other forms of concessional finance.
CASE STUDYCOLOMBIA’S BIODIVERSITY FINANCING ROUNDTABLES
Financing roundtables have been widely recognised as a useful approach to enable multiple donor partners to meet, discuss financing needs, and coordinate their support, based on national priorities. These roundtables serve to promote and organise counterpart financing for biodiversity-related activities.
In June 2010, the Government of Colombia7, in collaboration with the CBD Secretariat’s LifeWeb Initiative (see page 136), hosted a biodiversity financing roundtable. In line with the CBD Programme of Work on Protected Areas the roundtable aimed to foster coordination in the establishment and maintenance of a national system of protected areas in Colombia. Specifically, the roundtable served as a forum to examine the needs of and improve cooperation on financing the protected area network in Colombia. The roundtable was attended by governments of nine international cooperation partners, the Colombian Ministries of Foreign Affairs and Environment, and the Department of National Planning, as well as three NGOs. Those present conveyed the desire for this forum to become an ongoing process to facilitate financial cooperation for ecosystem-based approaches to sustain biodiversity, address climate change, and secure livelihoods.
7. Through the Presidential Agency for Social Action and International Cooperation and National Parks of Colombia
98 99

DELIVERY PROPOSALS
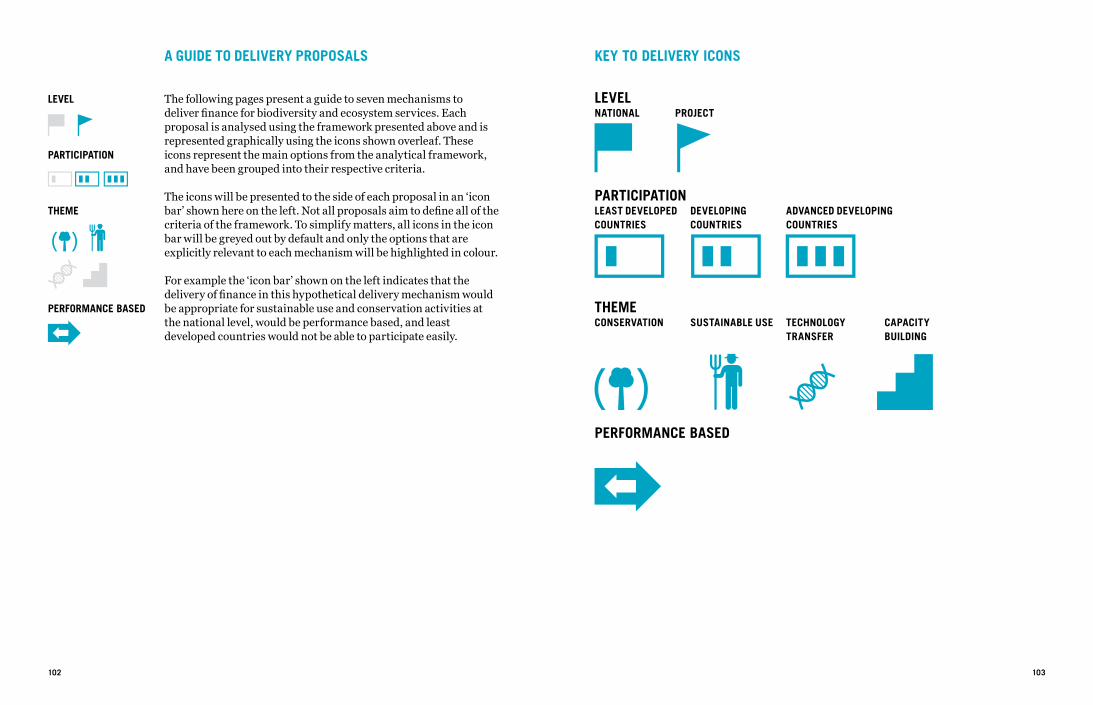
A GUIDE TO DELIVERY PROPOSALS
The following pages present a guide to seven mechanisms to deliver finance for biodiversity and ecosystem services. Each proposal is analysed using the framework presented above and is represented graphically using the icons shown overleaf. These icons represent the main options from the analytical framework, and have been grouped into their respective criteria.
The icons will be presented to the side of each proposal in an ‘icon bar’ shown here on the left. Not all proposals aim to define all of the criteria of the framework. To simplify matters, all icons in the icon bar will be greyed out by default and only the options that are explicitly relevant to each mechanism will be highlighted in colour.
For example the ‘icon bar’ shown on the left indicates that the delivery of finance in this hypothetical delivery mechanism would be appropriate for sustainable use and conservation activities at the national level, would be performance based, and least developed countries would not be able to participate easily.
102 103
PERFORMANCE BASED
LEVEL
PARTICIPATION
THEME
KEY TO DELIVERY ICONS
LEVELNATIONAL PROJECT
PARTICIPATIONLEAST DEVELOPED DEVELOPING ADVANCED DEVELOPINGCOUNTRIES COUNTRIES COUNTRIES
THEMECONSERVATION SUSTAINABLE USE TECHNOLOGY CAPACITY TRANSFER BUILDING
PERFORMANCE BASED
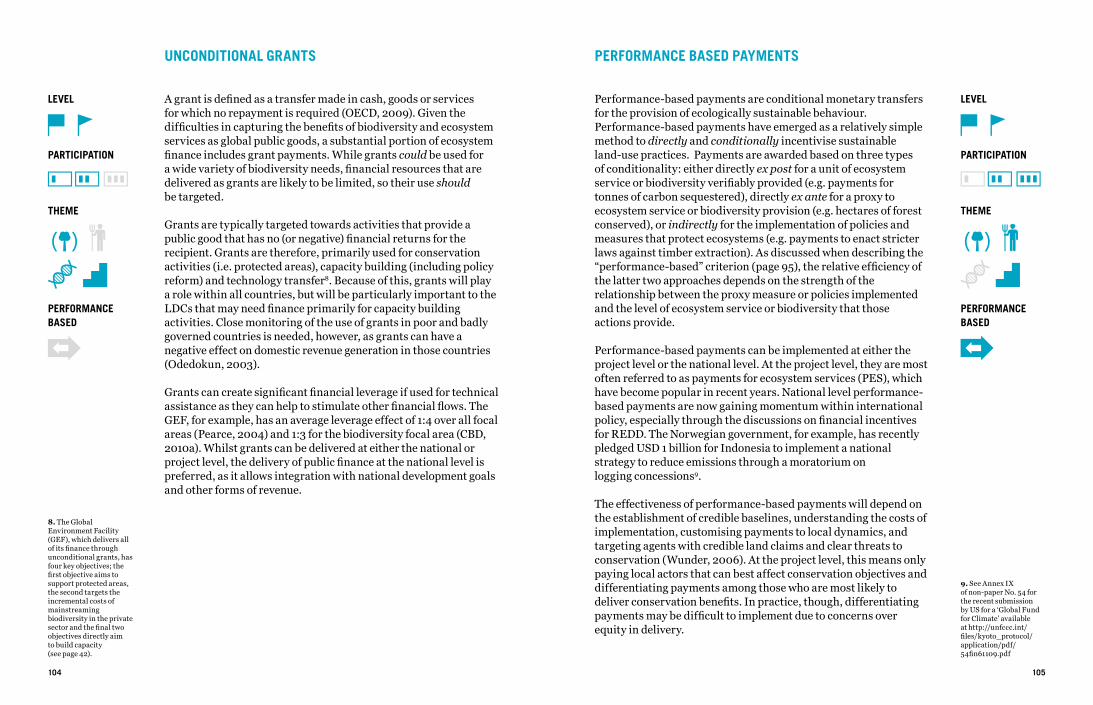
UNCONDITIONAL GRANTS
A grant is defined as a transfer made in cash, goods or services for which no repayment is required (OECD, 2009). Given the difficulties in capturing the benefits of biodiversity and ecosystem services as global public goods, a substantial portion of ecosystem finance includes grant payments. While grants could be used for a wide variety of biodiversity needs, financial resources that are delivered as grants are likely to be limited, so their use should be targeted.
Grants are typically targeted towards activities that provide a public good that has no (or negative) financial returns for the recipient. Grants are therefore, primarily used for conservation activities (i.e. protected areas), capacity building (including policy reform) and technology transfer8. Because of this, grants will play a role within all countries, but will be particularly important to the LDCs that may need finance primarily for capacity building activities. Close monitoring of the use of grants in poor and badly governed countries is needed, however, as grants can have a negative effect on domestic revenue generation in those countries (Odedokun, 2003).
Grants can create significant financial leverage if used for technical assistance as they can help to stimulate other financial flows. The GEF, for example, has an average leverage effect of 1:4 over all focal areas (Pearce, 2004) and 1:3 for the biodiversity focal area (CBD, 2010a). Whilst grants can be delivered at either the national or project level, the delivery of public finance at the national level is preferred, as it allows integration with national development goals and other forms of revenue.
104
PERFORMANCE BASED PAYMENTS
Performance-based payments are conditional monetary transfers for the provision of ecologically sustainable behaviour. Performance-based payments have emerged as a relatively simple method to directly and conditionally incentivise sustainable land-use practices. Payments are awarded based on three types of conditionality: either directly ex post for a unit of ecosystem service or biodiversity verifiably provided (e.g. payments for tonnes of carbon sequestered), directly ex ante for a proxy to ecosystem service or biodiversity provision (e.g. hectares of forest conserved), or indirectly for the implementation of policies and measures that protect ecosystems (e.g. payments to enact stricter laws against timber extraction). As discussed when describing the “performance-based” criterion (page 95), the relative efficiency of the latter two approaches depends on the strength of the relationship between the proxy measure or policies implemented and the level of ecosystem service or biodiversity that those actions provide.
Performance-based payments can be implemented at either the project level or the national level. At the project level, they are most often referred to as payments for ecosystem services (PES), which have become popular in recent years. National level performance-based payments are now gaining momentum within international policy, especially through the discussions on financial incentives for REDD. The Norwegian government, for example, has recently pledged USD 1 billion for Indonesia to implement a national strategy to reduce emissions through a moratorium on logging concessions9.
The effectiveness of performance-based payments will depend on the establishment of credible baselines, understanding the costs of implementation, customising payments to local dynamics, and targeting agents with credible land claims and clear threats to conservation (Wunder, 2006). At the project level, this means only paying local actors that can best affect conservation objectives and differentiating payments among those who are most likely to deliver conservation benefits. In practice, though, differentiating payments may be difficult to implement due to concerns over equity in delivery.
8. The Global Environment Facility (GEF), which delivers all of its finance through unconditional grants, has four key objectives; the first objective aims to support protected areas, the second targets the incremental costs of mainstreaming biodiversity in the private sector and the final two objectives directly aim to build capacity (see page 42).
9. See Annex IX of non-paper No. 54 for the recent submission by US for a ‘Global Fund for Climate’ available at http://unfccc.int/ files/kyoto_protocol/application/pdf/ 54fin61109.pdf
105
PERFORMANCE BASED
LEVEL
PARTICIPATION
THEME
PERFORMANCE BASED
LEVEL
PARTICIPATION
THEME
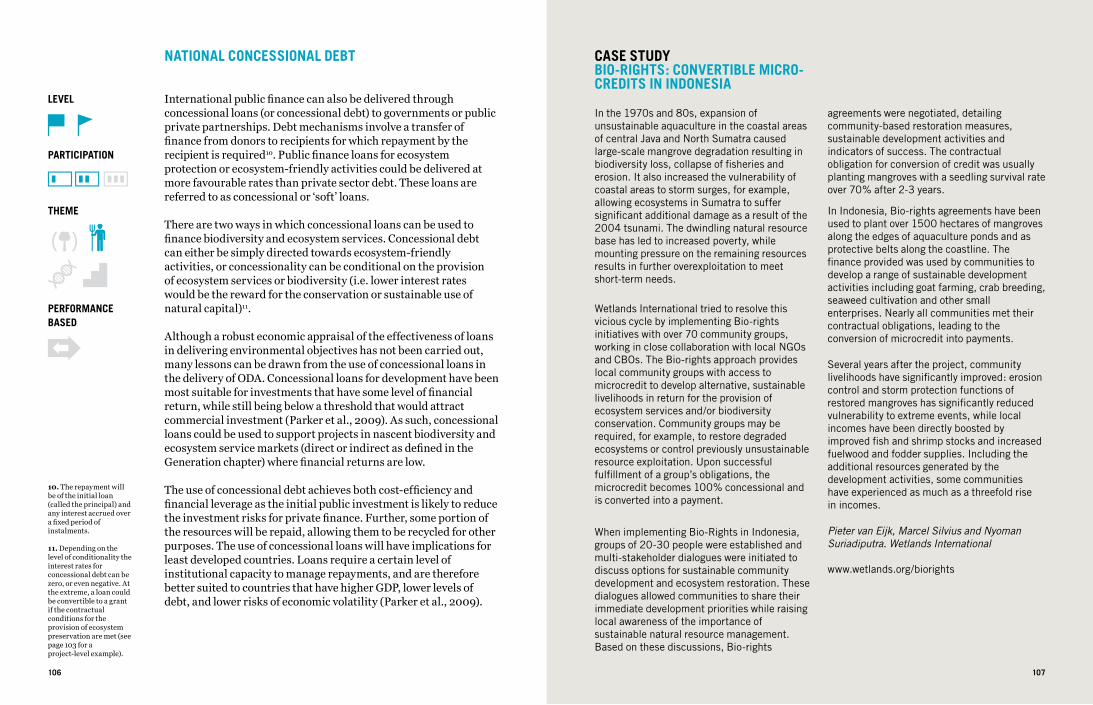
NATIONAL CONCESSIONAL DEBT
International public finance can also be delivered through concessional loans (or concessional debt) to governments or public private partnerships. Debt mechanisms involve a transfer of finance from donors to recipients for which repayment by the recipient is required10. Public finance loans for ecosystem protection or ecosystem-friendly activities could be delivered at more favourable rates than private sector debt. These loans are referred to as concessional or ‘soft’ loans.
There are two ways in which concessional loans can be used to finance biodiversity and ecosystem services. Concessional debt can either be simply directed towards ecosystem-friendly activities, or concessionality can be conditional on the provision of ecosystem services or biodiversity (i.e. lower interest rates would be the reward for the conservation or sustainable use of natural capital)11.
Although a robust economic appraisal of the effectiveness of loans in delivering environmental objectives has not been carried out, many lessons can be drawn from the use of concessional loans in the delivery of ODA. Concessional loans for development have been most suitable for investments that have some level of financial return, while still being below a threshold that would attract commercial investment (Parker et al., 2009). As such, concessional loans could be used to support projects in nascent biodiversity and ecosystem service markets (direct or indirect as defined in the Generation chapter) where financial returns are low.
The use of concessional debt achieves both cost-efficiency and financial leverage as the initial public investment is likely to reduce the investment risks for private finance. Further, some portion of the resources will be repaid, allowing them to be recycled for other purposes. The use of concessional loans will have implications for least developed countries. Loans require a certain level of institutional capacity to manage repayments, and are therefore better suited to countries that have higher GDP, lower levels of debt, and lower risks of economic volatility (Parker et al., 2009).
10. The repayment will be of the initial loan (called the principal) and any interest accrued over a fixed period of instalments.
11. Depending on the level of conditionality the interest rates for concessional debt can be zero, or even negative. At the extreme, a loan could be convertible to a grant if the contractual conditions for the provision of ecosystem preservation are met (see page 103 for a project-level example).
106 107
CASE STUDYBIO-RIGHTS: CONVERTIBLE MICRO-CREDITS IN INDONESIA
In the 1970s and 80s, expansion of unsustainable aquaculture in the coastal areas of central Java and North Sumatra caused large-scale mangrove degradation resulting in biodiversity loss, collapse of fisheries and erosion. It also increased the vulnerability of coastal areas to storm surges, for example, allowing ecosystems in Sumatra to suffer significant additional damage as a result of the 2004 tsunami. The dwindling natural resource base has led to increased poverty, while mounting pressure on the remaining resources results in further overexploitation to meet short-term needs.
Wetlands International tried to resolve this vicious cycle by implementing Bio-rights initiatives with over 70 community groups, working in close collaboration with local NGOs and CBOs. The Bio-rights approach provides local community groups with access to microcredit to develop alternative, sustainable livelihoods in return for the provision of ecosystem services and/or biodiversity conservation. Community groups may be required, for example, to restore degraded ecosystems or control previously unsustainable resource exploitation. Upon successful fulfillment of a group’s obligations, the microcredit becomes 100% concessional and is converted into a payment.
When implementing Bio-Rights in Indonesia, groups of 20-30 people were established and multi-stakeholder dialogues were initiated to discuss options for sustainable community development and ecosystem restoration. These dialogues allowed communities to share their immediate development priorities while raising local awareness of the importance of sustainable natural resource management. Based on these discussions, Bio-rights
agreements were negotiated, detailing community-based restoration measures, sustainable development activities and indicators of success. The contractual obligation for conversion of credit was usually planting mangroves with a seedling survival rate over 70% after 2-3 years.
In Indonesia, Bio-rights agreements have been used to plant over 1500 hectares of mangroves along the edges of aquaculture ponds and as protective belts along the coastline. The finance provided was used by communities to develop a range of sustainable development activities including goat farming, crab breeding, seaweed cultivation and other small enterprises. Nearly all communities met their contractual obligations, leading to the conversion of microcredit into payments.
Several years after the project, community livelihoods have significantly improved: erosion control and storm protection functions of restored mangroves has significantly reduced vulnerability to extreme events, while local incomes have been directly boosted by improved fish and shrimp stocks and increased fuelwood and fodder supplies. Including the additional resources generated by the development activities, some communities have experienced as much as a threefold rise in incomes.
Pieter van Eijk, Marcel Silvius and Nyoman Suriadiputra. Wetlands International
www.wetlands.org/biorights
PERFORMANCE BASED
LEVEL
PARTICIPATION
THEME
107
MICROFINANCE
Microfinance12 is the provision of financial services (lending, savings and insurance) to poorer households and communities or small- and medium-sized enterprises that lack access to formal financial institutions. Microcredit currently provides the best-developed microfinance mechanism for delivering ecosystem finance and so is the focus here. Microcredit involves offering small loans to groups or individuals to help build up their assets, establish or develop a business or protect against risks (Agrawala and Carraro, 2010).
Lack of financing is often a major hurdle for poorer communities to transition to more sustainable livelihoods. By financing that transition rather than paying for provision of ecosystem services, it is hoped that once financing stops, reconversion to unsustainable activities is less likely. Payments can be used to finance transition costs, but where some financial returns can be expected from the transition, microfinance may be a more efficient mechanism to deliver ecosystem finance.
As with national concessional debt, Microfinance institutions (MFIs) can either choose to selectively support sustainable and biodiversity-friendly enterprises (such as eco-tourism and green commodity production)13 or incorporate a level of environmental conditionality on lending. Conditionality can be implemented in two ways; either by incorporating conditions for future lending based on current ecosystem preservation (as discussed under ‘Environmental mortgages’ on page 107) or by accepting lower repayment when borrowers carry out specified ecosystem preservation activities (as with national concessional debt, see page 104). At the extreme, microcredit could be 100% concessional and converted to a payment when the conditionality is met (see the case study on Bio-rights on page 105).
Whichever model is used microfinance, if applied correctly, achieves both cost-efficiency and financial leverage. The use of microfinance may, however, require complementary grant-based finance (particularly in developing and least developed countries) to ensure that household and community borrowers have access to profitable markets and repayment is not overly burdensome.
12. Microfinance is broadly used here to discuss both micro- and meso-finance.
13. A few funds supported by NGOs and IGOs such as Verde Ventures (Conservation International) and Proyecto CAMBIO (Central American Bank for Economic Integration, United Nations Development Program, and Global Environment Facility) have already been established along these lines
108 109
CASE STUDYENVIRONMENTAL MORTGAGES FOR MARINE TURTLE CONSERVATION
Marine turtles suffer from a suite of human impacts. As such, these species are highly endangered; loggerhead turtles, for example, may be extinct in 50 years. Some governments have taken steps to minimise impacts on marine turtles through command and control approaches limiting coastal development and regulating fisheries, at some cost to the public and private sectors. The efficacy of these conservation actions can be compromised, however, by other activities like the direct harvest of eggs and adults for subsistence domestically and sale in foreign markets. That threat is particularly acute in coastal communities where there are few alternative sources of income.
Where direct regulation of unsustainable activities is likely to be ineffective due to local economic pressures, the primary question is how to overcome the lack of alternative livelihoods and reduce the unsustainable resource use that results from it. One possibility would be to use an “environmental mortgage” approach. An environmental mortgage programme would establish a community conservation lending trust. Community members could qualify for low interest lines of credit provided by the trust, with the total credit available conditionally linked to preservation of some environmental asset. In the case of coastal communities harvesting sea turtles, the credit available would depend on the annual number of sea turtle hatchlings (i.e. a direct ex-post conditionality, see page 95 and 103). Loans could be used for a range of pre-approved ventures, from improved agricultural production on existing cultivated lands to alternative economic activities to infrastructure
improvements in order to improve market access.
Given the success of microfinance institutions in alleviating poverty over the past two decades, environmental mortgages provide a promising approach for linking sustainable development and incentives for environmental stewardship. Today, environmental assets are often valued solely for their extractive uses, and much of that extraction is unsustainable, often due to a lack of alternatives. If challenges in design and implementation can be overcome, environmental mortgages would capitalise the value of conserving environmental assets, and provide not only the incentive, but also the means for low-impact livelihoods and development.
C. Josh Donlan, Advanced Conservation Strategies
www.advancedconservation.org
For more information see Mandel, J., C. J. Donlan, C. Wilcox, R. Cudney-Bueno, S. Pascoe, and D. Tulchin. 2009. Debt investment as a tool for value transfer in biodiversity conservation Conservation Letters 2:233-239
PERFORMANCE BASED
LEVEL
PARTICIPATION
THEME
NON-FINANCIAL INCENTIVES
Non-financial incentives reward ecosystem-friendly behaviour by offering non-financial benefits (e.g. strengthening of property rights) or specific in-kind payments (i.e. a local school). They can be unconditional, but are usually to some degree conditional on biodiversity conservation or ecosystem service provision.While cash payments are theoretically preferred in situations where providers forgo income to deliver ecosystem services, in cases where they have been implemented the benefits from cash payments are often ‘insignificant’ (Porras et al., 2008) or do not overcome opportunity costs (Wunder, 2005, Kosoy et al., 2007). In contrast, non-financial benefits are believed to be a key reason for participating in PES schemes. For example, strengthening property rights, capacity building, and improvements in social organisation and quality of life are often cited as motivating participation in payments for watershed services (Porras et al., 2008).
Cash payments are also traditionally preferred because money is considered to be flexible. But where absorptive capacity is an issue in-kind payments are a more rational choice (Asquith et al., 2008). Without these financial options, there is higher risk that cash will be spent on non-necessary consumption (e.g. alcohol or other luxury goods). Although that occurrence is context-dependent, some ecosystem service providers themselves echo this sentiment and prefer receiving non-financial incentives For example, in designing the Los Negros watershed programme (see page 109), future recipients of payments were concerned that cash did not provide a lasting benefit (Robertson and Wunder, 2005).
There are also psychological benefits to non-financial incentives. Payments can crowd-out already existing altruistic or cultural motivations for providing ecosystem services (Farley and Costanza, 2010); they may also be viewed as entitlements over time thus diminishing their ability to incentivise (Sommerville et al., 2009); and can cause fears of land expropriation (Robertson and Wunder, 2005). The decision between financial and non-financial incentives is highly context-specific, however, and so ecosystem service buyers must investigate in advance the mode of incentives local people prefer (Wunder, 2005).
110 111
CASE STUDYPAYMENTS FOR WATERSHED SERVICES IN LOS NEGROS, BOLIVIA
Agriculture is a key activity in the Los Negros River region of Bolivia and heavily relies on irrigation from the river due to the semi-arid climate of the area. Since the late 1980s, the downstream agricultural zone experienced a 50% reduction in water levels, attributed by downstream farmers to increased upriver water use and deforestation at the headwaters. To support restoration of water levels, Fundación Natura Bolivia developed a payment for watershed services (PWS) programme to compensate upstream farmers to conserve forest. Not only does this provide watershed services, but also delivers biodiversity conservation as the watershed borders the Amboró National Park.
Based on the preferences of upstream farmers (who receive payments) the programme uses non-financial incentives in the form of artificial beehives (as well as technical training in many cases) instead of cash payments. Through a process of stakeholder engagement several key lessons were learnt on the design and use of non-financial incentives instead of (or to complement) cash payments.
Firstly, it was considered important that the incentive provide long-run benefits either in the form of social benefits (such as schools or infrastructure) or by supporting alternative livelihoods. In both cases, but particularly in the case of alternative livelihoods, the incentive should help produce a genuinely marketable product and the livelihood should preferably depend on, or at least permit, ecosystem service co-production. Apiculture (bee keeping) was an appropriate alternative livelihood because it produces honey (a locally useful subsistence product) and incentivises forest conservation to protect bee habitat (ecosystem co-production).
Another crucial consideration in incentive design was strengthening land tenure claims. Improving property rights is often cited as a reason for participation in PWS schemes. In the case of Los Negros, the inclusion of land as part of the scheme strengthens the idea it is being used and is owned by someone. Some participants have even suggested changing the in-kind payment from beehives to barbed wire, or some other support for delineating their land claim.
Finally, in relation to delivery of the incentive, the Los Negros experience highlights three important points: firstly, training costs must be considered in the budgeting of the scheme and incentive design. This is important for any scheme that requires alternative land uses, but particularly important for in-kind payments that provide new equipment technologies for alternative livelihoods; secondly, the incentive should be as flexible as possible to meet participants’ needs; and finally where the incentive is in part an alternative livelihood, access to markets and market creation for new products arising from this livelihood will allow the new livelihood to be adopted more effectively.
For more information see Asquith et al., 2008 or go to www.naturabolivia.org
PERFORMANCE BASED
LEVEL
PARTICIPATION
THEME

POSITIVE TAX INCENTIVES
Governments can use positive tax incentives (specifically tax credits and tax exemptions) to promote ecosystem-friendly behaviour among businesses and land users. Positive tax incentives use domestic policy to deliver finance directly from a government’s budget. Biodiversity-related tax credits and exemptions would therefore likely be most politically feasible if the revenue for tax incentives were generated by an ecosystem-focused revenue generation mechanism (direct or linked as described in the Generation section).
Positive tax incentives take many forms and are found in a range of jurisdictions but are still not used to their potential (TEEB, 2009b). They are most commonly used to reward landowners that currently undertake biodiversity conservation or forgo future development in order to safeguard habitats (i.e. conservation easements). But positive tax incentives are not limited to rewarding sustainable land use, they can also reward ecosystem-friendly behaviour by businesses and investors.
Whilst revenue generation mechanisms that negatively incentivise biodiversity impacts (e.g. subsidy reform and natural capital taxes) are politically difficult to implement (OECD, 2005), positive incentives such as tax credits are more politically palatable. In general, however, it is preferable to tax negative impacts rather than subsidise preferable outcomes as there might be a tendency for companies or land users - who would have changed practices without the additional incentive - to take advantage of financial support (Stern, 2006).
Depending on the level at which incentives are set, positive tax incentives can leverage additional finance from personal values held by landowners (Boyd et al., 1999) or in the case of business directly from the private sector. More information is required, however, on the environmental impacts of such measures to better understand their effectiveness in achieving environmental outcomes.
112
CASE STUDYSUPPLEMENTARY BIODIVERSITY PAYMENTS FOR REDD+
An international climate finance mechanism for reducing emissions from deforestation (REDD+) is expected to provide substantial benefits for biodiversity. By financing the conservation of tropical forests for their greenhouse gas abatement value, REDD+ would be safeguarding habitat for the majority of the world’s terrestrial species as well. But conservationists have an opportunity to increase the biodiversity benefits of REDD+ still further. By supplementing REDD+ finance with biodiversity payments, conservation organisations could guide market demand for REDD+ toward high-biodiversity forests. By leveraging the vast infrastructure being put in place for REDD+ - systems for forest conservation, monitoring, accounting and governance - transaction and startup costs could be far lower than under a project-by-project approach to biodiversity conservation.
Simulations using the OSIRIS model indicate that supplementing carbon finance with biodiversity payments would not only increase biodiversity benefits, but carbon benefits as well. In some forests carbon finance alone may be enough to incentivize conservation. But in forests where carbon finance alone is insufficient, biodiversity payments would act as a subsidy, allowing combined carbon and biodiversity payments to conserve forests where costs would otherwise be too high.
A price premium for emissions reductions originating in high-biodiversity forests could be paid either by existing buyers of REDD+, or by a new set of buyers interested primarily in forest biodiversity. This price premium could be paid through:
• Providing additional up-front finance to develop high-biodiversity REDD+ programs or projects;
• Purchasing high-biodiversity REDD+ credits above market price and reselling at regular market price; or
• Rewarding sellers of high-biodiversity REDD+ credits with a “biodiversity matching payment”.
To implement any of these supplemental biodiversity payment methods, three additional global institutional investments would be useful:
A registry identifying the spatial origin of emission reductions would allow potential buyers of biodiversity to decide which forests are rich enough in biodiversity to merit a price premium. This registry may already be an important feature of international or national REDD+ programs even in the absence of supplemental biodiversity finance.
Standardised, accepted metrics for quantitatively differentiating forests’ relative biodiversity value would relieve individual buyers of the cost of gathering this information. Arriving at appropriate and accurate metrics for biodiversity value should result from an independent, transparent and science-based process, and need not be under the auspices of the UNFCCC.
A centralized institution ccould consolidate demand for the biodiversity benefits of avoided deforestation from many small and geographically dispersed potential buyers.
Jonah Busch, Ph.D. (Conservation International)See Busch, J. “Mechanisms for increasing the biodiversity benefit of reducing emissions from deforestation.”
http://www.conservation.org/osiris
PERFORMANCE BASED
LEVEL
PARTICIPATION
THEME
113
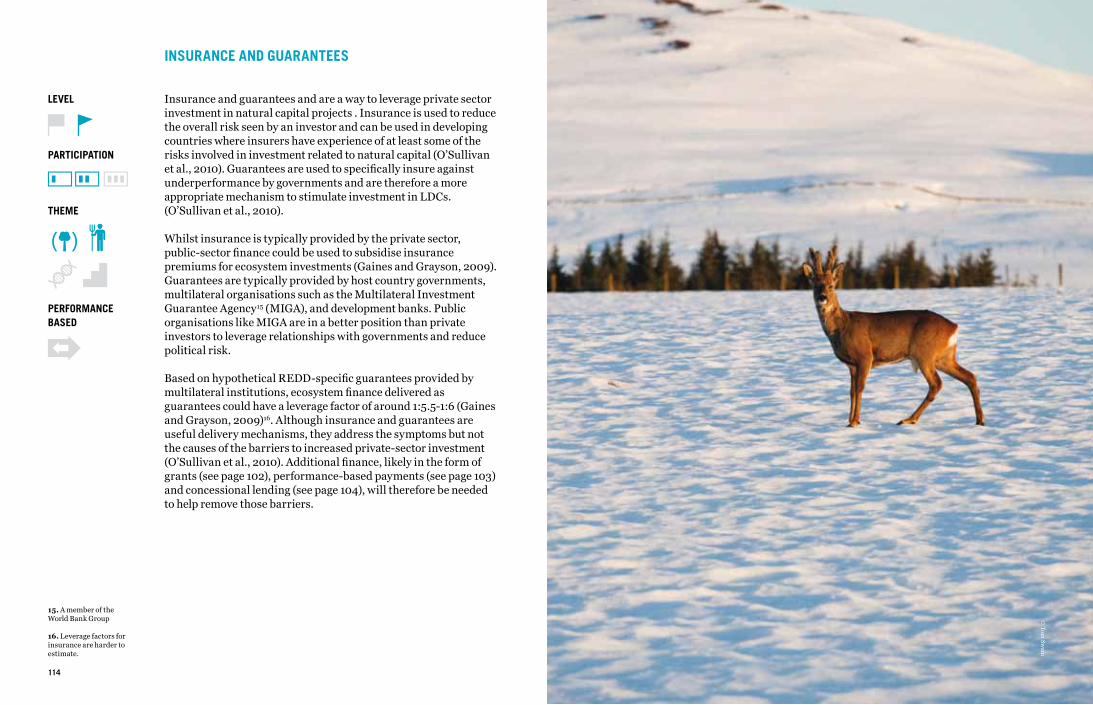
114 115
INSURANCE AND GUARANTEES
Insurance and guarantees and are a way to leverage private sector investment in natural capital projects . Insurance is used to reduce the overall risk seen by an investor and can be used in developing countries where insurers have experience of at least some of the risks involved in investment related to natural capital (O’Sullivan et al., 2010). Guarantees are used to specifically insure against underperformance by governments and are therefore a more appropriate mechanism to stimulate investment in LDCs. (O’Sullivan et al., 2010).
Whilst insurance is typically provided by the private sector, public-sector finance could be used to subsidise insurance premiums for ecosystem investments (Gaines and Grayson, 2009). Guarantees are typically provided by host country governments, multilateral organisations such as the Multilateral Investment Guarantee Agency15 (MIGA), and development banks. Public organisations like MIGA are in a better position than private investors to leverage relationships with governments and reduce political risk.
Based on hypothetical REDD-specific guarantees provided by multilateral institutions, ecosystem finance delivered as guarantees could have a leverage factor of around 1:5.5-1:6 (Gaines and Grayson, 2009)16. Although insurance and guarantees are useful delivery mechanisms, they address the symptoms but not the causes of the barriers to increased private-sector investment (O’Sullivan et al., 2010). Additional finance, likely in the form of grants (see page 102), performance-based payments (see page 103) and concessional lending (see page 104), will therefore be needed to help remove those barriers.
15. A member of the World Bank Group
16. Leverage factors for insurance are harder to estimate.
PERFORMANCE BASED
LEVEL
PARTICIPATION
THEME
© T
om Sw
ain

INSTITUTIONAL ARRANGEMENTS

118 119
© T
om Sw
ain
UNDERSTANDING INSTITUTIONAL ARRANGEMENTS
Alongside the decision on how to generate and deliver finance for biodiversity and ecosystem services is the equally important consideration of how to govern and coordinate that finance. This section explores the various institutional arrangements that have been proposed to manage the flows of international ecosystem finance. The institutional arrangements that are covered in this analysis could be implemented at the sub-national, national and international level across developed and developing country Parties.
THE STATE OF PLAYCurrently, LifeWeb (page 136) and the GEF (page 122) are the sole institutions related to mobilising and managing financial resources to achieve the CBD mandate. Outside of the CBD process, biodiversity-specific finance is provided through an array of bilateral initiatives as well as through civil society and businesses, in a number of different ways. Additionally, several bilateral and multilateral funds have recently emerged related to climate finance, which offer potential co-benefits for biodiversity, but these funds lie primarily outside the CBD mandate, so strong institutional cooperation will be required to maximise those co-benefits.
A proliferation of institutions and funding channels at the international and national level has led to a fragmented, decentralised model (page 140) in which developing countries face an array of uncoordinated funding sources. The multiplication of funds and other financing channels with different governance structures and approaches makes the management of these revenue streams complicated for recipients at the national and project level. Additionally, fragmentation of funding can lead to competing centres of authority and a duplication of funding efforts.
120
1. Non-papers No. 34 and 54 are relevant to the contact group on enhanced action on the provision of financial resources and investment and are available at http://unfccc.int/files/kyoto_protocol/application/pdf/54fin61109.pdf
2. Taken from the latest non-paper No. 54, as well as the paper on common elements presented at AWG-LCA 6 in Bonn in August available at http://unfccc.int/files/meetings/ad_hoc_working_groups/lca/application/pdf/finance140809.pdf.
A BRIEF HISTORYIn relation to the management of financial resources, Article 21 of the Convention states:
“21(3): The Conference of the Parties shall review the effectiveness of the mechanism established under this Article (…). Based on such review, it shall take appropriate action to improve the effectiveness of the mechanism if necessary.”
“21(4): The Contracting Parties shall consider strengthening existing financial institutions to provide financial resources for the conservation and sustainable use of biological diversity.”
A review process is currently underway, aimed at substantially enhancing international financial flows and domestic funding for biological diversity, in order to achieve a substantial reduction of the current funding gaps for effective implementation of the Convention’s three objectives.
Decision IX/11, B (4) of the Conference of the Parties, adopted in 2008, adds:
“IX/11 B (4): Invites Parties to come forward with new and innovative financial mechanisms in support of the strategy for resource mobilization in accordance with Article 20 of the Convention.”
121
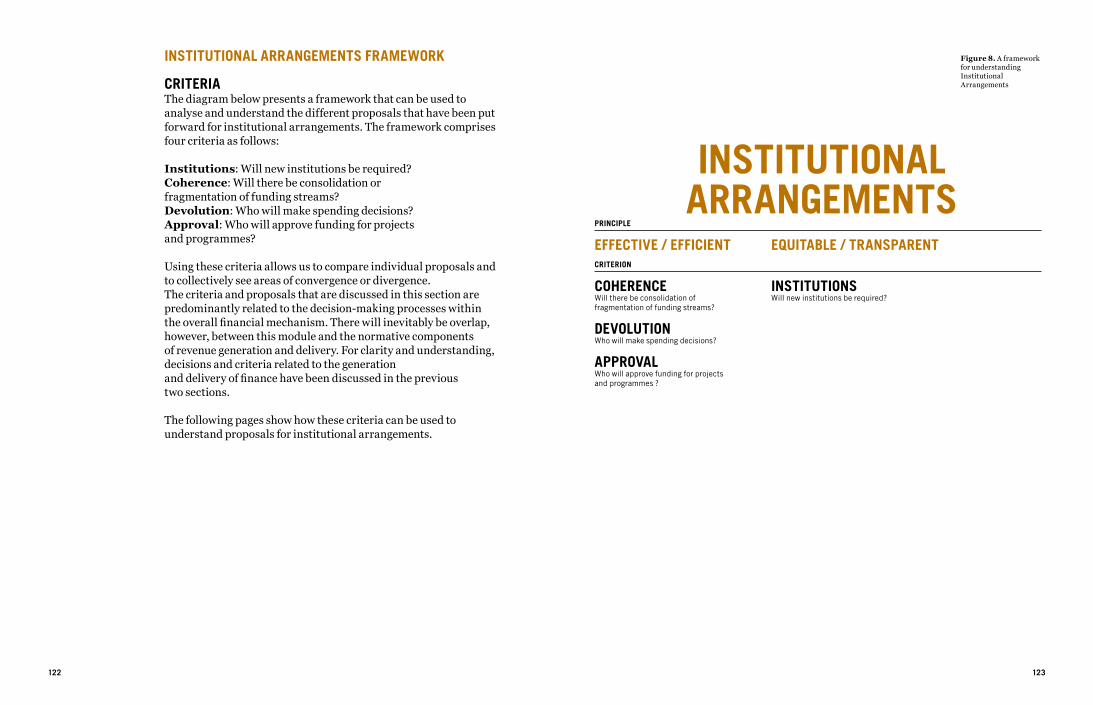
INSTITUTIONAL ARRANGEMENTS FRAMEWORK
CRITERIAThe diagram below presents a framework that can be used to analyse and understand the different proposals that have been put forward for institutional arrangements. The framework comprises four criteria as follows:
Institutions: Will new institutions be required?Coherence: Will there be consolidation or fragmentation of funding streams?Devolution: Who will make spending decisions?Approval: Who will approve funding for projects and programmes?
Using these criteria allows us to compare individual proposals and to collectively see areas of convergence or divergence. The criteria and proposals that are discussed in this section are predominantly related to the decision-making processes within the overall financial mechanism. There will inevitably be overlap, however, between this module and the normative components of revenue generation and delivery. For clarity and understanding, decisions and criteria related to the generation and delivery of finance have been discussed in the previous two sections.
The following pages show how these criteria can be used to understand proposals for institutional arrangements.
122 123
EFFECTIVE / EFFICIENT
COHERENCEWill there be consolidation of fragmentation of funding streams?
DEVOLUTIONWho will make spending decisions?
APPROVALWho will approve funding for projects and programmes ?
PRINCIPLE
CRITERION
EQUITABLE / TRANSPARENT
INSTITUTIONS Will new institutions be required?
INSTITUTIONAL ARRANGEMENTS
Figure 8. A framework for understanding Institutional Arrangements
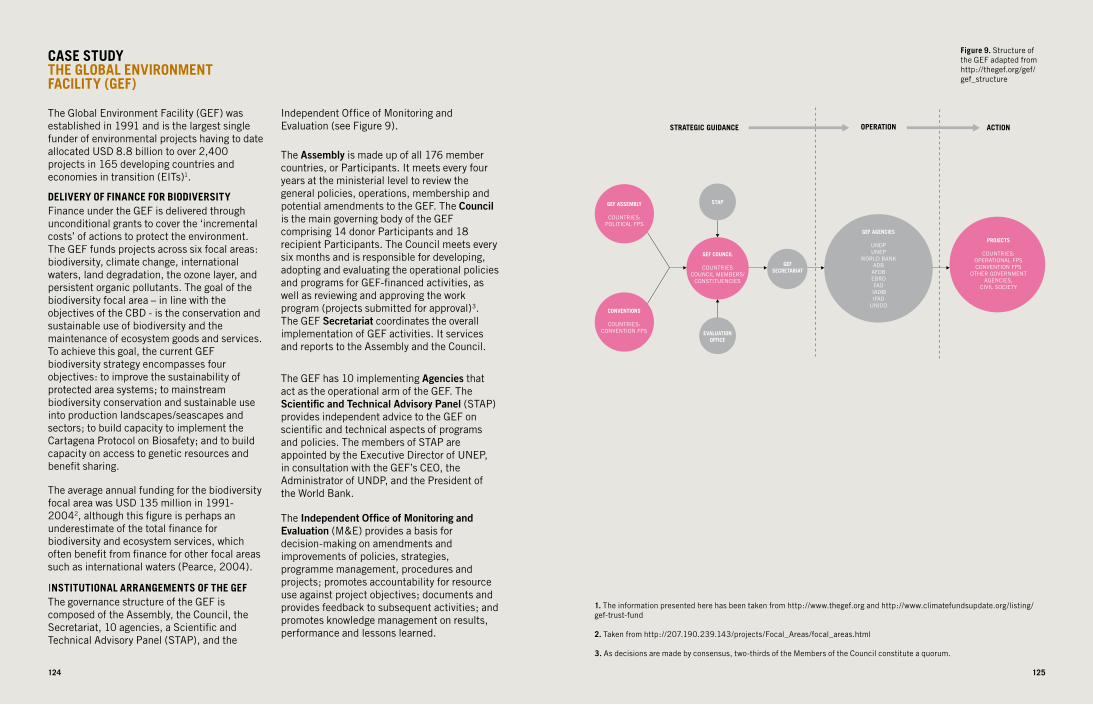
124 125
CASE STUDYTHE GLOBAL ENVIRONMENT FACILITY (GEF)
The Global Environment Facility (GEF) was established in 1991 and is the largest single funder of environmental projects having to date allocated USD 8.8 billion to over 2,400 projects in 165 developing countries and economies in transition (EITs)1.
DELIVERY OF FINANCE FOR BIODIVERSITYFinance under the GEF is delivered through unconditional grants to cover the ‘incremental costs’ of actions to protect the environment. The GEF funds projects across six focal areas: biodiversity, climate change, international waters, land degradation, the ozone layer, and persistent organic pollutants. The goal of the biodiversity focal area – in line with the objectives of the CBD - is the conservation and sustainable use of biodiversity and the maintenance of ecosystem goods and services. To achieve this goal, the current GEF biodiversity strategy encompasses four objectives: to improve the sustainability of protected area systems; to mainstream biodiversity conservation and sustainable use into production landscapes/seascapes and sectors; to build capacity to implement the Cartagena Protocol on Biosafety; and to build capacity on access to genetic resources and benefit sharing.
The average annual funding for the biodiversity focal area was USD 135 million in 1991-20042, although this figure is perhaps an underestimate of the total finance for biodiversity and ecosystem services, which often benefit from finance for other focal areas such as international waters (Pearce, 2004).
INSTITUTIONAL ARRANGEMENTS OF THE GEFThe governance structure of the GEF is composed of the Assembly, the Council, the Secretariat, 10 agencies, a Scientific and Technical Advisory Panel (STAP), and the
Independent Office of Monitoring and Evaluation (see Figure 9).
The Assembly is made up of all 176 member countries, or Participants. It meets every four years at the ministerial level to review the general policies, operations, membership and potential amendments to the GEF. The Council is the main governing body of the GEF comprising 14 donor Participants and 18 recipient Participants. The Council meets every six months and is responsible for developing, adopting and evaluating the operational policies and programs for GEF-financed activities, as well as reviewing and approving the work program (projects submitted for approval)3. The GEF Secretariat coordinates the overall implementation of GEF activities. It services and reports to the Assembly and the Council.
The GEF has 10 implementing Agencies that act as the operational arm of the GEF. The Scientific and Technical Advisory Panel (STAP) provides independent advice to the GEF on scientific and technical aspects of programs and policies. The members of STAP are appointed by the Executive Director of UNEP, in consultation with the GEF’s CEO, the Administrator of UNDP, and the President of the World Bank.
The Independent Office of Monitoring and Evaluation (M&E) provides a basis for decision-making on amendments and improvements of policies, strategies, programme management, procedures and projects; promotes accountability for resource use against project objectives; documents and provides feedback to subsequent activities; and promotes knowledge management on results, performance and lessons learned.
1. The information presented here has been taken from http://www.thegef.org and http://www.climatefundsupdate.org/listing/gef-trust-fund
2. Taken from http://207.190.239.143/projects/Focal_Areas/focal_areas.html
3. As decisions are made by consensus, two-thirds of the Members of the Council constitute a quorum.
Figure 9. Structure of the GEF adapted from http://thegef.org/gef/gef_structure
124 125
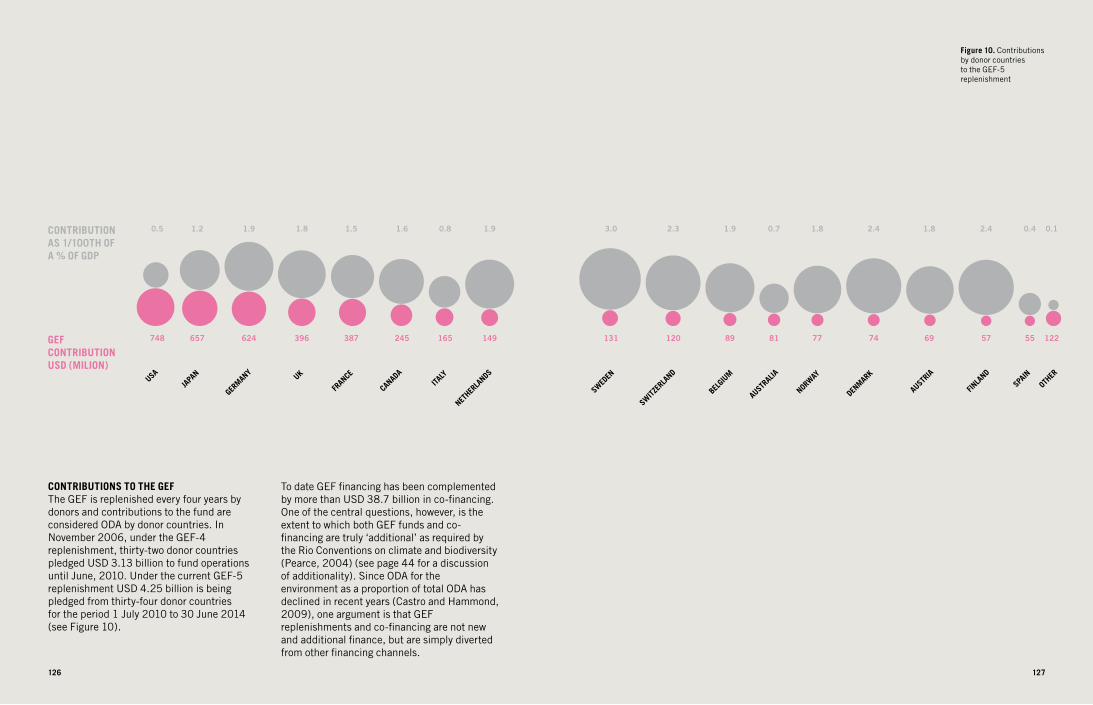
126 127
CONTRIBUTIONS TO THE GEFThe GEF is replenished every four years by donors and contributions to the fund are considered ODA by donor countries. In November 2006, under the GEF-4 replenishment, thirty-two donor countries pledged USD 3.13 billion to fund operations until June, 2010. Under the current GEF-5 replenishment USD 4.25 billion is being pledged from thirty-four donor countries for the period 1 July 2010 to 30 June 2014 (see Figure 10).
Figure 10. Contributions by donor countries to the GEF-5 replenishment
To date GEF financing has been complemented by more than USD 38.7 billion in co-financing. One of the central questions, however, is the extent to which both GEF funds and co-financing are truly ‘additional’ as required by the Rio Conventions on climate and biodiversity (Pearce, 2004) (see page 44 for a discussion of additionality). Since ODA for the environment as a proportion of total ODA has declined in recent years (Castro and Hammond, 2009), one argument is that GEF replenishments and co-financing are not new and additional finance, but are simply diverted from other financing channels.
CONTRIBUTION AS 1/100TH OF A % OF GDP
GEF CONTRIBUTIONUSD (MILION)
126 127
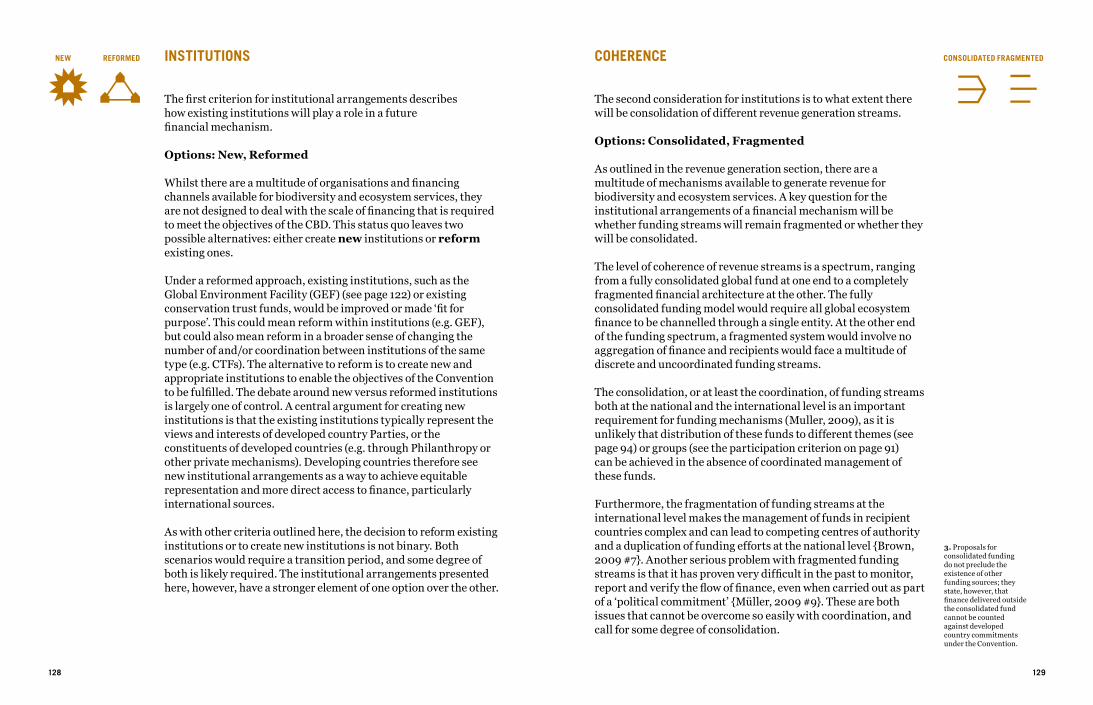
128 129
COHERENCE
The second consideration for institutions is to what extent there will be consolidation of different revenue generation streams.
Options: Consolidated, Fragmented
As outlined in the revenue generation section, there are a multitude of mechanisms available to generate revenue for biodiversity and ecosystem services. A key question for the institutional arrangements of a financial mechanism will be whether funding streams will remain fragmented or whether they will be consolidated.
The level of coherence of revenue streams is a spectrum, ranging from a fully consolidated global fund at one end to a completely fragmented financial architecture at the other. The fully consolidated funding model would require all global ecosystem finance to be channelled through a single entity. At the other end of the funding spectrum, a fragmented system would involve no aggregation of finance and recipients would face a multitude of discrete and uncoordinated funding streams.
The consolidation, or at least the coordination, of funding streams both at the national and the international level is an important requirement for funding mechanisms (Muller, 2009), as it is unlikely that distribution of these funds to different themes (see page 94) or groups (see the participation criterion on page 91) can be achieved in the absence of coordinated management of these funds.
Furthermore, the fragmentation of funding streams at the international level makes the management of funds in recipient countries complex and can lead to competing centres of authority and a duplication of funding efforts at the national level {Brown, 2009 #7}. Another serious problem with fragmented funding streams is that it has proven very difficult in the past to monitor, report and verify the flow of finance, even when carried out as part of a ‘political commitment’ {Müller, 2009 #9}. These are both issues that cannot be overcome so easily with coordination, and call for some degree of consolidation.
3. Proposals for consolidated funding do not preclude the existence of other funding sources; they state, however, that finance delivered outside the consolidated fund cannot be counted against developed country commitments under the Convention.
CONSOLIDATED FRAGMENTEDINSTITUTIONS
The first criterion for institutional arrangements describes how existing institutions will play a role in a future financial mechanism.
Options: New, Reformed
Whilst there are a multitude of organisations and financing channels available for biodiversity and ecosystem services, they are not designed to deal with the scale of financing that is required to meet the objectives of the CBD. This status quo leaves two possible alternatives: either create new institutions or reform existing ones.
Under a reformed approach, existing institutions, such as the Global Environment Facility (GEF) (see page 122) or existing conservation trust funds, would be improved or made ‘fit for purpose’. This could mean reform within institutions (e.g. GEF), but could also mean reform in a broader sense of changing the number of and/or coordination between institutions of the same type (e.g. CTFs). The alternative to reform is to create new and appropriate institutions to enable the objectives of the Convention to be fulfilled. The debate around new versus reformed institutions is largely one of control. A central argument for creating new institutions is that the existing institutions typically represent the views and interests of developed country Parties, or the constituents of developed countries (e.g. through Philanthropy or other private mechanisms). Developing countries therefore see new institutional arrangements as a way to achieve equitable representation and more direct access to finance, particularly international sources.
As with other criteria outlined here, the decision to reform existing institutions or to create new institutions is not binary. Both scenarios would require a transition period, and some degree of both is likely required. The institutional arrangements presented here, however, have a stronger element of one option over the other.
NEW REFORMED
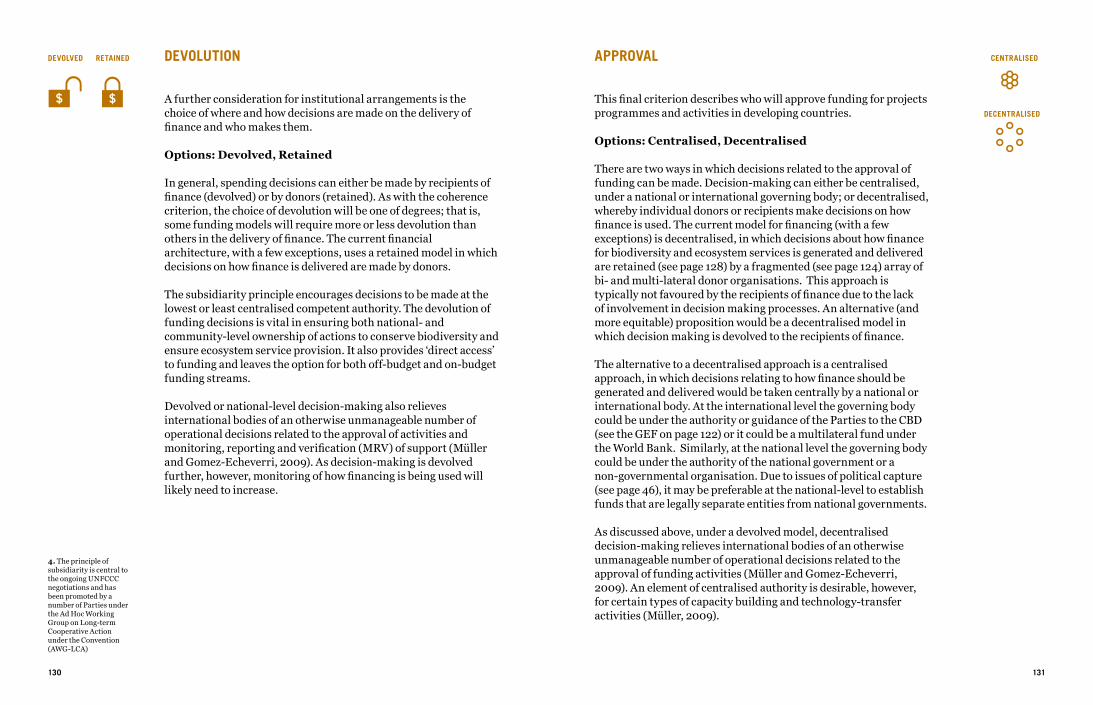
APPROVAL
This final criterion describes who will approve funding for projects programmes and activities in developing countries.
Options: Centralised, Decentralised
There are two ways in which decisions related to the approval of funding can be made. Decision-making can either be centralised, under a national or international governing body; or decentralised, whereby individual donors or recipients make decisions on how finance is used. The current model for financing (with a few exceptions) is decentralised, in which decisions about how finance for biodiversity and ecosystem services is generated and delivered are retained (see page 128) by a fragmented (see page 124) array of bi- and multi-lateral donor organisations. This approach is typically not favoured by the recipients of finance due to the lack of involvement in decision making processes. An alternative (and more equitable) proposition would be a decentralised model in which decision making is devolved to the recipients of finance.
The alternative to a decentralised approach is a centralised approach, in which decisions relating to how finance should be generated and delivered would be taken centrally by a national or international body. At the international level the governing body could be under the authority or guidance of the Parties to the CBD (see the GEF on page 122) or it could be a multilateral fund under the World Bank. Similarly, at the national level the governing body could be under the authority of the national government or a non-governmental organisation. Due to issues of political capture (see page 46), it may be preferable at the national-level to establish funds that are legally separate entities from national governments.
As discussed above, under a devolved model, decentralised decision-making relieves international bodies of an otherwise unmanageable number of operational decisions related to the approval of funding activities (Müller and Gomez-Echeverri, 2009). An element of centralised authority is desirable, however, for certain types of capacity building and technology-transfer activities (Müller, 2009).
130 131
CENTRALISED
DECENTRALISED
DEVOLUTION
A further consideration for institutional arrangements is the choice of where and how decisions are made on the delivery of finance and who makes them.
Options: Devolved, Retained
In general, spending decisions can either be made by recipients of finance (devolved) or by donors (retained). As with the coherence criterion, the choice of devolution will be one of degrees; that is, some funding models will require more or less devolution than others in the delivery of finance. The current financial architecture, with a few exceptions, uses a retained model in which decisions on how finance is delivered are made by donors.
The subsidiarity principle encourages decisions to be made at the lowest or least centralised competent authority. The devolution of funding decisions is vital in ensuring both national- and community-level ownership of actions to conserve biodiversity and ensure ecosystem service provision. It also provides ‘direct access’ to funding and leaves the option for both off-budget and on-budget funding streams.
Devolved or national-level decision-making also relieves international bodies of an otherwise unmanageable number of operational decisions related to the approval of activities and monitoring, reporting and verification (MRV) of support (Müller and Gomez-Echeverri, 2009). As decision-making is devolved further, however, monitoring of how financing is being used will likely need to increase.
4. The principle of subsidiarity is central to the ongoing UNFCCC negotiations and has been promoted by a number of Parties under the Ad Hoc Working Group on Long-term Cooperative Action under the Convention (AWG-LCA)
DEVOLVED RETAINED
INSTITUTIONAL ARRANGEMENTS PROPOSALS
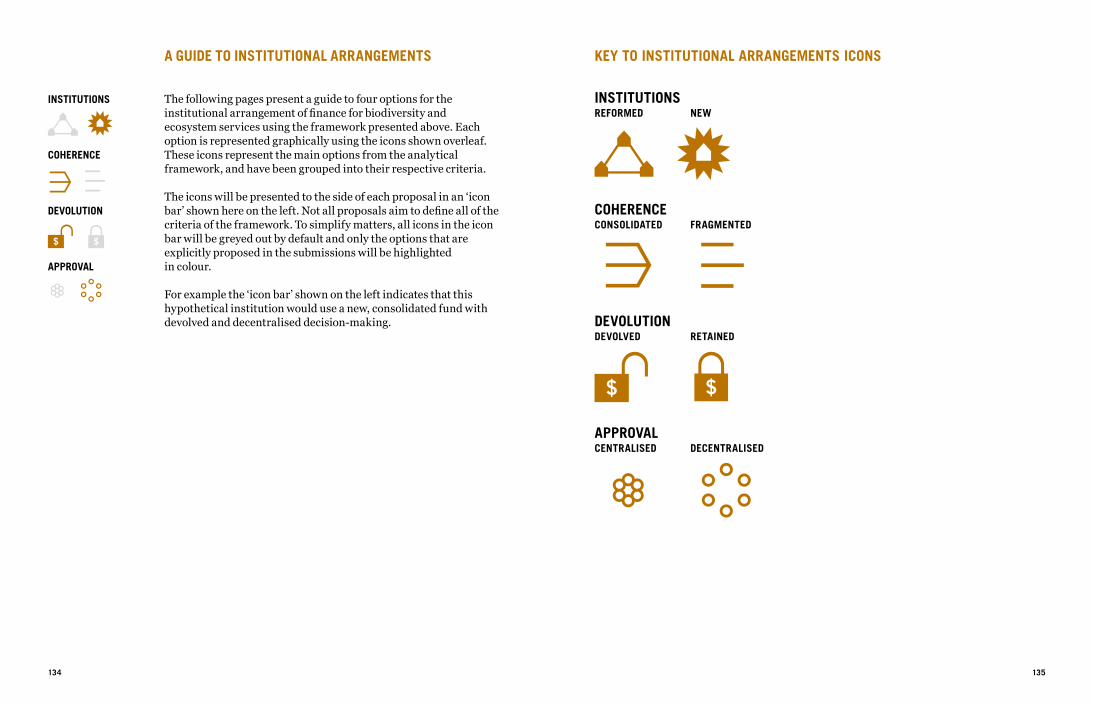
A GUIDE TO INSTITUTIONAL ARRANGEMENTS
The following pages present a guide to four options for the institutional arrangement of finance for biodiversity and ecosystem services using the framework presented above. Each option is represented graphically using the icons shown overleaf. These icons represent the main options from the analytical framework, and have been grouped into their respective criteria.
The icons will be presented to the side of each proposal in an ‘icon bar’ shown here on the left. Not all proposals aim to define all of the criteria of the framework. To simplify matters, all icons in the icon bar will be greyed out by default and only the options that are explicitly proposed in the submissions will be highlighted in colour.
For example the ‘icon bar’ shown on the left indicates that this hypothetical institution would use a new, consolidated fund with devolved and decentralised decision-making.
134 135
APPROVAL
COHERENCE
DEVOLUTION
INSTITUTIONS
KEY TO INSTITUTIONAL ARRANGEMENTS ICONS
INSTITUTIONSREFORMED NEW
COHERENCECONSOLIDATED FRAGMENTED
DEVOLUTIONDEVOLVED RETAINED
APPROVALCENTRALISED DECENTRALISED
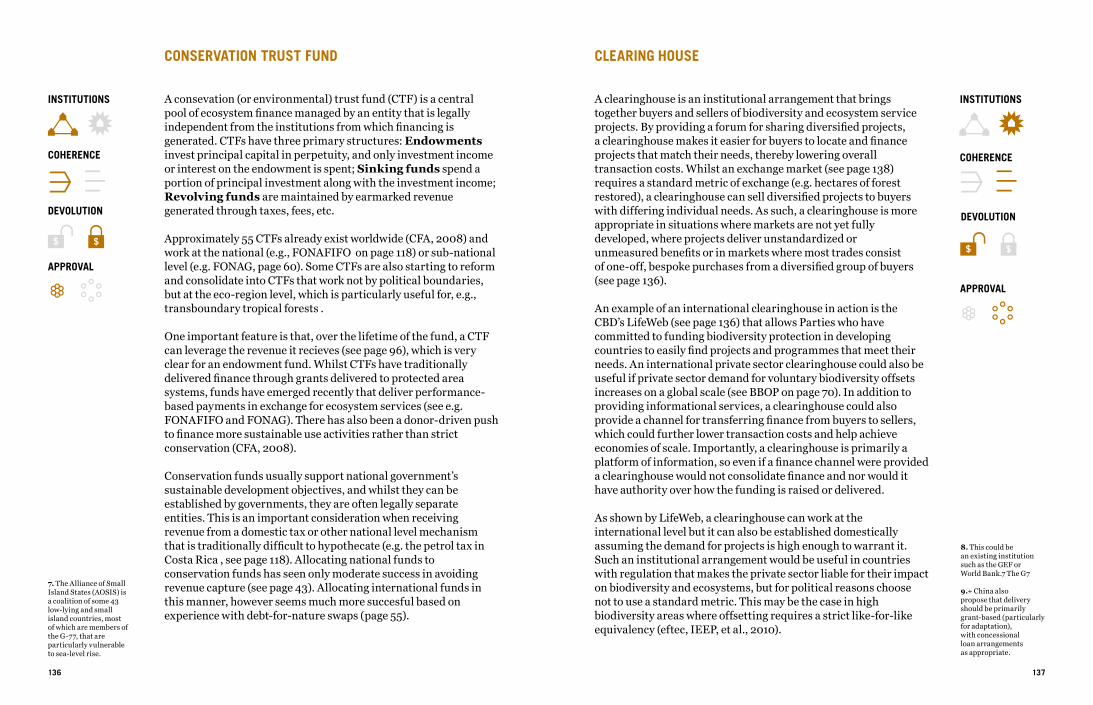
CONSERVATION TRUST FUND
A consevation (or environmental) trust fund (CTF) is a central pool of ecosystem finance managed by an entity that is legally independent from the institutions from which financing is generated. CTFs have three primary structures: Endowments invest principal capital in perpetuity, and only investment income or interest on the endowment is spent; Sinking funds spend a portion of principal investment along with the investment income; Revolving funds are maintained by earmarked revenue generated through taxes, fees, etc.
Approximately 55 CTFs already exist worldwide (CFA, 2008) and work at the national (e.g., FONAFIFO on page 118) or sub-national level (e.g. FONAG, page 60). Some CTFs are also starting to reform and consolidate into CTFs that work not by political boundaries, but at the eco-region level, which is particularly useful for, e.g., transboundary tropical forests .
One important feature is that, over the lifetime of the fund, a CTF can leverage the revenue it recieves (see page 96), which is very clear for an endowment fund. Whilst CTFs have traditionally delivered finance through grants delivered to protected area systems, funds have emerged recently that deliver performance-based payments in exchange for ecosystem services (see e.g. FONAFIFO and FONAG). There has also been a donor-driven push to finance more sustainable use activities rather than strict conservation (CFA, 2008).
Conservation funds usually support national government’s sustainable development objectives, and whilst they can be established by governments, they are often legally separate entities. This is an important consideration when receiving revenue from a domestic tax or other national level mechanism that is traditionally difficult to hypothecate (e.g. the petrol tax in Costa Rica , see page 118). Allocating national funds to conservation funds has seen only moderate success in avoiding revenue capture (see page 43). Allocating international funds in this manner, however seems much more succesful based on experience with debt-for-nature swaps (page 55).
7. The Alliance of Small Island States (AOSIS) is a coalition of some 43 low-lying and small island countries, most of which are members of the G-77, that are particularly vulnerable to sea-level rise.
136
8. This could be an existing institution such as the GEF or World Bank.7 The G7 9.+ China also propose that delivery should be primarily grant-based (particularly for adaptation), with concessional loan arrangements as appropriate.
CLEARING HOUSE
A clearinghouse is an institutional arrangement that brings together buyers and sellers of biodiversity and ecosystem service projects. By providing a forum for sharing diversified projects, a clearinghouse makes it easier for buyers to locate and finance projects that match their needs, thereby lowering overall transaction costs. Whilst an exchange market (see page 138) requires a standard metric of exchange (e.g. hectares of forest restored), a clearinghouse can sell diversified projects to buyers with differing individual needs. As such, a clearinghouse is more appropriate in situations where markets are not yet fully developed, where projects deliver unstandardized or unmeasured benefits or in markets where most trades consist of one-off, bespoke purchases from a diversified group of buyers (see page 136).
An example of an international clearinghouse in action is the CBD’s LifeWeb (see page 136) that allows Parties who have committed to funding biodiversity protection in developing countries to easily find projects and programmes that meet their needs. An international private sector clearinghouse could also be useful if private sector demand for voluntary biodiversity offsets increases on a global scale (see BBOP on page 70). In addition to providing informational services, a clearinghouse could also provide a channel for transferring finance from buyers to sellers, which could further lower transaction costs and help achieve economies of scale. Importantly, a clearinghouse is primarily a platform of information, so even if a finance channel were provided a clearinghouse would not consolidate finance and nor would it have authority over how the funding is raised or delivered.
As shown by LifeWeb, a clearinghouse can work at the international level but it can also be established domestically assuming the demand for projects is high enough to warrant it. Such an institutional arrangement would be useful in countries with regulation that makes the private sector liable for their impact on biodiversity and ecosystems, but for political reasons choose not to use a standard metric. This may be the case in high biodiversity areas where offsetting requires a strict like-for-like equivalency (eftec, IEEP, et al., 2010).
137
APPROVAL
COHERENCE
DEVOLUTION
INSTITUTIONS
APPROVAL
COHERENCE
DEVOLUTION
INSTITUTIONS
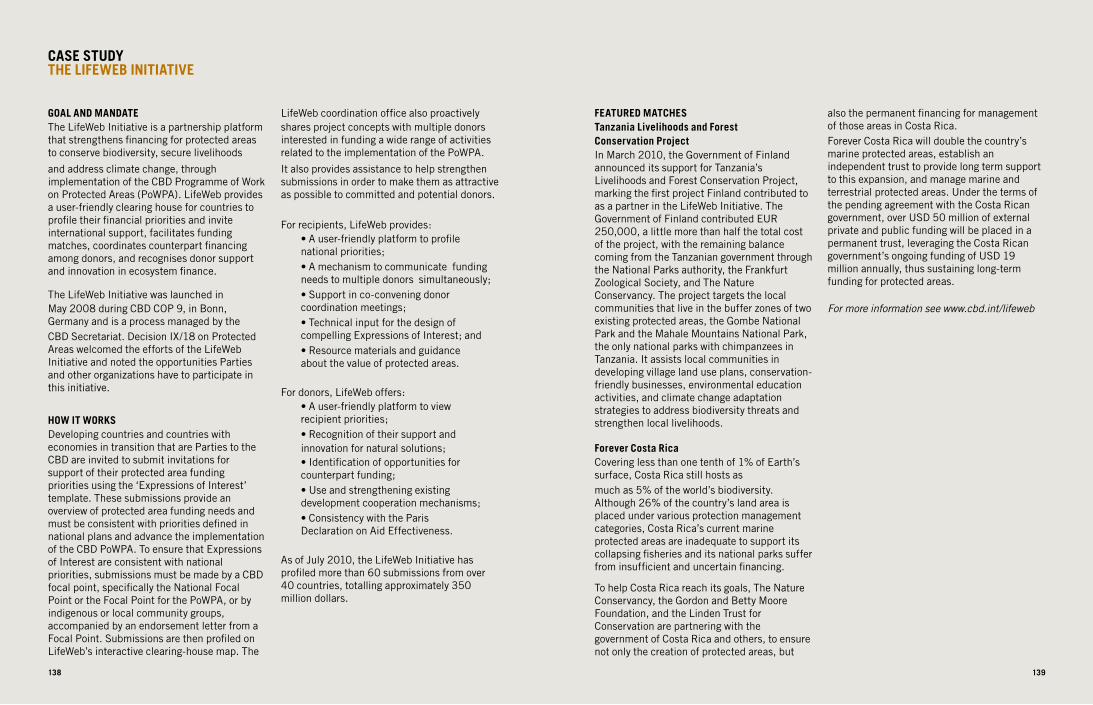
138 139
CASE STUDYTHE LIFEWEB INITIATIVE
GOAL AND MANDATE The LifeWeb Initiative is a partnership platform that strengthens financing for protected areas to conserve biodiversity, secure livelihoods
and address climate change, through implementation of the CBD Programme of Work on Protected Areas (PoWPA). LifeWeb provides a user-friendly clearing house for countries to profile their financial priorities and invite international support, facilitates funding matches, coordinates counterpart financing among donors, and recognises donor support and innovation in ecosystem finance.
The LifeWeb Initiative was launched in May 2008 during CBD COP 9, in Bonn, Germany and is a process managed by the CBD Secretariat. Decision IX/18 on Protected Areas welcomed the efforts of the LifeWeb Initiative and noted the opportunities Parties and other organizations have to participate in this initiative.
HOW IT WORKSDeveloping countries and countries with economies in transition that are Parties to the CBD are invited to submit invitations for support of their protected area funding priorities using the ‘Expressions of Interest’ template. These submissions provide an overview of protected area funding needs and must be consistent with priorities defined in national plans and advance the implementation of the CBD PoWPA. To ensure that Expressions of Interest are consistent with national priorities, submissions must be made by a CBD focal point, specifically the National Focal Point or the Focal Point for the PoWPA, or by indigenous or local community groups, accompanied by an endorsement letter from a Focal Point. Submissions are then profiled on LifeWeb’s interactive clearing-house map. The
LifeWeb coordination office also proactively shares project concepts with multiple donors interested in funding a wide range of activities related to the implementation of the PoWPA.
It also provides assistance to help strengthen submissions in order to make them as attractive as possible to committed and potential donors.
For recipients, LifeWeb provides: • A user-friendly platform to profile national priorities; • A mechanism to communicate funding needs to multiple donors simultaneously; • Support in co-convening donor coordination meetings; • Technical input for the design of compelling Expressions of Interest; and • Resource materials and guidance about the value of protected areas.
For donors, LifeWeb offers: • A user-friendly platform to view recipient priorities; • Recognition of their support and innovation for natural solutions; • Identification of opportunities for counterpart funding; • Use and strengthening existing development cooperation mechanisms; • Consistency with the Paris Declaration on Aid Effectiveness.
As of July 2010, the LifeWeb Initiative has profiled more than 60 submissions from over 40 countries, totalling approximately 350 million dollars.
FEATURED MATCHESTanzania Livelihoods and Forest Conservation ProjectIn March 2010, the Government of Finland announced its support for Tanzania’s Livelihoods and Forest Conservation Project, marking the first project Finland contributed to as a partner in the LifeWeb Initiative. The Government of Finland contributed EUR 250,000, a little more than half the total cost of the project, with the remaining balance coming from the Tanzanian government through the National Parks authority, the Frankfurt Zoological Society, and The Nature Conservancy. The project targets the local communities that live in the buffer zones of two existing protected areas, the Gombe National Park and the Mahale Mountains National Park, the only national parks with chimpanzees in Tanzania. It assists local communities in developing village land use plans, conservation-friendly businesses, environmental education activities, and climate change adaptation strategies to address biodiversity threats and strengthen local livelihoods.
Forever Costa RicaCovering less than one tenth of 1% of Earth’s surface, Costa Rica still hosts as much as 5% of the world’s biodiversity. Although 26% of the country’s land area is placed under various protection management categories, Costa Rica’s current marine protected areas are inadequate to support its collapsing fisheries and its national parks suffer from insufficient and uncertain financing.
To help Costa Rica reach its goals, The Nature Conservancy, the Gordon and Betty Moore Foundation, and the Linden Trust for Conservation are partnering with the government of Costa Rica and others, to ensure not only the creation of protected areas, but
also the permanent financing for management of those areas in Costa Rica. Forever Costa Rica will double the country’s marine protected areas, establish an independent trust to provide long term support to this expansion, and manage marine and terrestrial protected areas. Under the terms of the pending agreement with the Costa Rican government, over USD 50 million of external private and public funding will be placed in a permanent trust, leveraging the Costa Rican government’s ongoing funding of USD 19 million annually, thus sustaining long-term funding for protected areas.
For more information see www.cbd.int/lifeweb
138 139
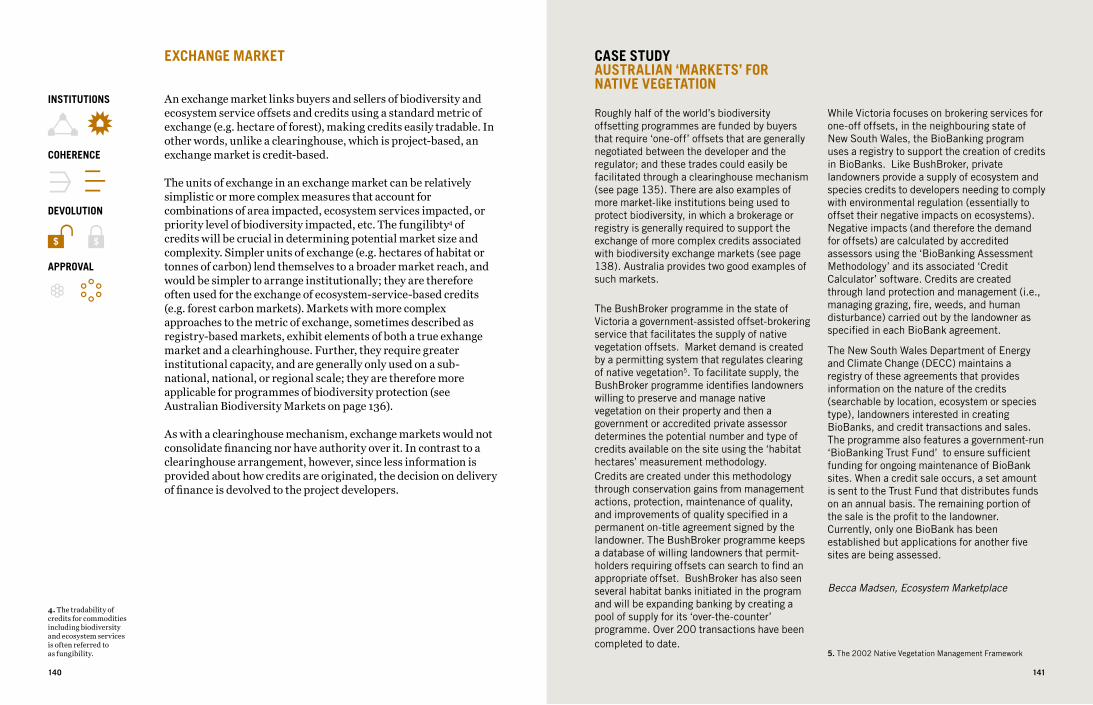
EXCHANGE MARKET
An exchange market links buyers and sellers of biodiversity and ecosystem service offsets and credits using a standard metric of exchange (e.g. hectare of forest), making credits easily tradable. In other words, unlike a clearinghouse, which is project-based, an exchange market is credit-based.
The units of exchange in an exchange market can be relatively simplistic or more complex measures that account for combinations of area impacted, ecosystem services impacted, or priority level of biodiversity impacted, etc. The fungilibty4 of credits will be crucial in determining potential market size and complexity. Simpler units of exchange (e.g. hectares of habitat or tonnes of carbon) lend themselves to a broader market reach, and would be simpler to arrange institutionally; they are therefore often used for the exchange of ecosystem-service-based credits (e.g. forest carbon markets). Markets with more complex approaches to the metric of exchange, sometimes described as registry-based markets, exhibit elements of both a true exhange market and a clearhinghouse. Further, they require greater institutional capacity, and are generally only used on a sub-national, national, or regional scale; they are therefore more applicable for programmes of biodiversity protection (see Australian Biodiversity Markets on page 136).
As with a clearinghouse mechanism, exchange markets would not consolidate financing nor have authority over it. In contrast to a clearinghouse arrangement, however, since less information is provided about how credits are originated, the decision on delivery of finance is devolved to the project developers.
140 141
4. The tradability of credits for commodities including biodiversity and ecosystem services is often referred to as fungibility.
CASE STUDYAUSTRALIAN ‘MARKETS’ FOR NATIVE VEGETATION
Roughly half of the world’s biodiversity offsetting programmes are funded by buyers that require ‘one-off’ offsets that are generally negotiated between the developer and the regulator; and these trades could easily be facilitated through a clearinghouse mechanism (see page 135). There are also examples of more market-like institutions being used to protect biodiversity, in which a brokerage or registry is generally required to support the exchange of more complex credits associated with biodiversity exchange markets (see page 138). Australia provides two good examples of such markets.
The BushBroker programme in the state of Victoria a government-assisted offset-brokering service that facilitates the supply of native vegetation offsets. Market demand is created by a permitting system that regulates clearing of native vegetation5. To facilitate supply, the BushBroker programme identifies landowners willing to preserve and manage native vegetation on their property and then a government or accredited private assessor determines the potential number and type of credits available on the site using the ‘habitat hectares’ measurement methodology.Credits are created under this methodology through conservation gains from management actions, protection, maintenance of quality, and improvements of quality specified in a permanent on-title agreement signed by the landowner. The BushBroker programme keeps a database of willing landowners that permit-holders requiring offsets can search to find an appropriate offset. BushBroker has also seen several habitat banks initiated in the program and will be expanding banking by creating a pool of supply for its ‘over-the-counter’ programme. Over 200 transactions have been completed to date.
While Victoria focuses on brokering services for one-off offsets, in the neighbouring state of New South Wales, the BioBanking program uses a registry to support the creation of credits in BioBanks. Like BushBroker, private landowners provide a supply of ecosystem and species credits to developers needing to comply with environmental regulation (essentially to offset their negative impacts on ecosystems). Negative impacts (and therefore the demand for offsets) are calculated by accredited assessors using the ‘BioBanking Assessment Methodology’ and its associated ‘Credit Calculator’ software. Credits are created through land protection and management (i.e., managing grazing, fire, weeds, and human disturbance) carried out by the landowner as specified in each BioBank agreement.
The New South Wales Department of Energy and Climate Change (DECC) maintains a registry of these agreements that provides information on the nature of the credits (searchable by location, ecosystem or species type), landowners interested in creating BioBanks, and credit transactions and sales. The programme also features a government-run ‘BioBanking Trust Fund’ to ensure sufficient funding for ongoing maintenance of BioBank sites. When a credit sale occurs, a set amount is sent to the Trust Fund that distributes funds on an annual basis. The remaining portion of the sale is the profit to the landowner. Currently, only one BioBank has been established but applications for another five sites are being assessed.
Becca Madsen, Ecosystem Marketplace
5. The 2002 Native Vegetation Management Framework
APPROVAL
COHERENCE
DEVOLUTION
INSTITUTIONS
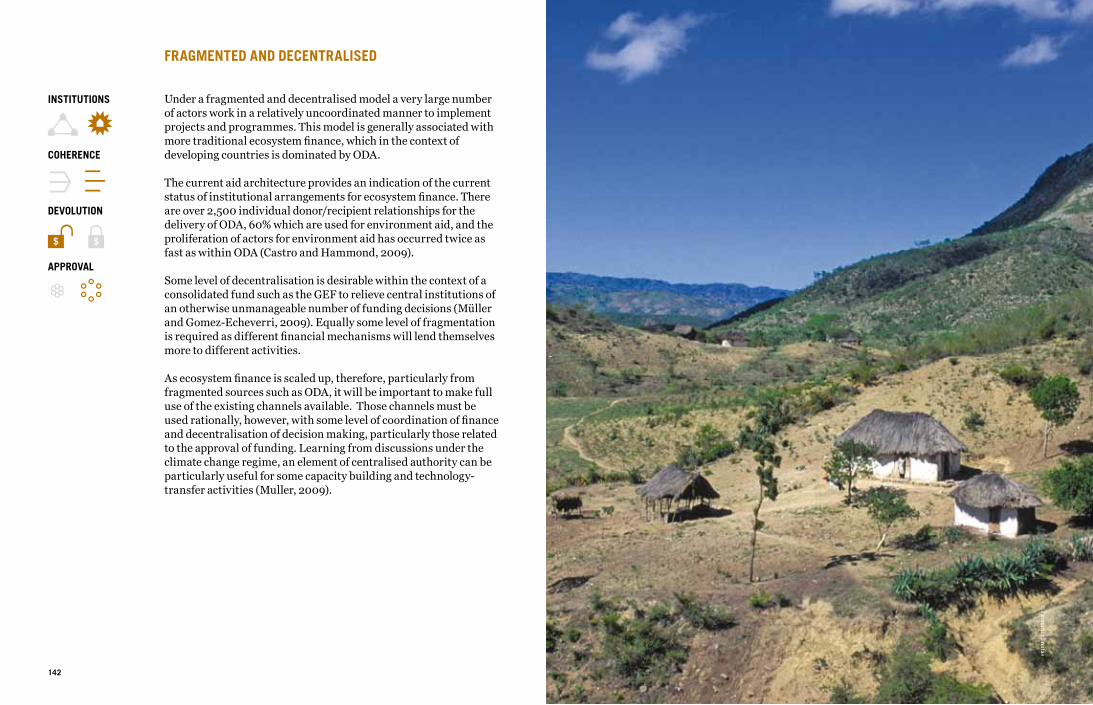
142 143
FRAGMENTED AND DECENTRALISED
Under a fragmented and decentralised model a very large number of actors work in a relatively uncoordinated manner to implement projects and programmes. This model is generally associated with more traditional ecosystem finance, which in the context of developing countries is dominated by ODA.
The current aid architecture provides an indication of the current status of institutional arrangements for ecosystem finance. There are over 2,500 individual donor/recipient relationships for the delivery of ODA, 60% which are used for environment aid, and the proliferation of actors for environment aid has occurred twice as fast as within ODA (Castro and Hammond, 2009).
Some level of decentralisation is desirable within the context of a consolidated fund such as the GEF to relieve central institutions of an otherwise unmanageable number of funding decisions (Müller and Gomez-Echeverri, 2009). Equally some level of fragmentation is required as different financial mechanisms will lend themselves more to different activities.
As ecosystem finance is scaled up, therefore, particularly from fragmented sources such as ODA, it will be important to make full use of the existing channels available. Those channels must be used rationally, however, with some level of coordination of finance and decentralisation of decision making, particularly those related to the approval of funding. Learning from discussions under the climate change regime, an element of centralised authority can be particularly useful for some capacity building and technology-transfer activities (Muller, 2009).
APPROVAL
COHERENCE
DEVOLUTION
INSTITUTIONS
© L
eonard
o Freitas

COMPARATIVE ANALYSIS
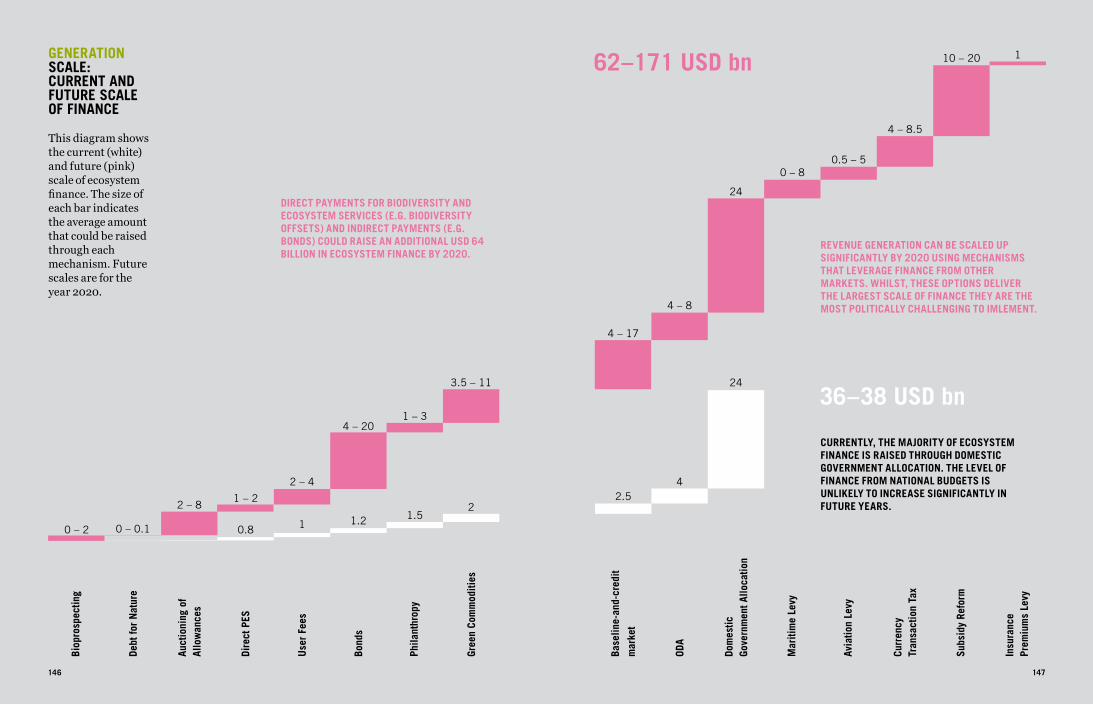
GENERATIONSCALE: CURRENT AND FUTURE SCALE OF FINANCE
This diagram shows the current (white) and future (pink) scale of ecosystem finance. The size of each bar indicates the average amount that could be raised through each mechanism. Future scales are for the year 2020.
REVENUE GENERATION CAN BE SCALED UP SIGNIFICANTLY BY 2020 USING MECHANISMS THAT LEVERAGE FINANCE FROM OTHER MARKETS. WHILST, THESE OPTIONS DELIVER THE LARGEST SCALE OF FINANCE THEY ARE THE MOST POLITICALLY CHALLENGING TO IMLEMENT.
CURRENTLY, THE MAJORITY OF ECOSYSTEM FINANCE IS RAISED THROUGH DOMESTIC GOVERNMENT ALLOCATION. THE LEVEL OF FINANCE FROM NATIONAL BUDGETS IS UNLIKELY TO INCREASE SIGNIFICANTLY IN FUTURE YEARS.
DIRECT PAYMENTS FOR BIODIVERSITY AND ECOSYSTEM SERVICES (E.G. BIODIVERSITY OFFSETS) AND INDIRECT PAYMENTS (E.G. BONDS) COULD RAISE AN ADDITIONAL USD 64 BILLION IN ECOSYSTEM FINANCE BY 2020.
146 147
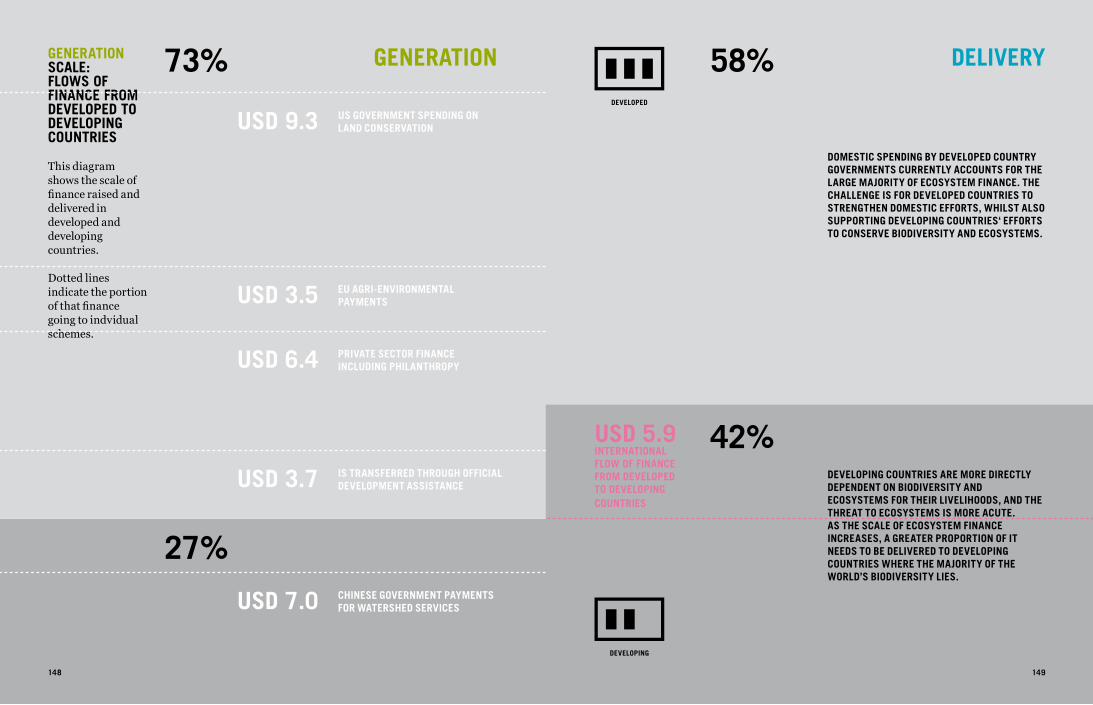
148 149
GENERATION DELIVERYGENERATIONSCALE: FLOWS OF FINANCE FROM DEVELOPED TO DEVELOPING COUNTRIES
This diagram shows the scale of finance raised and delivered in developed and developing countries.
Dotted lines indicate the portion of that finance going to indvidual schemes.
USD 9.3 US GOVERNMENT SPENDING ON LAND CONSERVATION
USD 6.4 PRIVATE SECTOR FINANCE INCLUDING PHILANTHROPY
USD 7.0 CHINESE GOVERNMENT PAYMENTS FOR WATERSHED SERVICES
USD 5.9INTERNATIONAL FLOW OF FINANCE FROM DEVELOPED TO DEVELOPING COUNTRIES
DEVELOPING
DEVELOPED
148 149
73%
27%
58%
42%USD 3.7 IS TRANSFERRED THROUGH OFFICIAL
DEVELOPMENT ASSISTANCE
USD 3.5 EU AGRI-ENVIRONMENTAL PAYMENTS
DOMESTIC SPENDING BY DEVELOPED COUNTRY GOVERNMENTS CURRENTLY ACCOUNTS FOR THE LARGE MAJORITY OF ECOSYSTEM FINANCE. THE CHALLENGE IS FOR DEVELOPED COUNTRIES TO STRENGTHEN DOMESTIC EFFORTS, WHILST ALSO SUPPORTING DEVELOPING COUNTRIES‘ EFFORTS TO CONSERVE BIODIVERSITY AND ECOSYSTEMS.
DEVELOPING COUNTRIES ARE MORE DIRECTLY DEPENDENT ON BIODIVERSITY AND ECOSYSTEMS FOR THEIR LIVELIHOODS, AND THE THREAT TO ECOSYSTEMS IS MORE ACUTE.AS THE SCALE OF ECOSYSTEM FINANCE INCREASES, A GREATER PROPORTION OF IT NEEDS TO BE DELIVERED TO DEVELOPING COUNTRIES WHERE THE MAJORITY OF THE WORLD’S BIODIVERSITY LIES.
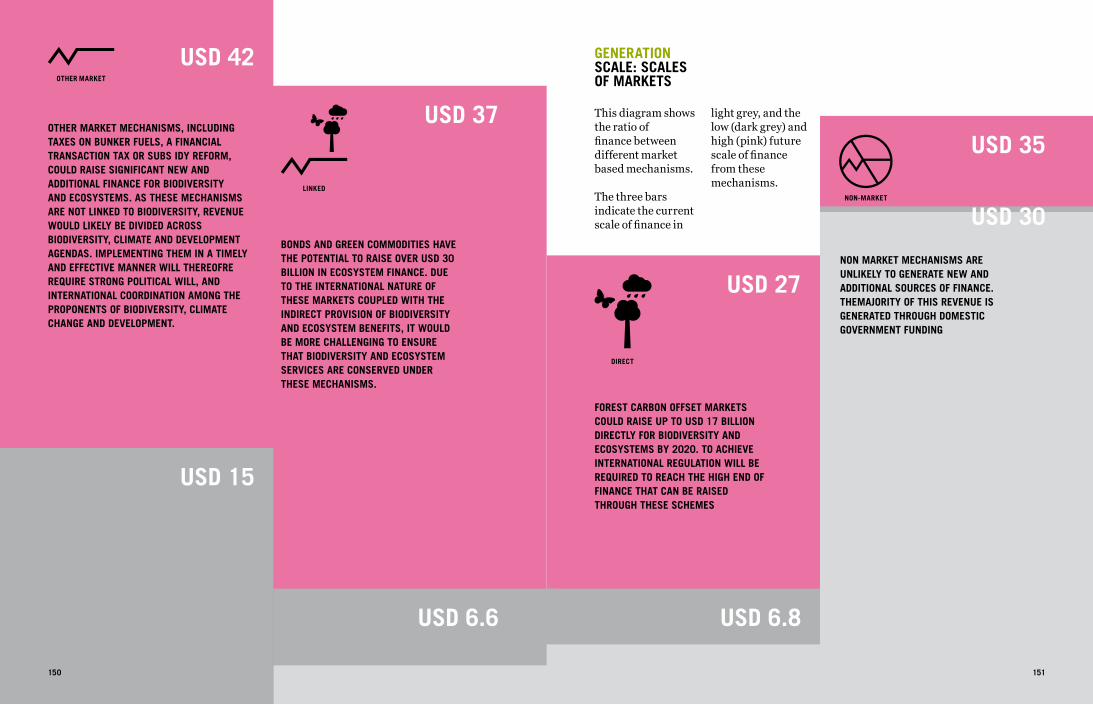
151151
GENERATIONSCALE: SCALES OF MARKETS
This diagram shows the ratio of finance between different market based mechanisms.
The three bars indicate the current scale of finance in
USD 15
USD 42
USD 37
USD 6.6 USD 6.8
USD 27
USD 30
USD 35
OTHER MARKET
LINKED
DIRECT
NON-MARKET
150 151
OTHER MARKET MECHANISMS, INCLUDING TAXES ON BUNKER FUELS, A FINANCIAL TRANSACTION TAX OR SUBS IDY REFORM, COULD RAISE SIGNIFICANT NEW AND ADDITIONAL FINANCE FOR BIODIVERSITY AND ECOSYSTEMS. AS THESE MECHANISMS ARE NOT LINKED TO BIODIVERSITY, REVENUE WOULD LIKELY BE DIVIDED ACROSS BIODIVERSITY, CLIMATE AND DEVELOPMENT AGENDAS. IMPLEMENTING THEM IN A TIMELY AND EFFECTIVE MANNER WILL THEREOFREREQUIRE STRONG POLITICAL WILL, ANDINTERNATIONAL COORDINATION AMONG THE PROPONENTS OF BIODIVERSITY, CLIMATE CHANGE AND DEVELOPMENT.
BONDS AND GREEN COMMODITIES HAVETHE POTENTIAL TO RAISE OVER USD 30BILLION IN ECOSYSTEM FINANCE. DUETO THE INTERNATIONAL NATURE OFTHESE MARKETS COUPLED WITH THEINDIRECT PROVISION OF BIODIVERSITYAND ECOSYSTEM BENEFITS, IT WOULDBE MORE CHALLENGING TO ENSURETHAT BIODIVERSITY AND ECOSYSTEMSERVICES ARE CONSERVED UNDERTHESE MECHANISMS.
FOREST CARBON OFFSET MARKETSCOULD RAISE UP TO USD 17 BILLIONDIRECTLY FOR BIODIVERSITY ANDECOSYSTEMS BY 2020. TO ACHIEVEINTERNATIONAL REGULATION WILL BEREQUIRED TO REACH THE HIGH END OFFINANCE THAT CAN BE RAISEDTHROUGH THESE SCHEMES
NON MARKET MECHANISMS AREUNLIKELY TO GENERATE NEW ANDADDITIONAL SOURCES OF FINANCE. THEMAJORITY OF THIS REVENUE ISGENERATED THROUGH DOMESTICGOVERNMENT FUNDING
light grey, and the low (dark grey) and high (pink) future scale of finance from these mechanisms.
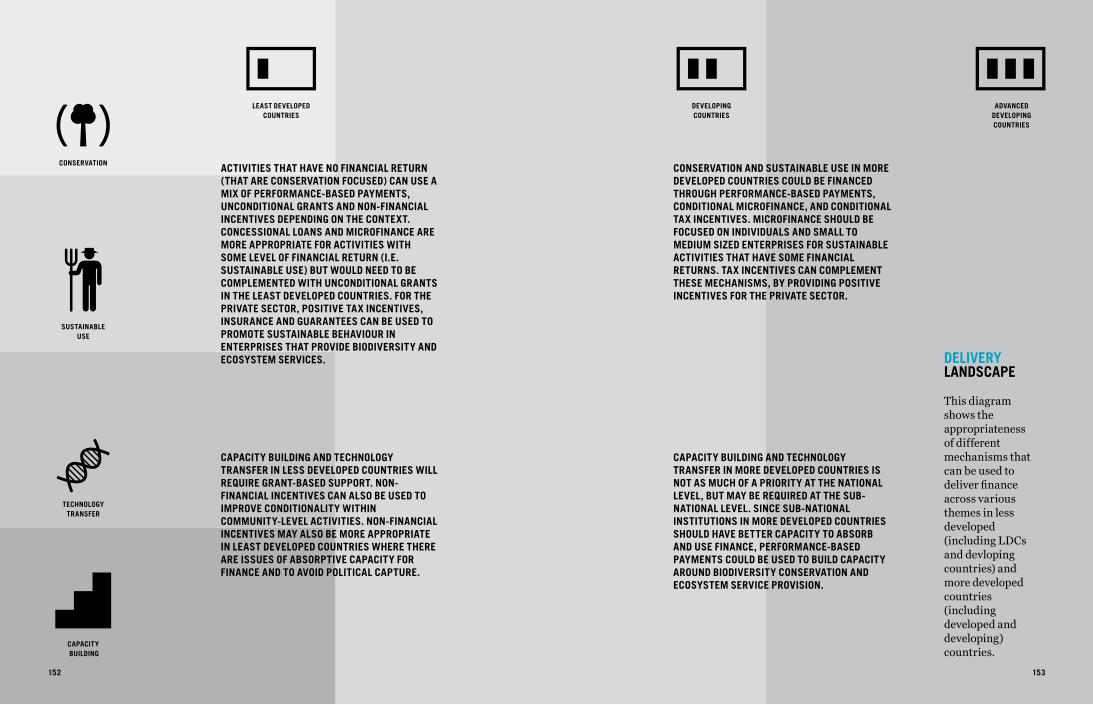
152 153
DELIVERYLANDSCAPE
This diagramshows theappropriatenessof differentmechanisms thatcan be used todeliver financeacross variousthemes in lessdeveloped(including LDCsand devlopingcountries) andmore developedcountries(includingdeveloped anddeveloping)countries.
CONSERVATION AND SUSTAINABLE USE IN MORE DEVELOPED COUNTRIES COULD BE FINANCED THROUGH PERFORMANCE-BASED PAYMENTS, CONDITIONAL MICROFINANCE, AND CONDITIONAL TAX INCENTIVES. MICROFINANCE SHOULD BE FOCUSED ON INDIVIDUALS AND SMALL TO MEDIUM SIzED ENTERPRISES FOR SUSTAINABLE ACTIVITIES THAT HAVE SOME FINANCIAL RETURNS. TAX INCENTIVES CAN COMPLEMENT THESE MECHANISMS, BY PROVIDING POSITIVE INCENTIVES FOR THE PRIVATE SECTOR.
CAPACITY BUILDING AND TECHNOLOGY TRANSFER IN MORE DEVELOPED COUNTRIES IS NOT AS MUCH OF A PRIORITY AT THE NATIONAL LEVEL, BUT MAY BE REQUIRED AT THE SUB-NATIONAL LEVEL. SINCE SUB-NATIONAL INSTITUTIONS IN MORE DEVELOPED COUNTRIES SHOULD HAVE BETTER CAPACITY TO ABSORB AND USE FINANCE, PERFORMANCE-BASED PAYMENTS COULD BE USED TO BUILD CAPACITY AROUND BIODIVERSITY CONSERVATION AND ECOSYSTEM SERVICE PROVISION.
ACTIVITIES THAT HAVE NO FINANCIAL RETURN (THAT ARE CONSERVATION FOCUSED) CAN USE A MIX OF PERFORMANCE-BASED PAYMENTS, UNCONDITIONAL GRANTS AND NON-FINANCIAL INCENTIVES DEPENDING ON THE CONTEXT. CONCESSIONAL LOANS AND MICROFINANCE ARE MORE APPROPRIATE FOR ACTIVITIES WITH SOME LEVEL OF FINANCIAL RETURN (I.E. SUSTAINABLE USE) BUT WOULD NEED TO BE COMPLEMENTED WITH UNCONDITIONAL GRANTS IN THE LEAST DEVELOPED COUNTRIES. FOR THE PRIVATE SECTOR, POSITIVE TAX INCENTIVES, INSURANCE AND GUARANTEES CAN BE USED TO PROMOTE SUSTAINABLE BEHAVIOUR IN ENTERPRISES THAT PROVIDE BIODIVERSITY AND ECOSYSTEM SERVICES.
CAPACITY BUILDING AND TECHNOLOGY TRANSFER IN LESS DEVELOPED COUNTRIES WILL REQUIRE GRANT-BASED SUPPORT. NON-FINANCIAL INCENTIVES CAN ALSO BE USED TO IMPROVE CONDITIONALITY WITHIN COMMUNITY-LEVEL ACTIVITIES. NON-FINANCIAL INCENTIVES MAY ALSO BE MORE APPROPRIATE IN LEAST DEVELOPED COUNTRIES WHERE THERE ARE ISSUES OF ABSORPTIVE CAPACITY FOR FINANCE AND TO AVOID POLITICAL CAPTURE.
LEAST DEVELOPEDCOUNTRIES
DEVELOPING COUNTRIES
ADVANCED DEVELOPINGCOUNTRIES
CONSERVATION
SUSTAINABLE USE
CAPACITY BUILDING
TECHNOLOGY TRANSFER
152 153
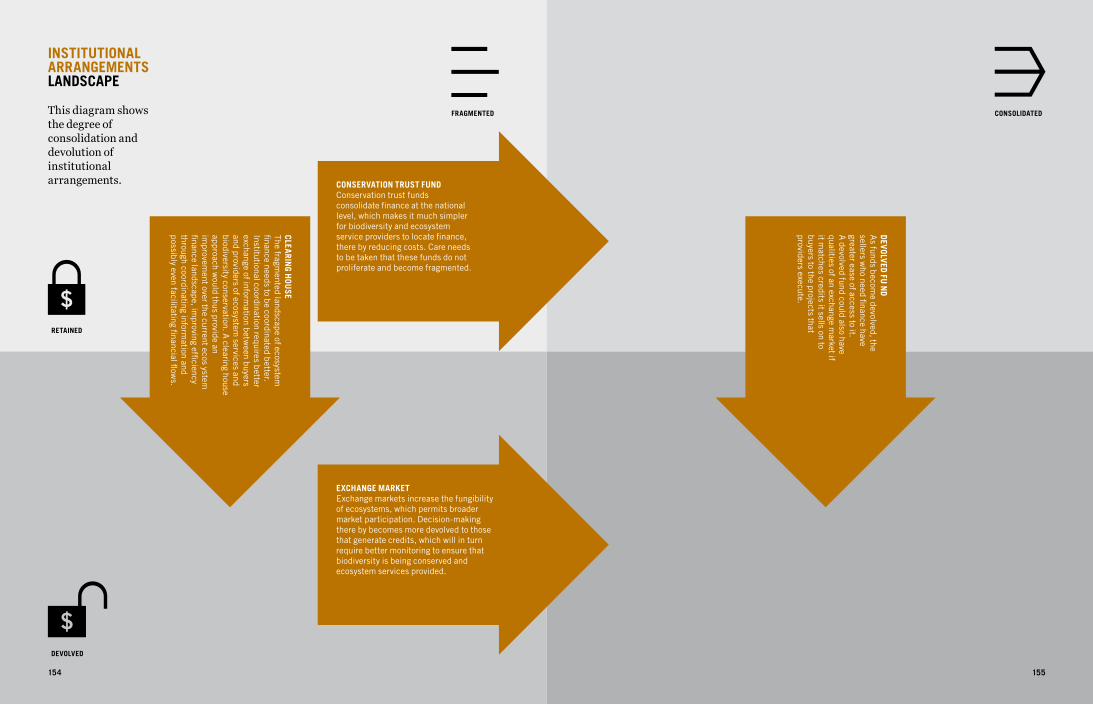
154 155
INSTITUTIONALARRANGEMENTSLANDSCAPE
This diagram showsthe degree ofconsolidation anddevolution ofinstitutionalarrangements. CONSERVATION TRUST FUND
Conservation trust fundsconsolidate finance at the nationallevel, which makes it much simplerfor biodiversity and ecosystemservice providers to locate finance,there by reducing costs. Care needsto be taken that these funds do notproliferate and become fragmented.
EXCHANGE MARKETExchange markets increase the fungibility of ecosystems, which permits broader market participation. Decision-making there by becomes more devolved to those that generate credits, which will in turn require better monitoring to ensure that biodiversity is being conserved and ecosystem services provided.
DEVOLVED FU N
DA
s funds become devolved, the
sellers who need finance have
greater ease of access to it. A
devolved fund could also havequalities of an exchange m
arket ifit m
atches credits it sells on tobuyers to the projects thatproviders execute.
CLEARING H
OUSE
The fragmented landscape of ecosystem
finance needs to be coordinated better. Institutional coordination requires better exchange of inform
ation between buyers
and providers of ecosystem services and
biodiversity conservation. A clearing house
approach would thus provide an
improvem
ent over the current ecos ystem
finance landscape, improving efficiency
through coordinating information and
possibly even facilitating financial flows.
DEVOLVED
RETAINED
FRAGMENTED CONSOLIDATED
154 155

156 157
WHERE DO WE GO FROM HERE?
158 159
JOSHUA BISHOPCHIEF ECONOMIST, IUCN (INTERNATIONAL UNION FOR CONSERVATION OF NATURE)
Financing biodiversity conservation and sustaining ecosystem services is an unresolved problem. This may seem surprising, given the amount of effort in recent years that has gone into justifying the expenditure, identifying priority investments, estimating the funding needed, and identifying potential sources of finance. But biodiversity conservation and the sustainable provision of ecosystem services turns out to be a tricky financing challenge, for several reasons.
The first issue is that many of the benefits of biodiversity and many ecosystem services can be considered ‘public goods’ (i.e. they are non-excludable and non-rivalrous). This means that firms who provide public biodiversity and ecosystem benefits cannot easily charge consumers for enjoying them, while at the same time people who are made worse off due to biodiversity and ecosystem loss cannot easily extract compensation from those responsible for the damage. In short, the market tends to ignore biodiversity altogether and many if not most ecosystem services. This problem can be solved using mechanisms that ‘internalize’ the public good value of natural capital in private production and consumption decisions, for example green commodities, subsidy reform, payment for ecosystem services and environmental offset schemes. Such mechanisms have the dual merit of directly addressing the economic drivers of biodiversity and ecosystem loss, while some also help to reduce pressure on government budgets. There is an urgent need to expand the use of these mechanisms in developing countries, where biodiversity is most concentrated, where the drivers of ecosystem loss are most intense, and where government budgets are most constrained.
The second reason that biodiversity and ecosystem services are chronically underfunded is that many of the public benefits of biodiversity and ecosystems services are enjoyed at a distance, far from the site of conservation – this is particularly the case for the non-use or ‘existence’ values of biodiversity. In contrast, most of the costs of conservation are incurred locally, notably the opportunity costs of forgoing certain uses of resources that are deemed incompatible with conservation. This disconnect poses a particular financing challenge, namely how to elicit sustainable funding from distant beneficiaries to compensate local communities for their loss of access to natural resources. While ‘sustainable uses’ such as eco-tourism or bio-prospecting can help fill the funding gap, the revenues generated by such activities often look modest compared to the short-term profits, local jobs and government tax revenues promised by promoters of conventional, more destructive uses of natural resources. A significant expansion of international funding is needed to bridge the gap between the global beneficiaries and local providers of biodiversity and ecosystem services. Not all of this need come from public sources, although intergovernmental agreement is probably required to establish an effective enabling framework that can stimulate increased international finance for biodiversity conservation and ecosystem services from the private sector.
The third problem facing proponents of biodiversity conservation and ecosystem servicesis that we still have limited knowledge of the extent and value of natural capital, especially in marine environments. We know little about the functional value of biodiversity and other forms of natural capital, for instance, how the quantity and quality of ecosystem services vary with the diversity of genes, species and ecosystems. There is some evidence that we may be nearing ecological thresholds, where further biodiversity loss would result in the collapse of certain ecological functions and a dramatic decline in ecosystem services, but the precise nature and location of these thresholds remains very unclear. As a result, decision-makers don’t know which ecosystems or which components of biodiversity most need to be conserved, or where they need to be conserved, in order to maintain and increase human prosperity. In short, there is an urgent need to develop the natural capital knowledge base, particularly on the links between biodiversity, ecosystem services and the economy.
Despite these challenges, biodiversity conservation remains a priority for international finance for the simple reason that we lack technical substitutes for many of the benefits provided by nature. Not only is it impossible to bring extinct species back to life, but we also have no cost-effective substitutes for many - if not all - of the ecosystem services that we depend upon, such as the natural assimilation of waste and toxic material, regeneration of soils, pollination of important food plants, and other so-called ‘regulating’ and ‘supporting’ services.
Some potential solutions to the biodiversity and ecosystem finance challenge are highlighted above, notably wider use of economic incentives to ‘internalize’ ecosystem values, more international funding for conservation, including private finance, and increased research on the links between biodiversity, ecosystem services and human well-being. In addition, there are a few immediate steps that need to be taken towards a more rational approach to biodiversity and ecosystem finance:
• Track what is currently being spent on biodiversity and ecosystem services, including private as well as public expenditure, direct spending as well as indirect costs (such as positive tax incentives), the opportunity costs of protected areas (including ‘community conserved areas’), and the marginal costs of adopting ‘ecosystem-friendly’ production practices;
• Assess the relative effectiveness of different financial mechanisms, in terms of well-defined indicators of conservation outcome or, where feasible and appropriate, in terms of the economic value of ecosystem services delivered;
• Better understand the conservation funding gap for different components of natural capital, by preparing objective, independently-verified estimates in different parts of the world, expressed in terms of specific conservation outcomes and quantitative indicators.

160 161
ANNEXES
162 163
BIBLIOGRAPHY
AGRAWALA, S. & CARRARO, M. 2010. Assessing the Role of Microfinance in Fostering Adaptation to Climate Change. In: OECD PUBLISHING (ed.) OECD Environmental Working Paper No. 15. OECD.
ASQUITH, N., VARGAS, M. & WUNDER, S. 2008. Selling two environmental services: In-kind payments for bird habitat and watershed protection in Los Negros, Bolivia. Ecological Economics, 65, 675-684.
BENICK, D., ENTENMANN, S., PISTORIUS, T. & SCHMITT, C. B. 2010. Greening REDD+ Challenges and opportunities for forest biodiversity conservation: Workshop summary. University of Freiburg.
BETTS, R. A., FALLOON, P. D., GOLDEWIJK, K. K. & RAMANKUTTY, N. 2007. Biogeophysical effects of land use on climate: Model simulations of radiative forcing and large-scale temperature change. Agricultural and Forest Meteorology, 142, 216-233.
BONAN, G. B. 2008. Forests and Climate Change: Forcings, Feedbacks, and the Climate Benefits of Forests. Science, 320, 1444-1449.
BOYD, J., CABALLERO, K. & SIMPSON, R. D. 1999. The Law and Economics of Habitat Conservation: Lessons from an Analysis of Easement Acquisitions. Washington, DC: Resources for the Future.
BRAAT, L. & TEN BRINK, P. 2009. The Cost of Policy Inaction: The case of not meeting the 2010 biodiversity target.
BROWN, J., NANASTA, D. & BIRD, N. 2009. Financing Climate Change to Support Mitigation and Adaptation Actions in Africa: Key Issues and Options for Policies and Negotiations.
CASTRO, R. & HAMMOND, B. 2009. The Architecture of Aid for the Environment: A ten-year statistical perspective. CFP Working Paper Series. The World Bank Group.
CBD 2009. The CBD PoWPA Gap Analysis: A tool to identify potential sites for action under REDD-plus. CBD.
CBD 2010a. Global Monitoring Report 2010 – Innovative Financing for Biodiversity.
CBD 2010b. Innovative Financial Mechanisms: Report of the proceedings of the International Workshop on Innovative Financial Mechanisms. Convention on Biological Diversity. Nairobi.
CFA 2003. Conservation Finance Guide.
CHIVIAN, E. 2002. Biodiversity: Its Importance to Human Health. In: CHIVIAN, E. (ed.). Center for Health and the Global Environment. Harvard Medical School.
COSTANZA, R., D’ARGE, R., DE GROOT, R., FARBERK, S., GRASSO, M., HANNON, B., LIMBURG, K., NAEEM, S., O’NEILL, R. V., PARUELO, J., RASKIN, R. G., SUTTON, P. & VAN DEN BELT, M. 1997. The value of the world’s ecosystem services and natural capital. Nature, 387, 253-260.
COSTANZA, R. & DALY, H. E. 1992. Natural Capital and Sustainable Development. Conservation Biology, 6, 37-46.
COSTELLO, C. & WARD, M. 2006. Search, bioprospecting and biodiversity conservation. Journal of Environmental Economics and Management, 52, 615–626.
DALY, H. E. & FARLEY, J. 2004. Ecological Economics: Principles and Applications. Island Press, Washington DC.
DEO, R. C., SYKTUS, J. I., MCALPINE, C. A., LAWRENCE, P. J., MCGOWAN, H. A. & PHINN, S. R. 2009. Impact of historical land cover change on daily indices of climate extremes including droughts in eastern Australia. Geophysical Research Letters, 36, 5.
DOORNBOSCH, R. & KNIGHT, E. 2008. What Role For Public Finance In International Climate Change Mitigation. OECD.
DUDLEY, N. & STOLTON, S. 2003. Running pure: the importance of forest protected areas to drinking water. Gland, Switzerland: WWF/World Bank Alliance for Forest Conservation and Sustainable Use.
ECOSYSTEM MARKETPLACE 2008. Payments for Ecosystem Services: Market Profiles.
EFTEC, IEEP, STRATUS CONSULTING & IUCN 2010. The use of market-based instruments for biodiversity protection: The case of habitat banking. Technical Report.
ELIASCH, J. 2008. Climate Change: Financing Global Forests. The Eliasch Review.
FARLEY, J. & COSTANZA, R. 2010. Payments for Ecosystem Services: From local to global. Ecological Economics, 69, 2060-2068.
FENNELL, D. 2007. Ecotourism.
FLOMBAUM, P. & SALA, O. E. 2008. Higher effect of plant species diversity on productivity in natural than artificial ecosystems. Proceedings of the National Academy of Science, Vol. 105, 6087-6090.
FORUM FOR THE FUTURE 2009. Forest Investment Review.
GIRISHANKAR, N. 2009. Innovating Development Finance: From Financing Sources to Financial Solutions. CFP Working Paper Series. The World Bank.
GUTMAN, P. & DAVIDSON, S. 2008. A Review of Innovative International Financial Mechanisms for Biodiversity Conservation: With a Special Focus on the International Financing of Developing Countries’ Protected Areas, A Contribution to the COP9 of the CBD. WWF.
HAMILTON, K., CHOKKALINGAM, U. & BENDANA, M. 2010. State of the Forest Carbon Markets 2009: Taking Root & Branching Out. Ecosystem Marketplace.
HANSON, C., RANGANATHAN, J., ICELAND, C. & JOHN, F. 2007. The Corporate Ecosystem Services Review: Guidelines for Identifying Business Risks and Opportunities Arising from Ecosystem Change. World Resources Institute.
HARMELING, S., BALS, C., STERK, W. & WATANABE, R. 2009. Funding Sources For International Climate Policy. A Criteria-Based Analysis Of The Options Discussed Under The Unfccc. Germanwatch.
HILLEL, D. & ROSENZWEIG, C. 2008. Biodiversity And Food
Production. In: CHIVIAN, E. & BERNSTEIN, A. (eds.) Sustaining Life: How Human Health Depends On Biodiversity. New York, NY: Oxford University Press.
HONEY, M. 2008. Ecotourism and Sustainable Development: Who owns paradise? , Island Press.
HOOPER, D. U., CHAPIN III, F. S., EWEL, J. J., HECTOR, A., INCHAUSTI, P., LAVOREL, S., LAWTON, J. H., LODGE, D. M., LOREAU, M., NAEEM, S., SCHMID, B., SETÄLÄ, H., SYMSTAD, A. J., VANDERMEER, J. & WARDLE, D. A. 2005. Effects of Biodiversity on Ecosystem Functioning: A Consensus of Current Knowledge. Ecological Monographs, Vol. 75, 3-35.
IPCC 2007. IPCC Fourth Assessment Report: Climate Change 2007. Geneva, Switzerland: IPCC.
IUCN 2010. Saving biodiversity: An economic approach. In: KNEE, A. (ed.). International Union for Conservation of Nature and Natural Resources.
IWG-IFR 2009. Summary of Report of the Informal Working Group on Interim Finance for REDD+ (IWG- IFR).
JAMES, A., GASTON, K. & BALMFORD, A. 2001. Can we afford to conserve biodiversity? Bioscience, 51, 43–52.
JONES, K. E., PATEL, N. G., LEVY, M. A., STOREYGARD, A., BALK, D., GITTLEMAN, J. L. & DASZAK, P. 2008. Global trends in emerging infectious diseases. Nature, 451, 990-993.
KAROUSAKIS, K. 2009. Promoting Biodiversity Co-Benefits in REDD. OECD Environment Working Papers. OECD.
KOSOY, N., MARTINEZ-TUNA, M., MURADIAN, R. & MARTINEZ-ALIER, J. 2007. Payments for environmental services in watersheds: insights from a comparative study of three cases in Central America. Ecological Economics, 61, 446–455.
KOTCHEN, M. J. 2005. Impure public goods and the comparative statics of environmentally friendly consumption. Journal of Environmental Economics and Management, 49, 281-300.
KOTCHEN, M. J. 2006. Green Markets and Private Provision of Public Goods. Journal of Political Economy, 114.
LEWIS, S. L., LOPEZ-GONZALEZ, G., SONKE, B., AFFUM-BAFFOE, K., BAKER, T. R., OJO, L. O., PHILLIPS, O. L., REITSMA, J. M., WHITE, L., COMISKEY, J. A., DJUIKOUO, M. N., EWANGO, C. E. N., FELDPAUSCH, T. R., HAMILTON, A. C., GLOOR, M., HART, T., HLADIK, A., LLOYD, J., LOVETT, J. C., MAKANA, J. R., MALHI, Y., MBAGO, F. M., NDANGALASI, H. J., PEACOCK, J., PEH, K. S. H., SHEIL, D., SUNDERLAND, T., SWAINE, M. D., TAPLIN, J., TAYLOR, D., THOMAS, S. C., VOTERE, R. & WOLL, H. 2009. Increasing Carbon Storage In Intact African Tropical Forests. Nature, 457, U3.
MARENGO, J. A., SOARES, W. R., SAULO, C. & NICOLINI, M. 2004. Climatology of the low-level jet east of the Andes as derived from the NCEP-NCAR reanalyses: Characteristics and temporal variability. Journal of Climate, 17, 2261-2280.
MILLENNIUM ECOSYSTEM ASSESSMENT 2005. Ecosystems and Human Well-being: Synthesis. Washington, DC.: Island Press.
MÜLLER, B. 2008. International Adaptation Finance: The Need for an Innovative and Strategic Approach. Oxford Institute for Energy Studies.
MÜLLER, B. & GOMEZ-ECHEVERRI, L. 2009. The Reformed Financial Mechanism of the UNFCCC. European Capacity Building Initiative.
MULLIGAN, M. (2010) Relative species richness for amphibians and mammals, calculated from individual species distribution maps for mammals and amphibians from IUCN (data source: [www.iucnredlist.org/mammals]. Downloaded on 9 May 2009 and [www.iucnredlist.org/amphibians]. Downloaded on 9 May 2009].
MURADIAN, R., CORBERA, E., PASCUAL, U., KOSOY, N. & MAY, P. H. 2010. Reconciling theory and practice: An alternative conceptual framework for understanding payments for environmental services. Ecological Economics, 69, 1202-1208.
NISSANKE, M. 2003. Revenue Potential of the Tobin Tax for Development Finance: A Critical Appraisal. School of Oriental and African Studies, University of London.
NUSSBAUM, R., HOARE, A., MCDERMOTT, C., SAUNDERS, J. & MOURA COSTA, P. 2009. Accelerating Transfers of Interim Finance for REDD+: Building Absorptive Capacity. Oxford: ProForest.
O’SULLIVAN, R., STRECK, C., PEARSON, T., BROWN, S. & GILBERT, A. 2010. Engaging the Private Sector in the Potential Generation of Carbon Credits from REDD+; An Analysis of Issues, Report to the UK Department for International Development (DFID).
ODEDOKUN, M. O. 2003. Economics and Politics of Official Loans Versus Grants: Panoramic Issues and Empirical Evidence. Helsinki, Finland: UNU/WIDER.
OECD 2005. Environmental Fiscal Reform for Policy Reduction. DAC Reference Document. Organisation for Economic Co-operation and Development.
OECD. 2010. Development aid rose in 2009 and most donors will meet 2010 aid targets [Online]. Available: http://www.oecd.org/document/11/0,3343,en_2649_34487_44981579_1_1_1_1,00.html [Accessed].
PAGIOLA, S. & PLATAIS, G. 2002. Payments for Environmental Services. Environment Strategy Notes. Washington, DC The World Bank.
PARKER, C., BROWN, J. & PICKERING, J. 2009. The Little Climate Finance Book. Oxford: Global Canopy Programme.
PASCUAL, U., CORBERA, E., MURADIAN, R. & KOSOY, N. 2010. Special Section - Payments for Environmental Services: Reconciling Theory and Practice. Ecological Economics, 69, 1193-1364.
PEARCE, D. 2004. Environmental market creation: saviour or oversell? Portuguese Economic Journal, 3, 115–144.
PERSSON, A. S., KLEIN, R. J. T., KEHLER SIEBERT, C., ATTERIDGE, A., MÜLLER, B., HOFFMAISTER, J., LAZARUS, M. & TAKAMA , T. 2009. Adaptation Finance under a Copenhagen Agreed Outcome. Stockholm Environment Institute.
PORRAS, I., GRIEG-GRAN, M. & NEVES, N. 2008. All that glitters: A review of payments for watershed services in developing countries. Natural Resource Issues. London, UK: International Institute for Environment and Development.
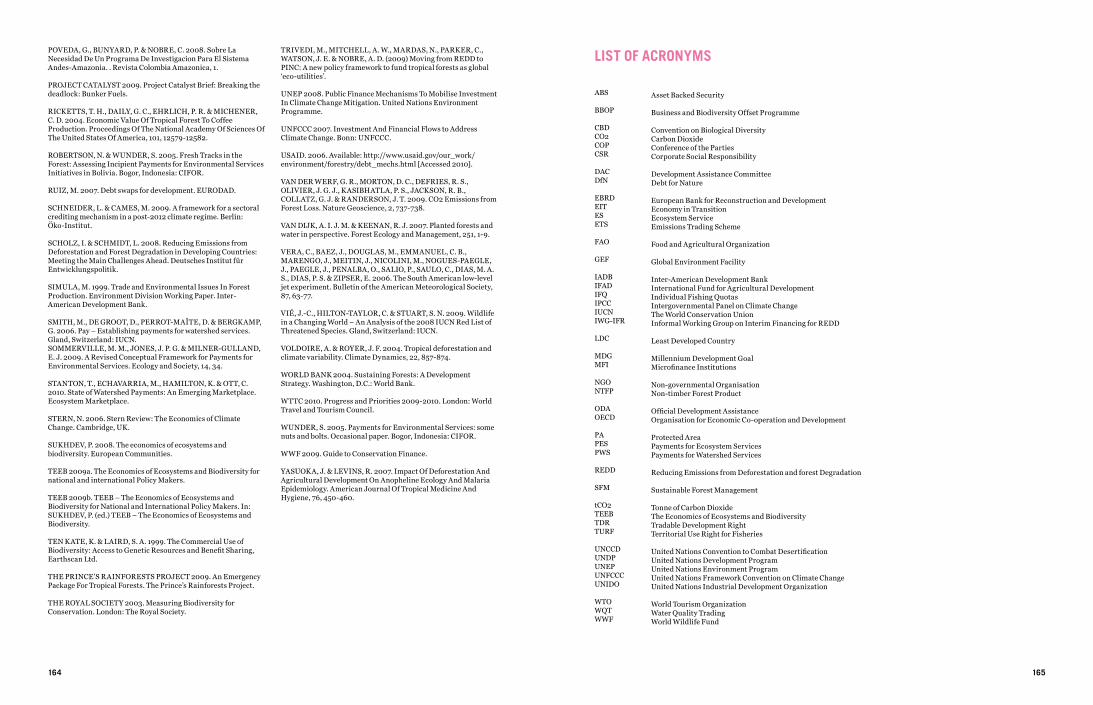
164 165
POVEDA, G., BUNYARD, P. & NOBRE, C. 2008. Sobre La Necesidad De Un Programa De Investigacion Para El Sistema Andes-Amazonia. . Revista Colombia Amazonica, 1.
PROJECT CATALYST 2009. Project Catalyst Brief: Breaking the deadlock: Bunker Fuels.
RICKETTS, T. H., DAILY, G. C., EHRLICH, P. R. & MICHENER, C. D. 2004. Economic Value Of Tropical Forest To Coffee Production. Proceedings Of The National Academy Of Sciences Of The United States Of America, 101, 12579-12582.
ROBERTSON, N. & WUNDER, S. 2005. Fresh Tracks in the Forest: Assessing Incipient Payments for Environmental Services Initiatives in Bolivia. Bogor, Indonesia: CIFOR.
RUIZ, M. 2007. Debt swaps for development. EURODAD.
SCHNEIDER, L. & CAMES, M. 2009. A framework for a sectoral crediting mechanism in a post-2012 climate regime. Berlin: Öko-Institut.
SCHOLZ, I. & SCHMIDT, L. 2008. Reducing Emissions from Deforestation and Forest Degradation in Developing Countries: Meeting the Main Challenges Ahead. Deutsches Institut für Entwicklungspolitik.
SIMULA, M. 1999. Trade and Environmental Issues In Forest Production. Environment Division Working Paper. Inter-American Development Bank.
SMITH, M., DE GROOT, D., PERROT-MAÎTE, D. & BERGKAMP, G. 2006. Pay – Establishing payments for watershed services. Gland, Switzerland: IUCN.SOMMERVILLE, M. M., JONES, J. P. G. & MILNER-GULLAND, E. J. 2009. A Revised Conceptual Framework for Payments for Environmental Services. Ecology and Society, 14, 34.
STANTON, T., ECHAVARRIA, M., HAMILTON, K. & OTT, C. 2010. State of Watershed Payments: An Emerging Marketplace. Ecosystem Marketplace.
STERN, N. 2006. Stern Review: The Economics of Climate Change. Cambridge, UK.
SUKHDEV, P. 2008. The economics of ecosystems and biodiversity. European Communities.
TEEB 2009a. The Economics of Ecosystems and Biodiversity for national and international Policy Makers.
TEEB 2009b. TEEB – The Economics of Ecosystems and Biodiversity for National and International Policy Makers. In: SUKHDEV, P. (ed.) TEEB – The Economics of Ecosystems and Biodiversity.
TEN KATE, K. & LAIRD, S. A. 1999. The Commercial Use of Biodiversity: Access to Genetic Resources and Benefit Sharing, Earthscan Ltd.
THE PRINCE’S RAINFORESTS PROJECT 2009. An Emergency Package For Tropical Forests. The Prince’s Rainforests Project.
THE ROYAL SOCIETY 2003. Measuring Biodiversity for Conservation. London: The Royal Society.
TRIVEDI, M., MITCHELL, A. W., MARDAS, N., PARKER, C., WATSON, J. E. & NOBRE, A. D. (2009) Moving from REDD to PINC: A new policy framework to fund tropical forests as global ‘eco-utilities’.
UNEP 2008. Public Finance Mechanisms To Mobilise Investment In Climate Change Mitigation. United Nations Environment Programme.
UNFCCC 2007. Investment And Financial Flows to Address Climate Change. Bonn: UNFCCC.
USAID. 2006. Available: http://www.usaid.gov/our_work/environment/forestry/debt_mechs.html [Accessed 2010].
VAN DER WERF, G. R., MORTON, D. C., DEFRIES, R. S., OLIVIER, J. G. J., KASIBHATLA, P. S., JACKSON, R. B., COLLATZ, G. J. & RANDERSON, J. T. 2009. CO2 Emissions from Forest Loss. Nature Geoscience, 2, 737-738.
VAN DIJK, A. I. J. M. & KEENAN, R. J. 2007. Planted forests and water in perspective. Forest Ecology and Management, 251, 1-9.
VERA, C., BAEZ, J., DOUGLAS, M., EMMANUEL, C. B., MARENGO, J., MEITIN, J., NICOLINI, M., NOGUES-PAEGLE, J., PAEGLE, J., PENALBA, O., SALIO, P., SAULO, C., DIAS, M. A. S., DIAS, P. S. & ZIPSER, E. 2006. The South American low-level jet experiment. Bulletin of the American Meteorological Society, 87, 63-77.
VIÉ, J.-C., HILTON-TAYLOR, C. & STUART, S. N. 2009. Wildlife in a Changing World – An Analysis of the 2008 IUCN Red List of Threatened Species. Gland, Switzerland: IUCN.
VOLDOIRE, A. & ROYER, J. F. 2004. Tropical deforestation and climate variability. Climate Dynamics, 22, 857-874.
WORLD BANK 2004. Sustaining Forests: A Development Strategy. Washington, D.C.: World Bank.
WTTC 2010. Progress and Priorities 2009-2010. London: World Travel and Tourism Council.
WUNDER, S. 2005. Payments for Environmental Services: some nuts and bolts. Occasional paper. Bogor, Indonesia: CIFOR.
WWF 2009. Guide to Conservation Finance.
YASUOKA, J. & LEVINS, R. 2007. Impact Of Deforestation And Agricultural Development On Anopheline Ecology And Malaria Epidemiology. American Journal Of Tropical Medicine And Hygiene, 76, 450-460.
LIST OF ACRONYMS
Asset Backed Security
Business and Biodiversity Offset Programme
Convention on Biological DiversityCarbon DioxideConference of the PartiesCorporate Social Responsibility
Development Assistance CommitteeDebt for Nature
European Bank for Reconstruction and DevelopmentEconomy in TransitionEcosystem ServiceEmissions Trading Scheme
Food and Agricultural Organization
Global Environment Facility
Inter-American Development BankInternational Fund for Agricultural DevelopmentIndividual Fishing QuotasIntergovernmental Panel on Climate ChangeThe World Conservation UnionInformal Working Group on Interim Financing for REDD
Least Developed Country
Millennium Development GoalMicrofinance Institutions
Non-governmental OrganisationNon-timber Forest Product
Official Development AssistanceOrganisation for Economic Co-operation and Development
Protected AreaPayments for Ecosystem ServicesPayments for Watershed Services
Reducing Emissions from Deforestation and forest Degradation
Sustainable Forest Management
Tonne of Carbon DioxideThe Economics of Ecosystems and BiodiversityTradable Development RightTerritorial Use Right for Fisheries
United Nations Convention to Combat DesertificationUnited Nations Development Program United Nations Environment ProgramUnited Nations Framework Convention on Climate ChangeUnited Nations Industrial Development Organization
World Tourism OrganizationWater Quality TradingWorld Wildlife Fund
ABS
BBOP
CBDCO2COPCSR
DACDfN
EBRDEITESETS
FAO
GEF
IADBIFADIFQIPCCIUCNIWG-IFR
LDC
MDGMFI
NGONTFP
ODAOECD
PAPESPWS
REDD
SFM
tCO2TEEBTDRTURF
UNCCDUNDPUNEPUNFCCCUNIDO
WTOWQTWWF

166
The Little Biodiversity Finance Book will be constantly updated online. To follow developments visit: www.globalcanopy.org