Embed Size (px)
Citation preview
1
© 2008 Brooks/Cole 1
Chapter 11: Liquids, Solids and Materials
Chemistry: The Molecular ScienceMoore, Stanitski and Jurs
© 2008 Brooks/Cole 2
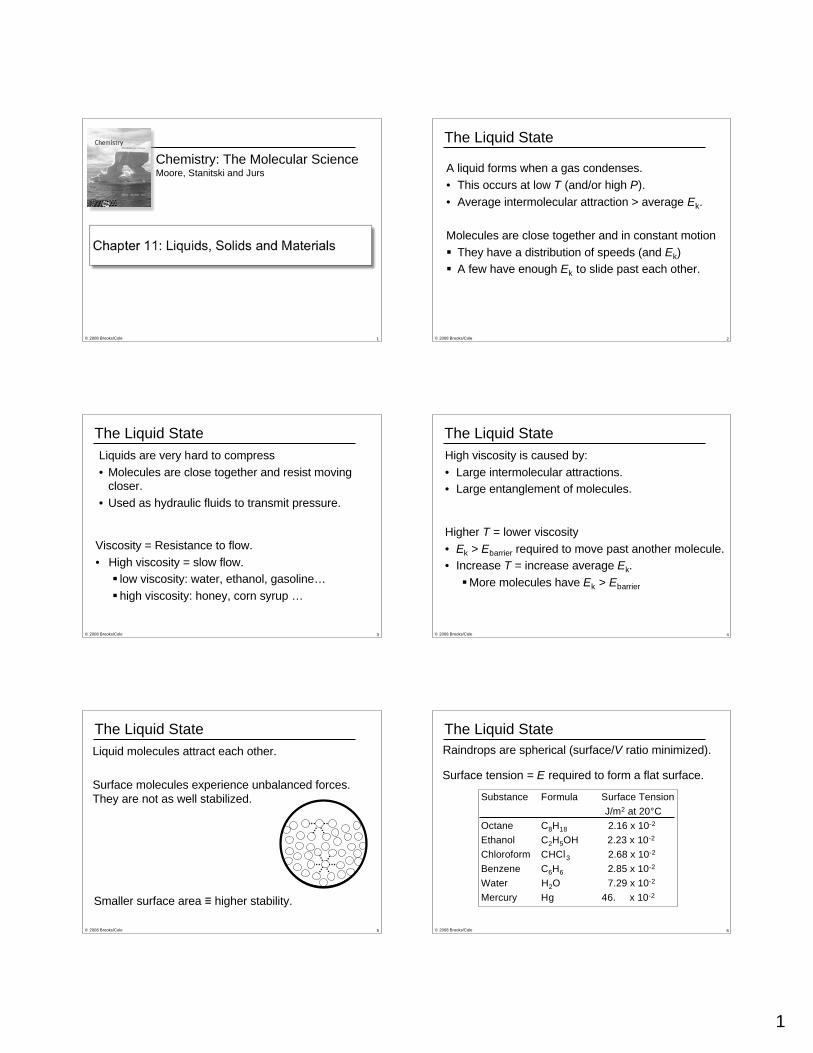
The Liquid State
A liquid forms when a gas condenses.
• This occurs at low T (and/or high P).
• Average intermolecular attraction > average Ek.
Molecules are close together and in constant motion
They have a distribution of speeds (and Ek)
A few have enough Ek to slide past each other.
© 2008 Brooks/Cole 3
Liquids are very hard to compress
• Molecules are close together and resist movingcloser.
• Used as hydraulic fluids to transmit pressure.
The Liquid State
Viscosity = Resistance to flow.
• High viscosity = slow flow.
low viscosity: water, ethanol, gasoline…
high viscosity: honey, corn syrup …
© 2008 Brooks/Cole 4
High viscosity is caused by:
• Large intermolecular attractions.
• Large entanglement of molecules.
Higher T = lower viscosity
• Ek > Ebarrier required to move past another molecule.
• Increase T = increase average Ek.
More molecules have Ek > Ebarrier
The Liquid State
© 2008 Brooks/Cole 5
Liquid molecules attract each other.
Surface molecules experience unbalanced forces.
They are not as well stabilized.
Smaller surface area higher stability.
The Liquid State
© 2008 Brooks/Cole 6
Raindrops are spherical (surface/V ratio minimized).
Surface tension = E required to form a flat surface.
Substance Formula Surface Tension
J/m2 at 20°C
Octane C8H18 2.16 x 10⁻²
Ethanol C2H5OH 2.23 x 10⁻²
Chloroform CHCl3 2.68 x 10⁻²
Benzene C6H6 2.85 x 10⁻²
Water H2O 7.29 x 10⁻²
Mercury Hg 46. x 10-2
The Liquid State
2
© 2008 Brooks/Cole 7
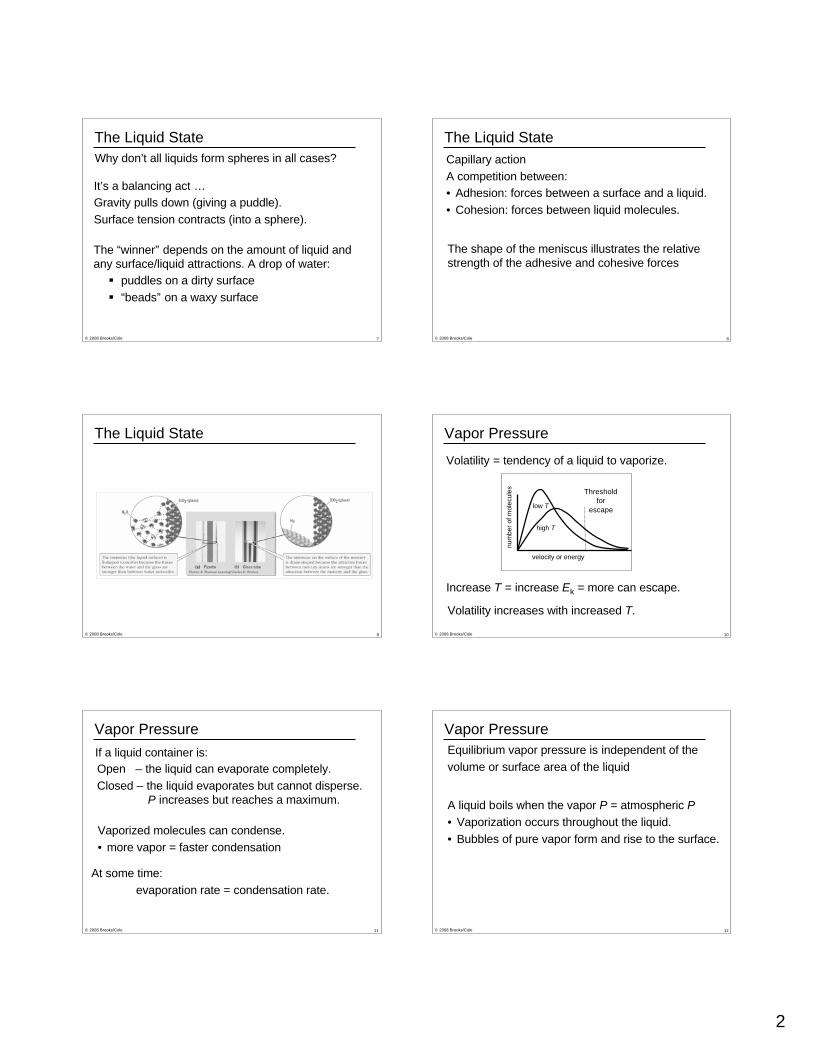
Why don’t all liquids form spheres in all cases?
It’s a balancing act …
Gravity pulls down (giving a puddle).
Surface tension contracts (into a sphere).
The “winner” depends on the amount of liquid and
any surface/liquid attractions. A drop of water:
puddles on a dirty surface
“beads” on a waxy surface
The Liquid State
© 2008 Brooks/Cole 8
Capillary action
A competition between:
• Adhesion: forces between a surface and a liquid.
• Cohesion: forces between liquid molecules.
The shape of the meniscus illustrates the relative
strength of the adhesive and cohesive forces
The Liquid State
© 2008 Brooks/Cole 9
The Liquid State
© 2008 Brooks/Cole 10
Volatility = tendency of a liquid to vaporize.
low T
velocity or energy
num
ber
of m
ole
cule
s
Threshold
for
escape
high T
Volatility increases with increased T.
Increase T = increase Ek = more can escape.
Vapor Pressure
© 2008 Brooks/Cole 11
If a liquid container is:
Open – the liquid can evaporate completely.
Closed – the liquid evaporates but cannot disperse.
Vaporized molecules can condense.
• more vapor = faster condensation
At some time:
evaporation rate = condensation rate.
P increases but reaches a maximum.
Vapor Pressure
© 2008 Brooks/Cole 12
Vapor Pressure
Equilibrium vapor pressure is independent of the
volume or surface area of the liquid
A liquid boils when the vapor P = atmospheric P
• Vaporization occurs throughout the liquid.
• Bubbles of pure vapor form and rise to the surface.
3
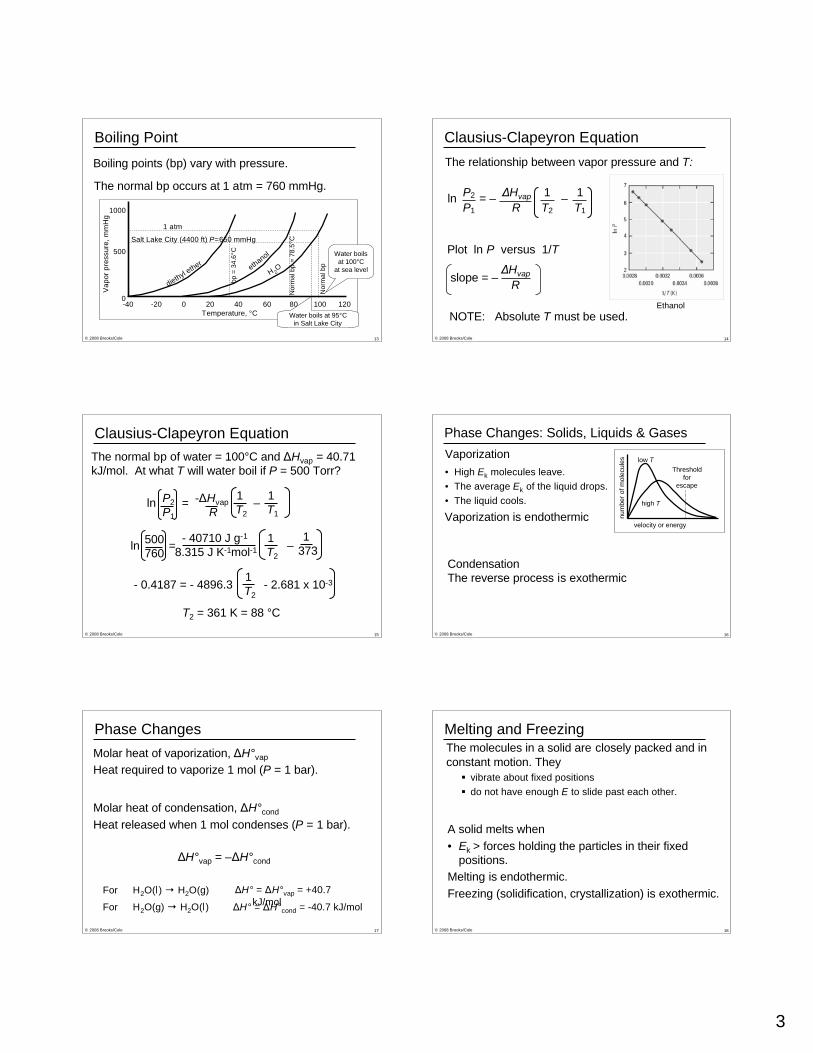
© 2008 Brooks/Cole 13
The normal bp occurs at 1 atm = 760 mmHg.
Boiling Point
Boiling points (bp) vary with pressure.
Norm
al bp =
78.5
°C
ethanol Water boils
at 100°C
at sea level
1 atm
Norm
al bp
-40 -20 0 20 40 60 80 100 120
Temperature, °C
Va
po
r p
ressu
re,
mm
Hg
1000
500
0
H 2O
diethyl ether
bp =
34.6
°CSalt Lake City (4400 ft) P=650 mmHg
Water boils at 95°C
in Salt Lake City
© 2008 Brooks/Cole 14
Clausius-Clapeyron Equation
The relationship between vapor pressure and T:
ln = – –P2
P1
Hvap
R
1
T2
1
T1
Ethanol
NOTE: Absolute T must be used.
Plot ln P versus 1/T
slope = – Hvap
R
© 2008 Brooks/Cole 15
Clausius-Clapeyron Equation
The normal bp of water = 100°C and Hvap = 40.71
kJ/mol. At what T will water boil if P = 500 Torr?
ln = – P2
P1
1
T2
1
T1
- Hvap
R
ln = – 500
760
1
3731
T2
- 40710 J g-1
8.315 J K-1mol-1
- 0.4187 = - 4896.3 - 2.681 x 10⁻³¹
T2
T2 = 361 K = 88 °C
© 2008 Brooks/Cole 16
Phase Changes: Solids, Liquids & Gases
Vaporizationlow T
velocity or energy
num
ber
of m
ole
cule
s
Threshold
for
escape
high T
• High Ek molecules leave.
• The average Ek of the liquid drops.
• The liquid cools.
Vaporization is endothermic
Condensation
The reverse process is exothermic
© 2008 Brooks/Cole 17
Phase Changes
H°vap = – H°cond
Molar heat of vaporization, H°vap
Heat required to vaporize 1 mol (P = 1 bar).
Molar heat of condensation, H°cond
Heat released when 1 mol condenses (P = 1 bar).
For H2O(l) H2O(g) H° = H°vap = +40.7
kJ/molFor H2O(g) H2O(l) H° = H°cond = -40.7 kJ/mol
© 2008 Brooks/Cole 18
Melting and FreezingThe molecules in a solid are closely packed and in
constant motion. They
vibrate about fixed positions
do not have enough E to slide past each other.
A solid melts when
• Ek > forces holding the particles in their fixed
positions.
Melting is endothermic.
Freezing (solidification, crystallization) is exothermic.
4
© 2008 Brooks/Cole 19
Phase Changes
H°fus = – H°cryst
Molar heat of crystallization, H°cryst
Heat released when 1 mol crystallizes (P = 1 bar).
For H2O(s) H2O(l) H° = H°fus = +6.02 kJ/mol
For H2O(l) H2O(s) H° = H°cryst = -6.02 kJ/mol
Normal melting or freezing occurs at P = 1 atm
Molar heat of fusion, H°fus
Heat required to melt 1 mol (P = 1 bar).
© 2008 Brooks/Cole 20
Phase Changes
Sublimation – the direct conversion of a solid to a gas
Examples
Solid CO2 (dry ice) sublimes.
Ice (v.p. = 4.6 mmHg @ 0°C) in a frost-free ‘fridge is removed
by blowing dry air over it…
Deposition is the reverse process: (g) (s)
Example: plating Al onto the surface of a CD
H°sub = – H°dep
© 2008 Brooks/Cole 21
Phase Changes
endothermic
process
(heat added)
exothermic
process
(heat released)
© 2008 Brooks/Cole 22
Phase Changes
Substance mp(°C) Hfus(kJ/mol) bp(°C) Hvap(kJ/mol)
O2 (16 e-) –248 0.445 –183.0 6.8
F2 (18 e-) –220 1.020 –188.1 6.54
Cl2 (34 e-) –103 6.406 –34.6 20.39
Br2 (70 e-) –7.2 10.794 59.6 29.54
Nonpolar molecules
London forces increase as the number of e- increase.
The data support this trend…
© 2008 Brooks/Cole 23
Phase Changes
Substance mp(°C) Hfus(kJ/mol)* bp(°C) Hvap(kJ/mol)*
SO2 (32 e-) –76 7.4 –10.0 24.9
HCl (18 e-) –115 2.0 –85.1 16.2
HBr (36 e-) –87 2.4 –66.8 17.6
H2O (10 e-) 0 6.0 +100.0 40.7
HF (10 e-) –83 4.6 +19.5 7.5
NH3 (10 e-) –78 5.6 –33.5 23.4
Polar molecules
More difficult to explore trends.
Values depend on London, dipole forces and H-bonding.
*At the normal phase-transition temperature (Air Liquide Gas Encyclopedia)
© 2008 Brooks/Cole 24
Phase Changes
Substance mp(°C) Hfus(kJ/mol)
NaCl 800 30.21
NaBr 747 25.69
NaI 662 21.95
Ionic solids
All Na+ ions / halide ion (-1 charge) compounds.
They only differ in halide size: I- > Br- > Cl-
Larger ion further apart weaker attraction
5
© 2008 Brooks/Cole 25
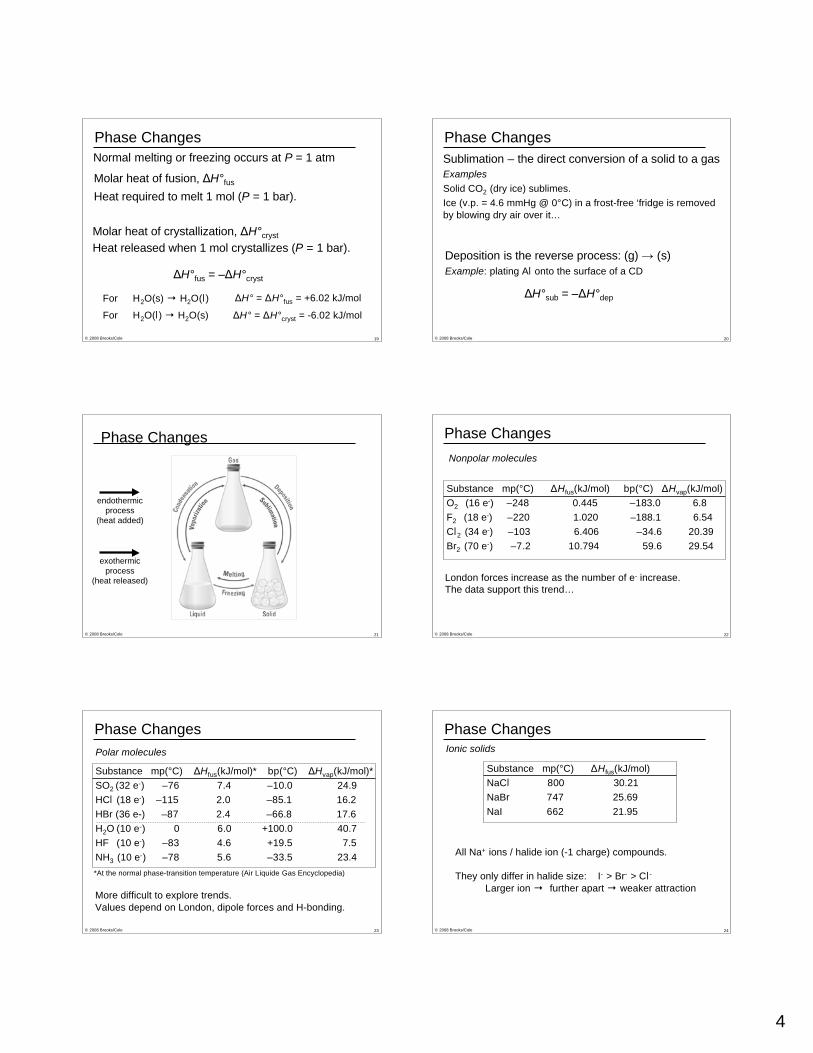
Heating Curve
Convert 100 g of ice at -20°C into vapor at 120°C.
© 2008 Brooks/Cole 26
TOTAL heat required = 308.9 kJ
Heat the ice to 0°C.
H = mc T = (100g)(2.06 Jg-1°C-1)(0-[-20]°C) = 4.1 kJ
Convert the ice to water
H = n Hfus = (100g/18.02g mol-1)(6.020 kJ/mol) = 33.4 kJ
Heat the water from 0°C to 100°C.
H = mc T = (100g)(4.184 Jg-1°C-1)(100 - 0°C) = 41.8 kJ
Convert water to steam (at its normal bp).
H = n Hvap = (100g/18.02 g mol-1)(40.7 kJ/mol) = 225.9 kJ
Heat steam from 100 to 120°C.
H = mc T = (100g)(1.84 Jg-1°C-1)(120 - 100°C) = 3.7 kJ
Heating Curve
© 2008 Brooks/Cole 27
Pre
ssu
re (
atm
)
Temperature (°C)
Phase Diagrams
Solid Liquid
Gas
critical point
triple pointsublimation
deposition
freezing
melting
condensation
vaporization
Melting point
curve
Vapor-pressure
curve
Supercritical
fluid
© 2008 Brooks/Cole 28
Phase Diagrams
Triple point
Three phases in equilibrium. T and P are fixed.
Water T = 0.01°C, P = 4.58 mmHg
CO2 T = -57°C, P = 5.2 atm
Critical point
The end of the liquid/gas equilibrium line. It occurs at
the critical temperature, Tc and critical pressure, Pc
Water Tc = 374°C, Pc = 218 atm
CO2 Tc = 31°C, Pc = 73 atm
Above Tc a gas cannot be liquefied (at any P)
© 2008 Brooks/Cole 29
Supercritical CO2 is an important solvent. It is used:
Above Tc and Pc the substance is neither a liquid nor
a gas. It is a supercritical fluid.
It has:
• to extract caffeine from coffee beans
• as a dry-cleaning fluid
• a density characteristic of a liquid.
• flow properties of a gas.
Critical Temperature and Pressure
© 2008 Brooks/Cole 30
Water Phase Diagram
For most materials, the solid/liquid line has a positive slope.
Water is unusual. Ice can be melted by increased P !
4.58
Solid Liquid Gas
Pre
ssu
re (
mm
Hg
)
Temperature (°C)0 0.01 100
760
triple point
normal fp normal bp
6
© 2008 Brooks/Cole 31
Physical Comparison with Importance in
Property Other Substances and Biological Environment
Specific heat capacity Highest of all liquids and Moderates T in the environment and in
(4.18 J g-1 °C-1) solids except NH3 organisms; climate affected by
movement of water (e.g., Gulf Stream)
Heat of fusion Highest of all molecular Freezing water releases large quantity
(333 J/g) solids except NH3 of thermal E; used to save crops from
freezing by spraying them with liq. water
Heat of vaporization Highest of all molecular Condensation of water vapor in clouds
(2250 J/g) substances releases large quantities of thermal E
fueling storms
Surface tension Highest of all molecular Contributes to capillary action in plants
(7.3 x 10⁻² J/m2) liquids causes formation of spherical droplets;
supports insects on water surfaces
Thermal conductivity Highest of all molecular Aids heat transfer in organisms;
(0.6 J s-1 m-1 °C-1) liquids rapidly cools organisms immersed in
cold water, causing hypothermia
Table 11.4 Unusual Properties of Water
Water: A Liquid with Unusual Properties
© 2008 Brooks/Cole 32
Most liquids: Lower T = higher density.
Most materials: dsolid > dliquid
Not water! In winter:
• Surface water cools & sinks until T=4°C.
• Water (T < 4°C) floats on the 4°C layer.
• The top layer cools to 0°C.
• Water freezes “top-down”.
• Ice floats on water, insulating the water below it.
These facts allow aquatic life to survive at low T.
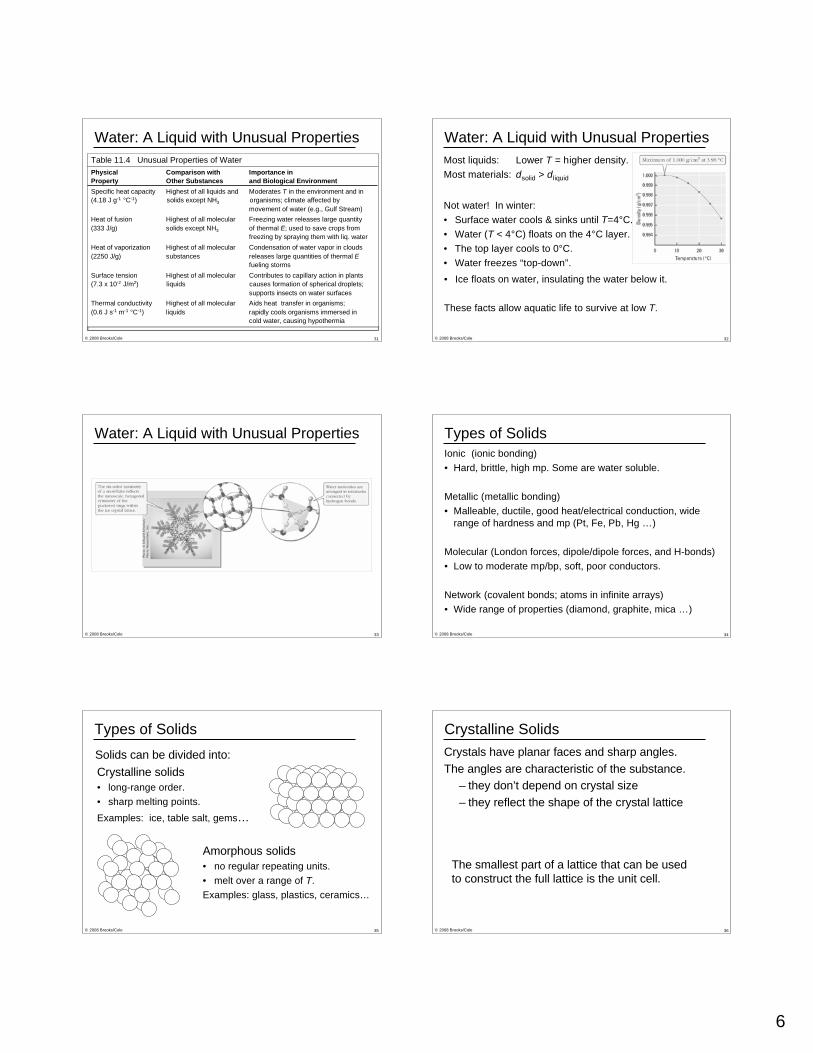
Water: A Liquid with Unusual Properties
© 2008 Brooks/Cole 33
Water: A Liquid with Unusual Properties
© 2008 Brooks/Cole 34
Types of Solids
Ionic (ionic bonding)
• Hard, brittle, high mp. Some are water soluble.
Metallic (metallic bonding)
• Malleable, ductile, good heat/electrical conduction, wide
range of hardness and mp (Pt, Fe, Pb, Hg …)
Molecular (London forces, dipole/dipole forces, and H-bonds)
• Low to moderate mp/bp, soft, poor conductors.
Network (covalent bonds; atoms in infinite arrays)
• Wide range of properties (diamond, graphite, mica …)
© 2008 Brooks/Cole 35
Types of Solids
Solids can be divided into:
Amorphous solids
• no regular repeating units.
• melt over a range of T.
Examples: glass, plastics, ceramics…
Crystalline solids
• long-range order.
• sharp melting points.
Examples: ice, table salt, gems…
© 2008 Brooks/Cole 36
Crystalline Solids
Crystals have planar faces and sharp angles.
The angles are characteristic of the substance.
– they don’t depend on crystal size
– they reflect the shape of the crystal lattice
The smallest part of a lattice that can be used
to construct the full lattice is the unit cell.
7
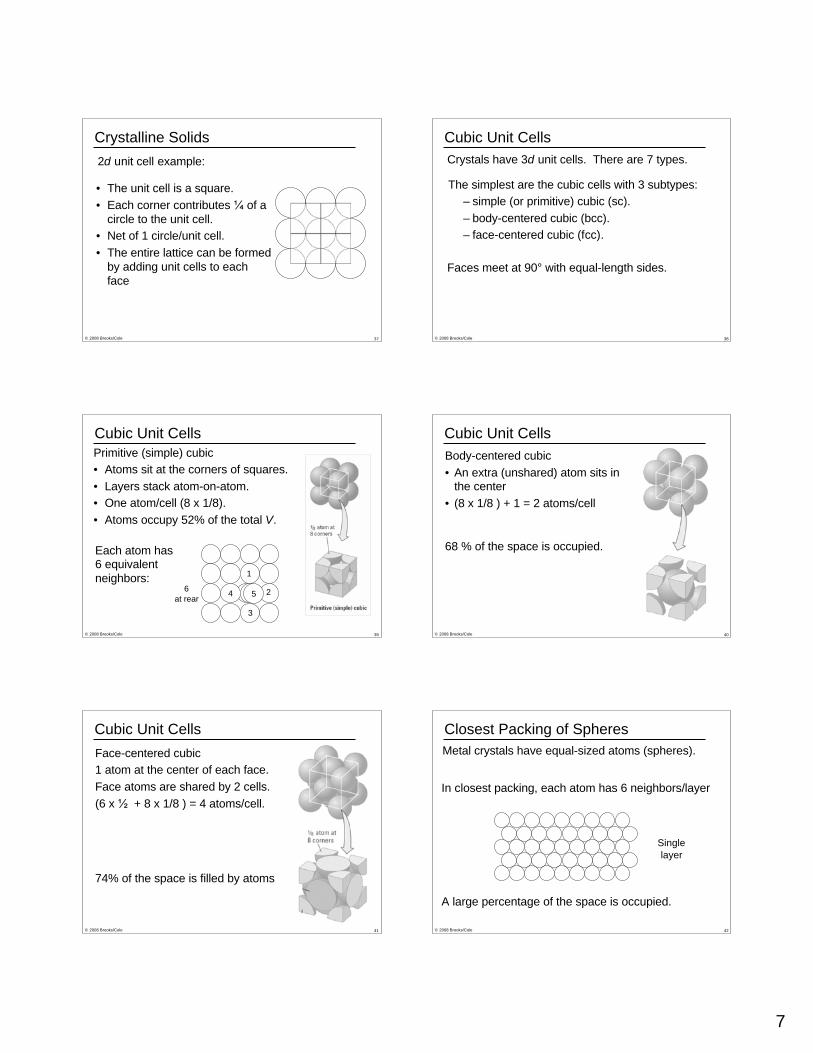
© 2008 Brooks/Cole 37
Crystalline Solids
2d unit cell example:
• The unit cell is a square.
• Each corner contributes of a
circle to the unit cell.
• Net of 1 circle/unit cell.
• The entire lattice can be formed
by adding unit cells to each
face
© 2008 Brooks/Cole 38
Cubic Unit Cells
Crystals have 3d unit cells. There are 7 types.
The simplest are the cubic cells with 3 subtypes:
– simple (or primitive) cubic (sc).
– body-centered cubic (bcc).
– face-centered cubic (fcc).
Faces meet at 90° with equal-length sides.
© 2008 Brooks/Cole 39
Cubic Unit Cells
Primitive (simple) cubic
• Atoms sit at the corners of squares.
• Layers stack atom-on-atom.
• One atom/cell (8 x 1/8).
• Atoms occupy 52% of the total V.
1
3
24 56
at rear
Each atom has6 equivalent
neighbors:
© 2008 Brooks/Cole 40
Cubic Unit Cells
Body-centered cubic
• An extra (unshared) atom sits inthe center
• (8 x 1/8 ) + 1 = 2 atoms/cell
68 % of the space is occupied.
© 2008 Brooks/Cole 41
Cubic Unit Cells
Face-centered cubic
1 atom at the center of each face.
Face atoms are shared by 2 cells.
(6 x + 8 x 1/8 ) = 4 atoms/cell.
74% of the space is filled by atoms
© 2008 Brooks/Cole 42
Closest Packing of Spheres
Metal crystals have equal-sized atoms (spheres).
Single
layer
In closest packing, each atom has 6 neighbors/layer
A large percentage of the space is occupied.
8
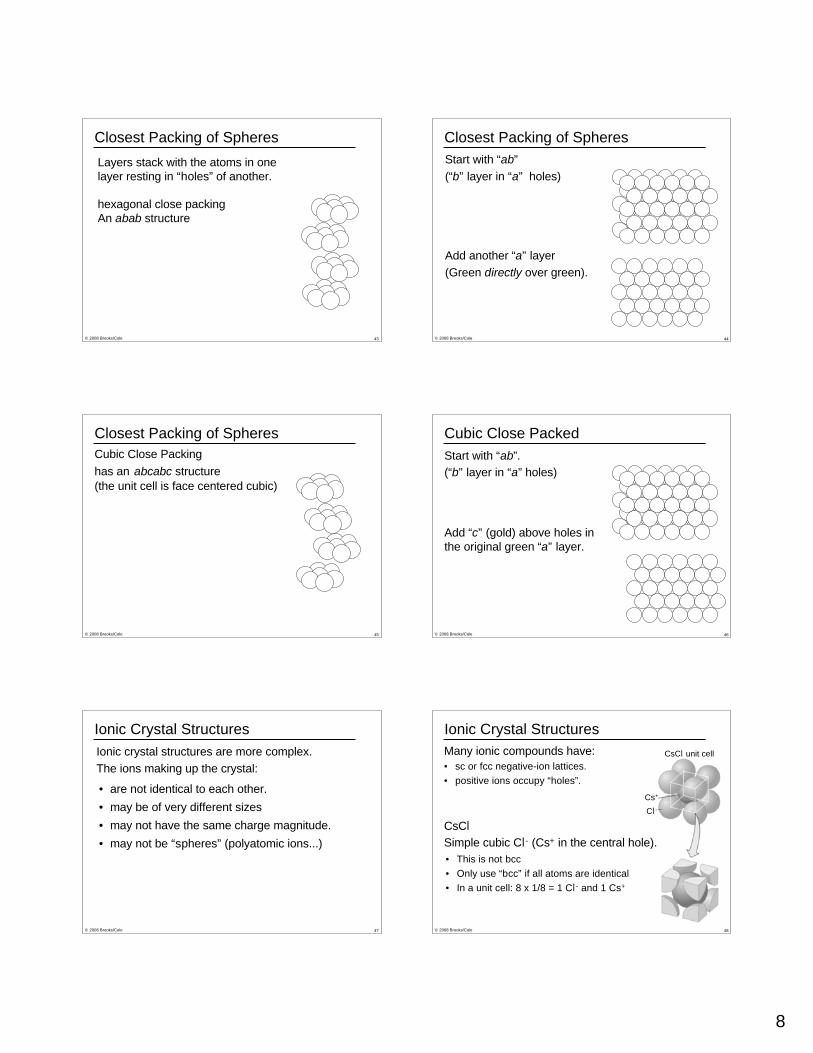
© 2008 Brooks/Cole 43
Closest Packing of Spheres
Layers stack with the atoms in one
layer resting in “holes” of another.
hexagonal close packing
An abab structure
© 2008 Brooks/Cole 44
Closest Packing of Spheres
Start with “ab”
(“b” layer in “a” holes)
Add another “a” layer
(Green directly over green).
© 2008 Brooks/Cole 45
Cubic Close Packing
has an abcabc structure
(the unit cell is face centered cubic)
Closest Packing of Spheres
© 2008 Brooks/Cole 46
Cubic Close Packed
Start with “ab”.
(“b” layer in “a” holes)
Add “c” (gold) above holes in
the original green “a” layer.
© 2008 Brooks/Cole 47
Ionic Crystal Structures
Ionic crystal structures are more complex.
The ions making up the crystal:
• are not identical to each other.
• may be of very different sizes
• may not have the same charge magnitude.
• may not be “spheres” (polyatomic ions...)
© 2008 Brooks/Cole 48
Ionic Crystal Structures
Many ionic compounds have:
• sc or fcc negative-ion lattices.
• positive ions occupy “holes”.
CsCl unit cell
Cs+
Cl-
CsCl
Simple cubic Cl- (Cs+ in the central hole).
• This is not bcc
• Only use “bcc” if all atoms are identical
• In a unit cell: 8 x 1/8 = 1 Cl- and 1 Cs+
9
© 2008 Brooks/Cole 49
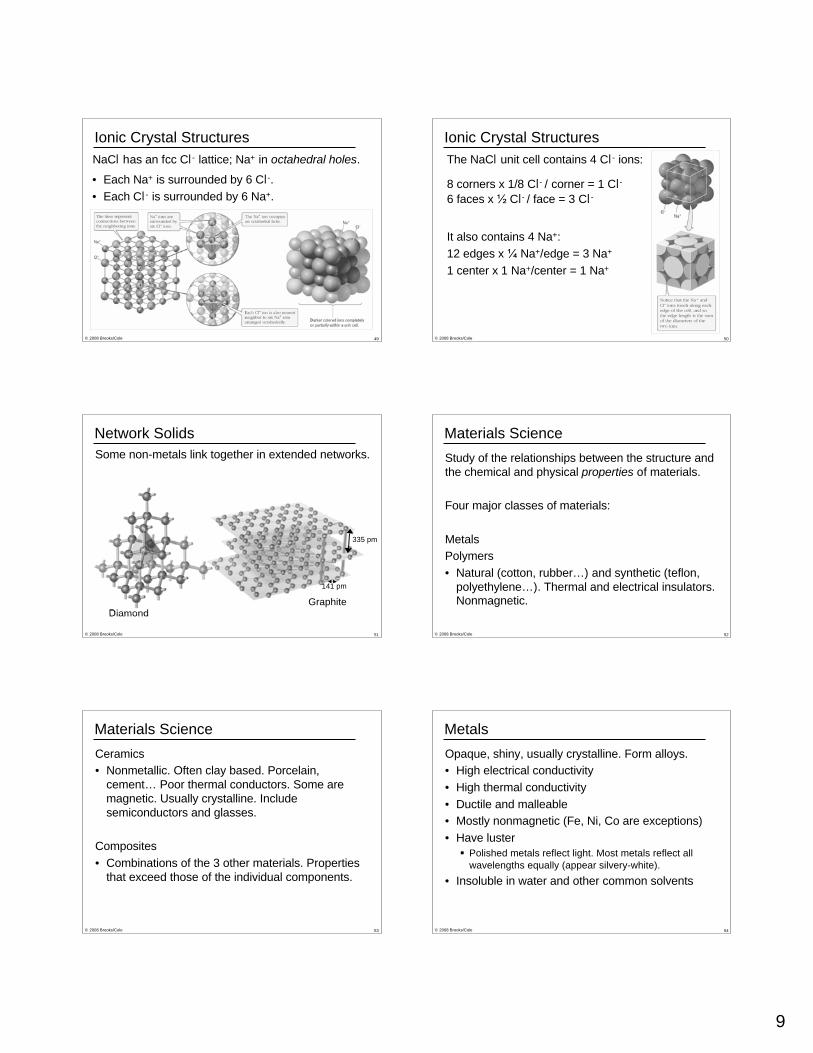
Ionic Crystal Structures
NaCl has an fcc Cl- lattice; Na+ in octahedral holes.
• Each Na+ is surrounded by 6 Cl-.
• Each Cl- is surrounded by 6 Na+.
© 2008 Brooks/Cole 50
It also contains 4 Na+:
12 edges x Na+/edge = 3 Na+
1 center x 1 Na+/center = 1 Na+
The NaCl unit cell contains 4 Cl- ions:
Ionic Crystal Structures
8 corners x 1/8 Cl- / corner = 1 Cl-
6 faces x Cl- / face = 3 Cl-
© 2008 Brooks/Cole 51
Network Solids
Some non-metals link together in extended networks.
DiamondGraphite
335 pm
141 pm
© 2008 Brooks/Cole 52
Materials Science
Study of the relationships between the structure and
the chemical and physical properties of materials.
Four major classes of materials:
Metals
Polymers
• Natural (cotton, rubber…) and synthetic (teflon,
polyethylene…). Thermal and electrical insulators.Nonmagnetic.
© 2008 Brooks/Cole 53
Materials Science
Ceramics
• Nonmetallic. Often clay based. Porcelain,
cement… Poor thermal conductors. Some are
magnetic. Usually crystalline. Include
semiconductors and glasses.
Composites
• Combinations of the 3 other materials. Properties
that exceed those of the individual components.
© 2008 Brooks/Cole 54
Metals
Opaque, shiny, usually crystalline. Form alloys.
• High electrical conductivity
• High thermal conductivity
• Ductile and malleable
• Mostly nonmagnetic (Fe, Ni, Co are exceptions)
• Have luster
Polished metals reflect light. Most metals reflect all
wavelengths equally (appear silvery-white).
• Insoluble in water and other common solvents
10
© 2008 Brooks/Cole 55
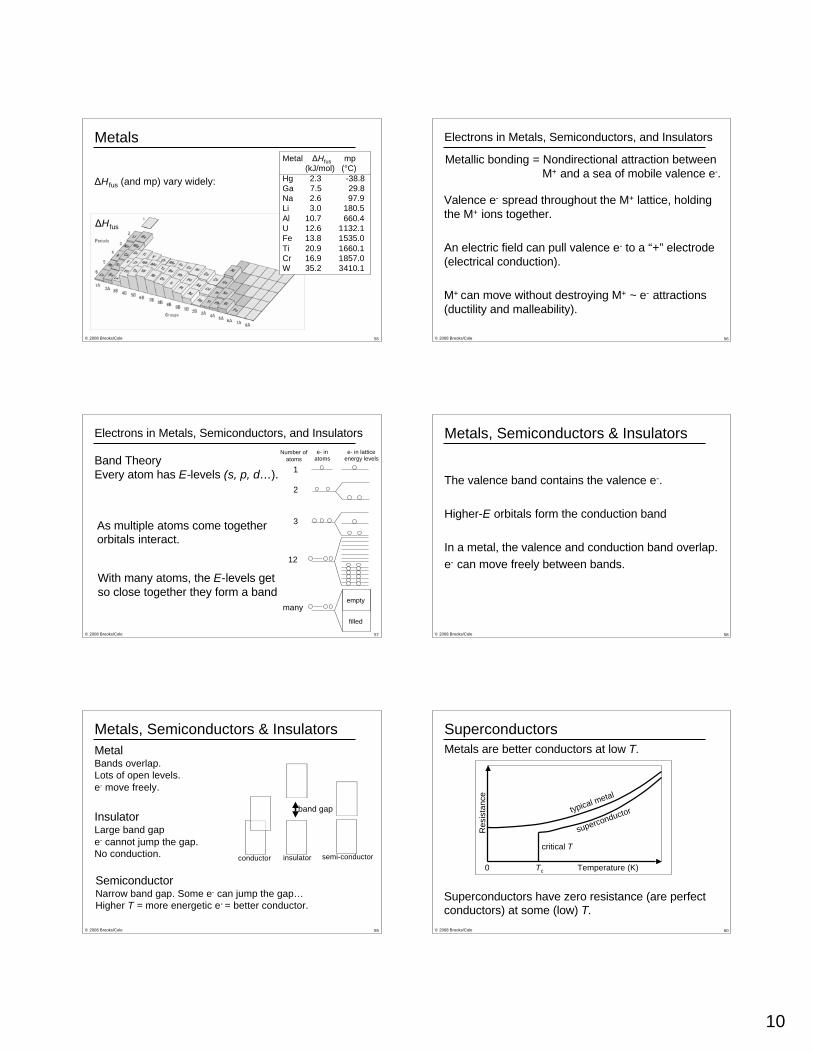
Metals
Metal Hfus mp
(kJ/mol) (°C)
Hg 2.3 -38.8
Ga 7.5 29.8
Na 2.6 97.9
Li 3.0 180.5
Al 10.7 660.4
U 12.6 1132.1
Fe 13.8 1535.0
Ti 20.9 1660.1
Cr 16.9 1857.0
W 35.2 3410.1
Hfus (and mp) vary widely:
Hfus
© 2008 Brooks/Cole 56
Metallic bonding = Nondirectional attraction between
M+ and a sea of mobile valence e-.
Electrons in Metals, Semiconductors, and Insulators
Valence e- spread throughout the M+ lattice, holding
the M+ ions together.
An electric field can pull valence e- to a “+” electrode
(electrical conduction).
M+ can move without destroying M+ ~ e- attractions
(ductility and malleability).
© 2008 Brooks/Cole 57
Band Theory
Every atom has E-levels (s, p, d…).1
Number of
atoms
e- inatoms
e- in latticeenergy levels
With many atoms, the E-levels get
so close together they form a band
3
2
12
As multiple atoms come togetherorbitals interact.
many
filled
empty
Electrons in Metals, Semiconductors, and Insulators
© 2008 Brooks/Cole 58
The valence band contains the valence e-.
Higher-E orbitals form the conduction band
In a metal, the valence and conduction band overlap.
e- can move freely between bands.
Metals, Semiconductors & Insulators
© 2008 Brooks/Cole 59
band gap
insulator semi-conductorconductor
MetalBands overlap.
Lots of open levels.
e- move freely.
InsulatorLarge band gap
e- cannot jump the gap.
No conduction.
SemiconductorNarrow band gap. Some e- can jump the gap…
Higher T = more energetic e- = better conductor.
Metals, Semiconductors & Insulators
© 2008 Brooks/Cole 60
Metals are better conductors at low T.
typical metal
Re
sis
tan
ce
Temperature (K)
superconductor
Tc
critical T
Superconductors have zero resistance (are perfectconductors) at some (low) T.
0
Superconductors
11
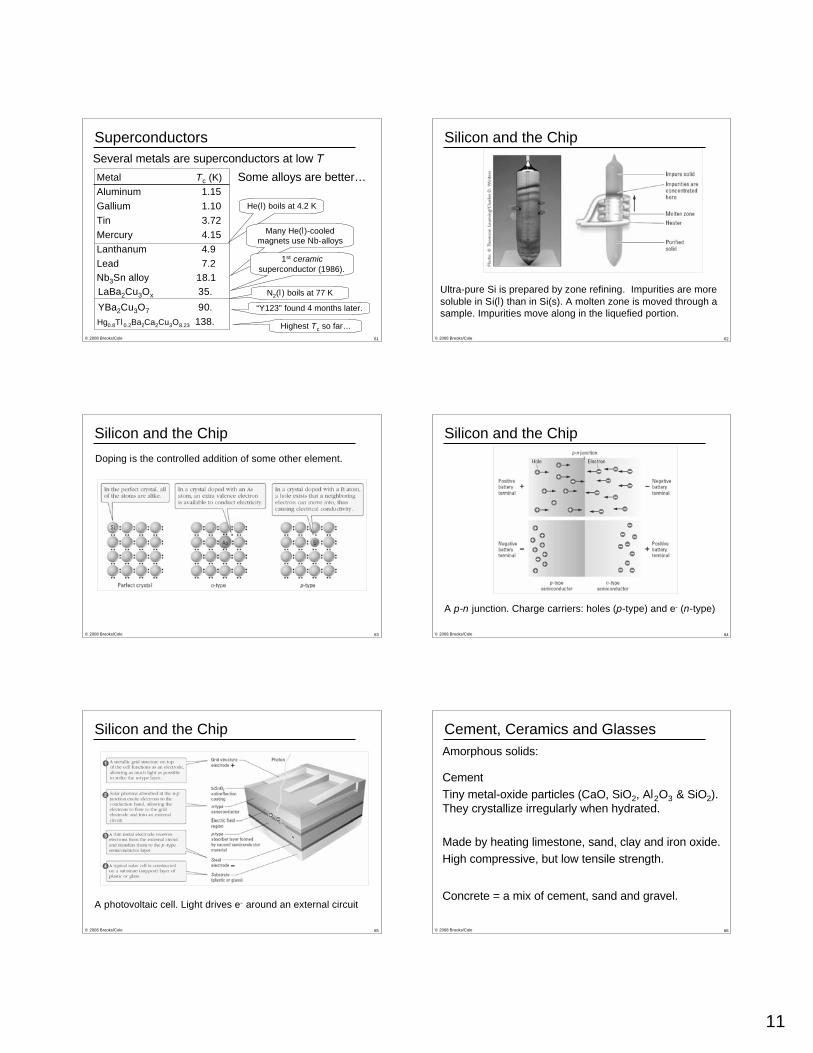
© 2008 Brooks/Cole 61
Metal Tc (K)
Aluminum 1.15
Gallium 1.10
Tin 3.72
Mercury 4.15
Lanthanum 4.9
Lead 7.2
Several metals are superconductors at low T
Nb3Sn alloy 18.1
YBa2Cu3O7 90.
LaBa2Cu3Ox 35.
He(l) boils at 4.2 K
Many He(l)-cooled
magnets use Nb-alloys
1st ceramic
superconductor (1986).
N2(l) boils at 77 K
“Y123” found 4 months later.
Highest Tc so far…Hg0.8Tl0.2Ba2Ca2Cu3O8.23 138.
Some alloys are better…
Superconductors
© 2008 Brooks/Cole 62
Silicon and the Chip
Ultra-pure Si is prepared by zone refining. Impurities are more
soluble in Si(l) than in Si(s). A molten zone is moved through a
sample. Impurities move along in the liquefied portion.
© 2008 Brooks/Cole 63
Silicon and the Chip
Doping is the controlled addition of some other element.
© 2008 Brooks/Cole 64
Silicon and the Chip
A p-n junction. Charge carriers: holes (p-type) and e- (n-type)
© 2008 Brooks/Cole 65
Silicon and the Chip
A photovoltaic cell. Light drives e- around an external circuit
© 2008 Brooks/Cole 66
Cement, Ceramics and Glasses
Amorphous solids:
Concrete = a mix of cement, sand and gravel.
Cement
Tiny metal-oxide particles (CaO, SiO2, Al2O3 & SiO2).
They crystallize irregularly when hydrated.
Made by heating limestone, sand, clay and iron oxide.
High compressive, but low tensile strength.
12
© 2008 Brooks/Cole 67
Cement, Ceramics and Glasses
Ceramics – made from clay or other natural earths.
Permanently hardened by heat.
Silicate ceramics – from clays. China clay (kaolin) is
white and used for table china. Red clay contains Fe.
Oxide ceramics – from metal oxides at high P and T.
Used in high-T applications. Excellent insulators. Canhave good mechanical strength.
Nonoxide ceramics – include Si3N2, SiC, and BN.
High P, T preparation. Hard, strong, but brittle.
© 2008 Brooks/Cole 68
Cement, Ceramics and Glasses
Glasses – optically transparent amorphous solids.
Simplest: vitreous silica = SiO2 in a 3d-lattice.
No long range order. (mp = 1800°C)
Soda lime glass, a SiO2, Na2O, CaO and MgO mix.
More inert and easier to make (mp ~800°C).
It can be colored (blue = add CoO, violet = MnO2…)