Embed Size (px)
Citation preview

Bachelor Thesis, 15hp
The link between consumer
perception and satisfaction - A comparative study of shopping malls and
city centres
Authors: Isabelle Lundmark Strategic Marketing Programme
Joanna Mainaud Strategic Marketing Programme
Katarina Sjögren Strategic Marketing Programme
Tutor: Soniya Billore, PhD Institution Marketing
Examiner: Setayesh Sattari, PhD Institution Marketing
Date: 2014-05-30
Coursecode: 2FE10E
Subject: Business Administration
Level: First Level/Bachelor Thesis
Spring Semester 2014

Abstract
Title: The link between consumer perception and satisfaction
Authors: Isabelle Lundmark, Joanna Mainaud and Katarina Sjögren
Tutor: PhD. Soniya Billore
Examiner: PhD. Setayesh Sattari
Level/Course: First Level/Bachelor Thesis 15hp in Business Administration,
(2FE10E) Strategic Marketing Programme, Linnaeus University Växjö,
Spring Semester 2014.
Background: It is a known phenomenon that when external shopping malls arise next
to cities the business of the city centres can be affected. This situation occurs since
many years and in various places in the world, even Sweden.
Purpose: The purpose of this research is to examine what factors are important to the
consumers when they are shopping in general, and then to evaluate how these factors
influence consumer satisfaction with regard to shopping malls and city centres.
Methodology: The research is based on a cross-sectional design with a quantitative
strategy. The data collection is conducted through an internet based questionnaire with a
snowball sampling approach.
Conclusion: The results are that, for consumers, store variety, atmosphere and service
quality are quite important aspects when shopping. They also shows that store variety
influences consumer satisfaction in both the shopping mall and the city centre. Finally,
convenience influences satisfaction in the city centre and the social aspect influences
customer satisfaction in shopping malls.
Keyword: Perception, Consumer/Customer satisfaction, Choice and Store variety,
Convenience, Facilities, Social, Service Quality, Atmosphere.

ii
Acknowledgements
In this preface, we would like to thank the persons who enabled this bachelor
thesis on the perception and satisfaction of shopping venues.
First and foremost we would like to extend many thanks to our tutor PhD.
Soniya Billore and examiner PhD. Setayesh Sattari at Linnaeus University in
Växjö. Thank you for your constructive feedback and encouragement
throughout the writing process of the thesis. We would also like to thank Dr.
Rana Mostaghel, who showed interest in our work and gave
recommendations regarding the analysis of the quantitative data.
We also want to thank the President of the Regional Executive, Head of
Business and Regional Development, the Business and Regional
Development and the City Planning Director of three municipalities, which
the research is based on. Thank you for the fruitful information regarding
your respective cities, which helped us to get a better, and concrete
understanding of the subject area.
Växjö 30
th of May 2014
Joanna Mainaud Isabelle Lundmark Katarina Sjögren
___________ _____________ ___________

I
Table of Contents
1 Introduction _________________________________________________________ 1
1.1 Background _____________________________________________________ 1
1.1.1 The situation in Sweden _________________________________________ 2
1.2 Problem discussion _______________________________________________ 3
1.3 Purpose ________________________________________________________ 5
1.4 Research questions _______________________________________________ 5
1.5 Delimitations ____________________________________________________ 5
1.6 Outline of the investigation ________________________________________ 6
2 Literature Review ____________________________________________________ 7
2.1 Perception ______________________________________________________ 7
2.2 Consumer satisfaction ____________________________________________ 8
2.3 Factors influencing consumer behaviour _____________________________ 9
2.3.1 Choice and store variety ________________________________________ 9
2.3.2 Convenience__________________________________________________ 9
2.3.3 Facilities ___________________________________________________ 10
2.3.4 Social ______________________________________________________ 10
2.3.5 Service Quality ______________________________________________ 11
2.3.6 Atmosphere _________________________________________________ 11
2.4 Summary of the chapter _________________________________________ 12
3 Research gap, Hypotheses and Research model ___________________________ 13
3.1 Research gap ___________________________________________________ 13
3.2 Hypotheses _____________________________________________________ 13
3.3 Research Model ________________________________________________ 15
4 Methodology ________________________________________________________ 16
4.1 Research approach ______________________________________________ 16
4.1.1 Inductive and deductive approach ________________________________ 17
4.1.2 Quantitative vs. Qualitative strategy ______________________________ 17
4.2 Research design ________________________________________________ 18
4.3 Data collection method ___________________________________________ 20
4.3.1 Secondary data ______________________________________________ 20
4.3.2 Primary data ________________________________________________ 21
4.4 Data collection instrument ________________________________________ 22
4.4.1 Documents __________________________________________________ 22
4.4.2 Interview ___________________________________________________ 22
4.4.3 Questionnaire _______________________________________________ 24
4.4.4 Questionnaire design __________________________________________ 25
4.4.5 Scaling _____________________________________________________ 26
4.4.6 Pilot survey and testing of questions ______________________________ 27

II
4.5 Operationalization ______________________________________________ 28
4.6 Sampling ______________________________________________________ 30
4.6.1 Sample size _________________________________________________ 30
4.7 Data analysis ___________________________________________________ 31
4.7.1 Descriptive statistics __________________________________________ 31
4.7.2 Testing the hypotheses _________________________________________ 31
4.8 Reliability and Validity __________________________________________ 32
4.8.1 Reliability __________________________________________________ 32
4.8.2 Validity ____________________________________________________ 33
4.9 Source criticism_________________________________________________ 34
4.10 Summary of the chapter ________________________________________ 36
5 Survey Results ______________________________________________________ 37
5.1 Interview - municipalities ________________________________________ 37
5.2 Questionnaire survey ____________________________________________ 39
5.2.1 Descriptive statistics __________________________________________ 39
5.3 Hypotheses testing and result _____________________________________ 43
5.4 Comparison ____________________________________________________ 47
5.5 Summary of tested hypotheses ____________________________________ 48
6 Analysis ____________________________________________________________ 50
7 Discussion __________________________________________________________ 55
7.1 Conclusion _____________________________________________________ 55
7.2 Theoretical and managerial implications ____________________________ 56
7.3 Limitations ____________________________________________________ 57
7.4 Suggestions for future research ____________________________________ 57
8 References list ______________________________________________________ 58
9 Appendix __________________________________________________________ 64
Appendix 1. Questionnaire - English version ____________________________ 64
Appendix 2. Questionnaire - Swedish version ___________________________ 67
Appendix 3. Hypotheses testing and result – SPSS _______________________ 70
Appendix 4. Descriptive statistics – SPSS ______________________________ 72
Appendix 5. Pearson Correlation – SPSS _______________________________ 74
Appendix 6. Paired sample t-test______________________________________ 75
Appendix 7. Overview of the items constituting the variables and their SPSS
Means ____________________________________________________________ 77
Appendix 8. Interview ______________________________________________ 79

1
1 Introduction
The following chapter will present the research area and provide a discussion about the topic,
which this study is based on. This will lead to the purpose of the research and specific
research questions. This chapter will provide the reader with an understanding of the
research. The chosen problem will imbue the entire thesis. Finally, the research delimitations
for this investigation will be presented.
1.1 Background
“The development of regional shopping centres and their incorporation into a suburban area
necessarily involves change and adaptation in older, established downtown shopping districts”
(Pratt and Pratt, 1960, p.45).
According to Underhill (2004) people have been organising their lives around shopping as a
feature through decades. The author explains that there have always been places in society
where people have gathered in order to exchange products. However, shopping is, as Dennis
et al. (2005) states, not just about obtaining the things we need, shopping is also something
that people enjoy doing and we like to have a wide variety of shopping outlets and
merchandise to choose from. Dennis et al. presume that the customer’s desire of a wide range
of shops is one of the reasons explaining the progression of shopping malls. It has been a
known and studied phenomenon throughout the years that the establishment of external
shopping malls has a negative impact on the business of city centres (Underhill, 2004).
To make it clear this research will be talking about shopping venues; namely city centres and
external shopping malls, the latter will be referred to as shopping malls in order to facilitate
the reading. These two terms will be used to represent the following concepts throughout the
whole thesis. City centre is described as the high street shopping area of a city centre (Hackett
and Foxall, 1993), and a shopping mall is define as “A set of stores that offer goods and
services to consumers and that are located and operated in close proximity to each other”
(Teller, 2008 as cited in Teller and Schnedlitz, 2012, p. 1043). Due to the establishment of
suburban shopping malls in the USA, the frequency and the quantity of shopping in
established venues of cities were affected (Pratt and Pratt, 1960; Underhill, 2004). The same
problem has been recognized in several European countries, for example Turkey (Ozuduru et
al., 2014), the Netherlands (Gorter et al., 2003), and England (Svensson, 2010). Guy (1998)

2
emphasizes that this development of external shopping malls has favoured those who have
access to a car and people who are looking for new experiences in shopping. He explains that
distant or new malls serve as excursion targets and are part of the modern experience of
seeking satisfaction through shopping. These external shopping malls offer conveniences such
as big parking spaces, attractiveness, atmosphere and a big variety of shopping (Ozuduru et.
al., 2014).
Hart et al. (2013) explain the differences between the external shopping mall and the city
centre when it comes to offering a total customer experience. The authors point out that the
city centre experience is often fragmented over a much bigger area than the shopping mall,
which makes it harder to manage and control. As a distinction, according to a piece of
research, published and conducted in 2011 by the Swedish retail statistics agency HUI
Research, it is observed that the new built shopping malls are often lavish projects with
advanced architecture, modern and exclusive material and design to give the visitors an
attractive shopping experience. The phenomenon, that occurs when shopping malls enter into
competition with the city centre, is a present-day one and can be related to the recent
economic climate (Grewal et al., 2009). As the authors mention, since year 2009, tens of
thousands of stores had to close in the United States because of the competitive retail
environment. When it comes to Europe, the retailing sector shows a strong trend of building
shopping malls (Lehtonen and Mäenpää, 1997, cited in Solomon et al., 2010). The shopping
malls in Europe are often inspired by American ones that combine the possibilities to shop
and socialise in a safe environment (Lehtonen and Mäenpää, 1997 cited in Solomon et al.,
2010).
1.1.1 The situation in Sweden
Bringing the focus to Sweden, a market analysis conducted in 2013 by JLL, an international
real estate company, show that it is the country in western Europe after Luxembourg, Ireland
and the Netherlands, with the highest shopping mall area (450 sq m) per 1000 inhabitants and
that one third of non-daily goods in Sweden are purchased in such venues (JLL, 2013).
According to an article published in 2013 in Dagens Nyheter, a Swedish independent liberal
daily newspaper, the shopping malls has become a new meeting place for people to socialize
and are today recognised as the new living room. On the other hand, several city centres in
Sweden are old and worn with an unattractive environment, which are factors that in many
cases affect the shopping in the city centres negatively (JLL, 2013). There have been

3
nomerous articles regarding this particular issue, published by various Swedish media outlets,
that have discussed and argued that the establishment of external shopping malls has in some
cases led to the depletion of the city centres in Sweden (Svensson, 2010; Norrköpings
Tidningar, 2011; Olsson et al., 2012; Bohusläningen, 2013 ; Jensen, 2012). They mention that
the phenomenon is dramatically referred as “the centre death" and has been widely debated in
the media in the recent years. The articles show that Uddevalla, Trollhättan and Säffle are
examples of Swedish cities in which downtown commerce suffered greatly as a result of the
shopping intensity moving to nearby shopping malls.
1.2 Problem discussion
As Solomon et al. (2010) state, today we live in a consumer society where we are surrounded
by advertisements, brands, and shops that try to catch our attention and money. The authors
also state that our social lives are mainly determined by our roles as consumers. They further
explain that consumer behaviour is “… the processes involved when individuals or groups
select, purchase, use or dispose of products, services, ideas or experience to satisfy needs and
desires.” (Solomon et al., 2010, p.6).
The fact is that researchers have looked into understanding customer buying behaviour from
different perspectives (Kotler et al., 2009). Solomon et al. (2010) emphasise that these
perspectives of evaluating consumer behaviour are perception, beliefs and attitudes, which are
known as the psychological factors that affect the buying behaviour. The concept of
perception can be defined as “the process by which an individual is exposed to, attends to,
selects, organises, and interprets stimuli” (Morschett et al., 2005, p.426). How the consumer
actually behaves in a situation is depending on the consumer’s perception of a situation in
which he finds himself (Kotler et al., 2009). Through the act of shopping, the customer is
involved as an active participant who looks for quality (Solomon et al., 2010). Although the
consumers’ perception of quality performance is not only related to the quality of goods and
services offered (Morschett et al., 2005). The retailers must be aware that consumers’
evaluation of quality is also highly influenced by their perception of the atmosphere,
orderliness and service (Morschett et al., 2005). It is assumed that if the consumer’s
experience matches his expectations well, then the level of satisfaction is high (Anselmsson,
2006). In other words, customer satisfaction is “the extent to which a product's perceived
performance matches a buyer´s expectations” (Kotler et al, 2009, p.599). This definition of

4
product satisfaction can be applied for shopping venues in general, where the consumer can
find “a set of stores that offer goods and services” (Teller, 2008 cited in Teller and Schnedlitz,
2012, p. 1043).
It is usually assumed that the decision concerning the choice of where to go shopping depends
essentially on the distance to these shopping places, but in some cases, satisfaction is also
very important (Léo and Philippe, 2002). For example, a positive and satisfactory
environment can make the customer choose to spend more time at a specific place and also
increase the social interaction with other human beings (Velitchka and Barton, 2006).
Previous researchers have defined several factors that influence the choice of a shopping
venue, like store variety and atmosphere (Anselmsson, 2006; Leo and Philippe, 2002),
convenience, facilities, service quality and even the social aspect of the place (Hackett and
Foxall, 1993). Anselmsson (2006) adds that the atmosphere of a place can actually affect
customer satisfaction. Customer satisfaction is, as Helgesen (2006) explains, the cornerstone
of the concept of marketing since it is highly related to customer loyalty as well as customer
profitability.
As previously discussed in the background, it is usually the case that external shopping malls
have a negative and harmful effect on the city centres in terms of business for retailers. Under
the circumstances, the efforts of optimizing the attractiveness of the city centres as retail
destinations through urban revitalisations have become increasingly important (De Nisco et
al., 2008). The authors also mention that “public and private stakeholders should be aware not
just that the physical environment is important in the customer’s experience, but also of what
specific elements of the physical setting are most significant.” (De Nisco and Warnaby, 2013,
p.66).
In order to actually find out what the situation looks like in Swedish cities, for the purpose of
the current research, key representatives of three municipalities in Sweden were interviewed.
They all state that they perceive the relationship, in their respective municipality, between the
external shopping mall and the city centre as being complementary (e-mail interview, 2014-
03-06; 2014-05-05, phone interview, 2014-05-06; 2014-05-07). Though, one of the
respondents stated that the external establishments have contributed to a decreased customer
flow in one of the city centres and that “... the municipality has a special responsibility for an
attractive city.” (e-mail interview, 2014-03-06).

5
Based on the previous discussions, it is relevant in this research to understand what factors are
actually important for the consumers when they go shopping, and how these factors influence
customer satisfaction when they relate to different shopping venues; namely external
shopping malls and city centres. This comparison could help explain if the customers in
Sweden prefer to shop at the external shopping malls or if they prefer the city centres. The
results of the current research would provide implications on how the performance of both
shopping venues could be improved, and how customer satisfaction could be managed.
1.3 Purpose
The purpose of this research is to examine what factors are important to the consumers when
they are shopping in general, and then to evaluate how these factors influence customer
satisfaction with regard to shopping malls and city centres.
1.4 Research questions
RQ1: Which factors are the most important for customers when they are shopping?
RQ2: How does the perceived performance of an external shopping mall influences customer
satisfaction?
RQ3: How does the perceived performance of a city centre influences customer satisfaction?
1.5 Delimitations
The investigation has been limited to examining three Swedish municipalities located in the
south of Sweden. The number of municipalities is based on the fact it is would be difficult for
this study to include all venues in Sweden. The municipalities have been chosen due to their
similarities in terms of population size and the fact that they all have an external shopping
mall with a similar quantity of stores. The selected municipalities will be anonymous in the
study since the purpose is not to examine each of the three municipalities, but to generate a
general understanding of the different shopping venues.

6
1.6 Outline of the investigation
Chapter 1: This chapter presents the background of the research and a discussion of the
identified problem. The chapter also consists of the research purpose, questions and the
delimitations of the investigation.
Chapter 2: This chapter consists of the chosen theories, which together form this research’s
frame of reference that will limit the following analysis.
Chapter 3: In this section the research gap will be presented regarding the importance of the
current investigation in terms of academic contribution and managerial implications. The
chapter also identifies the research model and the variables which are followed by a
presentation of the hypotheses.
Chapter 4: This chapter provides a presentation of the methodology of the research as well as
an argumentation of the authors’ choices.
Chapter 5: This section is covering the research results of the conducted survey.
Chapter 6: In this chapter the analysis will be presented, were the result of the survey will be
linked with research by previous scientists.
Chapter 7: In this section the conclusion of the findings is presented. The chapter also
consists of this thesis limitation, theoretical and manager implication and finally suggestion
for further research.

7
2 Literature Review
The following chapter outlines the research frame of reference, which consists of perception
and customer satisfaction. Next to these concepts, the factors that influence consumer
behaviour and that can be source of customer satisfaction will be presented. The literature
review will give the reader an overall view of the area where the research is moving in and
attempting to answer, the reference frame will also limits the following analyses.
2.1 Perception
Perception is “The process by which people select, organise and interpret information to form
a meaningful picture of the world” (Kotler et al., 2009, p.602). In other words, it can be
described as how we create a context with the help of the sensory stimuli that we are exposed
to (Schiffman and Kanuk, 2004). The interpretation process is, according to Schiffman and
Kanuk (2004), highly personal since it is based on our unique expectations, needs and values.
The authors explain that when visiting a store, the customer is exposed to an enormous
amount of stimuli but they only perceive a small part of it. According to the authors, this has
to do with subconscious selection, a process in which the customer selects to perceive
stimulus depending on his expectations and motives at the moment, in combination with the
nature of the actual stimulus. They further explain that a person's awareness of stimuli is
strongly dependent on whether or not it is relevant to the person´s needs and interests. The
fact is that people tend to make their purchase by those companies, which deliver the highest
perceived value (Kotler et al., 2009). In other words, it is about “the customer´s evaluations of
the difference between all the benefits and all the costs of a market offering relative to those
of competing offers” (Kotler et al., 2009, p.16).
Mossberg (2003) bring out the argument that companies must offer the customer memorable
events which affect them in a personal way in order to influence their behaviour. Through this
experience, people can create their own perceptions and attitudes towards something
(Mossberg, 2003). Thang and Tan (2003), explains further that customers develop a
perception about a marketplace based on the attributes they are exposed to, and thereafter
form a reaction, i.e. whether they should avoid or approach the actual place. When it comes to
the customer´s perceived performance in link with satisfaction, Peluso (2011) explains that if
the customer’s perceived performance of a product or service meets or exceeds his or her own
expectations, it will lead to satisfaction. He also explains that a contrary perceived
performance will lead to dissatisfaction with the product or service.

8
2.2 Consumer satisfaction
Researchers broadly investigate the concept of satisfaction as a consumer behaviour, and
these various contributions have brought a lot of different definitions of the concept. One
definition of satisfaction is “ … the consumer’s response to the evaluation of the perceived
discrepancy between comparison standards and the perceived performance of the product”
(Yi, 1990 as cited in Jack and Powers, 2013). Satisfaction can be about the transaction created
between the customer and a company but can often entail a range of interactions that take
place with a variety of companies (Mossberg, 2003). As stated by Kotler et al. (2009),
customers have expectations on what the market can offer them. They explain that when
facing a broad range of products and services, their satisfaction is translated by the act of
buying and a positive word-of-mouth. Kotler et al. (2009) add that, on the contrary,
dissatisfaction would be translated by negative word-of-mouth and shifting towards
competition. This is the reason why marketers should not set expectations to low nor too high,
as satisfaction is the key to a good customer relationship (Kotler et al., 2009).
Bitner (1992) explains that if a place does not live up to the individual’s expectations, this
may lead to them not choosing to not visit the place. However, if expectations are satisfied or
even surpassed, this could have a positive impact on the visit (Bitner, 1992). The author
clarifies that expectations are influenced by previous experiences but also by what others have
told us about the place. According to Jones et al. (2006), word of mouth, customer satisfaction
as well as repatronage anticipation, which is the likelihood of revisiting a retail place, is
strongly related by the hedonic aspects of shopping. The hedonic value of shopping reflects,
not the product-related, but the emotional aspect of the shopping experience (Jones et al.,
2006). Bitner (1992) also states that our behaviour, cognitive, emotional and physiologic, can
be influenced by staying in a specific environment. Finally, Jones et al. (2006) add that the
feeling of accomplishment, by finding the information or product that the customer was
looking for, is a driver for customer’s utilitarian, task-oriented product shopping value and
could also function as a driver for the intention to visit the store again.
In terms of measurements, Léo and Philippe (2002) affirm that there are different ways of
measuring satisfaction, apart from direct questioning. The affective dimension can describe
the pleasure of using something, and the cognitive one can evaluate actions like the future
behaviour of the customer or the fact of recommending a place to others (Léo and Philippe,

9
2002). The authors also include the comparative dimension, which is that the consumer can
establish choices according to his judgment of other opportunities.
2.3 Factors influencing consumer behaviour
The factors choice and store variety, convenience, facilities, social and service quality are
based on the research by Hackett and Foxall (1993). Their findings are complemented by the
result of other studies from various scientists in order to explain the impact of each variable
on the behaviour of consumers in the context of shopping. The authors of this thesis added
the atmosphere factor as it is according to several researchers also considered as an important
dimension which can affect behaviour.
2.3.1 Choice and store variety
Consumer choice can be described as “the selection, consumption, and disposal of products
and service” (Bettman et al., 1998, p.187). The authors found out that choice can be affected
by different factors such as context, time pressure, number of choice, and even environment.
Previous studies have showed the tenant mix being one of the major determinants for visiting
a shopping venue (Leo and Philippe, 2002; Anselmsson, 2006; Teller, 2008), and for
customer satisfaction (Anselmsson, 2006). When talking about tenants mix, Brown (1992)
refers to the relative location of outlets within shopping areas. These have shown to be
important when it comes to attracting a customer, like for example the role of magnet stores
and secondary attractors (Brown, 1992).
2.3.2 Convenience
According to Kelley (1958) when shopping, consumers balance commodity costs and
convenience costs. The author defines commodity costs as “the monetary price paid the seller
to obtain possession of goods and services” (Kelley, 1958, p.32) and convenience costs as
“incurred through the expenditure of time, physical and nervous energy, and money required
to overcome the frictions of space and time, and to obtain possession of goods and services”
(Kelley, 1958, p.32). A research by Anselmsson (2006), conducted in Sweden, shows that
convenience has an impact on customer satisfaction through the availability of parking spaces
and the ability to easily locate themselves in the shopping mall. He states further that location,
in terms of the geographical distance between the shopping venue and the home, are found to
be a determinant of satisfaction. The study of Im and Ha (2011), recommends having a

10
convenient mall atmosphere, which can include adequate temperature and easy navigation, in
order to provide customer satisfaction.
2.3.3 Facilities
The physical surroundings in which consumers shop can have a strong impact on their
purchase decisions (Solomon et al., 2010). Myers et al. (2008) states that interesting design
and architecture, as well as easy access are important when it comes to the experience of
shopping venues, but offering the basics such as clean and safe shopping environments,
adequate toilets, good signage and places to sit, are of equal significance. Miller et al. (2005)
claims that the feeling of safety, like the presence of security staff, in some cases, is of great
importance for customers when shopping. The image of a shopping area, as studied by Wee
(1985), is significant in predicting and explaining shopping behaviour. In his research, he
focused on the relationship between shopping area image and patronage behaviour. Different
image components were studied by Wee, and the results showed that factors like “product and
service offering” were much less significant to the customer's patronage behaviour than
operational (like store hours for example) and facilitative factors (like washrooms or play
areas for children). Also transport facilities can have an impact, as Ozuduru et al. (2014)
found evidence that car owners more frequently visited shopping malls than they visited street
shops.
2.3.4 Social
Shopping is not just about acquiring products or services (Tauber, 1972; Babin et al., 1994).
Tauber (1972), describes a number of psychosocial needs which motivate shopping, such as
the possibilities of socialising. The social aspect of shopping refers to shopping with friends
or communicating with others (Tauber, 1972; Arnold and Reynolds, 2003; Davis and Hodges,
2012). Bäckström (2011) states that the social interaction is sometimes the principal activity
for shopping, and the products are just peripheral objects. In leisure shopping, outing is the
actual purpose and shopping is only one of the components in the experience (Schiller, 1999
cited in Howard, 2007). The mall is a social environment (Feinberg et al., 1989; Solomon et
al., 2010), and the social aspects of the mall may have an important part of its success to
attract and keep consumers (Feinberg et al., 1989). Matzler et al. (2005) explains that positive
as well as negative emotions have a crucial role in customer satisfaction.

11
2.3.5 Service Quality
Service quality, according to Bolton and Drew (1991) is defined as the contrast between the
expectation of the consumer and the actual performance of the service. According to May
(1991), aspects such as demand for quality, value and variety of goods influence a customer’s
choice of shopping venue. A customer´s perception of a store and patronage intention are also
positively influenced if the salespersons are friendly, helpful and perceived overall as
trustworthy (Clopton et al., 2001; Jayawardhena and Farrell, 2011). In fact, to offer customers
a helpful staff is a major influential factor which has a great impact on customer satisfaction
(Keh et al., 2013). A study by Terblanche and Boshoff (2001) states that internal store
environment, like cleanliness or also having attractive product displays and promotional
offers, is an important dimension when assessing customer satisfaction.
2.3.6 Atmosphere
The fact is that today, for companies, it is not enough to only offer the customer products or
services in order to create customer value and to differentiate themselves from the competitors
(Kotler et al., 2009). Kotler et al. (2009) highlight that it is no longer the physical product or
service that is the focus, but in fact, many companies now also offer an intangible experience
that is beyond the actual product or service. As Kotler et al. state, "They are buying what
those offers will do for them" (Kotler et al., 2009, p.231). A way of creating a customer
experience is through atmosphere, for example (Bitner, 1992). The term atmospherics can be
defined as “the conscious designing of space to create certain effects in buyers” (Kotler, 1973,
p.50). Kotler is the researcher who first defined atmospherics (Turley and Milliman, 2000;
Yalch and Spangenberg, 2000; De Nisco and Warnaby, 2013). He “was the first to use and
define the term /.../ as the intentional control and structuring of environmental cues,...”
(Turley and Milliman, 2000, p.193). Atmospherics are also defined as “the use of space and
physical features in store design to evoke certain effects in buyers” (Solomon et al., 2010,
p.643).
De Nisco and Warnaby (2013), state that an important part of the customers’ experience lies
within the perception of the physical environment of a shopping area. The physical design,
area layout and external appearance are, according to the authors, some of the factors on
which the customers base their evaluation of the service quality. The perceived service quality
impacts both the customers’ intention to stay longer and visit the area again (De Nisco and
Warnaby, 2013). Furthermore, Bitner (1992) states that the physical environment can be used

12
as a tool for positioning and to differentiate the organisation from its competitors. Also, the
usage of pleasant music and scents enhances the experience of shopping (Mattila and Wirtz,
2001). Finally, research shows that the atmosphere of a shopping mall is the influence factor
that has a high impact on customer satisfaction (Anselmsson, 2006; Teller, 2008).
The impact of music on consumer behaviour is well documented (Milliman, 1982; Yalch and
Spangenberg, 2000; Broekemier et al., 2008). Music influences the customers’ perception of
service quality (Sweeney and Wyber, 2002; Chebat and Michon, 2003). It may also increase
customers’ intention to shop or to visit the store again (Broekeimer et al. 2008). Concerning
design, according to the study of Baker et al. (2002), customer’s perception of design cues,
namely high image store design (colour, display, layout) have a strong influence on patronage
intentions and service quality. The authors also found out that the perceived merchandise
value in a store was affected by design cue perception. According to Mazursky and Jacoby
(1986) store interior design and layout influences the store image perception of customers.
Also the exterior structure of the shop, such as the window displays, has an influence on the
customer’s feelings and experience of the store’s identity (Giacoma-Claire, 2013) as well as
their decision to enter a store (Sen et al., 2002). When it comes to scent, according to Chebat
and Michon (2003), odour presence can influence the customer´s perception of the
environment in which he is shopping, and the quality of the products available, through the
effect of odours on mood. The study of Herrmann et al. (2013) has shown that a scent´s nature
could positively enhance the processing fluency of a customer in a store. The authors also
found out that when complex scent are present, the customer spend less money than in stores
where simple ambient scent is present.
2.4 Summary of the chapter
To sum up, this chapter consists of the research frame of reference. The theory regarding
customer perception brings up the aspect of how consumers select, organise and interpret the
surrounding information, according to their personal expectations and motives. The chapter
also discusses the theory consumer satisfaction, which occurs when the perceived
performance of companies’ offerings meets or exceeds the customer’s expectations which
increases the possibilities of repatronage and positive word-of-mouth. Furthermore, six
factors have shown to influence consumer behaviour when shopping, namely choice and store
variety, convenience, facilities, the social aspect, service quality and atmosphere. These
factors can have an impact on consumer’s satisfaction and patronage intention.

13
3 Research gap, Hypotheses and Research model
The following chapter defines the research gap, the independent and dependent variables of
the studied construct. The hypotheses and the research model will also be presented.
3.1 Research gap
Previous studies within the area have mostly focused on customers on either the external
shopping mall (see Frasquet et al., 2001; Anselmsson, 2006) or the city centre (see De Nisco
and Warnaby, 2013; Hart et al., 2013). Few academic comparative studies on both venues in
Sweden have been found. Thus, this investigation should be relevant. The findings of this
investigation could bring leads for managers to understand consumer’s perceptions and act
upon creating more attractive shopping venues.
3.2 Hypotheses
The following section present this research’s independent and dependent variables, which are
based on the previous literature review. The variables will form the hypotheses that the
research is going to measure, in order to find a possible relationship between them. To make it
clear, a research model will be presented in order to provide an overall view of the construct.
The independent variables are:
X1 (Choice and store variety), X2 (Convenience), X3 (Facilities), X4 (Social), X5 (Service
Quality), X6 (Atmosphere).
For the first research question, Which factors are the most important for customers when they
are shopping?, the six independent variables represent the customer’s perception of the
importance of different factors when shopping.
The dependent variables are:
Consumer satisfaction of the shopping mall and consumer satisfaction of the city centre.
The twelve following hypotheses, which will be tested, are presented below:
H1a: The perceived performance of choice and store variety in the shopping mall influences
customer satisfaction.
14
H1b: The perceived performance of choice and store variety in the city centre influences
customer satisfaction.
H2a: The perceived performance of convenience in the shopping mall influences customer
satisfaction.
H2b: The perceived performance of convenience in the city centre influences customer
satisfaction.
H3a: The perceived performance of facilities in the shopping mall influences customer
satisfaction.
H3b: The perceived performance of facilities in the city centre influences customer
satisfaction.
H4a: The perceived performance of the social aspect in the shopping mall influences
consumer satisfaction.
H4b: The perceived performance of the social aspect in the city centre influences customer
satisfaction.
H5a: The perceived performance of service quality in the shopping mall influences customer
satisfaction.
H5b: The perceived performance of service quality in the city centre influences customer
satisfaction
H6a: The perceived performance of atmosphere in the shopping mall influences customer
satisfaction.
H6b: The perceived performance of atmosphere in the city centre influences customer
satisfaction.
The possible correlation between perception of importance of the factors and customer
satisfaction will also be measured. This will show if there is a correlation between what
customers perceive as important and their level of satisfaction of the both shopping venues.

15
3.3 Research Model
The research model shows the six independent factors in relation to the two dependent ones.
The model also presents the perception of importance, which could have a possible
correlation with customer satisfaction of each of the shopping venues.
Model - H1a to H6b
Figure 1: Research Model - Own development

16
4 Methodology
The following chapter describes the methodology chosen for the investigation, which has
shaped the study. This section begins with a presentation of the selected research strategy,
approach and design. A second part will present the methods used for collecting data. Finally
a critical review is presented and discusses the methodology’s reliability and validity.
4.1 Research approach
A study can be characterised as exploratory, descriptive or explanatory depending on what the
purpose of the research is (Christensen et al. (2010). The quantitative research is characterised
as descriptive and explanatory while the qualitative is usually exploratory, descriptive and
explanatory (Christensen et al., 2010). The exploratory research is generally used at the
beginning of a research process when there is inadequate knowledge regarding the area to be
studied (Christensen et al., 2010) and therefore it aims at creating an pre-understanding
(Christensen et al., 2010; Björklund and Paulsson, 2003). Christensen et al. (2010) adds that
this kind of research is concerned with What, How and Why questions. In an exploratory
investigation the researcher undergoes a journey of discovery as “intended to identify and
narrow the problem area” (Christensen et al., 2010, p.57). Because this form of research is not
depending on statistical calculations or systematic techniques, it requires that the researcher is
curious, creative and pays attention as the survey is controlled by an individual's personal
capabilities to collect relevant data (Christensen et al., 2010).
When it comes to a descriptive research, Björklund and Paulsson (2003) and Christensen et
al. (2010) state that then the research aims to describe relationships. Thus, in this case the
researcher has already existing knowledge about the actual problem but lacks a clear and
updated view of it (Christensen et al., 2010). Björklund and Paulsson (2003) add that it aims
to describe probable connections and not to explain the current problem. Christensen et al.
(2010) mentions that the descriptive is not searching for explanation of new phenomena,
which is causing the problem. A descriptive research concerns with questions as How, Who,
Where and When but mainly deals with How questions (Christensen et al., 2010). The authors
state that to be able to describe a problem, there must be an understanding, in order to enable
an description of the current problem. This means that the researcher will also be exploratory
by seeking knowledge to achieve this (Christensen et al., 2010). Björklund and Paulsson
(2003) explain that the explanatory research has many similarities with both the exploratory
and the descriptive, but unlike the descriptive approach is the purpose of the explanatory is to

17
identify and determine the causal relationship between variables. The authors further state that
the explanatory approach is used when the aim of the research is to both explain and describe
a phenomenon in search of a deeper understanding. The exploratory research aims to explain
why something is as it is and therefore questions which concern Why will be asked
(Christensen et al., 2010). Finally, Björklund and Paulsson (2003) mention normative
research, which aims to propose measures to the current problem.
The current research is an explorative and descriptive research. The exploratory part of the
study aims at identifying what factors are important to customers when shopping and will
answer to the first research question. The descriptive part aims at describing the relationship
between the factors important to customers when shopping and customer satisfaction in
regard to city centres and shopping malls. This research is based on what and how questions
which are connected to the exploratory and descriptive research.
4.1.1 Inductive and deductive approach
There are two approaches that describe the relationship between theory and practice,
deductive and inductive approach (Bryman and Bell, 2013; Christensen et al., 2010;
Björklund and Paulsson, 2003). A deductive approach means, according to Bryman and Bell
(2013) that the research is based on knowledge that already exists within the specific area and
theories derived from it. They also explain that from this basis, a number of hypotheses are
formulated which will be subjected to empirical scrutiny. This method is usually adopted in
the quantitative research (Bryman and Bell, 2013). Induction, on the other hand, is associated
mostly with qualitative research, meaning the opposite, i.e. that research results provide a
basis by which theories or generalised conclusions are generated (Bryman and Bell, 2013).
This thesis is engaged in a deductive approach, as the study is based on existing theories in
order to create a ground for the research. Hypotheses will be formulated from the theories and
will thereafter be tested.
4.1.2 Quantitative vs. Qualitative strategy
The research problem can, according to Bryman and Bell (2013) and Backman et al. (2012),
be carried out from two different strategies, qualitative research and quantitative research. The
authors state that the perspective is determined depending on what the researcher wants to
achieve with the investigation. A qualitative approach is suitable when the researcher is
18
interested in people’s description of their world or observing their behaviour (Bryman and
Bell, 2013). Thus, the emphasis in the qualitative strategy is on words (Backman et al., 2012;
Bryman and Bell, 2013; Creswell, 2014) and their interpretation (Bryman and Bell, 2013). On
the other hand, the quantitative strategy focuses particularly on figures that allow
quantification of variables (Christensen et al., 2011; Backman et al., 2012; Creswell, 2014), in
order to see the relationship between them (Creswell, 2014).
Bryman and Bell (2013) separate variables into two groups, independent variables and
dependent variables. An independent variable is defined as “a variable that performs a causal
impact on another variable (the dependent variable)” (Bryman and Bell, 2013, p.718) and a
dependent variable is defined as “a variable that is causal affected by another (independent)
variable” (Bryman and Bell, 2013, p.714). The two strategies qualitative and quantitative are
not always inseparable (Christensen et al., 2010; Bryman and Bell, 2013; Creswell, 2014), but
can complement each other in order to get a more nuanced view of the research problem
(Christensen et al, 2011; Bryman and Bell, 2013). Finally, Creswell (2014) adds that a
research tends to be more quantitative or qualitative.
The purpose of this research is to examine what factors are important to consumers when they
are shopping, and to evaluate the influence of the perceived performance of these factors in
both an external shopping mall and a city centre on customer satisfaction. The focus of the
study is to evaluate this specific link between a perceived performance and satisfaction, in
order to measure a possible correlation. In order to do so, the most suitable research method
would therefore be the quantitative one, since it enables determination of the variables as well
as measuring the relationships between the different variables. The research also has
qualitative elements through exploratory interviews with municipalities.
4.2 Research design
Bryman and Bell (2013) distinguish the concepts of research design and research method as
they have different meanings in a study. Yin (2007) clarifies that the research design is a
logical plan and its purpose is to help to collect the right information. Bryman and Bell (2013)
explain the research design as being the framework in which the data collection and analysis
is being made and the research methods are the techniques that are used to gather information.
They also state that the design chosen in the analysis should reflect the decisions taken
regarding the priority of certain aspects of the research process. The five research designs that

19
the authors define are: experiment, comparative, longitudinal, case study and cross-sectional
design.
Experimental design is according to Bryman and Bell (2013), used when the researcher is
interested in examining how the individuals in the experimental group or groups are affected
by the changes in their environment. When using a comparative design, the researcher wants
to gain a better understanding of a certain social occurrence, which can only be made through
the study of two or more contrasting cases (Bryman and Bell, 2013). Christensen et al. (2010)
state that a longitudinal design is preferable for studies with an explanatory or descriptive
purpose. The authors also explain that the same type of data is collected on a number of
occasions over a period of time, which allows an explanation of trends or changing processes.
A case study is, according to Bryman and Bell (2013), a detailed study of one single case,
such as an organisation, a place, person or a specific situation. They state that this design
shows strong similarities to the cross-sectional study but the distinction lies in the researchers
interest in the particular case. Bryman and Bell (2013) also explain that cross-sectional design
means studying several cases in order to generate quantifiable data that can be linked to a
number of variables and thus to study the relationships between them. The authors explain
that this design is suitable when the researchers are interested in finding variations between
for example, organisations, individuals or nations. This design is, as explained by Christensen
et al. (2010), also used when the aim of the study is to give a quantifiable description of
something since the quantitative primary data, which often is the basis of the cross-sectional
design, allows the researcher to draw statistical generalisations. The information drawn from
this kind of study is therefore often of big value for a company since it for example can
provide information on their customers satisfaction with their offerings (Christensen et al.,
2010).
Bryman and Bell (2013) clarify that examining several cases increases the likelihood of
variation between the variables and the possibilities of making exact distinctions between
cases. The collection of data is done at a certain time, and often consists of questionnaires and
structured interviews but may also include other data collection methods (Bryman and Bell,
2013). The disadvantage of the cross-sectional design is, as Bryman and Bell (2013) explain
it, the difficulty in determining the causal direction between the variables. This difficulty is
according to them due to the simultaneous gathering of information, which prevents the

20
possibilities of manipulating the variables. The researcher can therefore not be sure of the
relation between the variables being causal, according to the authors. Despite the uncertainty,
it is not impossible to draw causal conclusions from a cross-sectional study (Bryman and Bell,
2013). Since the purpose of this research is to investigate the relationship between the
customer’s perceived performances of two different shopping venues and customer
satisfaction, the cross-sectional design was found to be appropriate for this study. It is of
significance in this research to do a broad study of several cases in order to find relationships
between the variables, and give them a quantifiable description.
4.3 Data collection method
The researcher must decide based on the chosen method, which type of information is
required in order to answer the research question (Björklund and Paulsson, 2003). The
information is categorised depending on when it was collected, where and for what purpose it
was collected (Christensen et al., 2010; Björklund and Paulsson, 2003). The two different
forms of data, which often are used to complement each other, are termed as secondary data
and primary data (Christensen et al., 2010; Björklund and Paulsson, 2003). In order to execute
this investigation and respond to the research questions and test the hypotheses, the results of
the study will be based on both secondary and primary data.
4.3.1 Secondary data
Secondary data implies information that is already available and is produced for a different
purpose than the researcher's current investigation (Christensen et al., 2010; Björklund and
Paulsson, 2003; Hair et al., 2011). Christensen et al. (2010) and Hair et al. (2011) explain that
the secondary data is often used initially in the research process in order to create a basic
knowledge of the problem area, which is to be investigated. In fact, by using secondary data,
the researcher can make a comparison and see what kind of primary data is required for the
study (Christensen et al., 2010; Hair et al., 2011). Secondary data was collected which
discussed the phenomena of competitiveness between shopping venues in Sweden in order to
get a basic understanding of the topic. The data consists of newspapers and research by the
Swedish retail statistics agency HUI Research and market analysis by JLL, an international
real estate company. Secondary data can comprise external data such as published or
commercial sources (Christensen et al., 2010; Hair et al., 2011). The authors explain that it

21
can also consist of internal data regarding information on organisations of customers, sales
performance and marketing activities.
It is important to ensure the reliability of the secondary data before it is used in the study
because information can be biased and not correspond to the reality (Christensen et al., 2010;
Hair et al., 2011). It is therefore of importance that the data is reviewed before being used in
the research (Christensen et al., 2010; Björklund and Paulsson, 2003). Bryman and Bell
(2013) explain that if the information is thoroughly reviewed, it also means that it maintains a
high quality. Making use of secondary data, researchers can save both time and money
because the collection of primary data often requires greater resources (Bryman and Bell,
2013; Christensen et al, 2010).
The secondary data, in this study, consists of academic literature and scientifically reviewed
articles. The articles were used in order to assure an updated but also a high academic level of
the research quality. The scientifically reviewed articles have been retrieved from
academically approved databases, such as BSP - Business Source Premier. The used data
servers are OneSearch and Google Scholar with the following keywords; Shopping mall, City
centre, Perception, Customer satisfaction, customer experience, Factors influencing consumer
behaviour, Choice and Store variety, Convenience, Facilities, Social, Service Quality and
Atmosphere. The used articles are chosen due to their relevance to the subject of this study
and focus on the factors which influence customer in the context of shopping. To increase the
reliability of this research, authors of this thesis critically reviewed the selected articles,
before using them. The academic information is forming the frame of reference in this
research. This frame aims to narrow and identify the area, which is explored (Creswell, 2014).
4.3.2 Primary data
When there is not enough existing information available to answer the specific problem, it is
often required that the researcher has to complement theory with new information which he
then collects himself, for his investigation (Christensen et al., 2010). This kind of information
is defined as primary data and can be collected by various techniques, but must
simultaneously fit the identified research problem (Christensen et al., 2010). Bryman and Bell
(2013) point out that qualitative investigations often consist of participant observation and
interviews or focus groups as techniques to collect information. When it comes to quantifying
the data, investigations will very likely be based on questionnaire surveys in order to collect

22
primary data (Bryman and Bell, 2013). The benefit of primary data, in comparison with
secondary data, is that the information is not only updated, but the researcher also knows how
reliable the information actually is (Christensen et al, 2010). The primary data, in this
research, is mainly based on a quantitative questionnaire (see appendix 1 and 2), also known
as survey, in order to confirm the previous scientific findings regarding factors influencing
consumer behaviour when shopping. This technique of collecting data is explained in the
following section. The primary data also consists of exploratory interviews in order to get a
fundamental knowledge of the studied municipalities.
4.4 Data collection instrument
4.4.1 Documents
As mentioned earlier, the current research is partly based on secondary data. Secondary data
is already existing documents, which can help the researcher to design questions, and themes,
which then can be compared with primary data (Bryman and Bell, 2013). Bryman and Bell
(2013) states that there are different types of documents depending on the specific source.
One type of document is defined as; mass media outputs which implies sources such as daily
newspapers and magazines (Bryman and Bell, 2013). Christensen et al. (2011) define this
type of sources as external data. In this thesis, the mass media outputs are data from the
Swedish media and research from analysis institutes, and are presented in the background of
this thesis. Documents can also take the form of virtual documents, which according to
Bryman and Bell is information published over the Internet. In this thesis, these documents
are presented as articles and books by previous scientists, and newspaper articles, published
on the Internet. Even if Bryman and Bell (2012) do not mention literature as a form of
document, it can be considered as a type of documented source.
4.4.2 Interview
The fact is that the quantitative and the qualitative strategy are not always inseparable, but can
complement each other in order to get a more nuanced view (Christensen et al., 2010; Bryman
and Bell, 2013). Bryman and Bell mention that qualitative research can consist of various
forms of interviews. The research in this thesis is mainly characterised as quantitative but has,
however, elements of the qualitative because interviews have been conducted with various
municipalities in Sweden. The use of interviews was an exploratory phase in the research in
order to get a basic knowledge of the situation of three cities in Sweden, on which the

23
forthcoming investigation is based on. Questions were asked to key representatives, in order
to get their perspective on their municipalities’ relationship between two shopping venues; the
shopping mall and the city centre (see appendix 8). The contacted persons were a President of
the Regional Executive, a Head of Business and Regional Development, a Business and
Regional Developer and a City Planning Director, each from a different municipality. The
data was collected through email interviews and phone interviews. The same questions were
asked in both of the two interview techniques and used for each municipality in order to see
similarities and differences of the answers (see appendix 8). The answers from the email
interviews were collected on the 6th of March and the 5th of May. The phone interviews were
conducted on the 6th and 7th of May.
Regarding the advantage of using phone interview, it is an efficient way to collect data
(Christensen et al., 2010). Bryman and Bell (2013) distinguishes different types of interviews
such as, unstructured and semi-structured, which reflects the respondent's point of view. The
difference between a semi-structured interview and unstructured interview is that in the semi-
structured-one, different themes are used which will be touched during the interview (Bryman
and Bell, 2013). The authors state that unstructured interview can be seen as a conversation
which also has themes to start from, but where the researcher gives the respondent more
responsibility to answer freely and to have more control over the conversation. Christensen et
al. (2010) mentions that phone interviews can be unstructured but is, however, usually
standardised where the moderator has predetermined questions to be answered during the
interview process. The advantage of phone interviews is the flexibility, which allows the
interviewer to ask follow-up questions, which could generate unexpected and deeper answers
(Bryman and Bell, 2013).
Since this study involved interviewing several respondents with different positions in different
municipalities, it was important to start with the semi-structured interview to avoid getting
irrelevant and unmanageable amount of information. The interview guide for the email and
phone interview was based on an opened-ended question in order to generate unforeseen
answers. The phone interviews were semi-structured in character, and follow-up questions
where asked based on the respondents answers. Although, Bryman and Bell (2013) explains
that it can be beneficial to ask open-ended questions in investigations of new areas, but can be
more time consuming than asking closed questions. It was, in this case, substantial to use

24
open-ended questions because the lack of knowledge regarding the municipalities’
perspective of their situation.
4.4.3 Questionnaire
Hair et al. (2011) point out one technique in order to collect information, which is using self-
completion surveys, that consist in structured questionnaires with a set of predetermined
questions in order to collect a large quantity of data in numerical form. The authors explain
that the questionnaire has to have a specific design and be delivered in a chosen way. In the
current study an electronic self-completion questionnaire has been delivered, through a web-
hosted Internet survey. It is an effective way of collecting data and the answers can be quickly
gathered thank to the server, but it also allows the participants to stay anonymous
(Christensen et al., 2010; Hair et al., 2011; Bryman and Bell, 2013). The used webpage was
Webbenkater.com, a Swedish questionnaire creating website which offer a free usage for
students. The questionnaire was accessible to respondents from the 1st to the 7th of May. To
increase the response rate among respondents, they were informed that they would remain
anonymous. The selection of this particular technique in order to collect data is based on the
fact that this study requires a large number of responses for a limited period of time. It is
therefore not adaptable for this investigation to use other techniques. It is important to add
that the choice is also based upon that the fact that participants should not be affected by the
environment, which would be the case if they were approached in the actual venues. Instead,
the survey allows them to answer the questions based on their previous experience and
perception of the two shopping venues.
To get as high a response frequency as possible, social media was chosen as a communication
channel to distribute the questionnaire survey among inhabitants of each municipality. The
surveys were published through the social network Facebook, where several Facebook
groups, related to the municipalities in question, were selected and used to spread the survey.
This groups target different kinds of people, both men and women in various ages. The
questionnaire was also spread further through the contacts that the authors in this study had
within each municipality. Theses contacted persons sent on their turn the questionnaire
forward to people they knew who lived in the municipalities. The reason for publishing via
social media was it effectiveness and rapidity to pass on information to people, but also to be
able to get access to people located elsewhere. In order to further increase the response
25
frequency, the authors sent reminders every day to encourage as many people as possible to
complete the questionnaire.
4.4.4 Questionnaire design
A structured questionnaire can be based on open-ended or/and closed questions with
predetermined options (Christensen et al., 2010; Bryman and Bell, 2013). The questions of
this survey consist of closed-ended questions with a set of alternatives from which the
respondents can choose what best matches their opinion. The advantage of making use of
fixed alternative answers, according to Bryman and Bell (2013), is the efficient way to
process the responses, but also to allow the researcher to easily compare the responses,
because the variation in the answers is minor in comparison to asking open-ended questions.
It is, however, an advantage to ask open-ended questions because it can generate more
interesting answers, which are not expected (Christensen et al., 2010; Bryman and Bell,
2013). It is important to add that the validity can be negatively affected if the respondents do
not understand the questions (Bryman and Bell, 2013). It is therefore, in this study, important
to test the questions in order to ensure that respondents understand and perceive the questions
correctly before publishing the questionnaire. When the questions are formulated, it must be
taken into account not to ask questions that lead the respondent to answer in a certain
direction (Christensen et al., 2010; Bryman and Bell, 2013). It is of great importance, in
closed questions, to have as complete response options as possible to ensure that the
respondent's answers are not controlled (Christensen et al., 2010).
The first questions of the questionnaire concern the respondent’s information, like gender, age
and occupation. For the next two parts of the questionnaire, the design of the questionnaire is
inspired by the questionnaire of Hackett and Foxall (1993). The research from Hackett and
Foxall studies consumer’s location specific values in a high street and a shopping mall, using
an opportunity sampling. The mentioned sampling method is based on that the researcher
needs respondents who happen to be there (Christensen et al., 2010; Bryman and Bell, 2013).
Thus, it seemed relevant for the study to use their previous research and content areas as a
basis to construct the questionnaire. For the last part of the questionnaire, the design is a close
replication of Léo and Philippe’s (2002) “Satisfaction measurement scale”. Following Léo
and Philippe, the measurement includes questions about overall satisfaction, pleasure of use
and future behaviour of the customer, intention to recommend the place and comparison with
other shopping venues. Some questions were rephrased to fit the scaling of the questionnaire.

26
4.4.5 Scaling
Measuring a variable consists in assigning a number to it that reflects the aspect of the object
or event (Hair et al., 2011). According to Hair et al. (2011) there are numerous types of
scales, but broadly two types of scales can be defined, metric scales which are a type of
quantitative scales, and non-metric scales. The authors define different types of metric scales,
which among others include rating scales and likert scales. An interval scale consists of
numbers which allow the respondents to rate objects, with equal distances between numbers
(Hair et al., 2011). For the measurement of opinions or perceptions, a rating scale can be used
(Hair et al., 2011). The likert-scale help, as explained by Hair et al. (2011) measuring
opinions by assessing how strongly the participant agree or disagree about an item. Zikmund
et al. (2013) explains that a odd number of scale points are appropriate to use if it is assumed
that the respondent could have a neutral opinion of the subject in question. Even scale points
are, according to the authors, preferable for issues that people tend to have strong opinions of,
since it forces the respondents to choose side.
The questionnaire used in this study is divided in three parts, the rating scale was used for
measuring the customers opinion on the importance of factors when shopping, and a likert-
scale was used to measure their agreement on the performance of the two shopping venues,
and on their satisfaction. An odd number of the scaling was used since the authors of the
thesis considered it likely for the respondents to have a neutral opinion. The first part of the
questionnaire asks the respondents to rate each item according to the criteria of importance
when shopping, on a 5-point scale, from “not important at all ” to “very important”. The
choice of a five point scale in this part is based on the recommendations from Hair et al.
(2011), which explains this number to be adequate for measurement of importance.
The second part of the questionnaire asks respondents to scale the performance of each item
according to the criteria of perception on a 7-point scale, rating from “strongly disagree to
“strongly agree”. The same scale is used for the third part of the questionnaire in which the
respondents are asked to scale questions on their satisfaction of the two shopping venues.
Zikmund et al. (2013) explains that a scale with 7-10 points generally seems to perform better
but it is up to the researcher to determine which grading is best for the actual case. “This issue
of identifying how many meaningful distinctions respondents can practically make is

27
basically a matter of sensitivity, but at the operational rather than the conceptual level.”
(Zikmund et al., 2013, p.327). The seven-point scale was used for the measurement of
perceived performance and satisfaction since it was considered to provide a more precise
indication of the respondents ‘opinion.
4.4.6 Pilot survey and testing of questions
Bryman and Bell (2013) explain that a pilot survey, known as pre-testing, is of great
importance to investigations, and especially for research, which is based on questionnaires.
The authors add that it is a requirement that the questionnaire goes through verification tests,
before it is published for public, in order to ensure that the questions are clearly asked and
well formulated. Doing so, the researcher is sure that respondents understand the question in
order to be able give correctly answers (Christensen et al., 2010; Bryman and Bell, 2013). The
pre-testing also helps to assure that the questionnaire is coherent and that respondents
understand how it should be filled in (Christensen et al., 2010). Christensen et al. (2010)
recommend having 5 to10 participants in the tests and that the researcher interviews the
participants afterwards regarding what they think about the questions, in order to get a
generalised point of view on the questionnaire.
Bryman and Bell (2013) explain that with a pilot study the researcher has also the possibility
to get a view of the survey as a whole. In order to increase the validity of this study's
questionnaire the questions went through a control test before it were published for the public.
The questionnaire was constructed in English and then translated to Swedish since it would be
addressing both Swedish- and English speaking persons. A group of 5 Swedish participants
were gathered in order to get an understanding on how the questions were perceived and if
there were any misunderstanding regarding these. The participants were three women and two
men aged from 25 to 34. Three of them were working and two were students. It was important
to have participants in different ages, gender and different occupation in order to get as
realistic result as possible. The first step was to let the participants do the web survey over the
Internet in order to provide a natural way of doing it.
The individuals were timed in order to see how long the questionnaire took to complete. In the
second step, the participants were handed a printed version of the questionnaire and were
asked to write comments on the questions they have found strange or difficult to answer. Step
three was to gather the individuals into a group where they could discuss the experience of the

28
survey completion and perception of the questions. There was some lacking of clarity
concerning the formulation of a few questions. As a result, some of the questions were
adjusted to fit the Swedish vocabulary. The adjustments were also made in the English
version in order to have the exact same questions in both questionnaires.
4.5 Operationalization
Table 1: Operationalization
Concepts
/Factors
Definition Measures based on
literature review
Construct Question
number
Perception Perception is “The
process by which people
select, organise and
interpret information to
form a meaningful
picture of the world”
(Kotler et al., 2009,
p.602).
-Stimulus being
relevant to the
person’s needs and
interests (Schiffman
and Kanuk, 2004).
- Attributes meet or
exceed the person's
expectations (Peluso,
2011).
- Perception of
importance
-Perception of
performance
5
6
Satisfaction Customer satisfaction is
“The extent to which a
product´s perceived
performance matchers a
buyer´s expectations”
(Kotler et al, 2009,
p.599).
-Recommending a
place to other
customers
- Repeated buying of
a product/service
-Comparison relating
to other opportunities
- Pleasure associated
with use (Léo and
Philippe, 2002)
- Satisfied with the
venue
- Recommend it to a
friend
- Comparison with
other venue
- Pleasant to walk
there
- Enjoy going there
- Usually go
shopping there
- Regularly use its
services
7.1
7.2
7.3
7.4
7.5
7.6
7.7
Choice and
store variety
Choice is “the selection,
consumption, and
disposal of products and
services” (Bettman et
al., 1998, p.187).
- Tenant mix, magnet
stores and secondary
attractors (Brown,
1992)
- Number of choice
(Bettman et al., 1998)
- Wide choice of
shops/goods
- Large departmental
store
- Get a bargain
- Large supermarkets
- Find small
specialist stores
6.1
6.7
6.13
6. 15
6.19
Convenience Commodity costs are
“the monetary price
paid the seller to obtain
possession of goods and
services” (Kelley, 1958,
p.32). Convenience
costs are “ incurred
- Location
(Anselmsson, 2006). -
Parking (Anselmsson,
2006).
- Ability to easily
locating themselves
-Stay warm and dry
- Shopping area
close to my home
- Park easily
- Short distances
between shops
- Easily find shops
6.2.
6.14.
6.27.
6.20

29
through the expenditure
of time, physical and
nervous energy, and
money required to
overcome the frictions
of space and time, and
to obtain possession of
goods and services”
(Kelley, 1958, p.32).
in the shopping mall
(Anselmsson, 2006;
Im and Ha, 2011).
-Temperature, easy
navigation (Im and
Ha, 2011).
Facilities A comfortable, clean
and safe shopping
environment (Myers et
al., 2008).
- Transport (Ozuduru
et al., 2014).
- Adequate toilets,
seating, security
(Myers et al., 2008)
- Washrooms, play
areas for children
(Wee, 1985)
- Baby
feeding/changing
- Security staff
- Place to leave
children
- Place to sit down
- Toilets
- Good transport
links
6.3
6.9
6.21
6.25
6.28
6.8
Social The social aspect of
shopping refers to
shopping with friends or
communicating with
others (Tauber, 1972;
Arnold and Reynolds,
2003; Davis and
Hodges, 2012).
- Shopping with
friends (Arnold and
Reynolds, 2003).
- Positive emotions
(Matzler et al., 2005)
- Places to meet
others
- Nice place to shop
with friends
- Enjoying myself
6.5
6.11
6.17
Service
Quality
The contrast between
the expectation of the
consumer and the actual
performance of the
service (Bolton and
Drew, 1991).
- Friendly and
helpfull salesperson
(Clopton et al., 2001;
Keh et al., 2013).
- Store environment
like cleanliness
(Terblanche and
Boshoff, 2001)
- Quality, value and
variety of goods
(May, 1991)
- Friendly and
helpfull staff
- Clean area
- High quality goods
- Value for money
6.4
6.10
6. 16
6.22
Atmosphere The conscious
designing of space to
create certain effects in
buyers” (Kotler, 1973,
p.50).
- Music (Broekeimer
et al., 2008).
- Design (Baker et al.,
2002).
- Scent (Chebat and
Michon, 2003).
- Attractive product
and promotional
displays (Terblanche
and Boshoff, 2001)
- Nice window
displays
- Nice design
- Pleasant music
- Nice smell
6.6
6.12
6.18
6.23

30
4.6 Sampling
Sampling as part of the research process involves collecting information thanks to a chosen
group of people, known as a population, who share similar characteristics (Hair et al., 2011).
A sample has to be representative of this population, and a relevant target population has to be
defined, from which the sample unit will be selected for the research (Hair et al., 2011). A
probability sampling is, according to Hair et al. (2011), a method where a random selection of
elements is used, and the non-probability sampling, where the researcher decides to include or
exclude some elements. Snowball Sampling is a non-probability sampling method, that
consists in using initial respondents to help the researcher identify other ones in the chosen
population (Christensen et al., 2010; Hair et al., 2011; Bryman and Bell, 2013). Bryman and
Bell (2013) explains that the snowball sampling is a relatively uncommon method in
quantitative studies but it can be relevant when the researchers are interested in finding
relation between persons.
The chosen population of this research can be define as people living in Sweden, and more
precisely in three cities in the south of Sweden. The choice of cities is based on the size, they
are all mid-size cities, of the respective external shopping malls regarding their number of
stores, which is around 70-80. The sample unit used will consist of individuals over 18 years
and older, who are familiar with both their local city centre and their external shopping mall.
Non-probability sampling will be used, as there is a need for this particular study to include
specific elements. The most efficient way for the study to find relevant participants is to
proceed to a snowball sampling, for each of the studied cities.
4.6.1 Sample size
Hair et al. (2010) explains that the sample size rule of thumb is ten times as many respondents
as variables, and 50 respondents are a minimum. In order to calculate the sample size for this
study, the method of Rule of thumb as explained by Hair et al. (2010) was used. For the
second part of the questionnaire, there are 6 independent variables, thus the calculation is the
following: 10*6= 60 respondents. The total amount of responses collected was 111, which
were used as data for the first part of the questionnaire. Nevertheless, some of the surveys
were incomplete, which left 75 of them to be used for the second part of the questionnaire.
This mean that the minimum of the needed responses according to Hair et al. (2010) was
exceeded.

31
4.7 Data analysis
Analysing quantitative data can be done through the use of descriptive statistics, and through
the testing of the hypotheses (Hair et al., 2011). The IBM SPSS Statistics software, version 21
will be used throughout the data analysis of the internet based survey in this thesis. SPSS -
Statistical Package for the Social Sciences, is a statistical data analysis program within the
social sciences and is used to analyze quantitative information of surveys (Bryman and Bell,
2013).
4.7.1 Descriptive statistics
In order to analyse the first part of the questionnaire, which asks participants to scale the
importance of different factors according to a rating scale, descriptive statistics will be used.
Descriptive statistics include different measurements like central tendency, to describe the
distribution and thanks to the mean for example, that can be used to calculate averages and
see the central tendency of an item (Hair et al., 2011). Measures of dispersion will be used, to
evaluate the variability in responses thanks to standard variation, and to see how the
distribution is shaped, through the analysis of the skewness and kurtosis: if skewness is over 1
or under -1, the distribution is very skewed and if the kurtosis finds itself within over 3 or
under -3, it shows a very peaked or flat distribution (Hair et al., 2010).
4.7.2 Testing the hypotheses
Testing the hypotheses will allow the researcher to statistically use the collected empirical
data in order to see if the hypotheses can be confirmed or not (Hair et al., 2011). There is
always a risk of error in business research, while testing hypothesis and the probability of
error, known as level of significance (Sig) can be considered as acceptable if it is < 0.05. The
aim of the study is to examine the relations between the perceived performance of two
shopping venues, and customer satisfaction. Therefore, correlations and regression analysis
will be conducted between the variables (Hair et al., 2011).
The relationships between variables of the presented model are evaluated as linear
relationships, meaning there is a “straight-line association between two or more variable”
(Hair et al., 2011, p.349). Also of importance is that all of the presented hypotheses present a
positive direction (Hair et al., 2011).

32
Pearson correlation
The Pearson correlation is used when measuring two variable’s linear association (Hair et al.,
2011). The authors explain that the correlation coefficient will range from -1.00 to +1.00
where 0 represents the absence of association. Besides, this correlation can be squared, to
define the coefficient of determination, also known as the r2, which is found between 0.00 and
1.00 and shows in percentage how much of the variation of one variable can be associated
with another one (Hair et al., 2011). The adjusted r2
is used for small samples to provide a
better estimation of the r2
value (Pallant, 2005).
Linear regression analysis
Linear regression is used to examine the relationship between a dependent and an independent
variable (Hair et al., 2011). When testing more than one independent variable, the Beta
coefficient, situated from -1.00 to +1.00, can differentiate variables with the most important
influence on the dependent variable from the ones with poor influence (Hair et al., 2011).
Paired-sample t-test
Pallant (2005) states that the paired-samples t-test is used in order to do a comparison of the
mean scores of an object on different occasions. According to her, this test is useful when the
researcher wants to measure individuals’ answers on two separate questions. By running this
test, the researcher can determine if there is a statistically difference between the mean scores
(Pallant, 2005).
4.8 Reliability and Validity
Bryman and Bell (2013) bring up the concepts of reliability, replicability and validity in order
to evaluate the quality of an investigation. It is of great importance to assess the quality of the
measurements used in the study, by completing reliability and validity tests (Hair et al.,
2011).
4.8.1 Reliability
According to Bryman and Bell (2013) the term reliability is mainly used in quantitative
studies. The reliability is about operationalising each step in order to allow others to generate
the same results, or to reduce the defects, which could be found in the investigation (Yin,
2007; Backman et al., 2012; Bryman and Bell, 2013). The research process of this study is
documented in a way that will allow others to evaluate the chosen approach but also enable

33
them to carry out the same study and to generate the same results. Hair et al. (2011) associates
reliability to the consistency of the variables used to measure a construct. A questionnaire is
considered reliable when findings stay consistent even through multiple applications, and
more importantly when multi-item scales are used (Hair et al., 2011). In this study, two
different multi-item scales are used, therefore each item corresponding to a scale needs to be
correlated, and if a strong correlation is shows, then the scale can be judged as reliable.
Internal consistency reliability
Cronbach’s alpha is used to measure the internal consistency reliability of the items that,
together, form a construct (Hair et al., 2011). When calculated the alpha, it will range from 0
to 1, were 0.6 is considered as the minimum (Hair et al. 2011). The closer to 1 the alpha, the
stronger the association between items (Hair et al., 2011). In order to test the reliability of the
satisfaction construct and of the six different variables, the cronbach’s alpha will be measured
for each of them. The ensure further reliability of the scales, a minimum of three items per
concept were used, which were correlated in a positive way, according to the guideline for
reliability of scales by Hair et al. (2011). Also, by adapting Hackett and Foxall’s (1993) factor
analytic study, and using the satisfaction measurement scale” form Léo and Philippe (2002),
the reliability of the final questionnaire will be increased.
4.8.2 Validity
Validity can be defined as “to evaluate whether the conclusions that is generated from a
survey are linked or not” (Bryman and Bell, 2013, p.63). Bryman and Bell (2013) bring up the
concepts of construct validity, and Hair et al.(2011) add the concepts of content validity and
criterion validity.
Content validity
The fact is that validity is related to measurements (Bryman and Bell, 2013). As mentioned by
Hair et al. (2011), validity is about having an accurate construct that measures what it is
supposed to, and different approaches can assess this issue, like content validity, construct
validity and also criterion validity. Content validity is simply the fact of consulting experts to
judge if a construct is suitable (Hair et al., 2011). The questionnaire of this study was
controlled by academics and experts, both on the questions and the used concepts as a whole,
in order to assess the content validity of the construct. The questionnaire also went through a
translation check by professionals, were the correct translation of languages, from English to

34
Swedish was controlled. Both the English and the Swedish version of the questionnaire were
compared, controlled and approved.
Construct validity
Hair et al. (2011) add that construct validity, which evaluates what a scale actually measures,
can be controlled with convergent validity. The authors explain that to perform convergent
validity, a correlation test has to be run between the studied variables, and if it is shown to be
high, convergent validity can be approved (Hair et al., 2011). A Pearson correlation has been
run between all the dependent variables, in order to make sure of the construct validity of the
model. All of the variables for the city centre show a correlation, which is lower than 0,9 so
the construct validity is checked, because each variable measures a different area. For the
shopping mall, all of the variables show a correlation lower than 0,9, which also shows the
validity of the construct (see appendix 5).
Criterion validity
Criterion validity is used to make sure that a concept performs consistently compared to
existing validated variables (Hair et al., 2011). According to the authors, in order to assess
criterion validity, a verification of concurrent validity can be performed, which consists in
associating the studied concepts with theory to make sure they are correlated. In this study,
criterion validity is supported by the previously discussed literature review. The concept of
satisfaction is measured through a previously tested measurement used by researchers. The
dependent variables are measured thanks to determined factors in previous studies, that have
been found to influence consumer behaviour when shopping in general, but also satisfaction
or patronage intention.
4.9 Source criticism
Backman et al. (2012) emphasises on the fact that it is important in a research to have a
critical approach to the sources and the information, which actually is used in the study.
According to Christensen et al. (2010) it is needed to critically review the used sources in a
research in order to judge its reliability, that the published materials is correct and does not
contain incorrect data. Using mostly sources of origin will allow the researcher to review their
reliability (Christensen et al., 2010). It is also advantageous in a research to use the sources

35
which are published by authors with authority within the research area (Backman et al.,
2012).
In the current thesis, the authors have, as already mentioned in the above discussion, used the
information of a scientific reviewed articles and literature. The authors of this paper searched
for the respective original sources and the finally used information is mostly based on original
sources. The authors have, however, in some cases, been obliged to use secondary sources
when the original source could not be accessed. The secondary sources used in the thesis have
been critically examined to ensure their reliability and quality. . It is also important to add that
the sources used throughout this paper are based on well-known researchers in the studied
subject. The authors of the current study, have made use of current studies to generate an as
up-to-date reference frame as possible. In cases where new research has not been available,
older material were used because they are relevant to the study.

36
4.10 Summary of the chapter
The methodology chapter has discussed different method approaches, which form a research
such as choice of research approach, research strategy, research design, data sources, data
collection methods and techniques, analysis method and criteria in order to measure the
reliability and validity of the research. The table below shows a summary of the chosen
method, which has formed the current research.
Table 2: Summary of method choice.
Method approach Chosen method
Research approach Deductive approach
Research strategy Quantitative strategy
Research design Cross-sectional design
Data sources Secondary data
Primary data
Data collection
instruments
Exploratory: Interviews – email and phone
Internet based questionnaire
Sampling Convenience sampling – Snowball sampling
Data analysis method Descriptive statistics - Linear regression analysis
Quality criteria Reliability
Validity (Content validity, Construct validity, Criterion
validity)

37
5 Survey Results
The following chapter describes the data from the conducted interviews and the results from
the collected survey answers. In order to facilitate the reading, the tables for each hypothesis
will be attached in the appendix 3. Separate results will be presented in the following
sections. Since the municipalities in the study are anonymous in the interviews, the
municipalities will be referred in the chapter as: municipality 1, municipality 2 and
municipality 3.
5.1 Interview - municipalities
As an exploratory phase in which the authors of the thesis wanted to get a general view of the
situation in the selected municipalities, key representatives within each location were
interviewed (see appendix 8). The reason was to get an understanding of their opinion on the
relationship between shopping venues in their city. The respondents’ opinion regarding each
municipality is the basis for the empirical material that is gathered in the following section.
The interviewees’ positions are presented below:
Male, Business and Regional Developer, Municipality 1.
Female, Head of Business and Regional Development, Municipality 2.
Female, City Planning Director, Municipality 2.
Male, President of the Regional Executive, Municipality 3.
The following question was asked: “Do you perceive that there is a positive or negative
competition between the external shopping mall X and the X city centre?”
Most of the respondents highlight the fact that there is a positive competition between the two
venues. Although, the respondent from municipality 3 adds that “There is healthy
competition, but unfortunately the whole city has lost as a commercial centre. The
municipality has a special responsibility for an attractive city”. Respondents from
municipality 2, state that the venues complement each other. Most of the respondents
highlight the fact that there should be a collaboration between the venues in order for both
venues to benefit from trade. The respondent, from the municipality 3 states that the two
shopping venues have different requirements when it comes to expansion. The shopping
venues also involves different types of shopping behaviours, for example people mostly visit
the shopping malls on weekends, clarifies the respondent. The respondent expresses that it is

38
the same person who shops at the shopping mall and in the city centre. The choice of venue is
depending on the situation and what consumers want, adds the respondent. He also states that
the shopping mall is a venue visited by people with access to a car and the municipality is
trying to get rid of car traffic in the city centre to create a better green environment. The
respondent highlights that those who visit the city centre are mostly people between the ages
of 20-30 and that it is now a place for cafés and restaurants visits by this target market.
“It is important to know which target group that shops where and what they in turn demand.”
(Business and Regional Developer, municipality 1, 2014-05-06)
Although, the respondent from multiplicity 1 explains that in the city centre there are stores,
which target another age group than the people who are actually visiting the city centre. For
the moment, in the municipality 1, there are no active efforts to update the range of stores to
adapt the current target market, clarifies the respondent. He also adds that there are stores in
the city centre that do not succeed to remain on the market due to a poor product range and no
ability to build up their brand or loyal clientele. In municipality 3, the establishment of the
external shopping mall has contributed to a loss in the city but the municipality now does
everything to strengthen the city centre, like making it more attractive through cultural events.
In municipality 2, the development of the external shopping mall had a major impact on the
city centre, when the mall was first opened, explains the respondent. She highlights that by
this new development, stores in the city centre were difficult to manage and the whole town
was suffering. She also explains that to strengthen the city centre it was decided to establish a
partnership between the municipality and a private company. In order to increase the
attractiveness of the city centre, the municipality 2 and 3 are working on infrastructures and
urban planning. The respondent by the municipality 2 states that the municipality is working
active to create a nice city, with hustle and bustle, different services, dwellings and nice
pedestrian streets.
“It is important to have a holistic perspective on the development of both
the city centre and the external shopping mall.”
(Head of Business and Regional Development, municipality 2, 2014-05-07).
According to the respondent, from the municipality 1, the explosive development of shopping
malls has contributed to a competition between shopping venues, which attract the same type
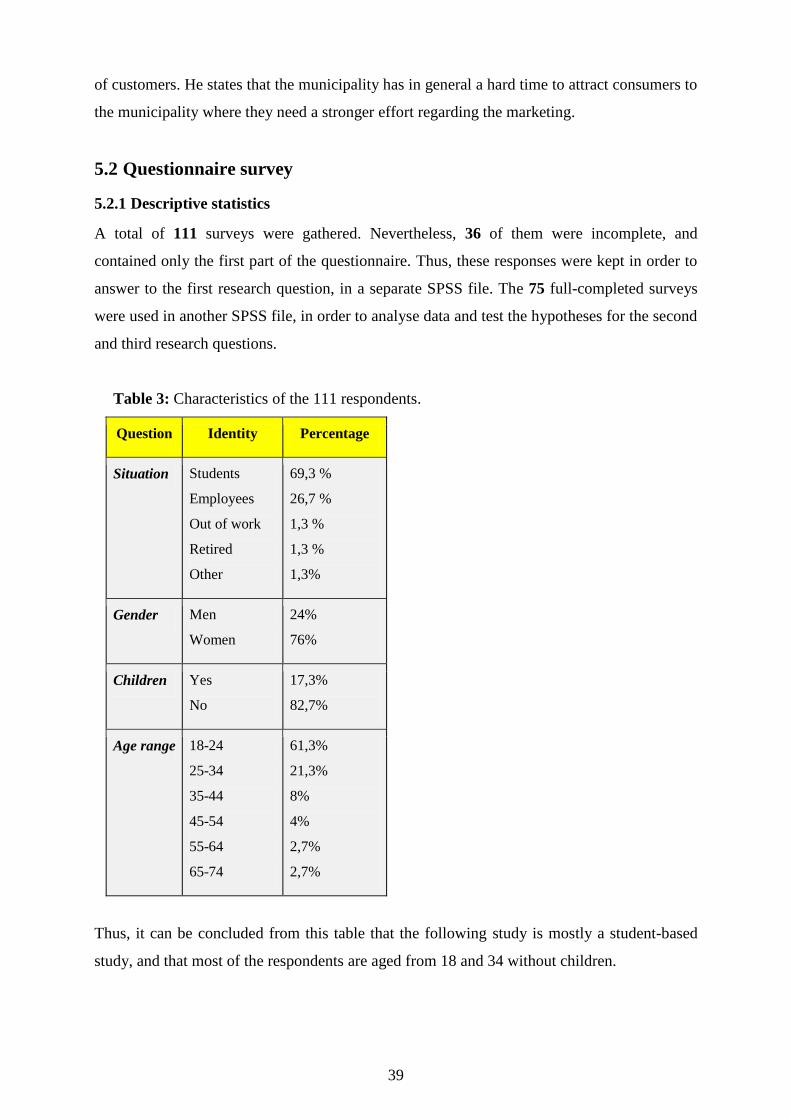
39
of customers. He states that the municipality has in general a hard time to attract consumers to
the municipality where they need a stronger effort regarding the marketing.
5.2 Questionnaire survey
5.2.1 Descriptive statistics
A total of 111 surveys were gathered. Nevertheless, 36 of them were incomplete, and
contained only the first part of the questionnaire. Thus, these responses were kept in order to
answer to the first research question, in a separate SPSS file. The 75 full-completed surveys
were used in another SPSS file, in order to analyse data and test the hypotheses for the second
and third research questions.
Table 3: Characteristics of the 111 respondents.
Question Identity Percentage
Situation Students
Employees
Out of work
Retired
Other
69,3 %
26,7 %
1,3 %
1,3 %
1,3%
Gender Men
Women
24%
76%
Children Yes
No
17,3%
82,7%
Age range 18-24
25-34
35-44
45-54
55-64
65-74
61,3%
21,3%
8%
4%
2,7%
2,7%
Thus, it can be concluded from this table that the following study is mostly a student-based
study, and that most of the respondents are aged from 18 and 34 without children.

40
Questionnaire part 1
For the first part of the questionnaire, each variable has been run through descriptive statistics
in order to analyse the collected data. A focus was put on skewness and kurtosis. The
variables with an acceptable skewness and kurtosis level were kept in the construct. All
variables with a kurtosis over 3 or under -3 were deleted, as well as variables with a skewness
over 1 or under - 1, because it means that the distribution of scores for the answers to these
questions was too flat, too peaked, or too unbalanced for them to be used.
Cronbach’s alpha
In the following table will be presented the internal consistency reliability of each factor.
Table 4: Internal consistency reliability Q1.
Factor Cronbach´s alpha
Store Variety 0,631*
Convenience 0,149
Service Quality 0,600*
Social 0,494
Facilities 0,526
Atmosphere 0,639*
*Reliable over 0,6
Three factors of the model; namely Store Variety, Service Quality and Atmosphere showed to
have a reliable internal consistency, thus these were the factors that were used for further
analysis.
Descriptives of the computed variables
For this first part of the questionnaire, where respondents were asked to scale the importance
of different factors when shopping, a 5-point scale was used, where 1 represented “not
important at all” and 5 “very important”. Looking at the mean for each variable shows the
average of the respondent’s answers. Comparing these averages will give an understanding of

41
which factors are more or less important than the others. If the factors are ranked in terms of
importance, Service Quality would be in the first place, and Atmosphere would be in the
second place, closely followed by Store Variety.
Service Quality, mean : 4,2207
Atmosphere, mean : 3,5721
Store variety, mean : 3,4775
Outliers
The following items were found to be outliers: Facilities 1 - a baby changing/feeding area,
Facilities 2 - good transport links, Social 3 - enjoying yourself, Convenience 5 - being able to
easily find the shops I am looking for and Facilities 6 - access to toilets (see appendix 4 - the
incumbent questions - table 1).

42
Questionnaire part 2
For the data analysis of the second part of the questionnaire, once again, each variable has
been run through descriptive statistics (skewness and kurtosis) in order to look for outliers.
Only the variables with a normal distribution were kept for further data analysis.
Cronbach’s alpha
In the following table will be presented the internal consistency reliability of each factor.
Table 5: Internal consistency reliability Q2
Factor City centre Shopping mall
Store Variety 0,678* 0,610 *
Convenience 0,620* 0,405
Service Quality 0,614* 0,611*
Social The Social variable could
not be included in the
analysis, as all it questions
were taken out after being
found as outliers.
0,685*
Facilities 0,695* 0,457
Atmosphere 0,712* 0,685*
Satisfaction 0,847* 0,847*
*Reliable over 0,6
The items of the model that showed to be unreliable for measuring the construct were deleted,
therefore some of the proposed hypotheses could not be tested; namely :
H2a: The perceived performance of convenience in the shopping mall influences customer
satisfaction.
H3a: The perceived performance of facilities in the shopping mall influences customer
satisfaction.
H4b: The perceived performance of the social aspect in the city centre influences customer
satisfaction.

43
Outliers
The following variables were found to be defiant for the shopping mall: Convenience1 (being
protected from rain and cold), Facilities2 (good transport links), StoreVariety4 (large
supermarkets/hypermarkets), Convenience3 (short distances between shops), Facilities5
(places to sit down), Convenience5 (being able to easily find the shops I am looking for),
Convenience6 (convenient parking) and Facilities6 (toilets). For the city centre, the following
questions were outliers: Social1 (places to meet others), Facilities2 (good transports links),
Social2 (shopping with friends), Convenience2 (shops being close to my home) , Social3
(enjoying myself) (see appendix 4 - table 2).
The authors of this thesis assume that these could be defiant as most respondents were
students, or that the questions were not understood or that they were judged as being
irrelevant.
5.3 Hypotheses testing and result
Figure 2: Which is your favourite shopping venue?
Figure 2 shows that 57,3 % of the respondents answered that city centre is their favourite
shopping venue and 42,7 % of the respondents answered that the external shopping mall is
their favourite venue.

44
Linear regression
For the second part of the questionnaire, linear regression analysis was run in order to test the
proposed hypotheses (see appendix 3). The adjusted R Square for the variables in the city
centre is 0,534, which means that the model (with store variety, convenience, facilities,
service quality and atmosphere) explains 53,4% of the variance of customer satisfaction. The
adjusted R Square for the variables in the shopping mall is 0,627, which means that the model
(with store variety, service quality, social and atmosphere) explains 62,7 % of the variance of
customer satisfaction. This means that in this study, the independents variables influence
53,4% of customer satisfaction in the city centre and 62,7% in the shopping mall.
The following table shows the results of the linear regression analysis between the six
independent factors (Store Variety, Convenience, Facilities, Service Quality, Atmosphere)
and the dependent factor (Satisfaction) in the city centre. The yellow highlight shows the
accepted hypotheses.
Table 6: Linear regression analysis - city centre.
The following table shows the results of the linear regression analysis between the six
independent factors (Store Variety, Convenience, Facilities, Service Quality, Atmosphere)
and the dependent factor (Satisfaction) in the shopping mall. The yellow highlight shows the
accepted hypotheses.

45
Table 7: Linear regression analysis - shopping mall.
H1a: The perceived performance of choice and store variety in the shopping mall
influences customer satisfaction. Accepted
As shown in the table, the significance value indicates p=0,000< 0.05, which means that the
hypotheses is accepted. The Beta value of 0,417 shows that store variety in the city centre has
high influence on satisfaction, but comes after the social aspect. The Pearson correlation is
0,695, which indicates a positive and strong relationship between the variables. (see appendix
5 - pearson correlation)
H1b: The perceived performance of choice and store variety in the city centre influences
customer satisfaction. Accepted.
The Beta value is 0,543, which show show that store variety is the factor with the highest
influence on satisfaction in the city centre.
H2b: The perceived performance of convenience in the city centre influences customer
satisfaction. Accepted.
The Beta value of 0,221 means that convenience has a moderate influence on satisfaction in
the city centre, and it is less important than store variety.
H3b: The perceived performance of facilities in the city centre influences customer
satisfaction. Rejected
H4a: The perceived performance of the social aspect in the shopping mall influences
customer satisfaction. Accepted.

46
The Beta value is 0,508, which mean that the social aspect has the highest influence on
satisfaction in the shopping mall.
H5a: The perceived performance of service quality in the shopping mall influences
customer satisfaction. Rejected
H5b: The perceived performance of service quality in the city centre influences
customer satisfaction. Rejected
H6a: The perceived performance of atmosphere in the shopping mall influences
customer satisfaction. Rejected
H6b: The perceived performance of atmosphere in the city centre influences customer
satisfaction. Rejected
Composition of the factors
The questionnaire 2 asks respondent to rate the perceived performance of two shopping
venues, on a 7-point scale. Each variable has a mean value, which corresponds to its average
rating. The following table summarises the variables with the highest average rating, for each
factor, in both the city centre and the shopping mall (see appendix 7).
Table 8 : High rated variables in the two shopping venues.
Factor Highest rated items in
the city centre
Highest rated items in
the shopping mall
Store Variety
I can find small specialist stores
(5,63)
There is a wide choice of shops and
goods (5,33)
Convenience The distances between shops are short
(5,45)
/ Deleted factor
Service
Quality
I can find high quality goods (5,69) The shopping area is clean (5,99)
Social / Deleted factor There are places to meet others (5,44)
Facilities There are places to sit down (5,11) / Deleted factor
Atmosphere The interior/exterior design and The interior/exterior design and

47
decoration are nice (5,09) decoration are nice (5,21)
Paired-sample t-test
Paired-sample t-tests were run for each factor, in order to compare their means and find out a
possible difference between the perception of these factors in the shopping mall and in the
city centre. For this second part of the questionnaire a 7-point scale was used, where 1
represents “Strongly disagree” and 7 “Strongly agree”. The mean is an average of the answers
given by the respondents, and can therefore show the level of agreement with the performance
of different factors in the two different shopping venues. Store variety, Service Quality and
Atmosphere had respectively a significance level of 0,126, 0,466 and 0,516, which indicates
no significant difference between these factors in both venues. Thus, it can be concluded that
participants rated the perceived performance of both shopping venues very similarly (see
appendix 6).
Satisfaction
The significance, known as “Sig. (2-tailed)”, is 0,001, which indicates a significant difference
in satisfaction between the two shopping places. The Mean difference is around 0,56 points.
The Mean score for the city centre is 5,03 and the Mean shopping mall is 4,47 so the
comparison of means shows that the participants are slightly more satisfied with the city
centre than with the shopping mall.
5.4 Comparison
The authors of the thesis looked for a possible correlation between the importance of different
factors when shopping, and the influence of perceived performance on the satisfaction of both
shopping venues. The two parts of the questionnaire are compared by overlapping the set of
results from the first part of the questionnaire on the results from the second part. As it has
been found previously, Service quality was the most important factor for consumer when they
are shopping, with a mean of 4,2 on a 5-point scale. It is perceived performance is the one that
has been rated as the highest by consumers, in both venues, with an average mean of 5,4 on a
7-point scale. Atmosphere was the second factor in terms of importance, with a mean of
3,5721 and also the second highest perceived performance, in the two venues, with an average
mean of 4,75.

48
At last comes Store variety, which is the third factor in terms of importance with a mean of
3,4, and with a perceived performance that also comes in third place, with an average mean of
4,6. Store Variety is the third most important factor for consumer when they are shopping,
and the collected data from the second part of the questionnaire shows that only Store Variety
in the city centres and in the shopping malls influences respectively customer satisfaction in
both venues. Thus, it can be concluded that there is a correlation between the importance of
certain factors and their perceived performance in two different shopping venues.
Nevertheless, no correlation can be confirmed between the importance of these factors, and
their influence on customer satisfaction.
5.5 Summary of tested hypotheses
The following table 3 is a summary of the findings from the statistical data analysis that
shows if the hypotheses are accepted or rejected. The table below shows the significant value
for each hypothesis, the sig-value, which indicates the probability of error, and the beta value
that shows the level of influence on the dependent variable.
Table 9 : Summary of hypotheses testing results.
Hypothesis Sig. Beta value Accepted/Rejected
H1a - The perceived performance of choice and store
variety in the shopping mall influences customer
satisfaction.
0,000* 0,417 Accepted
H1b - The perceived performance of choice and store
variety in the city centre influences customer
satisfaction.
0,000* 0,543 Accepted
H2b - The perceived performance of convenience in
the city centre influences customer satisfaction.
0,05** 0,221 Accepted
H3b - The perceived performance of facilities in the
city centre influences customer satisfaction.
0,370 -0,092 Rejected
H4a - The perceived performance of the social aspect
in the shopping mall influences consumer satisfaction.
0,000* 0,508 Accepted
H5a - The perceived performance of service quality in 0,276 -0,111 Rejected

49
the shopping mall influences customer satisfaction.
H5b - The perceived performance of service quality in
the city centre influences customer satisfaction
0,563 0,066 Rejected
H6a - The perceived performance of atmosphere in
the shopping mall influences customer satisfaction.
0,531 0,067 Rejected
H6b - The perceived performance of atmosphere in
the city centre influences customer satisfaction.
0,428 0,088 Rejected
* Significant at the 0,01 level.** Significant at the 0,05 level.

50
6 Analysis
The following chapter will present the result of the research and a discussion of the findings.
Finally, an analysis of the previously described survey results, in link with the gathered
information of the literature review.
The purpose of this thesis was to understand which factors had an influence on customer
satisfaction, by comparing the perceived performance of multiple factors in two shopping
venues. The findings of this study may generate managerial leads on what aspects to improve
or take into consideration, when focusing on the satisfaction of consumers when they are
shopping. As the previous chapter showed, the result of the data collection highlights that the
perceived performance of store variety had an influence on customer satisfaction in both
venues. Moreover, the perceived performance of the social aspect in the shopping malls
showed to also have an influence on customer satisfaction. Finally, the perceived performance
of convenience in the city centre has an influence on customer satisfaction. Other factors like
service quality; facilities or atmosphere did not appear to have any influence on customer
satisfaction, for any of the shopping venues.
Store variety
Store variety is the third most important aspect for consumer’s shopping in general. When
testing the hypothesis, Store variety was the only factor that showed having an influence in
the two shopping venues. Previous research also has showed that store variety influenced the
choice of a specific shopping venue (Anselmsson, 2006; Leo and Philippe, 2002). As the
respondent from municipality 1 of the interviewed locations states, it is of great importance
for shopping venues to know which target group they have and what kind of shops the
customers demand. The aspect “There is a wide choice of shops and goods” has shown to be
more performant in the shopping mall than in the city centre. This can be understood by the
statement of the respondent in the municipality 1 that explains that their city centre does not
have the right stores for the current target market. As stated by Kotler et al. (2009) and Bitner
(1992) consumers have expectations, which impact their satisfaction. The likelihood that the
customer visits a place again is bigger if the customer is satisfied, and can also contribute to a
positive word-of-mouth (Kotler et al., 2009; Bitner, 1992).

51
In this thesis, the fact that there is “a wide choice of shops and goods” and “ large
departmental stores” in the shopping mall partly explains why store variety performs well, in
the mind of customers. Theses aspects were the ones that had the highest rated perceived
performance. In the city centre, the presence of “small specialist stores” is the aspect that
customer perceive to be the most performant. This aspect is in accordance with previous
research, which states that tenant mix is one of the most important factors for attracting
customers (Brown, 1992). The specific location of some stores, magnet and secondary ones, is
determinant in the choice of visiting a shopping venue. This accepted hypothesis adds to
research with the finding that store variety influences customer satisfaction, whatever the
shopping venue. The results of the study also show, through the comparison of means, that
there is no significant difference in the perceived performance between the two shopping
places. This means that customers perceive their city centre and their external shopping mall,
as offering an overall similar store variety.
Social
When testing the hypothesis, the social factor was shown to have the strongest impact on
customer satisfaction in the shopping mall. The most important aspect showed to be that
“there are places to meet others” in the shopping mall and that “it is a nice place to shop with
friends/family”. Tauber (1972) also describes socialising as being one of the motives for
shopping, and Bäckström (2011) explains that the social interaction is sometimes also the
main activity of shopping. The findings of the current study confirm the statement by
Feinberg et al. (1989) and Solomon et al. (2010), that the mall is a social environment. The
third most important aspect, considering the means, showed to be “I am enjoying myself
when I go to” the shopping mall. All the measures within the social factor indicate that the
shopping mall environment encourages social interactions. The social aspect of shopping is
linked with hedonic values, which Jones et al. (2006) describes as the emotional aspect of the
shopping experience. The positive result of the social aspect in this thesis indicates that the
respondents perceive the shopping mall as offering them an emotional value. The emotional
value is important since it, according to Jones et al. (2006), strongly relates to customer
satisfaction, word of mouth and repatronage intention.

52
Convenience
The survey results show that the perceived performance of convenience had an influence on
customer satisfaction in the city centre only. The aspect with the highest perceived
performance was the fact of having “short distances between shops”. The second aspect with
a high-perceived performance is the fact of finding “pedestrian zones”. It can be understood
that the customer appreciates having space to walk, without cars and maybe less crowded than
in the shopping malls. Indeed, the respondent of the municipality 2 had stated that they were
working to create a nice city, with hustle and bustle, dwellings and nice pedestrian streets.
Thus, it is possible to conclude that the performance of the convenience in the city centre has
met the customers’ expectations, and it why it has an impact on their satisfaction of the venue.
Anselmsson (2006), has shown that convenience had an impact on customer satisfaction also
through parking spaces and the possibility for customer to easily locating themselves in a
shopping mall. In this thesis, it is in the city centre that these aspects have shown to influence
customer satisfaction. It may be partly the reason why respondents have said that they
preferred their city centre from their external shopping mall.
Service quality
According to De Nisco and Warnaby (2013), how a customer perceives service quality will
influence his willingness to visit a place again and the time spent in this specific place. In the
findings of this thesis, the perceived performance of service quality did not show any
influence on customer satisfaction, for either of the venues. Terblanche and Boshoff (2001)
found out that the environment of a store, like cleanliness, is an aspect to take into
consideration when assessing customer satisfaction. In this thesis, although the data show that
the presence of a “clean shopping area” is what customers rated as performing the better in
the shopping mall, it did not show to influence the satisfaction of the studied
sample/participants. For the city centre, the possibility to “find high quality goods” was the
aspect with the highest perceived performance, but a “clean shopping area” was also rated is
performing quite well. If the findings do not show any influence from Service quality on
customer satisfaction, it has been found out that service quality is the first most important
factor for consumer when they are shopping.
Facilities
The perceived performance of facilities did not show any influence on customer satisfaction,
for the city centre. The result of the current research shows that “there are places to sit down”
53
is the only facility aspect which the customers perceives as well performing in the city centre.
The aspect of the poor perceived performance of “available toilets in” the city centre could
have a negative impact on the experience of the city centre. As Myers et al. (2008) states, the
offering of basic facilities such as adequate toilets and places to sit affects the customer’s
experience of the shopping venue. The lowest perceived performance within this factor was
shown to be “there is a place to leave children in” the city centre. According to Wee (1985),
the facilities washrooms for children as well as children’s play area are significant to the
customer’s patronage behaviour. The poor perceived performance could be impacted by the
fact that the majority of the respondents did not have children and these facilities are thus not
relevant to them. As Schiffman and Kanuk (2004) states, people tend to neglect things that are
of no need or interest to them. But the negative result could also mean that there are no places
to leave children in the city centre.
Atmosphere
As previous literature review showed, scientists argue that the atmosphere could be of great
importance in various ways. One of these aspects is to differentiate a company, or venue in
this thesis, from its competitors by creating emotional values among consumers through the
atmosphere and the physical environment (Kotler et al., 2009; Bitner, 1992). As Solomon et
al. (2010) highlights, consumers’ purchase decisions can actually be positively influenced by
using atmosphere cues. In this thesis, the findings show that the perceived performance of
atmosphere did not have any influence on customer satisfaction, for either of the two venues.
Although, the results indicate that the presence of a “nice interior/exterior design and
decoration” was rated by the customers as performing well in both shopping venues, among
the other aspects. In fact, the aspect of interior/exterior design was closely followed by “nice
window display” in the shopping mall.
As Barker et al. (2002) state, the design elements of the store have an impact on the
consumers’ perception, which can affect the patronage intention of customers. In the theory,
regarding customer satisfaction, Kotler et al. (2009) point out the fact that satisfied consumers
tend to make purchase decisions but also tell others about the positive experience. If they
remain dissatisfied the customers can choose the competitors instead and spread the negative
experience they had to others (Kotler et al., 2009). It could mean that without a nice design
environment, the customer's choice of shopping location and purchasing decisions would be
adversely affected. In other words, the respondents of the survey perceived design in both

54
venues slightly well with a mean of 5,21 in the shopping mall and 5,09 in the city centre.
Therefore the venues do create a certain emotional value to the consumer through the
atmosphere, and influences his perception. Although, the number shows that the performance
of nice design in the shopping mall is perceived slightly stronger than the city centre.
Some of the mean values of the questions forming the atmosphere factor are not so high. A
possible analysis of this could be that atmospherics are something intangible and that can be
situationally based, like the consumer’s moods and interests for example. Therefore, it would
not be something that customers consciously perceived as important. It could also be related
to the fact that the respondents are actually stimulated by the atmosphere factor, but that they
could not really remember the stimuli regarding the music and the smell, and therefore were
not able to scale the performance of the atmosphere in the shopping venues.
Comparison
When comparing the factors that are important to consumers when shopping to how their
performance is perceived, the results were consistent. Service quality on the first place of
importance is the factor that is perceived as performing the better in both shopping venues. It
is followed by atmosphere, which is secondly important, and is perceived as performing
slightly better than store variety. Store variety finds itself at the third place of perceived
performance, which is consistent with its third place for importance. These results show that
what customers perceive as being important on their shopping experience, also performs in
the way they expect it to, which sometimes leads, in the case of store variety, to satisfaction.
Preferred shopping venue
As the result showed, 57,3 % of the respondents consider their favourite shopping venue
being the city centre and 42,7 % answered the external shopping mall as being their favourite
venue. This finding could be partly explained, as it has been found out from the respondent of
the municipality 3, by the fact that most of the people who visit the city centre are aged
between 20-30 and that the centre offer is now cafés and restaurants that attract this target
population. Therefore, the result of the study showing that the city centre is the preferred
venue could be explained by the fact that most of the respondents to the survey were students.
The findings of this thesis will result in specific managerial implications, which are discussed
in the next chapter.

55
7 Discussion
This last chapter presents a conclusion to the conducted study, as well as managerial and
theoretical implications and suggestions for future research.
7.1 Conclusion
The purpose of the thesis was to answer to the following research questions:
RQ1: Which factors are the most important for customers when they are shopping?
RQ2: How does the perceived performance of an external shopping mall influence customer
satisfaction?
RQ3: How does the perceived performance of a city centre influence customer satisfaction?
The findings of this thesis showed that three aspects are important to consumers when they
are shopping; namely store variety, atmosphere and service quality. As the results
demonstrate, the presence of store variety influences customer satisfaction of city centres and
shopping malls. When it comes to atmosphere, it has not shown to have any influence on
customer satisfaction, even if it is of secondary importance for consumer when they are
shopping. Nevertheless, the perceived performance of atmosphere is quite high in both of the
shopping venues. But as it is a factor considered as important, it is interesting to increase its
performance in both shopping venues in order to create customer satisfaction, which also
could lead to a positive word-of-mouth and a higher visit frequency. Service quality is the
third important aspect to consumers, but it has not shown any influence on satisfaction from
the consumers.
Finally, two other factors have proven to have an influence on customer satisfaction. The
social aspect in the shopping mall, and Convenience in the city centre. Both of the factors
come second in terms of strength in the influence, but their impact on satisfaction still needs
to be taken into consideration. It must be taken into account that the results of this thesis are
based on the answers of participants living in three different cities of the south of Sweden, and
that most of the participants were students. Thus, when the findings vary from what previous
research has shown, it may be because of these parameters.

56
7.2 Theoretical and managerial implications
Managerial implications
It is relevant for managers to be aware of the perception that consumer have of different
shopping venues, as well as of their level of satisfaction. The findings of this thesis can bring
leads for future managerial decisions, and most importantly for retailers in Swedish cities. As
it has been understood, consumers focus on the importance of service quality, atmosphere and
store variety when they are going shopping. Thus, these aspects need to be prioritised by
retailers and managers. As atmosphere it is a factor considered as important, it could be
interesting to increase its performance in both shopping venues. Music and scent were the
least performant, so they could be developed in the venues as a whole, but also for each
specific store. By increasing these sensory stimulus the manager could awake certain
emotional feelings in consumers, which could create positive memories and associations of
the place.
Moreover, store variety showed to influence customer satisfaction in both venues. In order to
increase satisfaction, this aspect of store variety would need to be improved, by adapting the
offer to the needs of the target population. Convenience in the city centre also showed to have
an influence on customer satisfaction, thus it is important that the persons responsible for
development of the municipalities put effort into keeping a convenient shopping area, with
pedestrian streets, easy access and navigation, in order to keep the customers satisfied.
Finally, the social aspect in the shopping mall had an influence on customer satisfaction,
which means that consumer appreciate shopping with others and having the possibility to
socialise. Moreover, the performance of the social aspect may be improved by further
development of marketing activities focused on social interactions to create an inviting and
friendly atmosphere. To sum up, these findings could contribute to managers and retailers so
that they have the knowledge of how to improve and distinguish themselves, by having the
best offer and situation on the retail market and in the same time keep a healthy and stable
competition between the two shopping venues.
Theoretical implications
Previous academic research within the area has been focusing on either the shopping malls or
the city centre. In this thesis, the shopping mall is being compared with a city centre and
therefore contributes to a new perspective on the Swedish market. This thesis has brought
some new findings to theory by showing that Store variety influences customer satisfaction in

57
the city centres as well as in the shopping malls. It also showed that Convenience in the city
centre influences customer satisfaction and that the Social aspect influences customer
satisfaction in the shopping malls. The comparison of means between the two shopping
venues, gave the result that both shopping venues, city centre and shopping mall, are very
similarly rated by consumers, and this for each of the following aspect: service quality,
atmosphere and store variety.
7.3 Limitations
Convenience sampling will be used; therefore the authors will not have total control on the
characteristics of respondents to the study. Thus, the research is trusted on the spread of the
questionnaire through the snowball sampling. This method of sampling was the only way to
get access to residents of the three municipalities, without the need to visit respective location,
which had not been possible within the time limit for this research. Another limit of this
research was that most respondents, 69,3% of them to be precise, who answered the
questionnaire turned out to be students. This limits the possibility of generalising the result to
a broad level.
7.4 Suggestions for future research
In this thesis, most of the respondents were students, thus it would be interesting for further
research to investigate a more representative sample of the Swedish population. The results
may be different from the ones of this thesis, and in this case, they may give a more general
view of the perceived performance of shopping venues. The majority of the participants in
this survey turned out to be between 18 to 34 years old, so it could be interesting to
investigate it further, by evaluating a possible difference between the needs and perceptions of
different age groups. This could add another dimension, which could give further managerial
implications on how to attract customers within other age cohorts. A final and interesting idea
for further research would be to investigate the same purpose, but with another method for
collecting data. The quantitative method could be expanded with a qualitative method,
through interviews with open-ended questions, in order to get a deeper understanding of
customer’s perception.
58
8 References list
Anselmsson, J. (2006). Sources of customer satisfaction with shopping malls: A comparative
Study on different customer segments. The International review of retail distribution and
consumer research, 16(1),115-138.
Arnold, M. J., and Reynolds, K. E. (2003). Hedonic shopping motivations. Journal of
Retailing, 79(2), 77-95.
Babin, B. J., Darden, W. R., and Griffin, M. (1994). Work and/or fun: Measuring hedonic and
utilitarian shopping value. Journal of Consumer Research, 20(4), 644–656.
Backman, Y., Gardelli, T., Gardelli, V. and Persson, A. (2012). Vetenskapliga tankeverktyg -
till grund för akademiska studier. Lund: Studentlitteratur AB. Translation: Scientific thinking
tools - the basis for academic study.
Baker, J., Parasuraman, A., Grewal, D. and Voss, G. B. (2002). The Influence of Multiple
Store Environment Cues on Perceived Merchandise Value and Patronage Intentions. Journal
of Marketing, 66(2), 120-141.
Bettman, J. R., Luce M. F. and Payne J. W. (1998). Constructive Consumer Choice Processes.
Journal of Consumer Research, 25(3), 187-217.
Bitner, M. J. (1992). Servicescapes: The Impact of Physical Surroundings on Customers and
Employees. Journal of Marketing, 56(2), 57-71.
Björklund, M. and Paulsson, U. (2003). Seminarieboken – att skriva, presentera och
opponera. 10th edition. Lund: Studentlitteratur AB. Translation: The seminarbook - writing,
presenting and act as opponent.
Bohusläningen. (2013). Väck en stad som somnat innan det är för sent. Bohusläningen,
[online] 22th June 2013, updated 27th June 2013. Available at:
<http://bohuslaningen.se/nyheter/uddevalla/1.2213392-vack-en-stad-som- somnat-innan-det-
ar-for-sent > Translated: Wake a town that has fallen asleep before it's too late. (Accessed 5
March 2014).
Bolton, R. N. and Drew, J. H. (1991). A multistage model of consumer’s assessments of
service quality and value. Journal of Consumer Research, 17(4), 375-384.
Broekemier, G., Marquardt, R. and Gentry, J. W. (2008). An Exploration of happy/sad and
liked/disliked music effects on shopping intentions in a women’s clothing store service
setting. Journal of Service Marketing, 22(1), 59-67.
Brown, S. (1992). Tenant Mix, Tenant Placement and Shopper Behaviour in a Planned
Shopping Centre. Service Industries Journal, 12(3), 384-403.
Bryman, A. and Bell, E. (2013). Företagsekonomiska forskningsmetoder. 2nd
edition.
Stockholm : Liber AB. Translation : Business Research Methods

59
Bäckström, K. (2011). Shopping as leisure: An exploration of mainfoldness and dynamics in
consumers shopping experiences. Journal of Retailing and Consumer Services, 18(3), 200-
209.
Chebat, J-C. and Michon, R. (2003). Impact of ambient odors on mall shoppers' emotions,
cognition, and spending: A test of competitive causal theories. Journal of Business Research,
56(7), 529.
Christensen, L., Engdahl, N., Grääs, L. and Haglund, L. (2010). Marknadsundersökning en
handbok. 3th edition. Lund: Studentlitteratur AB. Translation: Market Research a handbook.
Clopton, S., Stoddard, J. and Clay, J. (2001). Salesperson characteristics affecting consumer
complaint responses. Journal of Consumer Behaviour, 1(2), 124.
Creswell, J. W. (2014). Research design: qualitative, quantitative, and mixed methods
approaches. 4th edition. Los Angeles: SAGE Publications Inc.
Dagens Nyheter. (2013). Köpcentret har blivit det nya vardagsrummet. Dagens nyheter,
[online] 11th November 2013. Available at:
<http://www.dn.se/ekonomi/kopcentret-har-blivit-det-nya- vardagsrummet/ (Accessed 2
March 2014). Translated: The shopping mall has become the new living room.
Davis, L. and Hodges, N. (2012). Consumer shopping value: An investigation of shopping
trip value, in-store shopping value and retail format. Journal of Retailing and Consumer
Services, 19(2), 229-236.
De Nisco, A., Riviezzo, A. and Napolitano, M. A. (2008). The role of stakeholders in town
centre management: guidelines for identification and analysis. Journal of Place Management
and Development, 1(2), 166-176.
De Nisco, A. and Warnaby, G. (2013). Shopping in downtown The effect of urban
environment on service quality perception and behavioural intentions. International Journal
of Retail & Distribution Management, 41(9), 654-670.
Dennis, C., Newman, A. and Marsland, D. (2005). Objects of Desire: Consumer Behaviour in
Shopping Centre Choices. New York: Palgrave MacMillan.
Feinberg, R. A., Meoli, J. and Rummel, A. (1989). There’s something social happening at the
mall. Journal of business psychology, 4(1), 49-63.
Frasquet, M., Gil, I. and Molla, A. (2001). Shopping-centre selection modelling: a
segmentation approach. The International Review of Retail, Distribution and Consumer
Research, 11(1,8), 23-38.
Giacoma-Claire, G. (2013). Visual Merchandising: Mirror and soul of a point of sale. [e-
book], Italy, Creative Group - Pademo Dugnano. Available at: Google Books
<http://www.google.se/books?hl=sv&lr=&id=PxjhAgAAQBAJ&oi=fnd&pg=PT3&dq=Sales
+Window+to+Macy%E2%80%99s+Soul:+Displays+Sell+a+Season+of+Merchandise.&ots=
HRnoFuut8t&sig=WekcHEYjJKWIZUnqjAfXvKrBlv0&redir_esc=y#v=snippet&q=window
s&f=false> (Accessed 5 May 2014).

60
Gorter, C., Nijkamp, P. and Klamer, P. (2003). The attraction force of out-of-town shopping
malls: a case study on run-fun shopping in the Netherlands. Tijdschrift voor economische en
sociale geografie, 94(2), 219-229.
Grewal, D., Levy, M. and Kumar, V. (2009). Customer experience management in retailing:
an organizing framework. Journal of retailing, 85(1), 1-14.
Guy, C., M. (1998). Controlling New Retail Spaces: The Impress of Planning Policies in
Western Europe. Urban Studies, 35(5-6), 953-979.
Hackett, P. M. W. and Foxall, G. R. (1993). A Factor Analytic Study of Consumers' Location
Specific Values: A Traditional High Street and a Modern Shopping Mall. Journal of
Marketing Management, 10(1-3), 163-178.
Hair, J. F. Jr., Black, W.C., Babin, B.J., and Anderson, R.E. (2010). Multivariate Data
Analysis. 7th edition. Upper Saddle River, N.J: Pearson Education.
Hair, J. F. Jr., Wolfinbarger Celsi, M., Money, A. H., Samouel, P., and Page, M. J. (2011).
Essentials of Business Research Methods Second Edition. New York, USA: Sharpe Inc.
Hart, C., Stachow, G. and Cadogan, J. W. (2013). Conceptualising town centre image and
customer experience. Journal of Marketing Management, 29(15/16), 1753-1781.
Helgesen, Ø. (2006). Are Are Loyal Customers Profitable? Customer Satisfaction Customer
(Action) Loyalty and Customer Profitability at the Individual Level. Journal of Marketing
Management, 22(3/4), 245-266.
Herrmann, A., Zidansek, M., Sprott, D. E. and Spangenberg, E. R. (2013). The Power of
Simplicity : Processing Fluency and the Effects of Olfactory Cues on Retail Sales. Journal of
Retailing, 89(1), 33-43. 14p.
Howard, E. (2007). New shopping centres: is leisure the answer?. International Journal of
Retail & Distribution Management, 35(8), 661-672.
HUI Research. (2011). Kampen om köpkraften: Handeln i framtiden. [pdf] HUI Research.
Available at: <http://www.hui.se/statistik-rapporter/index-och-barometrar/kampen-om-
kopkraften > Translation: The fight for purchasing power: Trading in the future. (Accessed 5
March 2014).
Im, H. and Ha, S. (2011). An exploration of the cognitive-affective model of satisfaction in a
shopping context : A test of competing models. The Service Industries Journal, 31(13), 2273-
2288
Jack, E.P. and Powers, T.L. (2013). Shopping behaviour and satisfaction outcomes. Journal of
Marketing Management, 29(13/14), 1609-1630.
Jayawardhena, C. and Farrell, A. M. (2011). Effects of retail employees' behaviours on
customers' service evaluation. International Journal of Retail & Distribution Management,
39(3), 203-217.

61
Jensen, V. (2012). Ny studie i Trollhättan ska stoppa centrumdöden. Sveriges Radio, [online]
11th December 2012. Available at:
http://sverigesradio.se/sida/artikel.aspx?programid=125&artikel=5377055
Translation: Recent study in Trollhättan will stop the centre death. (Accessed 5 March 2014).
JLL. (2013). The retail market in Sweden. [pdf] Jones Slang Lasalle. Available at:
<http://www.joneslanglasalle.se/ResearchLevel1/Retail_Market_Sweden_2013_web_se.
pdf> (Accessed 15 March 2014).
Jones, M. A., Reynolds, K. E. and Arnold, M. J. (2006). Hedonic and utilitarian shopping
value: Investigating differential effects on retail outcomes. Journal of Business Research,
59(9), 974-981.
Keh, H.T., Ren, R., Hill, R.S. and Li, X. (2013). The Beautiful the Cheerful and the Helpful:
The Effects of Service Employee Attributes on Customer Satisfaction. Psychology &
Marketing, 30(3), 211-226.
Kelley, E. J. (1958). The importance of convenience in consumer purchasing. Journal of
Marketing, 23(1), 32-38.
Norrköpings Tidningar (2011). Konsten att strypa en levande stadskärna. Norrköpings
Tidningar [online] 13th April 2011. Available at:
<http://www.nt.se/ledare/default.aspx?articleid=6767946> Translated: The art of strangling a
living city centre. (Accessed 5 March 2014).
Kotler, P. (1973/74). Atmospherics as a marketing tool. Journal of retailing, 49(4), 48-64.
Kotler, P., Armstrong, G., Harker, M. and Brennan, R. (2009). Marketing an introduction. 9th
edition, Harlow: England, Pearson Education Inc. Financial Times Prentice Hall.
Léo, P-Y. and Philippe, J. (2002). Retail centres: location and consumer’s satisfaction.
Service Industries Journal, 22(1), 122-146.
Matzler, K., Faullant, R., Renzl, B. and Leiter, V. (2005). The relationship between
personality traits (extraversion and neutroticism), emotions and customer self-satisfaction.
Innovative Marketing, 1(2), 32-39.
Mattila, A., S. and Wirtz, J. (2001). Congruency of scent and music as a driver for in-store
evaluations of behavior. Journal of Retailing, 77(2), 273–289.
May, E. G. (1989). A Retail Odyssey. Journal of Retailing, 65(3), 356-367.
Mazursky, D. and Jacoby, J. (1986). Exploring the Development of Store Images. Journal of
Retailing, 62(2), 145-165.
Miller, D., Jackson, P., Thrift, N., Holbrook, B. and Rowlands, M. (2005). [e-book],
Shopping, place and identity. Taylor & Francis, Available at: Google Books.
http://books.google.se/books?id=za2AAAAAQBAJ&printsec=frontcover&hl=sv#v=onepage
&q&f=false (Accessed 2th May 2014).

62
Milliman, R. E., (1982). Using Background Music to Affect the Behavior of Supermarket
Shoppers. Journal of Marketing, 46(3), 86-91.
Morschett, D., Swoboda, B., and Foscht, T. (2005). Perception of store attributes and overall
attitude towards grocery retailers: The role of shopping motives. The International Review of
Retail, Distribution and Consumer Research, 15(4), 423-447.
Mossberg, L. (2003). Att skapa upplevelser – från OK till WOW!. Edition 1:7. Lund:
Studentlitteratur AB. Translation: To create experiences - from OK to WOW!
Myers, H., Gore, J. and Liu, K. (2008). European shopping centre developments: an industry
perspective. Journal of Place Management and Development, 1(1), 109-114.
Olsson, L., Lönn, K., Larsson, M. and Söderquist, C. (2012). Centrumdöd befaras i Säffle,
Nya Wermlands Tidningar, [online] Januari 13th 2012. Available at:
< http://www.nwt.se/asikter/debatt/article1037127.ece> Translation: City death is feared in
Säffle. (Accessed 5 March 2014).
Ozuduru, H., B., Varol, C. and Ercoskun, O., Y. (2014). Do shopping centers abate the
resilience of shopping streets? The co-existence of both shopping venues in Ankara. Turkey.
Cities, 36, 145-157.
Pallant, J. (2005). SPSS survival manual. 2nd edition. Crows Nest, Australia: Allen and
Unwin.
Peluso, A. M. (2011). Consumer Satisfaction: Advancements in Theory, Modeling, and
Empirical Findings. [e-book], Bern CHE: Peter Lang AG. (Accessed 20 May 2014).
Pratt, S. and Pratt, L. (1960). The impact of some regional shopping centres. Journal of
Marketing, 25(2), 44-50.
Schiffman, L., G. and Kanuk, L. L. (2004). Consumer behavior. 8th edition, Upper Saddle
River, New Jersey, Pearson Education Inc.
Sen, S., Block, L. G. and Chandran, S. (2002). Window displays and consumer shopping
decisions. Journal of Retailing and Consumer Services, 9(5), 277-290.
Solomon, M. R., Bamossy, G., Askegaard, S. and Hogg, M., K. (2010). Consumer behavior:
a European perspective. 4th edition. Italy, Rotolito Lambarda: Pearson education .
Svensson, E. (2010). Centrumdöden breder ut sig. Sveriges Radio, [online] 10th April 2010.
Available at: http://sverigesradio.se/sida/artikel.aspx?programid=104&artikel=3617905
Translation: The centre death spreads out. (Accessed 5 March 2014).
Sweeney, J. C., and Wyber, F. (2002). The role of cognitions and emotions in the music-
approach-avoidance behavior relationship. Journal of services marketing, 16(1), 51-69.
Tauber, E. M. (1972). Why Do People Shop?. Journal of Marketing, 36(4), 46-49.
Teller, C. (2008). Shopping streets versus shopping malls – determinants of agglomeration
format attractiveness from the consumers' point of view. The International Review of Retail,
Distribution and Consumer Research, 18(4), 381-403.

63
Teller, C. and Schnedlitz, P. (2012). Drivers of agglomeration effects in retailing: The
shopping mall tenant's perspective. Journal of Marketing Management, 28(9/10), 1043-1061.
Terblanche, N.S. and Boshoff, C. (2001). Measuring customer satisfaction with the
controllable elements of the instore shopping experience. South African Journal of Business
Management, 32(4), 11.
Thang, D. C. L. and Tan, B. L. B. (2003). Linking consumer perception to preference of retail
stores: an empirical assessment of the multi-attributes of store image. Journal of Retailing &
Consumer Services, 10(4), 193-200.
Turley, L.W. and Milliman, R.E. (2000). Atmospheric Effects on Shopping Behaviour: A
Review of the Experimental Evidence. Journal of Business Research, 49(2), 193-211.
Underhill, P. (2004). Inside the Machine. The Wilson Quarterly, 28(1), 30-41.
Velitchka D. K. and Barton A.W. (2006). When Should a Retailer Create an Exciting Store
Environment?. Journal of Marketing, 70(1), 107-118.
Wee, C. H. (1986). Shopping area image: its factor analytic structure and relationships with
shopping trips and expenditure behavior. Advances in Consumer Research, 13(1), 48-52.
Yalch, R. and Spangenberg, E. (2000). The Effects of Music in a Retail Setting on
Real and Perceived Shopping Times. Journal of business Research, 49(2), 139-147.
Yin, R. K. (2007). Fallstudier: design och genomförande. 5th edition, The United States of
America, SAGE Publications Inc. Translated: Case study research: design and methods.
Zikmund, W., Babin, B., Carr, J. and Griffin, M. (2013). Business Research Methods: Ninth
Edition. [e-book] Mason OH: Cengage Learning, Available at: Google Books
http://books.google.se/books?id=veM4gQPnWHgC&q=7-
grade+scale#v=onepage&q=sencitivity&f=false (Accessed 22 May 2014).
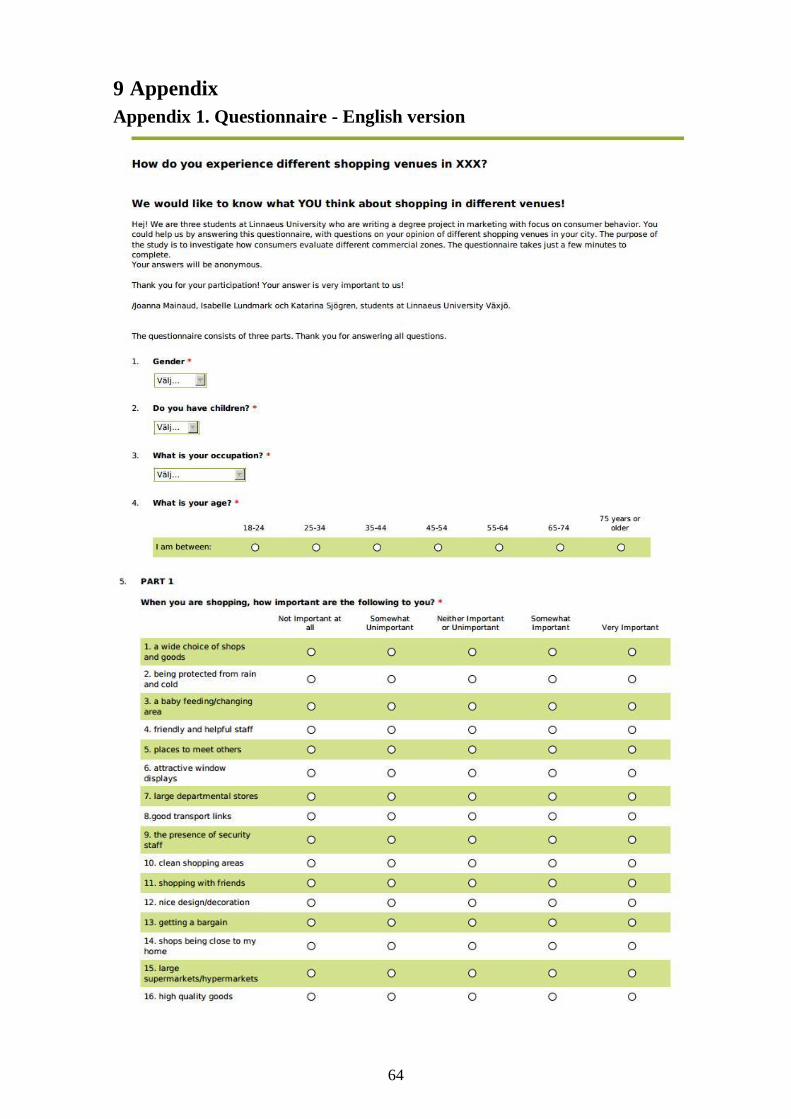
64
9 Appendix
Appendix 1. Questionnaire - English version

65

66

67
Appendix 2. Questionnaire - Swedish version

68

69

70
Appendix 3. Hypotheses testing and result – SPSS
City centre

71
Shopping mall

72
Appendix 4. Descriptive statistics – SPSS
Questionnaire part 1

73
Questionnaire part 2

74
Appendix 5. Pearson Correlation – SPSS
City centre
Shopping mall

75
Appendix 6. Paired sample t-test
Store Variety
Service Quality

76
Atmosphere
Satisfaction

77
Appendix 7. Overview of the items constituting the variables and their
SPSS Means
Variable Items Means
Shopping mall
- Store variety
(Accepted)
1. There is a wide choice of
shops and goods
2. There are large
departmental stores in
3. I can get a bargain in
5. I can find small specialist
stores in
5,33
5,32
4,73
4,09
City centre
- Store variety
(Accepted)
1. There is a wide choice of
shops and goods
2. There are large
departmental stores in
3. I can get a bargain in
4. There are large
supermarkets/hypermarkets
in
5. I can find small specialist
stores in
4,92
3,75
5,08
3,36
5,63
Shopping mall
- Social
(Accepted)
1. There are places to meet
others in
2. It is a nice place to shop
with friends/family
3. I am enjoying myself
when I go to
5,44
5,23
5,16
City centre
- Convenience
(Accepted)
1. I can stay warm and dry in
3. The distances between
shops are short in
4. I can find pedestrian zones
in
5. I can easily find the shops
I am looking for in
6. I park easily in
3,12
5,45
5,31
5,16
3,71
City centre
- Facilities
(Rejected)
1. There is a baby
feeding/changing area in
3. Security staff is present in
4. There is a place to leave
children in
5. There are places to sit
down in
6. There are available toilets
in
3,44
3,84
2,72
5,11
3,32

78
Shopping mall
- Service quality
(Rejected)
1. The staff is friendly and
helpful in
2. The shopping area is clean
in
3. I can find high quality
goods in
4. I get value for my money
in
5,20
5,99
5,37
5,01
City centre
- Service quality
(Rejected)
1. The staff is friendly and
helpful in
2. The shopping area is clean
in
3. I can find high quality
goods in
4. I get value for my money
in
5,20
5,49
5,69
5,01
Shopping mall
- Atmosphere
(Rejected)
1. The window displays are
nice in
2. The interior/exterior
design and decoration are
nice in
3. The music is pleasant in
4. It smells nicely in
4,89
5,21
4,29
4,69
City centre
- Atmosphere
(rejected)
1. The window displays are
nice in
2. The interior/exterior
design and decoration are
nice in
3. The music is pleasant in
4. It smells nicely in
5,05
5,09
4,17
4,55

79
Appendix 8. Interview
“Do you perceive that there is a positive or negative competition between the external
shopping mall X and the city centre?”
“Has the establishment of the external shopping mall affected the customer flow to
the city centre?”
“If You have experienced any problems with this, what actions do You take?“
“Do you feel that the external mall X has changed the attractiveness of X centre in
any way?”