Embed Size (px)
Citation preview
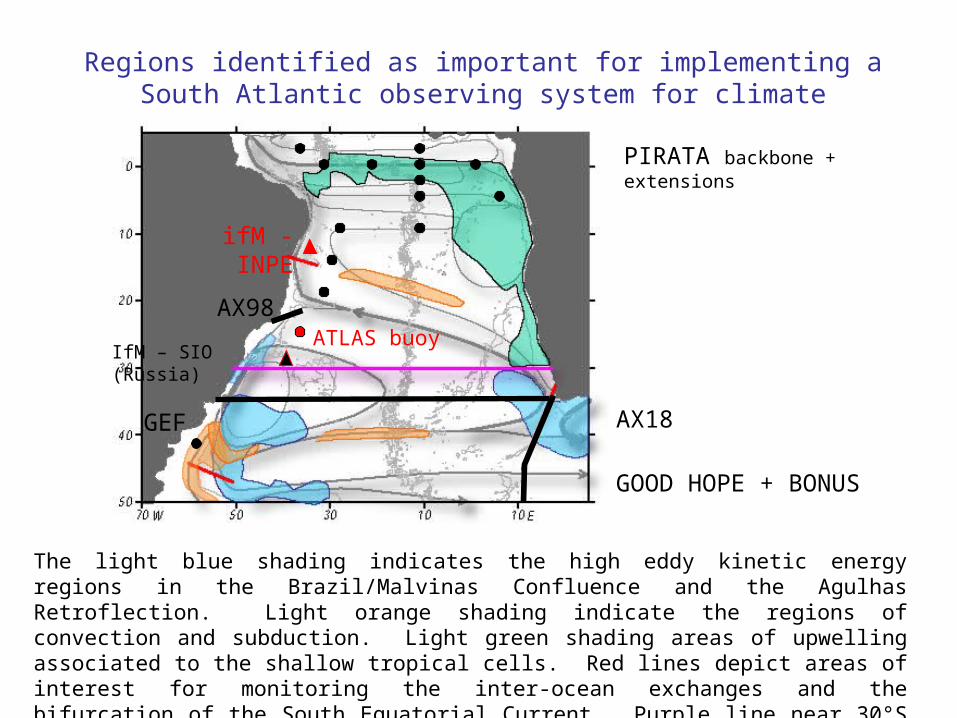
The light blue shading indicates the high eddy kinetic energy regions in the Brazil/Malvinas Confluence and the Agulhas Retroflection. Light orange shading indicate the regions of convection and subduction. Light green shading areas of upwelling associated to the shallow tropical cells. Red lines depict areas of interest for monitoring the inter-ocean exchanges and the bifurcation of the South Equatorial Current. Purple line near 30°S region for monitoring the meridional mass and heat flux
Regions identified as important for implementing a South Atlantic observing system for climate
PIRATA backbone + extensions
GOOD HOPE + BONUS
AX18
AX98ATLAS buoy
GEF
IfM – SIO (Russia)
ifM - INPE

•Recent changes in chl-a are among the largest observed (>50%, Gregg et al., 2005)
•Primary production shelf break front 1.9 to 7.8 gC m2 d-1 (Garcia et al., in preparation)
•F (CO2) = - 5.7 mmol CO2 m2 d-1 (Bianchi et al., 2005)
Primary production in the western South Atlantic

7 0
6 5
6 0
5 5
5 0
4 5
4 0
3 5
8 0 7 5 7 0 6 5 6 0 5 5 5 0 4 5 4 0
ARGAU

pCO2
-30 atm
70 65 60 55 5055
50
45
40
35
30
c d
>3>3 >1.5
<1
<1
>3
>1
0
0.5
1
1.5
2
2.5
3
3.5
5
Ocean productivity and CO2 fluxes
Chlorophyll-a FCO2
- 5.7 mmol m-2 d-1

GEF PATAGONIA

Pre-deployment set-up

TIM E
-200
-150
-100
-50
0
DE
PT
H (
m)
Feb. 4 - 00 hs. Feb. 5 - 00 hs. Feb. 6 - 00 hs.
High resolution sampling mode

Swimmers

Estimates of South Atlantic Meridional Heat Flux

Lat °S Heat Flux (PW) Method Source
32 0.16-0.68 Direct Bennett (1978)
30 0.39 Sea-air fluxes Bunker (1980)
32 0.66-0.88 Inverse Fu (1981)
30 0.69 Sea-air fluxes Hastenrath (1982)
32 0.4 Direct Bryan (1982)
30 0.38 Sea-air fluxes Hsiung (1985)
32 0.24 Inverse Rintoul (1991)
30 0.19 model Matano & Philander (1993)
30 0.56 FRAM Saunders &Thompson (1993)
37 0.45 to 0.94 Direct Saunders and King, 1995
37 0.67 FRAM Saunders and King, 1995
30 0.3 Inverse Macdonald & Wunsch (1996)
30 0.29 model Marchesiello et al. (1998)
30 -0.23 Inverse de las Heras & Schlitzer (1999)
30 0.22 Inverse McDonogh and King (2003)
32.5 0.23 Direct Talley (2003)
32.5 0.63 OCCAM Donners (2004)
37 0.28 POCM Matano & Schouten (2004)
30 0.39 ECCO Stammer, Kohl (2007)
30 0.17 ORCA25 Boening, Biastoch (2007)
30-35 0.54 XBT Garzoli and Barringer (2007)
Estimates of South Atlantic Meridional Heat Flux

Median pathways between successive oceanic sections crossed by water parcels. The colors indicate the mean depth of the transfer between two given sections. The North Atlantic overturning is defined here as the thermocline waters (in orange, red and pink) transformed into NADW (blue) in the North Atlantic sector. Numbers quantify the mass transfers between successive control sections (the Atlantic Equator, the Drake Passage, the SO section south of Australia and the Indonesian Throughflow).
Speich et al. 2007, submitted
Lagrangian reconstruction of the global Thermohaline Circulation

Lat °S Heat Flux (PW) Method Source
32 0.16-0.68 Direct Bennett (1978)
30 0.39 Sea-air fluxes Bunker (1980)
32 0.66-0.88 Inverse Fu (1981)
30 0.69 Sea-air fluxes Hastenrath (1982)
32 0.4 Direct Bryan (1982)
30 0.38 Sea-air fluxes Hsiung (1985)
32 0.24 Inverse Rintoul (1991)
30 0.19 model Matano & Philander (1993)
30 0.56 FRAM Saunders &Thompson (1993)
37 0.45 to 0.94 Direct Saunders and King, 1995
37 0.67 FRAM Saunders and King, 1995
30 0.3 Inverse Macdonald & Wunsch (1996)
30 0.29 model Marchesiello et al. (1998)
30 -0.23 Inverse de las Heras & Schlitzer (1999)
30 0.22 Inverse McDonogh and King (2003)
32.5 0.23 Direct Talley (2003)
32.5 0.63 OCCAM Donners (2004)
37 0.28 POCM Matano & Schouten (2004)
30 0.39 ECCO Stammer, Kohl (2007)
30 0.17 ORCA25 Boening, Biastoch (2007)
30-35 0.54 XBT Garzoli and Barringer (2007)
Estimates of South Atlantic Meridional Heat Flux

High-resolution XBT line AX18 (14 sections)
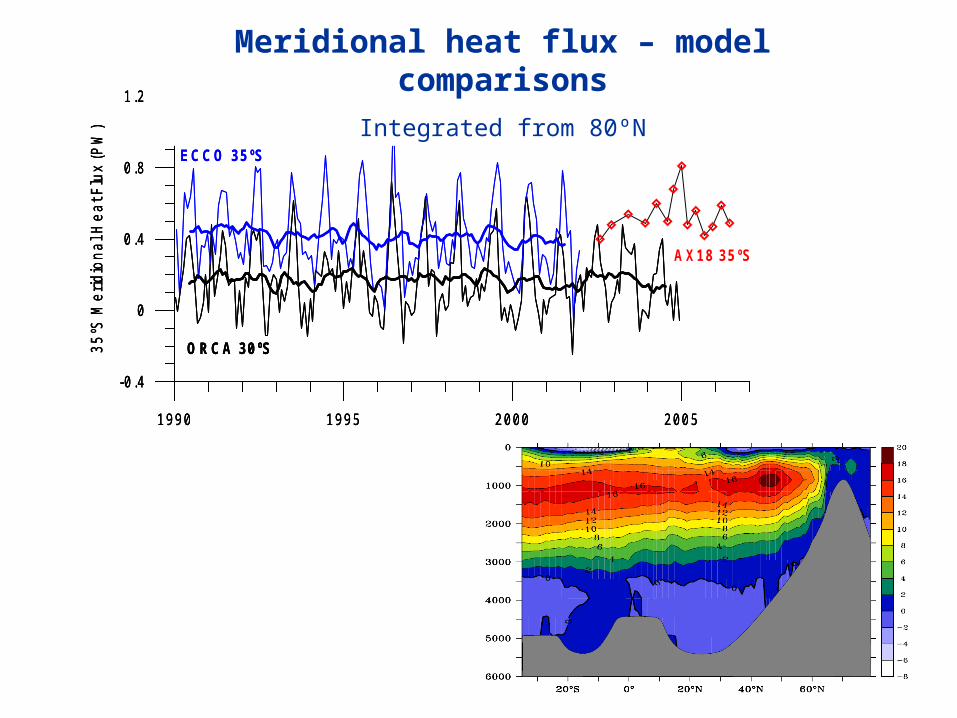
Garzoli & Baringer 2007, submitted

Meridional heat flux – meridional structure
Integrated from 80ºN
Garzoli & Baringer 2007, submitted
1990 1995 2000 2005
-0.4
0
0.4
0.8
1.23
5ºS
Me
rid
ion
al H
ea
t Flu
x (P
W)
ORCA 30ºS
1990 1995 2000 2005
-0.4
0
0.4
0.8
1.23
5ºS
Me
rid
ion
al H
ea
t Flu
x (P
W)
ECCO 35ºS
ORCA 30ºS
1990 1995 2000 2005
-0.4
0
0.4
0.8
1.23
5ºS
Me
rid
ion
al H
ea
t Flu
x (P
W)
ECCO 35ºS
ORCA 30ºS
AX18 35ºS
Meridional heat flux – model comparisons
Integrated from 80ºN

Structure of meridional flow –
(some) error sources
Courtesy from Baher & Marotzke, in prep.
“observed” thermal wind

UPCOMING WORKSHOP
A monitoring system for heat and mass transports in the South Atlantic as a component of the Meridional Overturning Circulation
Estancia San Ceferino, Buenos Aires Argentina, May 8 - 10, 2007
To establish the feasibility of and to foster collaborations for a monitoring system for meridional heat and mass transports in the South Atlantic and inter-ocean exchanges as a component of the Meridional Overturning Circulation.
25 participants from:
ArgentinaBrazilFrance GermanyRussia
South AfricaUKUruguayUSA