Embed Size (px)
Citation preview
THE LIFE-CYCLE OF CHLORINE:PART I, II, III & IV
by
RU. AYRES*and
L W. AYRES**
96/33/EPS(Part I and II are revisedversions of 96/08/EPS)
This working paper was published in the context of INSEAD's Centre for the Management of EnvironmentalResources, an R&D partnership sponsored by Ciba-Geigy, Danfoss, Otto Group and Royal Dutch/Shell andSandoz AG.
* Sandoz Professor of Management and the Environment at INSEAD, Boulevard de Constance, 77305Fontainebleau Cedex, France.
** Research Associate, at INSEAD, Boulevard de Constance, Fontainebleau 77305 Cede; France.
A working paper in the INSEAD Working Paper Series is intended as a means whereby a faculty researcher'sthoughts and findings may be communicated to interested readers. The paper should be consideredpreliminary in nature and may require revision.
Printed at INSEAD, Fontainebleau, France.
THE LIFE-CYCLE OF CHLORINE: PART 11
Robert U. AyresINSEAD, Fontainebleau, France
January 1996
Abstract
Chlorine is an important industrial chemical. Not only is it a component of manyimportant products, it is also needed for many chemical manufacturing processes, even whereit does not appear in the final product. But a number of chlorine chemicals, especially organo-chlorines, are toxic, carcinogenic, teratogenic or otherwise disturbing (or potentiallydisturbing) to the environment. For this reason, some environmentalists — notablyGreenpeace — have seriously proposed and lobbied for a ban, not just on some products, buton all uses of elemental chlorine itself. The chemical industry is taking this threat seriously,and mounting a vigorous defense. But the debate so far is not illuminating the issueseffectively, because both sides are selectively using questionable and unverifiable data.
The fact that there are scientific uncertainties is not really the problem. The problem isthat data in the public domain and accessible to environmentalists and even regulatoryauthorities is of very poor quality. Thanks to industry secrecy, much crucial information isunavailable and some of what is available is misleading or wrong. The purpose of this paper,and the three that follow, is to elucidate the information requirements for an adequate life-cycle analysis of chlorine and its uses. The present paper deals with electrolytic chlorineproduction and the chlorine-mercury connection. The next paper deals with conversionprocesses and losses and further chemical industry uses of chlorine. The third paper deals withmajor end uses of chlorine and chlorine chemicals. The fourth and final paper considers thesubset of persistent organochlorine pollutants (POPs) that have caused most concern toenvironmentalists.
Robert U. Ayres, The Life Cycle of Chlorine; Part I
File MERCHLOR.1 as printed on June 14, 1996 Page 2
1. Background
Chlorine is a chemically active element that is invariably combined with other elements,usually sodium or calcium, but occasionally potassium and magnesium. It's major compoundin the environment is sodium chloride (NaC1) or ordinary table salt, which constitutes roughly3.7 %, by weight, of seawater. There are large underground deposits of evaporite salt left overfrom earlier seas that have since dried up. However, apart from this one mineral, chlorine israre in the earth's crust. It's role in biochemistry is equally limited. While salt is a necessarycomponent of every diet, and chloride ions constantly circulate through the bloodstream, andthrough every cell, its biological role is limited. It appears to be mainly that of maintainingthe internal osmotic pressure of cells at an equilibrium level. It is also, of course, the sourceof hydrochloric acid released in the stomach to assist with digestion.
There are several hundred organo-chlorine molecules of natural origin, mostly producedin minute quantities by marine organisms. The most important of these is chloromethane,which seems to be produced at the rate of about 4 million t/y [SRC 1989]. However, with one(known) exception -- a tree frog -- organo-chlorines are not found in the tissues of vertebratesor any terrestrial animals [Neidleman & Geigert 1986; Vallentyne 1989]. Hence terrestrialanimals do not metabolize them or detoxify them efficiently, due to lack of evolutionary"experience".
Also, a number of organo-chlorines are biologically active in the sense that they arecapable of interfering with certain normal biochemical functions. In other words, organo-chlorines may be toxic, carcinogenic, teratogenic or even mutagenic. In some cases thesecharacteristics were deliberately exploited, as in the development of a whole family ofchlorinated pesticides (starting with DDT) and herbicides (such as 2-4 D) during the 1950sand 1960s. In other cases, the ecotoxic or carcinogenic effects turned up by accident, as inthe case of PCBs.
The exact mechanisms whereby these biological effects occur are not yet understood, forthe most part. (If they were, it would be much easier to design both chemical agents forparticular purposes, and also to design effective antidotes or antigens). All that can be saidat present, with some confidence, is that the biological activity of organo-chlorine moleculesis related to their physical structures (i.e. shapes). This follows from the fact that organo-chlorines differing only by the exact placement of a chlorine atom on (say) a benzene ringcan have totally different biological effects. For instance, only one of the isomers of benzenehexachloride (BHC) is biologically active; the rest are essentially inert. (The active isomer,in purified form, is the insecticide lindane). Similarly, only about 10% of the numerouscongeners of TCDD ("dioxin") are known to be toxic, and only one is really dangerous,namely the 2,3,7,8 TCDD.
Moreover, since some organo-chlorines are not actively metabolized, but simply stored(mainly in fatty tissue) and passed on, about 25 of them are bio-accumulated through the foodchain. Thus, what would be an insignificant concentration in a simple organism (such as amosquito larva), may become a lethal concentration in a top predator three steps up the foodchain. This is why eagles, ospreys, falcons and game fish were the main victims of DDT andother chlorinated pesticides, even though they were never its targets. Much the same sort ofproblem has been identified for other classes of organo-chlorines, notable the PCBs.
It is not only the organo-chlorines that are manufactured for specific biocidal (or other)purposes that have been implicated in undesirable side-effects. On the contrary, it may be theunexpected by-products of chemical reactions involving chlorine, from pulp bleaching toincineration (and accidental fires) that cause the greatest public concern — justified or not.The chlorinated dioxins (TCDDs) and dibenzo-furans (TCDFs) are among the candidate
Robert U. Ayres, The Life Cycle of Chlorine; Pan I
File MERCHLOR.I as printed on June 14, 1996 Page 3
villains. Apart from its biological activity, chlorine has been implicated in the destruction ofstratospheric ozone. The details of the chemical mechanism involved need not detain us here.It is only of interest that chlorine is only transported into the stratosphere in the first placeby virtue of the great stability (i.e. persistence) of chlorofluorocarbons (CFCs) in the presenceof atmospheric oxygen and OR radicals. Whereas most organic chemicals are rapidlyoxidized, this is not true of the CFCs. These are compounds used widely as refrigerants, foamblowing agents and solvents (and formerly as aerosol propellants) precisely because of thisstability.
There are environmental/health arguments against the use of chlorine for bleaching paperpulp, and against the dissipative use of chlorinated pesticides, chloro-carbon solvents andchloro-fluorocarbons. Because of these problems the industrial use of chlorine itself is beingchallenged, especially by the environmental organization Greenpeace [Thornton 1991, 1993].However, strong support for reducing the use of chlorine has also come from the International(US-Canadian) Joint Commission. In its Sixth Biennial Report, the Joint Commissionrecommended that "the use of chlorine and its compounds should be avoided in themanufacturing process" [IJC 1993].
For obscure reasons, the Greenpeace campaign against chlorine has chosen as its primarytarget the dominant single use of chlorine, namely in the plastic PVC. In response to publicconcern, the Dutch Parliament requested a strategic study of the uses of chlorine, which wascarried out by the laboratory TNO [Tukker et al 1995]. The chlorine industry carried out itsown study of PVC [ECM 1994]. Both studies concluded that PVC itself as well as itsproduction chain offer minimal hazard to the public. The Swedish government is currentlyundertaking starting a similar study, with the cooperation of the chlorine and PVC producerNorsk Hydro, also focussed on PVC.
The chlorine industry, feeling threatened, is mounting an active defense [Amato 1993].Through its industry associations, it has also funded a monumental study of the toxic effectsof chlorine chemicals, by a panel of independent toxicologists. This study concluded that "thealarms about chlorine containing compounds are unwarranted" and that "the mere presenceof chlorine in a molecule does not necessarily confer unique toxic properties or bioaccumulat-ive potential".' However, the panels conclusions are admittedly based, to a large extent, onthe low exposure probabilities and low concentrations of toxic or carcinogenic chlorinatedcompounds in most environments, rather than on the intrinsic harmlessness of the chemicals.
It is indisputable that alternatives can be found to most of the well-known major uses ofchlorine. But there are at least 11,000 chlorinated compounds in commerce, some of whichmight be very hard to replace [Tukker et al 1995].2 Approximately 60% of the value addedin the chemical industry involves chlorinated chemicals at some stage (although there are
1 Quotes are from the Editorial of a special issue of the journal Regulatory Toxicologyand Pharmacology (Frederick Coulston and Albert Kolbye, editors), Vol 20, (1), Aug. 1994Part 2 of 2. The contents of the issue consists of a report entitled "Interpretive Review of thePotential Adverse Effects of Chlorinated Organic Chemicals on Human Health and theEnvironment". The report was prepared by CanTox Inc., with the assistance of Robert F.Willes PhD, under the direction of an expert panel chaired by Ian Munro, President ofCanTox Inc.
2 Only 1200 or so are produced in "significant" quantities (over 10 t/y), according toEurochlor. There is considerable ambiguity in such figures, partly because some chemicalproducts are actually comprised of mistures of a number of different molecules, isomers orcongeners. This was notoriously true of PCBs, for instance.
Robert U. Ayres, The Life Cycle of Chlorine; Part I
File MERCHLORJ as printed on June 14, 1996 Page 4
many cases where the chlorine is not incorporated into the final products). For example, inwestern Europe chlorine is used for treatment of 98% of the drinking water, and is used inthe manufacturing process for 96% of crop protection chemicals, 85% of health care productsand 55% of all chemical products [Eurochlor 1995].
It is by no means clear how costly the substitutes would be and whether the costs wouldbe justified by the presumed benefits. A total ban on chlorine use would certainly bedisruptive in the short term and probably excessively costly in relation to the benefitsachieved [MIT 1993]. One US study by Charles River Associates, commissioned by theChlorine Chemistry Council and the Chemical Manufacturers Association, estimated that aban on chlorine would cost the economy $90 billion per year [Swift 1995]. It would beadvisable to undertake a much more complete and sophisticated life-cycle analysis of thechlorine industry than anything yet attempted along these lines.
To permit such a study, however, the chemical industry will have to cooperate by makingavailable much more data than it has traditionally been willing to release to the public. Thechemical industry consistently refuses to publish production, consumption, trade and stockpiledata even for extremely toxic compounds that have long been banned (such as DDT andPCBs). The extent of the data gaps and difficulties is clearly indicated in this paper and thosethat follow. The argument that such information must remain proprietary for "competitivereasons" rings hollow. The more likely explanation is that the industry prefers to keep thenumbers hidden for fear of embarrassment. It seems very unlikely that the public will bepersuaded to support the industry position on the basis of technical and economic argumentsthat depend entirely on "proprietary" data that cannot be released for scrutiny. In the presentcircumstances, Greenpeace may be able to make a persuasive case to the public that theindustry must have something nasty to hide.
The only way for industry to take and hold the "moral high ground" is to release thedata.3 Without such data the requisite analysis cannot be carried out and intelligent publicpolicy cannot be made.
2. Production and consumption of chlorine
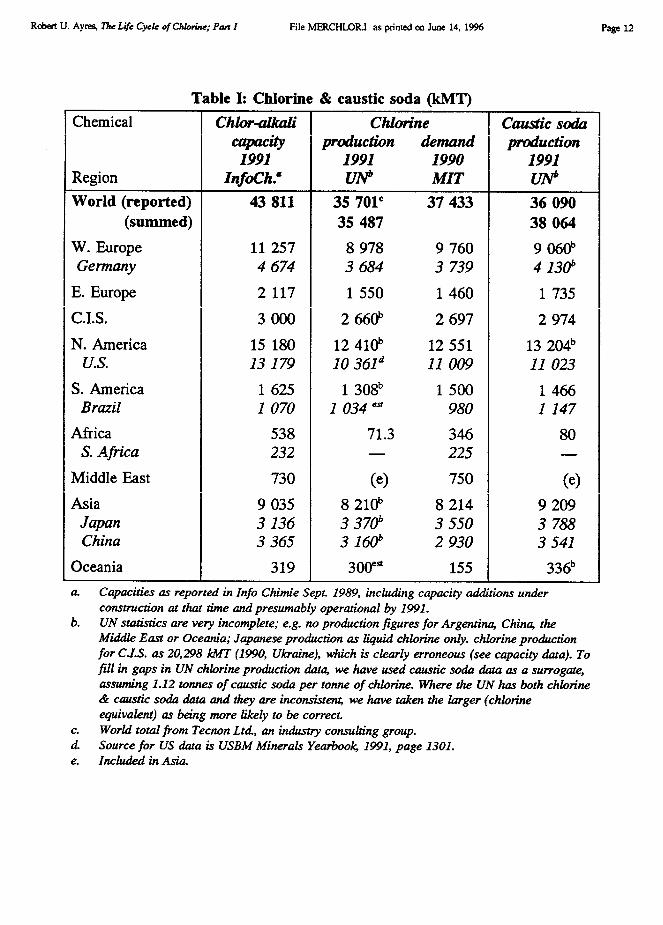
Chlorine and caustic soda (sodium hydroxide) are usually co-products of the electrolysisof sodium chloride, mainly in the form of brine made by solution mining of underground salt(halite) deposits? World production and consumption of chlorine in 1991 was 35.701 MMT,of which the U.S. accounted for 29% and western Europe 25% [Tecnon 1993]. A detailedbreakdown of capacity, production and demand by region is given in Table I. Although thetable does not show it, both production and consumption have peaked and begun to declinein Europe and North America. However demand is rapidly growing in other parts of theworld, especially Latin America and Asia.
Given the focus of this paper on life cycle analysis, some comments on the data in the
3 In fairness, it must be acknowledged that, after the first drafts of these four papers werecompleted, copies were sent to several reviewers including the chlorine industry associationEurochlor. In response, Eurochlor has provided me with extensive data on the production,trade and use of several categories of chemicals for which published data in Europe is scarceor non-existent. Some of this data has been provided in reports marked "confidential" or"restricted". Nevertheless, it has been provided without restriction on my use of it, and I amgrateful.
Robert U. Ayres, The Life Cycle of Chlorine,- Part I
File MERCHLOR.I as printed on June 14, 1996 Page 5
table are appropriate. It will be noted that the only officially published government data thatis international in scope is the UN Industrial Statistics. This source is also by far the leastreliable, since it is assembled by UN-crats from data provided by national statistical officesof member countries which the UN statisticians are not permitted (for political reasons) tochallenge. It is well-known among practitioners that most centrally planned countriessubmitted figures from 5–year plans, rather than actual data. Many other countries simply didnot bother to provide data. Because of political sensitivities, some egregious errors were—and still are — promulgated without comment. In particular, the UN reported no chlorineproduction for a number of producing countries, including Argentina, Australia, China andTaiwan. For a number of other countries the most recent data was from earlier years, althoughthe UN statisticians did extrapolate regional totals. On the other hand, the UN reportedproduction in the former USSR, attributed entirely to the Ukraine, ranging from 26,697 kMTin 1982 to 20,298 kMT in 1990 (the last year reported). These absurd figures were duly addedto the other regional totals, leading to equally absurd global totals to which the Ukrainecontributed over half in some years!
Fortunately, data on production capacity is also available from different sources (theindustry magazine Informations Chimie, published in Paris), which confirm that the actualproduction capacity of the former USSR is only about 3000 kMT. Moreover, the UN itselfindependently publishes data on the output of caustic soda (NaOH), which is a co-product ofchlorine. The output of caustic soda is essentially proportional to that of chlorine, in the ratioof their respective molecular weights (40:35.5 = 1.12). Thus 1.12 tonnes of (100%) causticsoda are produced by electrolysis per tonne of chlorine. 3 While 1991 data are not available,UN reports caustic soda production in the former USSR for 1990 as 2974 kMT (of whichonly 443 kMT was from the Ukraine). This would correspond to chlorine output of 2660kMT, approximately. The latter is consistent both with capacity estimates and with demandestimates reported by MIT [MIT 1993]. In other cases where chlorine production data wasunavailable or questionable, I used caustic soda production data to estimate it. In one case(Australia), lacking other information, I assumed near-capacity production (300 kMT). Theresulting world total of 36,109 kMT for 1991 is very close to the survey-based estimate(35,701 kMT) by Tecnon Ltd, a major industry consulting group [Tecnon 1993]. Thisremarkable coincidence tends to confirm the value of consistently using materials balancemethodology for verification of questionable data points.
3. Production processes for chlorine
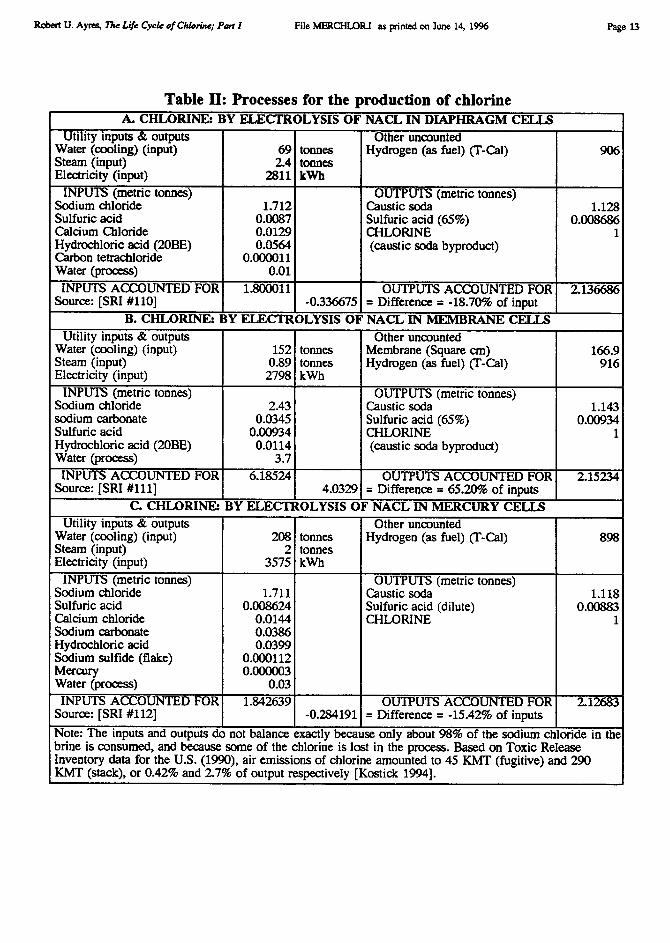
Primary chlorine is almost entirely (94% in Europe) produced by electrolysis of sodiumchloride salt (brine), with sodium hydroxide (caustic soda) as a co-product. Minor amountsare produced from potassium salts and in the production of sodium or potassium metal. Thereare three important variants of the basic electrolytic process, viz. the mercury cell, thediaphragm cell and the membrane cell. The three types of cell are summarized in terms ofinputs and outputs in Table II. In the decades since World War II, perhaps the largestconsumptive use of mercury has been in the manufacture of chlorine and sodium hydroxideby electrolysis. This technology was commercialized as early as 1894, with HamiltonCastner's "rocking cell", which was the dominant electrolytic method in the first quarter ofthis century. Most new chlor-alkali plants constructed in the 1920s, 1930s and 1940s utilizeddiaphragm cells, rather than mercury cells.
The economics of the mercury cell changed dramatically with the advent of the DeNoracell, developed in Italy and licensed by Monsanto shortly after World War II. Olin Mathieson
Robert U. Ayres, The Life Cycle of Chlorine; Part I
File MERCHLOR.I as printed on June 14, 1996 Page 6
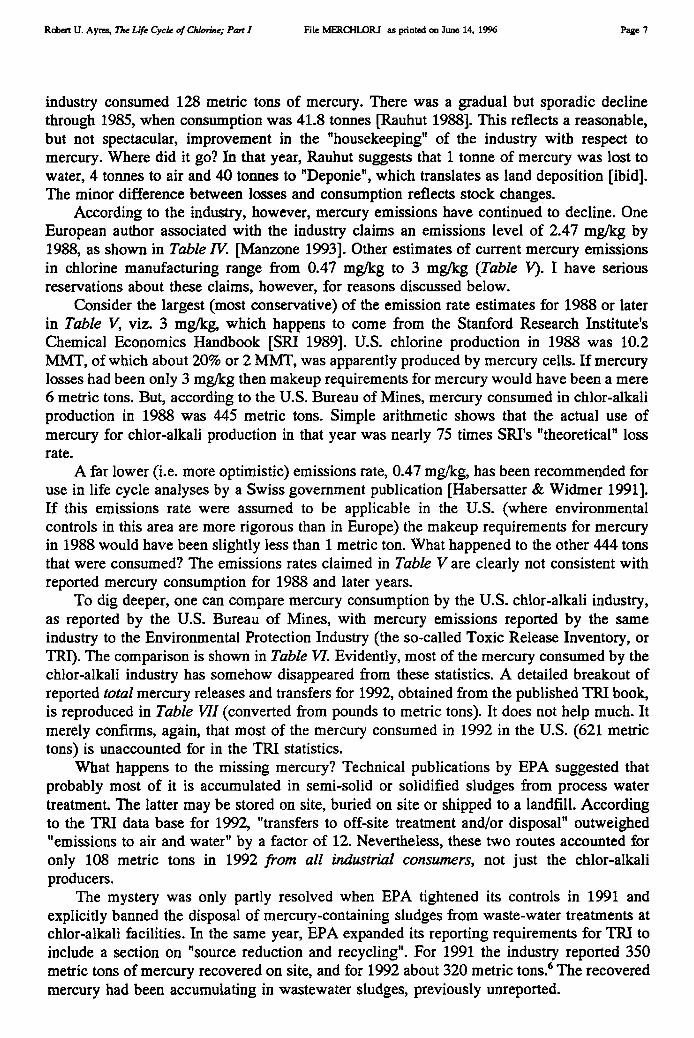
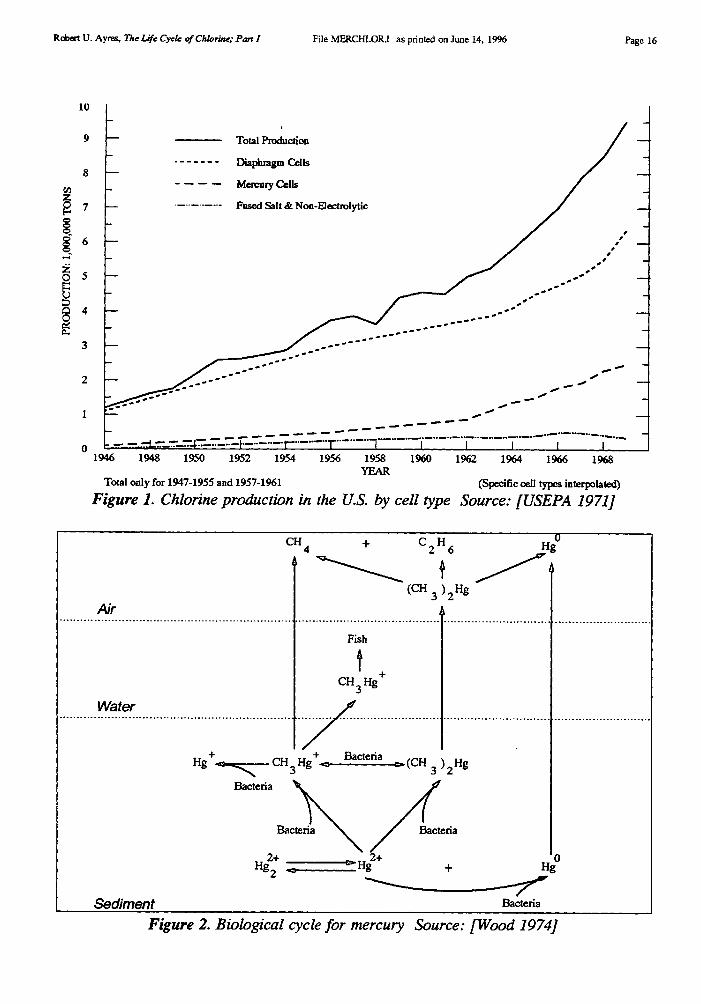
Chemical Company also developed a new mercury cell design. Chlorine production since the1940s has risen enormously, spurred by burgeoning demand for chlorinated pesticides (likeDDT, aldrin, dieldrin, endrin and chlordane), herbicides (like 2-4-D and its relatives), andplastics, notably PVC. Roughly half of the new capacity added in the U.S. in the 1950s and1960s utilized mercury cells (see Figure 1).
By 1970 there were 25 mercury cell chlor-alkali plants in the U.S., producing 2.5 milliontons (2.2 MMT) of chlorine per annum, or about 28% of U.S. production [USEPA 1971].Production of chlorine in the U.S. rose very rapidly from 1946 through 1970 or so. Since theearly 1970s has remained fairly constant, although the use of the mercury cell has declinedslowly, to about 17% in 1991. In fact, whereas U.S. production is dominated by thediaphragm cell, European production was, and still is, primarily via the mercury cell (64%of 1994 output). Of the remainder, 24% was based on the diaphragm cell and 11% on thenewer membrane cell.
The mercury cell was, for many years, a significant source of environmental pollution,since some mercury is lost in the process. Inorganic mercury can be metabolized to highlytoxic methyl-mercury (CH3)2Hg by anaerobic bacteria and this substance is bio-accumulatedin the marine food chain. It can reach dangerous concentrations in the tissues of fish or fish-eating sea-birds.4 The biological mercury cycle is summarized in Figure 2.
Because of the Minimata experience, the mercury cell was phased out altogether in Japanand to some extent in the U.S., since the early 1970s. In 1970 there were 25 mercury cellplants in the U.S. The number had dropped to 19 in 1989 and 16 in 1993. There are at least60 mercury cell plants in Europe as of 1994. The European industry has committed itself tobuild no new mercury cells in the future, however.
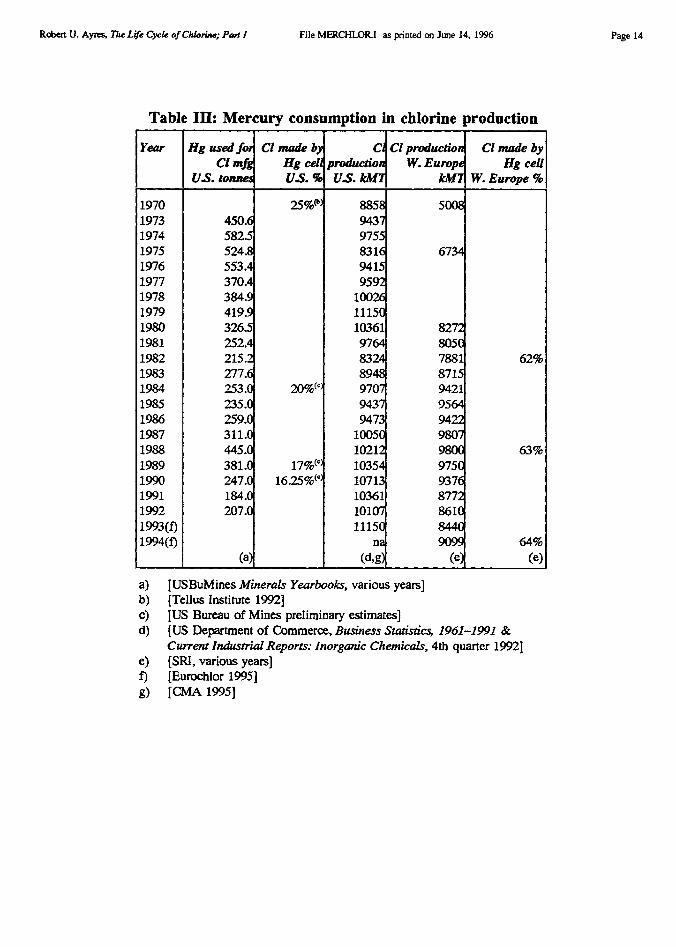
Historical data on chlorine production by cell type in the U.S. was shown in Figure 1.Data on U.S. use of mercury for this process is shown in Table III, taken from publicationsof the U.S. Bureau of Mines. The chlor-alkali industry was the largest domestic user ofmercury in the years 1989-90, despite the fact that only 17% of U.S. production used themercury cell. An obvious implication is that mercury consumption by the European chlor-alkali industry must be considerably higher than U.S. consumption. Unfortunately,consumption data is not available in published statistics for Europe or any other country.(However, see Addendum).
At first glance, it would appear that mercury consumption for chlorine production shouldbe equal to mercury emissions to the environment. However, it is not so simple. Before thehazardous nature of mercury emissions was fully recognized, actual emissions from themercury cell averaged 300 mg/kg of product, or 3 kg/tonne. In response to tighter regulationand better housekeeping, the emissions rate had declined to 150 mg/kg, or 1.5 kg/tonne by1971 [ibid]. A 1974 EPA publication uses the same figure [Martin 1974]. This figure wasadopted by the World Health Organization (WHO) for its 1982 guidelines for rapidassessment of sources of air, water and land pollution [WHO 1982].5
As a cross check, one can compare these rates with reported mercury consumption. Inthe pre-regulation days of 1970, the loss rate for mercury cells was acknowledged to be 300mg/kg. Given a production level of 2.2 MMT via the mercury cell, this loss rate would haverequired a mercury replacement of 660 metric tons. Actual reported mercury consumption bythe chlor-alkali industry in that year was slightly less, viz. 517 metric tons [USBuMines1975], which implies a loss rate of 235 mg/kg. It is not unreasonable to assume that the levelof 150 mg/kg taken from the 1974 EPA document (and assumed by the WHO) was realistic.The consumption and emissions figures for 1970 and 1974 are therefore roughly consistentwith each other.
The German data (such as it is) tell a similar story. In 1973 the German chlor-alkali
Robert U. Ayres, The Life Cycle of Chlorine; Part I
File MERCHLORJ as printed on June 14, 1996 Page 7
industry consumed 128 metric tons of mercury. There was a gradual but sporadic declinethrough 1985, when consumption was 41.8 tonnes [Rauhut 1988]. This reflects a reasonable,but not spectacular, improvement in the "housekeeping" of the industry with respect tomercury. Where did it go? In that year, Rauhut suggests that 1 tonne of mercury was lost towater, 4 tonnes to air and 40 tonnes to "Deponie", which translates as land deposition [ibid].The minor difference between losses and consumption reflects stock changes.
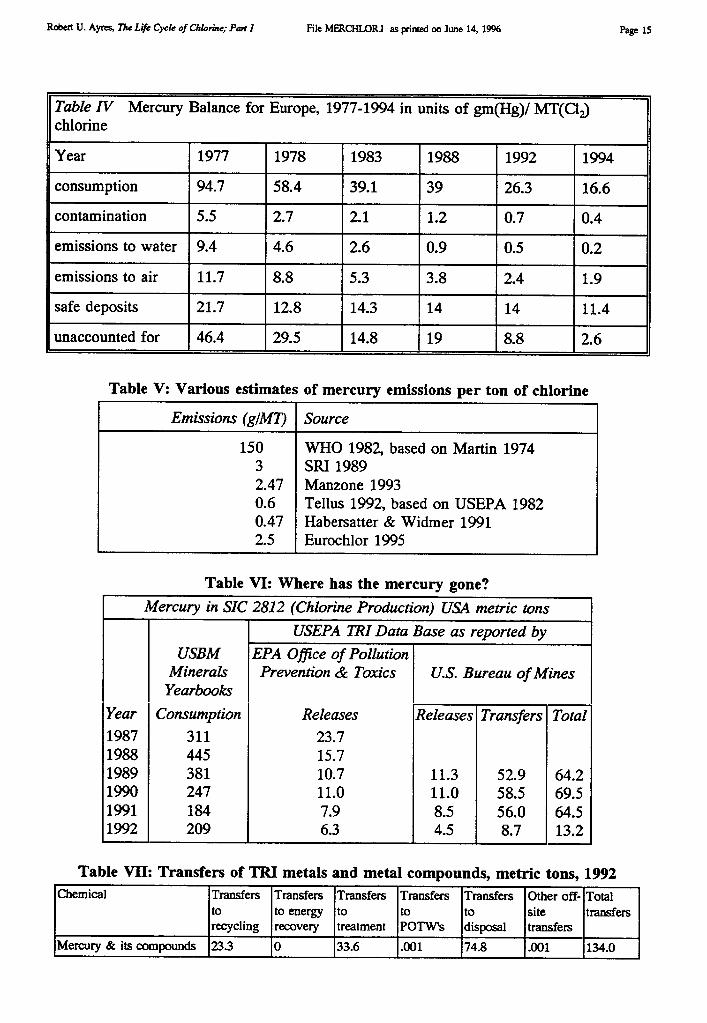
According to the industry, however, mercury emissions have continued to decline. OneEuropean author associated with the industry claims an emissions level of 2.47 mg/kg by1988, as shown in Table IV. [Manzone 1993]. Other estimates of current mercury emissionsin chlorine manufacturing range from 0.47 mg/kg to 3 mg/kg (Table V). I have seriousreservations about these claims, however, for reasons discussed below.
Consider the largest (most conservative) of the emission rate estimates for 1988 or laterin Table V, viz. 3 mg/kg, which happens to come from the Stanford Research Institute'sChemical Economics Handbook [SRI 1989]. U.S. chlorine production in 1988 was 10.2MMT, of which about 20% or 2 MMT, was apparently produced by mercury cells. If mercurylosses had been only 3 mg/kg then makeup requirements for mercury would have been a mere6 metric tons. But, according to the U.S. Bureau of Mines, mercury consumed in chlor-alkaliproduction in 1988 was 445 metric tons. Simple arithmetic shows that the actual use ofmercury for chlor-alkali production in that year was nearly 75 times SRI's "theoretical" lossrate.
A far lower (i.e. more optimistic) emissions rate, 0.47 mg/kg, has been recommended foruse in life cycle analyses by a Swiss government publication [Habersatter & Widmer 1991].If this emissions rate were assumed to be applicable in the U.S. (where environmentalcontrols in this area are more rigorous than in Europe) the makeup requirements for mercuryin 1988 would have been slightly less than 1 metric ton. What happened to the other 444 tonsthat were consumed? The emissions rates claimed in Table V are clearly not consistent withreported mercury consumption for 1988 and later years.
To dig deeper, one can compare mercury consumption by the U.S. chlor-alkali industry,as reported by the U.S. Bureau of Mines, with mercury emissions reported by the sameindustry to the Environmental Protection Industry (the so-called Toxic Release Inventory, orTRI). The comparison is shown in Table VI. Evidently, most of the mercury consumed by thechlor-alkali industry has somehow disappeared from these statistics. A detailed breakout ofreported total mercury releases and transfers for 1992, obtained from the published TRI book,is reproduced in Table VII (converted from pounds to metric tons). It does not help much. Itmerely confirms, again, that most of the mercury consumed in 1992 in the U.S. (621 metrictons) is unaccounted for in the TRI statistics.
What happens to the missing mercury? Technical publications by EPA suggested thatprobably most of it is accumulated in semi-solid or solidified sludges from process watertreatment. The latter may be stored on site, buried on site or shipped to a landfill. Accordingto the TRI data base for 1992, "transfers to off-site treatment and/or disposal" outweighed"emissions to air and water" by a factor of 12. Nevertheless, these two routes accounted foronly 108 metric tons in 1992 from all industrial consumers, not just the chlor-alkaliproducers.
The mystery was only partly resolved when EPA tightened its controls in 1991 andexplicitly banned the disposal of mercury-containing sludges from waste-water treatments atchlor-alkali facilities. In the same year, EPA expanded its reporting requirements for TRI toinclude a section on "source reduction and recycling". For 1991 the industry reported 350metric tons of mercury recovered on site, and for 1992 about 320 metric tons. 6 The recoveredmercury had been accumulating in wastewater sludges, previously unreported.
Robert U. Ayres, The Life Cycle of Chlorine; Part I
File MERCHLORI as printed on June 14, 1996 Page 8
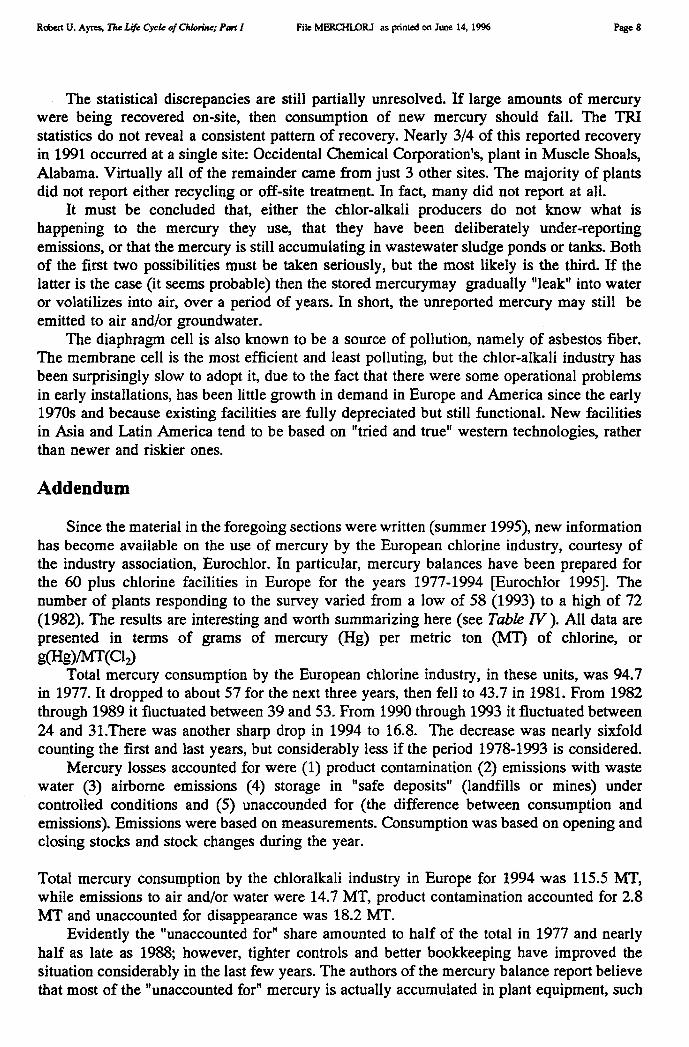
The statistical discrepancies are still partially unresolved. If large amounts of mercurywere being recovered on-site, then consumption of new mercury should fall. The TRIstatistics do not reveal a consistent pattern of recovery. Nearly 3/4 of this reported recoveryin 1991 occurred at a single site: Occidental Chemical Corporation's, plant in Muscle Shoals,Alabama. Virtually all of the remainder came from just 3 other sites. The majority of plantsdid not report either recycling or off-site treatment. In fact, many did not report at all.
It must be concluded that, either the chlor-alkali producers do not know what ishappening to the mercury they use, that they have been deliberately under-reportingemissions, or that the mercury is still accumulating in wastewater sludge ponds or tanks. Bothof the first two possibilities must be taken seriously, but the most likely is the third. If thelatter is the case (it seems probable) then the stored mercurymay gradually "leak" into wateror volatilizes into air, over a period of years. In short, the unreported mercury may still beemitted to air and/or groundwater.
The diaphragm cell is also known to be a source of pollution, namely of asbestos fiber.The membrane cell is the most efficient and least polluting, but the chlor-alkali industry hasbeen surprisingly slow to adopt it, due to the fact that there were some operational problemsin early installations, has been little growth in demand in Europe and America since the early1970s and because existing facilities are fully depreciated but still functional. New facilitiesin Asia and Latin America tend to be based on "tried and true" western technologies, ratherthan newer and riskier ones.
Addendum
Since the material in the foregoing sections were written (summer 1995), new informationhas become available on the use of mercury by the European chlorine industry, courtesy ofthe industry association, Eurochlor. In particular, mercury balances have been prepared forthe 60 plus chlorine facilities in Europe for the years 1977-1994 [Eurochlor 1995]. Thenumber of plants responding to the survey varied from a low of 58 (1993) to a high of 72(1982). The results are interesting and worth summarizing here (see Table IV ). All data arepresented in terms of grams of mercury (Hg) per metric ton (MT) of chlorine, org(Hg)/MT(C12)
Total mercury consumption by the European chlorine industry, in these units, was 94.7in 1977. It dropped to about 57 for the next three years, then fell to 43.7 in 1981. From 1982through 1989 it fluctuated between 39 and 53. From 1990 through 1993 it fluctuated between24 and 31.There was another sharp drop in 1994 to 16.8. The decrease was nearly sixfoldcounting the first and last years, but considerably less if the period 1978-1993 is considered.
Mercury losses accounted for were (1) product contamination (2) emissions with wastewater (3) airborne emissions (4) storage in "safe deposits" (landfills or mines) undercontrolled conditions and (5) unaccounded for (the difference between consumption andemissions). Emissions were based on measurements. Consumption was based on opening andclosing stocks and stock changes during the year.
Total mercury consumption by the chloralkali industry in Europe for 1994 was 115.5 MT,while emissions to air and/or water were 14.7 MT, product contamination accounted for 2.8MT and unaccounted for disappearance was 18.2 MT.
Evidently the "unaccounted for" share amounted to half of the total in 1977 and nearlyhalf as late as 1988; however, tighter controls and better bookkeeping have improved thesituation considerably in the last few years. The authors of the mercury balance report believethat most of the "unaccounted for" mercury is actually accumulated in plant equipment, such
Robert U. Ayres, The Life Cycle of Chlorine; Part I File MERCHLORI as printed on June 14, 1996 Page 9
as steelwork, tanks, headers and building materials. It is asserted that, when a facility isclosed, much --perhaps most -- of this mercury is eventually recovered and recycled. It is alsoasserted by Eurochlor that the non-recovered portion is held in "safe deposit" after plantclosure, hence does not become an emission.
The mercury balance illustrated above should be standard practice for every hazardousor toxic material used in industry.
References
[Amato 1993] Amato, Ivan, "The Crusade Against Chlorine", Science 261, July 1993 :152-154.
[Eurochlor 1995a] EuroChlor Annual Review of EuroChlor Statistics, EuroChlor, Brussels, 1995.
[Eurochlor 1995b] Eurochlor "Development of Mercury Balance 19787-1994" and "Explanation of theEurochlor Mercury Balance" (Restricted), Brussels, June 1995
[Habersatter & Widmer 1991] Habersatter, K. & F. Widmer, Ecobalance of Packaging Materials State of1990, Environmental Series (132), Swiss Federal Office of Environment, Forest & Landscape, Zurich,February 1991.
[IJC 1993] International Joint Commission (IJC ), A strategy for virtual elimination of persistent toxicsubstances, Vol I. ISBN 1-895085-65-9 Windsor, Ontario, Canada, August 1993.
[Jasinski 1994] Jasinski, Stephen M., The Materials Flow of Mercury in the United States, USBMInformation Circular (IC 9412), United States Bureau of Mines, Washington DC, 1994.
[Kostick 1994] Kostick, Dennis. Personal Communication, Washington DC, 1994.
[Manzone 1993] Manzone, R., PVC: Life Cycle & Perspectives, Commett Advanced Course, Urbino, Italy,1993.
[Martin 1974] Martin, E. E., Development Document for Effluent Limitations Guidelines & New SourcePerformance Standards for the Major Inorganic Product Segment of the Inorganic ChemicalsManufacturing Point Source Category, Report (EPA/440/1-74-007-A), United States EnvironmentalProtection Agency, Washington DC, March 1974.
[MIT 1993] Technology Business & Environment Program, Center for Technology Policy & IndustrialDevelopment. Dimensions of Managing Chlorine in the Environment: Report of the MIT/NorwegianChlorine Policy Study Massachusetts Institute of Technology, Cambridge MA, March 1993.
[Neidleman & Geigert 1986] Neidleman, S. & J. Geigert, Biohalogenation: Principles, Basic Roles &Applications, Pllis Harwood Publishers, Chichester, UK, 1986.
[Rauhut 1988] Rauhut, Arnold. Queck.silberbilanz 1983-1985, Landesgewerbeanstalt Bayern (LGA),Nurenberg, Germany, March 1988.
[SRC 1989] Syracuse Research Corporation. Toxicological Profile for Chloromethane, Agency for ToxicSubstances & Diseases Registry of the United States Public Health Service, Washington DC, October1989.
[Swift 1995] T. Kevin Swift, "Chlorine and its Major End Uses" Chemical Manufacturers Association(CMA), Washington D.C. March 1995.
[Tellus 1992] Tellus Institute, CSG/Tellus Packaging Study: Inventory of Material & Energy Use & Air &Water Emissions from the Production of Packaging Materials, Technical Report (89-024/2), TellusInstitute, Boston MA, May 1992. [prepared for the Council of State Governments & the United States
Robert U. Ayres, The Life Cycle of Chlorine; Part I
File MERCHLOR.I as printed on June 14, 1996 Page 10
Environmental Protection Agency]
[Thornton 1991] Thornton, Joe, The Product is the Poison: The Case for Chlorine Phase-Out, Greenpeace,Washington DC, 1991.
[Thornton 1993] Thornton, Joe. Chlorine, Human Health & the Environment, Greenpeace, Washington DC,1993.
[Tukker et al 1995] Tukker, A., R. Kleijn, E. v.d. Voet and E. Smeets "The Dutch Clorine Chain Study: AnExercize in Combining SFA and LCA", paper presented at 3rd SETAC Symposium on Case Studies,Brussels, Nov. 28, 1995
[UN 1993] United Nations Statistical Office, Industrial Statistics Yearbook: Commodity Production Statistics1991 II, United Nations, New York, 1993.
[USBuMines 1975] United States Bureau of Mines, Mineral Facts & Problems, United States GovernmentPrinting Office, Washington DC, 1975.
[USBuMines annual] United States Bureau of Mines, Minerals Yearbook, United States Government PrintingOffice, Washington DC, annual.
[USEPA 1971] United States Environmental Protection Agency, Atmospheric Emissions from Chlor-AlkaliProduction, Report (AP-80), United States Environmental Protection Agency, Washington DC, 1971.
[Vallentyne 1989] Vallentyne, J.,Testimony & Submission before the Alberta-Pacific Environmental ImpactAssessment Review Board, Edmonton, Canada, December 1, 1989.
[WHO 1982] World Health Organization. Rapid Assessment of Sources of Air, Water & Land Pollution,World Health Organization, Geneva, Switzerland, 1982.
[Wood 1974] Wood, J. M., "Biological Cycles for Toxic Elements in the Environment", Science 183, 1974:1049-1052.
Endnotes
1. We wish to acknowledge the valuable assistance of Stephen Jasinski, commodity specialist for mercury, Bureauof Mines, U.S. Department of the Interior, Washington D.C., and Philippe Feron, Executive Director, Eurodilor,Brussels.
2. There are several other minor routes to chlorine, mainly electrolysis of Ha and mga. In Europe, these routesaltogether accounted for only 3.4% of 1988 chlorine capacity.
3. Admittedly, the situation is slightly confused by the existence of several alternative minor routes to chlorine(mainly, electrolysis of Ha and MgCI). In Europe, these routes altogether account for only 3.4% of 1988chlorine capacity. However this would not change the chlorine/caustic ratio very much.
4. This happened in the 1950s in Minimata bay in Japan, due to the discharge of some mercury (a spent catalyst)into the bay by a chemical plant. A number of people — mostly fisher-folk — became seriously ill and somewere disabled. Mercury poisoning is now known as "Minimata disease".
5. The 1982 WHO publication is still the basis of UN environmental planning guidelines, worldwide.
6. I am grateful to Stephen Jasinski, the mercury specialist at the US Bureau of Mines, for calling my attentionto the statistical change that occurred in 1991 [Jasinski 1994].
Robert U. Ayres, The Life Cycle of Chlorine; Pan I File MERCHLOR.I as printed on June 14, 1996 Page 12
Table I: Chlorine & caustic soda (kMT)I Chemical
Region
I Chlor-alkalicapacity
1991InfoCh.c
I Chlorineproduction demand
1991 1990UNb MIT
Caustic soda Iproduction
1991UN"
World (reported) 43 811 35 701` 37 433 36 090(summed) 35 487 38 064
W. Europe 11 257 8 978 9 760 9 060bGermany 4 674 3 684 3 739 4 130"
E. Europe 2 117 1 550 1 460 1 735
C.I.S. 3 000 2 660b 2 697 2 974
N. America 15 180 12 410b 12 551 13 204bU.S. 13 179 10 36Id 11 009 11 023
S. America 1 625 1 308b 1 500 1 466Brazil 1 070 1 034 ' 980 1 147
Africa 538 71.3 346 80S. Africa 232 — 225
Middle East 730 (e) 750 (e)
Asia 9 035 8 210b 8 214 9 209Japan 3 136 3 370" 3 550 3 788China 3 365 3 1601' 2 930 3 541
Oceania 319 300' 155 336ba. Capacities as reported in Info Chimie Sept. 1989, including capacity additions under
construction at that time and presumably operational by 1991.b. UN statistics are very incomplete; e.g. no production figures for Argentina, China, the
Middle East or Oceania; Japanese production as liquid chlorine only. chlorine productionfor as 20,298 kMT (1990, Ukraine), which is clearly erroneous (see capacity data). Tofill in gaps in UN chlorine production data, we have used caustic soda data as a surrogate,assuming 1.12 tonnes of caustic soda per tonne of chlorine. Where the UN has both chlorine& caustic soda data and they are inconsistent, we have taken the larger (chlorineequivalent) as being more likely to be correct.
c. World total from Tecnon Ltd., an industry consulting group.d. Source for US data is USBM Minerals Yearbook, 1991, page 1301.e. Included in Asia.
Robert U. Ayres, The Life Cycle of Chlorine; Port I File MERCHLOR.I as printed on June 14, 1996
Page 13
Table II: Processes for the production of chlorineA. CHLORINE: BY ELECTROLYSIS OF NACL IN DIAPHRAGM CELLS
Utility inputs & outputs Other uncountedWater (cooling) (input) 69 tonnes Hydrogen (as fuel) (T-Cal) 906Steam (input) 2.4 tonnesElectricity (input) 2811 kWh
INPUTS (metric tonnes) OUTPUTS (metric tonnes)Sodium chloride 1.712 Caustic soda 1.128Sulfuric acid 0.0087 Sulfuric acid (65%) 0.008686Calcium Chloride 0.0129 CHLORINE 1Hydrochloric acid (20BE) 0.0564 (caustic soda byproduct)Carbon tetrachloride 0.000011Water (process) 0.01
INPUTS ACCOUNTED FOR 1.800011 OUTPUTS ACCOUNTED FOR 2.136686Source: [SRI #110] -0.336675 = Difference = -18.70% of input
B. CHLORINE: BY ELECTROLYSIS OF NACL IN MEMBRANE CELLSUtility inputs & outputs Other uncounted
Water (cooling) (input) 152 tonnes Membrane (Square cm) 166.9Steam (input) 0.89 tonnes Hydrogen (as fuel) (T-Cal) 916Electricity (input) 2798 kWh
INPUTS (metric tonnes) OUTPUTS (metric tonnes)Sodium chloride 2.43 Caustic soda 1.143sodium carbonate 0.0345 Sulfuric acid (65%) 0.00934Sulfuric acid 0.00934 CHLORINE 1Hydrochloric acid (20BE) 0.0114 (caustic soda byproduct)Water (process) 3.7INPUTS ACCOUNTED FOR 6.18524 OUTPUTS ACCOUNTED FOR 2.15234
Source: [SRI #111] 4.0329 = Difference = 65.20% of inputsC. CHLORINE: BY ELECTROLYSIS OF NACL IN MERCURY CELLS
Utility inputs & outputs Other uncountedWater (cooling) (input) 208 tonnes Hydrogen (as fuel) (T-Cal) 898Steam (input) 2 tonnesElectricity (input) 3575 kWh
INPUTS (metric tonnes) OUTPUTS (metric tonnes)Sodium chloride 1.711 Caustic soda 1.118Sulfuric acid 0.008624 Sulfuric acid (dilute) 0.00883Calcium chloride 0.0144 CHLORINE 1Sodium carbonate 0.0386Hydrochloric acid 0.0399Sodium sulfide (flake) 0.000112Mercury 0.000003Water (process) 0.03INPUTS ACCOUNTED FOR 1.842639 OUTPUTS ACCOUNTED FOR 2.12683
Source: [SRI #112] -0.284191 = Difference = -15.42% of inputsNote: The inputs and outputs do not balance exactly because only about 98% of the sodium chloride in thebrine is consumed, and because some of the chlorine is lost in the process. Based on Toxic ReleaseInventory data for the U.S. (1990), air emissions of chlorine amounted to 45 KMT (fugitive) and 290KMT (stack), or 0.42% and 2.7% of output respectively [Kostick 1994].
Robert U. Ayres, The Life Cycle of Chlorine; Part I File MFRCHLORJ as printed on June 14, 1996
Table III: Mercury consumption in chlorine production
Year Hg used forCI mfg
US. tonnes
Cl made byHg cellUS. %
ClproductionUS. kV T
Cl productionW. Europe
kt117
Cl made byHg cell
W. Europe %
1970 25% 8858 50081973 450.6 94371974 582.5 97551975 524.8 8316 67341976 553.4 94151977 370.4 95921978 384.9 100261979 419.9 111501980 326.5 10361 82721981 252.4 9764 80501982 215.2 8324 7881 62%1983 277.6 8948 87151984 253.0 20%(`) 9707 94211985 235.0 9437 95641986 259.0 9473 94221987 311.0 10050 98071988 445.0 10212 9800 63%1989 381.0 17%(`) 10354 97501990 247.0 16.25%(`) 10713 93761991 184.0 10361 87721992 207.0 10107 86101993(f) 11150 84401994(f) na 9099 64%
(a) (d,g) (e) (e)
a) [USBuMines Minerals Yearbooks, various years]b) [Tellus Institute 1992]c) [US Bureau of Mines preliminary estimates]d) [US Department of Commerce, Business Statistic.; 1961-1991 &
Current Industrial Reports: Inorganic Chemicals, 4th quarter 1992]e) [SRI, various years]f) [Eurochlor 1995]g) [CMA 1995]
Page 14
Robert U. Ayres, The Life Cycle of Chlorine; Part I File MERCHLOR.I as printed on June 14, 1996
Page 15
Table IV Mercury Balance for Europe, 1977-1994 in units of gm(Hg)/ MT(C12)chlorine
Year 1977 1978 1983 1988 1992 1994
consumption 94.7 58.4 39.1 39 26.3 16.6
contamination 5.5 2.7 2.1 1.2 0.7 0.4
emissions to water 9.4 4.6 2.6 0.9 0.5 0.2
emissions to air 11.7 8.8 5.3 3.8 2.4 1.9
safe deposits 21.7 12.8 14.3 14 14 11.4
unaccounted for 46.4 29.5 14.8 19 8.8 2.6
Table V: Various estimates of mercury emissions per ton of chlorine
Emissions (g/MT) Source
150 WHO 1982, based on Martin 19743 SRI 19892.47 Manzone 19930.6 Tellus 1992, based on USEPA 19820.47 Habersatter & Widmer 19912.5 Eurochlor 1995
Table VI: Where has the mercury gone?Mercury in SIC 2812 (Chlorine Production) USA metric tons
USEPA TRI Data Base as reported byUSBM EPA Office of Pollution
Minerals Prevention & Toxics U.S. Bureau of MinesYearbooks
Year Consumption Releases Releases Transfers Total1987 311 23.71988 445 15.71989 381 10.7 11.3 52.9 64.21990 247 11.0 11.0 58.5 69.51991 184 7.9 8.5 56.0 64.51992 209 6.3 4.5 8.7 13.2
Table VII: Transfers of TRI metals and metal compounds, metric tons, 1992Chemical Transfers Transfers Transfers Transfers Transfers Other off- Total
to to energy to to to site transfersrecycling recovery treatment POTW's disposal transfers
Mercury & its compounds 23.3 0 33.6 .001 74.8 .001 134.0
Total Production
Diaphragm Cells
Mercury Cells
Fused Salt & Non-Electrolytic
....."'''....#
••••••■••••••••■■••••■•••••••■•■••00......
..."•••••
..,...0..... oo
Robert U. Ayres, The Life Cycle of Chlorine; Part I File MERCHLOR.I as printed on June 14, 1996
10
Page 16
9
8
cr)zg 7
g§ 6
-
------
I 1 I 1
1946 1948 1950 1952 1954 1956 1958 1960 1962 1964 1966 1968YEAR
Total only for 1947-1955 and 1957-1961 (Specific cell types interpolated)Figure 1. Chlorine production in the U.S. by cell type Source: [USEPA 19711
Figure 2. Biological cycle for mercury Source: [Wood 19741
----
0 56A 4Cc4it.
3
2
1
R. U. & L W. Ayres Life Cycle of Chlorine: H
File CHLORINT.II as printed on June 14, 1996 Page 1
THE LIFE-CYCLE OF CHLORINE:PART
Robert U. Ayres and Leslie W. AyresINSEAD, Fontainebleau, France
June 1996
Abstract
In this paper we describe the chlorine chemical industry in Europe and its majorconversion processes and emissions. Four major process chains, beginning with methane,ethylene, propylene and benzene are analyzed in detail, along with five important "stand-alone" processes. A self-consistent "version" of the industry is constructed for 1992, basedon data from a variety of different sources. Mass balance conditions are satisfied. Emissions,by type, are calculated.
It is of interest to note that "raw" chlorine inputs in Europe for 1992 amounted to 8937kMT (salt). This was used to produce of 8399 kMT of "virgin" elemental chlorine, plus 278kMT of "virgin" by-product HCI. Total elemental chlorine production was 8610 kMT (ofwhich 211 kMT was recycled from HCI). The sum total of chlorine inputs, including 12 kMTof recycled CHCs, was 8689 kMT during 1992, while shipments of chlorine and HC1 to othersectors (including chlorine for direct use in water treatment and pulp bleaching) was 1367kMT, leaving 7322 kMT lost within the sector or embodied in products. Of this subtotal, 350kMT was used to manufacture identified inorganic chemicals and 5694 kMT was used tomanufacture identifiable organic chemicals. The remainder, 1278 kMT was used for "otherunspecified" chemicals, both organic and inorganic.
In addition, 5496 kMT of HCI was generated within the sector, of which 863 kMT wasshipped out of the sector and 211 kMT was recycled back into chlorine. The rest was usedinternally as HC1. Altogether, 5496 - 863 = 4633 kMT (C1) was recycled. If we consider"raw" chlorine inputs, the total would be 9297 + 12 + 4633 = 13,942 (= 13,322 + 620, wherethe latter corresponds to the salt wastes in the first stage of processing). Based on thiscalculation, the virgin component of all inputs is 66.6 %, while 33.4% was recycled.
Chlorine embodied in chemicals destined for uses outside the production sector cannotbe determined exactly, due to uncertainty regarding the further conversion (within the sector)of "unspecified" chemicals. Our estimate for 1992 is 4403-4453 kMT, not counting 1367 kMTof chlorine and HC1 sold as such (noted above). Losses within the sector were therefore inthe range of 2870-2920 kMT. We can directly account for chlorine wastes, including 620kMT of wastes from chlorine production and recycling processes, amounting to 3490-3540kMT.
We estimate that products account for 41.6% of inputs (measured at the "fence"), whilewastes account for 24.7% of total chlorine flux. The remainder (33.7%) is recycled.
R. U. & L W. Ayres Life Cycle of Chlorine: II File CHLORINT.II as printed on June 14, 1996 Page 2
1. Introduction
For any produced chemical (indeed, any material) material, there are two possible fates.The chemical may "converted" i.e. transformed chemically to make something else. Or thechemical may be used as it is. Again, there are two possibilities. The chemical may beconsumed in a production process (without being converted) or it may be used by a "final"consumer. If it is either converted into another product, or consumed in the process (e.g. asa solvent, a lubricant or a catalyst) it is called an intermediate good. If, on the other hand, itis used by a consumer it is called a final good
Those products that are not transformed further must ultimately become wastes, eithersooner or later. Some products, such as solvents and pesticides are dissipated immediatelyafter use. On the other hand others, like PVC used for cable insulation, pipe, flooring orwindow frames, may have an effective lifetime of several decades.
However, it is analytically convenient to distinguish between losses and wastes that occurin the manufacturing process, vis a vis losses that occur in subsequent consumptive use. Theformer are discussed in the present paper (Part II). The latter are discussed in a later paper(Part III of the series).
Major uses of chlorine in the U.S. are summarized for 1992 in the pie chart Figure 1[Thornton 1993] and for Europe in Figure 2 [Tecnon 1993]. A more detailed breakdown isavailable for the world, and for Europe, for the years 1989-1992 as shown in Table I andTable II [Tecnon 1993]. Our own revised estimate for Europe is also presented in pie-chartform as part of Figure 10.
A few major regional differences in use patterns are worthy of comment. (See Table III[USBuMines 1994]). According to this source, 25% of Japanese chlorine consumption isapparently used for inorganic chemicals, as compared to only 8-10 % for Europe, the U.S.and the rest of the world. This is somewhat mysterious. Another difference is that pulp andpaper bleaching accounted for only 1% of European chlorine consumption — in elementalform — in 1994 (5.8% in 1987) vs 9% in the U.S. (14% in 1989) and 5% in Japan. 2 On theother hand, water treatment accounted for 4% of chlorine use in Europe (where ozone alsohas a significant market), 5% in the U.S. and Japan, but 11% in the rest of the world.
Of the final products that embody chlorine, in Europe, just over 60% (in terms ofchlorine content) consists of the plastic PVC [ibid]. The remainder consists of solvents (18%),other organics (15%) and inorganics, such as bleaches (6%) [ibid]. Expressed in terms ofprimary chlorine inputs, PVC accounts for 0.60 * 0.515 = 0.31 (31%) of western Europeanelemental chlorine production. VCM and PVC production by region are given in Table III.For instance, U.S. production in 1991 was 4157 kMT, while western European production in1991 was 5005 kMT (in 1992 it fell slightly to 4785 kMT); the world total was 16,087 kMTin that year (the last for which we have global data). The chlorine content of PVC is 56.7%,so this product apparently accounted for 2360/10,361 = 22.5% of gross U.S. chlorine output,2840/8978 = 31.6% of gross west European chlorine output and 9130/35,700 = 25.6% ofgross global chlorine output.
Of the apparent HC1 supply in Europe (5774 kMT for 1992, Cl content), over 80% wasused as a process reactant — mostly in the EDC/VCM chain — 14% was used for pHadjustment and neutralization, and the rest for miscellaneous purposes (including sale outsidethe industry). Uses of HCI in Europe in 1989 are shown in a pie chart Figure 3 [ECOPLANundated]. We analyze the year 1992 in greater detail below.
R. U. & L W. Ayres Life Cyck of Chlorine: H
File CHLORINT.II as printed on June 14, 1996 Page 3
2. Data sources and data problems
It is important to note, here, that while government sources do provide gross productionand consumption figures for major chemicals, including chlorine and hydrochloric acid,detailed data on chlorine uses are not routinely available from any U.S. or Europeangovernment agency. They are only available from private sources, either the industry itself(e.g. [Euro Chlor 1995]) or market consulting firms that do surveys from time to time. Dataon wastes and losses are collected, in principle, by the U.S. Environmental Protection Agencyand its counterparts in Europe and Japan. As a practical matter, there is only one source ofsuch data, namely the chemical industry itself. Considering that the industry is almostpathologically secretive, even about production and consumption statistics, it should not besurprising that emissions data effectively do not exist, at least in the public domain.
Our detailed results hereafter are based largely on production data from a major surveycarried out for Euro Chlor by a consulting firm, EcoTec, or from Euro Chlor itself [EcoTec1995; Euro Chlor 1995]. Tecnon data (Tables I, II) was used to fill in some gaps forparticular chemicals [Tecnon 1993]. The sources were all more or less consistent with eachother, except in the case of solvents. The differences in that case appear to be due to the factthat Tecnon surveyed consumption rather than production. For most true intermediates, ofcourse, the two should be essentially identical.
The major purpose of this paper is to construct a plausible emissions profile for theindustry from process data and mass balance considerations. In fact, most chemical processdata are obscure or unpublished. Process schematics and "recipes" are normally available onlyfrom chemical engineering textbooks, patents or private consultants. Even when processdescriptions are available, they do not include wastes and emissions. Fortunately chemicalprocesses can also be simulated via chemical process design software (e.g. Aspen Plus®) thatis commercially available. The results presented hereafter were obtained by systematicallyscanning the published literature for process information, which was subsequently subjectedto a detailed element-by-element "balancing" process using a methodology that has beendescribed more fully in previous papers [Ayres 1995; Wolfgang & Ayres 1995]).
There are two fundamental problems with the private unpublished market data. In the firstplace, survey methodologies are not adequately described or tested. For instance, it is oftenunclear whether the numbers in published pie charts and tables refer to inputs to a "processchain", or to chlorine embodied in outputs. In practice, the correct interpretation was usuallyclear from the context, or from mass balance considerations.
A second difficulty is that the Tecnon data for Europe (interpreted as inputs) differssignificantly in the case of solvents from data published by European chlorine industryassociation Euro Chlor [Euro Chlor 1995] and the European Chlorinated Solvents Association[ECSA 1993]. We have used the ECSA data as our primary source for the four major tonnagesolvents (below).
To illustrate other discrepancies, for 1992 Tecnon reported chlorine production of 8760kMT (Table II) whereas Euro Chlor reported 8610 kMT [Euro Chlor 1995]. Tecnon reportedthat 358 kMT of chlorine was used for water treatment in Europe; Euro Chlor reported only251 kMT for this purpose [ibid]. In the case of the four major solvents [methylene(di)chloride, trichloroethylene, perchloroethylene, 1,1,1 trichloroethane (methyl chloroform)]Tecnon reported total consumption of 433 kMT, while Euro Chlor reported 405 kMT [ibid].In the case of chlorinated polymers (including PVC, PVDC and chlorinated polyethylene PE),Tecnon reports 3197 kMT for vinyl chloride monomer (VCM), the precursor of both PVC andPVDC, plus 10 kMT chlorinated polyethylene (PE); for this category Euro Chlor reports 3716
R. U. & L W. Ayres Life Cycle of Chlorine: II File CHLDRINTII as printed on June 14, 1996 Page 4
kMT, presumably including some other polymers [ibid]. Obviously the discrepancy regardingchlorinated polymers is much too large to explain so easily.
We think that the Euro Chior/EcoTec data are the most reliable. Nevertheless, for reasonsnoted above, we use Tecnon data in a few instances where no other source was available.
3. Mass balances for chlorine chemicals in Europe, 1992
Many, if not most, uses of chlorine and its products are intermediate. That is, chlorineand its organic compounds are mostly transformed into other products. The intermediate usesand conversion processes are discussed in this section. There are significant losses of chlorineand its products during the various conversion processes. We have constructed detailedbalances of chlorine inputs and outputs for four major chains and several stand-aloneprocesses, discussed below. Most of the "lost" chlorine is actually converted to hydrochloricacid (HC1), which can be recycled within the industry quite easily. A very high percentageof HCI (95%) is produced as a by-product of some other process. Table IV shows ourcategorization of the internal production and consumption of HC1 in Western Europe in 1992along with EcoTec's more general categories.
The internal production and consumption of HC1 in the chemical industry happensbecause chlorination is often an intermediate step in a complex process, often followed by asubsequent step in which (some or all of) the chlorine is released as HC1. The best knownexample is probably the production of vinyl chloride (VCM) via direct chlorination ofethylene to ethylene dichloride (EDC), which is then catalytically split to yield VCM andHCI. The HCI is normally used in a complementary process in which Ha reacts withethylene and oxygen to yield more EDC (and water). These two processes are roughlybalanced to consume all of the HC1 that is produced. (Actually the EDC chain consumesslightly more HCI than it generates).
Ethylene dichloride (EDC) is the most important chlorinated intermediate in tonnageterms, if we disregard hydrochloric acid. However, according to Table III almost all EDC(95.9% in Europe, 1992) is consumed in the production of vinyl chloride monomer (VCM).VCM, in turn, is polymerized to make the durable plastic PVC. PVC accounts for nearly 31%of European elemental chlorine output (24% in the US).
Other intermediate organic chemical categories (Table II) are as follows: chlorinatedmethyl (C1) compounds (10.5%); chlorinated ethane and ethyl (C 2) compounds other thanvinyl chloride (12.1%); chlorinated C., compounds (epichlorohydrin and propylene oxide bythe chlorohydrin route),13.2%; phosgene derivatives (5.5%); other higher order chloro-carbons(2.1%). Inorganic chemicals accounted for 8.4%, with hydrochloric acid (2.8%) and sodiumhypochlorite (2.5%) the major items.
Unfortunately the rest of the intermediate product breakdown shown in Tables I, II andFigures 1 & 3 is almost meaningless to anyone except an industrial chemist, and itsimplications are anything but clear. The sorts of questions one would like to answer include:how much chlorine is contained in "final" products that are sold to other sectors and nottransformed further? (The plastic PVC is an obvious example, but there are many others).What is the ultimate fate of that embodied chlorine? How much chlorine is lost to theenvironment in conversion processed within the chemical industry? Again, in what forms?These questions are at the heart of a life cycle analysis of chlorine. As noted above, onlyprocess losses are considered in this paper. The fate of final products is considered in thethird and last paper.
R. U. & L W. Ayres Life Cycle of Chlorine: H File CHLARINTII as printed on June 14, 1996 Page 5
The situation is complicated by the fact that a chlorine atom may be recycled within thechemical industry several times before being embodied in a final product or discarded in awaste. Chlorine is recycled in several ways, although by far the most important is ashydrochloric acid (HC1). HC1 is used in enormous quantities (5774 kMT Cl, in Europe, 1992),most of which is a by-product of some other production process. In fact, chlorinatedintermediates are utilized in the production of a number of final products that contain nochlorine, i.e. all the chlorine is discarded along the way (mostly as HC1). Examples includepolyurethanes, polycarbonates, epoxies, propylene oxide, fluorocarbons, titanium dioxide andultrapure (electronic grade) silicon. Some of these are discussed later.
Apart from recycling via hydrochloric acid, there are several other less importantpossibilities. In the first place, some secondary chlorine (about 3.4% in Europe) is producedfrom by-product HC1 by electrolysis (the Kel-chlor process). In addition, salt itself is recycledto a small extent, mainly where it is a major waste product (as in polycarbonate production).A small amount of EDC is recycled from VCM production. Finally, some over-chlorinatedproducts are recycled by hydrogenation or pyrolysis, again yielding Ha/a, which is recycled.
The most important single chain is the one that begins with chlorination of ethylene andends with PVC and some by-products. However the analysis is complicated by the fact thatthere are several other by-products of the chain, including vinylidene chloride (VDC), 1,1,1trichloroethane, trichloroethylene and perchloroethylene. The last three products can also bemade by other processes (e.g. ethane chlorination). In the past, some vinyl chloride monomer(VCM) was made by direct chlorination of acetylene, but this route has also been closeddown.
We had no direct information on the mix of processes that was used, but we do knowa few other useful facts. As mentioned above, there are two major processes involved in theproduction of EDC, namely direct chlorination of ethylene and oxychiorination of ethyleneusing hydrochloric acid. The process for making vinyl chloride monomer (VCM) in turn ispyrolysis of EDC, which produces hydrochloric acid as a by-product. We know that thesethree processes are normally carried out jointly, in the same facility, so that the HC1 producedfrom the EDC pyrolysis process is then utilized next door in the oxychiorination process tomake EDC. There is no net output of HC1 from these combined processes beyond the plantboundary itself.
In fact, according to Euro Chlor, there is a small net input of HC1 to the EDC chain (286kMT Cl or about 5.8% in 1992). This enables us to allocate the EDC output among the twoprincipal production processes: about 51.2% of the virgin EDC is made by oxychiorinationof ethylene, the remainder being from the direct chlorination process. See Figure 4.
About 92% of the EDC is converted to vinyl chloride monomer, VCM. The remainderof the EDC — about 8% — is divided between the monomer vinylidene chloride (from whichseveral products, including "Saran®" are made) and the two solvents, trichlorethylene,perchloroethylene. Similarly, we know that another solvent, 1,1,1 trichloroethane, ismanufactured partly from VCM itself. (It can also be made from vinylidene chloride, but wehave ignored that route, since it involves an extra step).
As mentioned, all three of these solvents could also be made by direct chlorination ofethane, but this route is no longer used. All are apparently derived by various routes fromEDC (including some routes involving other intermediates, such as 1,1 dichloroethane and 1,1dichloroethylene). The only exception is perchloroethylene, which can also be made fromheavy ends (CHCs) generated by the methane chlorination chain. However, we do know thetotal European production of the three above-mentioned solvents for 1992, shown in TableV [ECSA 1993], and of course their chlorine content is easily calculated: viz. 80.95%, 85.51%and 79.73% respectively. Although we also know the amount of chlorine allocated to these
R. U. & L W. Ayres Life Cycle of Chlorine: H File CHLORINTil as printed on June 14, 1996 Page 6
three chemicals according to the Tecnon survey (Table II), this information did not appearto apply to production and was not used.
We had no direct data on the production of vinylidene chloride (VDC). However, toestimate it we subtracted the imputed use of VCM for PVC and 1,1,1 trichloroethaneproduction. This procedure yielded an estimate of 13 kMT (C1 content), which we suspect isquite a bit too low. However, our allocation is at least consistent with most of the knownfacts and laws of chemistry. From a description of the VDC process, [SRI 1989] we calculatethat 18 kMT of molecular chlorine would have been used, and that by-product hydrochloricacid output would have been about 7 kMT (chlorine).
Combining all of the inputs and outputs, then, subject to the mass-balance condition andusing process yield data for EDC and VCM production from various published andunpublished sources, we arrived at Figures 4 and 5 and the following summary:
Chloroethylene Chain, Part 1: EDC-VCM-PVC (Figure 4)
Direct chlorine inputs to the EDC chain: 3585 kMTChlorine in recycled EDC: 122 kMTChlorine in HC1 produced (and entirely consumed) in the chain: 3489 kMTChlorine embodied in VCM: 2797 kMT (of which 55 kMT to 1,1,1 trichloroethane)Chlorine embodied in PVC: 2714 kMTChlorine embodied in vinylidene chloride, VDC: 13 kMTChlorine embodied in 1,1,1 trichloroethane from this chain: 158 kMTChlorine in HCH "light & heavy ends": 191 kMTChlorine in wastes: 162 kMT (of which 118 was organochlorines)
Taking into account by-products, this chain accounted 41.7% of the chlorine consumedin western Europe in 1992.
Analysis of the other chains followed a similar methodology. We omit the details. Thenext largest final output of chlorine products from the chemical industry in Europe in 1992was chlorinated solvents, as shown in Table V [ECSA 1993]. Total output of these four for1992 amounted to 768 kMT, of which about 80% — or 608 kMT — was chlorine.(Production and sales of chlorinated solvents are declining steadily). Apart from by-productsof ethylene chlorination, solvents are produced by chlorination of methane.
The chloroethylene series based on EDC, not including VCM and PVC (discussed above)but including ethylene amines, is displayed graphically in Figure 5.
Chloroethylene Chain, part 2: Remainder (Figure 5)
• Chlorine consumed in the extended chloroethylene chain: 207 kMT• Chlorine consumed as EDC: 527 kMT• Chlorine consumed as VCM: 55 kMT• Chlorine consumed as recycled CHC: 31 kMT• Chlorine embodied in 1,1,1 trichloroethane: 158 kMT• Chlorine embodied in trichloroethylene: 101 kMT• Chlorine embodied in perchloroethylene: 180 kMT• Chlorine embodied in organochlorine wastes: 16 kMT• Chlorine embodied in inorganic salt wastes: 340 kMT
•••
•
••
•••
Products of the chain also included ethylene amines (233 kMT), which contain no chlorine.
R. U. & L W. Ayres Life Cycle of Chlorine: H File CHLORINT.11 as printed on June 14, 1996 Page 7
The chloromethane series is diagrammed in Figure 6.
Chloromethane Chain (Figure 6)
Elemental chlorine consumed in the chloromethane chain: 809 kMTChlorine in recycled CHCs consumed in the chain: 72 kMTChlorine in HC1 produced by the chain: 316 kMTChlorine in HC1 shipped from the chain: 181 kMTChlorine embodied in methyl chloride (from methanol): 186 kMTChlorine embodied in methylene chloride from the chain: 195 kMTChlorine embodied in chloroform from the chain: 198 kMTChlorine embodied in carbon tetrachloride from the chain: 186 kMTChlorine embodied in organochlorine wastes: 20 kMTChlorine embodied in inorganic salt wastes: 28 kMT
Together, these two chains consumed 1016 kMT of elemental chlorine in 1992, inaddition to indirect chlorine inputs of 685 1cMT as EDC, VCM and CHCs. Evidently the twochains yield more than solvents, including carbon tetrachloride (to fluorocarbons), methylchloride (to tetraethyl and tetramethyl lead), chloroform (to fluorocarbons) and ethyleneamines (to explosives). The summary results are as follows:
As was noted previously, there are a number of important instances of the use of chlorine(and HC1) as an intermediate in the production of chemicals that do not themselves containchlorine. For such products, it necessarily follows that all chlorine ends up in by-productssuch as HC1 that are used in other processes or in wastes. The case of ethylene amines(mainly for explosives) was mentioned already. Other examples are as follows:
Polyurethanes are polymers of either toluene diisocyanate (TDI), or methylene diphenyldiisocyanate (MDI). These monomers are made by reacting a feedstock (e.g. toluenediamine) with a chlorine-containing intermediate (phosgene, CC12O), yielding HCLas a by-product. (In this case the Ha is recycled to hydrogen and chlorine byelectrolysis.)
Polycarbonates are co-polymers of phosgene with bisphenol A yielding HC1 as a by-product. The phosgene chain is shown schematically, along with the chlorobenzeneprocess in Figure 7 below. The phosgene/chlorobenzene chain alone accounted for867 kMT or about 10% of European chlorine consumed in 1992.
Extended Phosgene/Chlorobenzene Chain (Figure 7)
• Chlorine consumed in the phosgene/chlorobenzene chain: 867 kMT• Chlorine in HC1 produced by the chain: 604 kMT• Chlorine embodied in phosgene: 747 kMT• Chlorine embodied in monochlorobenzene: 31 kMT• Chlorine embodied in dichlorobenzene: 12 kMT (6 kMT leaves chain)• Chlorine embodied in organochlorine wastes: 68 kMT• Chlorine embodied in inorganic salt wastes: 160 kMT
Other products of the chain were mostly pesticides and herbicides.
••••••••••
R. U. & L W. Ayres Life Cycle of Chlorine: II
File CHLORINT.II as printed on June 14, 1996 Page 8
Propylene oxide (epoxipropane), is an important intermediate feedstock for severalproducts. It is made by two processes. The older "chlorohydrin" process proceeds viadichloropropane (DCP). In the dominant version, HC1 is a by-product of the secondstage, but it is neutralized with calcium hydroxide, producing CaC12 as a waste. Inone case (Dow) the propylene oxide facility is co-located with a salt electrolysisfacility. Instead of producing NaOH commercially by dehydration of the cell liquor,it is used to neutralize the Ha from the chlorohydrin process, regenerating NaCIbrine that is fed back into the electrolysis. The newer peroxidation process (Oxirane)does not require chlorine, but it is used primarily to produce tert-butyl alcohol(TBA), from i-butane and/or ethylbenzene en route to the gasoline octane additivemethyl-tert-butyl ether (MTBE). Propylene oxide is only a minor by-product of thisprocess, whence the Oxirane process only accounts for about 4% of worldwidecapacity as of 1989-90 [Fonds Chem. 1992].
Epoxies are co-polymers of bisphenol A with epichlorohydrin. The latter is derived fromallyl chloride, from direct chlorination of propylene. Not only does the productionprocess for epichlorohydrin itself generate large quantities of HC1, so does the finalpolymerization process [Fonds Chem 1992]. A schematic diagram of the propylenechlorination chain is shown in Figure 8. The propylene chlorination chain taken asa whole (see also above) accounted for 1109 kMT of chlorine, or 12.9% of Europeanchlorine produced in 1992. The ally! chloride sub-chain accounted for 153 kMT ofchlorine or about 1.8% of 1992 European chlorine production.
Extended Propylene Chlorination Chains (Figure 8)
• Chlorine consumed in the propylene chlorination chain: 1109 kMT• Chlorine in HC1 produced by the chains: 72 kMT• Chlorine in HC1 shipped outside the chain: 49 kMT• Chlorine embodied in ally! chloride: 54 kMT (5 kMT leaves chain)• Chlorine embodied in epichlorohydrin: 41 kMT (0 kMT leaves chain)• Chlorine embodied in "ends": 55 kMT• Chlorine in organochlorine wastes: 8 kMT• Chlorine in inorganic salt wastes: 972 kMT
Butyl rubber is another case of a product that contains no chlorine. It is polychloroprene,a polymer of chloroprene. Chloroprene is a chlorinated product of butadiene, a C4hydrocarbon. Inputs to the chlorination process were 82 kMT; of which 37 kMT wasembodied in chloroprene and the remainder is apparently waste salt. No chlorine iscontained in the polymer itself. The polymerization process therefore generatesadditional chlorine, probably in the form of HC1.
Chlorofluorocarbons (CFCs) are compounds containing some chlorine and somefluorine. They are made by direct partial fluorination of chlorocarbons or CHCs,mainly carbon tetrachloride, releasing chlorine or HC1 [Fonds Chem 1992].Production is included under "solvents". The main source is CC1 4 with chloroformas a secondary source.
Tetrafluoroethylene (TFE) is C2F4, the monomer for the polymer best known is"TeflonTM ". It contains no chlorine, but is made by high temperature pyrolysis of the
R. U. & L W. Ayres Life Cycle of Chlorine: II
File CHLORINT.II as printed on June 14, 1996 Page 9
solvent Monochlorodifluoromethane (CC1F 2H), releasing hydrochloric acid (HC1) forrecycling [Fonds Chem 1992].
Silicones are polymers based on a chain of molecules with the composition (CH3)2SiO,containing no chlorine. However, the starting point is a reaction between siliconmetal Si and methyl chloride (CH3C1) which produces methylchlorosilane(CH3)2SiC12. The latter reacts with water yielding the silicone monomer plus by-product HC1 [Fonds Chem 1992].
Important inorganic chlorine compounds include:
Hypochlorite (95% sodium, 5% calcium) an important category of industrial andhousehold bleaches. Input chlorine was 246 kMT, of which 121 kMT was embodiedin hypochlorite products. Outputs included 115 kMT in the form of HC1, 3 kMT"pure" salt and 7 kMT in the form of salt wastes.
Titanium dioxide is by far the most important white pigment for paint, paper, and otherproducts. It contains no chlorine. Titanium is obtained from two ores, ilmenite andrutile. The process for extracting titanium dioxide from rutile involves directchlorination to titanium tetrachloride (TiC1 4) as an intermediate step. The chlorideis then "burned" at high temperatures (above 1000°C), or reacted with hightemperature steam, to produce the oxide. In the case of direct oxidation, most of thechlorine is recycled internally. In the case of reaction with steam, hydrochloric acidis generated. In this case HC1 is apparently not recycled, but is neutralized by analkali; the waste product is either sodium chloride (salt) or magnesium chloride[Fonds Chem 1992]. The waste stream also includes small amounts of ferric chloride(from iron impurities in the ore). This process consumed 104 kMT of chlorine in1992 or about 1.2% of elemental chlorine in Europe.
Ultra-pure electronic grade silicon (EGS), is the starting point for virtually all semi-conductor products ("chips"). It is produced by a process in which impuremetallurgical grade silicon (MGS) is chlorinated to trichlorosilane (SiHC13), whichis subsequently reduced again (by reaction with hydrogen) to silicon and hydrochlo-ric acid. The latter reacts with trichlorosilane to yield silicon tetrachloride (SiC1 4) andhydrogen gas. In principle the hydrogen can also be recycled. The by-product SiCl4is an intermediate for other silicon chemicals. However the final fate of the chlorineis unclear. We have described this complex system is described in more detail inanother publication [Ayres et al, 1995, Chapter 10].
Summarizing, it is interesting to present the various chains in an integrated form. Thisis done in Figure 9. Total chlorine inputs from raw materials in 1992 amounted to 8937 kMTas NaC1, 79 kMT as CaC12 and 281 kMT as KC1, for a total of 9297 kMT. Process wastesat the first stage amounted to 620 kMT (salt). At the next stage, by far the dominant chlorinecarrier is elemental chlorine itself (8610 kMT), mostly from the electrolysis of salt. However,211 kMT of this was from recycled hydrochloric acid. On the other hand, in 1992 a modestamount of hydrochloric acid (278 kMT CD was produced from potassium chloride as a by-product of potash fertilizer. The total of all "virgin" processed chlorine inputs to the sectorwas therefore 8610 - 211 + 278 = 8677 kMT. There was also a small input of chlorine in theform of (net) imported CHCs (12 kMT), for a total of 8689 kMT.
R. U. & L W. Ayres Life Cycle of Chlorine: II
File CHLORINT.II as printed on June 14, 1996 Page 10
By the same token, some chlorine is shipped out of the chemical sector as hydrochloricacid (for use in other industries or in household products). In 1992, total shipments ofchlorine to other sectors as HC1 were 863 kMT, while 504 kMT of elemental chlorine wasalso shipped, partly for water treatment and partly for paper pulp bleaching. Net consumptionof chlorine within the sector was therefore 8689 - 863 - 504 = 7322 kMT.
Chlorine embodied in all identified final products of the sector itself, exclusive ofchlorine shipped out as such or in hydrochloric acid, amounted to 4073 kMT (C1), plus anunknown amount of unspecified products, which we estimate to be 330-380 kMT (see below),or 4403-4453 kMT altogether. Including chlorine and HC1 shipped as such (1367 kMT), totalchlorine embodied in products shipped "across the fence" was therefore 5770-5820 kMT (C1).
4. Losses of chlorine during production
Regarding HC1 production as a recycling loop, chlorine inputs to the chemical industrytaken generally may be divided into primary inputs (i.e. "virgin" chlorine producedelectrolytically from NaC1 or HC1 from KC1) and secondary inputs, consisting of secondarychlorine and HC1. As noted above, the "virgin" inputs were 8689 kMT in 1992, includingl2kMT (net) imported CHCs as mentioned previously. In addition, 5496 kMT of HC1 wasgenerated within the sector, of which (as mentioned) 863 kMT was shipped out of the sectorand 211 kMT was recycled back into chlorine. The rest was used internally as HC1.Altogether, 5496 - 211- 863 = 4492 kMT (Cl) of HC1 was recycled. In addition, 231 kMTof CHCs were recycled internally, without being converted to HC1.
Thus total chlorine reflux was 4492 + 231 = 4723 kMT (Cl), and total flux (input plusreflux) was 8689 + 4723 = 13,412 kMT based on processed inputs. If we consider "raw"chlorine inputs, instead, the total would be 9297 + 12 + 4723 = 14,032 (= 13,412 + 620,where the latter corresponds to the salt wastes in the first stage of processing). Based on theformer view, "virgin" chlorine accounts for 64.8% and recycled chlorine for 35.2% of thetotal chlorine input. Based on the latter view (which seems to us more realistic) the virgincomponent is 66.2%.
Looking at the "useful" outputs of the chemical industry (6270 IMI), shown in Figure10, in comparison with raw inputs (9306 kMT), throughputs (14,032 kMT), reflux (4723kM'I) and apparent processing losses (9306 - 6270 = 3036 kMT) — see Figure 11 — itappears at first glance that 33.7% of the chlorine flux is recycled, 44.7% is embodied inprimary products and 21.6% is lost as waste, of which perhaps 3% or so may consist oforgano-chlorines.
The foregoing waste calculations above are underestimates, however. The reason is thatsome of the identified products of the chemical industry are in fact intermediates. Forinstance, referring to Figure 9, several of the identified chlorine chemicals are actually furtherconverted within the sector, resulting in additional loss of chlorine. For instance, this iscertainly true of methyl chloride (used to make silicones) and chloroprene (used to make butylrubber). We can identify a total of 487 kMT of such "convertible" chemicals (chloroform,carbon tetrachloride, chlorobenzenes, chloroacetic acid, trichloropropane, chloroethers,chloroprene, trade EDC, methyl chloride, allyl chloride). Unfortunately, this is not all: thereis another 829 kMT of unidentified "other" products, some of which cross the fence, andsome of which do not.
The EcoTec study assists us with this problem in two ways. First, it explicitly countedall of the by-product HC1 from intermediates converted within the sector "fence" and, second,it created a special classification of ("other organics") that presumably consists of products
R. U. & L W. Ayres Lift Cycle of Chlorine: II
File CHLORINT.II as printed on June 14, 1996 Page 11
that "cross the fence", i.e. are sold for uses outside the chemical and plastics industry [EcoTec1995]. Examples of such uses (cited by EcoTec) include chlorinated paraffins andchlorobenzene/toluene. The total output in this category for Europe in 1992 (extrapolated) was364 kMT.
To confuse matters further, according to the Tecnon data (Table II) more than half(probably 60%) of the "other" category (829 kMT) consists of inorganic chemicals. Some ofthis is also sold "over the fence", but some is further converted (i.e. recycled) within thesector. Examples of the latter would include phosphorus trichloride and phosphorusoxychloride (to tricresyl phosphate for detergents), etc. We estimate that the organic fractionof "other" must have been 325-375 kMT. Some of this was converted into non-chlorinatedfinal products. (For instance, ethyl chloride is used to produce tetraethyl lead). Unfortunately,we do not know how much of the organic fraction was sold over the fence and how muchwas converted. The total of the "identified" group of candidates listed above (487 kMT) plusthe organic component in "other" (325-375 kMT) adds up to 812-862 kMT.
The mass balance principle can be applied here. According to EcoTec data, extrapolatedto 100% coverage, miscellaneous organics sold "over the fence" in 1992 totalled 364 kMT(C1 content) [EcoTec 1995]. Subtracting from the corresponding total in these categories,derived above, (812-862 kMT) implies that 450-500 kMT of chlorinated organics must havebeen consumed (i.e. converted) within the sector. In principle, this would generate either Ha,waste salt or waste organochlorines. However, all the secondary Ha has already beenaccounted for in the EcoTec study [ibid]. It follows that the chlorine content of chlorinatedorganics converted within the sector must contribute only to waste.
One implication of this correction is that the apparent total of 6270 kMT of "usefulproducts" estimated earlier is actually too high, because of double counting of (unidentified)products later converted within the sector. In fact, the total of chlorine embodied in products"crossing the fence" in 1992 was only about 5800 kMT or so (we cannot be more precise).But this means, in turn, that wastes and losses are underestimated by the same amount.Assuming the overcount of shipments was 450 kMT, the waste undercount is also 450 kMT.Instead of products accounting for 44.7% of flux (measured at the "fence"), they only accountfor 41.6%. Wastes increase from 21.6% to 24.7% of total chlorine flux (including recycling).Based on raw inputs only, products crossing the fence account for 62.6% of the chlorinecontent, while the rest is consumed or lost within the industry itself.
Obviously most of the chlorine losses within the industry occurs as sodium or calciumchlorides. This results from neutralization reactions between hydrochloric acid HC1 andcaustic soda, NaOH or lime (CaO). Certainly, most of the NaOH consumed in the chemicalindustry ends up reacting with and neutralizing one of the strong acids, either HC1 or H2SO4.3Of total NaOH production, 29% in Europe and 36% in America is used within the chemicalindustry, mostly for this purpose [USBuMines, 1994].
The composition of the CHC wastes cannot be characterized precisely in molecular termsby our imperfect mass-balance methodology. Of particular concern are emissions of EDC andVCM, both of which are produced in extremely large quantities en route to PVC. Both ofthese chemicals are highly toxic, while VCM is both toxic and also carcinogenic. 4 Thedangers have been recognized for some time, and strict standards have been enforced, inEurope and America, both on worker safety and on the allowable content of unpolymerizedVCM in PVC products. However, according to our calculations, Figure 5, about 28 kMT ofEDC was lost or unaccounted for in production wastes (pre-treatment) in Europe in 1992, orabout 0.5% of total production. Similarly, our calculations suggest that roughly 1% of inputVCM is not converted to PVC; of this 0.75% of the produced VCM, or 35 kMT is probably
R. U. & L W. Ayres Life Cycle of Chlorine: II
File CHLORINT.II as printed on June 14, 1996 Page 12
lost in process wastes (although some of this may be incorporated in the PVC itself). Clearly,emissions control at the plant level can — and presumably does — reduce these losses.
There are other scattered data that offer some confirming clues. We have no specificinformation on EDC emissions, unfortunately. As regards VCM, 330 tonnes was released tothe environment in Germany during 1989 [Claus et al 1990]. This would be around 0.03%of German production. One plant in Sweden emitted 140 tonnes of VCM in 1991 accordingto its own environmental report [Norsk Hydro 1992], while another in the U.K. emitted 1700tonnes of VCM in 1991 [ICI 1992]. This is probably not less than 0.5% of production. ForEurope as a whole (where standards are less tight than in Germany) it is plausible that VCMemissions still amount to 0.2-0.3% of production.
As regards other wastes, the foregoing analysis represents a likely upper limit to usefulproducts and, hence, a lower limit to CHC production and waste generation. Chlorine notembodied in products and not converted to HC1, of course, ends up as inorganic chlorides(NaC1, CaC12) or as unrecovered CHCs. One can estimate the NaC1 wastes directly in the caseof processes using NaOH (for instance, the epichlorohydrin chain). In the case of propylenechlorination and some inorganic products, we do not have enough information to characterizethe wastes more precisely. This would be a useful object of future research.
Endnotes
1. We wish to acknowledge the valuable assistance and criticisms of Donald Rogich, Director, Office of MineralCommodities, Dennis Kostick, commodity specialist for salt, Bureau of Mines, U.S. Department of the Interior,Washington D.C. Philippe Feron, Executive Director, Euro Chlor, Reinhard Joas, EcoTec, and Peter Johnston,Group Manager, European Chlorinated Solvent Association.
2. However, sodium chlorate (NaC1O 3) — which yields chlorine dioxide on site — is also produced and used insignificant quantities for pulp bleaching. This chemical is not produced from chlorine, however. It is made byelectrolysis of salt. Sodium hypochlorite (NaCIO) is another widely used bleach, though we are not aware ofany use in pulp bleaching.
3. The latter reaction yields sodium sulfate, which is a product that has a significant market in the paper industry.However it has no importance for this analysis, except insofar as it accounts for part of the NaOH that isproduced initially as a by-product of chlorine production.
4. At least 157 deaths had been attributed to VCM poisoning in Germany, up to 1990, and at least 140 additionaldeaths were anticipated before 2020 [Kollmann et al 1990].
R. U. & L W. Ayres Life Cycle of Chlorine: II
File CHLORINT.II as printed on June 14, 1996 Page 13
References
[Ayres 1995] Ayres, Robert U., "Life Cycle Analysis: A Critique", Resources, Conservation & Recycling 14,1995 :199-223. [ Also INSEAD Working Paper 94/33/EPS]
[Ayres et al 1995] Ayres, Robert U., Leslie W. Ayres, Paolo Frank, Howard Lee, Nichole Wolfgang & PaulM. Weaver, Materials-Optimization in the Production of Major Finished Materials, Final Report (ContractBRE2-CT93-0894), Center for the Management of Environmental Resources of INSEAD, Fontainebleau,France, January 25, 1995. [Prepared for the European Commission DGXII, Science Research &Development]
[Claus et al 1990] Claus, F., H. Frieze & D. Gremler Es geht auch ohne PVC: Einsatz-Entsorgung-ErsatzHamburg: Rasch und Miring 1990.
[ECOPLAN undated] EcoPlan, Personal communication, EcoPlan International, Paris.
[EcoTec 1995] "Chlorine Flow in Europe", Executive Summary; Handbook of Chlorine Chemistry I - 1992:Products, Companies, Material Flows. EcoTec (Institut fiir Chemische-Technische und OkonomischeForschung und Beratung), Munich, October 1995, 2nd Edition.
[ECSA 1993] Brochure from the European Chlorinated Solvents Association, Euro Chlor, Brussels.
[Euro Chlor 1995] Euro Chlor. Annual Review of Euro Chlor Statistics, Euro Chlor, Brussels, 1995.
[Fonds Chem 1992] Fonds der Chemischen Industrie, Die Chemie des Chlors und seiner Verbindungen,Folienserie des Fonds der Chemischen Industrie (24), Fonds der Chemischen Industrie, Frankfurt am Main,1992.
[ICI 1992] "UK Environmental Brochure", Brochure from ICI, Merseyside, UK 1992.
[Kollmann et al 1990] Kollmann, H. et al "StoffstrOme und Emissionen durch Produktion, Verwendung undEntsorgung von PVC" JILL Spez-543, Jiilich, 1990.
[Norsk Hydro 1992] "PVC and the Environment", Brochure from Norsk Hydro, 1992.
[SRI 1989] "Chlorine & Alkali Chemicals" in: Chemical Economics Handbook, SRI International, Palo Alto, CA,August, 1989.
[Tecnon 1994] Personal communication, Tecnon Ltd., UK, 1994.
[Thornton 1991] Thornton, Joe. Chlorine, Human Health the the Environment, Greenpeace, Washington DC,1991.
[USBuMines 1994] Mineral Commodities Summaries, United States Bureau of Mines, Washington DC, 1994.
[Wolfgang & Ayres 1995] Wolfgang, Nichole & Leslie W. Ayres. Simulation as a Useful Tool in ExaminingWaste Production, INSEAD, Fontainebleau, France, April 1995.
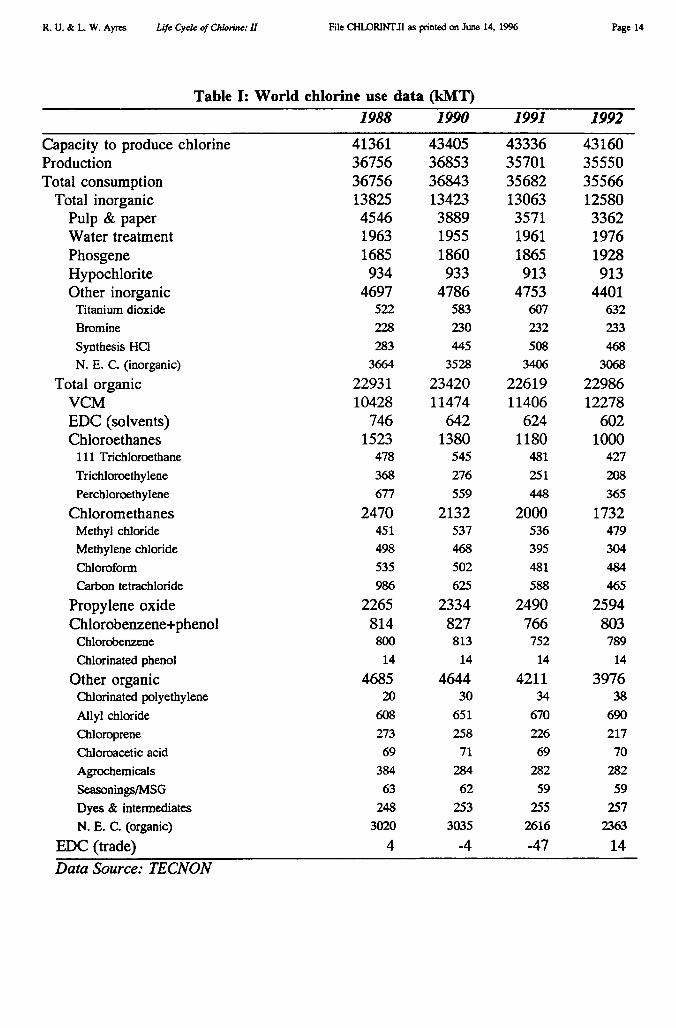
R. U. & L W. Ayres Life Cycle of Chlorine: H File CHLORINT.II as printed on June 14, 1996
Table I: World chlorine use data (1(111T)
Page 14
1988 1990 1991 1992
Capacity to produce chlorine 41361 43405 43336 43160Production 36756 36853 35701 35550Total consumption 36756 36843 35682 35566
Total inorganic 13825 13423 13063 12580Pulp & paper 4546 3889 3571 3362Water treatment 1963 1955 1961 1976Phosgene 1685 1860 1865 1928Hypochlorite 934 933 913 913Other inorganic 4697 4786 4753 4401
Titanium dioxide 522 583 607 632Bromine 228 230 232 233
Synthesis HO 283 445 508 468N. E. C. (inorganic) 3664 3528 3406 3068
Total organic 22931 23420 22619 22986VCM 10428 11474 11406 12278EDC (solvents) 746 642 624 602Chloroethanes 1523 1380 1180 1000
111 Trichloroethane 478 545 481 427
Trichloroethylene 368 276 251 208
Perchloroethylene 677 559 448 365
Chloromethanes 2470 2132 2000 1732Methyl chloride 451 537 536 479Methylene chloride 498 468 395 304
Chloroform 535 502 481 484
Carbon tetrachloride 986 625 588 465
Propylene oxideChlorobenzene+phenol
ChlorobenzeneChlorinated phenol
Other organic
2265814800
14
4685
2334827
81314
4644
2490766752
14
4211
2594803
789
14
3976Chlorinated polyethylene 20 30 34 38
Ally! chloride 608 651 670 690
Chloroprene 273 258 226 217
Chloroacetic acid 69 71 69 70
Agrochemicals 384 284 282 282
Seasonings/MSG 63 62 59 59
Dyes & intermediates 248 253 255 257
N. E. C. (organic) 3020 3035 2616 2363
EDC (trade) 4 -4 -47 14
Data Source: TECNON
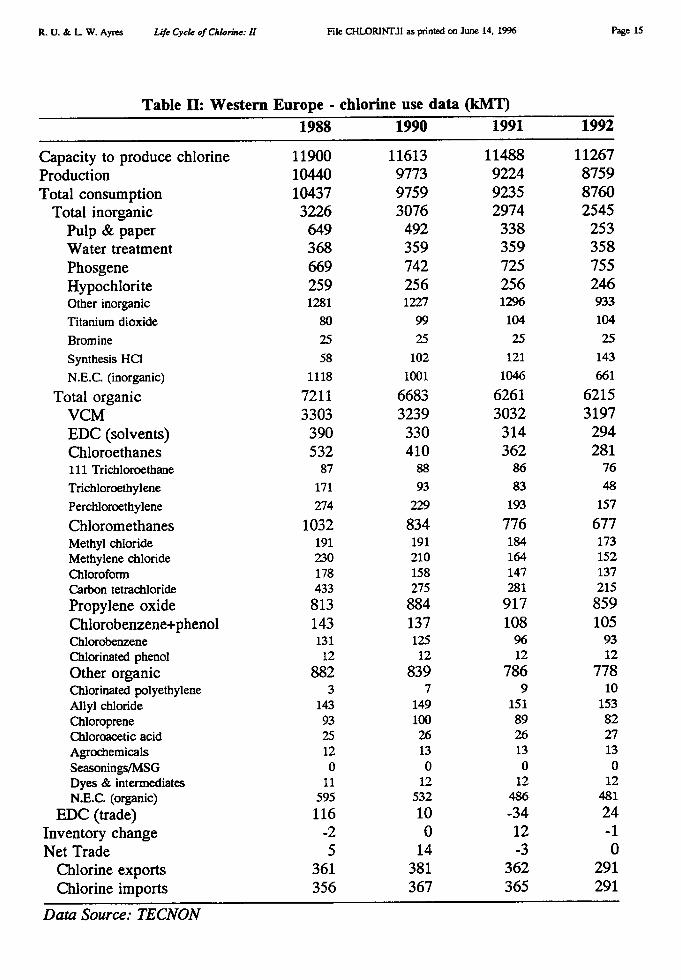
R. U. & L W. Ayres Life Cycle of Chlorine: H
File CHLORINTII as printed on June 14, 1996 Page 15
Table II: Western Europe - chlorine use data (kMT)1988 1990 1991 1992
Capacity to produce chlorine 11900 11613 11488 11267Production 10440 9773 9224 8759Total consumption 10437 9759 9235 8760
Total inorganic 3226 3076 2974 2545Pulp & paper 649 492 338 253Water treatment 368 359 359 358Phosgene 669 742 725 755Hypochlorite 259 256 256 246Other inorganic 1281 1227 1296 933
Titanium dioxide 80 99 104 104
Bromine 25 25 25 25
Synthesis Ha 58 102 121 143
N.E.C. (inorganic) 1118 1001 1046 661
Total organicVCMEDC (solvents)Chloroethanes
72113303390532
66833239330410
62613032314362
62153197294281
111 Trichloroethane 87 88 86 76
Trichloroethylene 171 93 83 48
Perchloroethylene 274 229 193 157
Chloromethanes 1032 834 776 677Methyl chloride 191 191 184 173Methylene chloride 230 210 164 152Chloroform 178 158 147 137Carbon tetrachloride 433 275 281 215
Propylene oxide 813 884 917 859Chlorobenzene+phenol 143 137 108 105Chlorobenzene 131 125 96 93Chlorinated phenol 12 12 12 12
Other organic 882 839 786 778Chlorinated polyethylene 3 7 9 10Allyl chloride 143 149 151 153Chloroprene 93 100 89 82Chloroacetic acid 25 26 26 27Agrochemicals 12 13 13 13Seasonings/MSG 0 0 0 0Dyes & intermediates 11 12 12 12N.E.C. (organic) 595 532 486 481
EDC (trade) 116 10 -34 24Inventory change -2 0 12 -1Net Trade 5 14 -3 0
Chlorine exports 361 381 362 291Chlorine imports 356 367 365 291
Data Source: TECNON
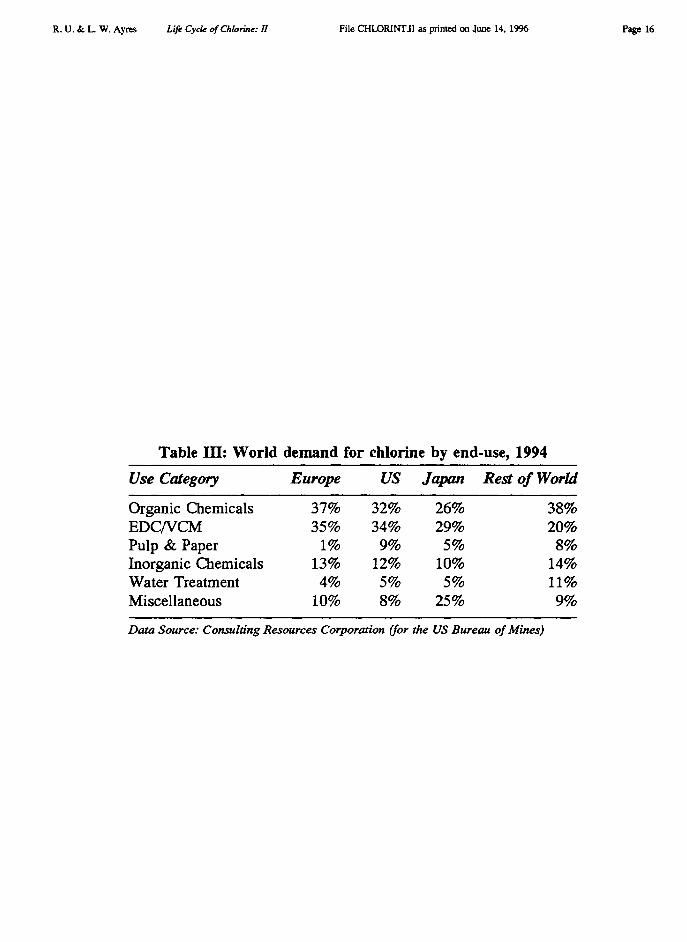
R. U. & L W. Ayres Life Cycle of Chlorine: H
File CHLORINTII as printed on June 14, 1996 Page 16
Table III: World demand for chlorine by end-use, 1994
Use Category Europe US Japan Rest of World
Organic ChemicalsEDC/VCMPulp & PaperInorganic ChemicalsWater TreatmentMiscellaneous
37% 32% 26% 38%35% 34% 29% 20%
1% 9% 5% 8%13% 12% 10% 14%4% 5% 5% 11%
10% 8% 25% 9%
Data Source: Consulting Resources Corporation (for the US Bureau of Mines)
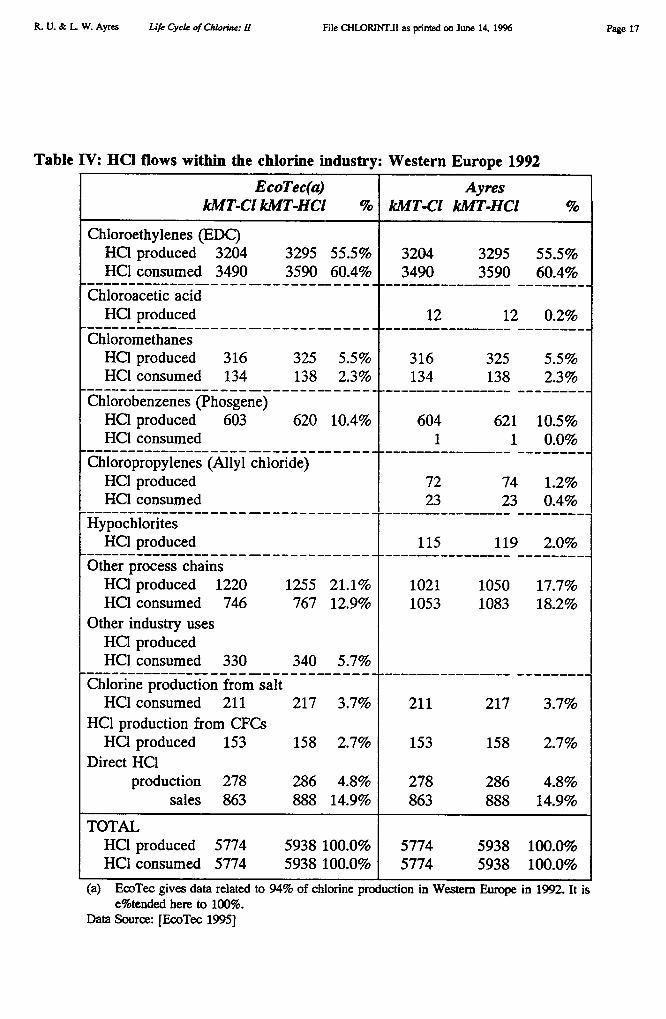
R. U. & L W. Ayres Life Cycle of Chlorine: II
File CHLORINT.II as printed on June 14, 1996 Page 17
Table IV: HC1 flows within the chlorine industry: Western Europe 1992
EcoTec(a)kMT-C1 kMT-HC1 %
AyreskNIT-C1 kIVIT-HC1 %
Chloroethylenes (EDC)HCI produced 3204 3295 55.5% 3204 3295 55.5%HC1 consumed 3490 3590 60.4% 3490 3590 60.4%
Chloroacetic acidHC1 produced 12 12 0.2%
ChloromethanesHCI produced 316 325 5.5% 316 325 5.5%HC1 consumed 134 138 2.3% 134 138 2.3%
Chlorobenzenes (Phosgene)HC1 produced 603 620 10.4% 604 621 10.5%HC1 consumed 1 1 0.0%
Chloropropylenes (Ally! chloride)Ha produced 72 74 1.2%HC1 consumed 23 23 0.4%
HypochioritesHC1 produced 115 119 2.0%
Other process chainsHa produced 1220 1255 21.1% 1021 1050 17.7%HC! consumed 746 767 12.9% 1053 1083 18.2%
Other industry usesHC1 producedHC1 consumed 330 340 5.7%
Chlorine production from saltHC1 consumed 211 217 3.7% 211 217 3.7%
HC1 production from CFCsHC1 produced 153 158 2.7% 153 158 2.7%
Direct HC1production 278 286 4.8% 278 286 4.8%
sales 863 888 14.9% 863 888 14.9%
TOTALHC! produced 5774 5938 100.0% 5774 5938 100.0%HC1 consumed 5774 5938 100.0% 5774 5938 100.0%
(a) EcoTec gives data related to 94% of chlorine production in Western Europe in 1992. It ise%tended here to 100%.
Data Source: [EcoTec 1995]
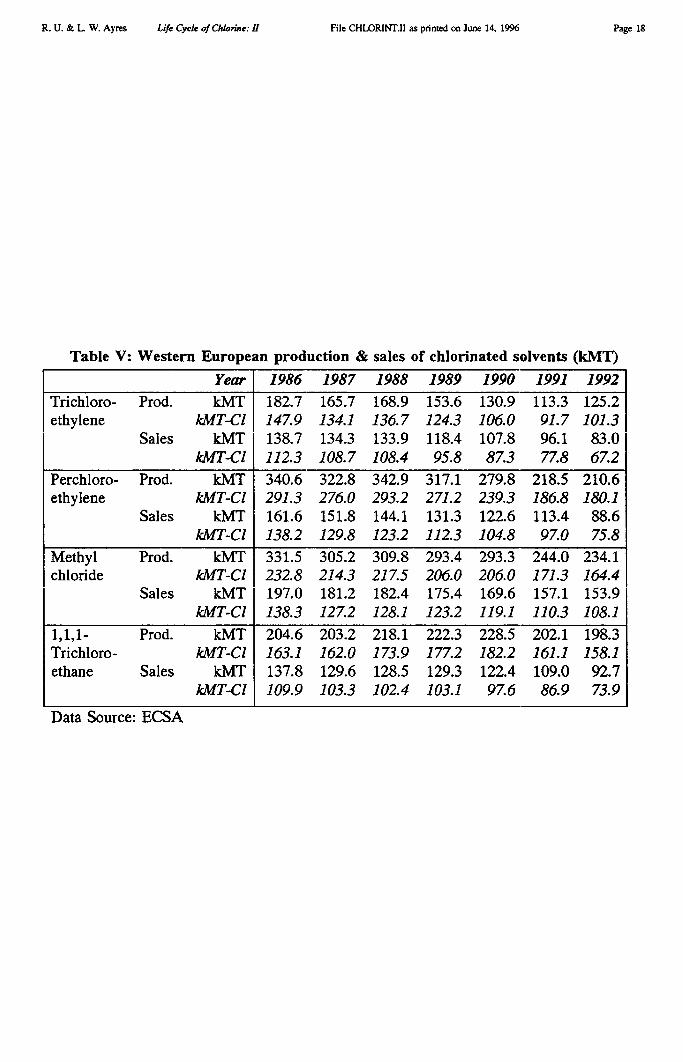
R. U. & L W. Ayres Life Cycle of Chlorine: H File CHLORINT.II as printed on June 14, 19% Page 18
Table V: Western European production & sales of chlorinated solvents (kMT)Year 1986 1987 1988 1989 1990 1991 1992
Trichloro- Prod. kMT 182.7 165.7 168.9 153.6 130.9 113.3 125.2ethylene kMT-C1 147.9 134.1 136.7 124.3 106.0 91.7 101.3
Sales kMT 138.7 134.3 133.9 118.4 107.8 96.1 83.0kMT-C1 112.3 108.7 108.4 95.8 87.3 77.8 67.2
Perchloro- Prod. kMT 340.6 322.8 342.9 317.1 279.8 218.5 210.6ethylene kMT-C1 291.3 276.0 293.2 271.2 239.3 186.8 180.1
Sales kMT 161.6 151.8 144.1 131.3 122.6 113.4 88.6kMT-C1 138.2 129.8 123.2 112.3 104.8 97.0 75.8
Methyl Prod. kMT 331.5 305.2 309.8 293.4 293.3 244.0 234.1chloride kMT-C1 232.8 214.3 217.5 206.0 206.0 171.3 164.4
Sales kMT 197.0 181.2 182.4 175.4 169.6 157.1 153.9kMT-C1 138.3 127.2 128.1 123.2 119.1 110.3 108.1
1,1,1- Prod. kMT 204.6 203.2 218.1 222.3 228.5 202.1 198.3Trichloro- kMT-C1 163.1 162.0 173.9 177.2 182.2 161.1 158.1ethane Sales kMT 137.8 129.6 128.5 129.3 122.4 109.0 92.7
kMT-C1 109.9 103.3 102.4 103.1 97.6 86.9 73.9
Data Source: ECSA
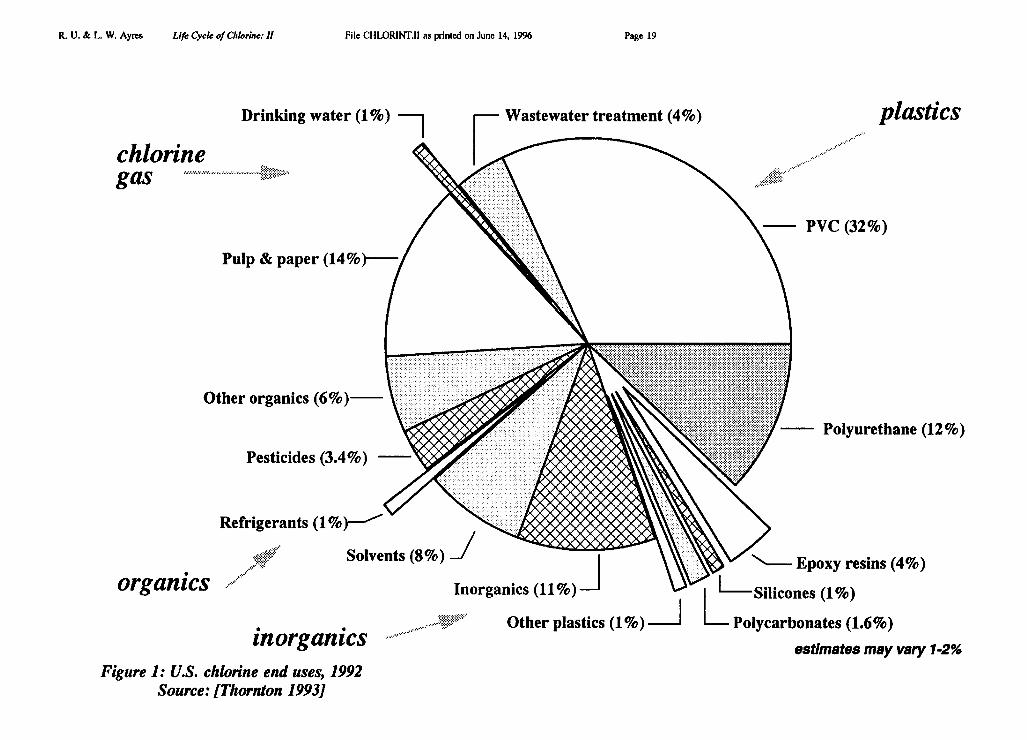
R. U. & L W. Ayres Life Cycle of Chlorine:!!
File CHLORINT.II as printed on June 14, 1996 Page 19
plasticsDrinking water (1%) Wastewater treatment (4%)
chlorinegas
Pulp & paper (14%)--
Other organics (6%)
Pesticides (3.4%) -
Refrigerants (1 %)-
Polyurethane (12%)
Epoxy resins (4%)organics Inorganics (11%)
inorganics Other plastics (1%)
Figure 1: U.S. chlorine end uses, 1992Source: [Thornton 1993]
I '_Silicones (1%)
Polycarbonates (1.6%)
estimates may vary 1-2%
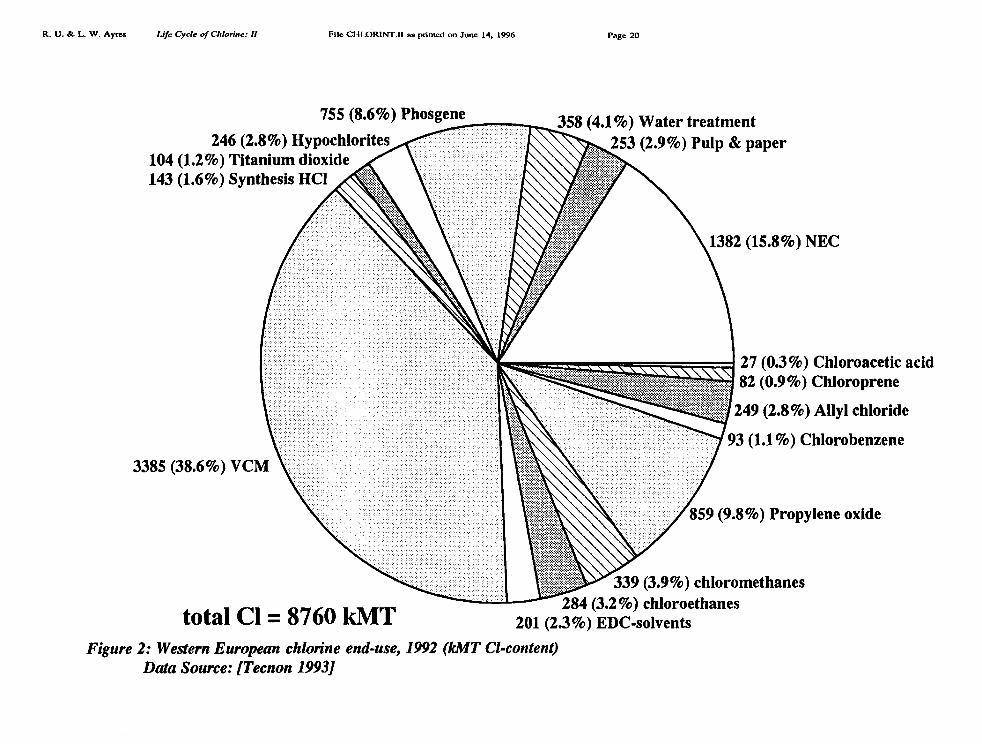
755 (8.6%) Phosgene
246 (2.8%) Hypochlorites104 (1.2%) Titanium dioxide143 (1.6%) Synthesis HC1
358 (4.1%) Water treatment253 (2.9%) Pulp & paper
1382 (15.8%) NEC
27 (0.3%) Chloroacetic acid82 (0.9%) Chloroprene
249 (2.8%) Allyl chloride
93 (1.1%) Chlorobenzene
3385 (38.6%) VCM
859 (9.8%) Propylene oxide
339 (3.9%) chloromethanes284 (3.2%) chloroethanes
201 (2.3%) EDC-solventstotal CI 8760 kMT
R. U. & L. W. Ayres Life Cycle of Chlorine: II
File aiLORINT.11 as printed on June 14, 1996 Page 20
Figure 2: Western European chlorine end-use, 1992 (kMT Cl-content)Data Source: [Tecnon 1993]
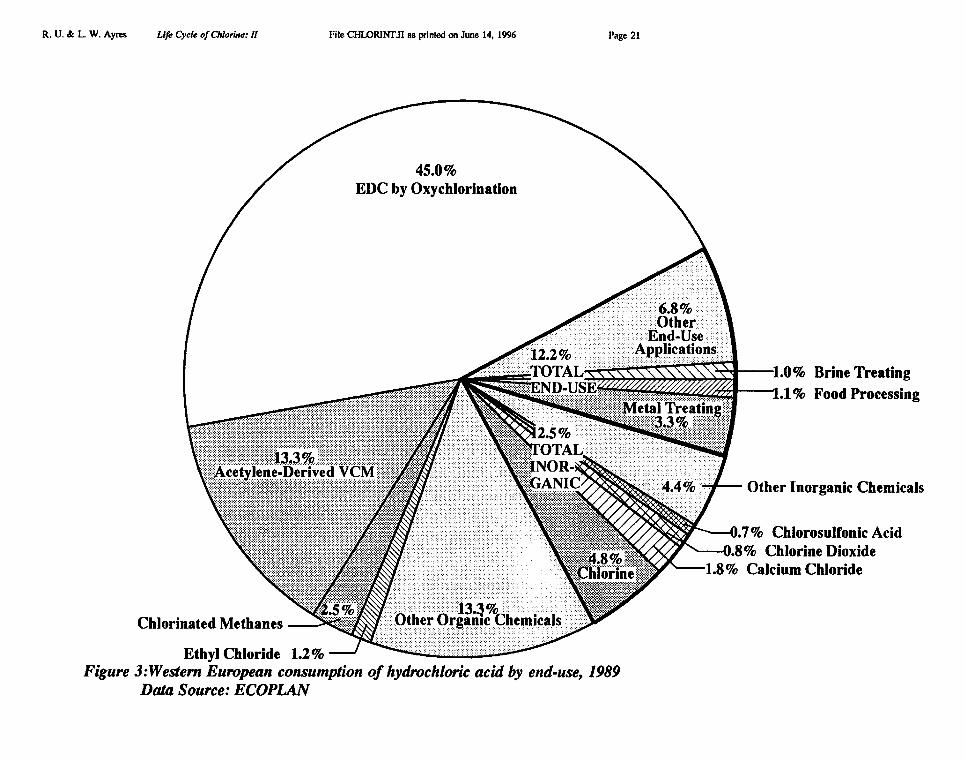
R. U. & L W. Ayres Life Cycle of Chlorine: II
File CHLORINT.I1 as printed on June 14, 1996
Page 21
..Other-:...End-Use :-.
Applications12.2%•.TOTAL loom.n
Metal Treatin
1.0% Brine Treating
.1% Food Processing
lene-DerivedV(Other Inorganic Chemicals
.7% Chlorosulfonic Acid.8% Chlorine Dioxide
1.8% Calcium Chloride
Chlorinated Methanes Other Or
Ethyl Chloride 1.2%Figure 3:Western European consumption of hydrochloric acid by end-use, 1989
Data Source: ECOPLAN
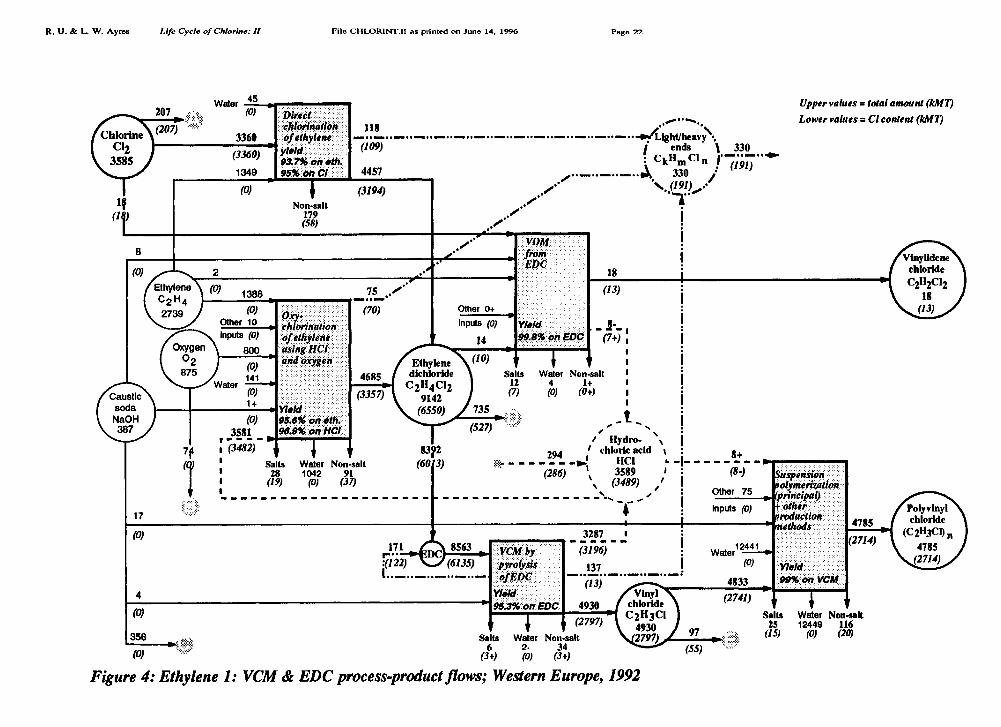
•(3194)
Yield99% on VCM
R. U. & L. W. Ayres Life Cycle of Chlorine: I!
File CHLORINTAI as printed on June 14, 1996 Page 22
1(1
45 Water207 (0)
c I nal on:
3360 of ethylene'
(3360) Yield.93.7% oh oth.
1349 9596'on Cl (0)
Non•salt179(58)
1.0. • •
••1•1•111••■••••••••• ••••■■•••••■••••■•■•••■••••••■••••••■••■11=10•■••■ • • ••••• • • • • - 4.ight/heavy
ends 330CkHm CI n
330■„ (191)0,0-
.1**
(207) 118(109)
4457 • • 111•■•••
(191)
Upper values = total amount (kMT)Lower values = CI content (kMT)
17
(0)3581 • (3482)
Salts28(19)
95.1 on eth•
Oxchlorination:'of ethylene
and oxygen Ethylenedichloride
C2H4C129142
(6550)
VOM
:.EDC
(0)
4(0)
18(13)
n phuet sr 0(0+) weld8•
14 99.8% on EDC (7+)
(10) 1Salts Water Non•salt I
12 4 1+ I(7) (0) (0+)
735•
(527) v" .•Hydro- - N I
294 chloricciacid
(286) 3589 l •(3489) /1
,
1 •3287 I
(3196)137(13)
4930(2797)
8322Water Non•salt (6013)
1042 91(0) (37)
(3357)
171(12) (6135)• • • • =MD • • IMMO • • • • _I
byrOlYSIS
,f EDC
913% on EDC
Waterater (0)
4833(2741)
(8)
Other 75
Inputs (0)
uspensionolymerizationpnncipal)
otherreductionethods
Polyvinylchloride
(C2H3C1) n4785
(2714)
Salts Water Non-salt25 12449 116
(15) (0) (20)
8+
97Salts Water Non-salt
6 2- 34 (SS) '••••••••
(3+) 0) po
Figure 4: Ethylene 1: VCM & EDC process-product flows; Western Europe, 1992
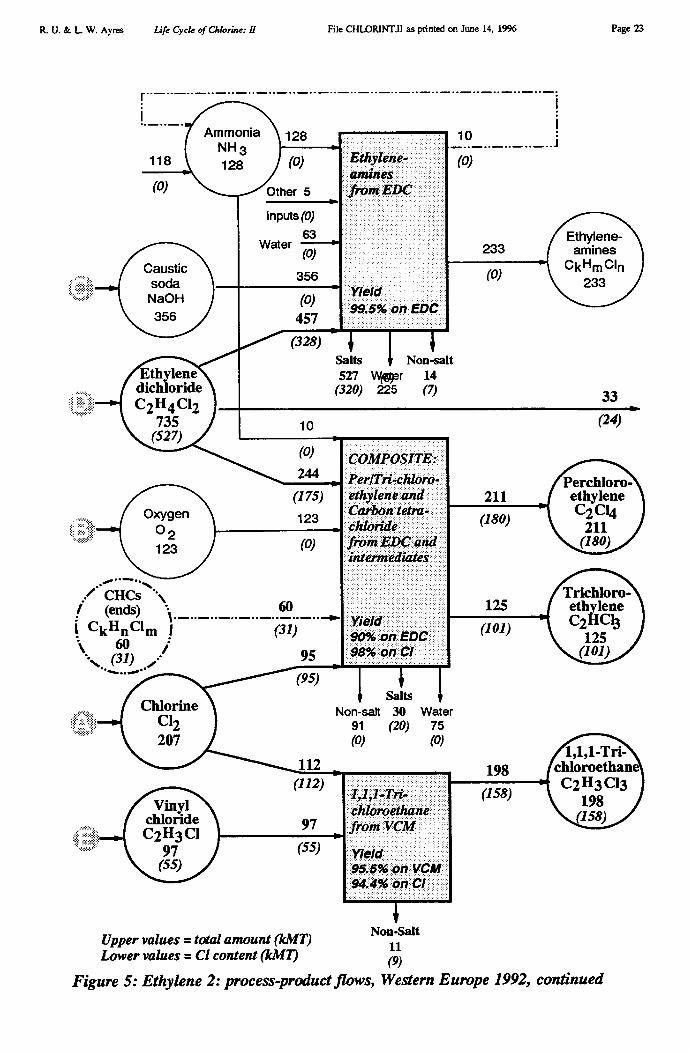
128
II
ChlorineC12207
(55)
AmmoniaNH 3128118
(0)
( Causticsoda
NaOH356
EthylenedichlorideC2H4C12
735(527)
10
Salts Non-salt527 Weser 14(320) 225 (7)
(175)
123
(0)
/ CHCs •
(ends) \*".....•• —••—••—••—•.
60CkHn Cl m 1 (31)
60/(31) / 95
(95)
(0)
244COMPOSITE:
Perchloro-ethyleneC2C14
211(180)
Yield9 on ED98% on CI
SaltsNon-salt 30 Water
91 (20) 75(0) (0)
chlomet nerom VCM
eldn VC
on
(328)
33
(24)
211(180)
112(112)
198
(158)
Other 5
inputs (0)63
Water(0)
356
(0)457
233
(0)Yield995% on EDC
Ethylene-amines
CkHmCIn233
R. U. & L W. Ayres Life Cycle of Chlorine: H
File CHLOR1NT.11 as printed on June 14, 1996 Page 23
Upper values = total amount (kMT)Lower values = Cl content (kMT)
Non-Salt11(9)
Figure 5: Ethylene 2: process-product flows, Western Europe 1992, continued
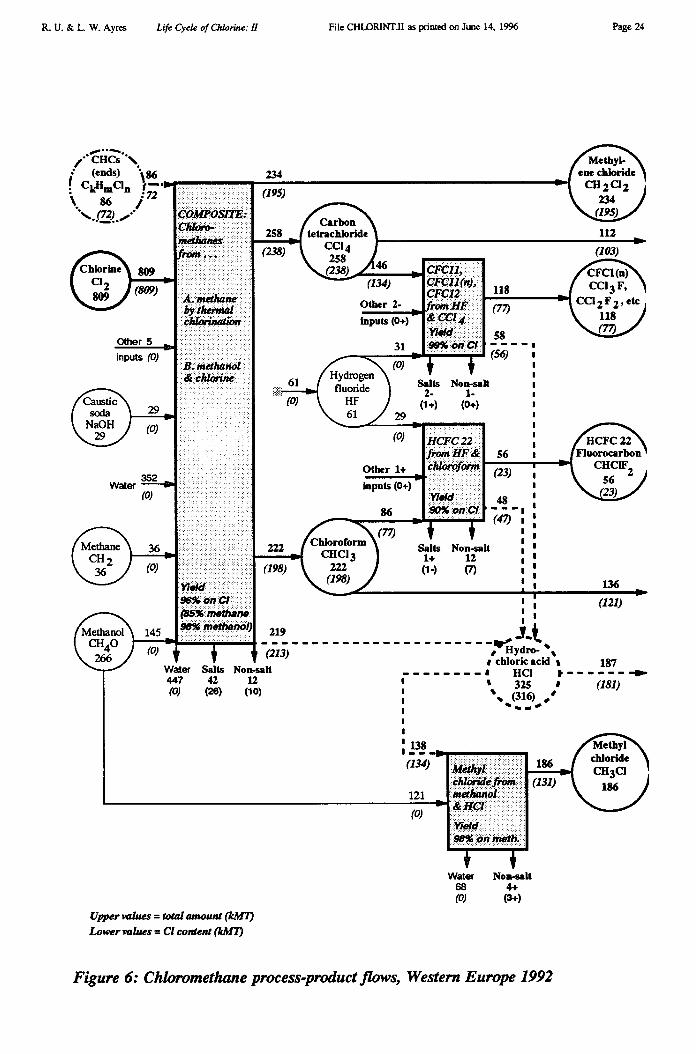
(198)
:Weld90%.on:
(47)
CHCs(ends) \86
86 72
ChlorineCl 2809
Other 5inputs (0)
29(0)
Water(0)
36(0)
234
COMPOSITE:
ethanes
'methaneby thermalchlorination
B. methanol& chlorine:
no,
Yield96% onCt
methane98% methanol)
(213)Non-sari
12(10)
Salts Non-salt1+ 12(1-) (7)
(238)
it# Hydro- s♦
♦ chloric acid ♦ 187a HCI
325 • (181)ts (316) #°
is• •
Carbontetrachloride
CCI 4258
(238)
46 CFC11,
(134) CFC11(n),
Other 2- apirCFontaH2F
inputs (0+) & CCI4Yield
31 :9916 on Cl
Other 1+inputs (0+)
86
ChloroformCHC13
222(198)
(77)
809
(809)
352
2580
222
219
(77)
118
Methyl-ene chloride
CH 2 a 2234
(195)
58
(56)
Non-salt1-
(0+)
HCFC 2256 Fluorocarbon
■ CHC1F2(23) i 56
(195)
112
(103)
(23)
136
(121)
R. U. & L W. Ayres Life Cycle of Chlorine: H
File CHLORINT.II as printed on June 14, 1996 Page 24
Water Non-salt68 4+(0) (3+)
Upper values = total amount (kM7)Lower values = Cl content (UM
Figure 6: Chloromethane process-product flows, Western Europe 1992
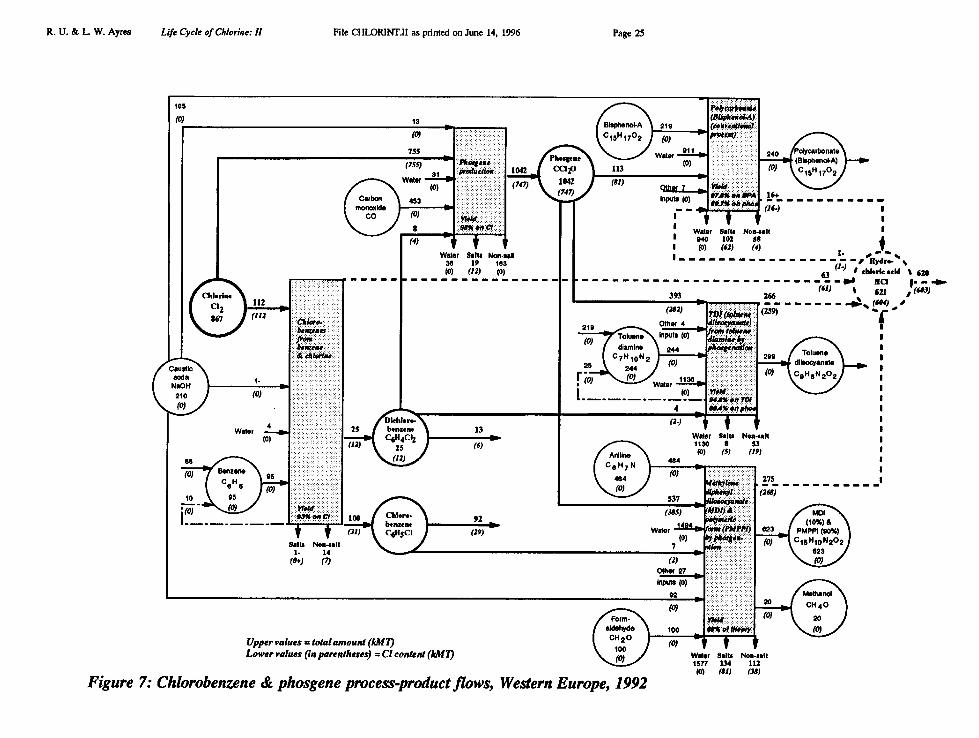
Meths; \20 tCH 40(0) 20
ati:4642. (0)
Water Salts Non-salt
1577 134 112(0) (811 (381
(0)
411 979;60:011ZetInputs 03) so 7,, oh0,4
11:1 W94atoe r S1a012ts No niss a t
Hydro- •1- • "' •
I (0) (62) (4)
63 (1) 6 eidetic acid • 620
Water Salts Non•salt1130 8 53(0) (5) (19)
Upper values = total amount (kMT)Lower values (in parentheses) = CI content (kMT)
Form-aldehydeCH 20
100(0)
R. U. I L W. Ayres Life Cycle of Chlorine: II
File CHLORKT.11 as printed on June 14, 1996
Page 25
Figure 7: Chlorobenzene & phosgene process-product flows, Western Europe, 1992
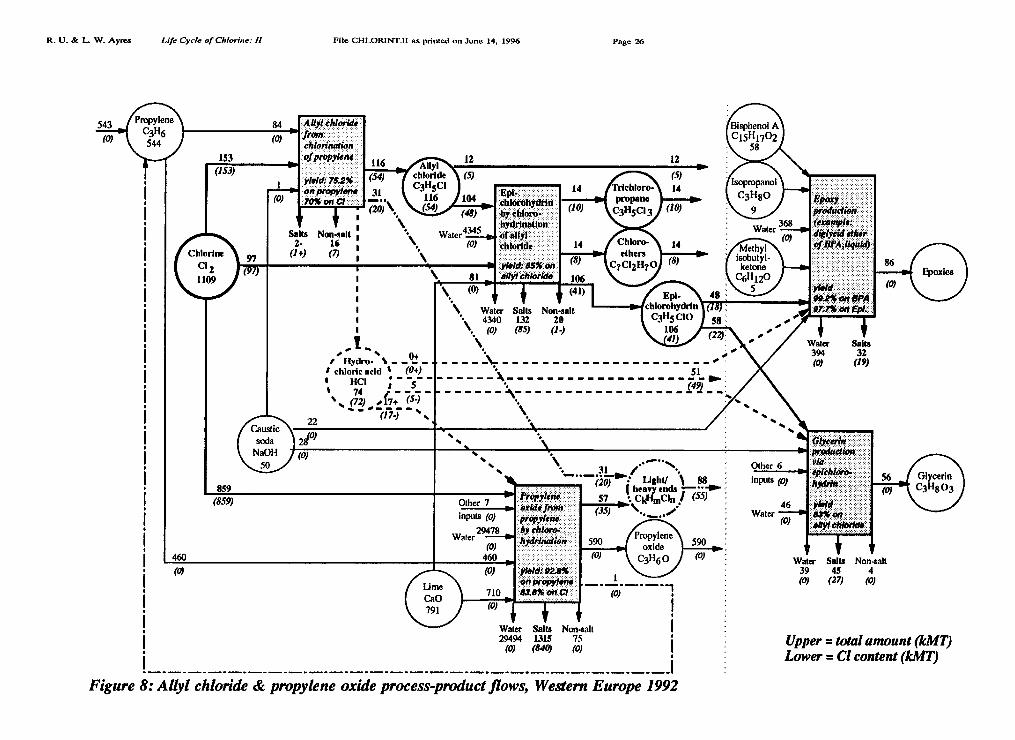
eitich 56Other 6inputs (0)
Other 7
R. U. & L. W. Ayres Life Cycle of Chlorine: H
File CHLORINT.II as printed on June 14, 1996 Page 26
(153)153
(97)97
(5)on riropylirna,. 31 14
—..t :;chottqff---Fr (20) N. (10)(48) by riled1
Salts Non-salt 1water4_03452- 16 ,
(14.) (7) ; • (0) chloride 14
• ::061(1:.:88,6:0:
AllYI chloridefrontchlorinationof propylene
yield: 75.2% (54)
22
HCI •I 5• 74 j – –„–,• (72) • 17+ (31
%•
•Hydro• 0+
chloric acid • (0+)
1 si :siallil:hicirldal:.*----0-1
\ (0)1 \ Water Salts Non-salt
i\ 4340
(85) 20
) (.1)\
\•
116 12
14(10)
12(5)
14
(22)Water Salts
• 394 32(0) (19)
51 •••(49)
48
86
(0)
543(0)
Water --So
• 31 /........."*(20) 1-18h1/ 1 88_
heavy ends '•—, • •4*4.0100:, 57 • CkHmCln 1 (55)
0**Off••• (35) W.\ :
-*•i'll--:,.. '' .•by 0?0,..*::. rpytene
...ift 61WHOIr 590 590oxide(0) (0)
(0) (0) yield 021%I o" 1
710 838% on CI (0)90, (0)
• Water Salts Non-saltI 29494 1315 75
(0) (840) (0)
Figure 8: Ally! chloride & propylene oxide process-product flows, Western Europe 1992
859 (0)
46Water —I°(0)
Water Salts Non-salt39 45 4(0) (27) (0)
inputs (0)29478
(0)460
Upper = total amount (kMT)Lower = Cl content (kMT)
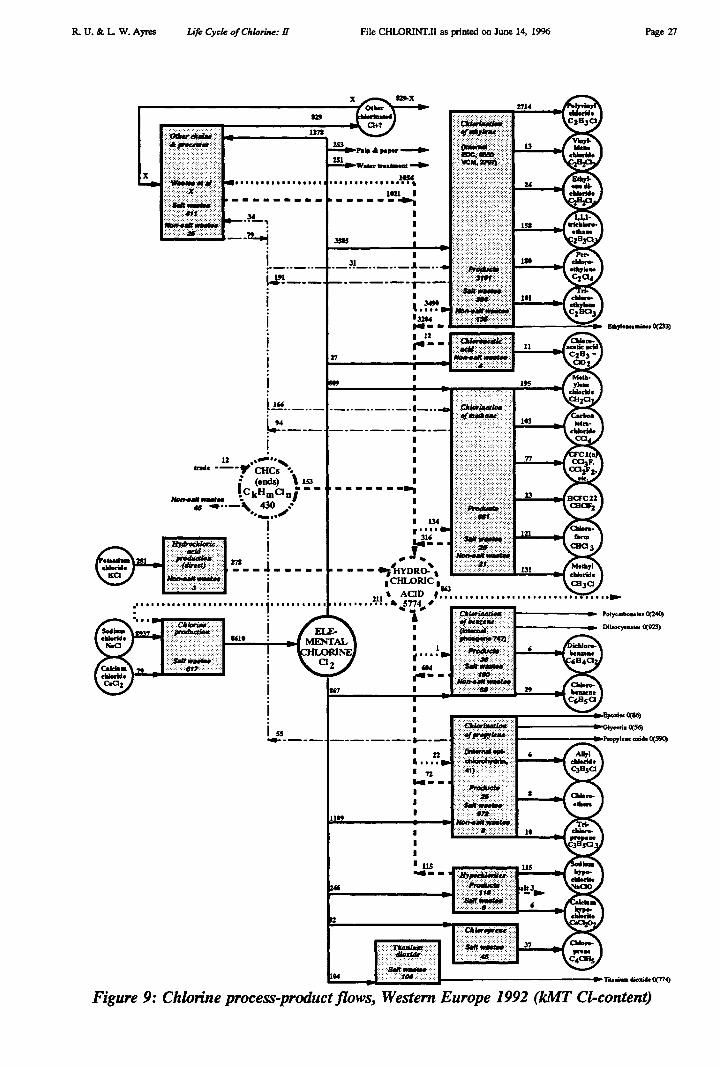
R. U. & L W. Ayres Life Cycle of Chlorine: H
File CHLORINT.II as printed on June 14, 1996 Page 27
Figure 9: Chlorine process-product flows, Western Europe 1992 (kMT Cl-content)
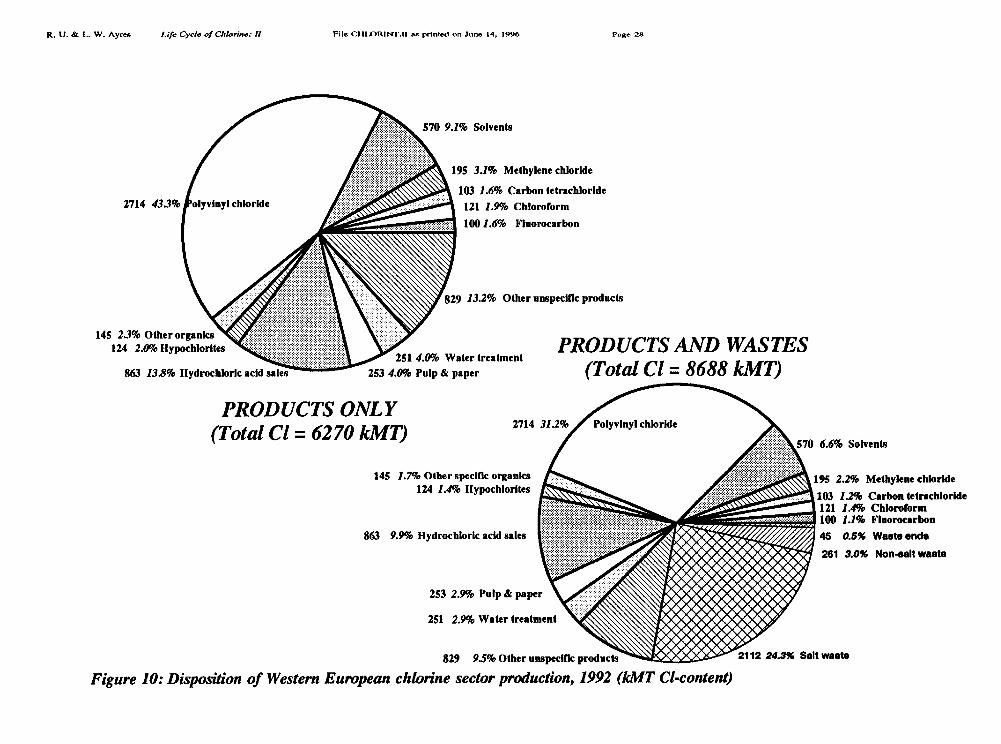
570 9.1% Solvents
195 3.1% Methylene chloride
103 1.6% Carbon tetrachloride121 1.9% Chloroform100 1.6% Fluorocarbon
829 13.2% Other unspecific products
PRODUCTS AND WASTES(Total Cl = 8688 kMT)
2714 433%
145 2.3% Other organics124 2.0% Hypochlorites
251 4.0% Water treatment863 13.8% Hydrochloric acid sales 253 4.0% Pulp & paper
PRODUCTS ONLY(Total Cl = 6270 kMT)
570 6.6% Solvents
145 1.7% Other specific organics124 1.4% Hypochlorites
863 9.9% Hydrochloric acid sales
195 2.2% Methylene chloride103 1.2% Carbon tetrachloride121 1.4% Chloroform100 1.1% Fluorocarbon45 0.5% Waste ends
261 3.0% Non•salt waste
253 2.9% Pulp & paper
251 2.9% Water treatment
829 9.5% Other unspecific products 2112 24.3% Salt waste
R. U. & L. W. Ayres Life Cycle of Chlorine: H
File CHLORINT.II as printed on June 14, 1996 Page 28
Figure 10: Disposition of Western European chlorine sector production, 1992 (kMT Cl-content)
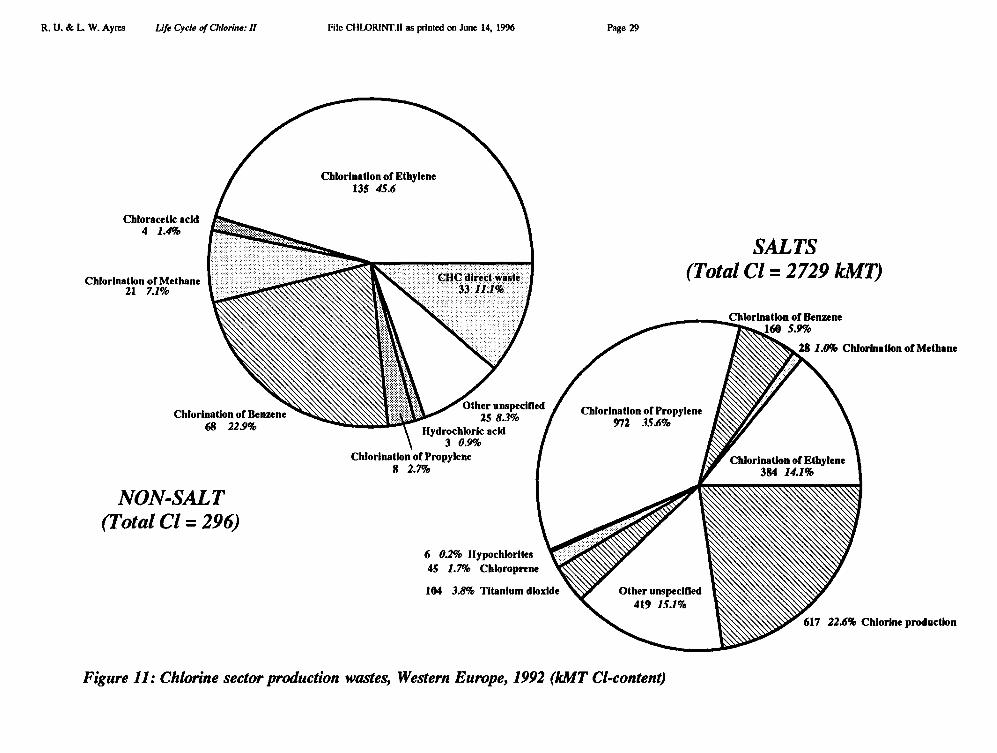
\ \41\Chlorination of Benzene
Other unspecified25 8.3%
Hydrochloric acid3 0.9%
Chlorination of Propylene8 2.7%
68 22.9%
Chlorination of Ethylene384 14.1%
R. U. I L. W. Ayres Life Cycle of Chlorine: H
File CHLORINT.11 as printed on June 14, 1996
Page 29
Chlorination of Ethylene135 45.6
Chloracetic acid4 1.4%
SALTS(Total Cl = 2729 kMT)Chlorination of Methane
21 7.1%
Chlorination of Benzene160 5.9%
28 1.0% Chlorination of Methane
Chlorination of Propylene972 35.6%
NON-SALT(Total Cl = 296)
6 0.2% Hypochlorites45 1.7% Chloroprene
104 3.8% Titanium dioxide Other unspecified419 15.1%
617 22.6% Chlorine production
Figure 11: Chlorine sector production wastes, Western Europe, 1992 (kMT Cl-content)
THE LIFE-CYCLE OF CHLORINE: PART IIIACCOUNTING FOR FINAL USE'
Robert U. Ayres
INSEAD, Fontainebleau, France
June 1996
Abstract
In two previous papers of this series we have reviewed the major processes of chlorineproduction (Part I) and its intermediate uses, and waste products, in the production of otherchemicals (Part II). In this paper we consider some of the final uses of the element in theindustrial economy the uses of the most important chlorinated compounds. We summarizeknown evidence regarding their environmental fates.
In the case of Europe, 504 kMT of elemental chlorine was consumed outside thechemical industry in 1992, half for pulp bleaching and half for water treatment. Also, 863kMT of HC1 was consumed for a variety of end uses, including metal treatment, foodprocessing, brine treatment and cleaning purposes. Most of this chlorine ends up as inorganicchlorides (salt), although paper pulp bleaching generates significant quantities of organo-chlorines (somewhat less than 25 kMT in 1992). This category of wastes is far greater inother parts of the world, where chlorine bleaching is still practiced on a larger scale. The useof hydrochloric (muriatic) acid to clean up oil stains on concrete surfaces could also producesome organochlorine wastes of unknown composition.
There were four major chlorinated solvents in use in Europe in 1992, of which one (1,1,1trichloroethane) has since been phased out in consequence of the Montreal accords ongreenhouse gases. Total European consumption of the four in 1992 was 500 kMT (albeitproduction was considerably larger (nearly 770 kMT), presumably the difference having beenexported for use elsewhere. Consumption is falling rapidly -- a 12% decline from 1991 to1992 alone -- due to environmental regulation and increased recycling (especially in the dry-cleaning industry). European consumption continues to fall, at about 7% per year. Needlessto say, nearly all of these solvents end up in the atmosphere, with a small part being disposedof in landfilled sludges. Very little goes into ground water, although the latter is source ofenvironmental health concerns.
Chlorofluorocarbons are also dissipated in use. The most persistent ones (CFC-11, CFC-12, CFC-22), which have adverse effects on the stratospheric ozone layer, are being phasedout under the Montreal protocols. We do not have data on specifically European productionor consumption, but 1993 production for the non-communist world was about 667 kMT, ofwhich Europe probably accounted for at least 40%.
The biggest "end use" of chlorine chemicals is in the plastic PVC, which accounted for2714 kMT of contained chlorine in 1992 (Europe). PVC products are mostly long-live andstructural (62%), but short-lived uses, in packaging, account for 18% of the total. Theremainder of uses are intermediate (2-10 years). Environmental concerns center largely aroundthe short and intermediate uses, especially with regard to plasticizer and stabilizer additivesand disposal by incineration resulting in dioxin production. However, on the basis of recentresearch, these concerns appear to have been exaggerated.
Robert U. Ayres, The Life Cycle of Chlorine; Part III
File CHLORUSE.Ill as printed on June 15, 1996 Page 2
1. Final uses of elemental chlorine and HC1
Although most of the environmental concern about chlorine chemistry has focussed onorganic compounds (discussed next), it should be noted that in 1992 (Europe) 29% of primarychlorine output was either consumed either as elemental chlorine (e.g. for water treatment orpulp bleaching), or for producing inorganic chlorine chemicals [Tecnon 1993]. This was downfrom 31% in 1988, mainly because the use of chlorine for bleaching pulp was being phasedout. Pulp bleaching consumed roughly 6% of European chlorine output in 1987-88 but thisfell to 3% in 1992 [Tecnon] and to 1% by 1994 [USBM]. In the US pulp bleaching consumed10.9% and water treatment took 5.1% of 1993 production [Swift 1995]. Inorganic chemicals(excluding hydrochloric acid) consumed 11.9%., while 10% was unaccounted for "miscella-neous" [Swift].
In the case of Europe (1992), consumption of elemental chlorine for water treatment was251 kMT and for pulp bleaching in that year consumption was 253 kMT. Also, 863 kMT(C1), or 15% of production, was apparently shipped outside the chlorine chemical sector"fence". Non chemical uses of the acid were mostly for brine treatment (neutralization ofalkalis), food processing, and metal treatment (mainly "pickling" of steel ingots prior to hotrolling). Also, significant quantities of "muriatic acid" are sold at retail for household andcommercial uses, such as cleaning concrete surfaces and floors. Muriatic acid is particularlyeffective at removing oil stains, for instance.
We do not have recent data on the breakdown of non-chemical end uses of HC1.However, for the year 1989 it was estimated that metal-treatment absorbed 3.3% of total HC1output, while food processing took 1.1% and brine treatment absorbed 1%. If these figureswere applicable to 1992, the actual quantities consumed in these end uses would have been190 kMT, 63 kMT and 58 kMT, respectively. Unspecified miscellaneous uses evidentlyaccounted for the other 9.6%. However, it seems likely that the majority of these usesinvolved alkali neutralization, cleaning or bleaching, directly or indirectly.
There are various substitutes for elemental chlorine as a bleach. One is hydrogenperoxide. However, this substance in high concentrations is unstable and potentially explosivein the presence of any metallic impurities. It must be diluted for safe shipping and storage.The other major alternative to elemental chlorine as a bleach for pulp is chlorine dioxide,C102 which is made (usually in-house) from sodium chlorate, NaC1O 3. Sodium chlorate is acrystalline solid — hence easy to ship and store — that is manufactured from sodium chloride(NaC1) by electrolysis, not from elemental chlorine. Thus, it does not appear in the statisticsof chlorine usage. There are at least two routes for conversion of sodium chlorate to chlorinedioxide. The most likely one utilizes sulfur dioxide (made from burning sulfur) as a reductantand yields sodium sulfate as a by-product. The sodium sulfate by-product is normally re-usedon-site in the sulfate (Kraft) pulp process.
Pulp bleaching involves successive stages of chlorination (or oxychiorination) followedby neutralization with caustic soda. The chlorine mainly ends up in combination withsodium, as sodium chloride (salt). Bleaching wastes are mostly (90%) sodium chloride (salt),usually too dilute to recover. But it is estimated that up to 10% of the chlorine used inbleaching is chemically bound to lignins and other organic materials in the pulp asorganochlorines. This is probably an over-estimate. However, such compounds do account forup to 3.3% of the mass of the spent sludge [Maatela 1992]. Roughly 6% of the mass of theraw pulp is lost during the bleaching process. Based on the 10% figure (admittedly too high)organochlorine wastes in 1992 could have been as much as 25 kMT.
As many as 1000 different organo-chlorine compounds may be in this waste material,many of them with very high molecular weights, and many as yet unidentified. At least half
Robert U. Ayres, The Life Cycle of Chlorine; Pan III
File CHLORUSE.III as printed on June 15, 1996 Page 3
of these organo-chlorines have not been tested for toxicity, still less for chronic effects whichtake a long time to uncover. It is known, however, that some of these compounds areteratogenic (i.e. cause birth defects) and some are toxic to animals. In fact, from 70% to 95%of spent chlorination and alkali extraction liquors (by weight) have molecular weights greaterthan 1000. Such compounds cannot be separated, quantified or identified by present means.
Chlorine bleaching of paper pulp is widely accused of being a major source of PCDDsand PCDFs. Traces of PCDDs and PCDFs have been found in chlorinated pulp bleachingwastes, albeit at very low levels [Beck et al 1988; Swanson et al 1988; Clement et al 1989;Holmbom 1991]. Other chloroaromatic compounds, such as chlorinated xanthenes andxanthones, alkyl PCDFs, alkyl PCDDs occur at much higher levels in pulp bleaching wastes[Koistinen et al 1992]. These compounds have not been tested much, as yet, for directbiological activity. However, there is some possibility that such compounds could constituteeffective precursors to PCDDs and PCDFs in the event of combustion. (See later discussion).
These wastes are typically disposed of by incineration or burial of water treatment sludge,albeit some is still dumped into waterways. For example, some older Canadian pulp millsdump 10 kg of organochiorines per tonne of pulp; the average for pulp mills in westernCanada (British Columbia) is 7 kg/t [MacLean's vol. 103, Jan 29 1990, p. 32]. Pendingregulations will probably reduce this to 2.5 kg/t for existing mills and 1.5 kg/t for new ones.
The pulp and paper industry is unhappy about being blamed for dioxin emissions, arguingthat the industry is only responsible for 1% to 3% of the problem. Nevertheless the Europeanpulp and paper industry, prodded by public relations campaigns by Greenpeace and other(mostly) German groups, decided to phase out chlorine bleaching. This transition began c.1987 and is now largely complete.
Water treatment is the other major use of elemental chlorine. It accounted for 358 kMTin 1992 in Europe, about 4% of chlorine produced (5% in the U.S.) As a point of interest,only 16 kMT was used in France (1993), barely 1.1% of French chlorine consumption. Mostof this chlorine volatilizes and reacts, in the air, with other trace gases. However, chlorinateddrinking water does leave behind traces of other chemicals, such as chloroform. Ozone is afeasible alternative, extensively used in France, although it is somewhat more costly andslightly less effective in that it breaks down rapidly and does not guard against contamination"downstream" from the disinfection plant.
It is difficult to characterize the environmental fate of end-uses of HC1, due to their greatdiversity. In the case of metal treatment, most of the chlorine is ultimately combined with themetal, mainly iron, yielding ferrous and ferric chlorides. Minor amounts are recovered as aby-product, mostly for use as a flocculent in sewage treatment. The remainder is probablydisposed of as water-treatment sludges or carried away by waterways. Acid used in brinetreatment also generates inorganic chlorides (salts).
Hydrochloric acid used in food processing probably ends up largely as sodium chloride(salt). In the case of cleaning agents, especially for cleaning concrete surfaces, the acid reactswith free lime and the major end product is probably calcium chloride. However, whenhydrochloric acid reacts with organic contaminants (such as oil stains), chlorination reactionscan occur and a variety of CHCs may be produced. Unfortunately, little or nothing is knownabout these wastes.
2. Chlorinated solvents
Solvents are used for cleaning metals, fabrics and other surfaces, of course. They are alsoused as carriers, e.g. to transfer substances such as adhesives, pigments (in paints, varnishesor lacquers) or biocides to a surface, or to extract soluble substances such as natural drugs
Robert U. Ayres, The Life Cycle of Chlorine; Part HI File CHLORUSEill as printed on June 15, 1996 Page 4
from raw materials. Finally, they are used as a reaction medium. Many reactive substancesexhibit their greatest efficacy when brought together in a solution.
Chlorinated hydrocarbon solvents have been employed widely since the 1920s. They werecrucial at the beginning of the century as rapid industrialization prompted the need for fastand effective non-flammable industrial solvents. The materials used previously, benzene andpetroleum fractions did not provide either the cleaning quality or worker safety possible withchlorinated solvents. The first chlorinated solvents to be utilized were carbon tetrachloride andchloroform [ECSA 1993]. They were very effective cleaning agents and had the additionalbenefit of non-flammability.
Carbon tetrachloride and chloroform continue to be applied today as chemicalintermediates, mainly in CFC production, but they were replaced from the mid-1950s in mostcleaning applications by other chlorinated solvents. Compared to their predecessors these newsolvents offer additional advantages in terms of cost and effectiveness in specializedapplications such as degreasing agents. Chlorinated solvents are currently important in thetextile, pharmaceutical, plastic and metal-working industries. Worldwide, approximately 1.2million tons of chlorinated hydrocarbon solvents are consumed annually [Euro Chlor 1995].The four most extensively used chlorinated solvents today are methylene (di)chloride,perchloroethylene (also known as PERC or tetrachloroethylene), trichloroethylene (or TRI),and 1,1,1,trichloroethane (also known as methyl chloroform). Production and consumption ofthe four major solvents in Europe (1986-1992), and for the US in 1993 are shown in TableI.
Methylene (di)chloride (CH2C12) is used in the US mainly as a paint and varnish remover(32.4%). Other uses are for urethane foam blowing (14%), degreasing (10%), plasticsprocessing (16%), solvent extraction (11.3%), aerosol sprays (8%) and electronics (4%) [Swift1995]. It is a potential substitute for 1,1,1 trichloroethane as a metal cleaner in someapplications. It is one of the least toxic chlorinated methanes, but it has been classified as"possibly carcinogenic to humans" by the International Agency for Research on Cancer.Vapors have an anesthetic action at high levels. It is classed as a "hazardous air pollutant" bythe U.S. Clean Air Act. Methylene dichloride is virtually insoluble in water.
Trichloroethylene, or TCE (CHC1=CC12) was first commercialized in 1911 and used asan anaesthetic in obstetrics. However general use as an anaesthetic was discouraged after1961, due to indications of cranial nerve damage, cardiac arrhythmias tachypnea andconvulsions, particularly in children [Kilburn & Warshaw 1993]. It is now mainly used,because of its low boiling point (87°C) as a solvent for vapor degreasing and metal surfacepreparation, especially for heat sensitive materials. This accounts for 91% of US usage [Swift1995]. It is also a raw material for the production of the hydrofluorocarbon refrigerantHFC134a. Its mean biological half life is 35-40 hours. There is some evidence that thischemical — unlike most other chlorinated hydrocarbons — is produced naturally by algae.2
TCE is lipophilic and is bioaccumulated in fatty tissues. It is a neurotoxic, probablybecause one of its metabolites, a chlorinated epoxide, tends to bind to central nervous system(CNS) macromolecules, including neurofilaments, thus inhibiting axon nutrition [Kilburn &Warshaw 1993]. It is absorbed through the lungs and is listed as a "hazardous air pollutant"under the U.S. Clean Air Act. There have been a few cases of injury due to accidentalexposure. TCE is slightly soluble in water (1.1 g/l). As a consequence, there have beeninstances of ground water pollution resulting from industrial solvent usage, notably in EastWoburn Mass. (1964-1967) and Tucson, Ariz. (1957-1981) [ibid]. In both cases, the principalsolvent was TCE but there were other chemicals involved, especially tetrachloro-ethylene, 1,1-and 1,2- dichloroethylene, 1,1,1-trichloroethane and chloroform. In Tucson, benzene, xyleneand bis(2-ethylhexyl)phthalate and hexavalent chromium were also found in the water from
Robert U. Ayres, The Life Cycle of Chlorine; Part HI File CHLORUSE.III as printed on June 15, 1996 Page 5
time to time. In E. Woburn, leukemia among the exposed population was 5.3 times theexpected rate and 2.5 times the US average. Excess birth defects and childhood healthproblems were also observed. Epidemiological evidence suggests that long-term exposure,even at low levels, resulted in observable neurological damage [ibid].
Perchloroethylene, or PERC (CC12=CC12) is the most stable of the chlorinated ethanes andethylenes, requiring only small amounts of stabilizers. Its main uses in the US are drycleaning (55%), fluorocarbons (25%) and metal cleaning/degreasing (13%) [Swift 1995]. Usesin Europe are in dry cleaning (66%), textile processing (13%), metal degreasing (7%), andfluorocarbon production [Euro Chlor 1995]. It is the basic raw material for CFCs-113,114,115,and 116 as well as HFC 134a. PERC is the principal solvent used for dry cleaning, accountingfor 90% of the dry cleaning in North America [Cantin 1992], and a comparably highproportion in Europe. Perchloroethylene has been used as an antihelminthic (anti-worm) agent,in relatively large doses, and it is readily absorbed through the gastrointestinal tract [Fuller1976]. It is more easily absorbed through the lungs. The mean biological half-life is 144hours. Most is excreted quickly, but some is accumulated in liver, kidney and fat tissues[Strauss 1992]. It has been classified as "possibly carcinogenic to humans" by theInternational Agency for Research on Cancer. One of its metabolites is trichloroacetic acid,which has been linked to potential cardiac birth defects [NRC 1991]. There is some indicationthat long term exposure (by workers) may cause miscarriages. It is a central nervous system(CNS) depressant. Concentrations of 1500 ppm can cause unconsciousness in less than 30minutes.
Recent work suggests that the lifetime of PERC in the atmosphere is about 2 months;about 0.6% of ground level emissions reach the stratosphere, while about 0.03% is convertedinto carbon tetrachloride, which is a potent ozone depleting substance [Franklin 1994]. It islisted as a "hazardous air pollutant" by the U.S. Clean Air Act and is currently subject tofederal VOC controls, though EPA is considering an exemption. PERC is insoluble in water.
1,1,1,Trichlorethane or methyl chloroform (CH3–CC13) is mainly used in the US as anindustrial vapor degreaser (31.4%), metal surface cleaner (18%), aerosol propellant (11%) andas a solvent for adhesives (8.5%) and coatings (7%). It is also used in the electronics industryto clean circuit boards (2.4%)[Swift 1995]. There are a number of minor uses (e.g. spotremover, shoe polish solvent, water-repellant solvent, asphalt extraction, etc.) It is among theleast toxic of the industrial chlorinated solvents. It is nearly insoluble in water (0.3 g/l).However, it is persistent in the atmosphere and contributes to the problem of ozone depletion,which is the reason for it's current phase-out.
CHC solvents were a big step forward in terms of safety and health in comparison withtheir predecessors. They are chemically stable, non-flammable, non-toxic (with respect to skincontact) and insoluble in water, all useful properties given the purposes that they are used for.However, there are other problems. Chlorinated solvents are responsible for about one-thirdof volatile organic compounds (VOC) emissions. Some of them, especially tri- and per-chloroethylenes, are known to be liver toxic and are suspected to be carcinogenic [Enquete1994]. Also, their high degree of stability means that they are persistent in the environment.If chlorinated solvents leak into ground water, they do not easily break down and this resultsin contamination. One chlorinated solvent (1,1,1 trichloroethane) has been implicated in thedepletion of the ozone layer and its production is being phased out at the end of 1995 in theEuropean Union, under the Montreal Protocol.
For these reasons, among others, regulation has been increasing in scope and stringencyover the last 20 years. In consequence, solvent-using industries have made a concerted effortin the last few years to reduce their emissions of CHC solvents. Consumer industries areactively seeking viable alternatives. This trend, in both Europe and the United States, has led
Robert U. Ayres, The Life Cycle of Chlorine; Part HI
File CHLORUSEJII as printed on June 15, 1996 Page 6
to increasing use of substitutes — especially "soap and water" — and to recycling of CHCsolvents.
Until recently, most chlorinated solvents were not recycled at all. They usually foundtheir way as emissions into the atmosphere or to a lesser extent were burned in incineratorsor would leak into ground water. Recycling has begun to be significant in the last decade,mainly due to the threat of regulation. 3 About 10% of all solvents used in Europe were beingsupplied by specialized regenerators [Informations Chimie, #323 December 1990]. This figureis probably closer to 15% today.
The dry cleaning industry, which consumes most of the perchloroethylene (PERC) is apartial exception, since the cleaning process involves immersion of the clothes in the solvent,followed by drying and distillation of the solvent for re-use. However, there are significantlosses in the clothes drying process, and in the filters. Moreover, the sludge that contains thedirt removed in the cleaning process also contains about 50% solvent. These losses accountfor the annual consumption of new solvent. Declining consumption rates imply increasing useof closed circuit machines with internal recycling capability. In the early 1970's all drycleaning machines in Europe were open circuit. This number had fallen to 60% by 1980, andcontinues to fall [Informations Chimie, #323 December 1990] By the year 2000 it is expectedthat closed circuit dry-cleaning machines will be virtually universal in Europe.
According to industry sources, atmospheric emissions from dry-cleaning in Europe wereestimated to be 32 kMT in 1975, falling to 18 kMT in 1989, with a final level of 7.5 kMT/yexpected after the year 2000 when all dry-cleaning machines are closed-circuit [InformationsChimie, # 354, January 1994]. Since most dry-cleaning establishments are small — there areover 300,000 in North America alone — further efficiency gains beyond that level will bemore difficult to achieve. Between 70% and 90% of the losses are air emissions (90% inearlier times, more like 70% now). The remainder goes into water or landfill disposal (e.g.of sludges and filters). It is asserted that emissions of PERC to water have already beenlargely eliminated in Europe, but residues to landfills are virtually unchanged, at about 3kMT/y.
However, it must be said that the above story is partially inconsistent with Europeanconsumption statistics for perchloroethylene, which were 131.3 kMT in 1989 and 88.6 kMTin 1992. Most of this was, and still is, used for dry-cleaning. Assuming that the inventory ofcleaning fluid in service is not changing much, it is fair to assume that actual emissions areessentially equal to total consumption. It is the airborne emissions that are almost certainlybeing underestimated.
The European Chlorinated Solvents Association (ECSA) estimates that in 1992 500,000tonnes of chlorinated solvents were sold in Europe, a 12% decline from 1991. ECSAestimates that 140,000 tonnes went into waste streams and 80,000 tonnes was recycled.According to another source, 600,000 metric tons of chlorinated solvents were consumed in1992, of which 15 percent was recycled [Kranendonk 1995]. The remaining CHC solventswere disposed of in various ways: approximately 450,000 tons were emitted into theatmosphere, 20,000 tons were incinerated (therefore mostly neutralized) and 40,000 tons wereunaccounted for [ibid]. Presumably most of it was sent to landfills (as sludge), although thispractice is no longer permitted in Germany.
In 1994, sales of the four major CHC solvents produced by ECSA members were350,000 tonnes, a reduction of 5% in comparison to 1993 and a reduction of nearly 17%when compared to 1992 (see Table I). According to ECSA, the use of CHC solvents inEurope has continued to decline at an annualized rate of 7% per annum.
These figures reflect the continuing trend of improved solvent management includingemission reduction and the utilization of recycled materials. Continuing improvements in
Robert U. Ayres, The Life Cycle of Chlorine; Part III
File CHLORUSEIII as printed on June 15, 1996 Page 7
equipment and use technology and investments by end user industries have also contributedto decreased emissions into the atmosphere. Awareness of the regulation of 1,1,1-trichloroeth-ane under the Montreal Protocol has caused users of this solvent to begin to move towardsalternatives. However, there are recent indications of a "renaissance of chlorinated solvents"since substitutes are inferior for some uses.
It should be noted that the four major chlorinated solvents discussed above do not exhaustthe category. There are a number of others. One of the most important of those not listedabove is chlorobenzene, which accounted for 93 kMT of chlorine inputs in western Europein 1992 [Tecnon 1993 cited by Ayres & Ayres 1996b, Table II]. According to ourcalculations, this sufficed to produce 100 kMT of the chemical itself (containing 31 kMT ofchlorine) [ibid, Figure 7]. The uses of this chemical are not well accounted for. However abreakdown of monochlorobenzene usage was carried out for USEPA for the years 1974-1977by a contractor [Hydroscience 1978]. The breakdown was as follows: production ofchloronitrobenzene (35%), solvent use 30%, production of diphenyl oxide (10%), productionof rubber intermediates (10%) and production of DDT and other uses (15%). We have noreliable recent data on the usage of monochlorobenzene as a solvent in the TDI (or MDI)processes. If the 1977 U.S. figures are valid for Europe in 1992, 30 kMT ofmonochlorobenzene would have been used as a solvent. Of this, 21% or 21 kMT would havebeen used in the production of toluylene di-isocyanate, TDI (or MDI). The remainder ( 8.9%of the total) output was presumably used as solvents for adhesives, paints, polishes andwaxes [Johnston et al 1979]. All of this was presumably dissipated in use (mainly to theatmosphere).
3. CFCs
Chlorofluorocarbons, or CFCs, are a class of very inert — hence long lived — chemicalproducts. Most of the past production is either still in service (e.g. as refrigerants or foamingagents) or in the atmosphere. The major compounds in this group (90% of production) areas follows:
Monochlorodifluoromethane (CHC1F2), known as CFC-22Dichlorodifluoromethane (CC1 2F2), known as CFC-12Trichlorofluoromethane (CC1 3F), known as CFC-11,1,1,2 trichloro 1,2,2 trifluoroethane (C2C13F3), known as CFC-113
These compounds and similar ones are manufactured from chlorocarbons, mainly carbontetrachloride and 1,1,1 trichloroethane, by direct hydrofluorination (reaction with hydrofluoricacid, HF), yielding HCI as a by-product. However, they all contain some chlorine. CFC-11and CFC-12 were (and still are) used aerosol propellants, foam-blowing agents and asrefrigerants and for air conditioners and chillers. CFC-22 is primarily used as a refrigerant.CFC-113 is, or was, exclusively used as a solvent.
Until recently, data on CFC production and use was very spotty. For instance, cumulativeglobal production of CFC-11 for the years 1950-71 has been estimated (by R. L. McCarthyof Dupont Co.) to be 1.48 MMT [Wilkniss et al 1975]. Production in the first year (1950)was estimated to be 5.5 kMT. Growth occurred at a rate of 20% per annum until 1971. It wasalso estimated, by the same source, that global production of CFC-11 was 270 kMT for eachof the individual years 1972 ,1973 and 1974 [ibid]. Thus Wilkniss et al estimated globalproduction (and emissions) of CFC-11 from 1950 through 1974 as 2.3 MMT.
Robert U. Ayres, The Life Cycle of Chlorine; Part III File CHLORUSEIII as printed on June 15, 1996 Page 8
Recent audited data from 13 reporting companies, not including any production in easternEurope, the former USSR or China, give a cumulative total (excluding feedstock use) of 8.523MMT for the years 1931 through 1993 [AFEAS 1995]. World production and consumptiondata for the year 1985, including communist countries, has been estimated for three CFCs byRAND Corp, as shown in Table II. RAND underestimated production in the non-communistworld by about 10%. But producers in communist or former communist countries apparentlyaccounted for 41.5 kMT, compared to 326.8 kMT for the 13 companies. On a proportionalbasis, the missing producers would have accounted for an additional 1.08 MMT, for a globalgrand total of 9.6 MMT. Incidentally, the total for the years 1950-1974 inclusive wasevidently around 3.8 MMT, or 65% greater than Wilkniss et al's estimate cited above[Wilkniss et al 1975]. Since Wilkniss et al used the numbers to parametrize a model ofstratospheric CFC buildup, it follows that the model was seriously mis-estimated. This is nota criticism of the modelers, but a reminder of the importance of having accurate worldwideproduction and consumption data.
In the case of CFC-12, cumulative production by the 13 reporting companies, for theyears 1931-1993 was 11.06 MMT [AFEAS 1995]. Production in 1885 was 376.4 kMT [ibid];for the same year RAND (Table II) estimated production in the communist countries at 78.7kMT, or 20.9% of the non-communist total. On a proportional basis, then, the cumulative totalfor the communist (or formerly communist) countries would be 2.31 MMT, for a global grandtotal of 13.37 MMT. Summary production data for CFC-11 and CFC-12 in the non-communist world are shown in Table III [AFEAS 1995].
Use data for the two major CFC's (CFC-11 and CFC-12) in the con-communist world,taken together, has also been compiled by the Chemical Manufacturers Association (CMA)for the years 1960-1984. Use data on each of the two major CFC's separately, for 1976-1993,has been compiled by AFEAS [AFEAS 1995].4 The CMA data, plotted graphically in Figures1,2 [Miller & Mintzer 1986, Figs. 9a,b], show that aerosol use peaked in 1974, prior to a banon such use (in the U.S. only). At the time of the ban, aerosol use of CFCs alone hadreached 470 kMT. Subsequently, it declined to a low in 1982 of just under 200 kMT beforebeginning to rise again. Non-aerosol use, in the meanwhile, had continued an almostuninterrupted increase, from 300 kMT in 1974 to 476 kMT in 1984. The total of non-aerosoluse for 1984, for reporting companies, was 703 kMT.
In 1984, according to CMA, rigid foams accounted for 51% of known U.S. use of CFC-11, and 39% of use in all reporting countries [ibid, Figs. 8a,bs]. Aerosols accounted for only5% in the U.S., but 31% for all reporting countries [ibid]. Other foams accounted for 20%in the U.S. and 19% for all countries [ibid]. Chillers accounted for 6% in the U.S. and 3%overall [ibid]. The remainder was unallocated. As regards CFC-12, rigid foams accounted for11% in the U.S. and 12% overall; aerosols accounted for 4% in the U.S. and 32% overall;refrigeration and air-conditioning accounted for 44% of known uses in the U.S. and 27% ofknown uses overall [ibid]. The remainder was classed as miscellaneous or unallocated.
Usage of CFC-11 and CFC-12 from 1980 through 1993 is shown in Table IV below.Evidently all uses except refrigeration had virtually ceased by 1993. However, refrigerationuses in 1993 were only moderately lower than the peak years of 1988-89; in fact, refrigerationuse of CFC-12 actually increased 6.5% from 1992 to 1993. CFC-113 has been usedexclusively for metal cleaning in the electronics industry.
Emissions of CFCs used for refrigeration and foam-blowing do not generally occur in theyear of production or consumption. As of the end of 1993 it is estimated that 86.5% of theCFC-11 produced to date had been released, leaving 13.5% in "inventory" (almost entirelytrapped in foam insulation materials) [AFEAS 1995]. Similarly, as of 1993, 93.4% of CFC-12
Robert U. Ayres, The Life Cycle of Chlorine; Part III File CHLORUSE.111 as printed on June 15, 1996 Page 9
produced to date had been released, leaving 6.6% in "inventory", mostly in refrigerationsystems and air-conditioners.
The chemical inertness of CFCs means that they do not break down quickly in the loweratmosphere, nor do they wash out. The measured tropospheric concentration of CFC-11increased from 60 parts per trillion (ppt) in 1972 to 80 ppt in 1974 [Neely 1977]. The lattercorresponds to a tropospheric load of 1.6 MMT, or 70% of cumulative production to thattime. The remainder (30%) was presumably still "in service", mainly in foams or aerosol cans.This is somewhat contradictory to the 13.5% unreleased inventory reported by AFEAS.
As a point of interest, AFEAS reported total non-communist world production of FCF-113 in 1986 as 196.6 kMT, with releases of 193.1 kMT. World totals for 1986, reported byUNEP and EPA (including the communist countries) were 220.7 kMT and 211.2 kMT,respectively. Of this, the US presumably accounted for 45%, or 90-95 kMT. The so-calledToxic Release Inventory (TRI) of EPA reported total U.S. emissions of CFC-113 for 1989of only 30.4 KMT, of which 28% was attributed to the electronics industry. Releases shouldcorrespond almost exactly with consumption, since there was little (if any) change ininventory and, even with some internal recycling, solvents have a relatively short life-in-use.Thus, one must conclude that the TRI undercounts true emissions by a factor of 3 in this case.
The combination of inertness and volatility allows CFCs to diffuse into the stratosphere,where they are broken down by UV radiation. Chlorine ions are released, which react withatomic oxygen forming chlorine monoxide. The latter is an effective catalytic agent in thedestruction of stratospheric ozone (which protects the earth's surface from about 90% of thesolar UV radiation that strikes the upper atmosphere. One single chlorine atom in thestratosphere can destroy over 100,000 ozone molecules. Stratospheric ozone loss of 3.5%annually has been recorded, and the loss is likely to continue for many years, even aftercurrent production of CFC's has ceased, because of the long lifetime of these chemicals in theatmosphere.
Ozone "holes"of accelerated depletion were first seen over Antarctica in 1985. Thisphenomenon is attributed to the formation of extremely cold clouds of ice particles andcatalytic reactions that occur on their surfaces. Ozone holes have now become an annual eventin winter over Antarctica, and recently similar "holes" have also occurred in the northernhemisphere, as far south as the north of Scotland.
A 1% decrease in stratospheric ozone thus results in an increase of the order of 1% ofUV reaching ground level. This, in turn, is a major cause of skin cancer in humans, geneticdamage and possible immune system suppression. UV may be especially damaging to marineorganisms that spawn in or near the ocean surface or in estuaries.
In addition to their role in the destruction of stratospheric ozone, CFC's are also verypotent greenhouse gases. Together with other chlorinated compounds (including carbontetrachloride and 1,1,1 trichloroethane or methyl chloroform) and certain fire-extinguisherchemicals known as halons, they account for around 10% of anthropogenic contributions toGreenhouse global warming potential. However 90% of the global warming impact of CFCsarises from the three major long-lived CFCs, viz. CFC-11, CFC-12 and CFC-22.
Because of the ozone depletion problem, most propellant and solvent uses of CFCs havealready been phased out since the 1989 Montreal Protocol and the London Revisions of 1990.The more critical uses (mainly as foaming agents and refrigerants) are also in the process ofbeing phased out, with a target date of 2000. Germany has banned production and use ofcertain fully halogenated CFCs for certain applications since 1991.
It is interesting to recall that a select international committee of experts convened by EPAin 1988 concluded that adequate substitutes for CFC-113 only existed (at the time) for20-30% of applications. It was recommended that continued use of CFC-113 be allowed, with
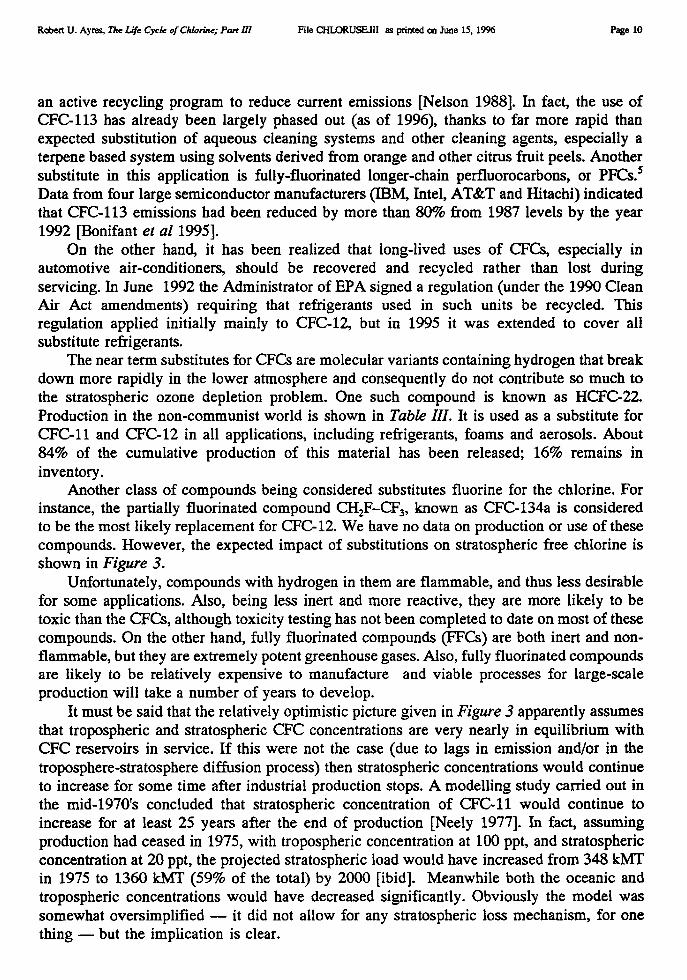
Robert U. Ayres, The Life Cycle of Chlorine; Pan III
File CHLORUSEIII as printed on June 15, 1996 Page 10
an active recycling program to reduce current emissions [Nelson 1988]. In fact, the use ofCFC-113 has already been largely phased out (as of 1996), thanks to far more rapid thanexpected substitution of aqueous cleaning systems and other cleaning agents, especially aterpene based system using solvents derived from orange and other citrus fruit peels. Anothersubstitute in this application is fully-fluorinated longer-chain perfluorocarbons, or PFCs.5Data from four large semiconductor manufacturers (IBM, Intel, AT&T and Hitachi) indicatedthat CFC-113 emissions had been reduced by more than 80% from 1987 levels by the year1992 [Bonifant et al 1995].
On the other hand, it has been realized that long-lived uses of CFCs, especially inautomotive air-conditioners, should be recovered and recycled rather than lost duringservicing. In June 1992 the Administrator of EPA signed a regulation (under the 1990 CleanAir Act amendments) requiring that refrigerants used in such units be recycled. Thisregulation applied initially mainly to CFC-12, but in 1995 it was extended to cover allsubstitute refrigerants.
The near term substitutes for CFCs are molecular variants containing hydrogen that breakdown more rapidly in the lower atmosphere and consequently do not contribute so much tothe stratospheric ozone depletion problem. One such compound is known as HCFC-22.Production in the non-communist world is shown in Table III. It is used as a substitute forCFC-11 and CFC-12 in all applications, including refrigerants, foams and aerosols. About84% of the cumulative production of this material has been released; 16% remains ininventory.
Another class of compounds being considered substitutes fluorine for the chlorine. Forinstance, the partially fluorinated compound CH2F–CF3, known as CFC-134a is consideredto be the most likely replacement for CFC-12. We have no data on production or use of thesecompounds. However, the expected impact of substitutions on stratospheric free chlorine isshown in Figure 3.
Unfortunately, compounds with hydrogen in them are flammable, and thus less desirablefor some applications. Also, being less inert and more reactive, they are more likely to betoxic than the CFCs, although toxicity testing has not been completed to date on most of thesecompounds. On the other hand, fully fluorinated compounds (EFCs) are both inert and non-flammable, but they are extremely potent greenhouse gases. Also, fully fluorinated compoundsare likely to be relatively expensive to manufacture and viable processes for large-scaleproduction will take a number of years to develop.
It must be said that the relatively optimistic picture given in Figure 3 apparently assumesthat tropospheric and stratospheric CFC concentrations are very nearly in equilibrium withCFC reservoirs in service. If this were not the case (due to lags in emission and/or in thetroposphere-stratosphere diffusion process) then stratospheric concentrations would continueto increase for some time after industrial production stops. A modelling study carried out inthe mid-1970's concluded that stratospheric concentration of CFC-11 would continue toincrease for at least 25 years after the end of production [Neely 1977]. In fact, assumingproduction had ceased in 1975, with tropospheric concentration at 100 ppt, and stratosphericconcentration at 20 ppt, the projected stratospheric load would have increased from 348 kMTin 1975 to 1360 kMT (59% of the total) by 2000 [ibid]. Meanwhile both the oceanic andtropospheric concentrations would have decreased significantly. Obviously the model wassomewhat oversimplified — it did not allow for any stratospheric loss mechanism, for onething — but the implication is clear.
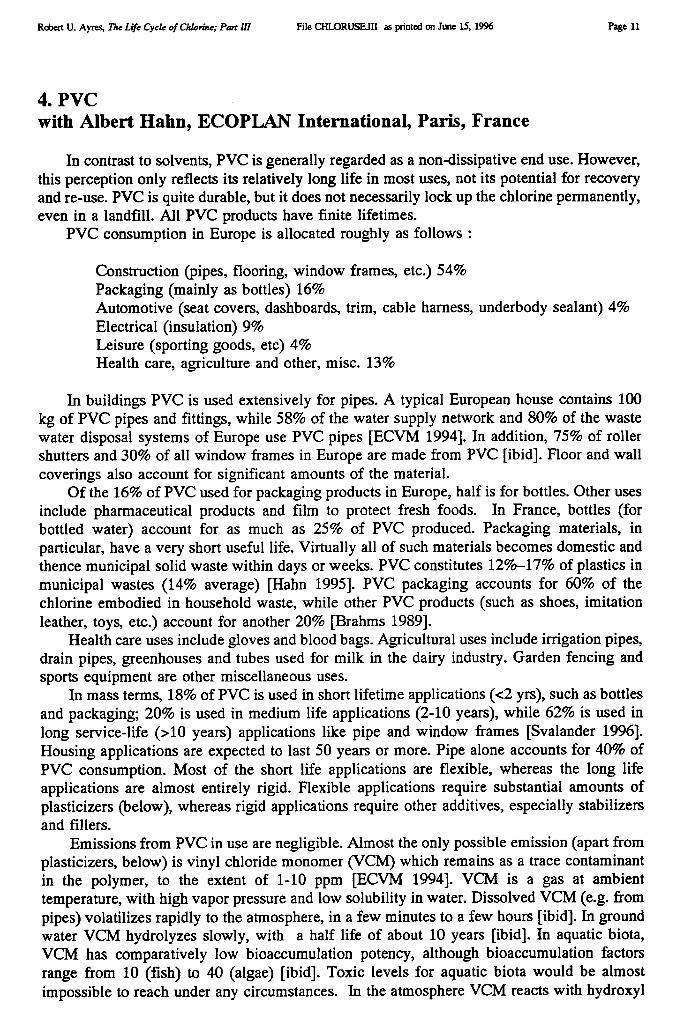
Robert U. Ayres, The Life Cycle of Chlorine; Pan HI
File CHLORUSE.Ill as printed on June 15, 1996 Page 11
4. PVCwith Albert Hahn, ECOPLAN International, Paris, France
In contrast to solvents, PVC is generally regarded as a non-dissipative end use. However,this perception only reflects its relatively long life in most uses, not its potential for recoveryand re-use. PVC is quite durable, but it does not necessarily lock up the chlorine permanently,even in a landfill. All PVC products have finite lifetimes.
PVC consumption in Europe is allocated roughly as follows :
Construction (pipes, flooring, window frames, etc.) 54%Packaging (mainly as bottles) 16%Automotive (seat covers, dashboards, trim, cable harness, underbody sealant) 4%Electrical (insulation) 9%Leisure (sporting goods, etc) 4%Health care, agriculture and other, misc. 13%
In buildings PVC is used extensively for pipes. A typical European house contains 100kg of PVC pipes and fittings, while 58% of the water supply network and 80% of the wastewater disposal systems of Europe use PVC pipes [ECVM 1994]. In addition, 75% of rollershutters and 30% of all window frames in Europe are made from PVC [ibid]. Floor and wallcoverings also account for significant amounts of the material.
Of the 16% of PVC used for packaging products in Europe, half is for bottles. Other usesinclude pharmaceutical products and film to protect fresh foods. In France, bottles (forbottled water) account for as much as 25% of PVC produced. Packaging materials, inparticular, have a very short useful life. Virtually all of such materials becomes domestic andthence municipal solid waste within days or weeks. PVC constitutes 12%-17% of plastics inmunicipal wastes (14% average) [Hahn 1995]. PVC packaging accounts for 60% of thechlorine embodied in household waste, while other PVC products (such as shoes, imitationleather, toys, etc.) account for another 20% [Brahms 1989].
Health care uses include gloves and blood bags. Agricultural uses include irrigation pipes,drain pipes, greenhouses and tubes used for milk in the dairy industry. Garden fencing andsports equipment are other miscellaneous uses.
In mass terms, 18% of PVC is used in short lifetime applications (<2 yrs), such as bottlesand packaging; 20% is used in medium life applications (2-10 years), while 62% is used inlong service-life (>10 years) applications like pipe and window frames [Svalander 1996].Housing applications are expected to last 50 years or more. Pipe alone accounts for 40% ofPVC consumption. Most of the short life applications are flexible, whereas the long lifeapplications are almost entirely rigid. Flexible applications require substantial amounts ofplasticizers (below), whereas rigid applications require other additives, especially stabilizersand fillers.
Emissions from PVC in use are negligible. Almost the only possible emission (apart fromplasticizers, below) is vinyl chloride monomer (VCM) which remains as a trace contaminantin the polymer, to the extent of 1-10 ppm [ECVM 1994]. VCM is a gas at ambienttemperature, with high vapor pressure and low solubility in water. Dissolved VCM (e.g. frompipes) volatilizes rapidly to the atmosphere, in a few minutes to a few hours [ibid]. In groundwater VCM hydrolyzes slowly, with a half life of about 10 years [ibid]. In aquatic biota,VCM has comparatively low bioaccumulation potency, although bioaccumulation factorsrange from 10 (fish) to 40 (algae) [ibid]. Toxic levels for aquatic biota would be almostimpossible to reach under any circumstances. In the atmosphere VCM reacts with hydroxyl
Robert U. Ayres, The Life Cyck of Chlorine; Part III
File CHLORUSE.III as printed on June 15, 1996 Page 12
radicals very rapidly (20 minute half life) to hydrochloric acid and formyl chloride [ibid]. Thelatter degrades to hydrochloric acid and carbon monoxide, also in about 20 minutes [ibid].In soil, VCM is rapidly degraded by bacteria under aerobic conditions.
PVC itself is stable, inert and not biologically active. Though it is not highly combustible,PVC will bum. PVC is definitely a fire hazard. Although it can be burned with relativesafety6 in a properly equipped incinerator, when PVC products burn in an uncontrolledsituation, as in domestic fires — especially electrical fires — the smoke can be verydangerous. In one fire in a supper club in Beverly Hills in 1977, 165 people died as a resultof contact only with the smoke from smoldering PVC insulation, according to one toxicologistwho subsequently analyzed the event [Wallace 1981]. Smoldering PVC is also alleged to bea significant source of polychlorinated dibenzo-dioxins and -furans (PCDDs and PCDFs). Forthese reasons, the use of PVC in electrical applications, and in many public buildings, hasbeen sharply restricted in Germany, Sweden and some other countries. A total ban on the useof PVC in public buildings was imposed in the German town of Bielefeld in 1987.
In a fire with excess air, the chlorine in PVC is largely converted to hydrochloric acid(HC1), although some other organochlorines (including trace amounts of dioxins) areproduced. It has now been confirmed by a number of studies that the mechanism for dioxinproduction is the reaction of hydrogen chloride with organics, catalyzed by heavy metals.However, this combination is available in most municipal wastes, whether or not PVC ispresent. The production of dioxins does not seem to be chlorine limited (it may be catalystlimited). A number of empirical studies have confirmed that dioxin production in incineration(and other types of combustion) is essentially independent of the PVC content, becausesufficient chloride is present in, for example, wood [e.g. Wormgoor 1994]. Because of thisrecent research, the Dutch Parliament has decided that there is "no reason to ban" PVC.
As a thermoplastic, PVC is potentially recyclable. Scrap generated within the productionprocess is normally recycled. However, post-consumption recyclability is greatly inhibited byone major factor: additives. PVC is almost never used in pure or near-pure form. Additivesvary enormously depending on the use to which the product is put. Additives are used toprovide increased plasticity, stiffness, inflammability, color, to protect against damage by UVradiation, and for several other reasons. They can account for as much as 50% of total weight,as shown in Table V.
Even if the polymer itself could be easily depolymerized, most additives cannoteasily be removed. Moreover, some of them are toxic. Heavy metals, including cadmium,have been widely used as stabilizers and pigments, in the past, as shown in Table VI [UBA1989]. Until recently cadmium was widely used for PVC products intended for exterior use,such as window frames. As recently as the late 1980s, almost half of the cadmium used inGermany was used by the plastics industry, mainly for stabilizers [Claus et al 1990]. Howevercadmium use for this purpose has been almost entirely phased out in Europe [Svalander1996]. About half of all processed PVC contains lead-based stabilizers (primarily in pipe andwindow frames). PVC for food containers is stabilized with organo-tin compounds. Thismeans that post consumer recycling can only be done either by returning PVC products totheir manufacturers for recycling in the same or a lower-value but compatible use, or inconjunction with a very sophisticated identification, sorting and separation system. In practice,these problems have sharply limited the extent of post-consumer recycling.
As of 1995, only 2% of post-consumer PVC in the U.S.A. was recycled, as compared to7% in Europe [Hahn 1995]. Yet 11% was recycled in Brazil [ibid]. Nevertheless, recyclingis on the increase. Examples from Germany include pipes, window profiles, flooring, androofing membranes. (PVC water bottles, in particular, offer a significant potential forrecycling and even possible re-use).
Robert U. Ayres, The Life Cycle of Chlorine; Part III
File CHLORUSE.III as printed on June 15, 1996 Page 13
PVC fabrication results in varying amounts of scrap, mostly recycled. Pipe extrudersgenerate very little scrap, which is easily recycled on site. Wire and cable coating operationsgenerate 7%-10% scrap, mainly from off-spec product [Hahn 1995]. This material is entirelyrecovered (because the copper is recovered) and is used as fill for thicker cables. Scrap fromPVC extrusion film operations is also recovered and used for applications with successivelylower transparency requirements. The last step in the chain is to produce black film foragricultural use. Scrap from calendaring operations is also recycled within the same operation.In some cases calendaring operations buy back scrap from downstream users e.g. "cut andweld" packaging. Some producers of "calandrette" extruded PVC coated fabrics buy backscrap from the cut and sew operations of their clients. This material is reground, remelted andre-introduced to the feed, of which it constitutes about 20% [ibid].
Scrap from PVC bottle production and blister packaging for the pharmaceutical industry(where scrappage is quite high, up to 40%) is rigid. This material can be recycled in PVCpipe, especially for agricultural use, and fittings. Scrap from production of rotomoldedproducts, such as toy dolls and balls, can be used for shoe soles or hoses, and even for someinjection-molded automobile parts [Hahn 1995]. Scrap from film operations can be used tomake plastic tubes for roll cores. Scrap from textile-supported calandared materials, such astarpaulins for trucks, can be used in manufacturing bands for tennis and volleyball nets.
There are other products that can be made from PVC that has been separated from otherplastics. The physical separation process is not too difficult, in principle, since PVC is muchdenser than other plastics. For instance, PVC bottles can be melted and incorporated directlyin PVC pipe. However, contaminants from recycled PVC waste tend to migrate to the outsideof extruded products (like pipe); in practice, problems are avoided by co-extruding 3-layerpipe with recycled material in the center layer [Svalander 1996]. The opposite problem arisesin the case of injection-molded products [Hahn 1995]. Cheap shoe soles can be made fromrecycled PVC plastic toys, and beach sandals, for instance; this is done in Brazil [ibid].
PVC insulation from wires and cables is obtained routinely as a by-product, as the wiresare stripped for copper recovery. This material is relatively inhomogeneous and is used tomanufacture garden hose [Hahn 1995]. The recovered material is used on the inside, withvirgin PVC on the outside to improve appearance and mechanical properties. Unfortunately,it is often contaminated by small pieces of copper wire. The latter can puncture the hose andcause leakage. Recovered post-consumption PVC insulation can also be used for shoe soles.
Potential recycling routes for pure PVC are shown in Figure 4. As much as two thirdsof PVC demand can potentially be filled by recycled products, although the near-termpotential is much less. The European Council of Vinyl Manufacturers (ECVM) estimatesrecycling potential in the next 5-6 years for Europe as 10-15% [Svalander 1996]. Recyclingfrom unsorted household waste is a particular challenge, since plastics constitute a significantand awkward fraction of such waste: 6%-7% by weight, but 20% by volume. There are twoapproaches (apart from energy recovery), viz. chemical depolymerization and mechanicalmixing/blending. Possible chemical methods of depolymerization include hydrolysis,alcoholysis, pyrolysis and hydrogenation. However hydrogenation and pyrolysis of PVCwaste results in HC1, which is undesirable. In the case of pyrolysis, about 56% of the product(by weight) consists of HC1, which is difficult to recover for use in small facilities (althoughthe chemical industry does quite a lot of pyrolysis of CFCs for HC1 recovery). Neither of theother processes is known to be used at present.
Mechanical recycling is currently the most feasible approach. One possible product ofmixed post-consumer plastics is "plastic wood". A homogeneous product can be producedby melting a mixture of plastics, at high pressures. Composition may be up to 20% PVC, the
Robert U. Ayres, The Life Cycle of Chlorine; Part III
File CHLORUSE.III as printed on June 15, 1996 Page 14
rest consisting of polyethylene (PE), polypropylene (PP), polystyrene (PS) and somepolyethylene terephthalate (PET). The mechanical properties of this material improve with PScontent [Hahn 1995]. When the PS content of the mixed waste is too low, virgin PS must beadded, which increases costs. Because of the compatibility problems, long screw extruders areneeded, operating at 200 rpm, rather than the conventional 20-40 rpm typical of extruders forvirgin materials [ibid]. Pigments must be added. Also, surface modification chemicals, suchas silanes and titanates, may be needed to improve compatibility among the differentcomponents [ibid].
Plastic wood products made by this process can be drilled and assembled with metalscrews, but cannot be nailed like natural wood. This sharply limits their applicability tomainly prefabricated objects like pallets, park furniture, dividers, and flowerpots. At present,these things often cost more than comparable objects made from natural wood. (They areoften used for public relations value). Nevertheless, plastic wood has significant potentialadvantages in use. Such products do not warp or twist. They are impervious to biologicalattack and never need painting. They are particularly attractive as a substitute for naturalwood that would have to be chemically treated by toxic metal-based wood preservatives suchas copper-chromium-arsenic (CCA). In future, plastic wood products should find increasingapplication for flooring, walls, doors, roof tiles, exterior panels and outdoor furniture. To theextent that plastic wood can compete with the natural product, of course, it has an enormouspotential demand.
Alternatives to recycling are landfill disposal or incineration. The advantage ofincineration is that there is some energy recovery (similar to that for coal, althoughsignificantly less than for other plastics), as shown in Table VII. The disadvantage is thatfairly sophisticated controls are needed to recapture the hydrogen chloride and other volatilechlorinated combustion products, as well as the ash which contains heavy metals and fillers.(Incinerator ash is regarded as hazardous, due to heavy metal content, and its disposal is afurther problem, though not primarily due to PVC). These controls are "state of the art" inEurope, but older incinerators are not necessarily adequately equipped.
PVC is not known to be hazardous in normal use, despite some suspicions. However,most PVC products contain significant quantities of other chemicals. Non-rigid PVC productscontain plasticizers, some of which can "leak" into the environment during use. Over amillion tonnes of plasticizers are used annually in Europe, of which over 75% is for PVC.Even rigid PVC products may contain up to 10% plasticizer (for processing), while flexibleproducts contain much more. The extreme case, PVC flexible "cling" film — for food — maybe 60% plasticizer.
The most important plasticizer is di-2-ethyl hexyl phthalate (DEHP). Western Europeanconsumption of DEHP and other phthalate esters amounts to more than 850 kMT per annumcurrently [Cadogan 1995]. This chemical migrates from packaged foods into the foodsthemselves; it is also found in human blood that has been stored in PVC bags. All suchproducts are tested for safety. However there have been concerns that it may migrate evenfrom landfills where PVC products are disposed into ground water. Trace amounts of DEHPare found in sewage sludge; it is also being detected in fish, birds eggs, marine mammals andother environmental "niches" far from its original use. However, the routes by which thismigration may occur are not known. Also, there is no known environmental hazard arisingfrom this.
Belatedly, suspicions have been growing that DEHP might be hazardous. It is a possibleestrogen mimic, with possible long term effects on human fertility, although it appears to bethe least likely among the various candidates under consideration. It is a "priority pollutant"in the U.S. and was put on the priority list of environmentally relevant substances in the
Robert U. Ayres, The Life Cycle of Chlorine; Part HI
File CHLORUSE.III as printed on June 15, 1996 Page 15
Netherlands, mainly due to the large tonnages involved and the potential for exposure. Its usein food packaging has been banned in Austria.
On the other hand, the Dutch authorities, having conducted a preliminary investigationof the risks to humans, concluded that they were very limited, except possibly in the vicinityof point sources such as manufacturing facilities. No further investigation was deemednecessary, at least for the present. The UN (ECE) has declassified DEHP as a hazardoussubstance.
Endnotes
1. I wish to acknowledge the valuable assistance of Donald Rogich, Director, Office of Mineral Commodities,Dennis Kostick, commodity specialist for salt, Bureau of Mines, U.S. Department of the Interior, WashingtonD.C., Dr. Gert F. Grau, Dow Europe, Prof. R. Papp, Elf-Atochem, Philippe Feron, Prof. A. J. Lecloux and J.Y. Van Diest all or Euro Chlor, and John Svalander, European Council of Vinyl Manufacturers (ECVM).
2. Cited by Martin Smith, chairman of ECSA's General Technical Working Group at the Euro Chlor conference,February 1995 [Euro Chlor 1995a].
3. For a discussion of the recycling of solvents in Europe — including all types, not only chlorinated solvents —see Informations Chimie #323 Dec 1990, and #354 Jan. 1994.
4. The two sources do not agree exactly; the more recent AFEAS data must be presumed to be more complete.However, the differences are not very great.
5. Because fully fluorinated compounds used as solvents are extremely potent greenhouse gases (although they donot contribute to the ozone depletion problem), it is important that they, too, be recovered and recycled.
6. There is much dispute on what constitutes relative safety. Some environmental groups want to ban incinerationtotally.
Robert U. Ayres, The Life Cycle of Chlorine; Part III
File CHLORUSE.III as printed on June 15, 1996 Page 16
References
[Adelman 1990] Adelmann, G., PVC-Bodenbelege & Vinyltapeten: Trend zum giftiger wohnen in Ausstiegaus der PVC-Nutzung (Unpublished), 1990. [working paper]
[AFEAS 1995] Alternative Fluorocarbons Environmental Study. Production, Sales & Atmospheric Release ofFluorocarbons through 1993, AFEAS, Washington DC, March 1995.
[Beck et al 1988] Beck, H., K. Eckart, W. Mathar & R. Wittkowski, Title missing, Chemosphere 17, 1988:283-290.
[Bonifant et al 1995] Bonifant, Benjamin, Michael Porter & Claas Van der Linde. Competitive Implicationsof Environmental Regulation, Management Institute of Environment & Business, Washington DC, 1995.
[Brahms et al 1989] Brahms, E. et al, Papier Kunstoff Verpackungen: Eine Mengen &Schadstollbetrachtung, Berichte (1/89), UBA, Berlin, 1989.
[Cantin 1992] Cantin, J., Overview of Exposure Pathways, (EPA/774/R-92/002), Proceedings of theInternational Roundtable on Pollution Prevention & Control in the Dry Cleaning Industry, 1992.
[Claus et al 1990] Claus, F., H. Frieze & D. Gremler, Es geht auch ohne PVC: Einsatz-Entsorgung-Ersatz,Rasch & Roehring, Hamburg, Germany, 1990.
[Clement et al 1983] Clement, R. E., A. C. Viau & F. W. Karasek, "Daily Variations in Composition ofExtractable Organic Compounds in Fly Ash from Municipal Waste Incinerators", Journal ofEnvironmental Analytic Chemistry, 1983.
[ECSA 1993] European Chlorinated Solvent Association. Les Solvants Chlores en Europe, ECSA, Brussels,1993. 2nd edition.
[ECVM 1994] European Council of Vinyl Manufacturers. On the Environmental Impact of the Manufactureof Polyvinyl Chloride (PVC): A description of Best Available Techniques, ECVM Division of APME,Brussels, August 5, 1994.
[Enquete 1994] Enquete Commission of the German Bundestag on the Protection of Humanity & theEnvironment, Responsibility for the Future: Options for Sustainable Management of Substance Chains& Material Flows; Interim Report (ISBN 3-87081-044-4), Economica Verlag, Bonn, Germany, 1994.[translated from the German]
[Eurochlor 1995] Euro Chlor. Annual Review: Euro Chlor Statistics, 1990-1994, Euro Chlor, Brussels, 1995.
[Eurochlor-a 1995] Euro Chlor, Persistent Organic Pollutants & Persistent Toxic & Bioaccumulative ExistingSubstances, Definition Paper, Euro Chlor, Brussels, October 1995.
[Franklin 1994] Franklin, James, "The Atmospheric Degradation & Impact of Perchloroethylene",Toxicological & Environmental Chemistry 46(3), 1994 :169-182.
[Fuller 1976] Fuller, B. B., Air Pollution Assessment of Tetrachloroethylene, Report (MTR-7143), MITRECorporation, Washington DC, February 1976.
[Gaines 1981] Gaines, Linda L, Energy & Materials Use in the Production & Recycling of Consumer-GoodsPackaging, Technical Memo (ANL/CNSV-TM-58), Argonne National Laboratory, Argonne IL,February 1981. [Prepared for the U.S. Department of Energy]
[Hahn 1995] Hahn, Albert, Consultancy report to CMER (Unpublished), 1995.
Robert U. Ayres, The Life Cycle of Chlorine; Part III
File CHLORUSE.I1I as printed on June 15, 1996 Page 17
[Holmbom 1991] Holmbom, Bjarne, Chlorine Bleaching of Pulp: Technology & Chemistry, Environmental &Health Effects, Regulations & Communication, Case Study (ISBN 952-9596-00-6), Abo Akademi,Turku/Abo Finland, April 1991.
[Hydroscience 1978] Hydroscience, Inc, Rainfall Runoff & Statistical Receiving Water Models, TaskReport (208), Hydroscience, Inc, New York, 1978. [PCP Task 225]
[Johnston et al 1979] Johnston, Pauline, Virginia Hodge & Karen Slimak, Materials Balance forChlorobenzenes: Level I, Preliminary Report (EPA-560/13-80-001), JRB Associates, McLean VA,December 1979.
[Kilburn & Warshaw 1993] Kilburn, Kaye and Raphael H. Warshaw "Effects on NeurobehavioralPerformance of Chronic Exposure to Chemically Contaminated Well Water" Toxicology andIndustrial Health Vol 9, No. 3 1993 pp. 391-404.
[Koistinen et al 1992] Koistinen, Jaana, Tapio Nevaiainen & Juhani Tarhanen, "Identification & LevelEstimation of Aromatic Coeluates of Polychlorinated Dibenzo-p-dioxins & Dibenzofurans in Pulp MillProducts & Wastes", Environmental Science & Technology 26(12), 1992 :2499-2597.
[Kranendonk 1995] Kranendonk, Sasha, The Rent-a-Chemical Strategy, Draft Case Study, Wuppertal Institutfuer Klima, Umwelt & Energie, Wuppertal, Germany, 1995.
[Maatela 1992] Maatela, P., TITLE MISSING PhD Thesis, [University of Jyvaskyla, Finland] , 1992.
[Miller & Mintzer 1986] Miller, Alan S. & Irving M. Mintzer, The Sky (underline is the Limit: Strategiesfor Protecting the Ozone Layer}, Research Report (3), World Resources Institute, Washington DC,November 1986.
[Neely 1977] Neely, W. Brock, "Materials Balance Analysis of Trichlorofluoromethane & CarbonTetrachloride in the Atmosphere", The Science of the Total Environment 8, 1977 :267-274.
[Nelson 1988] Nelson, Thomas P., Findings of the Chlorofluorocarbon Chemical Substitutes InternationalCommittee, Project Summary (EPA/600/S9-88/009), United States Environmental Protection Agency,Air & Energy Engineering Research Laboratory, Research Triangle Park NC, May 1988.
[NRC 1991] National Research Council, National Academy of Sciences, Environmental Epidemiology: Vol I.Public Health & Hazardous Wastes, National Academy Press, Washington DC, 1991.
[Strauss 1992] Strauss, H., Options for updating the NESCAUM Publication: 'Health Evaluation Documentfor Tetrachloroethylene' (Unpublished), September 15, 1992.
[Svalander 1996] Svalander, John, Letter addressed to R.U. Ayres, May 15, 1996
[Swanson et al 1988] Swanson, S. E., C. Rappe, J. Malmstrom & K.P. Kringstad, Title missing,Chemosphere 17, 1988 :283-290.
[Swift 1995] Swift, T. Kevin. Chlorine & Its Major End Uses, Chemical Manufacturers Association (CMA),Washington DC, March 1995.
[Tecnon 1993] Tecnon. Data tables, Tecnon, London, 1993.
[UBA 1989] Umwelt Bundes Amt. Data tables, German Federal Office of the Environment, Berlin, 1989.
[Wallace 1981] Wallace, D.N., "Dangers of Polyvinyl Chloride Wire Insulation Decomposition", Journal ofCombustion Technology 8, 1981.
Robert U. Ayres, The Life Cycle of Chlorine; Part HI
File CHLORUSE.Ill as printed on June 15, 1996 Page 18
[Wilkniss et al 1975] Wilkniss, P.E., J.W. Swinnerton, R.A. Lamontagne & D.J. Bressan, Title missing,Science 187, 1975 :832.
[Wormgoor 1994] Wormgoor, J.W., Sources of Dioxin Emissions into the Air in Western Europe, TNOReport (94-405), TNO Institute of Environmental & Energy Technology, Apeldoom, Netherlands,November 1994. [prepared for Euro Chlor]

Robert U. Ayres, The Life Cyck of Chlorine; Part III
File CHLORUSE.III as printed on June 15, 1996 Page 19
Table I: Production and consumption of chlorinated solvents in Europe,1986-1992; USA 1993 (kMT)
Solvent 1986 1987Western Europe1988 1989 1990 1991 1992
USb1993
TrichloroethyleneProduction 182.7 165.7 168.9 153.6 130.9 113.3 125.2 65.7Consumption 138.7 134.3 133.9 118.4 107.8 96.1 83.0 39.5
PerchloroethyleneProduction 340.6 322.8 342.9 317.1 279.8 218.5 210.6 123.0Consumption 161.6 151.8 144.1 131.3 122.6 113.4 88.6 135.6
Methylene (di)chlorideProduction 331.5 305.3 309.8 293.4 293.3 244.0 234.1 160.0Consumption 197.0 181.2 182.4 175.4 169.6 157.1 153.9 107.8
1,1,1 TrichloroethaneProduction 204.6 203.2 218.1 222.3 228.5 202.1 198.3 205.0Consumption 137.8 129.6 128.5 129.3 122.4 109.0 92.7 170.5
Sources: a) [Euro Chlor 19951
b) [Swift 19951
Table II: Estimated production & use of CFCsfor 1985 (kMT)
Chemical U.S. Other CommunistOECD countries
World
CFC-11 75 225 41.5 341.5CFC-12 135 230 78.7 443.7CFC-113 73.2 85 5 163.2Source: [Miller & Mintzner 1986, Table Hy
Table III: Global production of CFCs in non-communist countries, 1950-1993 kMT,(reporting companies only)
Year 1950 1960 1970 1980 1985 1990 1993 Total 1931-93CFC-11 6.6 49.7 238.1 289.6 326.8 232.9 147.1 8523CFC-12 34.6 99.4 321.1 350.2 376.3 230.95 214.7 11061CFC-113 NA NA NA 103.7 187 174.8 48 2922CFC-114 NA NA NA 15 17.1 8.3 4.6 501CFC-115 NA NA NA 9.3 12.8 11.3 11.4 218HCFC-22 NA NA 56.1 126.3 153.4 213.7 240.6 3363Data Source: [AFEAS 19951
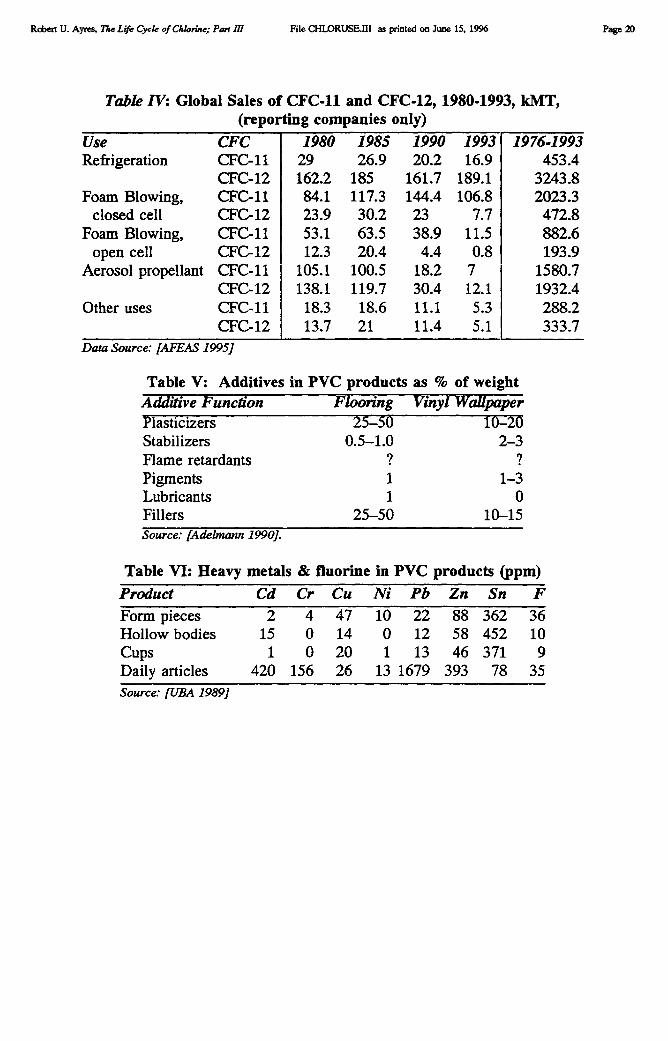
Robert U. Ayres, The Life Cycle of Chlorine; Part HI File CHLORUSE.III as printed on June 15, 1996 Page 20
Table IV: Global Sales of CFC-11 and CFC-12, 1980-1993, kMT,(reporting companies only)
Use CFC 1980 1985 1990 1993 1976-1993Refrigeration CFC-11 29 26.9 20.2 16.9 453.4
CFC-12 162.2 185 161.7 189.1 3243.8Foam Blowing,
closed cellCFC-11CFC-12
84.123.9
117.330.2
144.423
106.87.7
2023.3472.8
Foam Blowing,open cell
CFC-11CFC-12
53.112.3
63.520.4
38.94.4
11.50.8
882.6193.9
Aerosol propellant CFC-11 105.1 100.5 18.2 7 1580.7CFC-12 138.1 119.7 30.4 12.1 1932.4
Other uses CFC-11 18.3 18.6 11.1 5.3 288.2CFC-12 13.7 21 11.4 5.1 333.7
Data Source: [AFEAS 19951
Table V: Additives in PVC products as % of weightAdditive Function Flooring Vinyl Wallpaper
lasticizers 1Stabilizers 0.5-1.0 2-3Flame retardants 9Pigments 1 1-3Lubricants 1 0Fillers 25-50 10-15Source: [Adelmann 19901.
Table VI: Heavy metals & fluorine in PVC products (ppm)Product Cd Cr Cu Ni Pb Zn Sn FForm pieces 2 4 47 10 22 88 362 36Hollow bodies 15 0 14 0 12 58 452 10Cups 1 0 20 1 13 46 371 9Daily articles 420 156 26 13 1679 393 78 35Source: RIBA 19891
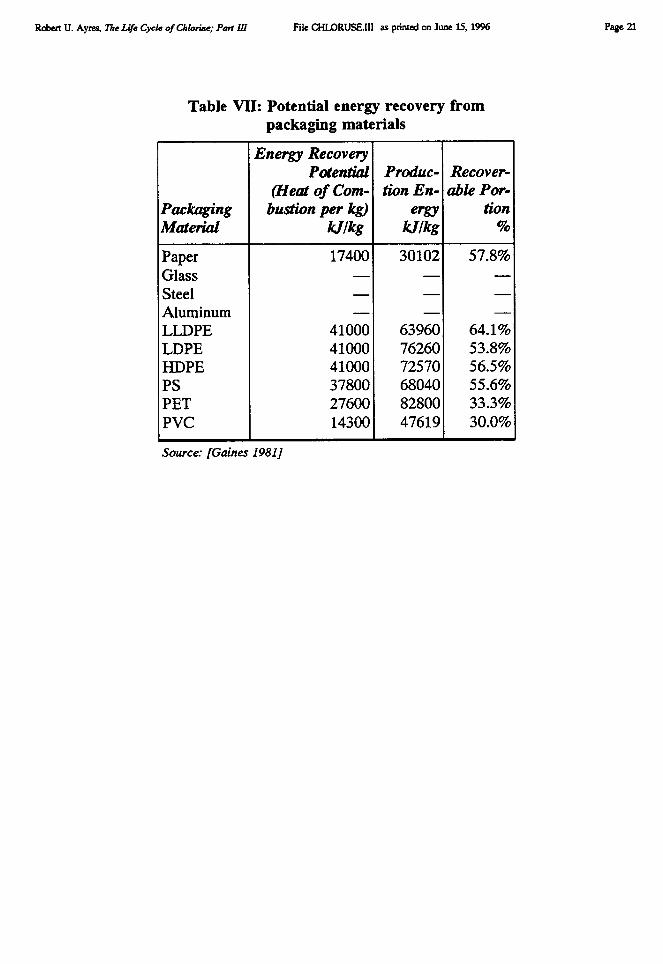
Robert U. Ayres, The Life Cycle of Chlorite; Part III File CHLORUSEIII as printed on June 15, 1996 Page 21
Table VII: Potential energy recovery frompackaging materials
PackagingMaterial
Energy RecoveryPotential
(Heat of Corn-bustion per kg)
kflkg
Produc-lion En-
ergykflkg
Recover-able For-
lion%
Paper 17400 30102 57.8%Glass — —Steel — —Aluminum — — —LLDPE 41000 63960 64.1%LDPE 41000 76260 53.8%HDPE 41000 72570 56.5%PS 37800 68040 55.6%PET 27600 82800 33.3%PVC 14300 47619 30.0%
Source: [Gaines 1981]
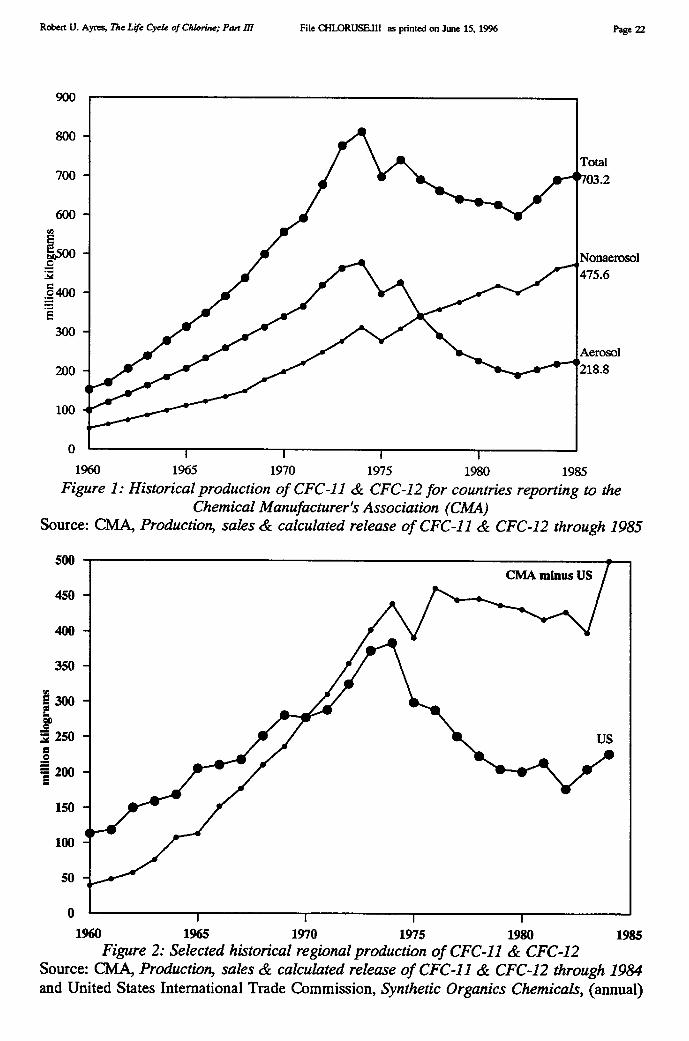
1
700
200
100
0 1 1 1
Total03.2
Nonaerosol475.6
Aerosol218.8
Robert U. Ayres, The Life Cycle of Chlorine; Part III File CHLORUSE.Ill as printed on June 15, 1996
Page 22
1960 1965 1970
1975
1980
1985Figure 1: Historical production of CFC-11 & CFC-12 for countries reporting to the
Chemical Manufacturer's Association (CMA)Source: CMA, Production, sales & calculated release of CFC-11 & CFC-12 through 1985
500
450 -
400 -
350 -
i1 300 —'ll
3 250 -CO
I 200 -
150 -
100 -
50 -
0 1 1 i 11960 1965 1970 1975 1980 1985
Figure 2: Selected historical regional production of CFC-11 & CFC-12Source: CMA, Production, sales & calculated release of CFC-11 & CFC-12 through 1984and United States International Trade Commission, Synthetic Organics Chemicals, (annual)
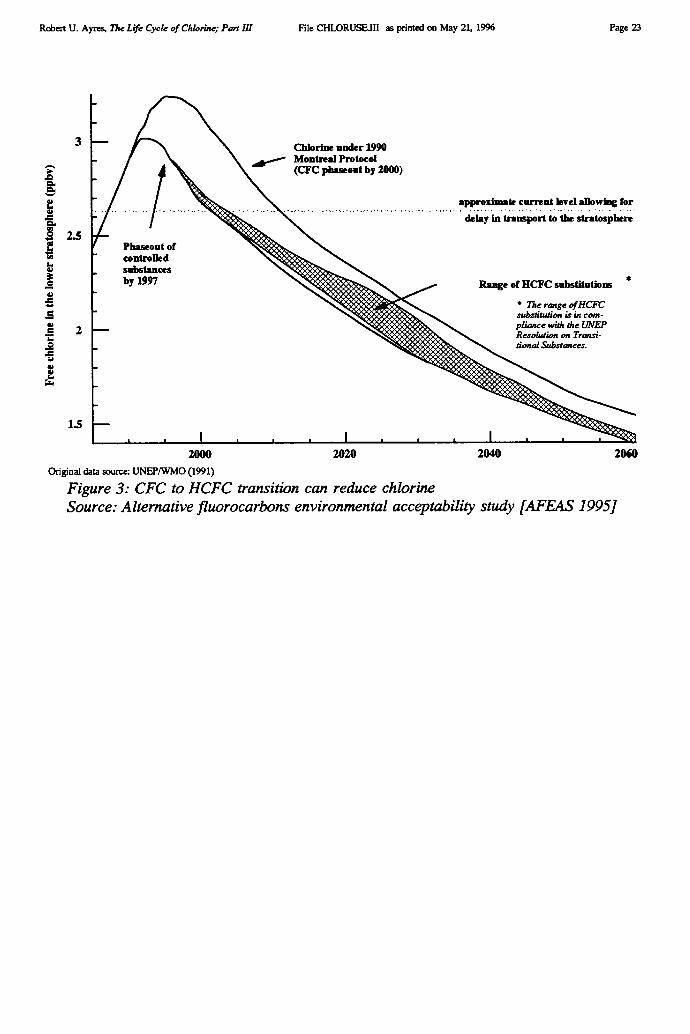
Range of HCFC substitutions
• The range of HCFCsubstitution is in com-pliance with the UNEPResolution on Transi-tional Substances.
Chlorine under 1990Montreal Protocol(CFC phaseout by 2000)
approximate current level allowing for............
delay in transport to the stratosphere
1.5
Phaseout ofcontrolledsubstancesby 1997
Robert U. Ayres, The Life Cycle of Chlorine; Part III
File CHLORUSEIII as printed on May 21, 1996
Page 23
2000 2020 2040
2060Original data source: UNEP/WMO (1991)
Figure 3: CFC to HCFC transition can reduce chlorineSource: Alternative fluorocarbons environmental acceptability study [AFEAS 1995]
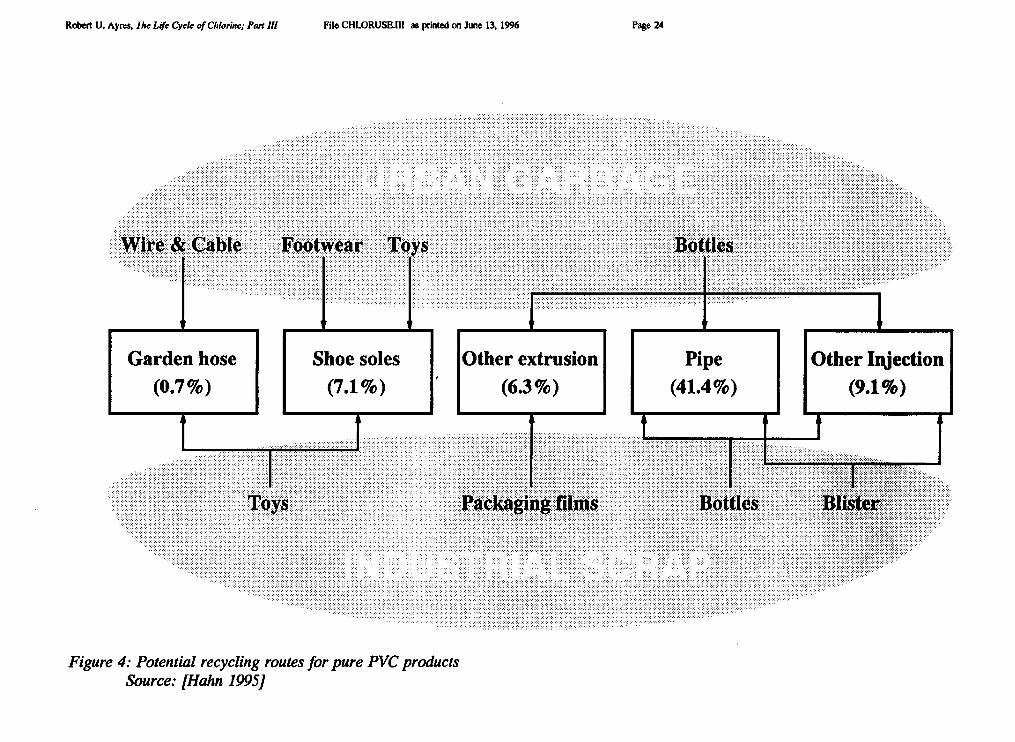
V
Pipe(41.4%)
Other extrusion(6.3%)
Shoe soles(7.1%)
Garden hose(0.7%)
Other Injection(9.1%)
Robert U. Ayres, the Life Cycle of Chlorine; Part III File CHLORUSE.III as printed on June 13, 1996
Page 24
Figure 4: Potential recycling routes for pure PVC productsSource: [Hahn 1995]
THE LIFE-CYCLE OF CHLORINE: PART IVACCOUNTING FOR PERSISTENT CYCLIC ORGANO-CHLORINES'
R. U. Ayres & L. W. AyresCMER-INSEADFontainebleau, France
May 1996
Abstract
This paper is the fourth of a series on the life cycle of chlorine. A number of cyclicorgano-chlorines share several key characteristics to a significant degree, notably volatility,solubility in lipids (fats), environmental persistence (resistance to photolysis or biodegrada-tion), a tendency to bio-accumulation and toxicity to aquatic organisms and/or birds andmammals. A subset of this group has been designated "persistent organic pollutants" (POPs).Because of their volatility, persistence, and tendency to bioaccumulate they are dispersedeither in vapor phase through the atmosphere, bound to dust or soil particles, or carried in thebodies of migratory animals. Members of this subset have been found in remote locations,such as the Arctic, far from the locations where they were initially used or produced.
With one significant categorical exception — the polychlorinated dibenzo-dioxins anddibenzo-furans (PCDDs and PCDFs) — all are, or were, originally produced for use as such,mainly as pesticides. PCDDs and PCDFs have never been produced for their own sake; theyare unwanted contaminants in some chemical intermediates (chlorinated benzenes) that werepassed on and incorporated in some final products, notably herbicides; they are also generatedspontaneously in most combustion processes, including fires of all kinds. Polychlorinatedbiphenyls (PCBs) were used mainly in capacitors and transformers because of their dielectricproperties and thermal stability. However they escaped into the environment when electricalequipment was discarded or accidently damaged. The majority of the POPs have been sharplyrestricted or banned outright in most of the industrialized countries, although some are stillproduced and/or used in less developed countries.
The qualities of persistence and bioaccumulation give special urgency to monitoring notonly point source emissions and local concentrations, but also the mobile environmentalreservoirs (MERs) of these chemicals. This is because human exposure is largely indirect.To conduct adequate risk analyses, far more detailed data is needed on quantities producedand used, quantities and location of storage, mode of use, location of use and period of use.Such data are not collected, or if collected they are not published, by any government orinternational agency.
R. U. & L W. Ayres Accounting for persistent cyclic organo-chlorines File CHLORPORIV as printed on June 14, 1996 Page 2
1. Background
The long-lived cyclic organo-chlorines constitute a special problem. Unlike most chlorinechemicals, including the major chlorinated solvents and PVC, many of these chemicals arebiologically active, yet slow to biodegrade. The majority of those discussed in this paper havebeen targets of attack by environmentalists for many years. For instance, DDT, HCH/Lindane,chlordane & heptachlor, the "drins" — aldrin, dieldrin and endrin — pentachlorophenol and2-4-5—t are all included among the so-called "dirty dozen" characterized by the PesticideAction Network [PAN 1990]. All except the "drins" and 2-4-5—t (plus PCB's) are alsoamong the priority list of persistent organic pollutants that were the subject of a majorinternational meeting jointly sponsored by the governments of Canada and the Philippines,held at Vancouver, June 4-5 1995.
Currently, the chemical industry distinguishes organic chemical pollutants that arepersistent, toxic and bioaccumulative (PTBs) and a subclass that are prone to long-rangetransport and deposition, viz Persistent Organic Pollutants (POPs). All PTBs, by definition,tend to remain for long periods in soils and sediments, or in the atmosphere. 2 Moreover, allof the chemicals in this group tend to accumulate in fatty animal tissues. 3 POPs aretransported over long distances and are now found in places (such as the Arctic) far from theoriginal point of use. 4 There are perhaps 20-25 POPs. Most POPs have been discontinued,or banned in most countries although in some cases — notably DDT — production continuesin some developing countries. Clearly, it is not current production and use that matters somuch as cumulative past production and environmental inventory.
Of particular concern, in view of recent developments, is the fact that some of thepersistent organo-chlorines have been found to disturb the development of animal endocrinesystems and the organs that respond to endocrine signals [Colborn et al 1993]. Effects dueto exposure of eggs or fetuses, or even exposure during early postnatal stages of development,are likely to be permanent and irreversible. Typical effects include feminization (or de-masculinization) of males, converse effects on females, sharply reduced fertility, low eggsurvival rates, as well as thyroid problems and damage to immune systems [ibid]. Exposureof females to some of these chemicals can result in transgenerational effects, due to theaccumulation and storage of the chemicals in fatty tissues which are subsequently mobilizedduring pregnancy and lactation [ibid].
While the ecotoxicological effects of the chemicals in question are still open to dispute,and some of the possible effects are still quite hypothetical and far from being proven, therisk cannot be taken lightly. It is true that the chemical industry in general, and the pesticideindustry in particular, have conferred many benefits on mankind. But it is by no means clearthat these benefits would outweigh the sort of fertility and transgenerational impacts that haverecently been suggested. In short, this is not a situation where it makes sense to wait until agreat deal more scientific evidence is in hand — which might take decades — beforeconsidering possible actions of a preemptive nature.
However this paper is not intended as a review of the evidence pro or con the uses oforgano-chlorines. Still less is it intended as a call to action. We agree that the evidence is stillmuch too scanty. Why this study? The answer has been phrased very neatly and conciselyby one of the more eminent and effective advocates of the chemical that started thecontroversy, namely DDT. The book from which the paragraph quoted below was borrowedbegan as a keynote address by the author, Professor Kenneth Mellanby (formerly director ofMonks Wood Experimental Station, in the U.K.) at a 1989 symposium of the British cropprotection council on "progress and prospects in insect control". Prof. Mellanby is not byany means opposed to the use of chemical pesticides. He says, however:
R. U. & L W. Ayres Accounting for persistent cyclic organ-chlorines File CHLORPOP.IV as printed on June 14, 1996 Page 3
"If we are to assess the possibility of DDT becoming a widespread pollutant, weneed to know how much of the chemical has been produced, and so may be presentin the world. We have reasonably accurate figures for the U.S.A. ...There are nooverall figures for the rest of the world....We are probably not very far out if weassume that something like 2,000,000 tonnes of DDT have been producedworldwide, and that much of this still exists. We need to know where it is to befound" [Mellanby 1992 p.34]
Exactly the same point can be made with respect to all of the other chemicals on our list,most of which are much less well documented even than DDT.
It is our immediate purpose to bring together all the available official (and, whereobtainable, unpublished) information on the "industrial metabolism" of the major persistentorgano-chlorines. (Some have been omitted, notably the insecticide "Mirex" and a few others).Not all of them are actually hazardous to the environment, if used properly, as will be noted.However, all are persistent and, are or have been subjects of concern in the past, for variousreasons. Thus the need for data on production and use of these chemicals is, if possible, moreurgent than for other substances. Our major concern is with the scarcity or absence of data.Unfortunately, as Prof Mellanby points out, a lot of the needed data has not been publishedanywhere. This is not to say that the data does not exist. It does exist. But it is buried in thearchives of chemical manufacturers, and government agencies, who treat it as "confidential"and "proprietary" — even long after the compound is no longer being produced!
By suppressing this data, or allowing it to be suppressed, the chemical companies andgovernment agencies make it effectively impossible to carry out the sort of quantitative riskanalysis that is needed.
2. Chlorobenzenes & chlorophenols
According to our previous mass-balance calculations for Europe, 93 kMT of chlorine wasconsumed to produce approximately 100 kMT of monochlorobenzene and 25 kMT ofdichlorobenzenes (plus 44 kMT of by-product HC1) in Europe in 1992 [Ayres & Ayres 1996].Our data on higher-order chlorobenzenes and chlorophenols is less complete. However, itappears that 12 kMT of chlorine was consumed to produce chlorophenol in Europe in 1992.It would follow from basic chemistry that about 27 kMT of chlorophenol plus a little over6 kMT of HC1 must have been produced. Production interrelationships among the group areillustrated by Figure 1.
We do not have a detailed breakdown of current uses of chlorobenzenes. However, basedon 1977 U.S. data, 30% of the monochlorobenzene was used as a solvent, mainly in theproduction of isocyanates (TDI, MDI), but also for paints, adhesives, waxes and polishes. Theremainder of the monochlorobenzene was apparently used as an intermediate in the productionof other chemicals, principally phenol, chloronitrobenzene, diphenyl oxide and rubberchemicals. Monochlorobenzene was also used in the production of DDT (see below). Thechlorobenzene route to phenol seems to have been largely displaced by cumene, at least inthe U.S., by the early 1970s [Lowenheim & Moran 1975]. However, it is likely that thechlorobenzene route was still significant in Europe at the time, though probably not muchlonger.
Chloronitrobenzene itself is an intermediate in the production of several other chemicals,notably phenylene diamine, nitroaniline, chloroaniline and nitrophenol. These are mostly dye
R. U. & L W. Ayres Accounting for persistent cyclic organ-chlorines File CHLORPOPJV as printed on June 14, 1996 Page 4
intermediates or explosives. Diphenyl oxide is also used in organic synthesis, but it has directuses as a heat transfer medium (replacing PCBs) and in soaps and perfumes.
There are three isomers of dichlorobenzene, of which two are important: ortho- (o) andpars- (p). The main use of o-dichlorobenzene (1977) was in the manufacture of 3,4dichloroaniline. This is an intermediate in the production of pesticides, dyes, epoxy resinsand polyethers. About 20% of domestic consumption was used as a solvent carrier in theproduction process for toluylene di-isocyanate (TDI). It was also used for paint removers andengine cleaners. The two major uses of p-dichlorobenzene as such were as a deodorant (50%)and for moth control (40%). The remainder (10%) was used as a chemical intermediate in theproduction of dyes, insecticides and polyphenylene sulfide resins.
There are three isomers of trichlorobenzene, of which only one (1,2,4) is significant. Itis used as an intermediate in the production of dyes and herbicides (dicamba and 2,5-dichlorobenzoic acid). It is primarily used as a solvent for dyes, for crystallization, forlubricants, as a metal degreasing agent, as a termite control agent and as a transformer fluid(as one of the substitutes for PCBs.)
Higher chlorinated benzenes — notably hexachlorobenzene — are or have been used insmaller quantities, mainly as a fungicide. HCB is discussed later. The higher chlorinatedbenzenes are more volatile than mono- or di-chlorobenzenes. They are dense but insoluble(hence they tend to sink to the bottom of lakes or streams) and they tend to bio-accumulatein fatty animal tissues.
Chlorophenols have been used, as far as we know, mainly as an intermediate in theproduction of herbicides, such as 2,4-dichlorophenol (2-4–D) and 2,4,5-trichlorophenol(2-4-5-1), and the wood preservative pentachlorophenol (PCP).
3. DDT
Dichloro-diphenyl-trichloroethane, or DDT, was first synthesized in 1874 by an Austrianstudent, Othmar Zeidler, but no effort was made to find a use for it. It was not until 1939 thatit was rediscovered and proven to be a highly effective insecticide by Paul Muller atCiba-Geigy AG in Switzerland. DDT's low vapor pressure, insolubility in water and resistanceto degradation make it very effective in use. This was regarded as a favorable characteristicin the early years.5
On the other hand, DDT is now classed by EPA as "moderately hazardous" to humansbased on acute toxicity. According to the International Association for Research on Cancer(IARC) it is "probably carcinogenic" for humans. DDT and its metabolites have inducedtumors in experimental animals. Long term effects that are suspected, if not conclusivelyproven, include reduction of male sperm counts, spontaneous abortions and low birth weights.Its toxic effects on other species — especially aquatic invertebrates — are far moredevastating. DDT can kill most fish species at fairly low exposure levels. It is bioaccumulat-ed in fatty tissues along the food chain. It had disastrous effects on a number of species offish-eating birds, such as the Sea Eagle.
It was first marketed in Switzerland in 1941.The products were patented in all majorcountries and licensed by Geigy for production to a number of German, British and Americanfirms in 1942. British production began at the Trafford Park facility of Geigy in 1943, andwas expanded rapidly. U.S. production began about the same time.
The structure of DDT is shown in Figure 2. It is produced by the reaction of chloral withmonochlorobenzene, in the reaction:
R. U. & L W. Ayres Accounting for persistent cyclic organ-chlorines File CHLORPOPIV as printed on June 14, 1996 Page 5
CC13CHO + 2C6H5C1 (C6H4C1)2CHCC13 + H20
using strong sulfuric acid or oleum as a catalyst. (Chloral is made by chlorination ofacetaldehyde or oxychlorination of ethanol). There are two waste streams, namely acid andunreacted chlorobenzene. Both are recycled for further use. Waste acid is neutralized with adilute caustic, yielding NaCl. The waste stream contains DDT (1-5 ppm) and other relatedcompounds (analogs) in somewhat higher concentrations.
Total U.S. production of this compound from 1945 through 1972, when most domesticuses were banned, was 1.337 million metric tons (MMT); subsequent U.S. production (forexport only) appears to have been about 140 kMT.6 World production for the years1960-1973 is shown in Table I. Interpolations by the authors for missing years are shown insmall italics. It should be noted that the figures in the table are probably an underestimate,since several producing countries (including the U.K.) have been omitted. Production inEurope (EEC) in 1981 has been given as 8.1 kMT [Heinisch et al 1993]. Indian productionin the range of 7400-9000 kMT/y has been published in various sources, including officialgovernment statistics, for various years between 1984-85 and 1993. 7 Indonesian productionis of the same order of magnitude. 8 (Indonesian exports of DDT in 1989 were $10.3 million,mostly to Vietnam).9
Based on the data in the table, it seems reasonable to suppose that U.S. productionconstituted about half of the world total prior to 1972, and about a third of the world totalthrough 1983, the final year. On this basis, the cumulative overall total world production inthe years through 1972 must have been in the neighborhood of 2.7 MMT. Cumulative worldproduction 1973-1983 would have been around 420 kMT.
Recent production in the rest of the world is unknown; there are no published data.'°However we can account for about 42.5 kMT/y of annual capacity in the late 1980's inFrance, Italy, Mexico, India, China and Indonesia (reduced by 7.5 kMT/y by the closure ofthe last French plant in 1990) not including the former USSR. Italian production is said tobe used only as an intermediate for the production of dicofol, an acaricide. Production for usestill continues in a number of countries at a rate of at least 30 kMT/y, and probably nearer50 kMT/y. The largest known current producer is India (about 7 kMT/y), but the formerUSSR is probably the largest actual producer and exporter, with annual production in theneighborhood of 20 kMT/y. Overall, we think total cumulative world production (and use)since 1983 must have been not less than 480 kMT, and more likely 600 kMT. Total globalproduction and use of DDT since 1944 thus approaches 3.6-3.7 MMT.11
In the year of maximum domestic (U.S.) consumption (1959), DDT was registered formore than 334 applications. Over 450 kMT of DDT were used in the U.S. alone during theperiod 1945-1972. Its low cost, persistence, and tendency to accumulate in the body-fat ofliving organisms from plankton and worms to birds, animals, and humans has led to its beingwidely distributed throughout the environment. These characteristics also resulted in seriousenvironmental concerns about the impact on fish and birds [Carson 1962; Graham 1970;Dunlap 1981]. As a result, domestic usage in the U.S. was partially curtailed in the 1960's.
A major change in regulatory authority occurred on December 2, 1970 when the federalregulation of pesticides in the U.S. was transferred to the Environmental Protection Agency.On June 14 of 1972 the Administrator announced the final cancellation of all uses (exceptpublic health emergencies). The U.S. ban went into effect January 1, 1973. Since the outrightban, only minor exceptions have been granted in the U.S., on a case-by-case basis. Aninternational treaty was signed in 1972 extending the ban to 28 countries, with severerestrictions in another 30 countries. Since the 1970's DDT has been used mainly in the
R. U. & L W. Ayres Accounting for persistent cyclic organ-chlorines File CHLORPOPJV as printed on June 14, 1996 Page 6
tropics for public health purposes (e.g. anti-malarial mosquito control) and in the formerUSSR.
Evidence of continued use in the former USSR, however, is extensive. A few examplestaken from the USSR 1989 State Report on the Environment12 include the following:
• In 1989 DDT contamination in soils in the wheat-growing region of Khirgistan amountedto 36-46 times the maximum allowable concentration of 1 ppm.
• On Moldavian farms, DDT contamination in some soils soil exceeded the maximumallowable concentration by factors of 29-92 .
• In the Ukraine, DDT contamination in some soils exceeded allowable concentrations byfactors of 16-29.
• In the cotton fields of Uzbekistan, DDT contamination in some soils exceeded allowableconcentrations by factors of 31-86.
Of 50,000 hectares in a number of regions in the former USSR surveyed in fall 1990 andspring 1991, 6700 hectares (13%) were found to harbor excess DDT (including metabolites)while 7300 hectares (14.6%) were over the limit by spring 1991. In Uzbekistan 46% of thefarmland exceeded twice the allowable level in the fall, and 66% exceeded three times theallowable level in the spring.
Although varying amounts of DDT may be lost by drift, volatility, wind erosion andremoval with crop, a large proportion lands on the soil and becomes mixed with the top layersdown to about 15 cm. It is lost from the soil at a very slow rate. The persistence of DDT insoil has been proven in many studies. The rate of disappearance is difficult to predict,however, since many factors can affect the nature, rate and extent of its degradation [Spencer1967]. It appears that volatilization is the major mechanism for loss from the soil [Mellanby1992 p.34]. As a result of variation among these factors the half-life may vary from a fewyears to decades. The accepted range is 15-190 years [Euro Chlor 1995].
The half life of DDT in the atmosphere is quite long: about 3 years. It may be degradedby UV light, or return to earth via rainfall. The half life of DDT in water is 12 years [ibid].At the time of peak use of DDT, in the 1960's, the average amount in the atmosphere wasabout 8 kMT [Mellanby 1992 p. 35]. Because of its persistence, a significant amount of DDTdispersed in the past remains in the environment. DDT lost to the atmosphere, or carried offby runoff and erosion, finally ends up in the oceans. It was calculated that in 1970 about 12kMT/y was being deposited by rainfall into the world's oceans, as compared to only 200tonnes/y via rivers and streams [ibid]. It is not known what happens to DDT in the oceans.However, its concentration in open oceans is not at detectable levels (< 1 part in 1012).
Because of microbial action in most soils there is a slow degradation of the DDTmolecule to a variety of metabolites. Among the more important products so formed isdichloro-diphenyl-dichloro-ethylene, or DDE. It can be produced chemically from DDT byreaction with an alcoholic alkali, catalyzed by iron, aluminum or chromium salts, in whichdehydrochlorination takes place.
Another degradation product is 1,1-dichloro-2,2-bis-(p-chlorophenyl) ethane, known asTDE or DDD. This chemical was also produced as a commercial product, mainly in the1950's, but not in large quantities. It is produced in vivo by reductive dechlorination of DDT— and may in turn be further dechlorinated to DDA, 4,4'dichloro-diphenyl-acetic acid.
R. U. & L W. Ayres Accounting for persistent cyclic organo-chlorines File CHLORPORIV as printed on June 14, 1996 Page 7
In humans and animals total DDT, DDD and DDE were found to have reached anaverage of 12 ppm in 1970 and had fallen below 7 ppm by 1980. Nevertheless, DDT is stillfound in whales, seals and seabirds — all high on the food chain — and there is reason tosuspect that it is still causing reproductive problems and eggshell thinning among birds.Because of its tendency to bioaccumulate in animal fats, DDT is also found in human tissues,and breast milk women living in the far north. For instance, women from northern Quebecare found to have DDT levels 5-7 times higher than women from the southern part ofCanada.
4. HCH & Lindane
Benzene hexachloride (BHC) and hexachlorocyclohexane (HCH) are common names forthe same chemical. The technical name is 1,2,3,4,5,6-hexachlorocyclohexane. The genericformula is C6H6C16. The structure is shown in Figure 3. It has been used as a pesticide since1942 when production was started in both France and England. Technical HCH consists ofseveral isomers, of which by far the most important is the active gamma isomer, and fouralmost completely inactive isomers. In addition to these there is usually about 4% ofheptachlorocyclohexane and a trace of octachlorocyclohexane, neither of which showinsecticidal activity. Normally the gamma-isomer is about 14% of the total product, althoughit is sometimes purified to higher concentrations. The pure gamma isomer (>99%) is knownas Lindane.
The benzene hexachloride process is an addition chlorination process, starting frombenzene (C6H6), catalyzed by UV light. The chlorine to benzene ratio is adjusted so that theproduct is a saturated solution of HCH in benzene [Sittig 1980, p.90]. Most HCH is furtherprocessed to separate the gamma isomer. The Lindane manufacturing process consists ofcontacting the crude HCH with acetic acid or methyl alcohol. The alpha and beta isomers arenearly insoluble in these liquids; thus the gamma concentration is more than doubled. A frac-tional crystallization step is used to remove the remaining alpha and beta isomers.
The disposal of inactive stereoisomers of HCH, which constitute 84% of the weight, ispotentially a serious environmental problem. A theoretical possibility is to convert the un-wanted stereoisomers of HCH into hexachlorobenzene (HCB). The problem is lack of demandfor that substance (see below). The same technique can probably be extended to theproduction of other chlorobenzenes (by the addition of benzene). Although producers withintegrated chlorine chemical facilities could convert the unwanted isomers into other productsor pyrolize them the yield hydrochloric acid, some past producers in the US and Europe andsome present producers elsewhere may have simply dumped this material in landfills orincinerated it (for example, in the floating incinerator ship that formerly operated in the NorthSea).
During periods when there were as many as six companies producing HCH in the U.S.,production data was available (See Table II). There is no current production in NorthAmerica. Apart from Inquinosa in Spain, the major producers of HCH, currently, are in India,where it is used to protect cotton, and for malaria control. Total output of HCH in India overthe last 10 years has ranged from 25 to 30 kMT/y. Specifically, production in the years1984/5, 1985/6, 1986/7 and 1987/8 (est.) was 28.65 25.67, 25.4 and 26.0 kMT, respectively[Bowonder 1995].
HCH is also produced in Russia, and is apparently used extensively in Central Asia inthe cotton growing areas (Turkmenistan, Uzbekistan, Kazakhstan). Combined exports of DDTand HCH from the USSR grew from 2.7 kMT in 1960 to 38.8 kMT in 1988, but no
R. U. & L W. Ayres Accounting for persistent cyclic organ-chlorines File CHLORPOPJV as printed on June 14, 1996 Page 8
breakdown between DDT and HCH is available. Nevertheless, it would seem that Russia isa very large producer of HCH, possibly the world's largest.
Cumulative U.S. production of technical HCH and lindane from 1947 through 1963 was361 kMT; peak production of 53 kMT occurred in 1951 (Korean War), but both productionand domestic sales remained at a level of around 30 kMT/y through the 1950's. After 1963only lindane was produced in the U.S. (still from HCH, of course), but quantitative data onlindane output was not published. Based on agricultural use surveys and EPA actions, itwould appear that U.S. technical lindane use declined from 919 tonnes in 1964 (of which 323t. was non-agricultural) to perhaps 500 tonnes in 1971. According to USDA/EPA use surveys,agricultural use virtually ceased thereafter. However, the Association of Lindane producersasserts that virtually all current North American use — around 700 t/y — is agricultural (asa seed dressing for cereal grains and rapeseed) [Denkler 1996].
Initially the active crude HCH was widely used. It later became apparent that thegamma-isomer was actually the only insecticidal component. Use of technical HCH wasbanned in the 1970's in both North America and Europe, but large amounts are consumed inIndia, for instance, mostly for cotton protection and malaria control [Biegel 1995]. However,both HCH and Lindane have continued to be produced and used in the rest of the world. Acombination of Lindane (actually, a partially refined form of technical HCH) and DDT wasone of the most widely used general purpose agricultural pesticides in eastern Europe and theformer USSR. This combination is probably still in use in Central Asia. Technical HCH ismainly used as such in India and central Asia, for control of cotton pests and, to some extent,for locusts and mosquitos. Indian use is around 20 kMT/y and the former USSR probablyuses as much or more. We estimate global consumption of technical HCH (not includingHCH for lindane production) at around 50 kMT/y, which is roughly the same level as duringthe 1950's. While there may have been some decline in the 1960's and 1970's — the figuresare necessarily imprecise — cumulative global consumption of technical HCH as aninsecticide appears to have been around 1 MMT, with an uncertainty of 20% either way.
As regards Lindane per se, current output is presumably the same as consumption (onaverage), which is about 4.4 kMT/y. This probably represents an increase during the 1950's,followed by a modest decrease since the early 1970's, and a recent recovery. Overall,cumulative global usage since 1950 is probably in the range 150 kMT, plus or minus 30kMT. This amount of lindane would have required approximately 1.050 MMT of technicalHCH as input feedstock, resulting in about 900 kMT of waste (inactive isomers of HCH) fordisposal or subsequent conversion into other chlorobenzenes.
Lindane is not significantly absorbed by plants through foliage. Lindane has a high vaporpressure and evaporates quickly if used on the surface: in tests 76-90% evaporates within 24hours after use [Boehnke et al 1989]. As a consequence, atmospheric transport is the primarymechanism for dispersion, with runoff accounting for the rest. However, most Lindane hasbeen used for soil or seed treatment, not foliar treatment. In fact all foliar uses of Lindanehave been discontinued.
Isomers of HCH (including Lindane) have been detected in very remote areas, includingboth the Arctic and the Antarctic. High and increasing levels of the HCH isomers have beendetected in rainfall in Europe during the 1980's [Lohse et al 1989]. However, apart from thepossibility of some minor misuse of Lindane, it would seem that the major source of thismaterial must be attributed to foliar applications of HCH in other parts of the world,especially India and Central Asia. Indeed, recent data show a decline in gamma isomerLindane) concentrations in the North and Baltic Seas [Denkler 1996].
Very little Lindane is taken up by plants through their roots. Lindane decomposes in thesoil, due to the action of bacteria, algae and fungi. The half life of Lindane in water is 10-20
R. U. & L W. Ayres Accounting for persistent cyclic organ-chlorines File CHLORPOPIV as printed on June 14, 1996 Page 9
days; in soil it ranges from 23 to 126 days in temperate zone conditions [Denkler 1996].Strictly speaking, these values are too low for Lindane to be characterized as "persistent"according to the criteria mentioned at the beginning of this paper.
The degradation process is slower under aerobic condition than anaerobic conditions;similarly, it is accelerated by moisture and the presence of organic matter. Of the variouspotential metabolites, only two — pentachlorocyclohexene and tetrachlorocyclohexene arerelatively long-lived. However, these occur in negligible amounts only. Others, such aschlorobenzenes are rapidly degraded, while highly chlorinated compounds like hexachloro-benzene, pentachlorobenzene and pentachlorophenol are scarcely produced at all becausechlorine is liberated too rapidly.
Lindane decomposes in soil to PCCH (gamma 1,3,4,5,6,pentachlorocyclohexane) [Yuleet al 1967]. The vapor pressure for PCCH is much higher than that of lindane — rangingfrom 10 times at 20°C to 22 times at 40°C. In the field with variable temperature conditionsprobably two thirds to three fourths of the applied Lindane is volatilized and lost as PCCH[Cliath & Spencer 1972]. This route for the volatilization of Lindane and its principalmetabolite probably account for the fact that residues in the soil in crop areas are minimal andfound in only a few test sites.13
The bioaccumulation factor BCF) for Lindane in fish is 1400, well below the proposed5000 criterion for persistence. In mammals, Lindane is excreted rapidly. It does notbioaccumulate in fatty tissue to a significant extent. The major degradation products excretedare isomers of di-, tri- and tetra-chlorophenols. The half life of Lindane in mammals is 2-4days. Overall, very little Lindane is metabolically transformed (except by soil organisms).
5. Hexachlorobenzene (HCB)
Hexachlorobenzene (HCB) is chemically perchlorobenzene. The chemical formula isC6C16. The structure is shown in Figure 4. It differs from HCH/BHC (which has beenmanufactured in much larger quantities) in having no hydrogen.
HCB can be produced efficiently from the unwanted stereoisomers of HCH (those notneeded in Lindane manufacture) by treatment with metal chlorides or anhydrous sulfuric acid[Sittig 1980 p. 449]. Thus, HCB and Lindane are potentially — and logically should be —co-products. HCB is also a normal by-product of industrial chlorination processes forperchloroethylene and carbon tetrachloride. (It is also found in waste streams from chlorinegas manufacturing). The tarry residue from trichloroethylene, perchloroethylene and carbontetrachloride production is reputed to contain 10-15% HCB, along with 70-75%hexachlorobutadiene (HCBD) and 10-20% hexachloroethane. As such, HCB is a constituentof some process waste streams. The commercial product is probably recovered as a by-product of these processes.
HCB has been found to be a major impurity in at least two widely used pesticides,dimethyl tetrachloroterephthalate (dacthal) and pentachloronitrobenzene (PCNB). At one time,HCB was also used as an intermediate in the manufacture of the widely used wood preserver,pentachlorophenol.
Peak U.S. production of HCB appears to have been about 2700 metric tons (1977). It isa natural by-product of benzene chlorination, Lindane manufacture and a number of otherindustrial chemicals (e.g. carbon tetrachloride, perchloroethylene). In the U.S. HCB has beenused as a fungicide to protect seed of wheat, oats, barley and rye against seed borne diseasessuch as bunt, smuts, seed decay and seedling blight in the early 1970s, but it was withdrawnfrom the market in the early 1980's. HCB is no longer listed in any of the standard catalogs
R. U. & L W. Ayres Accounting for persistent cyclic organ-chlorines File CHLORPOPJV as printed on June 14, 1996 Page 10
of farm chemicals. Use since 1964 must be presumed to have been very small. Most HCBin the environment arises from industrial process wastes and as a contaminant of several otherpesticides and herbicides. Current emissions appear to be small, probably less than 100 MT.
Cumulative global output (including wastes and contaminants) in the 1960's and 1970'sare extremely difficult to estimate. As a very rough order of magnitude, we conjecture thatthe peak might have been around 1980, at about 10 kMT (twice the highest U.S. level),declining sharply thereafter. On this basis, the global total, to the present time, could havebeen anywhere between 100 and 200 kMT.
HCB is extremely stable and long-lived. It is dispersed via evaporation (sublimation) anddeposition. It is nearly insoluble in water but soluble in alcohol and lipids. For this reason ittends to accumulate in fatty tissues of animals [USEPA 1977]. The dangers of bioaccumulati-on of HCB in animal fat were first observed in cattle brought to slaughter in 1970. The worstcase occurred in central Louisiana, where the problem was traced to airborne emissions ofHCB from several large chemical plants in the vicinity [USEPA 1977]. There were alsoincidents involving sheep in Texas and California. A testing program began at that time, andit was found that the chemical was already quite widespread in the environment [ibid].
6. The Aldrin group
The "Aldrin group" of cyclic chlorinated hydrocarbon insecticides included chlordane,aldrin, dieldrin, endrin, heptachlor, endosulfan and toxaphene. Chlordane was developed in1944 by Julius Hyman and others at Velsicol Corp. in the course of a search for uses ofcyclopentadiene. Endrin, also developed and produced by Velsicol, was put into productionin 1947. Aldrin and dieldrin were developed by Hyman et al in 1948 and found to have verystrong insecticidal properties. Hyman left Velsicol about that time to set up his own company,Julius Hyman and Company. Because all of the work on chlordane (and much of the workon aldrin and dieldrin) had been done at Velsicol the rights to the patent applications for allthree products were claimed by Velsicol and were so awarded by the courts. Later JuliusHyman & Co. was acquired by Shell Chemical Co., which purchased the rights to aldrin anddieldrin from Velsicol. Velsicol was the sole manufacturer of chlordane, endrin andheptachlor. Only chlordane and heptachlor are still produced by Velsicol, almost entirely forexport.
The group is related in that production of all of them (except toxaphene) is based on onecyclic feedstock: dicyclopentadiene, a by-product of synthetic rubber manufacture. Theinterrelationships among the pesticides in this group are shown schematically in Figure 5. Asan indicator of possible magnitudes, total U.S. production of dicyclopentadiene (includingcyclopentadiene) for 1991 was 65,911 metric tons, by five producers [USITC 1991]. Of this,47,923 tonnes were sold to other users, the remainder being consumed internally.
A process and an intermediate common to all members of the aldrin group is theproduction of cyclopentadiene and hexachlorocyclopentadiene (HCP), starting fromdicyclopentadiene. This is a two step process, consisting of heating to cause separation ofdicyclopentadiene, followed by chlorination. The chlorination is direct. By-product HC1 isneutralized by caustic soda, resulting in NaCI (salt) waste. The product hexachloropentadieneis soluble in carbon tetrachloride or perchloroethylene [Honea & Parsons 1977]. The structureof this intermediate is shown in Figure 6.
Some data on production, sales and exports of the aldrin-toxaphene group as a whole, andaldrin and dieldrin in particular, was assembled in 1983 for hearings of the U.S. Congressto determine whether a number of further uses of chlorinated pesticides should be suspended.
R. U. & L W. Ayres Accounting for persistent cyclic organo-chlorines File CHLORPOPJV as printed on June 14, 1996 Page 11
See Table III. These data are not specific to particular chemicals, but they provide someguidance for interpolation and extrapolation where precise data are not available.
6.1. Chlordane & Heptachlor
The process for manufacturing chlordane starts with a mixture of hexachloropentadiene(chlordene) and chlorine. The chlorine is reacted with sulfur dioxide to yield sulfur-(oxy)-chloride. The latter reacts, in turn, with chlordene at atmospheric pressure to yield chlordaneand sulfur dioxide, with excess sulfur chloride and chlorine gas. The batch process takesabout 1 hour. Chlordane (liquid) is removed and the gases are recycled [Honea & Parsons1977]. Heptachlor is a co-product of chlordane (about 7%). It is also made by chlorinationof chlordene. Heptachlor is 3 to 5 times more effective as an insecticide than chlordane. Thestructures of chlordane and heptachlor are shown in Figures 7 & 8.
Due to increasing concerns with regard to both human and environmental toxicity, mostU.S. uses for chlordane and heptachlor were initially suspended by EPA in 1975 with theremaining applications phased out during the years 1978-1983. As of 1989 chlordane hadbeen banned in 25 countries and severely restricted in 21 countries [PAN 1990].14
Chlordane consumption as a general-purpose agricultural insecticide in the U.S. probablypeaked in the 1950's, with a second peak around 1971 (partly due to switching from otherbanned pesticides), at around 8.5 kMT. Specific data on chlordane production since then isentirely lacking, but in the early 1970's U.S. consumption ranged from 300 tonnes to nearly1 kMT, mainly as a soil poison for termite control; exports were probably comparable. Thisseems to have declined gradually to a current level of perhaps 200 tonnes/y (based onhistorical ratios of chlordane/heptachlor and trade statistics). Extrapolating backward fromthese figures, we estimate that cumulative chlordane production from 1950 through 1992 wasaround 150 kMT, with a large uncertainty factor.
Production of heptachlor in 1971 has been estimated to be 2.7 kMT [Matsumara 1975].Production in the years 1976 and 1977 was 0.68 kMT and 1.12 kMT, respectively, almost allof it exported [US Congress 1978]. We have no later figures.
Residues of chlordane have been found to be more persistent than those of aldrin andheptachlor but less so than DDT and dieldrin [Edwards 1966]. The half life of chlordane inthe soil is estimated at about 3.8 years [Euro Chlor 1995, Appendix 3]. The half life ofchlordane in water is also estimated at 3.8 years [ibid]. Residues have been detected in soilafter 14 years. The measurement of chlordane residues is complicated by the variety ofcompounds (including heptachlor and as many as 18 unidentified compounds) that make uptechnical chlordane. Apparently all other constituents degrade more quickly than the pureisomers.
Trans-nonachlor, a degradation product, is of specific concern because of its tendencyto be accumulated by fish. In a study to determine the amount of technical chlordane thatwould affect fish it was found the component accumulated to the greatest extent wastrans-nonachlor for which whole body residues were up to 145,000 times higher than thosein the water [Cardwell et al 1977].
6.2. Aidrin, Dieldrin, Endrin
These three insecticides are closely related in structure; as shown in Figures 9, 10, &11 below. As noted above, all are manufactured from cyclopentadiene and hexachlorocyclo-
R. U. & L W. Ayres Accounting for persistcnt cyclic organo-chlorines File CHLORPOP.1V as printed on June 14, 1996 Page 12
pentadiene. Dieldrin can also be made from aldrin. They were manufactured in the U.S. (byShell) until both were banned in 1974; subsequently they were produced for a number ofyears in the Netherlands. The only production data available is that given in Table III above.No current production is known. However, as of 1990 these pesticides were apparently stillbeing used in a number of developing countries [PAN 1990].
These three insecticides, especially endrin, are acutely toxic to humans, as well as otherspecies. Endrin metabolites are apparently even more toxic than endrin itself. Ingestion,inhalation or skin absorption can all lead to poisoning by aldrin or endrin. Dieldrin is toxicby either inhalation or skin absorption. They are classed as highly hazardous by WHO.Despite being widely banned and restricted, they have caused many accidental deaths and fishkills. (One case of water contamination allegedly caused 400 deaths). Aldrin and dieldrin areclassed as "probable human carcinogens" by IARC. Dieldrin may reduce human fertility.
All three are extremely persistent in the soil. All three are bioaccumulative. In biologicalsystems aldrin is epoxidized to dieldrin. The half life of aldrin in soil is estimated to be 1year; the half-lives of dieldrin and endrin are 3 years and 12-14 years respectively [EuroChlor 1995 Appendix 3]. Half lives in water are 2 years for aldrin, 4 years for dieldrin and112 days for endrin [ibid]. Dieldrin residues are found in many organisms, including foodcrops.
63 Endosulfan
Endosulfan was introduced by Hoechst in the mid 1960's. It is a sulfurous acid ester ofa chlorinated cyclic diol. The formal nomenclature is 6„7,8,9,10-hexachloro-1,5,5a,6,9,9a-hexahydro-6,9-methano-2,4,3-benzodioxathiepin 3-oxide (IUAP). There are two isomers. It'sstructure is shown in Figure 12.
There are two manufacturing processes [Goebel et al 1982]. The final stage is a reactionbetween thionyl chloride and an intermediate, endosulfandiol. The latter is produced by eitherof two routes. The first is diene synthesis of hexachlorocyclopentadiene and cis-butene-(2)-diol-(1,4). The second is itself a two stage process, beginning with synthesis of endosulfandioldiacetate by Diels-Alder addition reaction of hexachlorocyclopentadiene with cis-1,4-diacetoxybutene-(2). This in turn is hydrolyzed to form endosulfandiol. The reaction betweenendosulfandiol and thionyl chloride yields a constant mixture of isomers, consisting of 70%a-endosulfan and 30% f3-endosulfan.
Current global production is estimated to be 12-13 kMT/yr, in at least 6 countries. Thebiggest producing country appears to be India, with six plants producing about 5.4 kMT/y.This level appears to be relatively steady. Lacking any historical data it is reasonable toextrapolate backward, allowing for a few years for initial market penetration. This impliescumulative global production to date of the order of 300 kMT, plus or minus 50 kMT.
Unlike the other members of the aldrin group, endosulfan is still registered for a greatmany crop uses in many countries. It does not appear to be unduly hazardous, if used withreasonable care. However, endosulfan is definitely persistent: the half life in soil is 60-900days, depending on climate [Euro Chlor 1995 Appendix 3]. The half life in water is 178 days[ibid].
6.4. Toxaphene
R. U. & L W. Ayres Accounting for persistent cyclic organo-chlorines File CHLORPOPJV as printed on June 14, 1996 Page 13
Toxaphene is one of a group of chlorinated terpenes. Hercules Co. developed toxaphenein 1946 as an outgrowth of research on uses of pine oils. It was the major producer (and theonly producer for many years). Alpha-pinene (camphene), the feedstock, is recovered fromturpentine and reacted with alkali. Toxaphene is then manufactured by direct chlorination ofcamphene in the presence of a catalyst (UV light). When chlorinated it has the empiricalformula C10H10C118 and contains 67-69% chlorine. The technical product is reported to containsome 175 polychloro derivatives. The most insecticidally active of these are 2,2,5-endo-6--exo-8,9,10-heptachlorobomane and 2,2,5-endo-exo-8,9,9,10-octa-chlorobomane, each of whichforms some 2-6% of the technical product. The structure of toxaphene is shown in Figure 13.
Toxaphene was produced and used until 1983 in the U.S. We have no U.S. productionstatistics, but consumption estimates are available from USDA for a number of years between1964 and 1983. Toxaphene was the most heavily used general purpose insecticide from theearly 1960's (post-DDT) to the mid 1970's. While toxaphene has been recommended for along list of crops and pests, by far its largest application has been on cotton — 17.5 kMT in1974 — with a mere 2.2 kMT being applied to other field crops, mainly soybeans, in thatyear.
The peak period of consumption appears to have been 1972-1975. A fairly accurateestimate of total cumulative U.S. consumption can be made, viz 450 kMT. We have no dataon U.S. exports, although there were undoubtedly some. East German production began in1956 and continued until 1990. The peak year was 1982. East German production continueduntil 1990. Total East German production was 45.95 kMT, of which 28.74 kMT was exported[Parlar 1995]. There is no known current production anywhere in the world, thoughconsumption is still legal in some countries. Russia is a possible producer, based ontechnological capability and large-scale cotton production, but we have no confirming data.It is of interest that Eva Voldner, of Environment Canada, has "interpolated" a cumulativetotal global usage of 1.33 MMT over the period 1950-1993 [anon].
Toxaphene is extremely persistent. Its half life in both soil and water is estimated to be20 years [Euro Chlor 1995, Appendix 3].
7. Pentachlorophenol (PCP)
Pentachlorophenol is an organo-chlorine pesticide, mainly used as a wood preservative.Chemically it is a benzene ring with five chlorines and an OH. It's structure is shown inFigure 14. The chemical name is 2,3,4,5,6 pentachlorophenol. About half of the PCP iscompounded as a sodium salt, sodium pentachlorophenate (Na-PCP). Both substances areclassed as "moderately toxic" to man, based on acute effects. It is toxic to mammals, andaquatic organisms, as well as insects. It bioaccumulates along the food chain in fatty tissues.
Pentachlorophenol is produced by two routes. One route is simple chlorination of phenolwith excess chlorine, at atmospheric pressure and 105 C, in the presence of a catalyst (FeC13or A1C13). Wastes from this step (mainly C12 and HCI) can be cycled to a secondary reactorwhere more phenol is added and a mixture of (ortho- and para-) mono, di, tri, and tetrachlorophenols is produced [Honea & Parsons 1977; Sittig 1980]. This sequence can bereversed, beginning with partially chlorinated phenols, then making pentachlorophenol in asubsequent reaction from polychlorinated feeds, with the help of a catalyst. Dichlorophenoland trichlorophenol are then separated from each other by fractional distillation. The dichloro-and trichloro- phenols are intermediates in the production of several herbicides 2,4-D,2,4,5-T, Silvex and hexachlorophene, (see next section), whence all of these products tendto be produced together in one location.
R. U. & L W. Ayres Accounting for persistent cyclic organ-chlorines File CHLORPOPJV as printed on June 14, 1996 Page 14
An alternative process, based on hydrolysis of hexachlorobenzene (HCB) has been usedby Dynamit Nobel. HCB is reacted with caustic soda (NaOH) yielding PCP and sodiumchloride as a waste.
It has been found that, in the past, representative samples of wood preservatives withtechnical grade pentachlorophenol have been high in impurities — particularly polychlorinatedbenzodioxins (PCDDs) and polychlorinated benzofurans (PCDFs). While more recent PCPproducts are much less contaminated, it must be remembered that large quantities of PCPproduced in past years are still embodied in treated wood.
Production of PCP probably began in the 1930's, but we have no information on that.U.S. production was 22.6 kMT in 1974, 20 kMT in 1977 and about the same in 1980. WestGerman production in 1976 was 4.5 kMT, continuing at that level through 1981, and at aslightly lower level (3.3-3.8 kMT/y) through 1984 [BUA 1985]. Production in Europe in theearly 1980's was around 9 kMT/y. World production in that year was estimated to be 50 kMT[Crosby 1981]. 15 Since then it has declined steadily, partially due to environmental concerns.None is currently produced in Europe, where its use has been heavily regulated for sometime, and was scheduled to be phased out by 1995. The 1995 world total is about 16 kMT/y,of which half is produced in the U.S. and the remainder is divided between Mexico andChina. Thus, cumulative world production 1981-1993 would seem to be in the range 300-350kMT. Assuming production began in 1950 and peaked in 1970 at 50 kMT/y, we canextrapolate a total world output during the period 1950-1980 to have been about 1 MMT,plus or minus 10%, for an overall total of 1.3 MMT.
Thanks to its persistence and toxicity to a variety of organisms, PCP was and is mainly(80%) used as a wood preservative (against fungus decay, termites, and lyctus beetles), havinglargely displaced creosote (a coal tar derivative) in that use in the 1950's. Over the years1955-1981 300 kMT of pentachlorophenol (PCP) were consumed in the U.S. for woodpreservation [Ayres et al 1988]. Eventually part of this PCP preserved wood, whether in thedisposal of sawdust and scraps left over from construction or in the accidental or intentionaldisposal of wooden structures, is likely to be burned. The burning of PCP treated material orchlorinated phenoxyphenols in general will yield trace amounts of PCDD. These are likelyto be carried into the atmosphere. This concern appears to be supported by a number ofreports that dioxins have been found in incinerator effluent in Canada, France [Clement, Viau& Karasek 1983] and the Netherlands [Lustenhouwer, Olie & Hutzinger 1980; Olie, Lusten-houwer & Hutzinger 1982]. (See section 5.6. below for further discussion of the dioxincontroversy).
In recent years PCP, as a wood preservative, has been displaced by other compounds,notably copper-chrome-arsenic (CCA). This substitution largely accounts for the decline inPCP sales. PCP is also a molluscicide. In the latter use it is used to control snail carriers oflarval human blood flukes causing the disease schistosomiasis in Egypt and other tropicalcountries.
PCP is an intermediate in the production of pentachloronitrobenzene (PCNB), a soilfungicide and seed dressing agent. The chemical structure of PCNB is similar to that of PCP,except that there is a nitrite (NO 2) group in place of the OH radical. We do not know howmuch PCNB is produced, but there are at least six producers in the world.
PCP is persistent, but is gradually degraded by exposure to UV light, and by bacteria andfungi. Because of its low solubility and its tendency to combine with cellulose and otherorganics, it remains in soils and sediments. Its half life in soil is estimated at 48-1500 days,depending on conditions [Euro Chlor 1995, Appendix 3]. The half life of PCP dissolved inwater is less than one day [ibid].
R. U. & L W. Ayres Accounting for persistent cyclic organ-chlorines File CHLORPOP.IV as printed on June 14, 1996 Page 15
It is probably transported as soil or sediment, mainly by water flow and/or erosion.Consequently the chemical is widely dispersed in trace quantities. PCP has been detected ingroundwater, sewage effluents, sediments, landfill leachates, and even in snowpack at remotelocations. It is bioaccumulative. Residues have been detected in many species of animals, andfish.
8. Chlorinated phenols & herbicides (2-4-5 T & Silvex):
The manufacturing of 2,4,5-T began in 1948. Phenol is chlorinated stepwise to a mixtureof (ortho- and para- ) mono, di, tri, and tetra chiorophenols. These are separated from theunreacted phenol by reacting with potassium carbonate to form water soluble salts.Polychlorophenols are then separated from each other by fractional distillation. Pentachloro-phenol is usually made in a subsequent reaction from polychlorinated feeds, with the help ofa catalyst (FeC13 or AlC13). The 2,4,5-Trichlorophenol isomer is reacted with chloroacetic acidand sodium hydroxide to produce 2,4,5-T. Another route to 2,4,5-trichlorophenol is from1,2,4,5-tetrachlorobenzene at high temperatures and pressures in the presence of NaOH. (SeeFigure 1). Silvex was produced by replacing the chloroacetic acid with chloropropionic acid.Alcohols were then reacted to provide the esters where these were desired.
Production levels were reported to the U.S. Tariff Commission beginning in 1951.Production rose erratically to 2.87 kMT annually in 1960 (Table IV). Production jumpedduring the period 1961 - 1968 to accommodate heavy military -use in Vietnam (mainly during1964 - 1968), which consumed 20 kMT of the chemical in "agent orange". Military salesslowed sharply in 1969 and output in that year dropped to 2.27 kMT and some producersdropped out. Production statistics are unavailable after 1969. Table V shows some of the U.S.companies which manufactured 2,4,5-T and derivatives in 1955, 1965 and 1969.
Production data for Silvex and hexachlorophene are not available at all, although U.S.consumption data for 2,4,5-T and Silvex have been published for 1978 (Table 'VI). No dataon production of the intermediate 2,4,5-trichlorophenol is available. The use pattern for 1978is probably fairly typical of use over the past three decades, averaging 9.3 million lbs./yr.sprayed on 2 million acres in the U.S.A.
Data for 1978 are shown because this is the last year of unrestricted use. Both 2,4,5-Tand Silvex were restricted in February 1979 by a suspension of their registration for use onrights-of-way and pastures [USEPA 1979]. Uses not suspended at that time includedpermanent rangeland, airports, fences, hedgerows, lumber yards, refineries, non-food cropareas, storage areas, tank farms, industrial sites, and all other areas not previously suspendedwere suspended by the final order banning all uses which was issued in 1980.
The principal uses of 2,4,5-T (as compared to 2,4—D) have been for the control ofbroad-leafed woody growths and weeds, while leaving grass unaffected. In the private sector,railway, electric power and pipeline companies use it as a way of keeping clear rights-of-wayand other areas that were likely to become overgrown. In the government sector highwaydepartments, forestry and parks departments use it for clearing shoulders, fire lanes and accessroads all with considerably less manual labor than was previously needed. It has also beenused in forest management to remove undesirable deciduous trees and prepare land forplanting. This application, using helicopters for aerial spray coverage, is blamed for havingcaused a high frequency of miscarriages among the women in one area in Oregon (thisepisode led to the product being suspended for most uses March 1, 1979).
R. U. & L W. Ayres Accounting for persistent cyclic organo-chlorines File CHLORPOPJV as printed on June 14, 1996 Page 16
9. Polychlorinated biphenyls (PCBs)
Another well-known category of cyclic organo-chlorines, no longer produced but stillpersistent in the environment, was the chlorinated biphenyls (PCBs). The class of polychlorin-ated biphenyls consists of compounds formed by chlorination of a biphenyl with the generalformula (C121110). Biphenyls are double ring hydrocarbons. The basic structure is shown inFigure 15. There are 10 possible forms, depending on the number of chlorine substitutionsin the biphenyl molecule as viz. monochloro-, dichloro-, trichloro-etc. Chlorine content rangesfrom 18% to 71% by weight. There are several isomers of each form.
The major U.S. (and world) producer of PCBs was Monsanto, which designated its PCBproducts by the trade name Aroclor®. The manufacturing process used by Monsanto was astraightforward (iron-based) catalytic batch chlorination, at elevated temperatures, yielding amixture of crude PCBs. Excess chlorine and HC1 were removed by alkaline washing. Thiswas followed by distillation to separate the products by density and boiling point [Kaley1995]. Small quantities of polychlorodibenzofurans (PCDFs) were apparently produced insome batches, at the wash or distillation stage, reflecting variations in the process details[NRC 1980, p.147].
Production began in 1930. Total cumulative U.S. production from 1930 through 1975totalled an estimated 625 kMT (of which exports were 65 kMT). Of gross U.S. consumptionof 570 kMT an estimated 340 kMT were still in service in 1975 [Versar 1976, p. 7]. 16 Annualdomestic sales by Monsanto have been released for the eighteen years 1957-1974 accountingfor about 300 kMT [Versar 1976, pp 199-200].
PCBs are bioaccumulative, persistent and toxic to aquatic life. When this informationbecame known Monsanto voluntarily eliminated sales for non-electrical uses (1971) and thenit ceased all U.S. production in 1977. Japan stopped all production in 1972. Most otherindustrial countries continued production through 1982.
Data on recent output are summarized as shown in Table VII [Bletchly 1984]. It is worthnoting that Monsanto (including its U.K. operation) accounted for 542.4 kMT of which 43kMT was produced in the U.K. However, 499 kMT is actually a lower bound estimate ofMonsanto's U.S. production. EPA has recently used the figure 635 kMT. All other producers(excluding Czech production) accounted for 359.2 kMT, possibly also a lower bound estimate.The world total was therefore somewhat in excess of 900 kMT, and possibly over 1 MMT.
PCBs are very stable compounds. They also have good dielectric properties and heattransfer properties. Finally, they are virtually non-inflammable. Their past industrial uses astransformer fluids and in large capacitors were based on these characteristics. From 1930 to1975, 76% of total PCBs consumed in the U.S. were used as dielectrics in electricalequipment, mainly transformers (26%) and capacitors (50%). About 8% was used in relativelylong-lived applications: hydraulic systems, heat transfer fluids and lubricants. The remainder(16%) was divided up between several short-lived dissipative uses, mainly plasticizers — e.g.for "baggies" — (9.2%), carbonless copy paper (3.6%) and miscellaneous industrial uses suchas adhesives, ink and dye carriers, pesticide extenders, etc. [Versar 1976, Table 1.2-1, p. 7].
Substantially all the PCBs used in non-electrical equipment or for other purposes in theU.S. are by now out of service. Lubricants have a short life and are either lost in situ (e.g.by leakage) or collected and discarded later. The same is true for hydraulic fluids. Most ofthese ended in landfills, with a fraction leaked onto factory floors or paved areas where theycould be washed into sewers. Plasticizers for packaging materials and carbonless copy paperrapidly become refuse and go to landfills (85%) or to incinerators (15%). The incineration ofpaper and packaging products containing PCBs probably accounted for most of the airbornePCBs observed in the early 1970's.
R. U. & L W. Ayres Accounting for persistent cyclic organ-chlosines File CHLORPOPJV as printed on June 14, 1996 Page 17
As of 1975 223,000 tonnes of PCBs were estimated to have been disposed of in variousways [NRC 1980]. The estimated rate of PCB entry into landfills in 1975 was estimated tobe 5500 tonnes/yr for the U.S.. However the ending of PCB production has substantiallyreduced the contribution from manufacturing processes. From 1980 onward, the majorcontribution to landfills was expected to be from obsolete electrical equipment, specificallyliquid filled capacitors and large transformers. It has been estimated that just over 1 milliontonnes of PCB-contaminated liquids (assumed 25% PCB content) remained in "inventory" —for future disposal — as of 1984 [Bletchly 1984]. Using the same assumptions aboutlifetimes and rates of replacement, we have updated his estimates in Table VIII.
As of 1975, the total of all PCB reservoirs in the U.S. was estimated to be about 545kMT, of which 340 kMT was then still in service and 68.2 kMT was in potentially mobileenvironmental reservoirs (excluding soils, equipment dumps, landfills, and marine sediments),as shown in Figure 16. [NRC 1980] . The quantity being added to landfills each year at thattime was roughly 5.7 kMT. However the quantity removed from service each year via variousroutes is very difficult to estimate. Transformers and power capacitors tend to have very longuseful lives (est. 40 years), while plastics and hydraulic fluids have intermediate periods ofuseful life (est. 6 years)[ibid p.63]. Based on this assumption, the annual removal from theelectrical equipment in service reservoir in 1975 would have been roughly equal toconsumption for that purpose 40 years earlier (i.e. in 1935) By the same argument, thereservoir of non-electrical equipment in service should have been largely depleted by 1975since production for this purpose was discontinued after 1969. The annual rate of removal inthe early 1970's would have been roughly equal to peak annual consumption for thesepurposes in the late 1960's (4.5 kMT/y) and would have begun to decline sharply as thereservoir itself was emptied.
The present situation in the U.S. is far better than Figure 16 (which was for 1975)implies, and probably better than Table VIII suggests. In the U.S. most utilities haveaccelerated their replacement of PCB-containing equipment, and knowledgeable industrysources assert that virtually none remain in service today. In any case, large quantities havePCBs have been disposed of by incineration17 in the U.S., and little now remains. We havefew data on the current situation outside the U.S., except that large amounts of PCB-contaminated material still remain in storage in Europe and elsewhere. As of 1989 it wasreported that 200 kMT of such material awaited disposal in Europe, and that 17 specialpurpose incinerators — capable of producing temperatures up to 1200°C — were needed[New Scientist 19 August, 1989]. Only a few such facilities were then in existence. One ofthe problems was (and is) that it is difficult to obtain permission to cross state lines in theU.S., or provincial/national boundaries elsewhere with shipments of PCBs (or other toxicmaterials) needing such treatment. For instance, the only facility in Canada (in Alberta) is notallowed to accept PCBs from outside the province. A Canadian shipment intended for aspecialist handler in Britain, was not allowed to land its cargo in Liverpool, and so on.
The environmental fate of PCBs is a matter of concern. The mobile environmentalreservoir (MER) consists of PCBs that have escaped into the environment by various routesbut that have not been permanently immobilized. As of 1980, most of the MER was still inriver bottom sediments — much of it in the Great Lakes and the Hudson River — which aremobile to the extent of the potential for disturbance by dredging and floods, with attendantrisks of evaporative loss or biological uptake.
The MER is gradually being reduced by three routes: the largest fraction is attached tosoil particles or finds its way to lake or river bottom sediments that move very slowly to theocean. The second largest fraction is apparently being 'recycled' to landfills by way of sewagesludges and incinerator ashes. A small amount is degraded each year to simple chemicals. The
R. U. & L W. Ayres Accounting for persistent cyclic organo-chlorines File CHLORPOPJV as printed on June 14, 1996 Page 18
half life in water is 108 days [Euro Chlor 1995, Appendix 3]. Unfortunately PCBs in waterbodies can escape to the atmosphere by evaporation from saturated waters. As notedpreviously, PCBs are very stable and unreactive under ambient environmental conditions. Inparticular, oxidation, reduction, nitration, isomerization and nucleoplectic reactions withalkalis, alkoxides or amines take place only under conditions of temperature and pressure notlikely to be encountered in the natural chemical environment. Irradiation by sunlight(especially UV) can cause a variety of reactions, including the replacement of some (ortho)chlorines by hydroxy groups. This permits an oxygen atom to bind in the correspondingposition on the other ring to form CDFs.
However PCBs in soil or in the aquatic environment, are very unlikely to be exposed tosunlight. The half life in soil is 5 years [ibid]. Microbes can degrade the less chlorinatedPCBs fairly readily in sewage plants but the more highly chlorinated forms (constituting thebulk of all production) are biodegraded only very slowly by microbial action.
Apart from resistance to biological degradation, PCBs are almost insoluble in water, butare soluble in fats (lipids). This accounts for the fact that they are gradually incorporated intomicrofauna and filter feeders. They tend to be accumulated via food chains and build up inthe tissues of higher animals and fish. For example, a concentration factor of 230,000 hasbeen reported in fathead minnows. Cod and pike have been found with up to 10 mg/kg of fat.Further concentration occurs in fish-eating birds, where levels as high as 400 mg/kg havebeen found in the fat of cormorants and 600-700 mg/kg in the fat of herring gulls [USEPA1979; NRC 1980]. In humans, PCBs have been conjecturally linked to a few cases of cancerand liver disorders, although the existing epidemiological evidence does not support thishypothesis.
10. The dioxin controversy
Polychlorinated dibenzodioxins (PCDDs) are a sub-classes of poly-chlorinated compoundsconsisting of two chlorinated benzene rings linked in two places by oxygen atoms. There are75 congeners (depending on the number and position of the chlorines), of which the mosttoxic by far is known as 2,3,7,8-tetrachloro-dibenzo-p-dioxin or 2,3,7,8 TCDD, which thegeneric formula C12H402C14. Closely related are the polychlorinated dibenzofurans (PCDFs),of which there are 135 congeners.
PCDDs can withstand temperatures up to 800 C, even in the presence of excess oxygen.Thus they are extremely persistent and tend to become widely dispersed in the environment,primarily through the air. The average human exposure to PCDDs in industrialized countrieshas been calculated to be 70 picograms per kg of body weight per year. Average concentra-tion of the (apparently) most dangerous congener, 2,3,7,8-TCDD in human fatty tissues is inthe range 2 to 20 parts per trillion (ppt).
It is generally acknowledged that 2,3,7,8-TCDD, in particular, is the most potentcarcinogen yet tested on animals (rodents). It is toxic to rats at 5 parts per trillion in food,causing cancer and other disabilities. This fact has been accepted by many environmentalistsas conclusive evidence of extreme risk to humans. Other PCDDs and PCDFs are alsosuspected of causing liver and kidney damage to humans. However, the evidence is weakerthan supposed, as noted below.
PCDD/Fs tend to be quite stable against thermal decomposition. For example, theysurvive temperatures up to 800 C, even in the presence of excess oxygen. However there areother mechanisms for destruction. It is reported that TCDD in an organic solvent may havea half-life as short as one hour on leaves in sunlight. When deposited on the soil surface it
R. U. & L W. Ayres Accounting for persistent cyclic organo-cIslorines File CHLORPOPIV as printed on June 14, 1996 Page 19
has a half life of about 50-55 hours [Wagner 1983]. Under the soil, however, degradationdepends on bacterial action which is much slower. In this case the half life is believed to beabout one year [Kearny et al 1973].
It is known that the herbicide 2,4,5-trichlorophenoxyacetic acid known as (2,4,5-T), andas a component of "agent orange" in Vietnam, contains some of the chlorinated dibenzop-dioxins, especially 2,3,7,8 TCDD, as a contaminant. The 2,4,5-T used in Vietnam wasreported to contain 8.36 ppm TCDD [Imhoff & Fair 1980, Table 2]. A related product(2,4,5-tri-chlorophenoxy)propionic acid commonly called Silvex also has the samecontaminant, as does the germicide hexachlorophene. In all three cases, the contaminantprobably arises from the production of a common intermediate, 2,4,5 trichlorophenol.
There was a major controversy in the late 1970's and early 1980's as to the effects thatexposure might have had in industrial plants producing the material and to sprays encounteredby military personnel in Vietnam. It is a fact that many people have been exposed to thesesubstances. Those exposed include persons who have sprayed dioxin-containing herbicides,including professional herbicide applicators, farmers, and Air Force personnel who sprayedAgent Orange over jungles in the Vietnam War (known as "Ranch Hands"). 18 Some of thelatter group were later found to have elevated dioxin levels in body fat, as high as severalhundred parts per trillion (ppt), as contrasted to average levels in the range 2-20 ppt amongpersons who have no occupational exposure. Vietnam War veterans, including many soldierswho fought on the ground amid contaminated jungles, later filed class action suits against thegovernment. The Veterans Administration had spent over $500 million testing Vietnamveterans who thought they had been exposed to Agent Orange. No significant effects werefound. Nor have any been reported from Vietnam where the herbicide was used. In a caseof known excessive application (accumulating 1000 lb/acre of 2,4,5-T at Eglin Air ForceBase) TCDD persisted for more than ten years [Wagner 1983], albeit with no evidence ofharm to humans.
Apart from military use, large amounts of the herbicides 2-4-5—T (and Silvex) have beenused to control leafy growth in areas such as railroad and power line rights-of-way. It isknown that the dioxin (2,3,7,8-TCDD) is generated in trace amounts when 2,4,5-T is burned(as in a brush or forest fire) at low or moderate temperatures. About 1 mg of dioxin wouldbe formed by combustion of 1 kg of 2,4,5-T (1 ppm) under certain conditions. [See Stehl,Lamparski & Ahling et al cited in Imhoff & Fair, op. cit]. Yet, despite the furor, no evidenceof harm to humans has been attributed to such fires.
Others exposed to PCDDs and PCDFs include workers in chemical plants, and peopleexposed accidently. An accident at BASF in 1953 resulted in 3 deaths, although notnecessarily as a direct result of exposure to PCDDs. The two most famous incidents of thatkind were at Times Beach, Missouri, and Seveso, Italy.
Times Beach was a small town in Missouri, which sprayed its dirt streets with an oilychemical waste in the late 1970's, to suppress dust. It was later discovered that the chemicalwaste contained dioxins. Panic ensued among the citizens, stirred up by environmentalactivists. The Federal Government stepped in and effectively legitimized their fears bypurchasing the entire town for $36 million in 1983. A number of former residents sued thechemical companies that generated the wastes in question. Some out of court settlements werereached. But only one case was tried in front of a jury (1988). The jury could find noevidence that anyone had actually suffered harm.
Seveso is a small town in northern Italy, where a chemical plant exploded in 1976,releasing a cloud of chemical vapors that drifted over the town. Dioxins were later detectedin the fallout from the vapor. In Seveso the half life of PCDD has been estimated at ten years[DiDomenico et al 1980]. Again, there was widespread publicity and near panic. However,
R. U. & L W. Ayres Accounting for persistent cyclic mono-chlorines File CHLORPOPIV as printed on June 14, 1996 Page 20
apart from some cases of skin rash (chloracne) among children, there have been no otherconfirmed adverse health effects among those people exposed, although there are manydocumented cases of health effects among domestic animals.
Both dioxins and furans are formed in all kinds of combustion processes [Choudry &Hutzinger 1983]. Specific examples that have been verified include municipal wasteincineration [Hutzinger & Fiedler 1988],[Bartelds et al 1985], the burning of gasoline inautomobile engines [Muller & Buser 1986], in household furnaces [Thoma 1988], and inforest fires [Gribble 1994]. In fact, it is now known that the smoke from burning woodcontains over 100 organo-chlorine compounds, including numerous PCDDs and PCDFs.
The importance of ordinary combustion processes as a source of PCDDs and PCDFs wasnot even suspected for a long time, because there was no obvious mechanism for theirformation. Scientists from Dow Chemical Co. attempted to argue that dioxins were producedonly by incineration and energy production [NRC 1980], but this study was challenged byenvironmentalists, both for methodological weaknesses and on the specious grounds that Dowhad an obvious conflict of interest. It was generally assumed, for example, that PCDD/Fformation in municipal incinerators would only occur because of the presence of PVC andother chlorinated plastics in the waste. However, in the light of new evidence of the ubiquityof PCDD/Fs it has been necessary to reconsider the possible formation mechanisms.
It is an open question whether the dioxins found near incinerators were produced by theincineration process or whether they were present in the materials being burned. There arethree logical possibilities: (1) survival of trace levels of PCDD/F from the original fuel; (2)generation of PCDD/F from chlorinated precursor chemicals (such as PCP or PVC) or (3)synthesis of PCDD/F de novo from organic carbon and inorganic chlorine [Lustenhouwer etal 1980]. The first possibility is the old standard assumption, but it does not account for thefacts. The second of these possibilities has been elaborated considerably, but the basic ideais that PCDD/Fs are formed on the surface of fly ash particles by heterogeneous catalysis,from chloroaromatic chemicals already present in the environment [Dickson & Karasek 1987].The third of these possibilities has been explored in some detail by German researchers whoproposed a theory for the synthesis of PCDD/F from active carbon particulates by gas-solidand solid-solid reactions, catalyzed by copper Cu(II) ions [Stieglitz et al 1989a,b, 1990].
Recently experiments have been carried out to try to determine which of thesemechanisms is dominant. While both types of reactions apparently do occur, model studieshave shown that the relative yields of PCDD formed from PCP were enormously higher (byfactors of 72 to 99,000) than the yields of the de novo synthesis process [Dickson et al 1992].This tends to confirm that it is the combination of chloro-aromatic precursors and fly ash withcatalytic properties that is most effective in producing PCDD/Fs.
In this context, however, it is important to emphasize that there are still other routes thathave yet to be explored in detail. For instance, while synthesis of PCDD/Fs from inorganicchloride ions may be too slow to account for much of it, there are other possible non-aromaticorgano-chlorines in the environment. The simplest is methyl chloride (CH 3C1), which is pro-duced in fairly large quantities (c. 5 million tonnes) from natural sources, such as seaweed.It is likely to be this, or some other non-aromatic chlorine compound, that accounts forPCDD/Fs from forest fires. It has been estimated recently that forest fires in Canada, alone,generate around 60 kg of PCDDs per year [Gribble 1994]. (By comparison, the famousSeveso accident in Italy in 1976 generated about 6 kg of PCDDs.) Obviously wildfires inother parts of the world, especially where wood is the major source of fuel for all purposes,must generate much larger amounts of dioxins. Slash and burn agriculture is also likely to bea major contributor.
R. U. & L W. Ayres Accounting for persistent cyclic organ-chlorines File CHLORPOPIV as printed on June 14, 1996 Page 21
In fact, it now appears that combustion of wood and other fuels is actually the majorsource of PCDD emissions, even in the industrialized countries. (In other words, Dow'scontention in 1975 was substantially correct). For example, Table IX shows data from a recentGerman study on sources of dioxins (in toxic equivalents).
This is a rather surprising discovery, since it implies that humans have probably beenliving with dioxins for a long time without any detectable ill-effects. (This does not meanthere are no ill effects, however; see below.) It is even possible that tens of thousands ofyears of evolutionary development in close contact with open fires have left humans withrelatively effective protective mechanisms visa vis many trace chemicals carried by smoke.Humans may have protective mechanisms lacking in rats or guinea pigs. Be this as it may,it is an implication that the environmental groups find difficult to accept, since they appearto be attacking some of the least important causes of a problem whose importance is not evenscientifically established.
It is common practice for the USEPA and other agencies with responsibility forminimizing public health risk, to calculated "expected" cancer deaths from environmentalexposure to carcinogens by extrapolating from animal test results. Based on this procedure— which is of questionable scientific validity 19 — EPA originally estimated an upper limitof 528 cancer cases annually in the U.S. from an average annual exposure of 70 picogramsof dioxins per kg of body weight. In 1987 the EPA proposed to lower the assumed cancerpotency factor by a factor of 17, based on new data. This led to a much smaller estimate of31 cases of cancer per year, in the U.S. (There are nearly 500,000 reported cancer cases eachyear in the U.S.) It also led to violent objections from environmental groups, especiallyGreenpeace. On this basis dioxins constitute a small, (though not necessarily negligible),risk. Nevertheless, there is no significant epidemiological (or other) evidence of any actualadverse health effects attributable to dioxins, even among those with the highest exposures[Gough 1988].
The lack of positive evidence of human health effects should not be taken as evidenceof harmlessness, of course.
11. Concluding remarks: Data needs
Specifically, the kind of picture that policy-makers need, in order to make sensible andrational decisions, is the entire "life cycle" of a chemical pollutant, from its initial introductioninto the environment to its final breakdown into harmless components, or its permanentburial in regulated landfills or deep ocean sediments. This life cycle picture is morecomplicated than it might seem to be at first glance, since long-lived chemicals can movefrom one environmental "storage bin" to another, and again to yet another. The complexityof the system is illustrated by the box model shown in Figure 17 (adapted from Figure 16above).
Notice that, in order to quantify the picture, several environmental parameters are critical.These include the rate of uptake into the food chain (by various mechanisms), the rate ofvolatilization from soil or foliage, under various climatic conditions, the rate of depositionor "washout" from the atmosphere back to the land (or water) surface, the rate of conversionof the chemical into other forms (metabolites) in various environmental media, and so on.2°
How are these rate parameters to be determined in practice? Most of them cannot bemeasured directly. What can be measured directly is (mainly) the concentration of thechemical in air, water, or some other substrate. What we still need to know, however, arethe fluxes between the boxes, and their changes over time. If, and only if we know both the
R. U. & L W. Ayres Accounting for persistent cyclic organ-chlorines File CHLORPOPIV as printed on June 14, 1996 Page 22
concentrations and the fluxes we can determine the rate constants. Concentrations alone arenot sufficient.
Only with both types of data — concentrations of critical contaminants as a function oftime and fluxes (inputs to the system) as a function of time — will we have the basis for aquantitative model of the chemical's distribution and life cycle in the environment. Scientistscan take point measurements of pollutant concentrations from now to eternity. But withoutcorresponding data on input fluxes over time, such measurements are wasted effort. Life cyclemodels require both kinds of data.
Similarly, firms and governments can — and do — invest huge sums in toxicologicalmeasurements, as they have been doing. But without quantitative life cycle models, it isimpossible to assess exposure probabilities over time. What is the point of spending a fortuneto determine the relative risk of chronic exposure to a particular chemical if the exposureitself cannot be predicted. Lacking the ability to predict population exposures to toxicchemicals sensible regulatory policies cannot be formulated.
Without reliable quantitative models, prediction of population exposures — not tomention ecological consequences — is impossible. Lacking such information, risk analysisis also impossible. Without the ability to forecast, and to assess risk, policy-making will beirrational. It will continue to be dominated by ignorance, prejudice, political manipulation andhappenstance — which is largely the case, now. The chemical industry often complains thatthe public "does not understand". It spends a great deal of money to advertise its goodintentions and its "progress". But, so long as data essential to rational policy-making issuppressed, the public will continue to misunderstand (usually suspecting the worst) and muchof the policy that is made will be contrary to the best interests of industry, as well as thepublic.
The bottom line is that the corporate "secrecy veil" must be pierced, in the case ofhazardous materials such as the persistent organo-chlorines, in the larger public interest.Competitive factors are indeed worth taking into account, especially the protection ofproprietary technologies developed at great expense. But there is also a larger public interestin making good environmental and health policy. The two aspects need to be weighed jointly.It is no longer sufficient — or reasonable — to allow vital production/consumption data tobe suppressed at will on "competitive" grounds. The whole issue needs to be reconsidered.
Endnotes1. The selection of chemicals discussed in this paper was based on an international experts meeting on persistent
organic pollutants, entitled "Toward Global Action", co-sponsored by the governments of Canada and thePhilippines. The meeting was held June 4-5 1995, in Vancouver, Canada. Most of the technical material hereinwas originally assembled by the authors for that conference, where it was included in the background documentprepared for the attendees (but not attributed). We hereby acknowledge financial support from the InternationalDevelopment Research Center (IDRC) of Canada for that effort. The authors also drew somewhat upon earlierwork supported by the US National Oceanographic and Atmospheric Administration (NOAA), entitled "AnHistorical Reconstruction of Major Pollutant Levels in the Hudson-Raritan Basin: 1880-1980" (3 volumes). Thiswork was published as a NOAA Technical Memorandum NOS OMA 43, Oct. 1988 [Ayres et al 1988]. Inaddition to reviewers of our earlier work, we are extremely grateful for constructive comments and assistancefrom Dr. P. Feron, Executive Director, Euro Chlor, Prof. A. J. Lecloux Scientific Director, Euro Chlor, Mr. J.Y. Van Diest, Technical and Safety Coordinator, Euro Chlor, Dr. W. Siegel, Executive Director, InternationalSociety of Lindane Producers (CEIL), Dr. M. Denkler, Scientific Consulting Co. and Prof. Roger Papp, Directorof Safety and Environment and Technology Advisor, Elf-Atochem.
2. The proposed EU criterion for persistence is that a substance have a half life in the water of (> 60 days) or soilof or sediments (anaerobic) of >180 days. Atmospheric persistence is a characteristic of CFCs and othergreenhouse gases, but is not relevant, since the latter chemicals are not biologically active.
R. U. & L W. Ayres Accounting for persistent cyclic organ-chlorines File CHLORPOPJV as printed on June 14, 1996 Page 23
3. The accepted criteria for bioaccumulation are defined in three ways, viz, in terms of the Bioaccumulation Factor(BAF), the Bioconcentration Factor (BCF), or the octanol-water partition coefficient (known as log Kow). First,The BAF is defined as the ratio of steady-state concentrations of the substance in the organism as comparedto the medium. The BCF is a special case of the BAF where the organism obtains the substance only from themedium (usually water) and not from other organisms. If either BAF or BCF are greater than 5000, thesubstance is bioaccumulative. ( As an example, VCM is not regarded as bioaccumulative, despite its BAF valuesranging from 10 to 40. If this information is not available, but 5 < log Kow < 7, bioaccumulation can beregarded as likely (subject to verification), unless the molecular weight of the compound is greater than 600.In the latter case, or in the case of log Kow >7, the molecule is probably too large to pass through biologicalmembranes.
4. The currently accepted criterion for long range transport and deposition is that the atmospheric half life be inexcess of 5 days and vapor pressure is less than 1000 Pa, or there is monitoring evidence of deposition farfrom the source.
5. Paul Muller received the Nobel Prize in chemistry for his discovery.
6. Annual production, sales and export statistics for the U.S. were published between 1945 and 1982 by the USInternational Trade Commission (ITC). See also [USEPA 1975; cited in Ayres et al 1995, Table 3.3].
7. Sources cited in [Ayres et al 1995], chapter 3, p.3-4.
8. The last U.S. DDT plant, Montrose Chemical Co. of California, was closed in 1983 and shipped to Indonesiawhere it reopened under local ownership in Bogor. It has a known capacity of 7500 kMT/y, and employs 270persons.
9. Data provided courtesy of R. Aten, USAID mission, Jakarta. Taken from Annual Report of the IndonesianPesticide Association, 1989 and local interviews.
10. Ciba-Geigy, the discoverer, first producer and licensor, has never released its own production figures or thoseof licensees, and still declines to do so, despite the fact that production in its own plants ceased some 25 yearsago.
11. As a point of interest, Kenneth Mellanby estimated total world DDT production (to 1992) as 2 MMT. See[Mellanby 1992].
12. Data courtesy of Murray Feshbach, Georgetown University, cited in a report to the World Bank [Feshbach1994].
13. In a soils monitoring study in 1970 by the United States Environmental Protection Agency, a summary tableof chlorinated hydrocarbon residues in cropland soils at all sites shows that of 1,506 analyses in 35 stateslindane was detected at only 6 sites or 0.4% of sites tested and residues detected ranged from <0.01 to 0.15ppm, with an arithmetic mean of <0.01 [Tashiro et al 1980]. A similar study for 1971 appears to have foundno trace of lindane [Carey et al 1978].
14. We do not attempt to summarize toxicity data in this paper. Indeed, most of such data is not publicly available,but is retained in confidential industry reports accessible only to regulatory authorities. Summaries extracted byan international committee of experts are available through UNEP and WHO.
15. The Crosby figure is probably an educated guess. We agree that it is plausible. We also have an estimate of totalworldwide production of all chlorophenols for the year 1979, of 150,000 tonnes [Hutzinger & Blumich 1985].This may or may not be reasonable, but it is not based on authoritative data.
16. Somewhat suspiciously, a 1989 report for the International Joint Commission (IJC) by Eva Voldner ofEnvironment Canada and Lowell Smith of USEPA estimated PCBs still in service in the U.S. as 340 kMT(along with 20 kMT destroyed, 70 kMT exported, 140 kMT buried in landfills (of which 100 kMT waspotentially leaky), and 70 kMT circulating in the environment, with reference to the year 1982. We suspect thesedata originally came from the same source we have quoted [Versar 1976], and should refer to the year 1975.But the Versar figures were then cited in various subsequent EPA documents, which were (in turn) cited as the
R. U. & L W. Ayres Accounting for persistent cyclic organ-chlorines File CHLORPOPJV as printed on June 14, 1996 Page 24
original source. This practice is common, but deceptive.
17. The only significant chemical breakdown process identified so far occurs when PCBs are heated to 500-600°C.Unfortunately, at these temperatures some polychlorinated dibenzofurans (PCDFs) are formed. This occasionallyhappens in electrical fires, though the quantities affected are small.
18. Military use in Vietnam (mainly during 1964-1968) consumed 20 kMT of the herbicide (2-4-5—T) in "agentorange".
19. The method of extrapolation from animal tests at very high dose levels has been sharply challenged by a numberof scientists, including Bruce Ames, for whom the test protocol was named. see [Ames 1992] and referencestherein.
20. If transition rates are known, then "half-lives" can be determined, and conversely. The two types of parametersare effectively equivalent to each other.
R. U. & L W. Ayres Accounting for persistent cyclic organ-chlorines File CHLORPOPJV as printed on June 14, 1996 Page 25
References
[Ames 1992] Ames, Bruce N., Title missing, J. Assoc. Off Anal. Chem 75, 1992.
[Ayres & Ayres 1996] Ayres, Robert U. & Leslie W. Ayres, Industrial Ecology: Closing the MaterialsCycle, Edward Elgar, Aldershott, UK, 1996. [in press]
[Ayres et al 1988] Ayres, Robert U., Leslie W. Ayres, J. McCurley, M. Small, Joel A. Tarr & Rolande C.Widgery, An Historical Reconstruction of Major Pollutant Levels in the Hudson-Raritan Basin1800-1980, Technical Memorandum (NOS OMA 43), National Oceanic & Atmospheric Administration,Rockville MD, October 1988. [3 Vols]
[Ayres et al 1995] Ayres, Robert U., Leslie W. Ayres & Albert Hahn, Industrial Metabolism of SelectedToxic Organic Chemicals, Final Report (Contract 402302/94-4239), Center for the Management ofEnvironmental Resources of INSEAD, Fontainebleau, France, March 17, 1995. [prepared for theInternational Development Research Centre (IDRC), Ottawa, Canada]
[Bartelds et al 1985] Bartelds, H., J.W. Gielen & J. Brem, Title missing, VDI-Forschungsberichte 574, 1985:377-402.
[Biegel 1995] Biegel, W., Personal communication, 1995.
[Bletchly 1984] Bletchly, J.D.. "Polychlorinated Biphenyls: Production, Current Use & Possible Rates ofFuture Disposal in OECD Member Countries", in: Barros, M.C., H. Koenemann & R.Visser(eds),Proceedings of PCB Seminar, Scheveningen, September 28-30, 1983 :343-365, Ministry of PhysicalPlanning & Environment, Agriculture & Fisheries, OECD, The Hague, Netherlands, 1984.
[Boehnke et al 1989]
[Bowonder 1995] Bowonder, Personal communication, 1995.
[BUA 1985] Beratergremium fuer umweltrelevante Altstoffe der Gesellschaft Deutscher Chemiker,Pentachlorphenol, BUA-Stoffbericht (3), BUA, Frankfurt am Main, Germany, October 1985.
[Cardwell et al 1977] Cardwell, R.D., Payne, T.R. & Wilbur, D.J., Acute and Chronic Toxicity of Chlordaneto Fish and Invertebrates, (EPA-600/3-77-019), United States Environmental Protection Agency, 1977.
[Carey et al 1978] Carey, A.E., Gowen, J.A. & Wiersman, G.B., "Pesticide Application and Cropping Datesfrom 37 States 1971 National Soils Monitoring Program of Insecticides", Pesticide Monitoring Journal12(3), December 1978.
[Carson 1962] Carson, R., Silent Spring, Houghton Miflin Co., Boston, 1962.
[Choudry & Hutzinger 1983] Choudry, G.G. & Hutzinger, 0., Mechanistic Aspects of the ThermalFormation of Halogenated Organic Compounds Including Polychlorinated Dibenzo-p-dioxins, Gordon& Breach, New York, 1983.
[Clement et al 1983] Clement, R.E., A.C. Viau & F.W. Karasek, "Daily Variations in Composition ofExtractable Organic Compounds in Fly Ash from Municipal Waste Incinerators", Journal ofEnvironmental Analytic Chemistry, 1983.
[Cliath & Spencer 1972] Cliath, M.M. & Spencer, W.F., "Dissipation of Pesticides from Soils byVolatilization of Degradation Products", Environmental Science & Technology 6(10), October 1972:910.
R. U. & L W. Ayres Accounting for persistent cyclic organ-chlorines File CHLORPORIV as printed on June 14, 1996 Page 26
[Colbom et al 1993] Colbom, Theo, Frederick S. von Saal & Ana M. Soto, "Developmental Effects ofEndocrine-Disrupting Chemicals in Wildlife & Humans", Environmental Health Perspectives 101(5),October 1993 :378-384.
[Crosby 1981] Crosby, D.G. (ed), "Environmental Chemistry of Pentachlorophenol: A Special Report onPCP in the Env", Pure & Applied Chemistry 53(5), 1981 :1052-1080.
[Denlder 1996] Denlder, Mechthild, Comments on the Inclusion of Lindane on the List of 'Persistent OrganicPollutants', SCC Project (105-006), SCC Scientific Consulting Company, Woellstein, Germany,February 21, 1996. [Prepared for C.I.E.L., Brussels]
[Dickson et al 1992] Dickson, L.C., Lenoir, D. & 0. Hutzinger, "Quantitative Comparison of de Novo &Precursor Formation of Polychlorinated Dibe", Environmental Science & Technology 26, 1992:1822-1828.
[Dickson & Karasek 1987] Dickson, L.C. & F.W. Karasek, Title missing, Journal of Chromatography 389,1987 :127-137.
[DiDomenico et al January] DiDomenico et al. Accidental Release of 2,3,7,8-TCDD at Seveso; Part V;Environmental Persistence (Half-Life) in Soil, Institute Superiore diSanta, Rome, 1980 January.
[Dunlap 1981] Dunlap, T.R., DDT: Scientists, Citizens and Public Policy, Princeton University Press,Princeton NJ, 1981.
[Edwards 1966] Edwards, CA., "Insecticide Residues in Soils", Residue Review 13, 1966 :83-132.
[Eurochlor 1995] Euro Chlor, Persistent Organic Pollutants & Persistent Toxic & Bioacculative ExistingSubstances, Definition Paper, Euro Chlor, Brussels, October 1995.
[Feshbach 1994] Feshbach, Murray. Medical Situation in the Former USSR: Priority Regions & Cities,Report to the World Bank, Washington DC, 1994.
[FondsChem 1992] Fonds der Chemischen Industrie, Die Chemie des Chlors & seiner Verbindungen,Folienserie des Fonds der Chemischen Industrie (24), Fonds der Chemischen Industrie, Frankfort amMain, Germany, 1992.
[Goebel et al 1982] Goebel, H. et al, "Properties, Effects, Residues & Analytics of the InsecticideEndosulfan", Residue Review 83, 1982 :6-7.
[Gough 1988] Gough, Michael, "The Most Potent Carcinogen?", Resources(92), Summer 1988 :2-5. [ISSN0048-7376]
[Graham 1970] Graham, F. Jr., Since Silent Spring, Houghton Miflin Co., Boston, 1970.
[Gribble 1994] Gribble, Gordon W., "The NAtural Production of Chlorinated Compounds", EnvironmentalScience & Technology 26(7), 1994 :310a-319a.
[Heinisch et al 1993] Heinisch, Emanuel, Antonius Kettrup & Sabine Wenzel-Klein,"DDT/Lindan-Masseneinsaetze in der DDR: Oekochemish-Oekotoxikologische Folgen",Umweltwissenschften & Schadstoff-Forschung 5(5), October 1993 :277-280.
[Honea & Parsons 1977] Honea, F.I. & Parsons, T., Industrial Process Profiles for Environmental Use:(Chapter 8) Pesticides Industry, (EPA-600/2-77 023h), Radian Corporation, January 1977.
[Hutzinger & Blumich 1985] Hutzinger, 0. & M.J. Blumich, "Sources & Fate of PCDDs & PCDFs: AnOverview", Chemosphere 14(6/7), 1985 :581-600.
R. U. & L W. Ayres Accounting for persistent cyclic organ-chlorines File CHLORPONV as printed on June 14, 1996 Page 27
[Hutzinger & Fiedler 1988] Hutzinger, 0. & H. Fiedler, 111LE MISSING, Report (172), NATO Committeeon the Challenges of Modem Society, Brussels, 1988.
[Imhoff & Fair 1980] Imhoff, K. & Fair, G.M., Sewage Treatment, John Wiley & Sons, New York, 1980.2nd edition.
[Kaley 1995]
[Kearny et al 1973] Kearny, P.C. et al, "Tetrachlorodibenzodioxin in the Environment: Sources, Fate &Decontamination", Environmental Health Perspectives 5, 1973 :273 -277.
[Lohse et al 1989]
[Lowenheim & Moran 1975] Lowenheim, Frederick A. & Marguerite K. Moran, Faith, Keyes, & Clark's"Industrial Chemicals", Wiley-Interscience, New York, 1975. 4th edition.
[Lustenhouwer et al 1980] Lustenhouwer, J.W.A., K. Olie & 0. Hutzinger, "Chlorinated Dibenzo-p-dioxins& Related Compounds in Incinerator Effluents", Chemosphere 9, 1980 :501-522.
[Matsumara 1975] Matsumara, F., Toxicology of Insecticides, Plenum Press, New York, 1975.
[Mellanby 1992] Mellanby, Kenneth, The DDT Story, The Britsh Crop Protection Council, Famham, Surrey,UK, 1992.
[Muller & Buser 1986] Muller, M.D. & Buser, H.-R., Title missing, Enviromental Science & Technology 20,1986 :1151-1157.
[NRC 1980] National Academy of Sciences/National Research Council, Bichlorinated BOhenyls, NationalAcademy Press, Washington DC, 1980.
[OECD 1984] Barros, M.C., H. Koenemann & R.Visser (eds), Proceedings of Proceedings of PCB Seminar[Ministry of Physical Planning & Environment, Agriculture & Fisheries] , OECD, The Hague,Netherlands, 1984.
[Olie et al 1982] Olie, K., Lustenhouwer, J.W.A. & 0. Hutzinger. "Polychlorinated Dibenzo-p-dioxins &Related Compounds in Incinerator Effluents", in: Hutzinger, 0. et al(eds), Chlorinated Dixoins &Related Compounds - Impact on the Environment :227-244, Pergamon Press, Oxford UK, 1982.
[PAN 1990] Pesticide Action Network. Dirty Dozen Fact Sheets, Pesticide Action Network International,Washington DC, 1990.
[Parlar 1995]Parlar, H., Data Tables, Technische Universita, Munich, Germany, 1995.
[Sittig 1980] Sittig, Marshall (ed), Pesticides Manufacturing & Toxic Materials Control Encyclopaedia,Noyes Data Corporation, Park Ridge NJ, 1980.
[Spencer 1967] Spencer, Donald A., "Problems in Monitoring DDT and its Metabolites in the Environment",Pesticide Monitoring Journal 1(2), September 1967.
[Stieglitz et al 1989] Stieglitz, L., G. Zwick, J. Beck, H. Bautz & W. Roth, Title missing, Chemosphere 18,1989 :1219-1226.
[Stieglitz et al-a 1989] Stieglitz, L, G. Zwick, J. Beck, H. Bautz & W. Roth, Title missing, Chemosphere19, 1989 :283-290.
[Stieglitz et al 1990] Stieglitz, L., G. Zwick, J. Beck, H. Bautz & W. Roth, Title missing, Chemosphere 20,1990 :1953-1958.
R. U. & L W. Ayres Accounting for persistent cyclic organo-chlorines File CHLORPOPIV as printed on June 14, 1996 Page 28
[Tashiro et al 1980] Tashiro, H., Bourke, J.B. & Gibbs, S.D., "Residual Activity of Dieldrin and Chlordanein Soil of Established Turf in Japanese Beetle Grub Control", Journal of Economic Entomology 74(4),August 1980.
[USCongress 1978] United States Congress, House of Representatives Subcommittee on Commerce &Monetary Affairs, Report on Products Banned by U.S. Regulatory Agencies, United States GovernmentPrinting Office, Washington DC, 1978.
[USEPA 1971] United States Environmental Protection Agency, Atmospheric Emissions from Chlor-AlkaliProduction, Report (AP-80), United States Environmental Protection Agency, Washington DC, 1971.
[USEPA 1975] Environmental Protection Agency, "DDT: A Review of the Scientific and Economic Aspectsof the Decision to Ban its Use", EPA-540/1-75-022, 1975
[USEPA 1976] United States Environmental Protection Agency, Environmental Contamination fromHexachlorobenzene, (EPA-560/6-76-014 (PB 251 874)), July 1976.
[USEPA 1977] United States Environmental Protection Agency, Economic Analyses of Pesticide DisposalMethods, (EPA-540/9-77-018), United States Environmental Protection Agency, 1977.
[USEPA 1979] United States Environmental Protection Agency, "Final Determination ConcerningRebuttable Presumption Against Registration for Certain Uses of Pesticide Products Containing 2,4,5-T& Silvex: Notice of Intent to Hold a Hearing", Federal Register 44(241), December 1979:72316-72340.
[USITC 1991] United States International Trade Commission, Synthetic Organic Chemicals 1991, UnitedStates Government Printing Office, Washington DC, 1991.
[USITC annual] United States International Trade Commission, Synthetic Organic Chemicals (annual),United States Government Printing Office, Washington DC, annual.
[Versar 1976] Versar Inc., PCBs in the United States Industrial Use and Environmental Distribution(EPA-56016-76-005 (PB 252 012)), US Government Printing Office, Washington DC, 1976.
[Wagner 1983] Wagner, Sheldon L., Chemical Toxicology of Agricultural Chemicals, Noyes DataCorporation, Park Ridge NJ, 1983.
[Yule et al 1967] Yule, W.N., Chiga, M. & Morley, H.V., "Fate of Insecticide Residues Decomposition ofLindane in Soil", Journal of Agricultural & Food Chemistry 15, April 1967 :1000-1006.
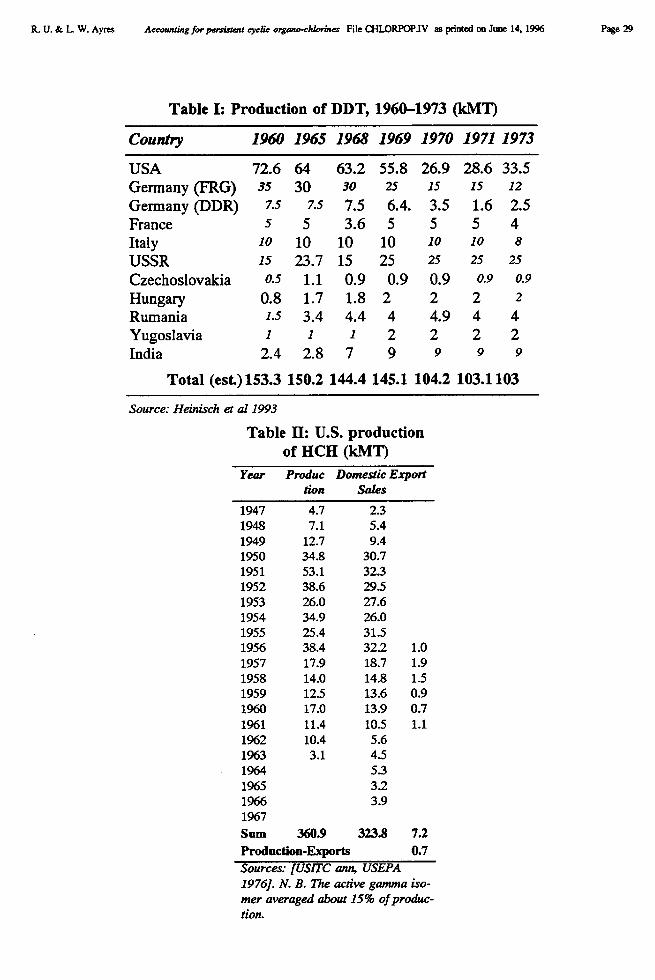
R. U. & L W. Ayres Accounting for persistent cyclic organ-chlorines File CHLORPOPIV as printed on June 14, 1996 Page 29
Table I: Production of DDT, 1960-1973 (kMT)
Country 1960 1965 1968 1969 1970 1971 1973
7.5 7.5 7.5 6.4. 3.5 1.6 2.55 5 3.6 5 5 5 4
10 10 10 10 10 10 815 23.7 15 25 25 25 25
0.5 1.1 0.9 0.9 0.9 0.9 0.9
0.8 1.7 1.8 2 2 2 21.5 3.4 4.4 4 4.9 4 41 1 1 2 2 2 2
2.4 2.8 7 9 9 9 9
Total (est.)153.3 150.2 144.4 145.1 104.2 103.1103
USA 72.6 64 63.2 55.8 26.9 28.6 33.5Germany (FRG) 35 30 30 25 15 15 12
Germany (DDR)FranceItalyUSSRCzechoslovakiaHungaryRumaniaYugoslaviaIndia
Source: Heinisch et al 1993
Table H: U.S. productionof HCH (kMT)
Year Produc Domestic Exportdon Sales
1947 4.7 2.31948 7.1 5.41949 12.7 9.41950 34.8 30.71951 53.1 32.31952 38.6 29.51953 26.0 27.61954 34.9 26.01955 25.4 31.51956 38.4 32.2 1.01957 17.9 18.7 1.91958 14.0 14.8 1.51959 12.5 13.6 0.91960 17.0 13.9 0.71961 11.4 10.5 1.11962 10.4 5.61963 3.1 4.51964 5.31965 3.21966 3.91967Sum 360.9 323.8 7.2
Production-Exports 0.7
Sources: [USITC ann, USEPA1976]. N. B. The active gamma iso-mer averaged about 15% of produc-tion.
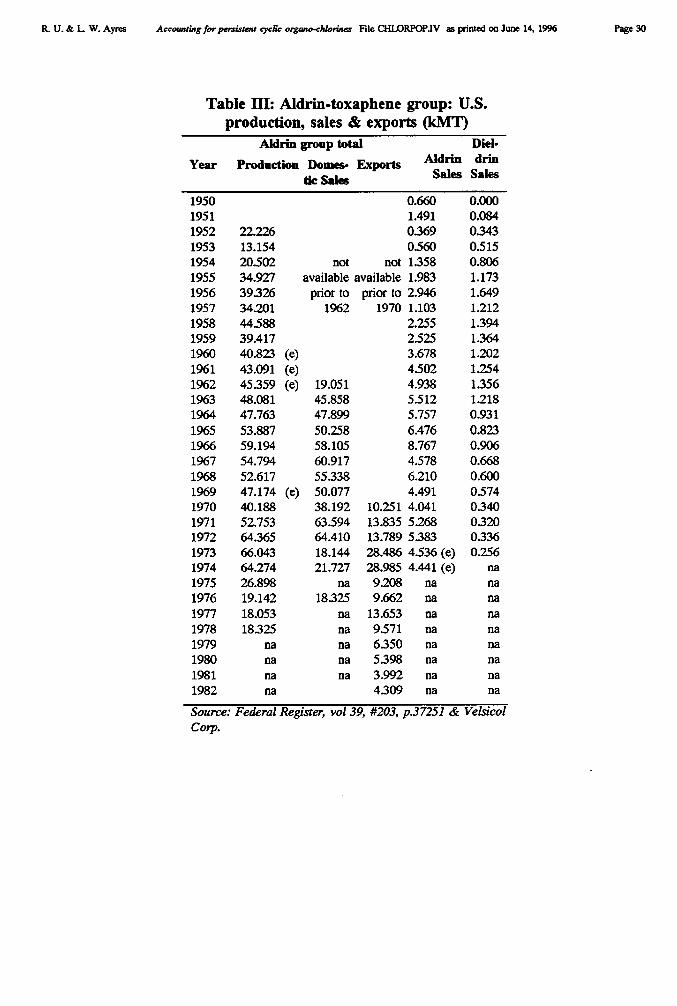
R. U. & L W. Ayres Accounting for persistent cyclic organ-chlorines File CHLORPOPJV as printed on June 14, 1996 Page 30
Table III: Aldrin-toxaphene group: U.S.production, sales & exports (kMT)
Aldrin group total
Diel-
Year Production Domes- Exports Aldrin drinSales Salestic Sales
19501951
0.6601.491
0.0000.084
1952 22.226 0.369 0.3431953 13.154 0.560 0.5151954 20.502 not not 1.358 0.8061955 34.927 available available 1.983 1.1731956 39.326 prior to prior to 2.946 1.6491957 34.201 1962 1970 1.103 1.2121958 44.588 2.255 1.3941959 39.417 2.525 1.3641960 40.823 (e) 3.678 1.2021961 43.091 (e) 4.502 1.2541962 45.359 (e) 19.051 4.938 1.3561963 48.081 45.858 5.512 1.2181964 47.763 47.899 5.757 0.9311965 53.887 50.258 6.476 0.8231966 59.194 58.105 8.767 0.9061967 54.794 60.917 4.578 0.6681968 52.617 55.338 6.210 0.6001969 47.174 (e) 50.077 4.491 0.5741970 40.188 38.192 10.251 4.041 0.3401971 52.753 63.594 13.835 5.268 0.3201972 64.365 64.410 13.789 5.383 0.3361973 66.043 18.144 28.486 4536 (e) 0.2561974 64.274 21.727 28.985 4.441 (e) na1975 26.898 na 9.208 na na1976 19.142 18.325 9.662 na na1977 18.053 na 13.653 na na1978 18.325 na 9571 na na1979 na na 6.350 na na1980 na na 5.398 na na1981 na na 3.992 na na1982 na 4.309 na na
Source: Federal Register, vol 39, #203, p.37251 & VelsicolCorp.
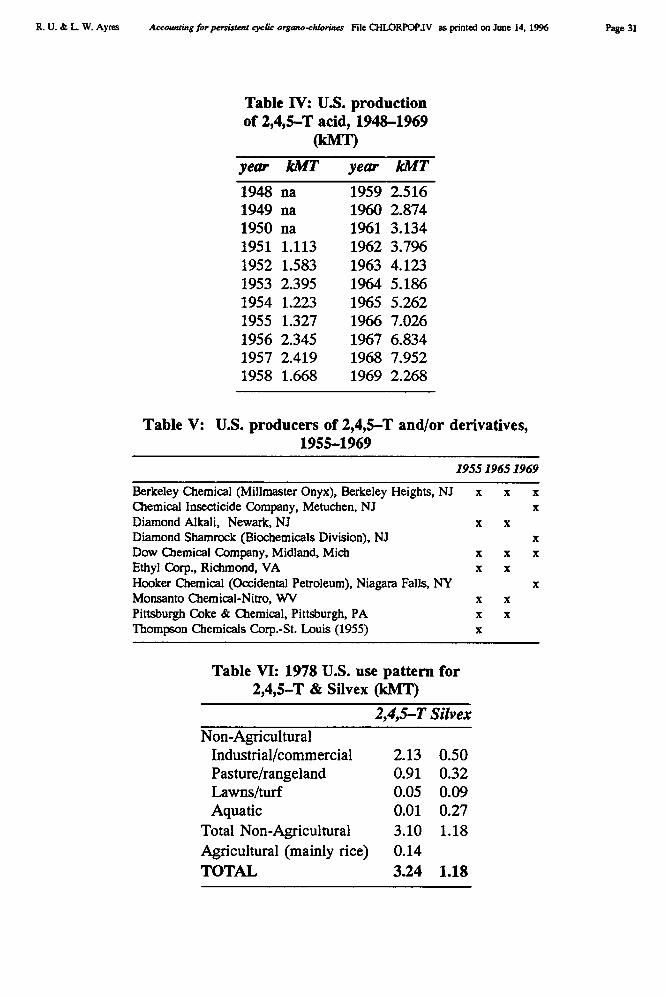
R. U. & L W. Ayres Accounting for persistent cyclic organ-chlorines File CHLORPOP.IV as printed on June 14, 1996 Page 31
Table IV: U.S. productionof 2,4,5–T acid, 1948-1969
(kW)year kMT year kMT
1948 na 1959 2.5161949 na 1960 2.8741950 na 1961 3.1341951 1.113 1962 3.7961952 1.583 1963 4.1231953 2.395 1964 5.1861954 1.223 1965 5.2621955 1.327 1966 7.0261956 2.345 1967 6.8341957 2.419 1968 7.9521958 1.668 1969 2.268
Table V: U.S. producers of 2,4,5–T and/or derivatives,1955-1969
1955 1965 1969
Berkeley Chemical (Millmaster Onyx), Berkeley Heights, NJ x x xChemical Insecticide Company, Metuchen, NJ xDiamond Alkali, Newark, NJ x xDiamond Shamrock (Biochemicals Division), NJ xDow Chemical Company, Midland, Mich x x xEthyl Corp., Richmond, VA x xHooker Chemical (Occidental Petroleum), Niagara Falls, NY xMonsanto Chemical-Nitro, WV x xPittsburgh Coke & Chemical, Pittsburgh, PA x xThompson Chemicals Corp.-St. Louis (1955) x
Table VI: 1978 U.S. use pattern for2,4,5–T & Silvex (kMT)
2,4,5–T Silvex
Non-AgriculturalIndustrial/commercial 2.13 0.50Pasture/rangeland 0.91 0.32Lawns/turf 0.05 0.09Aquatic 0.01 0.27
Total Non-Agricultural 3.10 1.18Agricultural (mainly rice) 0.14TOTAL 3.24 1.18
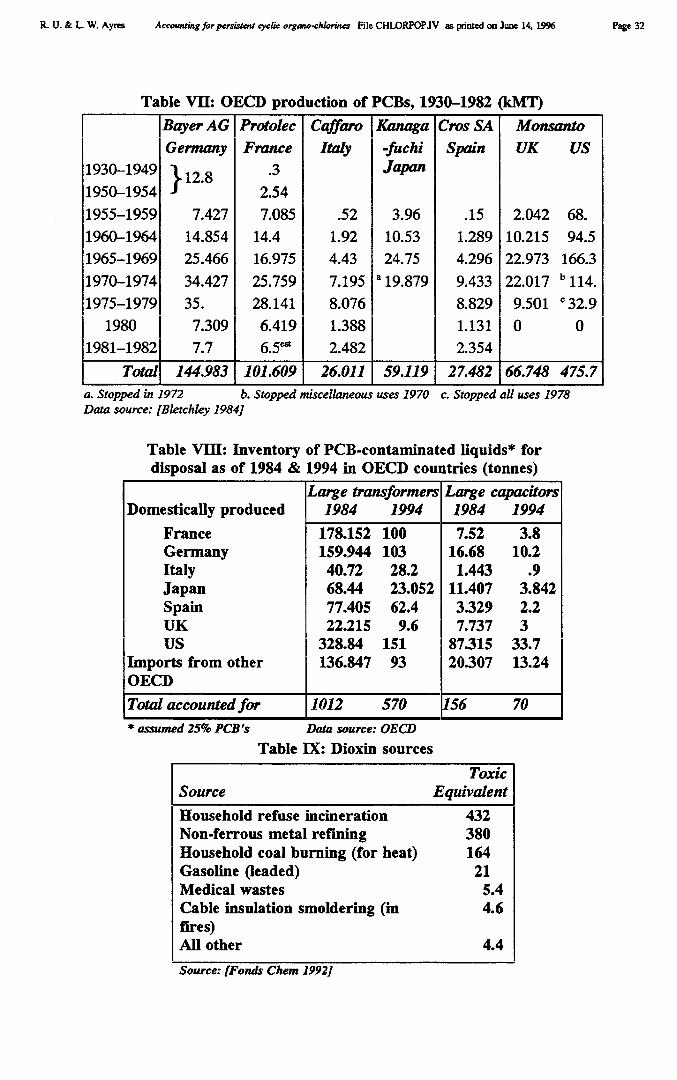
R. U. & L W. Ayres Accounting for persistent cyclic organ-chlorines File CHLORPOPJV as printed on June 14, 1996 Page 32
Table VII: OECD production of PCBs, 1930-1982 (kMT)!Bayer AG1ProtolecGermany France
I CaffaroItaly
IKanaga-fuchi
Cros SASpain
I MonsantoUK US
1930-1949 112.8 .3 JaPan1950-1954 2.541955-1959 7.427 7.085 .52 3.96 .15 2.042 68.1960-1964 14.854 14.4 1.92 10.53 1.289 10.215 94.51965-1969 25.466 16.975 4.43 24.75 4.296 22.973 166.31970-1974 34.427 25.759 7.195 a 19.879 9.433 22.017 b 114.1975-1979 35. 28.141 8.076 8.829 9.501 ' 32.9
1980 7.309 6.419 1.388 1.131 0 01981-1982 7.7 6.5" 2.482 2.354
Total 144.983 101.609 26.011 59.119 27.482 66.748 475.7a. Stopped in 1972 b. Stopped miscellaneous uses 1970 c. Stopped all uses 1978Data source: [Bletchley 1984)
Table VIII: Inventory of PCB-contaminated liquids* fordisposal as of 1984 & 1994 in OECD countries (tonnes)
Large transformers Large capacitorsDomestically produced 1984 1994 1984 1994
France 178.152 100 7.52 3.8Germany 159.944 103 16.68 10.2Italy 40.72 28.2 1.443 .9Japan 68.44 23.052 11.407 3.842Spain 77.405 62.4 3329 2.2UK 22.215 9.6 7.737 3US 328.84 151 87315 33.7
Imports from other 136.847 93 20307 13.24OECDTotal accounted for 1012 570 156 70* assumed 25% PCB's Data source: OECD
Table IX: Dioxin sources
SourceToxic
EquivalentHousehold refuse incineration 432Non-ferrous metal refining 380Household coal burning (for heat) 164Gasoline (leaded) 21Medical wastes 5.4Cable insulation smoldering (infires)
4.6
All other 4.4
Source: [Fonds Chem 19921
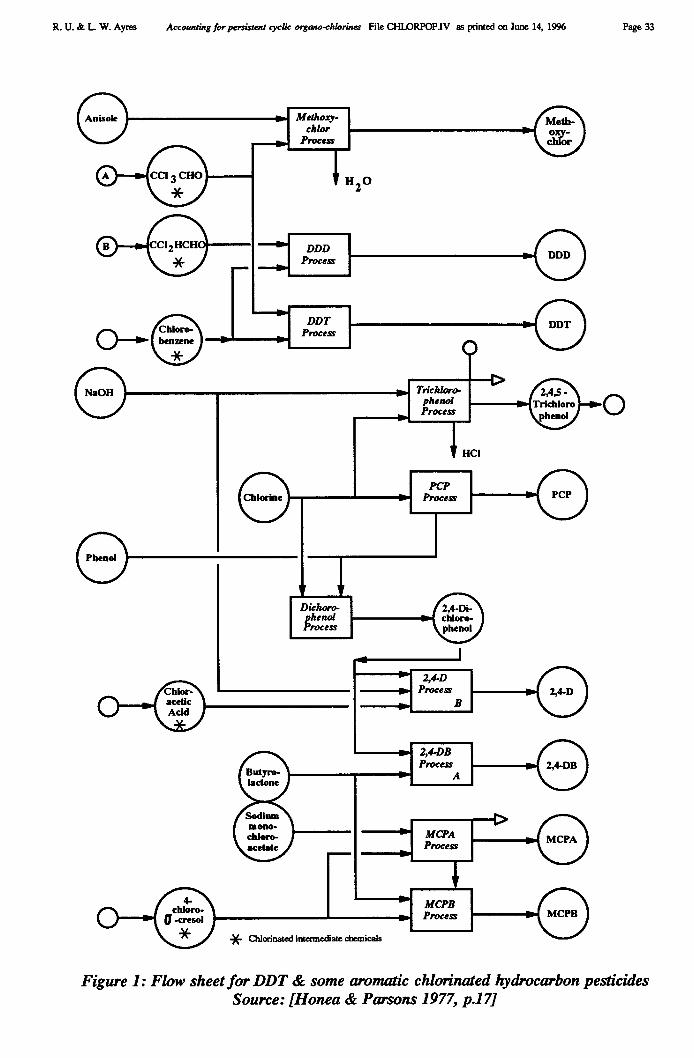
_401Methoxy-
Processehlor
Dichoro-phenolProcess
R. U. & L W. Ayres Accounting for persistent cyclic orgarto-chlorines File CHLORPOP.IV as printed on June 14, 1996 Page 33
Figure 1: Flow sheet for DDT & some aromatic chlorinated hydrocarbon pesticidesSource: [Honea & Parsons 1977, p.17]
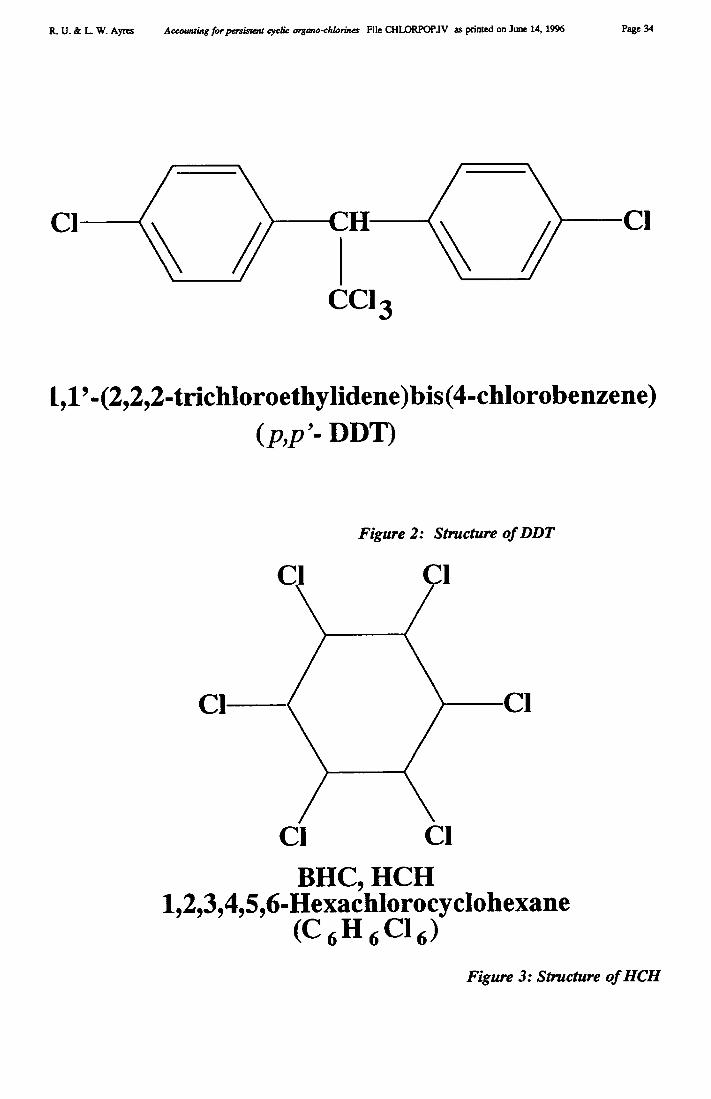
R. U. & L W. Ayres Accounting for persistent cyclic organ-chlorines File CHLORPOPIV as printed on June 14, 1996 Page 34
CI Cl
CC13
1,1'-(2,2,2-trichloroethylidene)bis(4-chlorobenzene)(p,p'- DDT)
Figure 2: Structure of DDT
Cl CI
CI Cl
BHC, HCH1,2,3,4,5,6-Hexachlorocyclohexane
(C6H6C16)
Figure 3: Structure of HCH
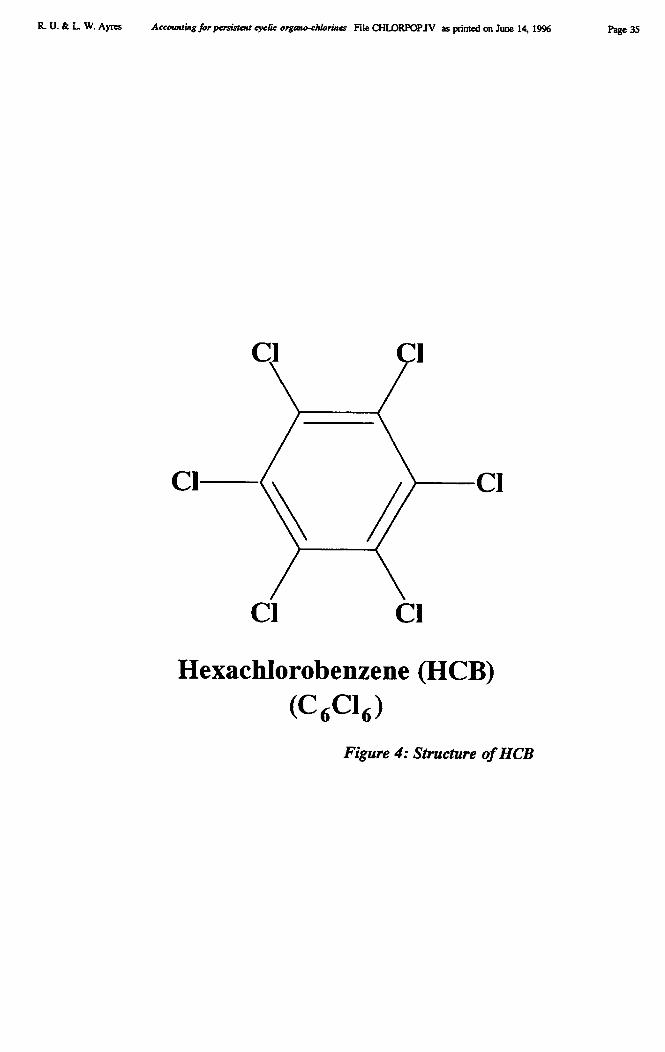
R. U. & L W. Ayres Accounting for persistent cyclic organ-chlorines File CHLORPOP1V as printed on June 14, 1996 Page 35
CI Cl
Cl Cl
Hexachlorobenzene (HCB)(C6C16)
Figure 4: Structure of HCB
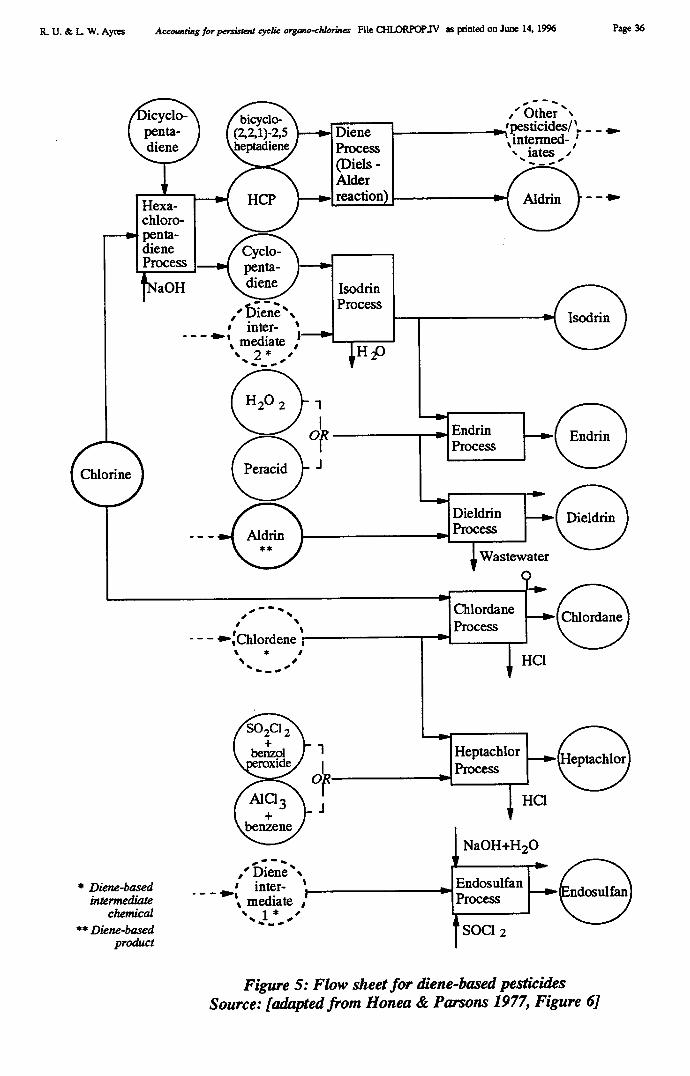
-E1Chlordane
rocessP
/6i-cycic:penta- 1diene
Hexa-chloro---ei penta-dieneProcess
fNaOH
CyclO:penta-diene, - •l' Diene `•
• inter-- - - AN.,, mediate ,• 2* ••
EndrinProcess
DieldrinProcess
Wastewater
• ow =1, %• •• •t •
- - - 0-,Chlordene I• * •• •• •• _ .. HC1
Accounting for persistent cyclic organ-chlorines File CHLORPOPJV as printed on June 14, 1996 Page 36R. U. & L W. Ayres
HeptachlorProcess
Ha
NaOH+H20• • - •,' Dienes
* Diene-based I inter- • Endosulfan
intermediate % mediate ) Process- - - 41.3
chemical • , 1 * , •** Diene-based
... SOC1 2
4. ...
product
Figure 5: Flow sheet for diene-based pesticidesSource: [adapted from Honea & Parsons 1977, Figure 61
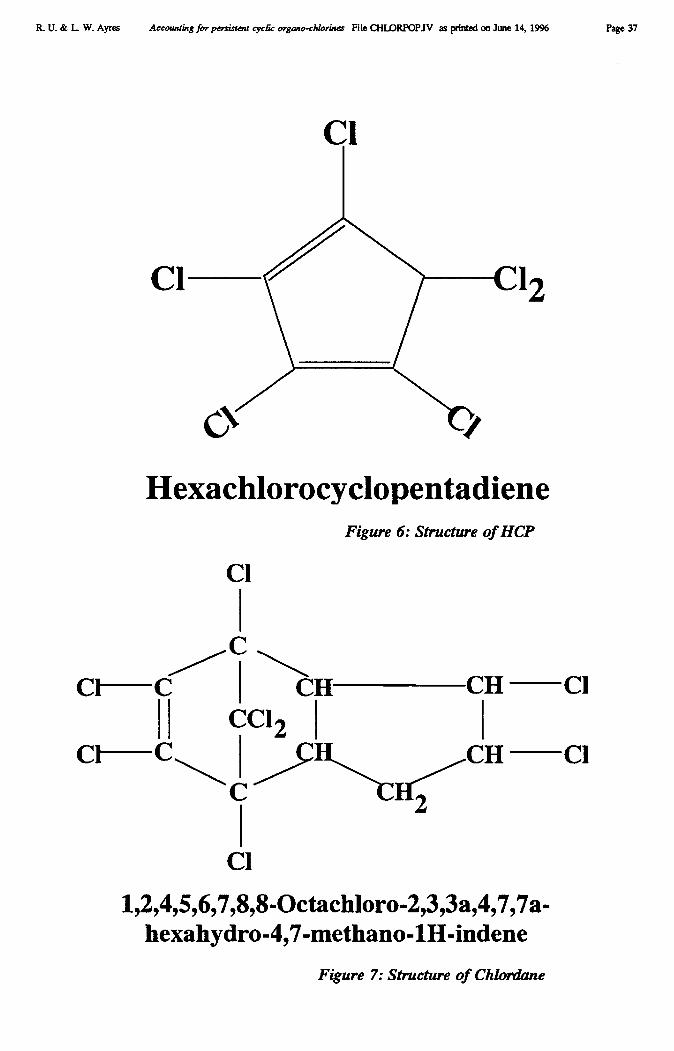
R. U. & L W. Ayres Accounting for persistent cyclic organ-chlorines File CHLORPOPIV as printed on June 14, 1996 Page 37
Cl
Cl
HexachlorocyclopentadieneFigure 6: Structure of HCP
Cl
CCI-C CH CH Cl
CC12CI-C 1 11FiCH Cl
C 2
Cl1,2,4,5,6,7,8,8-Octachloro-2,3,3a,4,7,7a-
hexahydro-4,7-methano-1H-indeneFigure 7: Structure of Chlordane
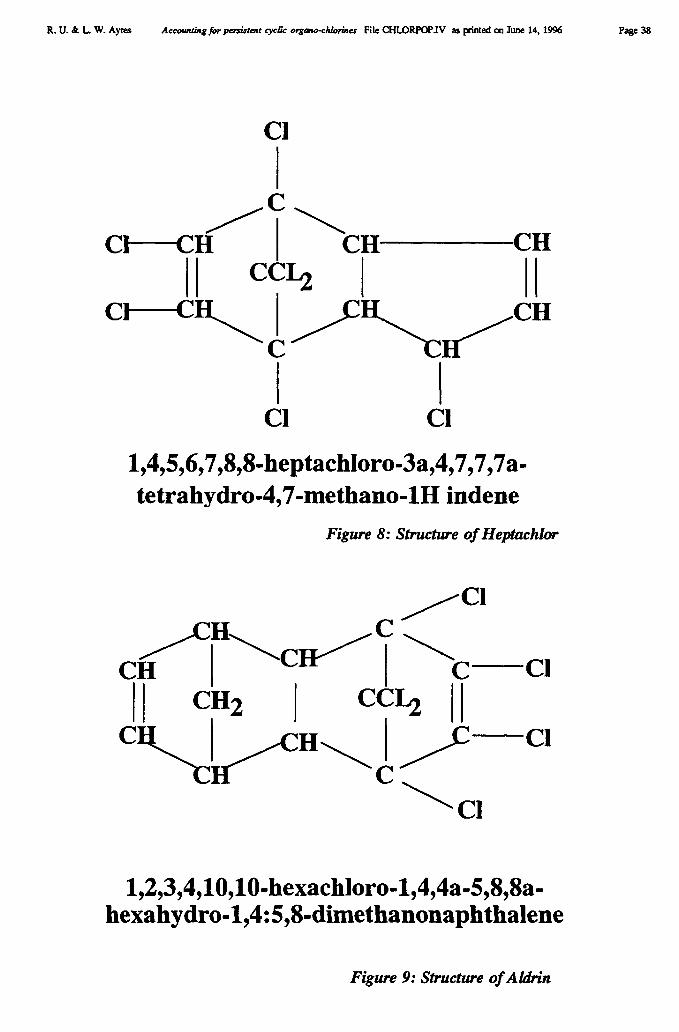
R. U. & L W. Ayres Accounting for persistent cyclic organ-chlorines File CHLORPOPIV as printed on June 14, 1996 Page 38
Cl
111C1-CH CHH
Cl Cl
1,4,5,6,7,8,8-heptachloro-3a,4,7,7,7a-tetrahydro-4,7-methano-1H indene
Figure 8: Structure of Heptachlor
C
CH IH CH2 CCL2 H
1,2,3,4,10,10-hexachloro-1,4,4a-5,8,8a-hexahydro-1,4:5,8-dimethanonaphthalene
Cl
Cl
Figure 9: Structure of Aldrin
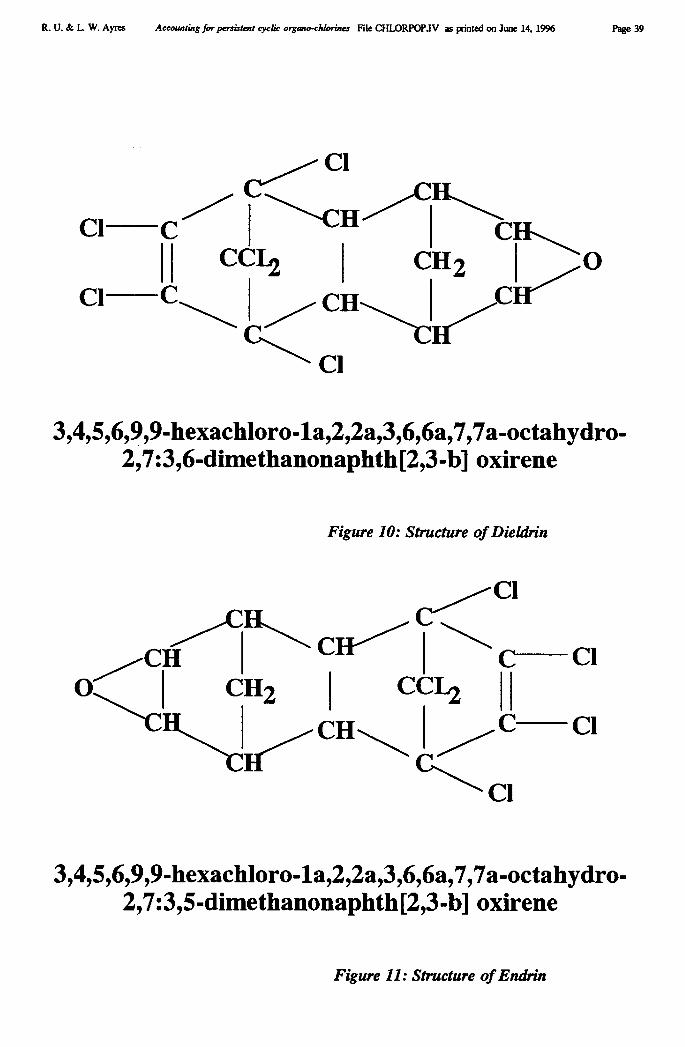
R. U. & L W. Ayres Accounting for persistent cyclic organo-chlorines File CHLORPOPJV as printed on June 14, 1996 Page 39
1
.CH IIIC CHII CCL21 CH2 1 0C CH
C1
3,4,5,6,9,9-hexachloro-la,2,2a,3,6,6a,7,7a-octahydro-2,7:3,6-dimethanonaphth[2,3-b] oxirene
Figure 10: Structure of Dieldrin
c,C1
CH
/C11 CII c_____ ClC/ 1 CH2 1 CC1 L20
C ClIICII
C1
CH
3,4,5,6,9,9-hexachloro-la,2,2a,3,6,6a,7,7a-octahydro-2,7:3,5-dimethanonaphth[2,3-b] oxirene
Cl
Cl
Figure 11: Structure of Endrin
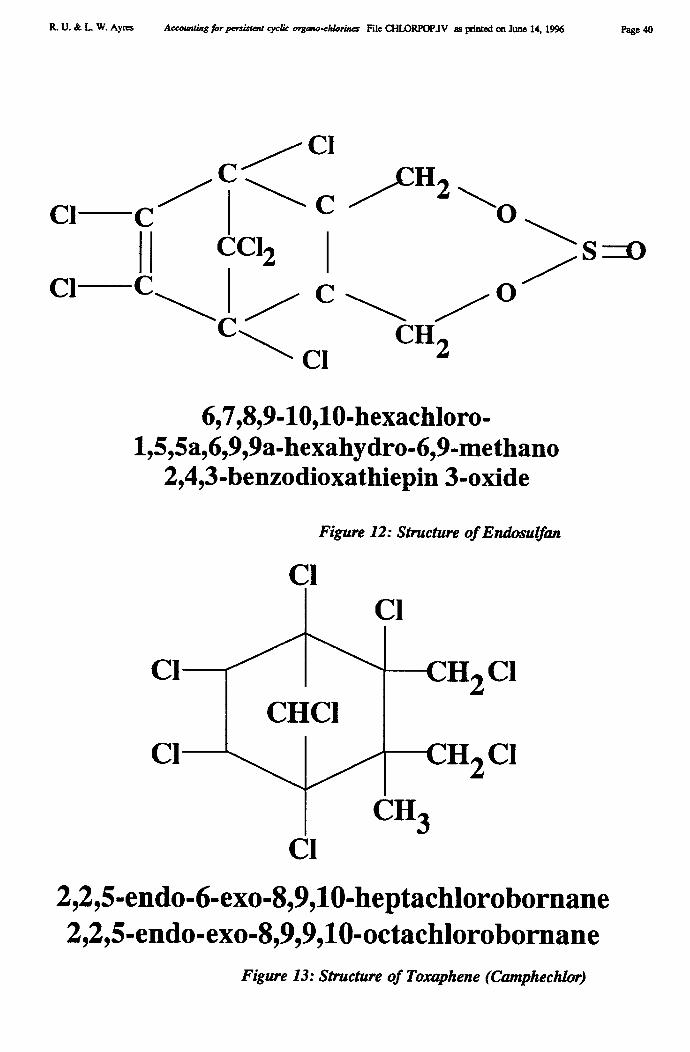
Cl
Cl
Cl C Cl
R. U. & L W. Ayres Accounting for persistent cyclic organo-chlorines File CHLORPORIV as printed on June 14, 1996 Page 40
citi2c r
ca2 c•s cci
CH2
6,7,8,9-10,10-hexachloro-1,5,5a,6,9,9a-hexahydro-6,9-methano
2,4,3-benzodioxathiepin 3-oxide
Figure 12: Structure of Endosulfan
Cl
CH2 Cl
H2 Cl
Cil3Cl
2,2,5-endo-6-exo-8,9,10-heptachlorobornane2,2,5-endo-exo-8,9,9,10-octachlorobornane
Figure 13: Structure of Toxaphene (Camphechlor)
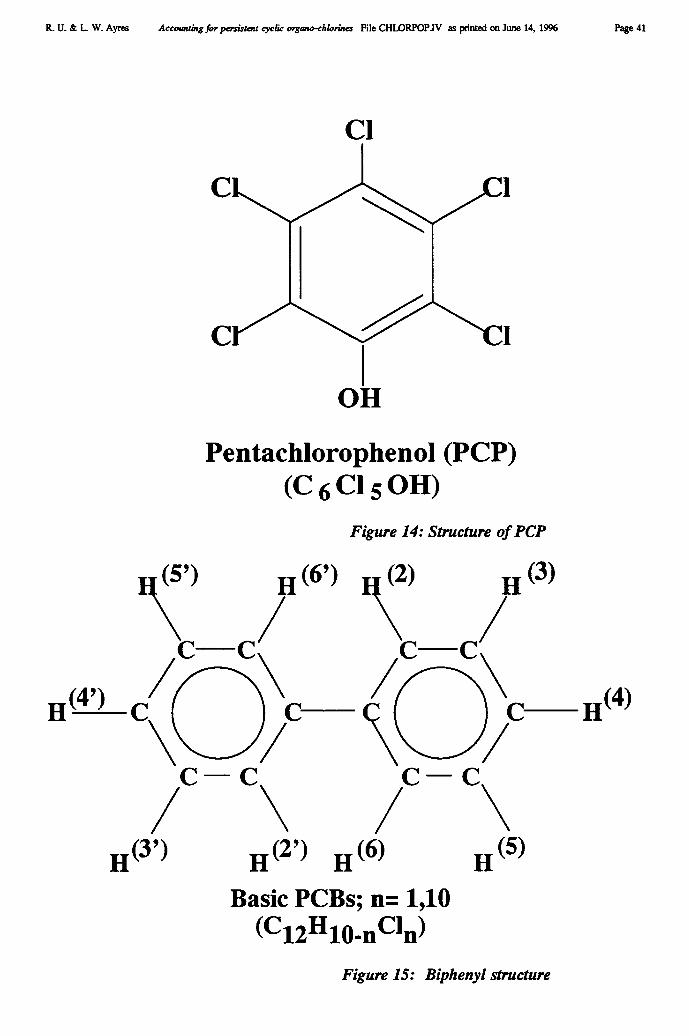
R. U. & L W. Ayres Accounting for persistent cyclic organ-chlorines File CHLORPOPIV as printed on June 14, 1996 Page 41
CI
Pentachlorophenol (PCP)(C 6 CI 5 OH)
Figure 14: Structure of PCP
1 ') H (6') (2)
C C C C
H(4') C C H (4)
C\
C C C
\ / \H (2') H (6) H (5)
Basic PCBs; n= 1,10(C121110-nan)
Figure 15: Biphenyl structure
H (3)
/
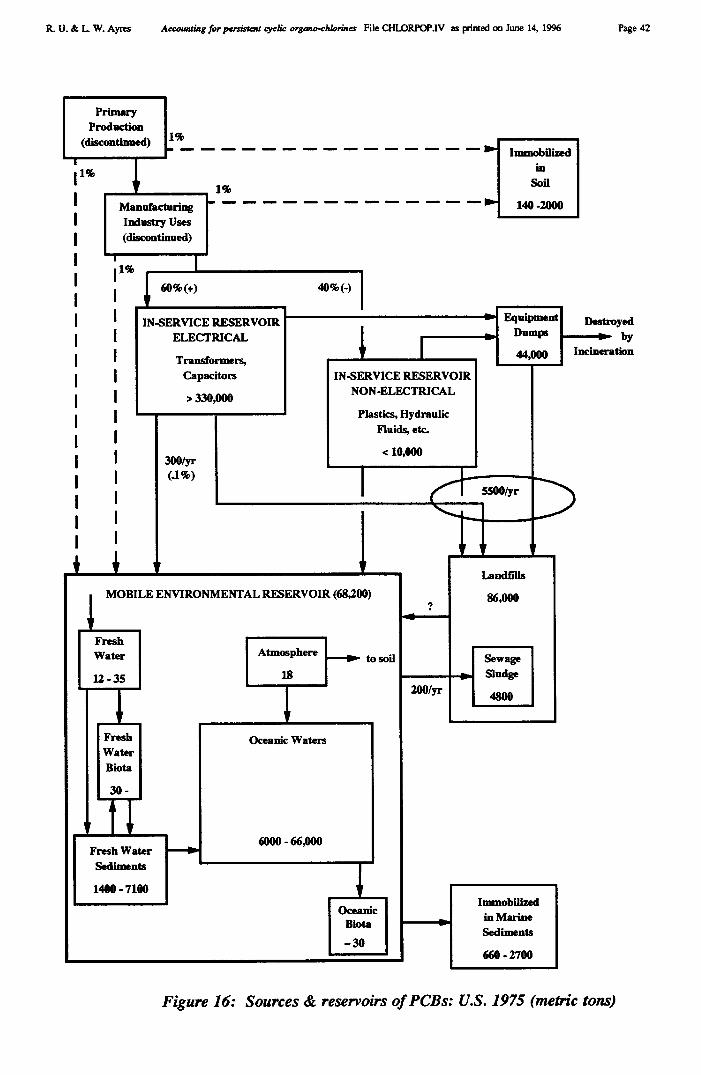
ManufacturingIndustry Uses(discontinued)
R. U. & L W. Ayres Accounting for persistent cyclic organ-chlorines File CHLORPOPIV as printed on June 14, 1996 Page 42
1%
PrimaryProduction
(discontinued)
1%
Immobilizedin
Soil
140 -2000
11%
I60% (+) 40%(-)
I IN-SERVICE RESERVOIR Equipment Deswtroyed.--.Ø. Dumps byI ELECTRICAL
I Transformers,Incineration44,000
I Capacitors IN-SERVICE RESERVOIR
I > 330,000 NON-ELECTRICAL
I Plastics, Hydraulic
IFluids, etc.
I 300/yr< 10,000
(.1%)5500/yr
Landfills
86,000MOBILE ENVIRONMENTAL RESERVOIR (68,200)
FreshWater Atmosphere to it Sewage
12 - 35 18 Sludge200/yr 4800
Fresh Oceanic WatersWaterBiota
30-
OceanicBiota- 30
+ Fresh Water
Sediments
1400 - 7100
6000 - 66,000
Immobilizedin MarineSediments
660 - 2700
Figure 16: Sources & reservoirs of PCBs: U.S. 1975 (metric tons)
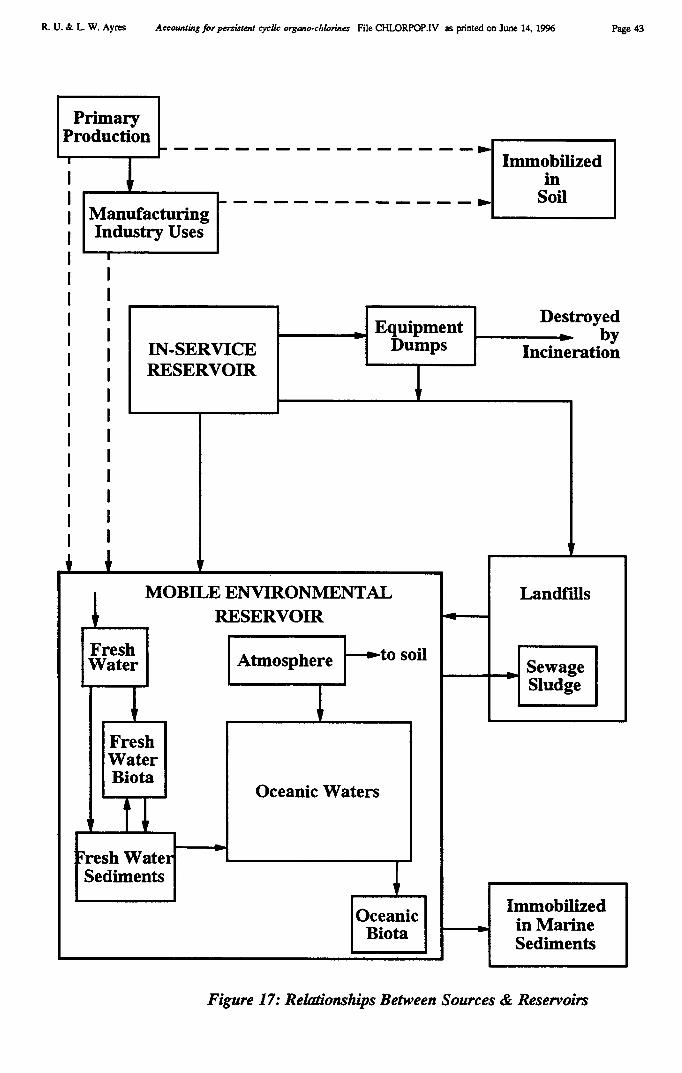
Oceanic Waters
Atmosphere
OceanicBiota
to soil
R. U. & L W. Ayres Accounting for persistent cyclic organ-chlorines File CHLORPOP.IV as printed on June 14, 1996 Page 43
PrimaryProduction
ManufacturingIndustry Uses
IN-SERVICERESERVOIR
EquipmentDumps
Immobilizedin
Soil
Destroyed byIncineration
IMOBILE ENVIRONMENTAL
RESERVOIRLandfills
SewageSludge
FreshWater
FreshWaterBiota
t
Fresh WateSediments
Immobilizedin MarineSediments
Figure 17: Relationships Between Sources & Reservoirs