Embed Size (px)
Citation preview

The life course of young male and female offenders – stability or
change between different birth cohorts? *
Olof Bäckman
1,2, Felipe Estrada
1, Anders Nilsson
1, David Shannon
1,3
1Department of Criminology, Stockholm University
2Swedish Institute for Social Research, Stockholm University
3The Swedish National Council for Crime Prevention
Abstract
Individuals' life chances are shaped by the times and events that they experience. This emphasises the need
for studies that focus on staggered birth cohorts. The article presents a new longitudinal data set that in-
cludes three complete Swedish birth cohorts, born in 1965, 1975 and 1985. Comparisons between the dif-
ferent birth cohorts show how offending distributions among young offenders, as well as their socio-
demographic backgrounds and life chances, have developed over time. The analyses of stability and change
presented in the study, may serve as a point of departure for more informed discussions of the significance
of societal changes for the criminality and life chances of male and female offenders.
* This article was published 2014 in the British Journal of Criminology, vol. 54, pp.393–410: http://bjc.oxfordjournals.org/content/54/3/393.full.pdf+html
2
Introduction
One paradigmatic principle in life-course theory is that individuals’ life chances are embed-
ded in and shaped by the historical times and events that they experience (Elder et al.
2004:10). That is, in addition to resources at the individual level, structural factors also mat-
ter, since they affect both the supply of resources and the individual’s ability to make use of
available resources. One criticism that may therefore be directed at longitudinal studies that
examine the significance of childhood conditions for individuals’ involvement in crime and
future life chances is that the findings are not generalizable to the prevailing conditions expe-
rienced by subsequent generations of young people (see e.g. Giordano et al. 2002; Johnson,
Morris and Menard 2012 and the discussion in Laub and Sampson 2003: 283). Societies
change, and with them the childhood conditions and opportunities that people experience.
This had led researchers to emphasise the need for studies that focus on analyses of staggered
birth cohorts (Mayer 2009).
The overarching questions in the present study concern stability and change between different
birth cohorts regarding a) registered crime, b) childhood risk factors, and c) long-term conse-
quences of criminal involvement. We employ a new longitudinal data set that includes three
complete Swedish birth cohorts, born in 1965, 1975 and 1985. The data include information on
childhood conditions, education, work, health and criminality, and thus provide the opportunity
to follow individuals with different backgrounds and levels of offending from their childhood
years to the age of 45, for the oldest birth cohort, and to age 25 for the youngest. The design of
this cohort study provides a unique opportunity to answer questions that are difficult to exam-
ine in studies based on a single cohort. Comparisons between different birth cohorts provide an
3
opportunity to describe how offending distributions among young offenders, as well as their
socio-demographic backgrounds and life chances, have developed over time.
In the next section we briefly discuss the significance of societal changes for youth crime. We
then move on to present the data and methods employed in the study. The presentation of re-
sults begins with a description of levels of registered offending within the three birth cohorts.
We then examine the relationship between social background factors and the risk of being reg-
istered for crime as a teenager, looking at whether the significance of different risk factors has
changed over time. Finally, we analyse the degree of attachment to the labour market and the
risk for social exclusion in adulthood for the different generations of young offenders.
The significance of societal changes for youth crime
In previous studies of young offenders’ life chances, we have focused on a cohort born in
Stockholm in 1953 (see e.g. Nilsson and Estrada 2011; Nilsson, Bäckman and Estrada 2013).
However, the conditions experienced by those growing up in Sweden, and elsewhere, have
changed significantly since the mid-1950s. The development of the welfare state, not least in
the Scandinavian countries, involved following policies with the clear objective of redressing
differences in life chances between different social groups. Inequalities in childhood condi-
tions were not to be perpetuated across generations, but should rather lose their significance
over time. Research on social mobility and educational attainment suggests, however, that
following a period during which life chances became more equal and social mobility im-
proved, this trend slowed for children born in Sweden subsequent to the 1950s (Breen and
Jonsson 2007). By studying the intergenerational transmission of social disadvantage in 30
Norwegian birth cohorts born between 1955 and 1985, Wiborg and Hansen (2009) show that
the significance of social origin has not declined for younger cohorts. On the contrary, their
4
results indicate a stable, and even slightly increasing impact of the parents’ economic re-
sources.
Over the last three decades, extensive structural changes have taken place in relation to both
the labour market and the education system. Generally speaking, the proportion of youths
continuing into further education has increased. At the same time, the proportion of youths
who are neither in employment, education or training has become greater. This latter group,
sometimes labelled NEETs (Not in Employment, Education or Training), has therefore be-
come the focus of increased levels of attention in the public debate in Europe (Eurofond
2012). In Sweden, the major increase in the number of NEETs came during the economic
crisis of the 1990s, when the proportion in employment declined very sharply over the course
of just a few years, particularly among the young. Increased competition for jobs, rather than
changes in the nature of the available work, has meant that employers have become able to
choose to employ youths who are over-qualified for the work at hand (Korpi and Tåhlin
2009).
In parallel with the decline in employment levels, income inequalities have increased. In an
international perspective, the level of income inequality has historically been relatively low in
Sweden (OECD 2008), but these inequalities have increased substantially over recent dec-
ades, as can be seen from the trend in the Gini index (Fritzell et al. 2011). Young people are
among the groups whose incomes have fallen behind most notably (ibid.). These develop-
ments have had a significant impact on the ability of young people to establish themselves as
adults with a job and a home, which has become more difficult and has come to be deferred
longer.
5
The studies described above do not examine the issue of offending. It is therefore unclear how
the intergenerational transmission of disadvantage is linked to the offending of different birth
cohorts, or whether the correlations between youth offending and life chances have changed
over time.
In addition to the socio-economic trends noted above, the post-war period has also been charac-
terised by a demographic shift. Increased mobility has led to a situation where a larger propor-
tion of the European population has an immigrant background. It is notable that shifts in migra-
tion flows have also produced changes in the ethnic composition of the immigrant population,
with an increasing proportion coming from a non-European background (e.g. OECD 2013:
299).
Impacts on youth crime
It is unclear how different societal changes have impacted upon youth crime. Discussions of
the causes and consequences of youths’ exclusion from work and continued studies some-
times raise the issue of links to involvement in crime without actually investigating the issue
in more detail (Eurofound 2012; see also the discussion in Farrall et al. 2010 regarding social
structure and desistance from crime). At the societal level, the correlations between general
trends in risk factors and the behaviour of individuals are far from self-evident (Tham and von
Hofer 2009). What has been shown, however, is that the first decades subsequent to the end of
World War II were characterised in the west by both increasing levels of wealth and a sub-
stantial increase in the level of youth (property) crime (Estrada 1999). The upward trend in
crime has been broken, however, and since the beginning of the 1990s, we have witnessed an
international “crime drop”. Just as with the preceding increases in crime levels, this decline
can be linked to opportunity-related mechanisms (Farrell et al 2011). In Sweden, for example,
6
levels of both registered and self-reported youth crime have declined (Estrada et al. 2012).
This decline is primarily associated with a reduction in the number of young males convicted
of theft offences, whereas the low levels of crime among females appear not to have changed
very much. These trends, showing a narrowing of the gender gap in crime, are also in line
with those reported in other countries (see e.g. Lauritsen et al. 2009; Fergusson 2013).
The decline in youth crime has occurred at the same time as young people’s life conditions
have in many ways become more difficult and characterised by greater inequalities. We know
relatively little, however, about whether this means that the risk of being registered for crime
has declined quite generally, or more for some groups than for others. To the extent that fewer
youths are being convicted, this need not necessarily mean that there has been a change in the
composition of the group of youths who are at risk of conviction for offending. It is reasona-
ble to assume that the most important risk factors remain the same. Nor need the fact that it
has become less common to be convicted during one’s youth mean that there has been any
change in the consequences of such convictions for young people’s future life chances. This
interpretation is supported, for example, by research showing that the risk factors associated
with involvement in youth crime tend to be the same in different countries (Wikström and
Sampson 2008) and also for both young males and young females (see e.g. Wong et al. 2010)
despite differences in levels of offending.
Inasmuch as the significance of risk factors may be expected to be similar over time, it is not
necessarily the case that this is also true of the long-term consequences of youth crime. There
are theoretical reasons for assuming that these may have become more negative over time. One
the basis of a labelling perspective, for example, one explanation for a deterioration in future
life-chances would be that societal trends have involved a shift towards a more condemnatory
7
view of (youths’) crime (Garland 2002; Estrada 2004; Farrall et al. 2010). Having been con-
victed of a crime has never been something to brag about at a job interview, but with increasing
competition for work and higher educational requirements, the informal consequences of crim-
inal convictions may be assumed to have become more severe. The fact that employers increas-
ingly often demand prospective employees to produce the results of criminal record checks
prior to employment may be viewed as confirmation of this (Backman 2012; see also the dis-
cussion of the rise of the risk agenda in Farrall et al. 2010).
Another explanation, this time focusing more on the significance of processes of cumulative
disadvantage as outlined in life-course theories ( Laub and Sampson 2003; Nilsson, Bäckman
and Estrada 2013), might highlight the fact that as youth offending becomes less common, the
group with convictions for crime may be assumed to become increasingly skewed in its social
composition. Rather than increasing labelling effects, then, we might instead be looking at
changes in the composition of the population of young offenders. The self-report surveys con-
ducted in the Scandinavian countries show clear evidence of a polarisation, with increasing
numbers of teenagers reporting no involvement in crime and a greater focus on the future. The
group of youths who offend and who fail to meet the demands placed on them in school thus
become more distinct from the rest of their generation (Balvig 2006, Kivivouri and Bernburg
2011). A trend towards a narrower selection of the group of individuals who are registered for
crime, such that they are even more likely to have had a problematic childhood, inevitably
means that this group will be more vulnerable in relation to possible negative outcomes later on
in life, such as ill-health and unemployment.
As regards demographic changes, one interesting question is that of whether the increase in
the size, and the shifting ethnic composition, of the immigrant population has produced
8
changes in the nature of immigrants’ over-representation in crime. Criminological research
has for a long time noted an over-representation of immigrants among those registered for
crime, which has primarily been explained by reference to socio-economic resources and
neighbourhood segregation (Hällsten, Szulkin and Sarnecki 2013). With the inclusion of con-
trols for social background factors, we would therefore expect the excess risk for registered
crime among immigrants to be similar across the different cohorts, in spite of the shifts that
have taken place in the ethnic composition of the immigrant population.
In studies where it is possible to compare different ages and birth cohorts, an attempt is some-
times made to distinguish age, period and cohort effects. Age effects relate to processes linked
to aging. A classic criminological example can be found in the decline in levels of involve-
ment in crime that is associated with increasing age (Farrington 1986). Period effects relate to
influences specific to a particular time period, whereas cohort effects are produced by a dis-
tinctive formative experience that birth cohort members share and that lasts over a longer pe-
riod of time. It is very difficult to differentiate between age, period and cohort effects howev-
er, not only methodologically (Glenn 2004), but also conceptually (the effects of economic
crises, for example, may be viewed as examples of both period and cohort effects, depending
on which mechanisms are emphasised as having produced them). Thus the line between what
is regarded as a period effect, and what is regarded as a cohort effect is rather thin, and ac-
cording to Glenn (2004: 475), since it is not possible to definitively separate these effects sta-
tistically, it is more reasonable to instead present arguments to the support the choice of the
type of effect at which a given study directs its focus. On the basis of this view, we would
argue that the factors of interest in the present study should first and foremost be regarded as
period effects.
9
In summary, the processes of societal change that we have briefly touched upon here generate a
range of questions that are difficult to answer on the basis of studies that proceed from homo-
geneous, older cohorts. There is therefore a need to supplement existing studies, e.g. those
based on analyses of individuals born in the 1920s and the 1950s (Laub and Sampson 2003;
Farrington et al 2009; Nilsson et al. 2013), with results relating to cohorts born during the
1960s, 1970s and 1980s. In this article we present a number of basic analyses of stability and
change, which may serve as a point of departure for producing a better foundation for discus-
sions of the significance of the societal changes witnessed over recent decades for the crimi-
nality and life chances of different groups.
Data and method
The study population comprises all individuals born in 1965, 1975 and 1985 who were resident in
Sweden at age 16 – a total of 337,000 individuals. Since every individual in Sweden has a
unique personal identification number, we have been able to link different registers to obtain
information on registered crime, childhood conditions, income and health (for a description of
how register data may be used in Scandinavian criminology, see Lyngstad and Skardhamar
2011). The majority of these register data relate to the period up to and including 2010. The
analyses include controls for individuals who have emigrated or died. Since some of the regis-
ter data are only available for more recent years, the oldest cohort has been excluded from a
number of the analyses.
We only have information on the offences that have been registered by the criminal justice system, and
the age of criminal responsibility in Sweden is fifteen years. We know that registered crime only
accounts for a small proportion of the offences that are actually committed. At the same time, and as
has been noted by Steffensmeier and Allan (1996) for example, self-report data often tend to
10
describe less serious forms of involvement in crime by comparison with the criminality that
becomes the object of justice system interventions. It is also worth remembering the substan-
tial problems linked to the large numbers of missing cases in survey data and the selection
processes associated with non-participation, which we are able to avoid by using data that
relate to the population as a whole. This is perhaps particularly important when the objective
is to study the criminality and life-chances of marginalised groups over time, and how the life
conditions of these groups differ from those of others.
Measures
The data we have on crime have been collected from the convictions register. The register
covers the period since 1973. The variables we have examined relate to annual data on the
number of convictions and the types of crime included in these convictions (divided into eight
categories: theft, shoplifting, threats and violence, vandalism, fraud, drug offences, road traf-
fic offences including drink driving, and other offences). In the analysis of young offenders’
childhood conditions we will be focusing on those with two or more convictions during their
teenage years. When focusing on adult outcomes we also take offending during adulthood
into consideration.
In addition to demographic background variables such as sex and immigrant background (indi-
viduals born outside Sweden, or with two parents born outside Sweden) we can also examine
how involvement in crime varies on the basis of resources during childhood. In this respect, the
focus is directed at family conditions and schooling. The available data relate to the family’s
financial resources measured as the family’s total post tax and transfer annual income. This is a
three level categorical indicator which refers to the year the cohort member turned 15 and it
identifies those 20 percent with lowest income, the 20 percent with the highest income, and the

11
60 percent in between. We also use an indicator of the parents’ social welfare receipts when the
cohort members were aged 8–17. This indicator is also divided into three categories: ‘No wel-
fare payments’, ‘Welfare payments 1–2 years’ and ‘Welfare payments 3+ years’.1 The indicator
of family type separates between the categories ‘Both parents living together’, ‘Single parent’
and ‘Others’, and refers to the situation when the cohort members were aged 16. We also use a
variable indicating whether either parent served a custodial sentence during the cohort mem-
ber’s childhood (0–17 years). We have also included the cohort members’ final grades from
compulsory education (age 15-16), divided into the highest 20 percent, the lowest 20 percent
and those in between. These data are only available for the youngest two cohorts (those born in
1975 and 1985).
The cohort members’ situation as adults is studied on the basis of their degree of attachment to
the labour market. To this end we employ a model that proceeds from the individuals’ principal
incomes, as recorded in official registers (see Bäckman and Nilsson 2011). The model was de-
veloped in two steps. As a first step, the cohort members were divided into groups on the basis
of annual earnings, recalculated into what are referred to as Price Base Amounts (PBA).2 In the
second step, this annual categorisation is used to produce a series of three-year-based categori-
sations, where the individuals’ position in a given year is determined by the category to which
they belonged in the current year and in the two previous years. This three-year categorisation
constitutes a more reliable measure than an annual measure, since it takes account of flow and
stability. We employ the following categories: ‘Core labour force’ comprises those earning at
least 3.5 PBA in at least two of the three consecutive years. This limit was set to correspond to
1 Social welfare benefits are a means tested final tier benefit granted to households when all other sources of
maintenance have been exhausted. 2 Annual earnings consist of income from work and work-related social insurance programs such as sickness
benefits and parental insurance, but not pensions and unemployment insurance. The size of the Price Base
Amount is tied to the consumer price index. In 2013 the PBA was specified at approximately €5000.
12
the lowest amount on which individuals can support themselves for a year. The group ‘Unsta-
ble labour force’ includes those earning between 0.5 and 3.5 PBA. The NEET-category is com-
posed of non-students with a very low income (below 0.5 PBA) or no income at all in at least
two of the three years. We also created categories that distinguish those on Disability Pensions
and Students.
Method
The analysis begins by presenting descriptive statistics to illustrate the different cohorts’ rec-
orded criminality, childhood and living conditions. Those cohort members who had been regis-
tered for crime as teenagers are compared with the other cohort members, and males are com-
pared with females. The focus is directed at the question of whether the situation of the cohorts
relative to one another is characterised by stability or change.
As has been noted by Wiborg and Hansen (2009:384), it is not entirely clear whether it is the
relative or the absolute changes between different groups in the cohorts that are of most inter-
est. When, as is the case in the current study, we are looking at outcomes characterised by sub-
stantial differences in the levels of the relevant variables, a small absolute change may produce
a large relative difference among groups with low initial values. The reverse is naturally the
case for groups that start with high scores on the variables of interest, where a much greater
change in the absolute score may nonetheless fail to produce a corresponding increase when the
change is viewed in relative terms. When interpreting the results, it is therefore important to
focus on both relative and absolute levels and changes.
The patterns that emerge in our descriptive analysis of the significance of different risk factors
for levels of registered crime during the teenage years will be further examined by means of
13
logistic regression, which analyses the probability (odds) of a certain event occurring, or in this
case, of membership of a certain category. Odds and likelihood or risk are not identical con-
cepts, but a higher odds-ratio also always means a higher relative probability or risk. As long as
no reference is made to exact figures, the terms may thus be used interchangeably.
Results
Registered criminality in the three cohorts
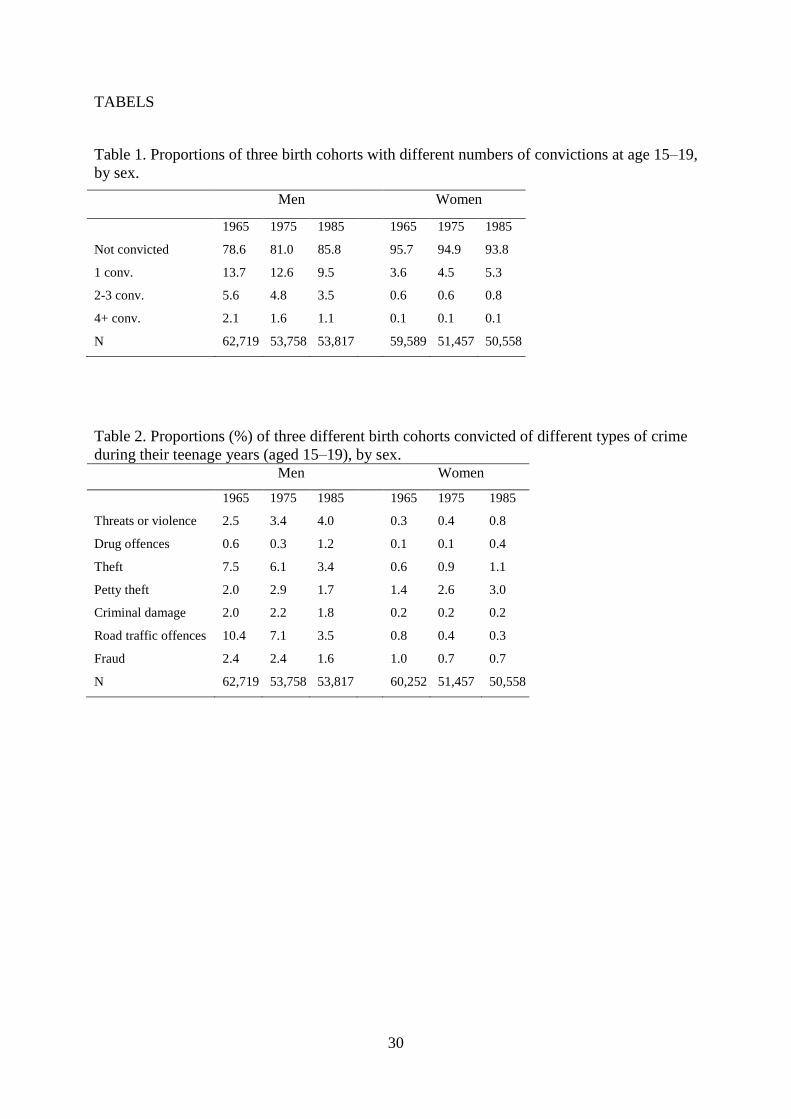
Table 1 presents the proportions of cohort members convicted during their teenage years. When
the different cohorts are compared, it can be seen that among the men, the oldest cohort pre-
sents the highest levels of registered crime, and thus that among males, levels of registered
crime have declined over time. Among the females, the proportions registered for crime are
highest in the youngest cohort. Thus registered youth crime has increased among females but
not among males. The majority of those convicted during their teenage years are only convicted
once, and this pattern is found in all three cohorts. Among the males, the proportion convicted
on a single occasion has declined from 13.7 percent (among those born in 1965) to 9.5 percent
(born 1985), and the proportion convicted at least twice has declined from 7.7 percent to 4.6
percent. Among the females, we instead find an increase, particularly in the proportion with
only a single conviction (from 3.6 to 5.3 percent). As can be seen, the proportion convicted
more than once is small, particularly among the females.
-TABLE 1 ABOUT HERE-
Table 2 presents the proportions of 15–19-year-olds convicted of different types of crime. As
would be expected, there are clear differences between males and females, but also between the
14
three cohorts. Over time, the proportion of cohort members convicted of violent and drug of-
fences has increased among both males and females. Both in Sweden and other countries, the
increase in registered violent offending has been found to be due to increased reporting propen-
sities rather than changes in offending behaviour (see e.g. Estrada 2001; Schwartz et al. 2009).
The increase in the proportions convicted of drug offences should, at least in Sweden, be
viewed against the background of on the one hand legislation that has expanded the number of
acts defined as drug offences, and on the other an increase in the level of police activity focused
on this type of crime (Lenke and Olsson 2002). The two major offence categories of theft (ex-
cluding petty theft) and road traffic offences have declined substantially among the males. The
females differ from the males in that the proportions convicted of petty and other theft offences
instead increase over time. In the youngest two cohorts, the proportion of females convicted of
petty theft is larger even than the proportion of males. The general picture of declining property
crime (among males) and an increase in the registering of violent and drug offences, as well as
of different trends among males and females respectively, is the same as that found in analyses
from countries such as the USA (Schwartz et al. 2009, Lauritzen et al. 2009) and the UK (Fer-
gusson 2013).
-TABLE 2 ABOUT HERE-
Young offenders’ childhood conditions and school achievement
It is widely established that youths who become involved in crime are more often than others
drawn from homes characterised by a lack of resources. This lack of resources manifests itself
in different ways, for example in family structure, finances, social problems and poor health
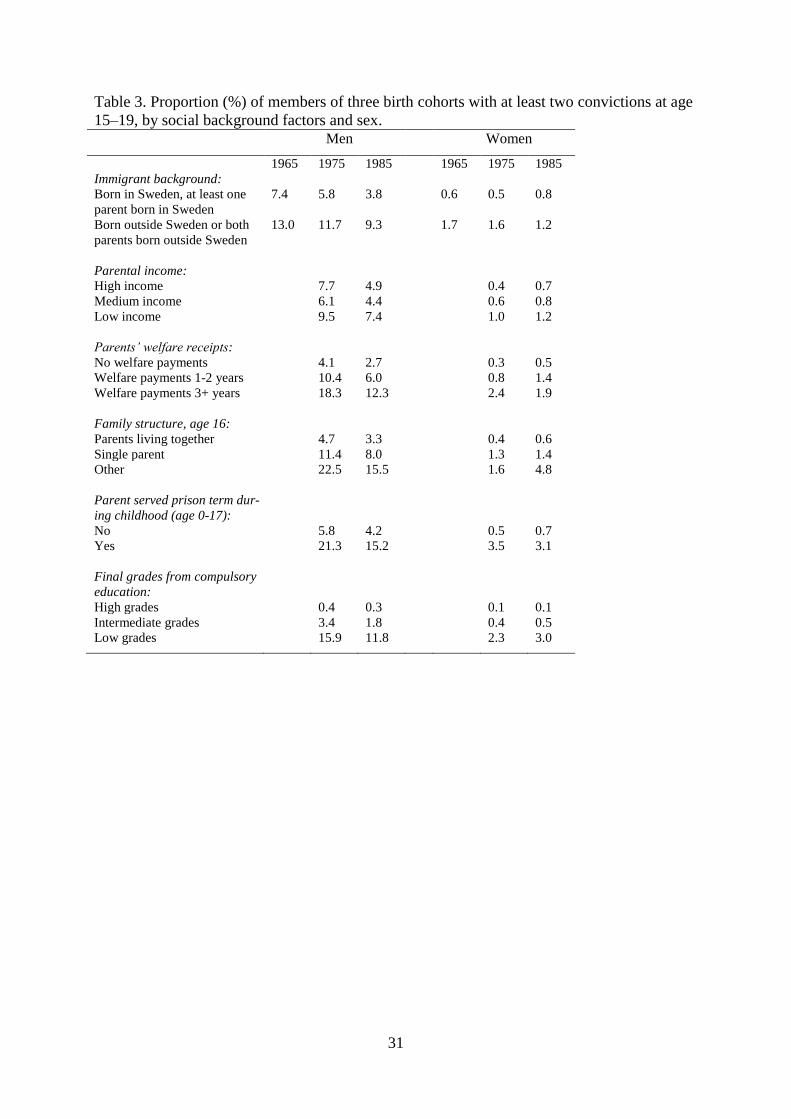
(e.g. Farrington et al. 2009; Aaltonen et al 2011; Estrada and Nilsson 2012). Table 3 presents
data on a number of background risk factors experienced by the young offenders from the dif-
ferent cohorts. Crime varies as would be expected, i.e. the presence of a risk factor is associated

15
with an increase in the proportion with two or more convictions. For example, almost one-fifth
(18.3%) of the males who were born in 1975 and grew up in families that were long- term so-
cial-welfare recipients have been convicted of at least two offences during their teenage years,
as against less than one in twenty of those from families who did not receive social welfare
during their childhood.
Looking to differences between the two youngest cohorts birth cohorts, i.e. those for which we
have access to social background information, we have already noted a decline in the rate of
convictions among the males, while the convictions rate has increased among the females. It is
notable that this general pattern is visible irrespective of the youths’ background conditions and
school grades. This means that the relative significance of the risk factors presented in the table
has not changed substantially between the different cohorts.
Some of the declines noted might nonetheless be regarded as somewhat surprising, not least
the decline in registered crime among youths who have grown up in families characterised by
long-term welfare recipiency. This decline must however be viewed against the background of
the fact that the proportion of cohort members whose families were long-term welfare recipi-
ents is significantly larger in the cohort born in 1985 as a result of the economic crisis experi-
enced in Sweden during the 1990s.3
-TABLE 3 ABOUT HERE-
Youths with an immigrant background are approximately twice as likely to be convicted of an
offence as youths with a non-immigrant background. A comparison between the three cohorts
3 The proportion of cohort members from families who were long-term welfare recipients was 12.2 percent for
the 1975 cohort, and 17.2 percent for the cohort born in 1985.

16
shows a slight increase in the relative differences for males with an immigrant background, but
a decrease among the females. On the basis of explanations that point to the significance of
social factors, an over-representation would be expected, since children and youths with an
immigrant background more often grow up in relatively disadvantaged conditions. Families
with an immigrant background are also affected to a greater extent by the negative structural
effects of residential segregation (see e.g. Hällsten et al. 2013). Furthermore, research also
shows that some of the over-representation can probably be ascribed to discriminatory practices
within the police service and the justice system (see e.g. Bowling and Phillips 2002).
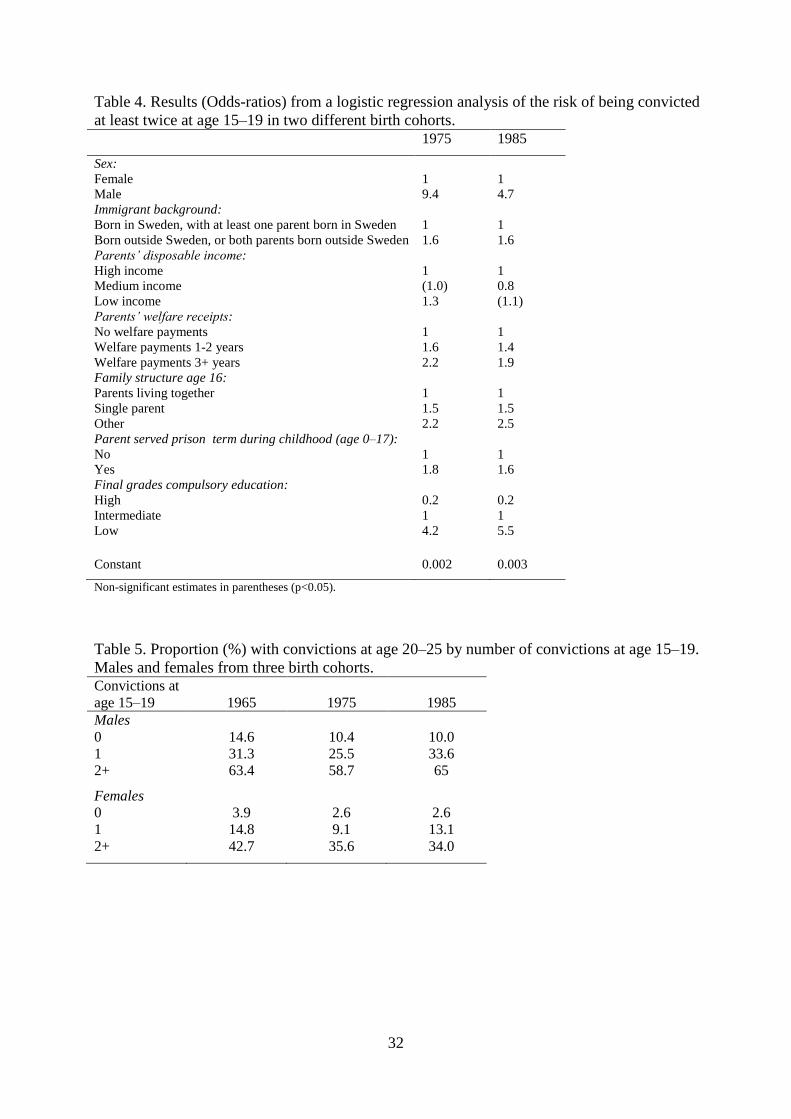
Multivariate analysis 1: the risk of being registered for crime
We are unable to study the significance of neighbourhood conditions and discrimination in the
context of this study. We can, however, examine how the excess risk of being registered for
crime is affected by controlling for differences in the childhood conditions experienced by the
cohort members and their level of school achievement (Table 4).
As expected, when we control for differences in background factors, other childhood condi-
tions, and school grades, the excess risk associated with an immigrant background is reduced.
What is perhaps most interesting, however, is that the size of this excess risk is the same in
both birth cohorts (OR=1.6). Following the inclusion of controls for social background fac-
tors, then, we can note that the size of the excess risk is similar across the different cohorts,
despite the compositional changes that have occurred within the immigrant population. 4
Table 4 shows further that the excess risk for males of being convicted repeatedly has dimin-
ished over time, which is in line with the description presented earlier, i.e. of a declining level
4 Immigrants from western countries comprised approximately 23 percent of the immigrants in the cohort born in
1975, for example, whereas the corresponding proportion among those born in 1985 was only 9 percent.
17
of registered criminal activity among males and a certain increase among females. There is a
clear excess risk for registered crime among long-term welfare recipients, and among those
with single parents or with a parent who has served a prison sentence. In these respects, the
relative risks do not differ over time. The single most prominent factor, besides sex, appears to
be the cohort members’ school performance (grades in their final year). Here the differences in
the level of risk are much larger than in relation to the other factors, and have furthermore in-
creased across the different cohorts.
-TABLE 4 ABOUT HERE-
Adult outcomes for young offenders
In this section, we compare the level of labour market attachment in early adulthood (age 25)
between those convicted of offences during their youth and those with no registered convic-
tions. The presentation begins however by describing the cohort members’ levels of continued
involvement in crime, which may themselves be regarded as an indicator of social exclusion,
across the different cohorts.
As can be seen from Table 5, there is a strong correlation for both males and females between
criminality as a teenager and subsequent registered crime. There are a number of obvious dif-
ferences between the sexes, however. Young male offenders exhibit a much higher level of
recidivism than their female counterparts. In the youngest cohort, approximately two-thirds of
the males with two or more convictions are reconvicted at age 20–25, compared with only one
in three of the corresponding group of females. What is most interesting, however, is that the
level of recidivism has increased somewhat for the males in the youngest cohort, while at the
same time having decreased for the females.

18
-TABLE 5 ABOUT HERE-
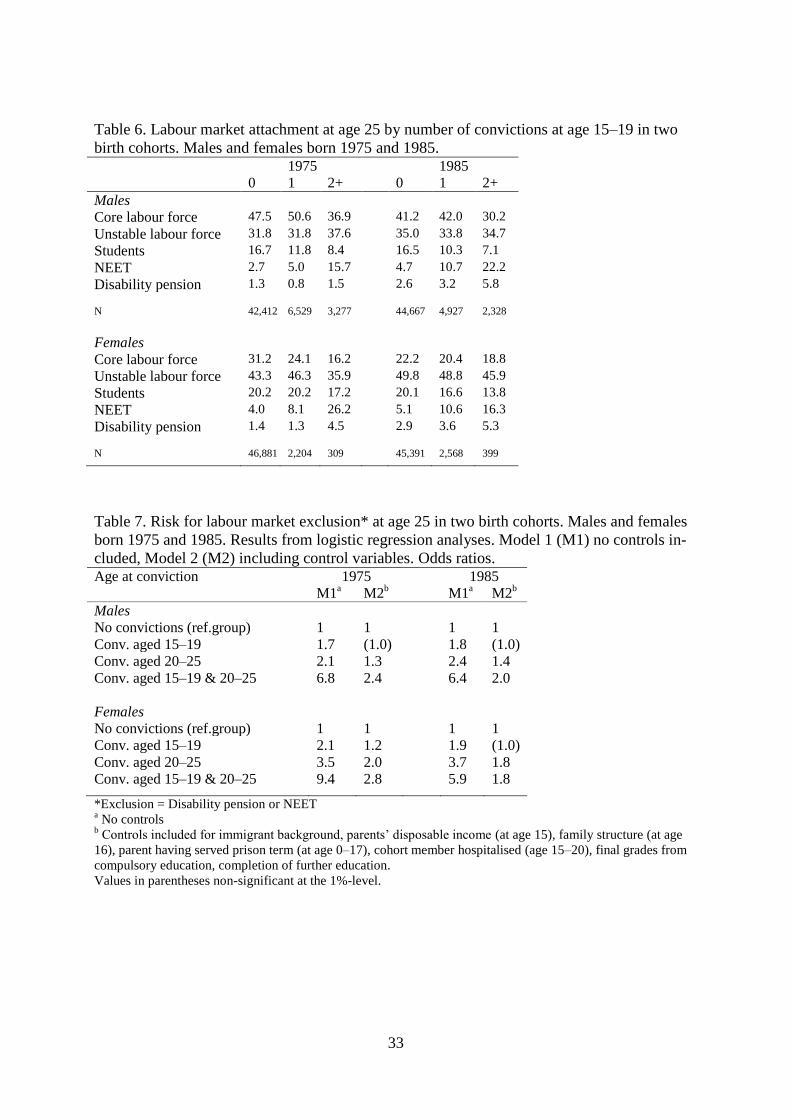
The economic problems experienced by many European countries as a consequence of the
2008 financial crisis have led to increased concerns about young adults who are neither in em-
ployment nor in education or training (Eurofond 2012). The results presented in Table 6 also
show a trend whereby an increasing proportion of young adults are neither in work nor educa-
tion/training. This is the case for both sexes and irrespective of the level of registered crime
during the cohort members’ teenage years. A comparison between those with convictions as
teenagers and those without, however, shows that the risk of finding oneself neither in work,
education or training is significantly greater among those with convictions as teenagers. The
proportion able to support themselves by means of employment (the core labour force) is also
significantly smaller in the group with two or more convictions as teenagers. By contrast, there
are no substantive differences in this particular respect between those with no convictions and
those with only a single conviction (with the exception of the females from the oldest cohort).
When levels of labour market attachment are compared across the cohorts, it is important to
note that, expressed in terms of percentage differences, the difference in the proportions experi-
encing labour market exclusion between those with and without convictions has increased by
age 25 among the males. Among the females, however, it can be noted that the proportion ex-
periencing labour market exclusion among those with at least two convictions has instead de-
clined. These sex differences reinforce the description presented earlier regarding the sex dif-
ferences in registered crime trends (increasing levels of registered crime among females, de-
clining levels among males), since the finding may be interpreted as indicating that the group of
registered female young offenders has come to include more individuals with a better prognosis
regarding both recidivism and labour market exclusion. For males, the trend is the reverse and
19
we find the group of registered young offenders becoming smaller but at the same time coming
to include a greater proportion of socially excluded males.
-TABLE 6 ABOUT HERE-
Multivariate analysis 2: the risk for labour market exclusion
Labour market attachment is of course also linked to factors other than registered crime as a
youth. Given that young offenders have grown up in poorly resourced households more often
than others and have more often been unsuccessful in school, we would expect this group to
manifest a higher risk for social exclusion in adulthood. This should be even more manifest
among those individuals who continue to offend subsequent to their teenage years. In order to
study changes between the cohorts in more detail, we have examined how the risk for labour
market exclusion in young adulthood is linked to registered offending using logistic regres-
sion analysis (Table 7). The first model (M1) only includes indicators of registered offending
at different ages, and focuses on those who continue to offend in young adulthood. The sec-
ond model (M2) includes controls for differences in the demographic and social composition
of the different offending groups. To save space, we have chosen not to present the effects of
the control variables.5 The analyses have been conducted separately for males and females.
In the first model, where no controls are included for any other factors that differentiate be-
tween the groups, those registered for crime as both teenagers and adults are at significantly
higher risk of labour market exclusion in adulthood. When controls are then included for the
presence of various risk factors (see the footnote in Table 7) there is a substantial decrease in
the risk differential between the registered offenders and the non-offenders. Although the lev-
5 These can be obtained from the authors upon request.
20
el of the females’ involvement in crime is significantly lower, the higher risks experienced by
those with convictions, with certain exceptions, are similar for males and females. It can thus
be noted that there is a significantly increased risk for labour market exclusion among those
with convictions as teenagers, but once other factors are controlled for, this increased risk
remains only for those who continue to offend as young adults.
As regards possible differences between the cohorts, no clear patterns emerge, other than that
the size of the increased risk for labour market exclusion is smallest in the youngest cohort.
The explanation for this decline in the relative risk for labour market exclusion among con-
victed offenders probably has little, if anything, to do with changes in the consequences of
registered offending, but is instead likely to be linked to the increasing difficulties experi-
enced by young people in general in establishing themselves on the labour market, as reflect-
ed by the general increase in the proportions of socially excluded young people (see Table 6).
This means that the group of socially excluded young adults has become increasingly “nor-
malised” over time, which in turn means that variables measuring various types of social
problems, including involvement in crime, will lose some of their explanatory power.
-TABLE 7 ABOUT HERE-
Discussion and conclusions
To return to our initial question of stability or change, we can begin by noting that there have
been clear shifts in criminal activity across the three cohorts, both in terms of the types of
crimes for they are convicted and the level of registered criminal activity. As has been noted in
previous studies (e.g. Farrell et al. 2011), we find a declining proportion being convicted of
theft and road traffic offences, and an increasing proportion being convicted of violent and drug
offences. The shifts that have occurred in the proportion of the cohorts with registered convic-
21
tions have involved a considerable reduction in the size of the gender gap. How this trend
should be understood is at present unclear and has therefore been a matter of some debate (see
e.g. Lauritzen et al. 2009; Schwartz and Steffensmeier 2012). The debate centres on whether
the decline in the gender gap should be viewed as primarily being due to an increased propensi-
ty for crime among young females or to an increase in the level of formal control focused on
less serious crime, with females comprising a larger proportion of the perpetrators of minor
offences. Our study indicates that the decline in the gender gap is primarily being driven by a
decline in the number of males convicted of theft and road-traffic offences, at the same time as
an increasing number of females are being convicted of petty theft offences. It is also clear that
the increase in registered crime among females is first and foremost associated with a larger
number being convicted on a single occasion during their teenage years. Finally, among the
females who have been convicted more than once during their teenage years, a declining pro-
portion have been reconvicted at age 20–25. Among the corresponding group of males, howev-
er, the level of recidivism in early adulthood has increased slightly. Although the question of
the reduction in the size of the gender gap requires a more detailed analysis than that presented
here, we would argue that our study provides no support for the view that the declining gender
gap is due to an increasing number of females committing serious offences. Our interpretation,
so far, is instead that the decline is due to more females, and females with a low risk for recidi-
vism, being drawn into the justice system on the basis of having committed a small number of
minor offences. This trend would be in line with the findings of studies that point to the signifi-
cance of political and public discourses and of media reporting for trends in police responses to
youth crime (e.g. Estrada 2001; Schwartz et al. 2012).
Looking to risk factors for crime, our central finding is one of stability over time, despite the
shifts that have occurred in registered crime and despite the societal changes that have been

22
mentioned. For both males and females, the various background factors and resource defi-
ciencies that we have examined (immigrant background, single parent, low income, long-term
welfare recipiency and having a parent who served a prison term) are associated with an in-
creased risk for youth crime. Although the level of involvement in registered crime varied
across the cohorts, the relative excess risks for young people from disadvantaged homes are in
principle quite stable. Thus far, then, we can state that societal changes have not meant that
recognized risk factors associated with the childhood household have become more, or for
that matter less, important.
The significance of an immigrant background is also stable across the different cohorts.
Around Europe, parties of the populist right highlight the fact that people of immigrant back-
ground are over-represented among those registered for crime and that this has become accen-
tuated as a result of an increased immigration from non-European countries (Rydgren 2007).
Our analyses show that the increase in immigration from non-European countries in the most
recent cohort has not affected the size of the excess risk for registered criminality once con-
trols are included for socio-economic background conditions.
Of all the risk variables examined, the cohort members’ final school grades were found to be
particularly strongly correlated with registered crime. Those with the lowest grades when leav-
ing compulsory education are at particularly high risk of being registered for crime as teenag-
ers. At the same time, it is very unusual for those with high grades to be registered as young
offenders. This is the case in all cohorts. It has repeatedly been noted that schooling plays a key
role in relation to young people’s life chances. The findings presented in this article point to the
importance of the school system being able to provide disadvantaged children with the support
they need, not least since, unlike background factors, it is possible to influence school
23
achievement. In light of this, it is troubling to note that over time, school results appear to have
become an increasingly important risk factor for youth crime. We would, however, like to note
that the correlations between childhood and school conditions and crime are rarely a question
of simple cause-effect relationships, but are instead often quite complex and require more de-
tailed analyses than those presented in this article.
The relative differences between young offenders and other youths also remain largely similar
across the cohorts when the focus is directed at longer term outcomes. At the same time, the
youngest cohort includes a significantly larger proportion of individuals who were neither in
employment nor in education or training as young adults (so-called NEETS). In spite of this,
the vast majority of the youths registered for crime as teenagers were in work and able to sup-
port themselves financially at age 25, including those in the youngest cohort. Given this im-
portant finding – that the longer term prognosis appears good for the majority – we feel we
must nonetheless note that our findings should in part also be viewed as somewhat dishearten-
ing. The study illustrates stability concerning the long-term consequences of inequalities in
childhood conditions and involvement in crime, and also concerning the inability of society to
satisfactorily deal with these problems over time. Teenagers who have been convicted on more
than a single occasion, for example, have a significantly worse labour-market situation at age
25. The risk of being neither in work nor education or training is several times higher for young
offenders. A large part of this increased risk is linked, however, to the fact that young offenders
are disproportionately drawn from among individuals who lack resources. In this sense, in-
volvement in crime represents an additional obstacle to becoming established in employment.
An earlier study has noted that poverty and social problems in the childhood family have long-
term consequences for the risk of exclusion much later in life (Bäckman and Nilsson 2011).
24
These effects were found to be largely mediated by intermediate factors during the teenage
years and early adulthood. The study found deviant behaviour – criminality and substance
abuse – and poor school achievement to be particularly important factors. Different risk factors
build on one another producing cumulative inequalities in life chances across the life course.
The results presented in this article emphasise the fact that resource deficiencies during child-
hood are linked to crime, and that crime in turn has negative consequences for life chances,
which manifest themselves in worse living conditions in adulthood. In addition, it should be
noted that over time it has generally become more difficult for young people to become estab-
lished on the labour market. The proportion of NEETs increases over time irrespective of back-
ground and registered criminality. In terms of absolute percentages, however, the increase is
greatest among males with a criminal history.
This finding indicates that the group of males convicted of offences, who despite the declining
gender gap still comprise a substantial majority of the young people who are registered for
crime, have over time come to experience increasing marginalisation and vulnerability. Given
that competition for a good education, for employment and for economic resources is increas-
ing rather than decreasing in Europe, this means that we are today facing a challenge which is
as difficult as it is important, that of creating integrative and supportive measures to reverse the
processes of exclusion faced by young people who become involved in crime.
References
Aaltonen, M., Kivivuori, J., and Martikainen, P. (2011), ‘Social Determinants of Crime in a
Welfare State: Do They Still Matter?’ Acta Sociologica, 54/2, 161--181.
Backman, C. (2012), ‘Mandatory Criminal Record Checks in Sweden: Scandals and Function
Creep’, Surveillance & Society, 10/3/4: 276--291.
25
Bäckman, O., Jakobsen, V., Lorentzen, T., Österbacka, E., and Dahl, E. (2011), Dropping Out
in Scandinavia. Social Exclusion and Labour Market Attachment among Upper Second-
ary School Dropouts in Denmark, Finland, Norway and Sweden. Institute for Futures
Studies Working Paper 2011:8.
Bäckman, O., and Nilsson, A. (2011), ‘Pathways to Social Exclusion—A Life-Course Study’,
European Sociological Review, 27/1, 107--123.
Balvig, F. (2006), Den ungdom. Det Kriminalpræventive Råd.
Bowling, B. and Phillips, C. (2002), Racism, Crime and Justice. Addison-Wesley Longman
Limited.
Breen, R., and Jonsson, J. O. (2007), ‘Explaining Change in Social Fluidity: Educational Equal-
ization and Educational Expansion in Twentieth‐Century Sweden’, American Journal of
Sociology 112/6: 1775--1810.
Elder, G. ([1974] 1999), Children of the Great Depression: Social Change in Life Experience,
25th
Anniversary Edition. Westview Press.
Estrada, F. (1999), ’Juvenile Crime Trends in Postwar Europe’, European Journal on Criminal
Policy and Research, 7/1: 5--22.
Estrada, F. (2001), ‘Juvenile Violence as a Social Problem’, British Journal of Criminology,
41/4: 639--655.
Estrada, F. (2004), ‘The Transformation of the Politics of Crime in High Crime Societies’, Eu-
ropean Journal of Criminology, 1/4: 419--444.
Estrada, F. and Nilsson, A. (2012), ‘Does it Cost More to be a Female Offender? A life-course
study of Childhood Circumstances, Crime, Drug Abuse, and Living Conditions’, Femi-
nist Criminology, 7/3: 196--219.
Estrada, F., Pettersson, T. and Shannon, D. (2012), ‘Crime and Criminology in Sweden’, Euro-
pean Journal of Criminology, 9/6: 668--688.
26
Eurofond (2012), NEETs – Young People Not in Employment, Education or Training. Charac-
teristics, Costs and Policy Response in Europe. Publications office of the European Un-
ion, Luxembourg.
Farrall, S., Bottoms, A., and Shapland, J. (2010), ‘Social Structures and Desistance from
Crime’, European Journal of Criminology, 7/6, 546--570.
Farrell, G., Tseloni, A., Mailley, J., and Tilley, N. (2011), ‘The Crime Drop and the Security
Hypothesis’, Journal of Research in Crime and Delinquency, 48/2, 147--175.
Farrington, D. (1986), ‘Age and Crime’, Crime and Justice, 7: 189--250.
Farrington, D., Tfofi, M., and Coid, J. (2009), ‘Development of Adolescence-Limited, Late-
Onset, and Persistent Offenders from Age 8 to Age 48’, Aggressive Behaviour, 35/2: 150-
-163.
Fergusson, R. (2013), ‘Risk, Responsibilities and Rights: Reassessing the ‘Economic Causes of
Crime’ Thesis in a Recession’, Youth Justice, 13/1: 31--56.
Fritzell, J., O. Bäckman, V.-M. Ritakallio (2011), ‘Income Inequality and Poverty: Do the Nor-
dic Countries still constitute a Family of their own?’, in J. Kvist, J. Fritzell, B. Hvinden,
O. Kangas, eds., Changing Social Equality: The Nordic Welfare Model in the 21st Centu-
ry, 165--185. Policy Press.
Garland, D. (2002), The Culture of Control: Crime and Social Order in Contemporary Society.
University of Chicago Press.
Giordano, P., Cernkovich, S., and Rudolph, J. (2002), ‘Gender, crime and desistance: Toward a
theory of cognitive transformation’, American Journal of Sociology, 107/4: 990--1064.
Glenn, N. (2004). ´Distinguishing Age, Period and Cohort Effects,´ in J. Mortimer and M.
Shanahan, eds., Handbook of the Life Course, 465--476. Springer.
Hällsten, M., Szulkin, R., and Sarnecki, J. (2013), ‘Crime as a Price of Inequality?’ British
Journal of Criminology, 53/3: 456--481.
27
Johnson, M. C., Morris, R. G., and Menard, S. (2012), ‘Historical Invariance in Delinquency
Causation: A Test of Equivalent Models of Delinquency for Two Generations of Adoles-
cents’, Crime & Delinquency. Published online July 20.
Korpi, T., and Tåhlin, M. (2009), ‘Educational Mismatch, Wages, and Wage Growth: Overedu-
cation in Sweden, 1974–2000’, Labour Economics, 16/2, 183--193.
Kivivuori, J., and Bernburg, J. G. (2011), ‘Delinquency Research in the Nordic Countries’,
Crime and Justice, 40/1: 405--477.
Laub, J., and Sampson, R. (2003), Shared Beginnings, Divergent Lives: Delinquent Boys to Age
70. Harvard University Press.
Lauritsen, J. L., Heimer, K., and Lynch, J. P. (2009), ‘Trends in the Gender Gap in Violent Of-
fending: New Evidence from the National Crime Victimization Survey’, Criminology,
47/2: 361--399.
Lenke, L., and Olsson, B. (2002), ‘Swedish Drug Policy in the Twenty-first Century: A Policy
Model Going Astray’, Annals of the American Academy of Political and Social Science
582: 64--79.
Lyngstad, T. H., and Skardhamar, T. (2011), ‘Nordic Register Data and their Untapped Poten-
tial for Criminological Knowledge’, Crime and Justice, 40/1: 613--645.
MacDonald, J., and Sampson, R. J. (2012), ‘The World in a City. Immigration and America’s
Changing Social Fabric’, The ANNALS of the American Academy of Political and Social
Science, 641/1, 6--15.
Mayer, K-U. (2009), ‘New Directions in Life Course Research’, Annual Review of Sociology
35/4: 413--433.
Nilsson, A. and Estrada, F. (2009), Criminality and Life-Chances. Department of Criminology
Report series 2009:3, Stockholm University.

28
Nilsson, A. and Estrada, F. (2011), ‘Established or Excluded? A Longitudinal Study of Crimi-
nality, Work and Family Formation’, European Journal of Criminology, 8/3: 229--245.
Nilsson, A., Bäckman, O., and Estrada, F (2013), ‘Involvement in Crime, Individual Resources
and Structural Constraints. Processes of Cumulative (Dis)Advantage in a Stockholm
Birth Cohort’, British Journal of Criminology, 53/2: 297--318.
OECD (2008), Growing unequal? Income Distribution and Poverty in OECD Countries.
OECD.
OECD (2013), International Migration Outlook 2013. OECD.
Payne, A. A., and Wech K. (2013), ‘The Impact of Schools and Education on Antisocial Be-
havior over the Lifecourse’, in C.L. Gibson, and M.D. Krohn, eds., Handbook of Life-
Course Criminology: Emerging Trends and Directions for Future research. Springer.
Rydgren, J. (2007), ‘The Sociology of the Radical Right’, Annual Review of Sociology, 33:
241--262.
Sampson, R. J., and Wikström, P. O. (2008), ‘The Social Order of Violence in Chicago and
Stockholm Neighborhoods: A Comparative Inquiry’, in S.N. Kalyvas, I. Shapiro, and T.
Masoud, eds., Order, Conflict, and Violence. Cambridge University Press.
Schwartz, J., and Steffensmeier, D. (2012), ‘Stability and Change in Girls’ Delinquency and
the Gender Gap: Trends in Violence and Alcohol Offending Across Multiple Sources of
Evidence’, in S. Miller, L.D. Leve, and P.K. Kerik, eds., Delinquent Girls. Contexts,
relationships, and adaptation. Springer.
Tham, H., and von Hofer, H. (2009), ‘Individual Prediction and Crime Trends’, European
Journal of Criminology, 6/4: 313--335.
Wiborg, Ø. N., and Hansen, M. N. (2009), ‘Change Over Time in the Intergenerational Trans-
mission of Social Disadvantage’, European sociological review 25/3: 379--394.

29
Wikström, P. O., and Loeber, R. (2000), ‘Do Disadvantaged Neighbourhoods Cause Well-
Adjusted Children to Become Adolescent Delinquents? A Study of Male Juvenile Serious
Offending, Individual Risk and Protective Factors, and Neighbourhood Context’, Crimi-
nology, 38/4: 1109--1142.
Wong, T., Slotboom, A.-M., and Bijleveld, C. (2010), ‘Risk Factors for Delinquency in Ado-
lescent and Young Adult Females: A European Review’, European Journal of Criminol-
ogy, 7/4: 266--284.
30
TABELS
Table 1. Proportions of three birth cohorts with different numbers of convictions at age 15–19,
by sex.
Men Women
1965 1975 1985 1965 1975 1985
Not convicted 78.6 81.0 85.8 95.7 94.9 93.8
1 conv. 13.7 12.6 9.5 3.6 4.5 5.3
2-3 conv. 5.6 4.8 3.5 0.6 0.6 0.8
4+ conv. 2.1 1.6 1.1 0.1 0.1 0.1
N 62,719 53,758 53,817 59,589 51,457 50,558
Table 2. Proportions (%) of three different birth cohorts convicted of different types of crime
during their teenage years (aged 15–19), by sex. Men Women
1965 1975 1985 1965 1975 1985
Threats or violence 2.5 3.4 4.0 0.3 0.4 0.8
Drug offences 0.6 0.3 1.2 0.1 0.1 0.4
Theft 7.5 6.1 3.4 0.6 0.9 1.1
Petty theft 2.0 2.9 1.7 1.4 2.6 3.0
Criminal damage 2.0 2.2 1.8 0.2 0.2 0.2
Road traffic offences 10.4 7.1 3.5 0.8 0.4 0.3
Fraud 2.4 2.4 1.6 1.0 0.7 0.7
N 62,719 53,758 53,817 60,252 51,457 50,558
31
Table 3. Proportion (%) of members of three birth cohorts with at least two convictions at age
15–19, by social background factors and sex. Men Women
1965 1975 1985 1965 1975 1985
Immigrant background:
Born in Sweden, at least one
parent born in Sweden
7.4 5.8 3.8 0.6 0.5 0.8
Born outside Sweden or both
parents born outside Sweden
13.0 11.7 9.3 1.7 1.6 1.2
Parental income:
High income 7.7 4.9 0.4 0.7
Medium income 6.1 4.4 0.6 0.8
Low income 9.5 7.4 1.0 1.2
Parents’ welfare receipts:
No welfare payments 4.1 2.7 0.3 0.5
Welfare payments 1-2 years 10.4 6.0 0.8 1.4
Welfare payments 3+ years 18.3 12.3 2.4 1.9
Family structure, age 16:
Parents living together 4.7 3.3 0.4 0.6
Single parent 11.4 8.0 1.3 1.4
Other 22.5 15.5 1.6 4.8
Parent served prison term dur-
ing childhood (age 0-17):
No 5.8 4.2 0.5 0.7
Yes 21.3 15.2 3.5 3.1
Final grades from compulsory
education:
High grades 0.4 0.3 0.1 0.1
Intermediate grades 3.4 1.8 0.4 0.5
Low grades 15.9 11.8 2.3 3.0
32
Table 4. Results (Odds-ratios) from a logistic regression analysis of the risk of being convicted
at least twice at age 15–19 in two different birth cohorts. 1975 1985
Sex:
Female 1 1
Male 9.4 4.7
Immigrant background:
Born in Sweden, with at least one parent born in Sweden 1 1
Born outside Sweden, or both parents born outside Sweden 1.6 1.6
Parents’ disposable income:
High income 1 1
Medium income (1.0) 0.8
Low income 1.3 (1.1)
Parents’ welfare receipts:
No welfare payments 1 1
Welfare payments 1-2 years 1.6 1.4
Welfare payments 3+ years 2.2 1.9
Family structure age 16:
Parents living together 1 1
Single parent 1.5 1.5
Other 2.2 2.5
Parent served prison term during childhood (age 0–17):
No 1 1
Yes 1.8 1.6
Final grades compulsory education:
High 0.2 0.2
Intermediate 1 1
Low
4.2 5.5
Constant 0.002 0.003
Non-significant estimates in parentheses (p<0.05).
Table 5. Proportion (%) with convictions at age 20–25 by number of convictions at age 15–19.
Males and females from three birth cohorts. Convictions at
age 15–19
1965
1975
1985
Males
0 14.6 10.4 10.0
1 31.3 25.5 33.6
2+ 63.4 58.7 65
Females
0 3.9 2.6 2.6
1 14.8 9.1 13.1
2+ 42.7 35.6 34.0
33
Table 6. Labour market attachment at age 25 by number of convictions at age 15–19 in two
birth cohorts. Males and females born 1975 and 1985. 1975 1985
0 1 2+ 0 1 2+
Males
Core labour force 47.5 50.6 36.9 41.2 42.0 30.2
Unstable labour force 31.8 31.8 37.6 35.0 33.8 34.7
Students 16.7 11.8 8.4 16.5 10.3 7.1
NEET 2.7 5.0 15.7 4.7 10.7 22.2
Disability pension 1.3 0.8 1.5 2.6 3.2 5.8
N
42,412
6,529
3,277
44,667
4,927
2,328
Females
Core labour force 31.2 24.1 16.2 22.2 20.4 18.8
Unstable labour force 43.3 46.3 35.9 49.8 48.8 45.9
Students 20.2 20.2 17.2 20.1 16.6 13.8
NEET 4.0 8.1 26.2 5.1 10.6 16.3
Disability pension 1.4 1.3 4.5 2.9 3.6 5.3 N
46,881
2,204
309
45,391
2,568
399
Table 7. Risk for labour market exclusion* at age 25 in two birth cohorts. Males and females
born 1975 and 1985. Results from logistic regression analyses. Model 1 (M1) no controls in-
cluded, Model 2 (M2) including control variables. Odds ratios. Age at conviction 1975 1985
M1a M2
b M1
a M2
b
Males
No convictions (ref.group) 1 1 1 1
Conv. aged 15–19 1.7 (1.0) 1.8 (1.0)
Conv. aged 20–25 2.1 1.3 2.4 1.4
Conv. aged 15–19 & 20–25 6.8 2.4 6.4 2.0
Females
No convictions (ref.group) 1 1 1 1
Conv. aged 15–19 2.1 1.2 1.9 (1.0)
Conv. aged 20–25 3.5 2.0 3.7 1.8
Conv. aged 15–19 & 20–25 9.4 2.8 5.9 1.8
*Exclusion = Disability pension or NEET a No controls
b Controls included for immigrant background, parents’ disposable income (at age 15), family structure (at age
16), parent having served prison term (at age 0–17), cohort member hospitalised (age 15–20), final grades from
compulsory education, completion of further education.
Values in parentheses non-significant at the 1%-level.

34
Funding information
This work was supported by the Swedish Research Council for Health, Working Life and
Welfare.